Article

Improvement in the Wear Resistance under Dry Friction of Electrodeposited Fe-W Coatings through Heat Treatments

1
Department of Industrial and Materials Science, Chalmers University of Technology, SE-412 96 Gothenburg, Sweden
2
Physical Chemistry Department, Vilnius University, LT-03225 Vilnius, Lithuania
3
Institute of Applied Physics of ASM, MD-2028 Chisinau, Moldova
4
CIDETEC, Paseo Miramon 196, E-20014 Donostia-San Sebastian, Spain
*
Authors to whom correspondence should be addressed.
Coatings 2019, 9(2), 66; https://doi.org/10.3390/coatings9020066
Submission received: 7 January 2019 / Revised: 7 January 2019 / Accepted: 21 January 2019 / Published: 24 January 2019

Abstract

:
The influence of the microstructural transformations upon heat treatments on the wear resistance of Fe-W coatings is studied. The coatings are electrodeposited from a glycolate-citrate plating bath with 24 at.% of W, and the wear resistance is investigated under dry friction conditions using ball-on-disc sliding tests. The samples were annealed in Ar atmosphere at different temperatures up to 800 °C. The microstructural transformations were studied by means of X-ray Diffraction (XRD), Scanning Electron Microscopy (SEM), and Electron Backscattered Diffraction (EBSD) technique. Except for the coating annealed at 800 °C, all the tested coatings suffered severe tribo-oxidation which resulted in the formation of deep cracks, i.e., ~15 μm in depth, within the wear track. The precipitation of the secondary phases, i.e., Fe2W and FeWO4, on the surface of the sample annealed at 800 °C increased the resistance to tribo-oxidation leading to wear tracks with an average depth of ~3 μm. Hence, the Fe-W coating annealed at 800 °C was characterized with a higher wear resistance resulting in a wear rate comparable to electrodeposited hard chromium coatings, i.e., 3 and 4 × 10⁻⁶ mm3/N m, respectively.

1. Introduction

In the field of coatings for protective applications, the attempt to find a sustainable alternative to hard chromium coatings is still under investigation. Hard chromium coatings are characterized by high hardness, as well as wear and corrosion resistance, but their production involves the use of carcinogenic compounds (i.e., Cr6+). Electrodeposited W alloys containing iron group metals (i.e., Ni, Co and Fe) have been extensively studied as an alternative to hard chromium coatings due to the remarkable properties of these alloys [1,2,3,4]. The proposed Ni and Co-based coatings do not represent a valid sustainable alternative. In the recent European environmental legislations, Co has been targeted as “substance of very high concern” and the use of Ni is discouraged because it is listed as highly allergenic [5]. Thus, among W alloys, Fe-W has especially seen much attention recently, due to the need to produce and develop sustainable materials [5]. Further, Fe-W alloys can be electrodeposited from environmentally friendly and thermodynamically stable electrolytes [6] with tunable composition and structure [7] and with high hardness and thermal stability [8,9]. Under these conditions, Fe-W coatings can potentially be used as a sustainable alternative for coatings produced using environmentally hazardous processes.
In a previous study, the structure development of Fe-W coatings with various W contents was studied at various annealing temperatures [8]. It was found that as-deposited Fe-W alloys with high W content (up to 30 at.%) show relatively high hardness, i.e., about 10–13 GPa, which is comparable to that of electrodeposited chromium [3,7]. Furthermore, the as-deposited hardness of electrodeposited Fe-W coatings can be substantially increased by heat treatments [9]. In particular, Fe-W coatings with 24 at.% of W showed the highest thermal stability and hardness in both as-deposited and annealed states. The highest hardness, i.e., 16.5 GPa, was measured after annealing for one hour at 600 °C [9]. An increase in hardness in as-deposited electrodeposited coatings has been often linked to a higher wear resistance [10,11,12,13]. Hence, Fe-W coatings with 24 at.% of W can be considered a promising candidate for protective coating applications. However, wear studies performed in dry conditions on as-deposited Fe-W coatings showed that the coatings are characterized by a rather low wear resistance [14,15]. Tribo-oxidation is the main factor influencing the wear mechanism of Fe-W coatings. Abrasive iron oxide particle are formed during the sliding tests, leading to high values of the coefficient of friction (COF) and to high wear track volumes [14,15,16]. However, the wear resistance of the Fe-W coatings can be improved under lubricated conditions using rapeseed oil. The application of the lubricant minimized the tribo-oxidation phenomena [15]. Also, an increase in wear resistance has been obtained with the deposition of ternary Fe-W-P coatings [17,18]. Nevertheless, tribo-oxidation remains an important factor in the wear mechanism of Fe-W-P coatings. In fact, an increase in oxygen content was observed in the wear track of Fe-W-P coatings tested in dry conditions using a ball-on-disc sliding tribometer [17].
Thermal treatments can be applied to increase the wear resistance of coatings [19,20,21,22,23]. It has been shown that for heat-treated coatings an increase in hardness is not the only factor linked to improved wear resistances. For instance, a strong contribution to the wear resistance of heat-treated Ni-P and Ni-W coatings was associated with the precipitation of secondary crystalline phases [21,24]. Nevertheless, the effect of the thermal treatment on the wear resistance of electrodeposited Fe-W coatings has not been investigated.
The aim of this paper is to study the influence of the microstructural transformation occurring upon annealing on the wear resistance of Fe-W coatings and to compare it with the wear resistance of hard chromium coatings.

2. Materials and Methods

2.1. Electrodeposition of Fe-W and Chromium Coatings

The Fe-W coatings with 24 at.% of W were deposited from a bath with the following composition: 1 M glycolic acid, 0.3 M citric acid, 0.1 M Fe2(SO4)3 and 0.3 M Na2WO4. The pH was adjusted to 5 and the temperature was kept at 65 °C. The procedure for electrodeposition of Fe-W alloys with 24 at.% of W is discussed elsewhere [7,8]. All analyzed Fe-W coatings had a fixed composition of 24 ± 0.6 at.% of W. The chemical composition was measured at the surface and along the cross-section of the samples with an Energy Dispersive X-ray Spectroscopy (EDS) technique. Thus, in the following, the samples will be designated as Fe-24W. The Fe-24W coatings were deposited applying a constant cathodic current density of 15 mA·cm−2. The electrodeposition was performed in a typical three-electrode cell and the electrolyte volume was kept at 250 mL. The coatings were deposited using a 2 cm × 2 cm copper sheet as substrate, platinized titanium was used as a counter electrode, and saturated Ag/AgCl/KCl(sat) was used as reference electrode. The thickness of the electrodeposited coatings was 15 ± 2 μm. The values were calculated based on gravimetric and elemental analyses of the electrodeposited alloys and confirmed by measuring the thickness on the cross-section. The average surface roughness (Ra) of the Fe-W coatings was 335 ± 80 nm. Chromium deposits were deposited on polished carbon steel substrates (AISI 1010, Industrias Urduri, Hernani, Spain) using an electrolyte with the following composition: 250 g·L−1 CrO3 and 2.5 g·L−1 H2SO4. The electrodeposition process was carried out under galvanostatic conditions in a three-electrode cell (400 mL), at a temperature of 51 °C, with magnetic stirring. Lead-8% tin was used as a counter electrode and an Ag/AgCl/Cl(3M) electrode as reference electrode. Chromium coatings were deposited applying a constant cathodic current density of 300 mA·cm−2 and a deposition time of 3150 s, which led to a thickness of 20 ± 1 μm. Chromium coatings were characterized with a hardness of 1024 ± 21 HV (~10.4 GPa) and with a surface roughness of 185 ± 25 nm.

2.2. Coating Characterization

The analysis of the wear resistance of the Fe-24W coatings was performed in dry conditions using ball-on-disc sliding tests (CSM Instruments, model THT, Peseux, Switzerland). An alumina ball of 6 mm diameter was used as the counter-body, moving with a rotation speed of 4 cm·s−1 for 500 m and with a fixed rotation diameter of 2.5 mm. A load of 2 N was applied. All the tests were performed in ambient air, at room temperature and about 55% of relative humidity. After the wear tests, the samples were cleaned in an ultrasonic bath containing ethanol to remove loose debris from the surface of the coatings. Depth profiles of the wear tracks were obtained using a confocal optical microscope (Leica, model DCM3D, Wetzlar, Germany). The specific wear rate of the as-deposited and annealed Fe-W coatings was calculated from the Equation:
K = A l F D
where K is the specific wear rate (mm3/N m), A is the area of the wear track (mm2), l is the length of the wear track (mm), F is the applied load (N), and D is the sliding distance (m) [25]. The heat treatment of the samples was performed with a heating rate of 20 °C/min under high purity Ar 6.0 atmosphere in the furnace of a NETZSCH 402 C dilatometer (Burlington, MA, USA), keeping the samples for one hour at 200, 400, 600 and 800 °C. Afterwards, the samples were cooled down to room temperature inside the furnace. Crystallographic information was obtained by means of a Bruker (Karlsruhe, Germany) AXS D8 advance with Cr Kα radiation (λ = 2.0821 Å) operated at 35 kV and 40 mA. The surface morphology of the coatings, before and after the wear tests, was analyzed with help of a LEICA (Wetzlar, Germany) optical microscope and a Leo 1550 Gemini Scanning Electron Microscope (SEM, Oberkochen, Germany) with field emission gun. For further analysis, the SEM is equipped with EDS and Electron Backscatter Diffraction (EBSD) techniques. The EBSD data were acquired with a Nordlys II detector (Oxford Instruments, High Wycombe, UK) using a step size of 20 nm. Electron Backscatter Diffraction maps were acquired from the cross-section of the Fe-24W coating after annealing at 800 °C. HKL Channel 5 software (Oxford Instruments) was used for the post processing of the acquired EBSD data: Noise reduction was done by removal of wild spikes and extrapolation of non-indexed points (5 nearest neighbors required). The sample was analyzed in the ordinary EBSD setup (70° tilt of sample toward the EBSD detector). Three EBSD maps of 5 μm × 5 μm were obtained applying an accelerating voltage of 20 kV. The maps were afterwards stitched together by using Map Stitcher software (version 5.1267.0). Metallographic preparation of the cross-section was performed by mechanical polishing with a 50 nm finish using OP-S silica suspension as the last step.

3. Results and Discussions

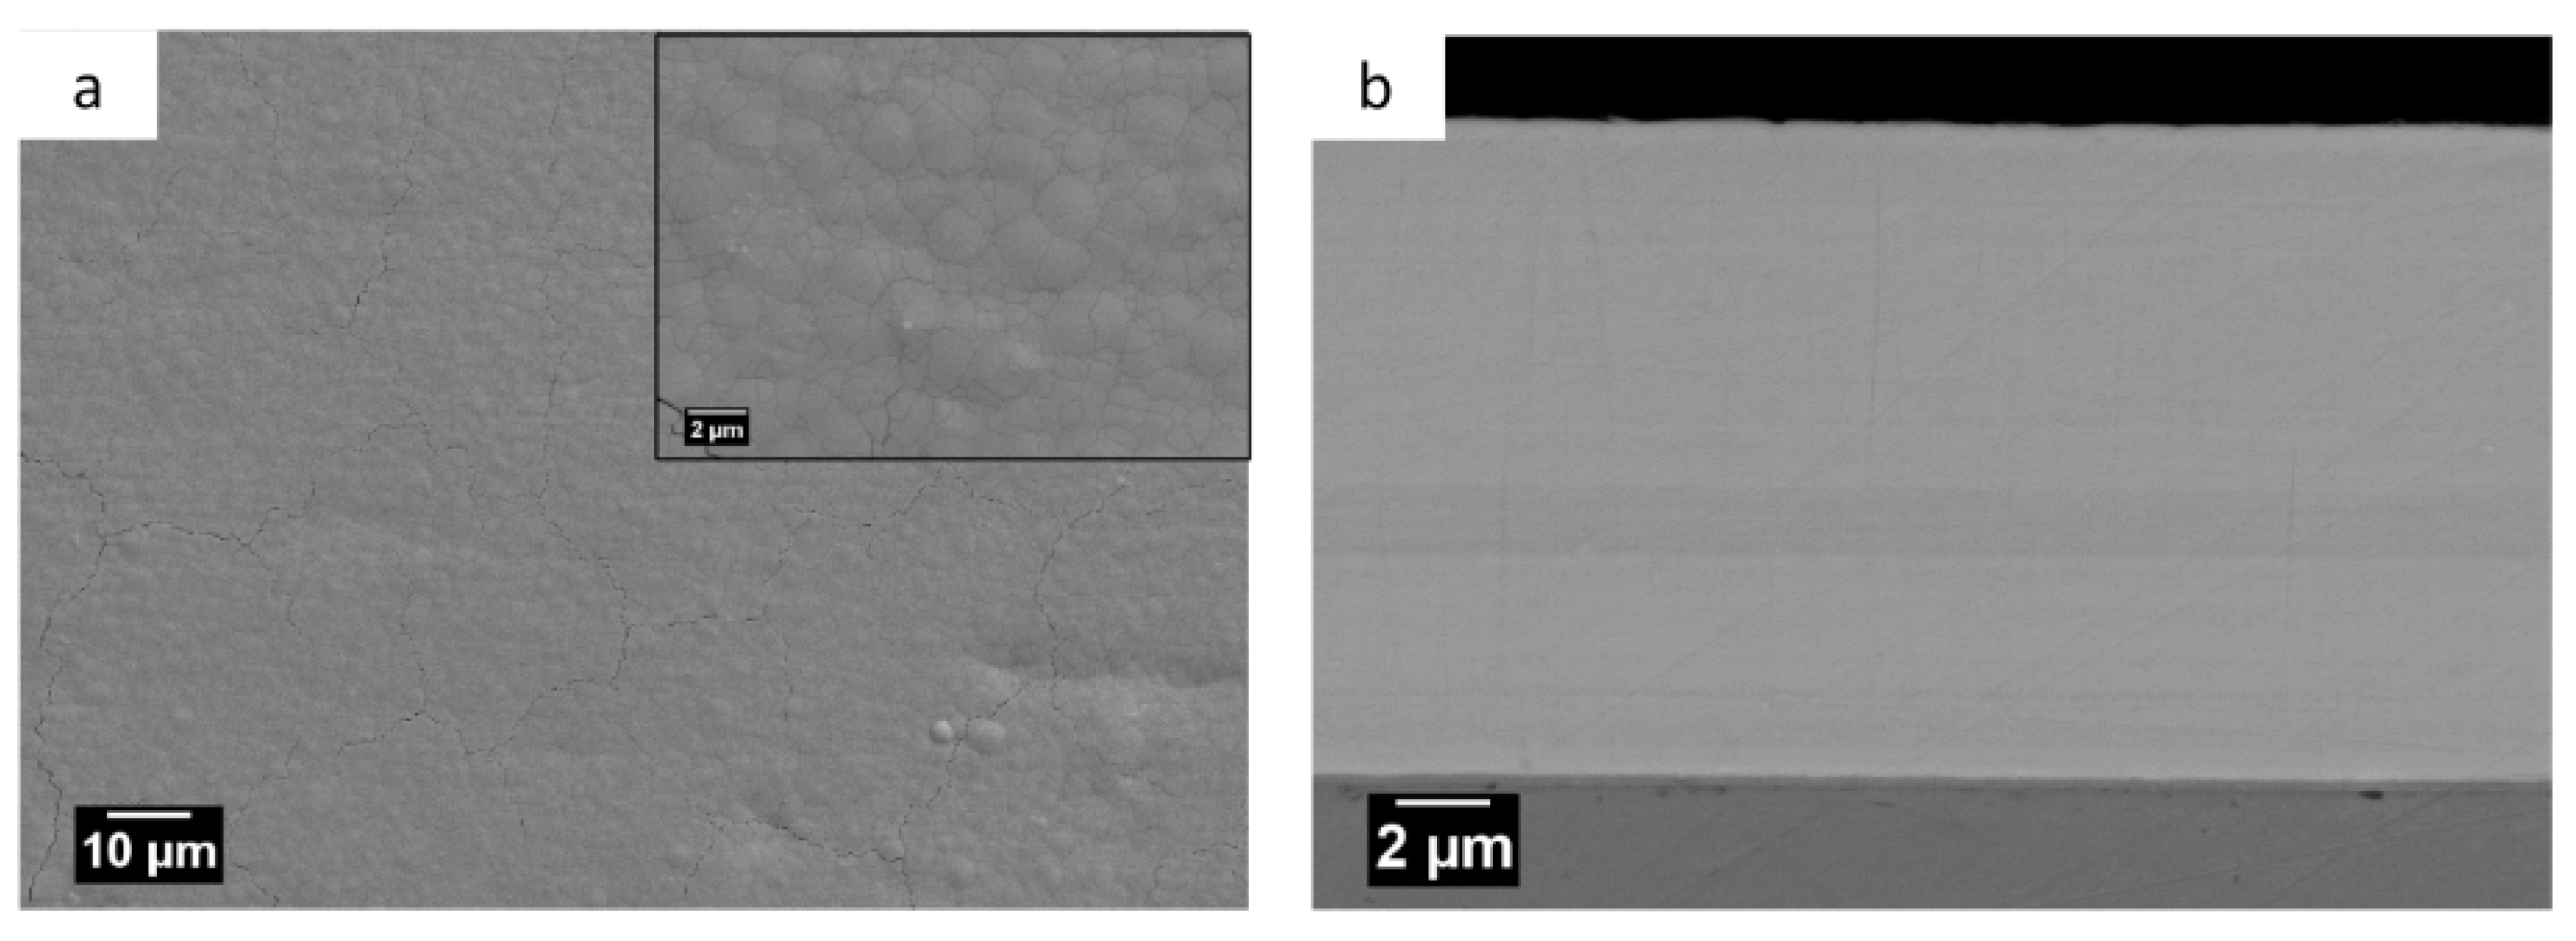
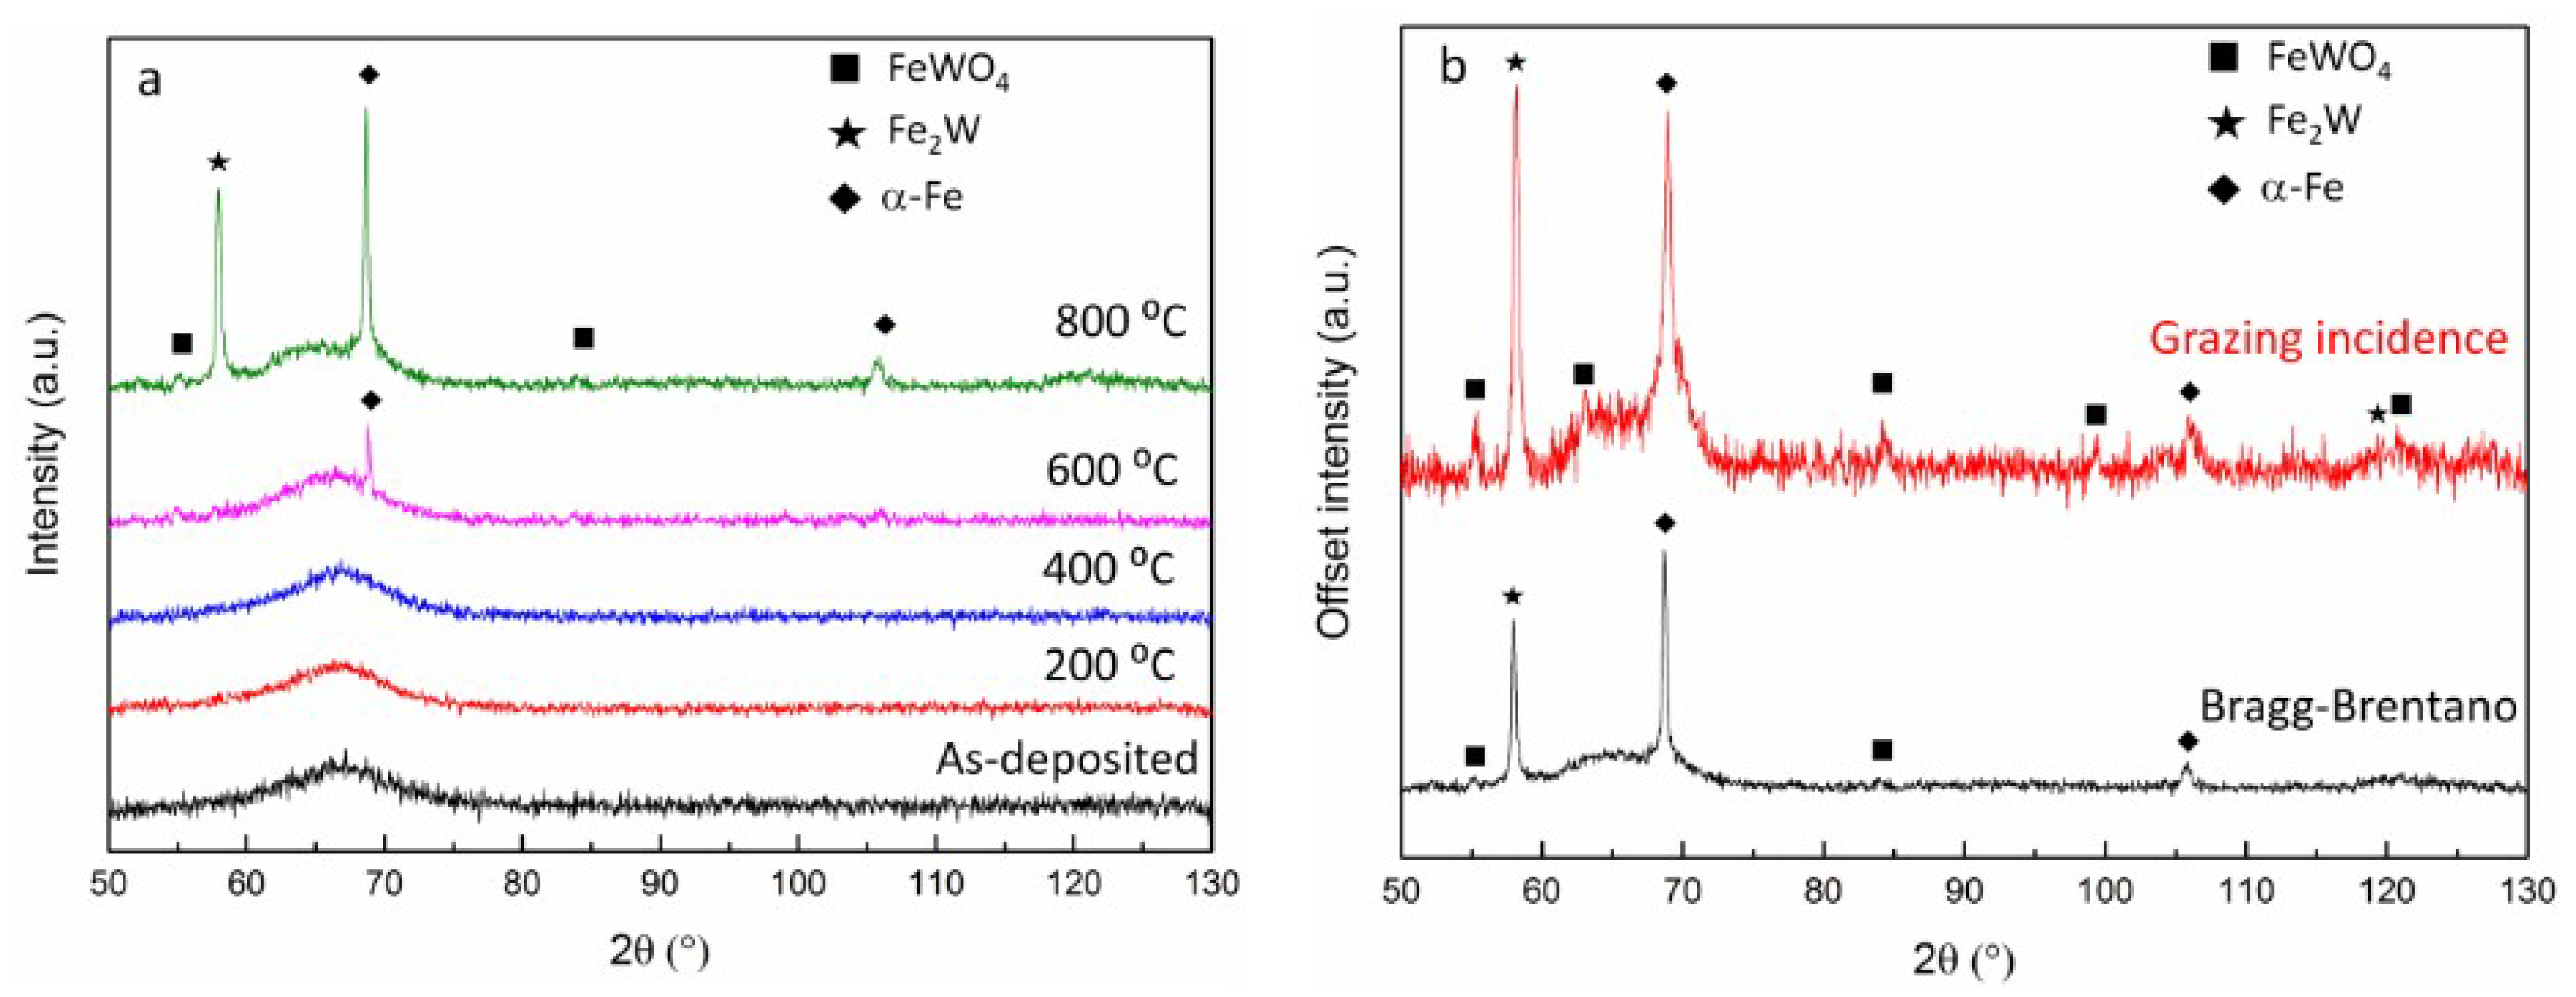
3.1. Structural Characterization of As-Deposited and Annealed Fe-W Coatings

Scanning Electron Microscope micrographs of the surface morphology and of the cross-section of the as-deposited Fe-24W coating are shown in Figure 1. The surface of the coating is smooth with some superficial cracks, as shown in Figure 1a and in the insert taken at higher magnification. The cracks can be considered superficial because they were not observed in the cross-section of the coatings—see Figure 1b. The formation of such superficial cracks can be inferred from the high amount of W co-deposited in the coatings, which leads to internal stresses in the deposited coating [8,12,26].
To study the effect of microstructural transformations on the wear resistance of Fe-24W coatings, heat treatments were performed, and the observed microstructural changes are shown in Figure 2. The crystallization of the Fe-24W coatings upon annealing are consistent with the previous findings, i.e., the Fe-24W coatings retain the amorphous structure up to 600 °C, at which point the first α-Fe crystalline peak is observed, and the crystallization of the Fe-24W sample is incomplete after annealing for one hour at 800 °C [8,9]. After annealing for one hour at 800 °C, the intermetallic phase Fe2W and the FeWO4 oxide phase are formed—see Figure 2. The formation of the Fe2W phase is expected according to the Fe-W phase diagram [27,28]. The formation of the FeWO4 phase can be attributed to some oxygen contamination in the Ar atmosphere. As a matter of fact, the formation of the FeWO4 phase was not observed upon annealing of Fe-24W coatings in a cleaner atmosphere, i.e., controlled vacuum (1 × 10⁻⁸ Pa) [8,9]. Also, XRD analysis on the sample annealed at 800 °C did not reveal the formation of other tungsten oxides, e.g., WOx Magnéli phases [29]. Figure 2b shows spectra of the sample annealed at 800 °C, acquired with Bragg–Brentano and grazing incidence geometry. The spectrum acquired with grazing incidence geometry is obtained scanning the samples with the angle of incidence set at 3° (information depth of the measurement limited to ~0.5 μm from the surface of the sample). The results shown in Figure 2b indicate that the surface of the sample annealed at 800 °C is rich in Fe2W and FeWO4 phase. In fact, in the spectrum acquired with grazing incidence geometry, the peaks of both Fe2W and FeWO4 phase appear with an increased intensity. Here, the peak with the highest intensity belongs to the Fe2W phase and not to the α-Fe phase, as observed in the case of the spectrum acquired with Bragg–Brentano geometry. Also, more crystalline peaks of the FeWO4 phase are visible in the spectrum acquired with grazing incidence geometry that were not observed in the spectrum acquired with Bragg–Brentano geometry. The crystallization of the sample upon annealing at 800 °C is also clearly observed in the backscattered electrons images of the surface and the cross-section of the sample (Figure 3). As shown in Figure 3a, FeWO4 grains are easily detectable at the surface of the sample. They have a diameter of ~1 μm and appear dark due to the lower W content of the Fe2W phase. The oxygen content in these grains reaches ~60 at.%, which corresponds to the atomic fraction of oxygen in FeWO4. The smaller grains around the oxide phase are characterized by a W content of ~30 at.%, which corresponds to the expected amount in the Fe2W phase.
As shown in Figure 3b, the crystallization along the cross-section of the sample annealed at 800 °C appears quite inhomogeneous. Different areas can be identified along the cross-section which are highlighted in Figure 3b with the numbering 1, 2 and 3. Area 1 is characterized with a uniform fine-grained structure. A large elongated grain, surrounded by smaller and bright grains, is found in area 2. In area 3, close to the surface of the sample, darker grains of ~1 μm in diameter are observed. To identify the observed structures, EBSD analysis was performed on a selected area of the cross-section of the sample annealed at 800 °C. In Figure 4a, the red dashed box defines the area where the EBSD phase map was acquired, shown in Figure 4b. The phases acquired through XRD analysis, i.e., α-Fe, Fe2W and FeWO4, were used as reference phases for the EBSD indexing by specifying them as a priori information in the EBSD software [30]. In the phase map shown in Figure 4b, the following colour code is used: The blue grains are indexed as α-Fe phase, the red grains are identified as the FeWO4 phase, and the violet grains belong to the Fe2W phase. As shown in the phase map, the large grain found in area 2 is indexed as α-Fe grain, and the smaller, brighter grains surrounding it are mostly indexed as Fe2W. Close to the surface, FeWO4 grains of about 1 μm in diameter are found. The uniform fine-grained structure seen in area 1 is mostly characterized by small α-Fe grains, and smaller FeWO4 and Fe2W grains (a few hundred nm in diameter). Furthermore, there is also a large fraction of zero solutions (appearing white in the phase map). Such high fraction of zero solutions can be attributed to the nanocrystalline/amorphous nature of the sample, which is conserved after the heat treatment at 800 °C and thus cannot be indexed by EBSD technique. The incomplete crystallization of the sample was already indicated by the broad shoulder visible in the XRD spectrum (see Figure 2).

3.2. Wear Resistance of As-Deposited and Annealed Fe-W Coatings and Hard Chromium Coatings

The wear resistance of the Fe-24W coatings was analyzed using sliding tests with a ball-on-disk configuration. The variation of the COF as a function of the sliding distance is shown in Figure 5. As can be seen in Figure 5, for all the Fe-24W samples the COF increases rapidly and, after a running period of 325 s, it reaches ~0.8. Similar values were found in previous tests performed on Fe-W coatings [14,15]. Such high values of the COF are expected when two hard surfaces are in contact. However, with the increase of the sliding distance, the trend of the COF appears unstable, i.e., it decreases continuously or more abruptly (like in the case of the sample annealed at 200 °C). Only for the Fe-24W sample annealed at 800 °C, the COF remains stable at ~0.8 throughout the whole test (see Figure 5).
Such instability in the measured COF can be understood by optical and electron microscopy analyses of the wear tracks. Optical micrographs of the wear tracks on the Fe-24W samples are provided in Figure 6. Cracks of about 15 μm in depth are found in the wear tracks of the as-deposited sample and samples which were annealed at 200, 400 and 600 °C (see Figure 6a–d). The depth of these cracks is comparable to the thickness of the coatings. In Figure 6, these cracks appear as dark spots within the wear track. The cracks are formed locally and are not present throughout the whole wear track. In the crack-free areas, the depth of the wear track varies between 4 and 8 μm, i.e., it is substantially lower. For the as-deposited sample, a comparison of the wear track profiles in a cracked area and a crack-free area is shown in Figure 7a–d. Similar cracks are not found in the wear track of the Fe-24W sample annealed at 800 °C. For this sample the depth of the wear track is at most ~3 μm along the whole track. A representative wear track profile of the Fe-24W sample annealed at 800 °C is shown in Figure 7e,f.
Wear tests were also performed on electrodeposited hard chromium coatings, and the results of COF variation and wear rate are shown in Figure 8a. The hard chromium coating was tested with the same wear parameters applied for the tests on the Fe-24W coatings. As shown in Figure 8a, the hard chromium coating is characterized with a lower COF, i.e., ~0.5, as compared to Fe-24W coatings. The lower COF of the hard chromium coating could be inferred from its lower surface roughness as compared to Fe-24W coatings. However, the measured wear rate is comparable to the wear rate of the Fe-24W coating annealed at 800 °C (see Figure 8b). The wear rate was obtained by means of Equation (1), considering for each sample an average wear track area (A). The average area was calculated from four surface profiles acquired at different locations along the wear track (i.e., from the upper and lower part of the wear track, and from the right and left side). For the Fe-24W samples showing deep cracks in the wear track, two profiles were acquired from a cracked area and two more were acquired from a crack-free area. This explains the large standard deviations of the wear rate of the as-deposited and samples annealed up to 600 °C (see Figure 8b).
To understand the mechanism behind the wear of the Fe-24W samples, the wear tracks were investigated in more detail by use of SEM, and the acquired micrographs are shown in Figure 9. For the as-deposited sample and samples annealed up to 600 °C, the wear tracks appear rather similar, i.e., traces of an adherent oxide film are found along the wear tracks. The adherent oxide film is not distributed homogeneously, i.e., in some areas the polished coating is still visible (e.g., see Figure 9b). Debris is formed and is agglomerated mostly along the side of the wear track. Furthermore, some superficial cracking and wear grooves are also found along the wear tracks. Chemical analyses performed with EDS point analysis showed a significant enrichment in oxygen in the areas where the adherent oxide film and the piles of debris are located. The different representative areas where the EDS point analyses were performed are highlighted in Figure 9 and the results are collected in Table 1. In the areas where the oxide film and the debris are present, the oxygen increases up to ~60 at.%, which corresponds to the atomic fraction of oxygen of mixed iron oxide (i.e., Fe2O3, FeO·Fe2O3).
The findings suggest that tribo-oxidation is the main wear mechanism occurring in these samples. Tribo-oxidation is the result of the thermal energy generated by the friction of two surfaces sliding together, e.g., the Fe-24W coatings and the alumina counter-body. Thus, the oxidation of the Fe-24W coatings is an intrinsic response of the material to recover from the thermal energy during dry friction [31]. The abrasive iron oxide particles formed during the sliding tests reduce the wear resistance of the Fe-24W coatings, causing the formation of the deep cracks and thus leading to higher wear volumes (see Figure 8b). This combination of adhesive and abrasive wear mechanism was already observed in previous studies on electrodeposited Fe-W and Fe-W-P coatings [15,17].
The wear track of the sample annealed at 800 °C appears different from the other samples, i.e., traces of adherent oxide films are not observed. Chemical analyses show (Table 1) an enrichment in oxygen within the wear track, which is, however, not as drastic as in the case of the other samples. It should be noticed that the results for EDS spectra 3 and 4 are given as approximate values, as the surface of the sample is covered by two phases, i.e., Fe2W and FeWO4. Hence, the chemical composition measured with EDS point analysis will vary depending on the actual location. Some small oxidized areas are found also in the wear track of the sample annealed at 800 °C (see the dark spot in Figure 9j). Here, the measured oxygen is ~60 at.%, suggesting the presence of iron oxide. These findings indicate that the sample annealed at 800 °C is less affected by tribo-oxidation. In fact, as shown by SEM, EBSD and XRD results, the surface of the sample is mainly covered by hard phases which are not prone to oxidation, i.e., Fe2W and FeWO4. Hence, the higher wear resistance of the sample annealed at 800 °C, reflected by the absence of deep cracks and the presence of a lower wear rate, can be explained by the higher resistance of the sample to tribo-oxidation.
The wear tracks of hard Cr coatings were also investigated, and the acquired SEM micrographs are shown in Figure 10. Here, the wear mechanism appears to be mainly abrasive, due to the presence of abrasion grooves along the wear track. Also, some adherent wear debris is found in the wear track (see Figure 10b). Energy Dispersive X-ray Spectroscopy point analyses of the adherent debris (spectra 2 and 3) show presence of oxygen and traces of Al (Table 2). This indicates that the debris is composed of chromium oxide and a transfer layer from the alumina counter-body.

4. Conclusions

The wear resistance of as-deposited and annealed Fe-W coatings with 24 at.% of W has been studied and compared to the wear resistance of electrodeposited hard chromium coating. In particular, the interdependences between the microstructural transformation occurring upon annealing and the wear mechanism have been analyzed. Based on the results presented in this study, the following observations and conclusions can be made:
  • The heat treatment of the Fe-24W coatings in Ar at 800 °C led to the crystallization of α-Fe, Fe2W and FeWO4 phases. The formation of the FeWO4 phase can be attributed to some oxygen contamination in the Ar atmosphere. As shown by XRD results, the surface of the sample annealed at 800 °C was rich in Fe2W and FeWO4.
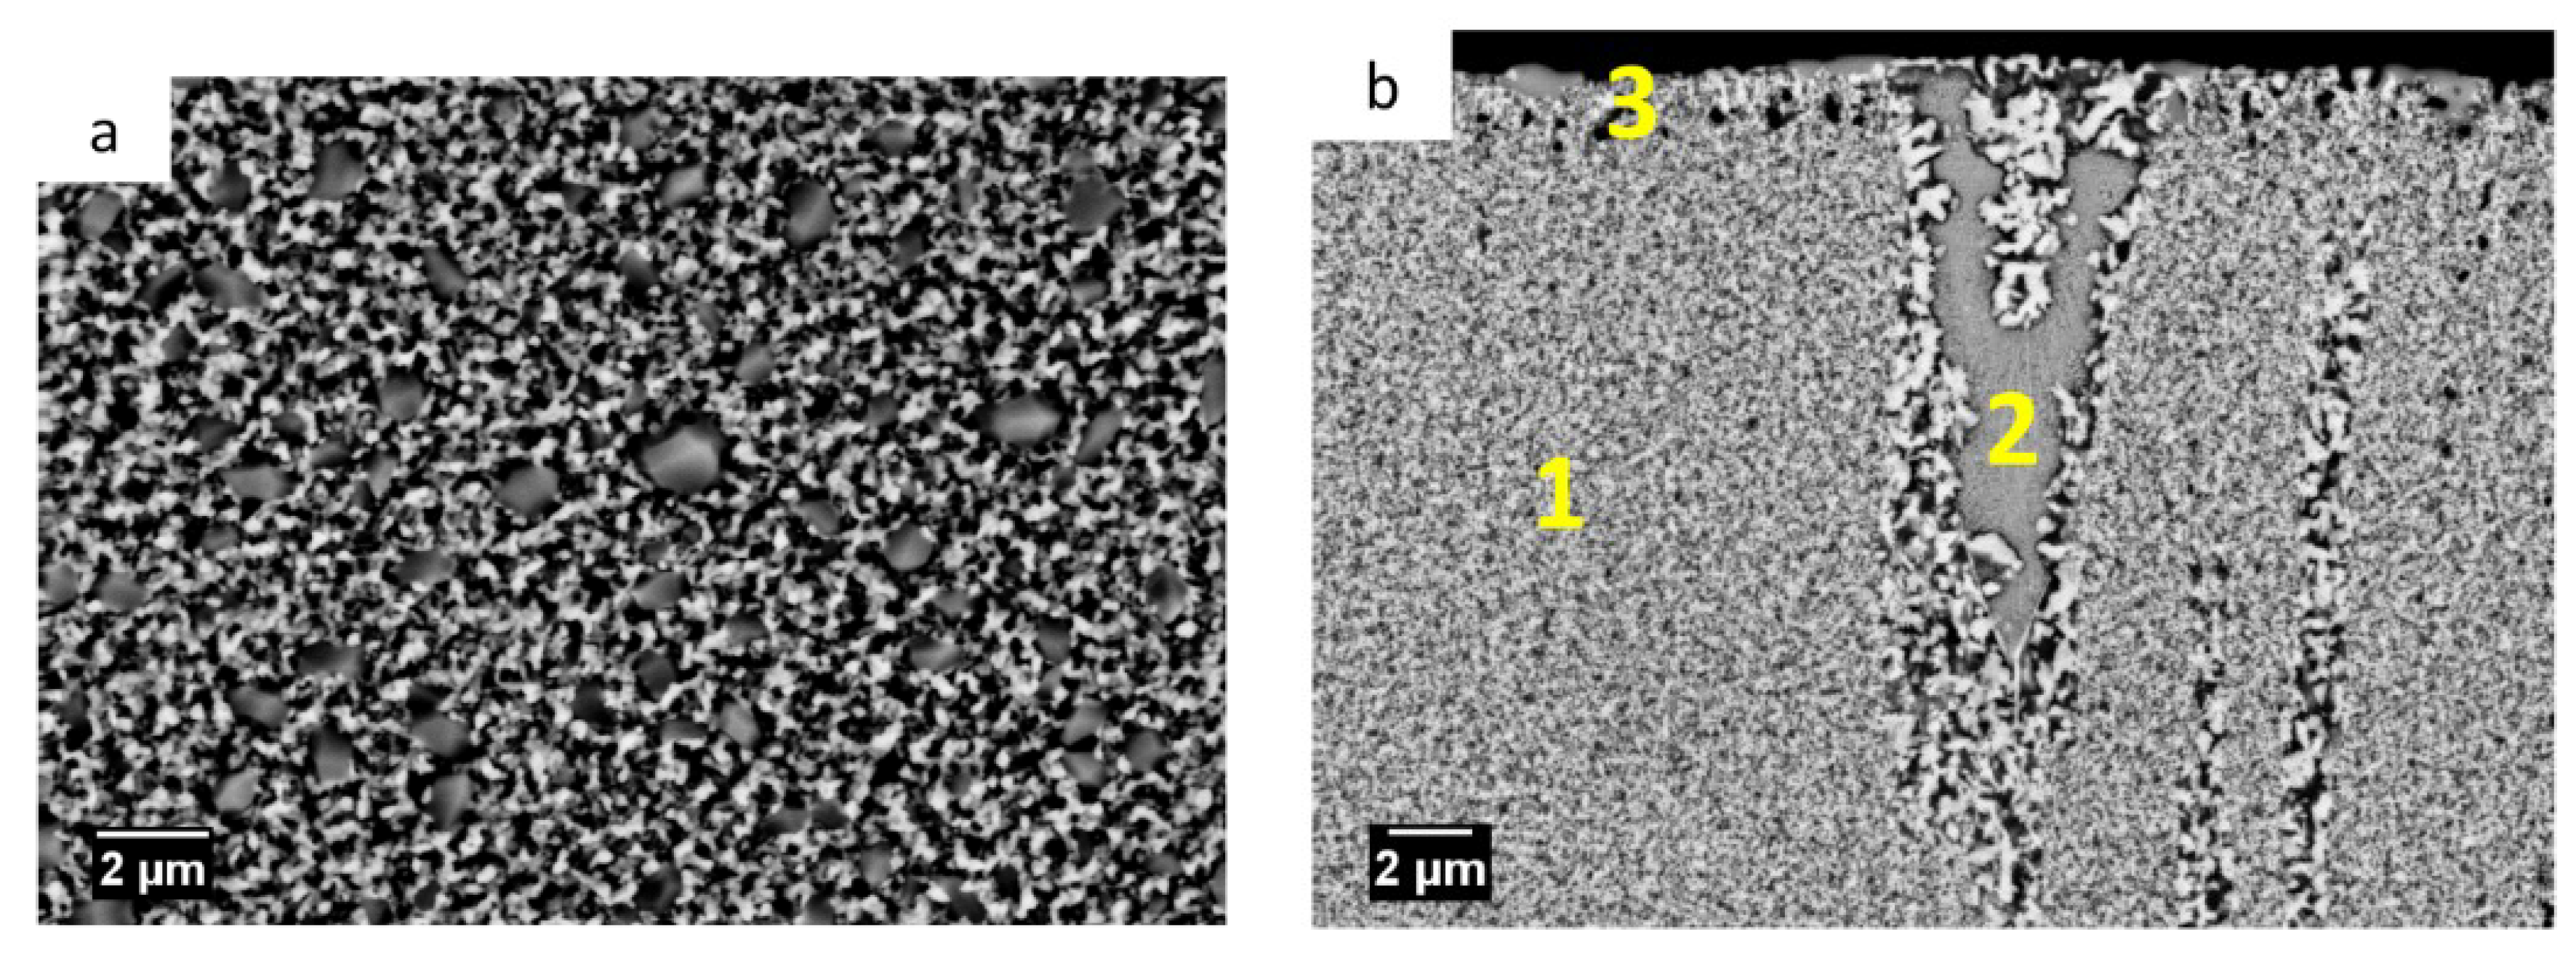
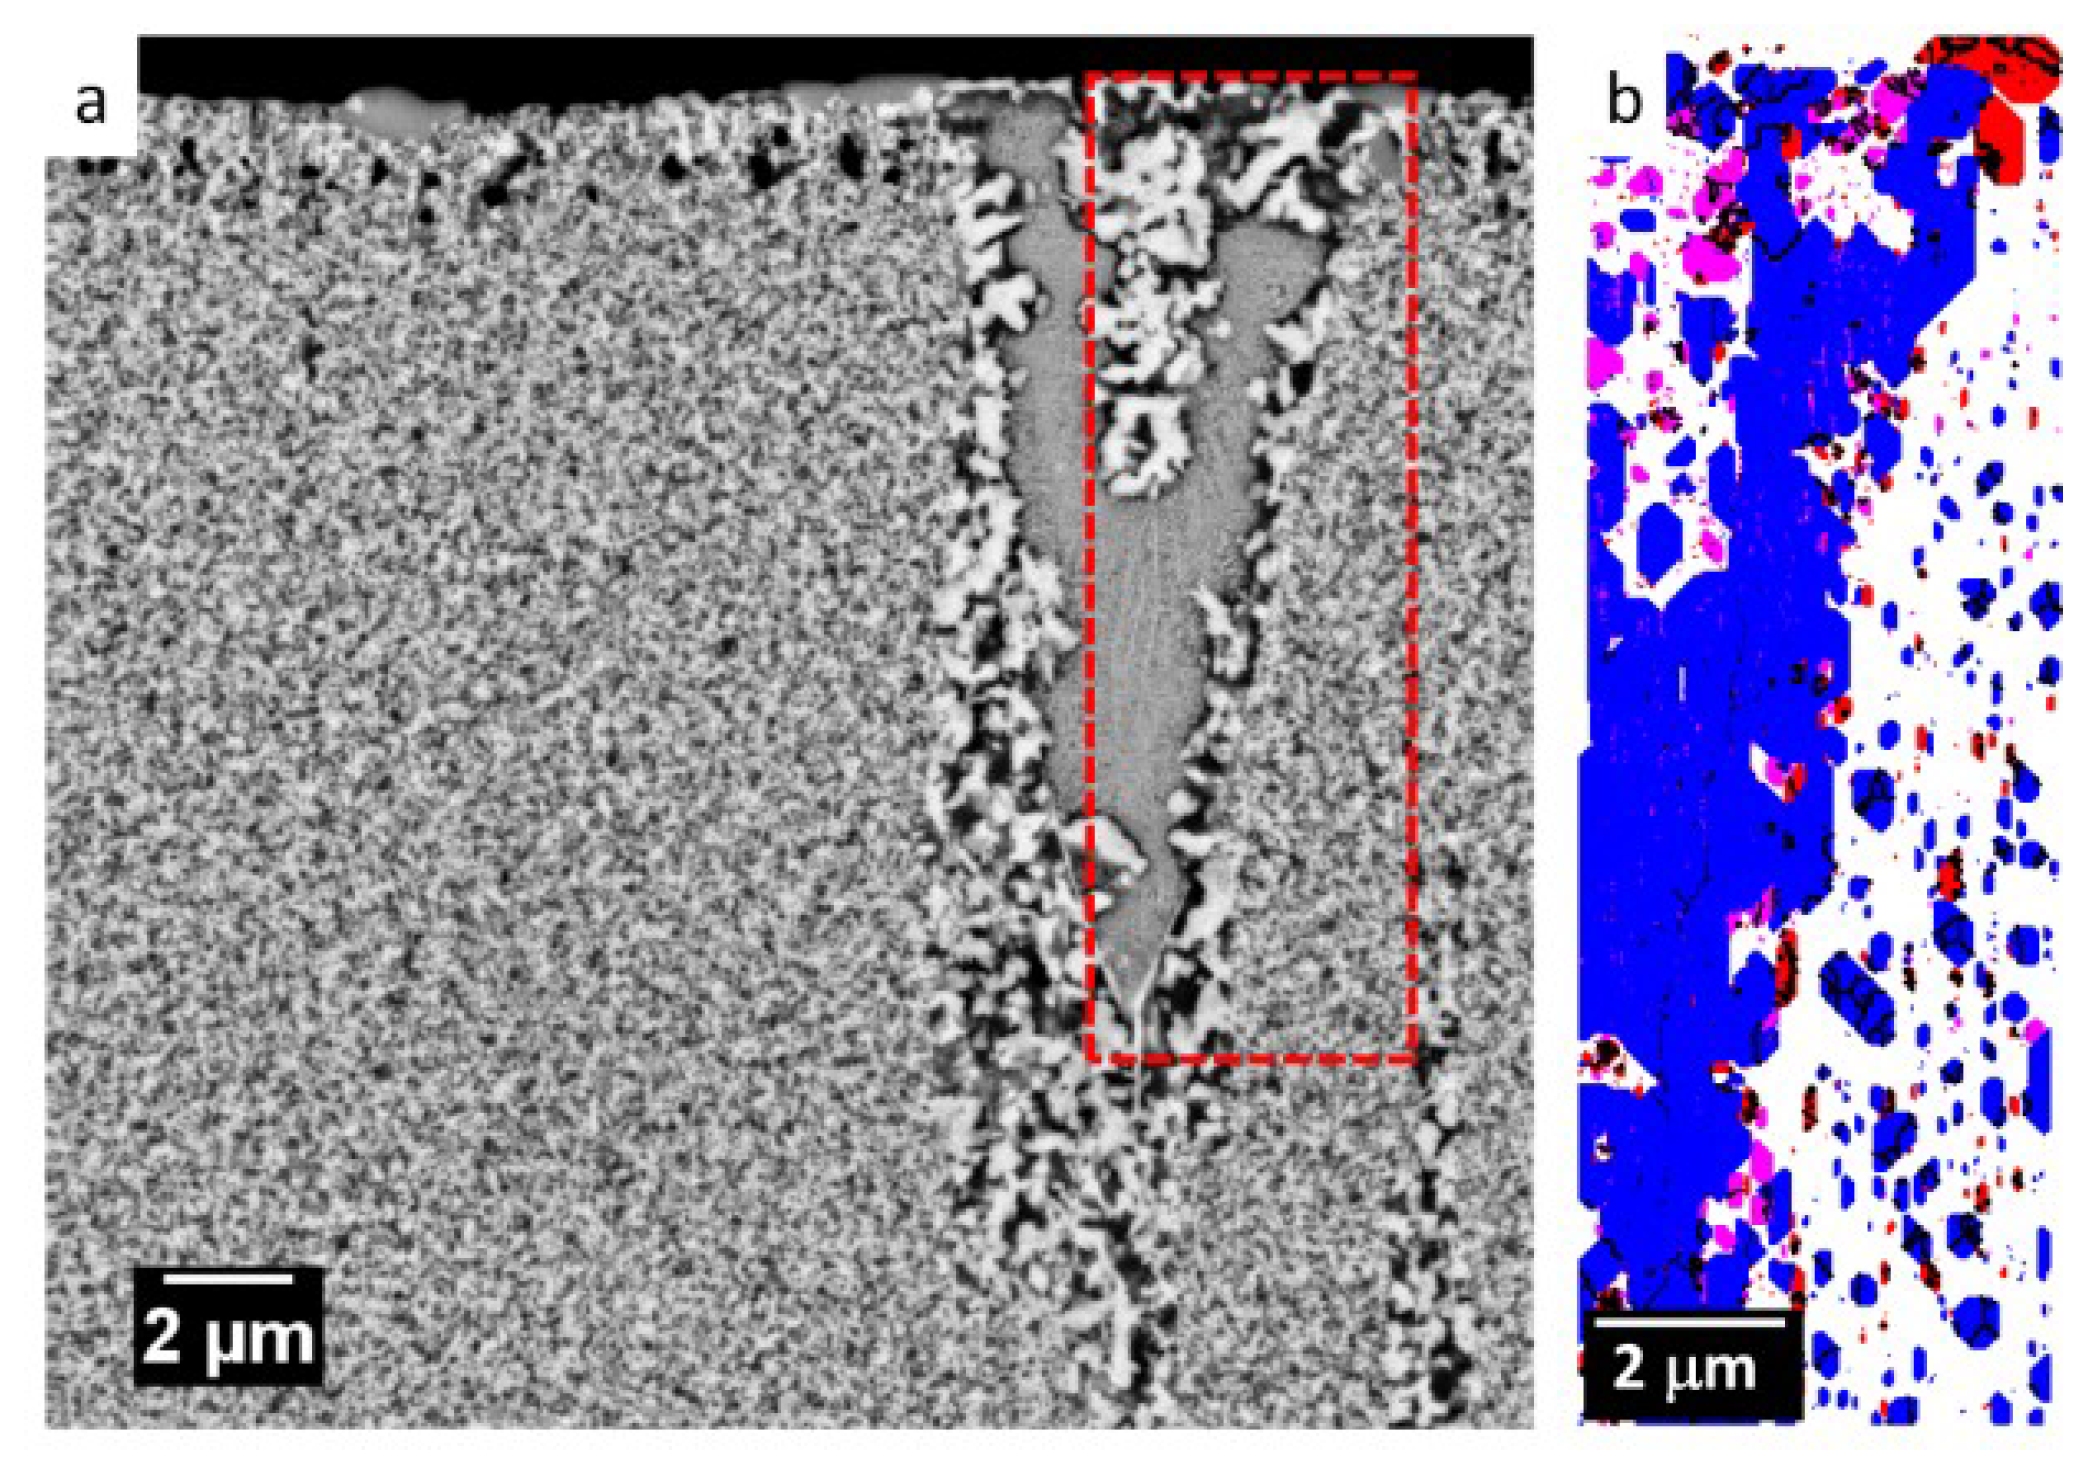
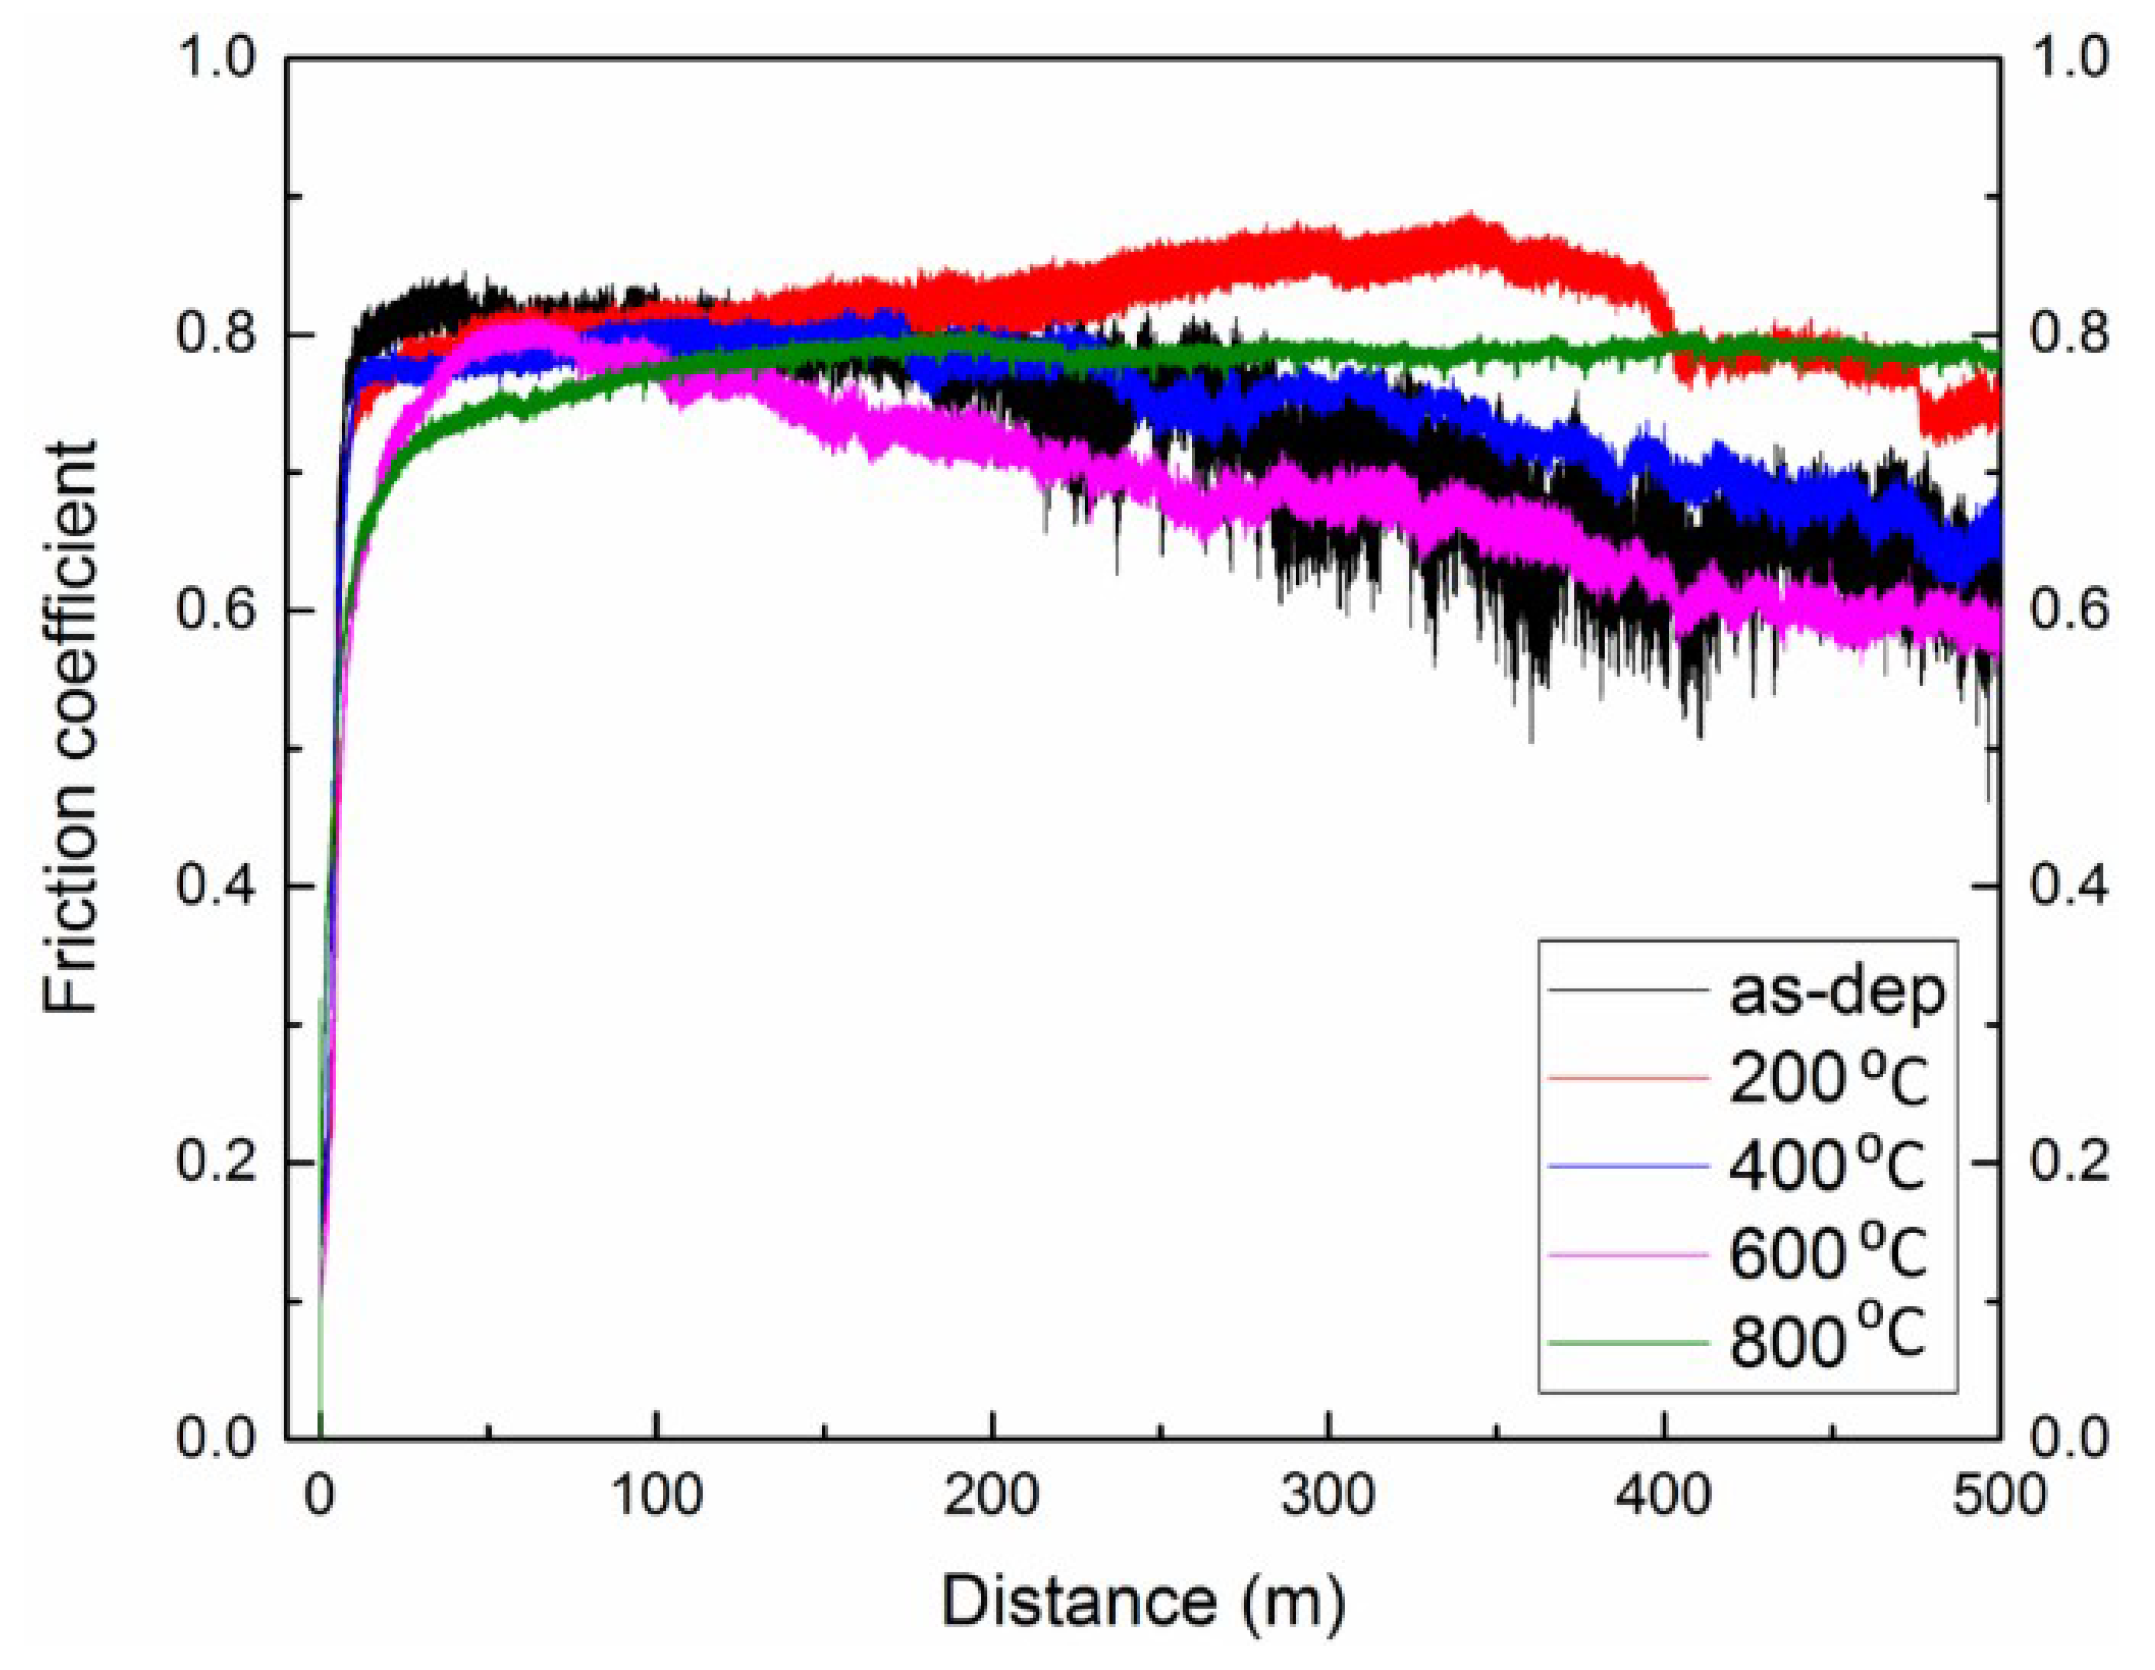
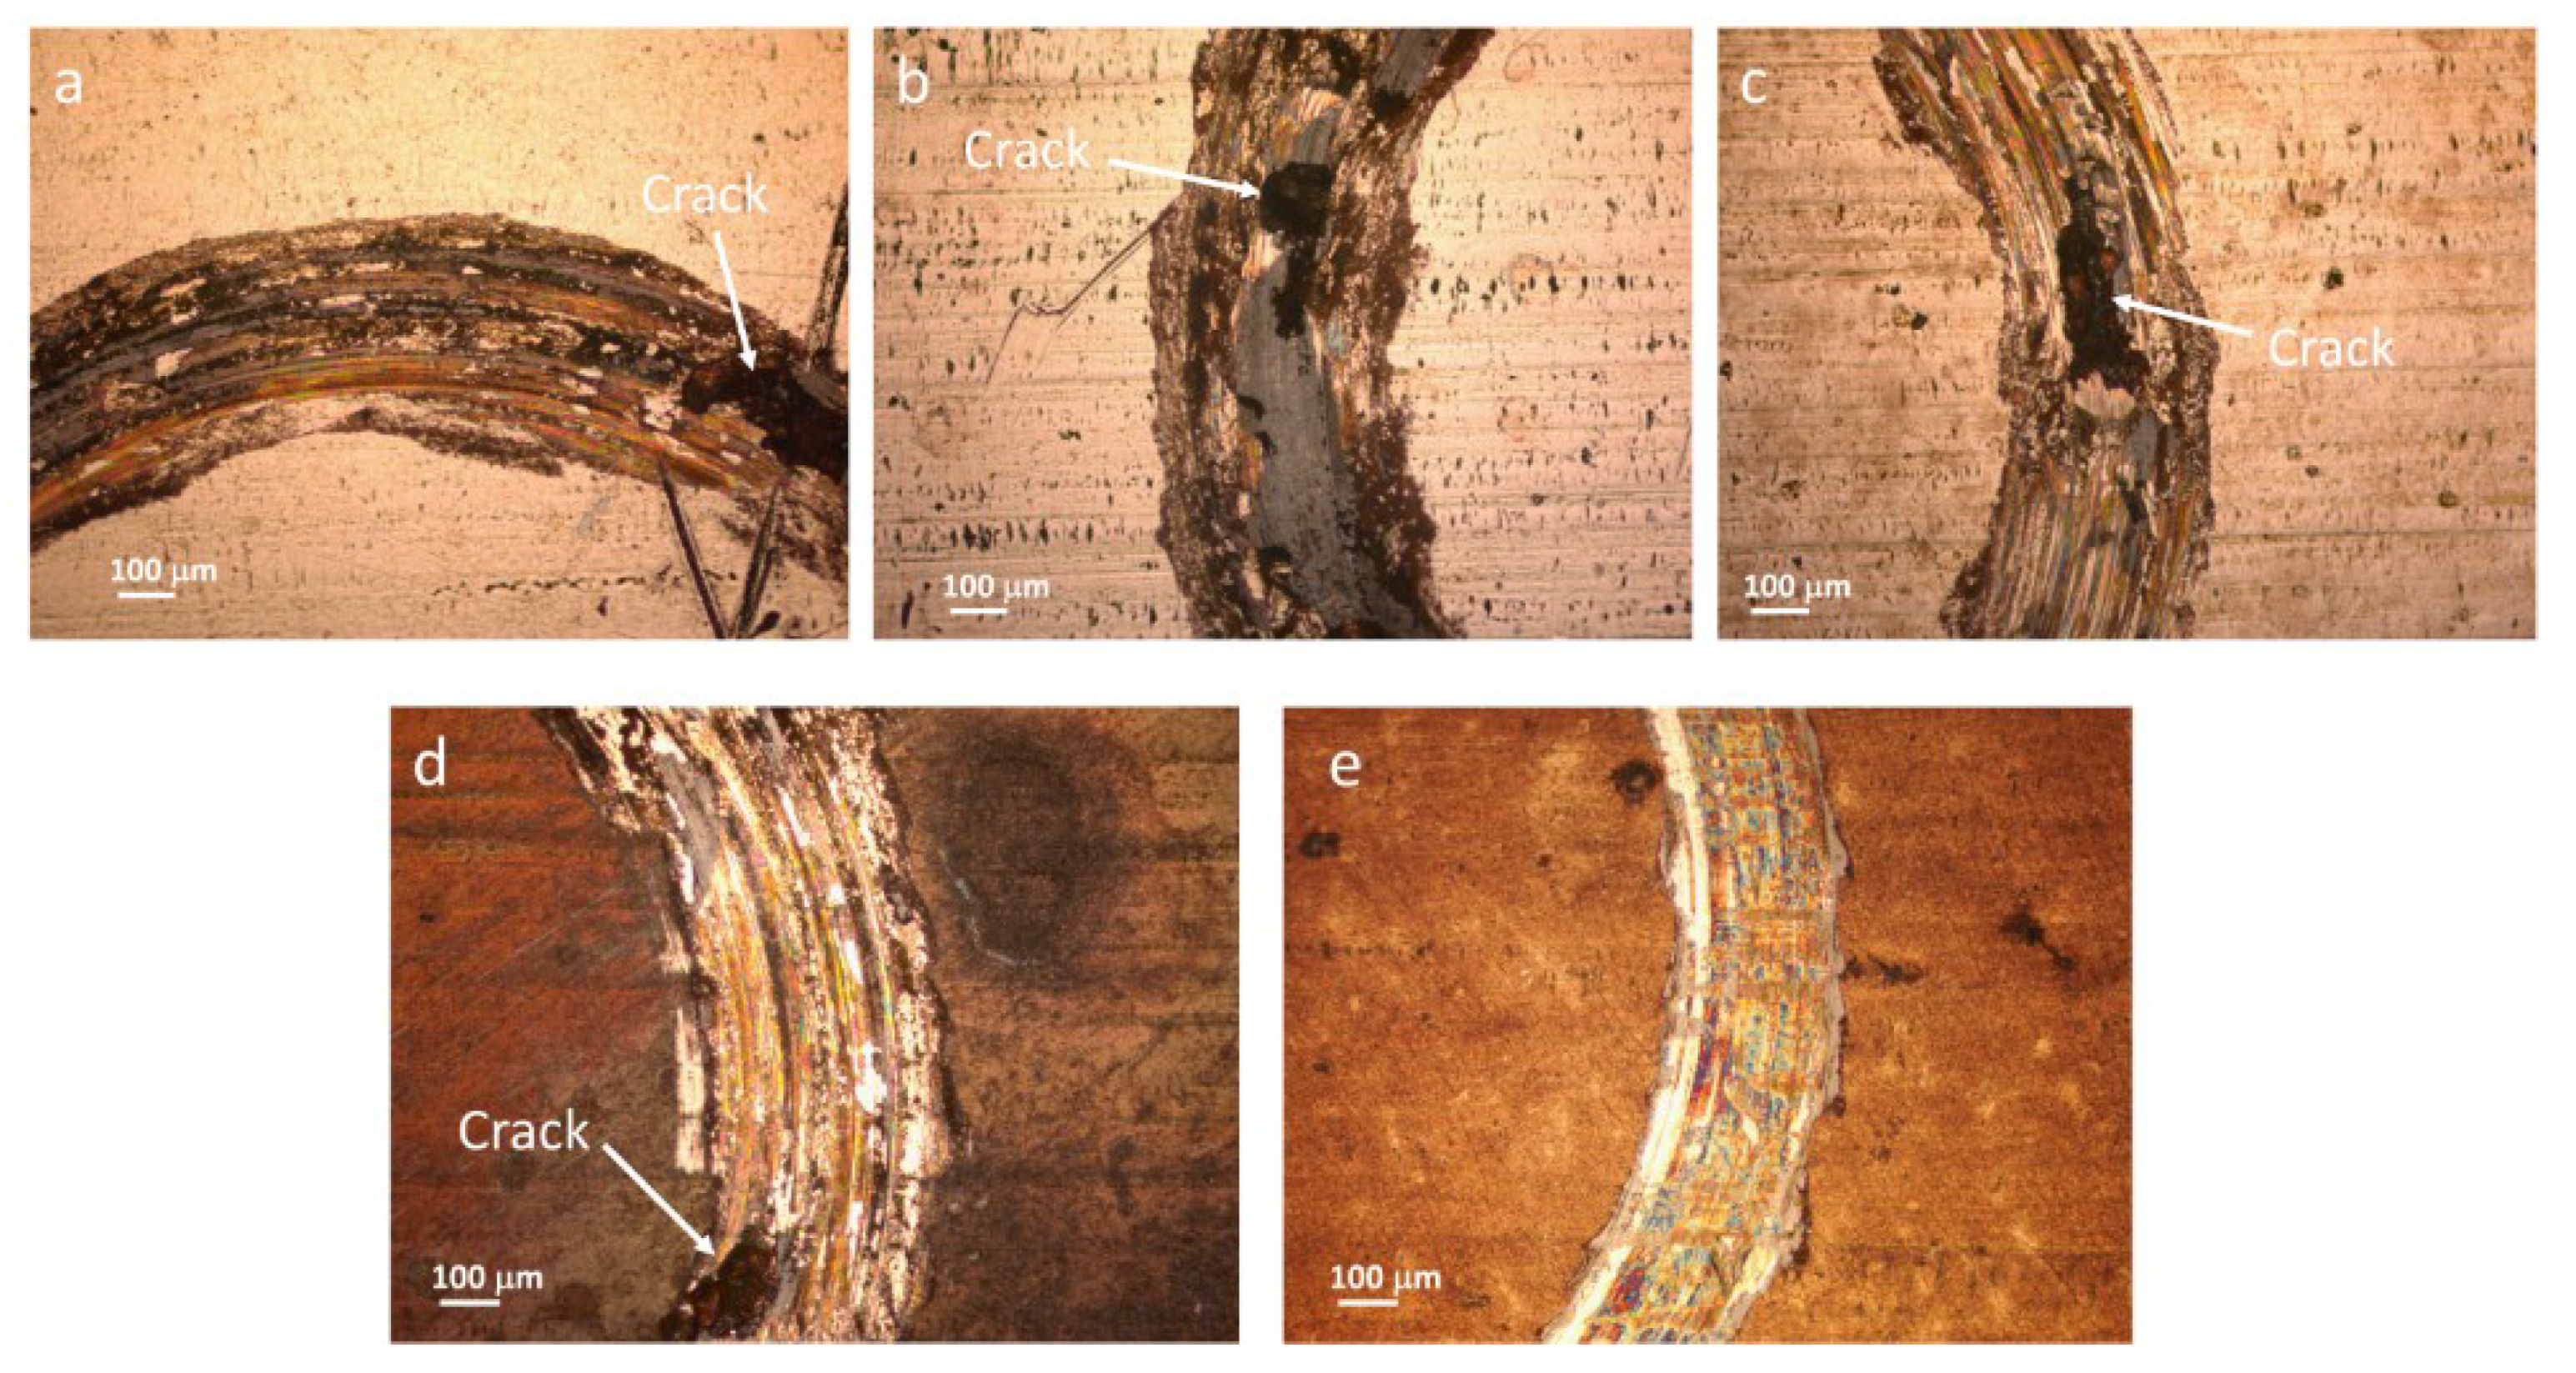
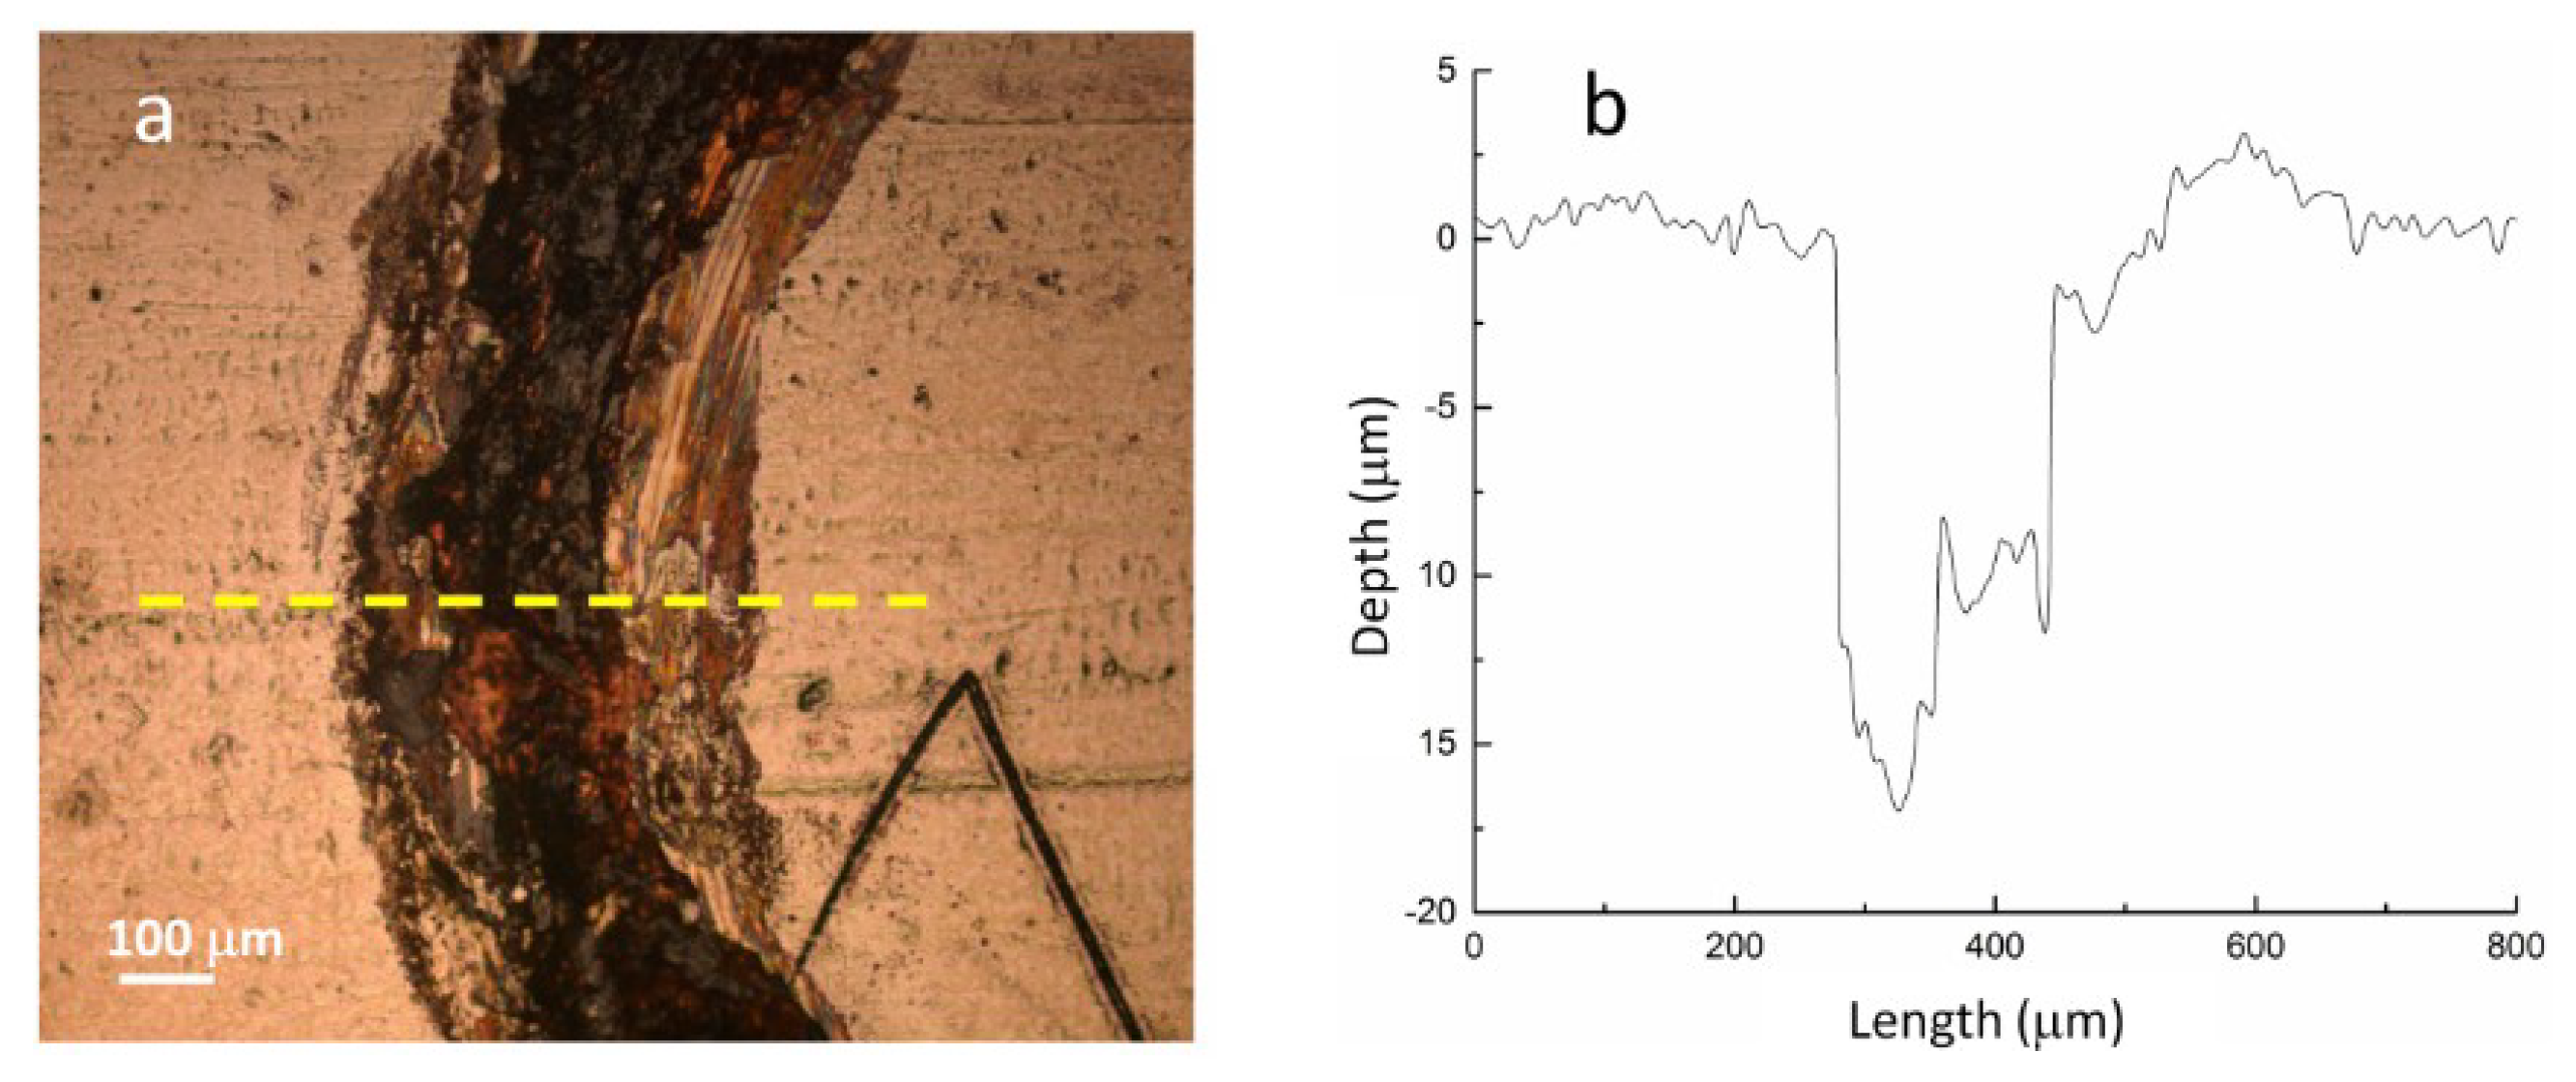
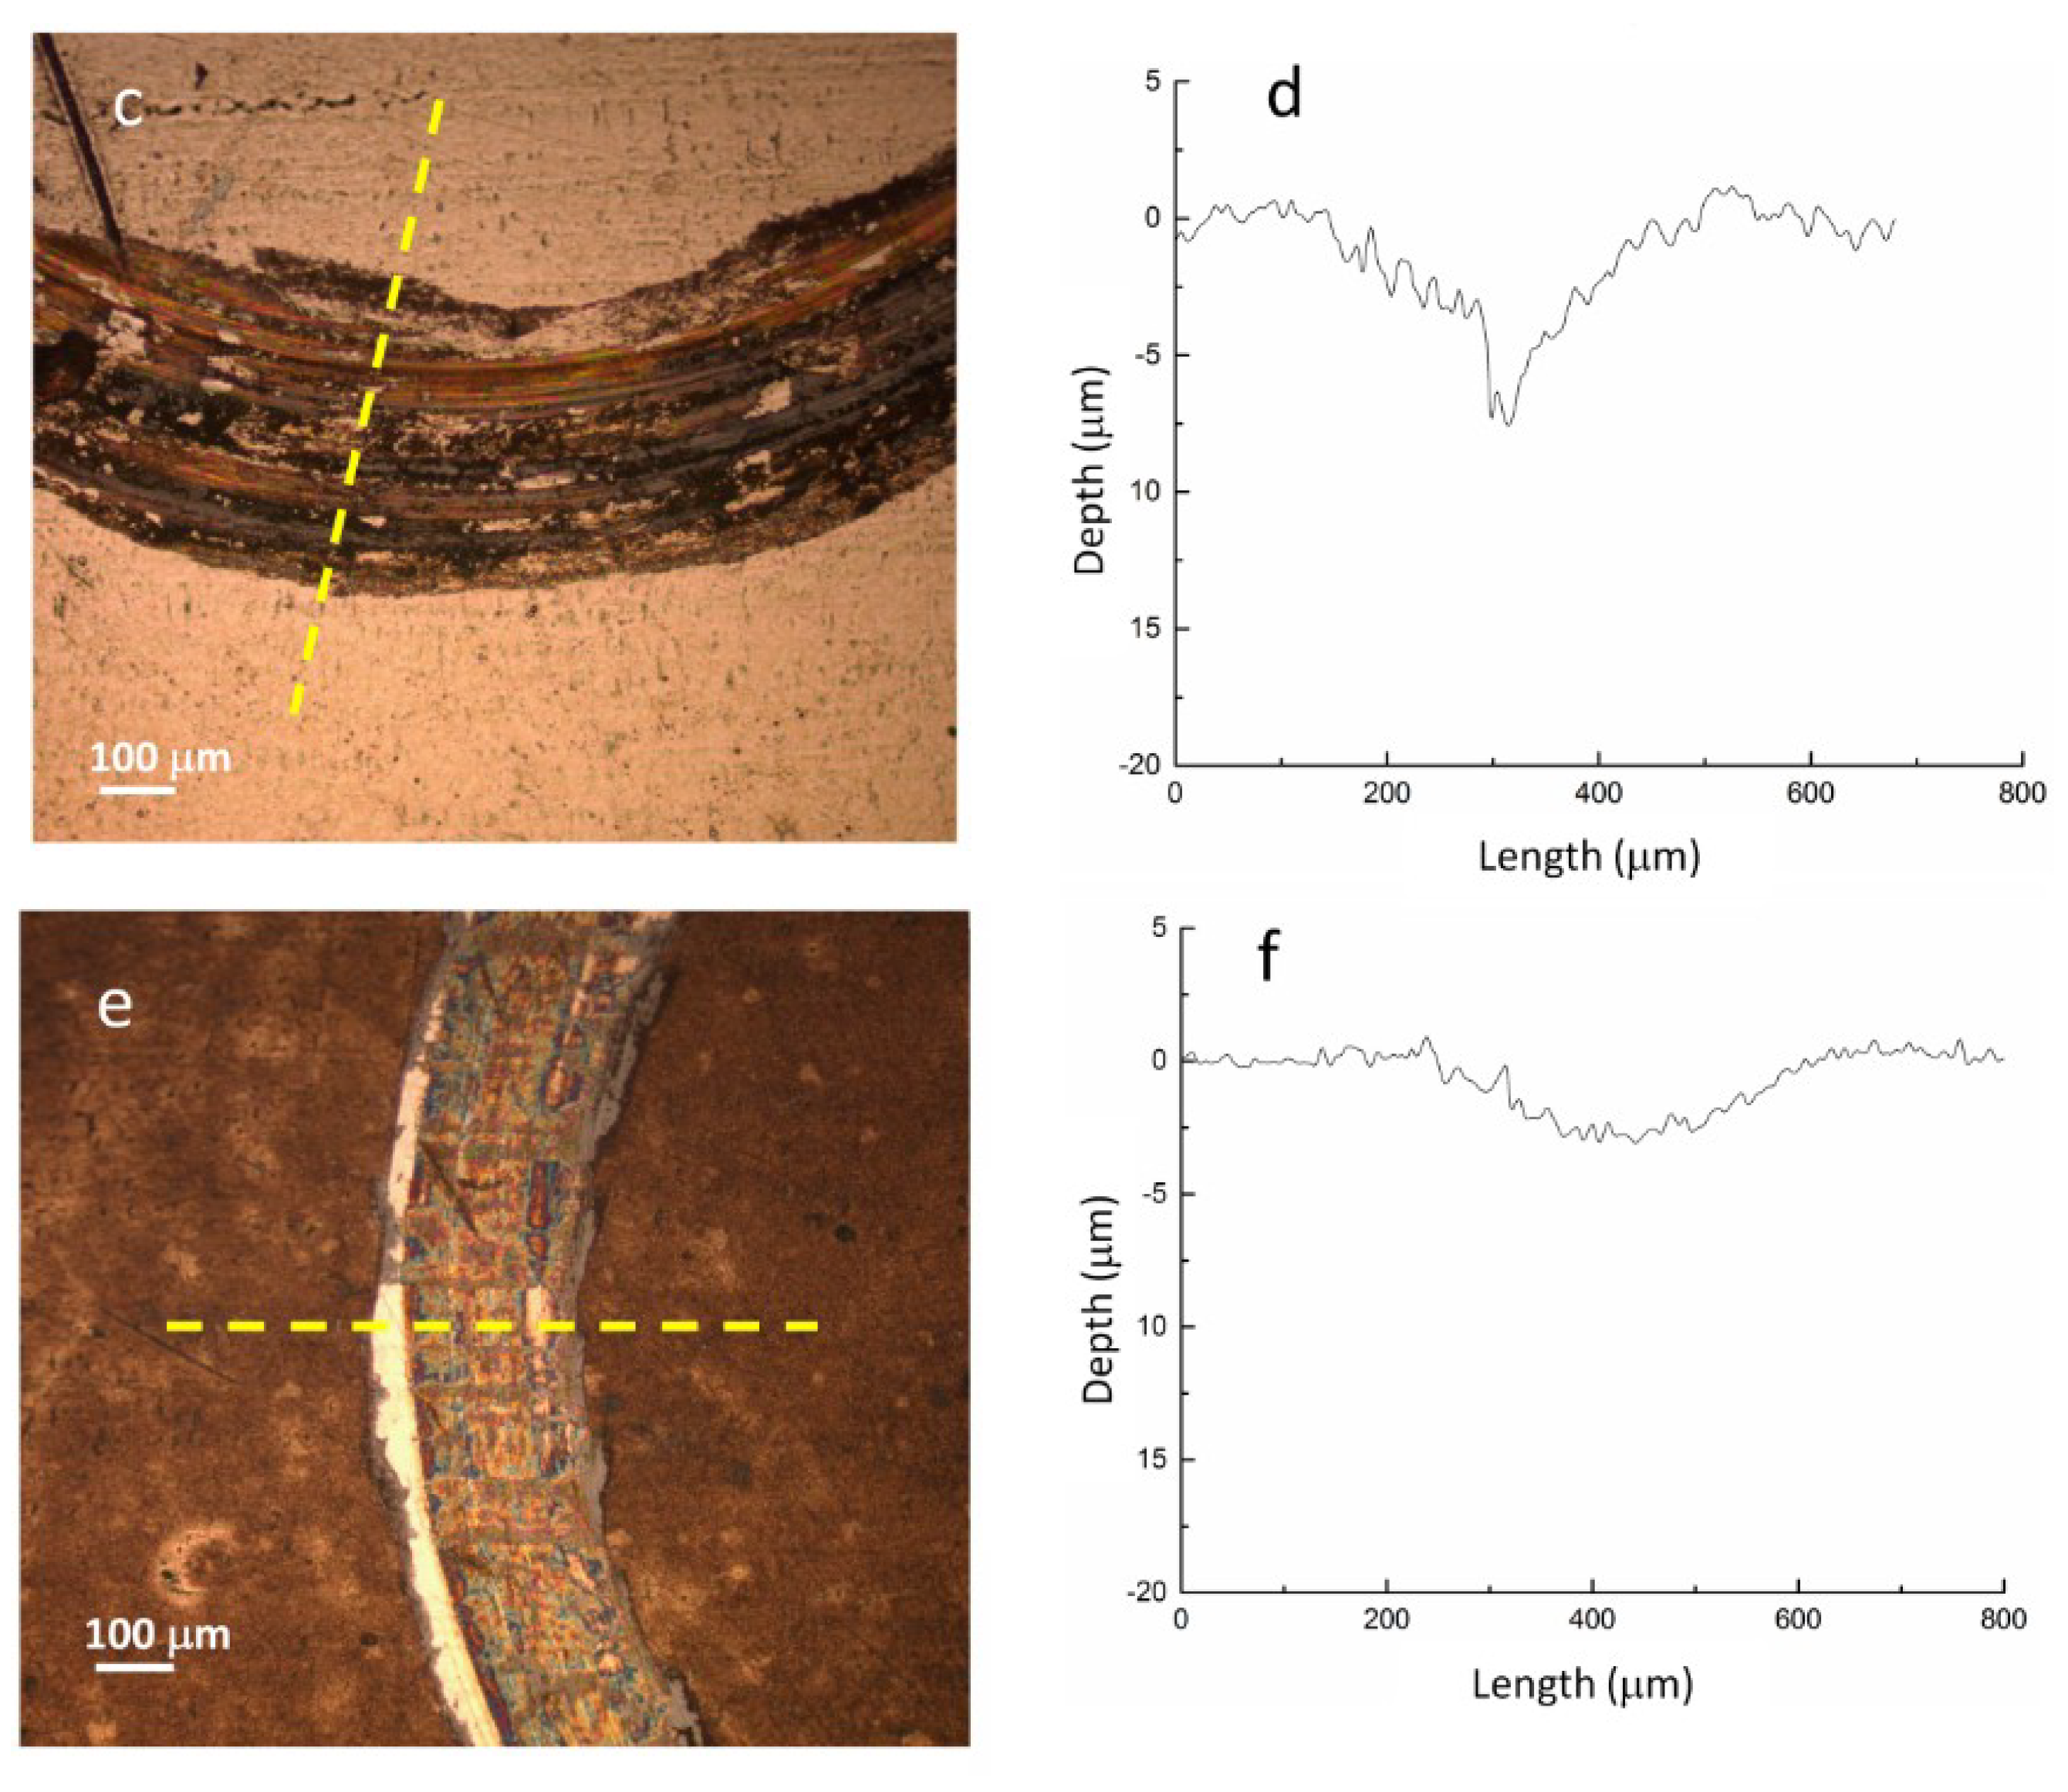
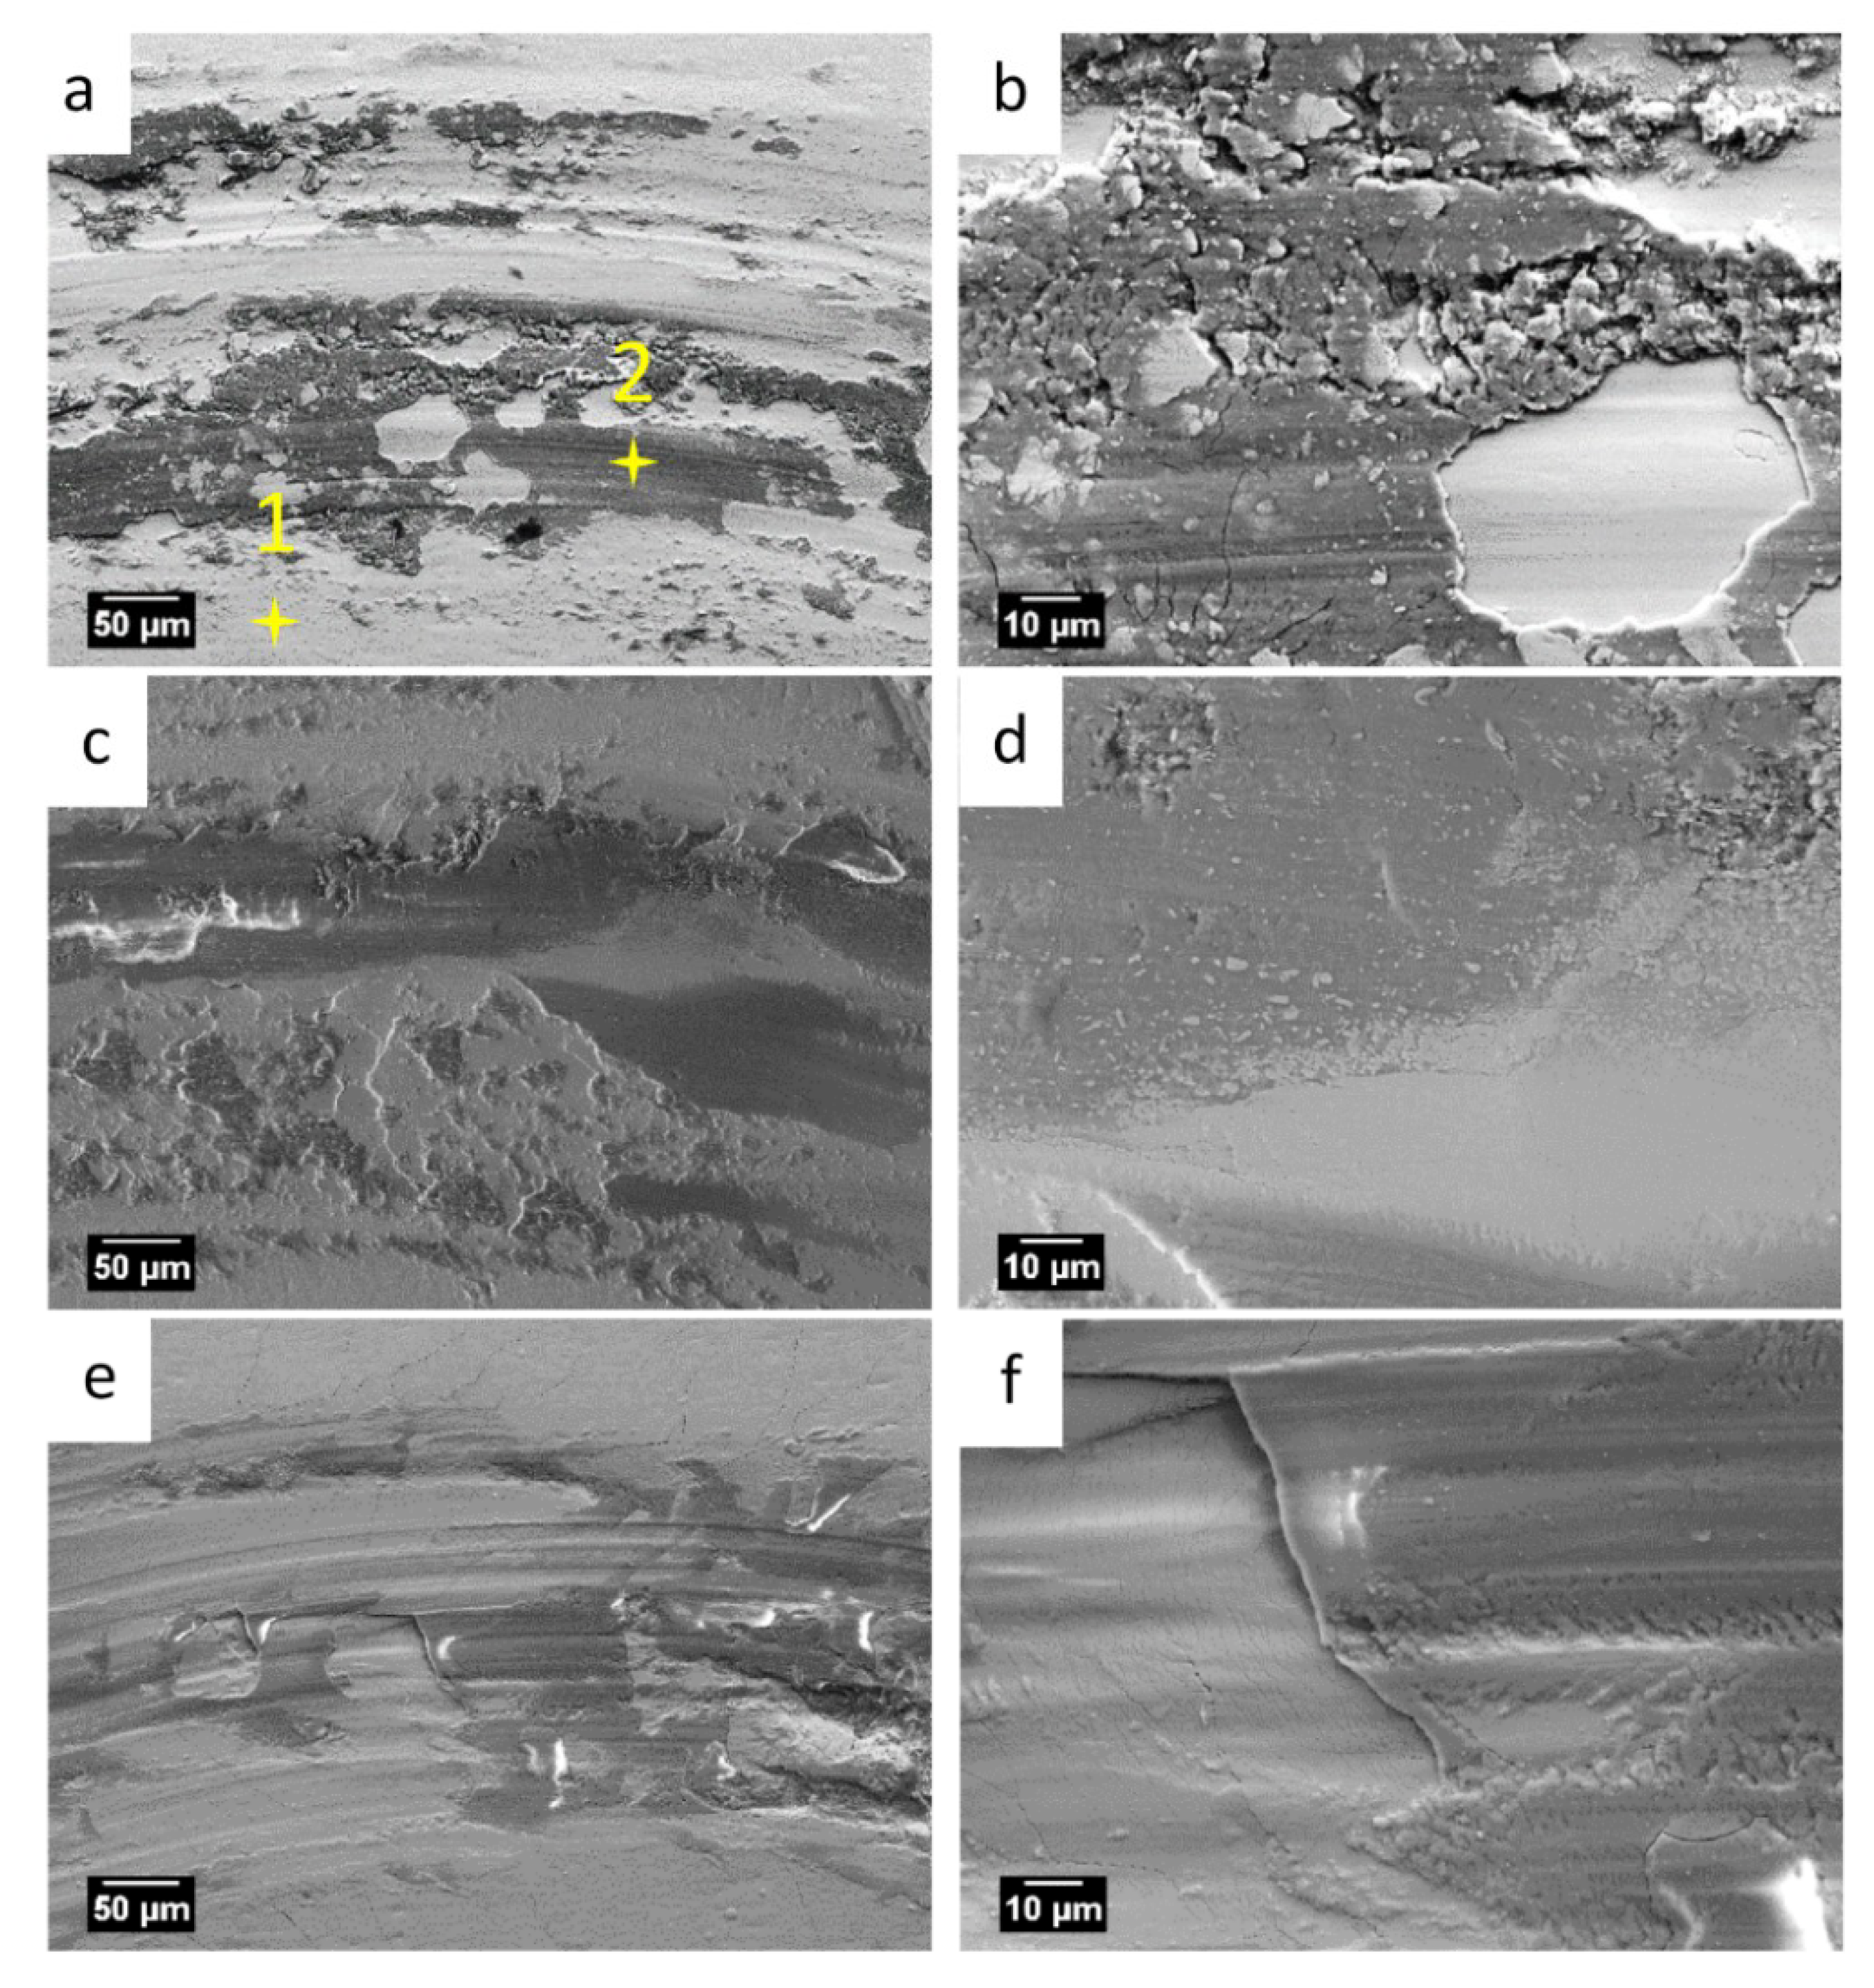
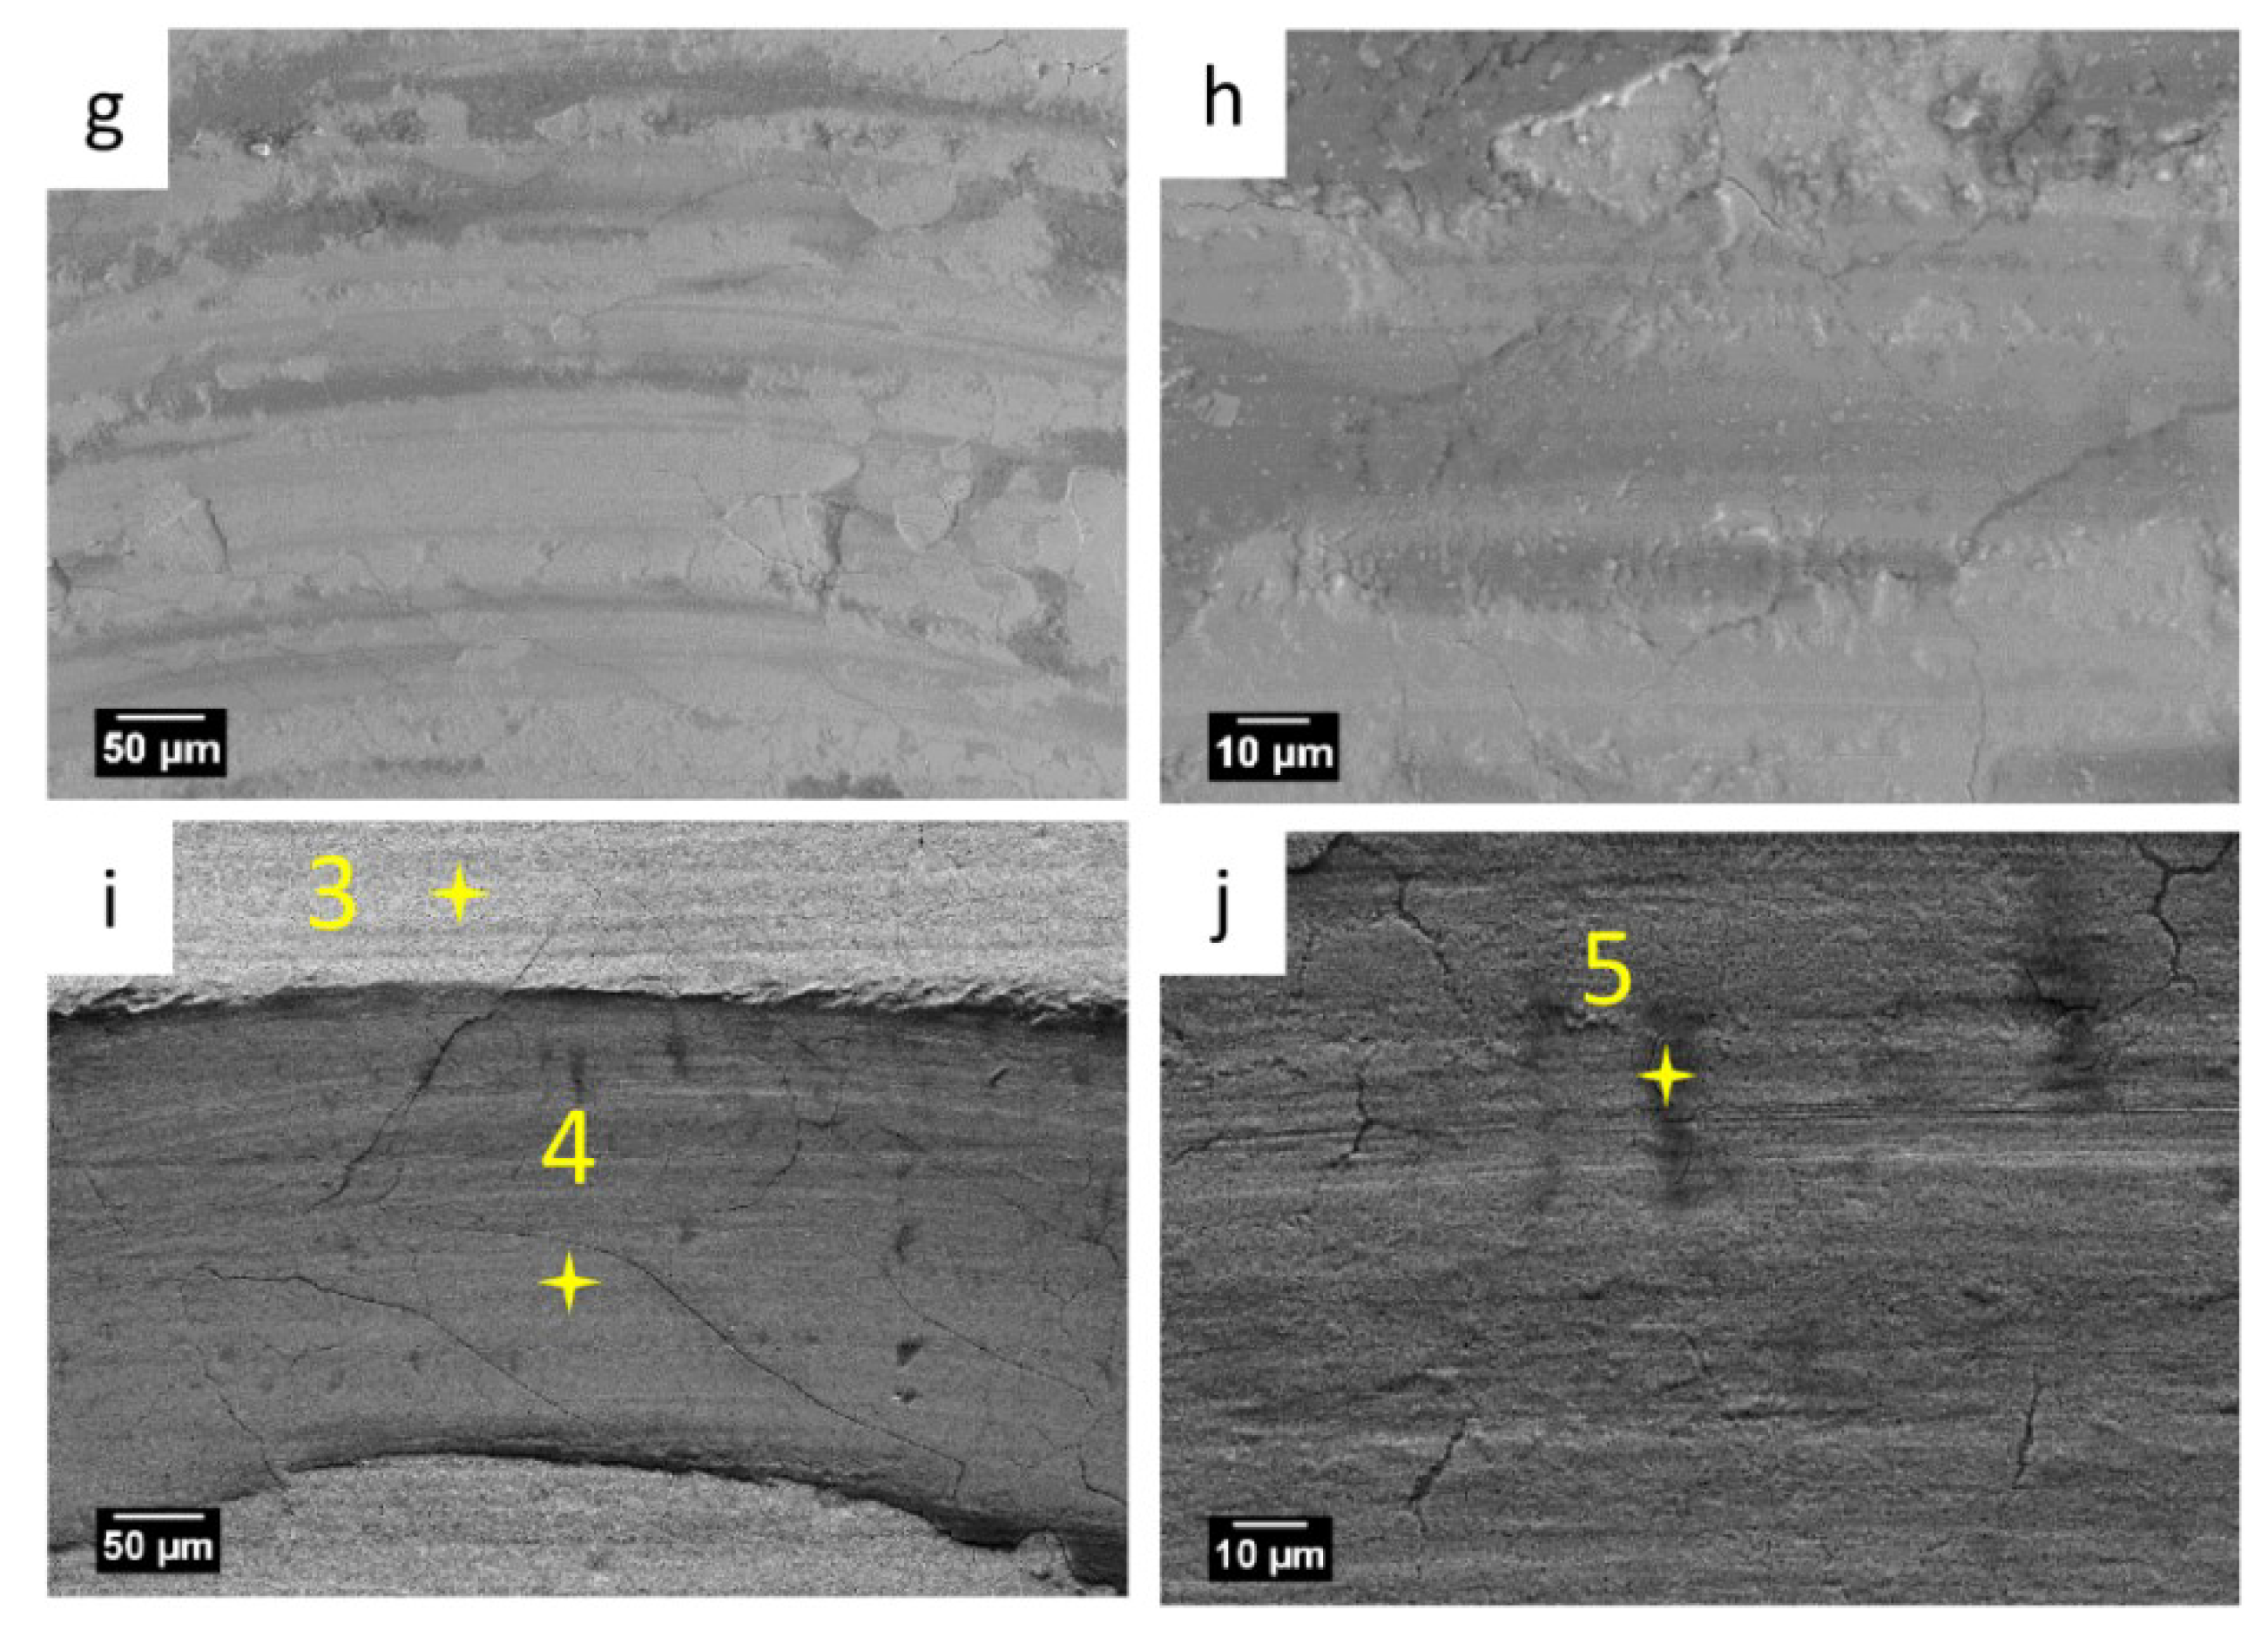
  • Tribo-oxidation was found to be the main factor influencing the wear of the studied Fe-W coatings. For all the Fe-24W coatings annealed up to 600 °C, the wear tracks showed traces of adherent oxide film and wear grooves running along the wear tracks. Hence, the abrasive iron oxide particles formed during the sliding tests reduce the wear resistance of the Fe-24W coatings, causing the formation of deep cracks (i.e., ~15 μm in depth) and thus leading to higher wear rates and to an instability of the measured COF.
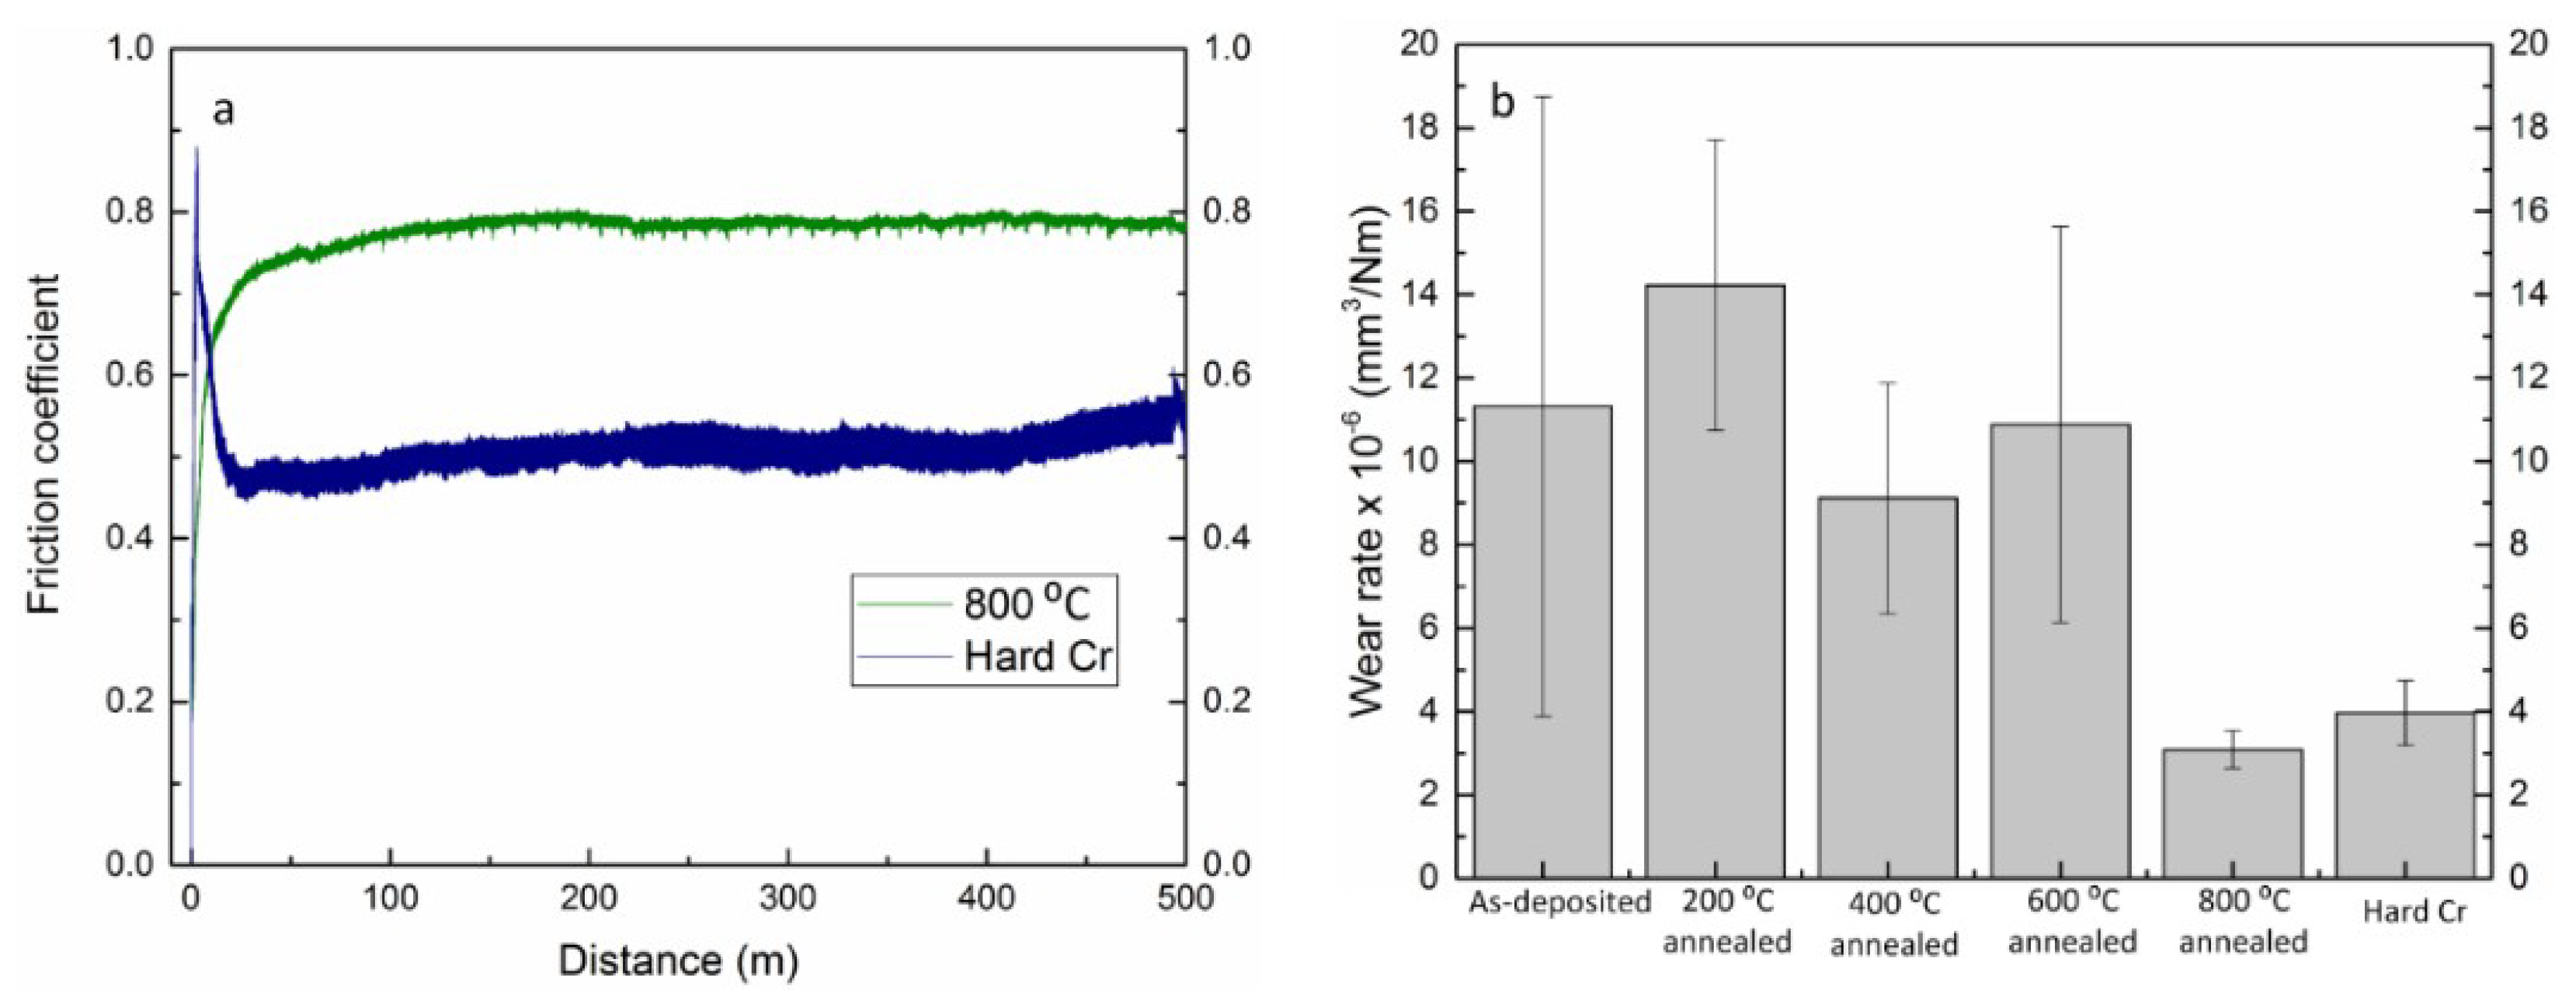
  • The Fe-24W coating annealed at 800 °C was characterized by a higher resistance to tribo-oxidation which led to a considerable improvement in the wear resistance of the coating: A constant COF throughout the whole test, i.e., ~0.8, and the lowest wear rate, i.e., 3 × 10⁻⁶ mm3/N m. The resistance to tribo-oxidation was related to the presence of Fe2W and FeWO4 hard phases which are not prone to oxidation.
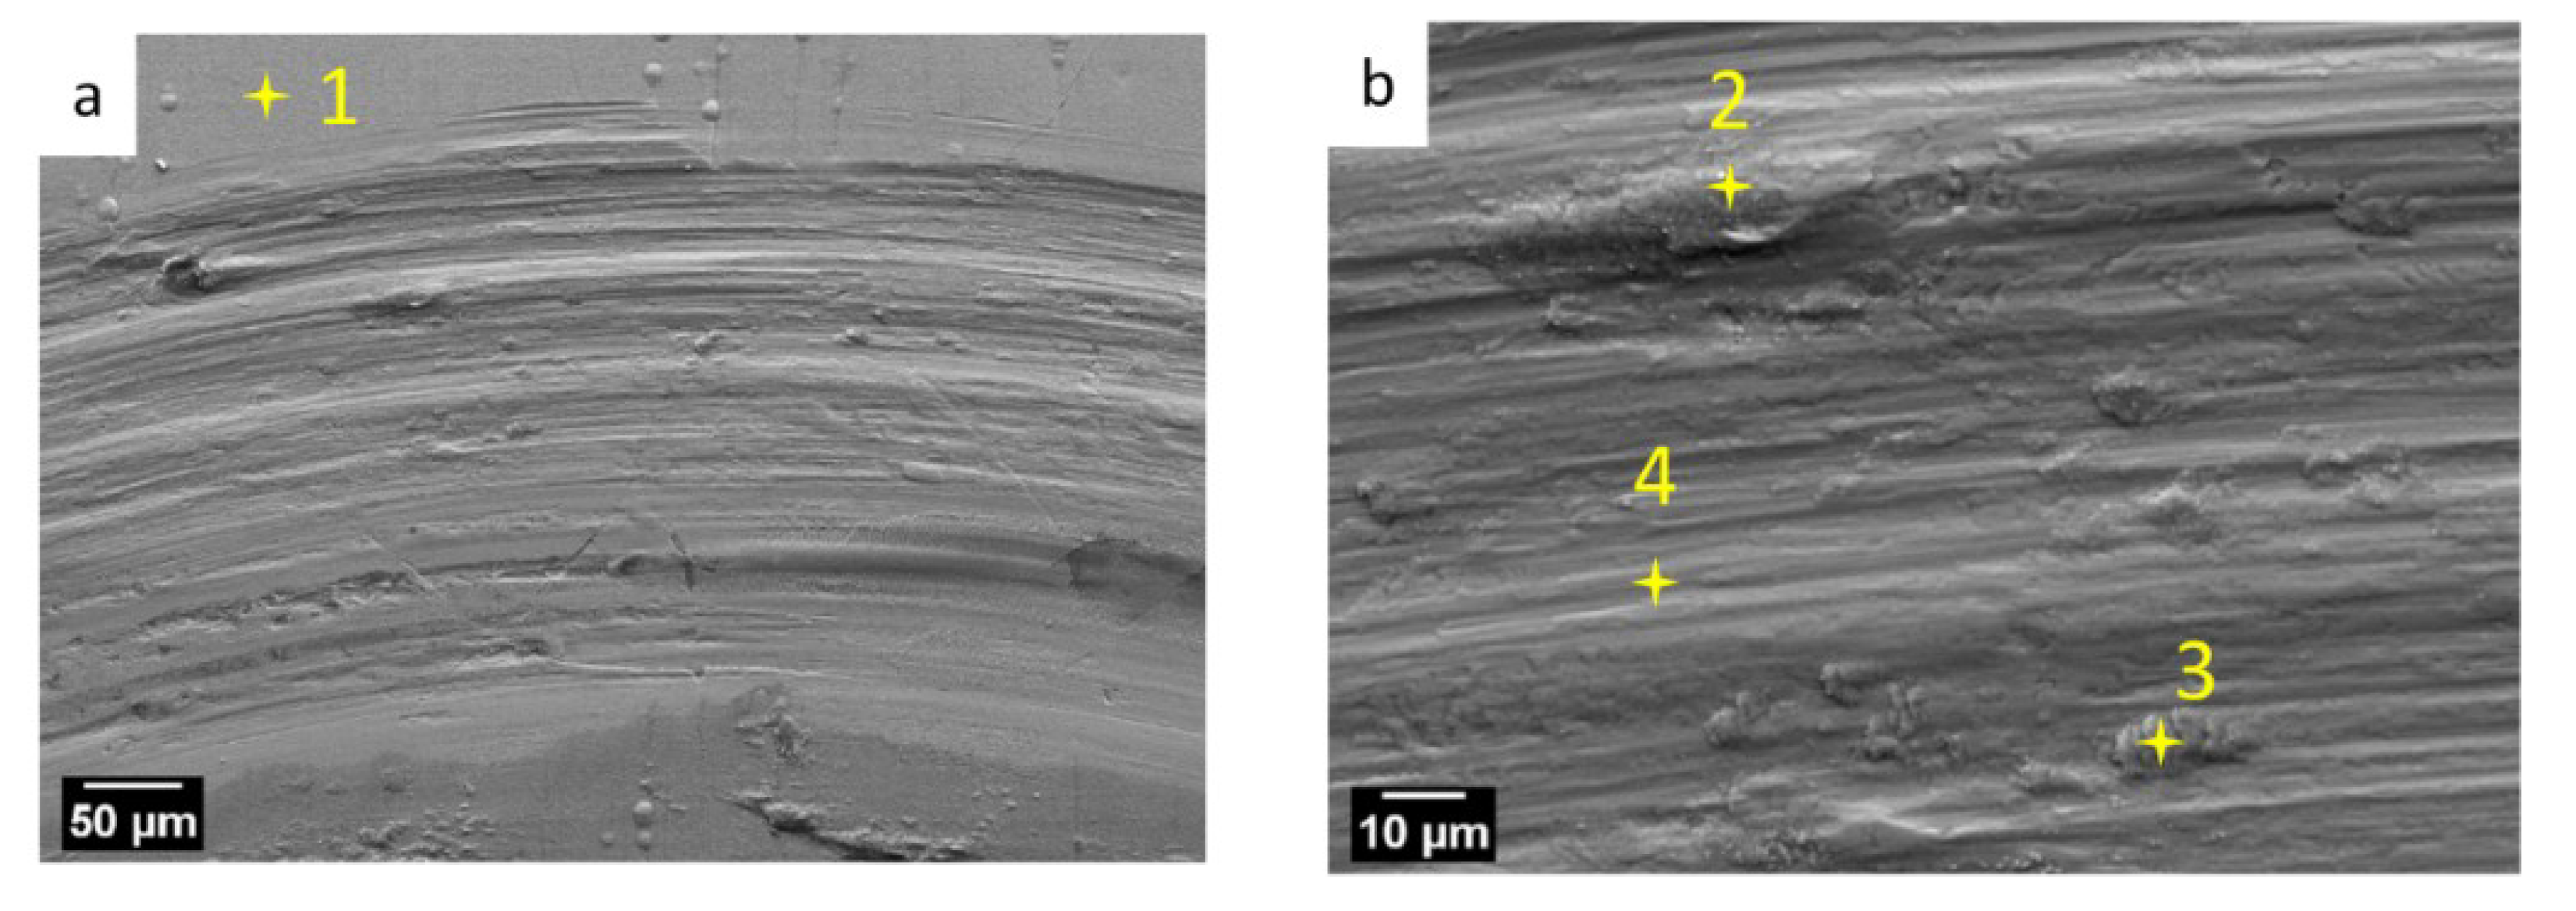
  • Wear tests performed on electrodeposited hard chromium showed a lower value for the COF, i.e., ~0.5, as compared to electrodeposited Fe-24W. However, the wear rate of the Fe-24W coating annealed at 800 °C and hard chromium are comparable. Hence, Fe-24W coatings annealed at 800 °C could be considered as a potential sustainable alternative to hard chromium coatings.

Author Contributions

The electrodeposition of the coatings was performed by A.N., under the supervision of N.T. and H.C., and N.I.; the structural characterization and the wear tests were performed by A.M. under the supervision of U.K., N.I. and V.M.-N.; Writing—Original Draft Preparation by A.M.; Writing—Review and Editing by all authors.

Funding

This research was funded by the European Union’s Horizon 2020 research and innovation programme under the Marie Skłodowska-Curie grant agreement (No. 642642) (SELECTA), by the Departamento de Desarrollo Económico y Competitividad of the Basque government (ELKARTEK, No. KK-2017/00096, KK-2018/00108) and the Research Council of Lithuania (No. 09.3.3-LMT-K-712-08-0003).

Conflicts of Interest

The authors declare no conflict of interest. The funding sponsors had no role in the design of the study; in the collection, analyses, or interpretation of data; in the writing of the manuscript, or in the decision to publish the results.

References

  1. Donten, M.; Cesiulis, H.; Stojek, Z. Electrodeposition of amorphous/nanocrystalline and polycrystalline Ni–Mo alloys from pyrophosphate baths. Electrochim. Acta 2005, 50, 1405–1412. [Google Scholar] [CrossRef]
  2. Chianpairot, A.; Lothongkum, G.; Schuh, C.A.; Boonyongmaneerat, Y. Corrosion of nanocrystalline Ni-W alloys in alkaline and acidic 3.5wt.% NaCl solutions. Corros. Sci. 2011, 53, 1066–1071. [Google Scholar] [CrossRef]
  3. Tsyntsaru, N.; Bobanova, J.; Ye, X.; Cesiulis, H.; Dikusar, A.; Prosycevas, I.; Celis, J.P. Iron-tungsten alloys electrodeposited under direct current from citrate-ammonia plating baths. Surf. Coat. Technol. 2009, 203, 3136–3141. [Google Scholar] [CrossRef]
  4. Druga, J.; Kašiarová, M.; Dobročka, E.; Zemanová, M.; Druga, J.; Ka, M.; Dobroc, E.; Zemanová, M. Corrosion and tribological properties of nanocrystalline pulse electrodeposited Ni–W alloy coatings Corrosion and tribological properties of nanocrystalline pulse electrodeposited Ni–W alloy coatings. Int. J. Surf. Eng. Coat. 2017, 95, 39–45. [Google Scholar] [CrossRef]
  5. Klement, U.; Pellicer, E.; Sort, J. Mid-term meeting of SELECTA: A European Training Network on smart electrodeposited alloys for environmentally sustainable applications. Trans. IMF 2017, 95, 124–125. [Google Scholar] [CrossRef]
  6. Nicolenco, A.; Tsyntsaru, N.; Cesiulis, H. Fe (III)-Based Ammonia-Free Bath for Electrodeposition of Fe-W Alloys. J. Electrochem. Soc. 2017, 164, D590–D596. [Google Scholar] [CrossRef] [Green Version]
  7. Nicolenco, A.; Tsyntsaru, N.; Fornell, J.; Pellicer, E.; Reklaitis, J.; Baltrunas, D.; Cesiulis, H.; Sort, J. Mapping of magnetic and mechanical properties of Fe-W alloys electrodeposited from Fe(III)-based glycolate-citrate bath. Mater. Des. 2018, 139, 429–438. [Google Scholar] [CrossRef]
  8. Mulone, A.; Nicolenco, A.; Hoffmann, V.; Klement, U.; Tsyntsaru, N.; Cesiulis, H. In-depth characterization of as-deposited and annealed Fe-W coatings electrodeposited from glycolate-citrate plating bath. Electrochim. Acta 2018, 261, 167–177. [Google Scholar] [CrossRef]
  9. Mulone, A.; Nicolenco, A.; Fornell, J.; Pellicer, E.; Tsyntsaru, N.; Cesiulis, H.; Sort, J.; Klement, U. Enhanced mechanical properties and microstructural modifications in electrodeposited Fe-W alloys through controlled heat treatments. Surf. Coat. Technol. 2018, 350, 20–30. [Google Scholar] [CrossRef]
  10. Sriraman, K.R.; Sundara Raman, S.G.; Seshadri, S.K. Synthesis and evaluation of hardness and sliding wear resistance of electrodeposited nanocrystalline Ni–Fe–W alloys. Mater. Sci. Technol. 2006, 22, 14–20. [Google Scholar] [CrossRef]
  11. Jeong, D.H.; Erb, U.; Aust, K.T.; Palumbo, G. The relationship between hardness and abrasive wear resistance of electrodeposited nanocrystalline Ni-P coatings. Scr. Mater. 2003, 48, 1067–1072. [Google Scholar] [CrossRef]
  12. He, F.; Yang, J.; Lei, T.; Gu, C. Structure and properties of electrodeposited Fe-Ni-W alloys with different levels of tungsten content: A comparative study. Appl. Surf. Sci. 2007, 253, 7591–7598. [Google Scholar] [CrossRef]
  13. Wasekar, N.P.; Sundararajan, G. Sliding wear behavior of electrodeposited Ni–W alloy and hard chrome coatings. Wear 2015, 342–343, 340–348. [Google Scholar] [CrossRef]
  14. Bobanova, Z.I.; Dikusar, A.I.; Cesiulis, H.; Celis, J.-P.; Tsyntsaru, N.I.; Prosycevas, I. Micromechanical and Tribological Properties of Nanocrystalline Coatings of Iron-Tungsten Alloys Electrodeposited from Citrate-Ammonia Solutions. Russ. J. Electrochem. 2009, 45, 895–901. [Google Scholar] [CrossRef]
  15. Nicolenco, A.; Tsyntsaru, N.; Matijošius, T.; Asadauskas, S.; Cesiulis, H. Wear resistance of electrodeposited Fe-W alloy coatings under dry conditions and in the presence of rapeseed oil. Green Tribol. 2018, 5228. [Google Scholar] [CrossRef]
  16. Ma, C.; Wang, S.C.; Wang, L.P.; Walsh, F.C.; Wood, R.J.K. The role of a tribofilm and wear debris in the tribological behaviour of nanocrystalline Ni–Co electrodeposits. Wear 2013, 306, 296–303. [Google Scholar] [CrossRef]
  17. Zouch, F.; Antar, Z.; Bahri, A.; Elleuch, K.; Urgen, M. Tribological Study of Fe–W–P Electrodeposited Coating on 316 L Stainless Steel. J. Tribol. 2018, 140, 1–9. [Google Scholar] [CrossRef]
  18. Vernickaite, E.; Antar, Z.Z.; Nicolenco, A.; Kreivaitis, R.; Tsyntsaru, N.; Cesiulis, H. Tribological and Corrosion Properties of Iron-Based Alloys. In Proceedings of the 8th International Scientific Conference “BALTTRIB 2015”, Kaunas, Lithuania, 26–27 November 2015. [Google Scholar] [CrossRef]
  19. Wang, H.; Sheu, H.; Ger, M.; Hou, K. The effect of heat treatment on the microstructure and mechanical properties of electrodeposited nanocrystalline Ni–W/diamond composite coatings. Surf. Coat. Technol. 2014, 259, 268–273. [Google Scholar] [CrossRef]
  20. Matik, U. Structural and wear properties of heat-treated electroless Ni-P alloy and Ni-P-Si 3 N 4 composite coatings on iron based PM compacts. Surf. Coat. Technol. 2016, 302, 528–534. [Google Scholar] [CrossRef]
  21. Biswas, A.; Das, S.K.; Sahoo, P. Correlating tribological performance with phase transformation behavior for electroless Ni-(high) P coating. Surf. Coat. Technol. 2017, 328, 102–114. [Google Scholar] [CrossRef]
  22. Hou, K.; Chang, Y.; Chang, S.; Chang, C. The heat treatment effect on the structure and mechanical properties of electrodeposited nano grain size Ni–W alloy coatings. Thin Solid Films 2010, 518, 7535–7540. [Google Scholar] [CrossRef]
  23. Abazari, S.; Rastegari, S.; Kheirandish, S. Influence of Pulse Electrodeposition and Heat Treatment on Microstructure, Tribological, and Corrosion Behavior of Nano-Grain Size Co-W Coatings. J. Mater. Eng. Perform. 2017. [Google Scholar] [CrossRef]
  24. Vamsi, M.V.N.; Wasekar, N.P.; Sundararajan, G. Influence of heat treatment on microstructure and mechanical properties of pulse electrodeposited Ni-W alloy coatings. Surf. Coat. Technol. 2017, 319, 403–414. [Google Scholar] [CrossRef]
  25. Bajwa, R.S.; Khan, Z.; Bakolas, V.; Braun, W. Water-lubricated Ni-based composite (Ni-Al2O3, Ni-SiC and Ni-ZrO2) thin film coatings for industrial applications. Acta Metall. Sin. 2016, 29, 8–16. [Google Scholar] [CrossRef]
  26. Mun, S.-J.; Kim, M.; Yim, T.-H.; Lee, J.-H.; Kang, T. Mechanical and Structural Characteristics of Electrodeposited Ni–Fe–W Alloy after Heat-Treatment. J. Electrochem. Soc. 2010, 157, D177–D180. [Google Scholar] [CrossRef]
  27. Antoni-Zdziobek, A.; Commeau, T.; Joubert, J.M. Partial redetermination of the Fe-W phase diagram. Metall. Mater. Trans. A Phys. Metall. Mater. Sci. 2013, 44, 2996–3003. [Google Scholar] [CrossRef]
  28. Jacob, A.; Schmetterer, C.; Singheiser, L.; Gray-Weale, A.; Hallstedt, B.; Watson, A. Modeling of Fe-W phase diagram using first principles and phonons calculations. Calphad Comput. Coupling Phase Diagr. Thermochem. 2015, 50, 92–104. [Google Scholar] [CrossRef]
  29. Gassner, G.; Mayrhofer, P.H.; Kutschej, K.; Mitterer, C.; Kathrein, M. Magnéli phase formation of PVD Mo–N and W–N coatings. Surf. Coat. Technol. 2006, 201, 3335–3341. [Google Scholar] [CrossRef]
  30. Maitland, T.; Sitzman, S. Electron backscatterd diffraction (EBSD) technique and materials characterization examples. In Scanning Microscopy for Nanotechnology: Techniques and Applications; Zhou, W., Wang, Z., Eds.; Springer: Berlin, Germany, 2007; pp. 41–76. [Google Scholar]
  31. Abdel-Aal, H.A. On the interdependence between kinetics of friction-released thermal energy and the transition in wear mechanisms during sliding of metallic pairs. Wear 2003, 254, 884–900. [Google Scholar] [CrossRef]
Figure 1. Secondary electron images of the as-deposited Fe-24W samples: (a) Surface morphology including an insert of the surface acquired at higher magnification; and (b) cross-section.
Coatings 09 00066 g001
Figure 2. X-ray diffraction patterns of Fe-24W alloys annealed at different temperatures (a), and X-ray diffraction patterns of Fe-24W sample annealed at 800 °C acquired with Bragg–Brentano and grazing incidence geometry (b).
Coatings 09 00066 g002
Figure 3. Back scattered electron image of the surface morphology (top view) (a), and of the cross-section (b) of the Fe-24W sample after one hour of annealing at 800 °C. In (b) different areas along the cross-section are highlighted with the numbering 1, 2 and 3.
Coatings 09 00066 g003
Figure 4. Back scattered electron image (a) and Electron Backscatter Diffraction (EBSD) phase map (b) of the cross-section of the Fe-24W sample annealed at 800 °C for 1 h. The EBSD phase map is acquired from the red dashed box highlighted in (a). The blue grains belong to α-Fe phase, the red grains to the FeWO4 phase, and the violet grains are identified as Fe2W phase.
Coatings 09 00066 g004
Figure 5. Coefficient of friction (COF) evolution for the as-deposited and annealed Fe-24W coatings.
Coatings 09 00066 g005
Figure 6. Optical micrographs of the wear track of the as-deposited Fe-24W samples (a), and of the wear tracks of samples annealed at 200 °C (b), 400 °C (c), 600 °C (d) and 800 °C (e). In the images the presence of deep cracks (i.e., ~15 μm) is highlighted with an arrow.
Coatings 09 00066 g006
Figure 7. Optical micrographs of (a) a cracked area in the wear track of the as-deposited Fe-24W sample, and (b) surface profile acquired at the location of the dashed line in (a). Optical micrographs of (c) a crack-free area in the wear track of the as-deposited Fe-24W sample, and (d) surface profile acquired at the location of the dashed line in (c). Optical micrographs of (e) the wear track of the Fe-24W sample annealed at 800 °C, and (f) surface profile acquired at the location of the dashed line in (e).
Coatings 09 00066 g007aCoatings 09 00066 g007b
Figure 8. Coefficient of friction evolution for the Fe-24W coating annealed at 800 °C and hard chromium coatings (a), and wear rate of the Fe-24W and hard chromium coatings (b).
Coatings 09 00066 g008
Figure 9. Scanning electron microscope micrographs of the wear track of the Fe-24W coatings in the as-deposited state (a,b) and after annealing at 200 °C (c,d), 400 °C (e,f), 600 °C (g,h) and 800 °C (i,j). The different representative areas where the EDS point analyses were performed are highlighted with the numbering 1 to 5, and the results are collected in Table 1.
Coatings 09 00066 g009aCoatings 09 00066 g009b
Figure 10. Scanning Electron Microscope micrographs of the wear track of the hard Cr coatings (a). The micrograph in (b) is acquired at higher magnification. The different representative areas where the EDS point analyses were performed are highlighted with the numbering 1 to 4, and the results are collected in Table 2.
Coatings 09 00066 g010
Table 1. Chemical composition as obtained by Energy Dispersive X-ray Spectroscopy (EDS) point analysis at locations shown in Figure 9.
SpectrumFe (at.%)W (at.%)O (at.%)
17624/
229863
3~60~20~20
4~50~15~35
528864
Table 2. Chemical composition as obtained by EDS point analysis at locations shown in Figure 10.
SpectrumCr (at.%)O (at.%)Al (at.%)
1100
267.8320.2
346.5530.5
4100

