1. Introduction
The research on insulator contamination characteristics is the fundamental research of external insulation in power systems, and it is of great significance to master the contamination characteristics of the insulator for the design, operation, and maintenance of external insulation [
1,
2,
3,
4,
5,
6]. Given the existence of the contamination, the insulation performance of insulators has changed greatly [
7,
8,
9]. Contamination degree, leakage current, and pollution flashover voltage are important parameters for evaluating insulation performance of the insulator, and researchers have carried out a lot of research on them [
10,
11,
12,
13,
14]. However, these researches were based on the surface that has been adhered to the contamination. The contribution on reduction of contamination accumulation and the physical properties of contamination is limited. Therefore, it is necessary to carry out research on related characteristics regarding accumulating contamination particles.
In recent years, researchers have carried out a lot of research on contamination accumulation characteristics through a variety of ways, including theoretical research, natural contamination accumulation experiments, artificial simulation experiments, and simulation analysis; especially in the research of the movement characteristics and deposition characteristics of contaminated particles from the microscopic point of view [
15,
16,
17,
18,
19,
20,
21,
22,
23,
24,
25,
26,
27]. In theoretical research, Wang et al. [
15] have analyzed the forces of particles moving around the insulator in detail, where they found that polarization force has little effect on the movement of particles, and fluid drag force plays an important role under high wind speed. Horenstein et al. [
16] considered that the electric field force has a great influence on the movement of particles, especially for particles with a size less than 10 μm, after a wind tunnel simulation experiment and theoretical deduction. However, when the particle size is greater than 10 μm, the effect of fluid drag force on the particle trajectory will gradually increase. At low wind speed, Li et al. [
17] thought that the energy loss was mainly caused by the inelastic collision of particles, and the friction loss caused by the relative motion of particles and surface during the collision. However, at high wind speed, the particles will experience elastic-plastic deformation, and thus generate energy loss [
18].
Furthermore, researchers have also used fluid dynamics simulation software to study contamination accumulation characteristics. Jiang et al. [
19] found that under the condition of horizontal wind, the collision coefficient of the contaminated particles on the upper surface of the insulator increases with the increase of particle size and wind speed, but the collision coefficient of the bottom surface is always at a low level. Nan et al. [
20] also obtained the same conclusion through an artificial simulation experiment and simulation analysis. In addition, they found that the change of wind direction had obvious influence on the contamination distribution of double umbrella insulators. Wang et al. [
21] suggested that the collision mass of particles increases rapidly with the increase of wind speed, and the shape of the umbrella skirt at the bottom surface has an important influence on the collision characteristics. Zhang et al. considered that the contamination degree of windward and leeward of the insulator increased with the increase of wind speed, whilst the contamination degree of crosswind side showed a decreasing trend. As a result, a great deal of contamination accumulates on the windward and leeward, but the crosswind surfaces are relatively clean [
22]. Lv et al. [
23,
24,
25] thought that under the same wind speed, the contamination degree in the DC (direct current) electrical field is much more than that in the AC (alternating current) and no electrical field. Furthermore, under the conditions of AC and no electrical field, the deposition amount of contamination at low wind speed was relatively low. Even under the condition of high wind speed, the increase amount of contamination was very limited.
In general, the current literature shows that researchers paid more attention to the amount of contamination accumulated from contaminated particles. However, researchers seldom studied and analyzed the size distribution characteristics of adhered particles. With the increase of the frequency of haze and other microclimate phenomena in recent years, the difference of adhered particle size distribution on the insulator surface will have some influence on the contamination characteristics, pollution flashover characteristics, etc. [
26]. Therefore, it is necessary to study size distribution characteristics of contaminated particles on the insulator surface.
After measuring many contamination samples, it was found that the size distribution of contaminated particles had some significant statistical characteristics. To explore the reasons of these distribution characteristics, a physical model of collision and adhesion between particles and surface was established. In addition, the influences of different factors on the adhesion were studied respectively. The research of this paper can effectively explain that the size distribution characteristics of adhered particle are easy to focus on a specific range. Furthermore, the work of this paper can provide theoretical support for more accurate external insulation researches in the future, such as artificial contamination simulation experiments and the influence of particle size distribution on pollution flashover.
3. Motion Characteristics of Particle
There are two processes in which particles move from the air to the insulator surface. The first one is that the particles move toward the surface with the effect of fluid drag force, electric force, gravity, and other forces. The second one is that particles with a certain initial velocity, collide with the surface and adhere to the surface. To research the motion characteristics of particles more clearly, it is necessary to carry out detailed research on these two physical processes [
31].
3.1. Aerodynamic Characteristics of Particle
In this paper, the Euler method was used to analyze the motion of airflow. However, for the particles, its concentration is relatively sparse, and its molecular weight is much greater than that of gas molecules. Thus, the Lagrange method was used to calculate the motion trajectory of the particles. In addition, the effect of the airflow phase on the particle phase was considered, but the effect of the particle phase on the airflow phase was neglected.
3.1.1. Mathematical Model of Airflow Phase
Given the complex structure of the suspension insulator, the airflow around the insulator will experience severe bending. If the standard
k–ε model was used to calculate, it would produce some errors. However, the RNG (Renormalization-group)
k–ε model has an advantage in dealing with airflow with low Reynolds number and serious streamline bending. Thus, the RNG
k–ε model was used [
19].
The N–S equation and the continuous equation are
where,
U is the average wind speed, m/s; ρ is the air density, kg/m
3;
p is the average pressure, Pa; μ is dynamic viscosity coefficient of air.
The turbulent kinetic
k equation and the dissipation rate ε equation of the RNG
k–ε model are
where, σ
k and σ
ε are Prandtl numbers corresponding to turbulent kinetic energy
k and dissipation rate ε, respectively, σ
k = σε = 1.393; μ
eff is effective dynamic viscosity coefficient of air, μ
eff = μ + μ
t; μ
t is turbulent viscosity coefficient of air, μ
t = ρ
Cμk2/ε;
Cμ = 0.0845;
S is the modulus of the mean rate of strain tensor;
C1ε = 1.42,
C2ε = 1.68; φ =
Sk/ε, φ
0 = 4.38, β = 0.012.
3.1.2. Mathematical Model of Particle Phase
The particles moving in the air are subjected to a variety of forces, including viscous resistance force, pressure gradient force, gravity, air buoyancy, virtual mass force, Brownian force, Basset force, Magnus lifting force, Saffman lifting force, thermophoresis forces, fluid drag force, electric field force, etc. [
15]. Among them, the effects of gravity, fluid drag force, and electric field force on the movement of particles are significant. Therefore, this paper mainly considered these three forces. The motion equations of particle in the Lagrange coordinate system can be calculated after analyzing the forces of the particle.
where,
m is particle quality, kg;
v is particle velocity, m/s;
FD is fluid drag force, N;
G is gravity, N;
Fq is electric field force, N.
Fluid drag force (
FD). In the mathematical model, the particles are assumed to be spherical, and their radius is
R. The fluid drag force is calculated using the Stokes Equation [
32].
where,
u is the wind speed, m/s; ρ
p is the density of particle, kg/m
3;
R is particle radius, m.
Electric field force (
Fq). If the charge of particles is
q, the electric field force is
where,
E is the electric field strength near the insulator, V/m;
q is the particle charge, C.
3.2. Collision Process between Particles and Surface
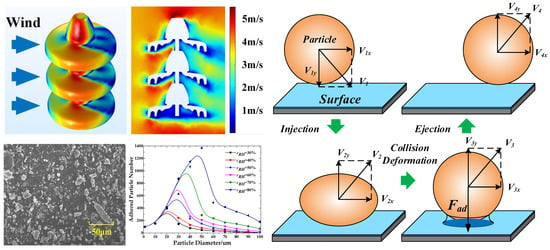
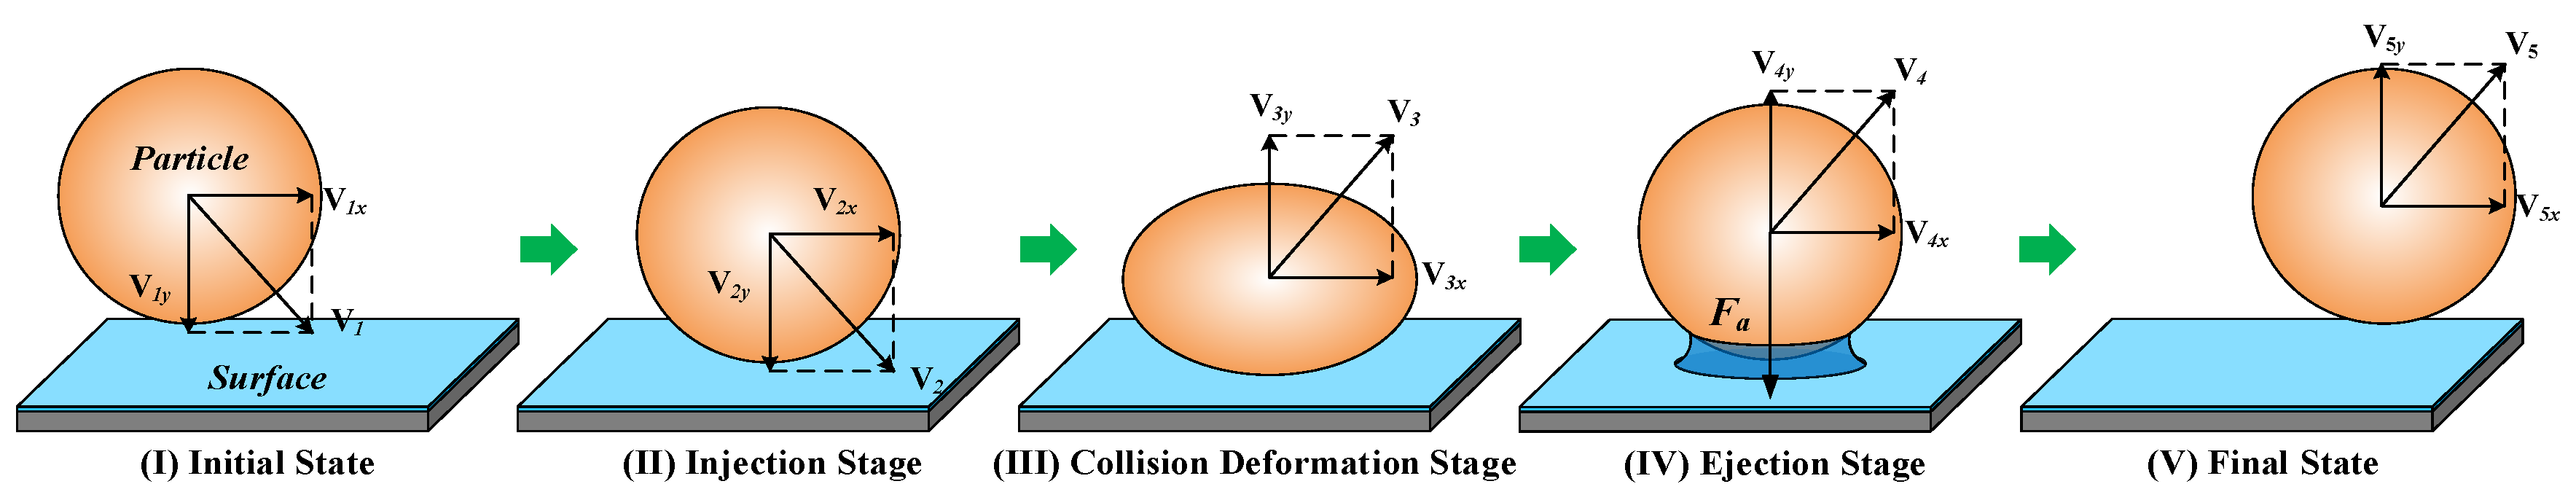
The physical process of collision between particles and the insulator surface (hereinafter referred to as the surface) can be divided into three stages, namely, injection stage, collision deformation stage, and ejection stage, as respectively shown in
Figure 3. In
Figure 3, the injection stage is I→II→III, and the collision deformation stage is II→III→IV, and the ejection stage is III→IV→V. Then these three stages are analyzed in detail.
3.2.1. Injection Stage
At this stage, the particles fly toward the surface with the initial velocity of
V1, in which
V1x is the tangential component of
V1, and
V1y is the normal component of
V1. When the particles move toward the surface, it will be affected by the water molecular layer attached to the surface [
33], and then its velocity will change to
V2. However, the measurement results by Asay et al. [
34] showed that the thickness of the water molecule layer varies only in the range of 0.5–2.5 nm, under different relative humidity. Compared with the particle size (1–100 μm), there is a great difference in magnitude. At the same time, the action distance of this process is too short, and the effect on the particles is so small that it can be neglected. Therefore, it can be considered that the particles hit the surface directly at the injection stage.
3.2.2. Collision Deformation Stage
The porcelain surface can be considered that it will not experience deformation during collision, due to its material properties. The particles will experience non-complete elastic deformation, and its velocity will change to
V3 after deformation recovery, and the direction of its velocity is outward along the surface normal. The theoretical model of Johnson collision recovery coefficient was used to analyze the velocity of particles in this paper, as outlined in [
17]. The recovery coefficient
e is:
where, σ
s is yield limit, σ
s = 200 N/mm
2;
E* is the effective elasticity modulus, GPa;
E1 is elastic modulus of particle, GPa;
E2 is the elastic modulus of surface, GPa; λ
1 and λ
2 are the Poisson’s ratios of particles and surface, respectively.
3.2.3. Ejection Stage
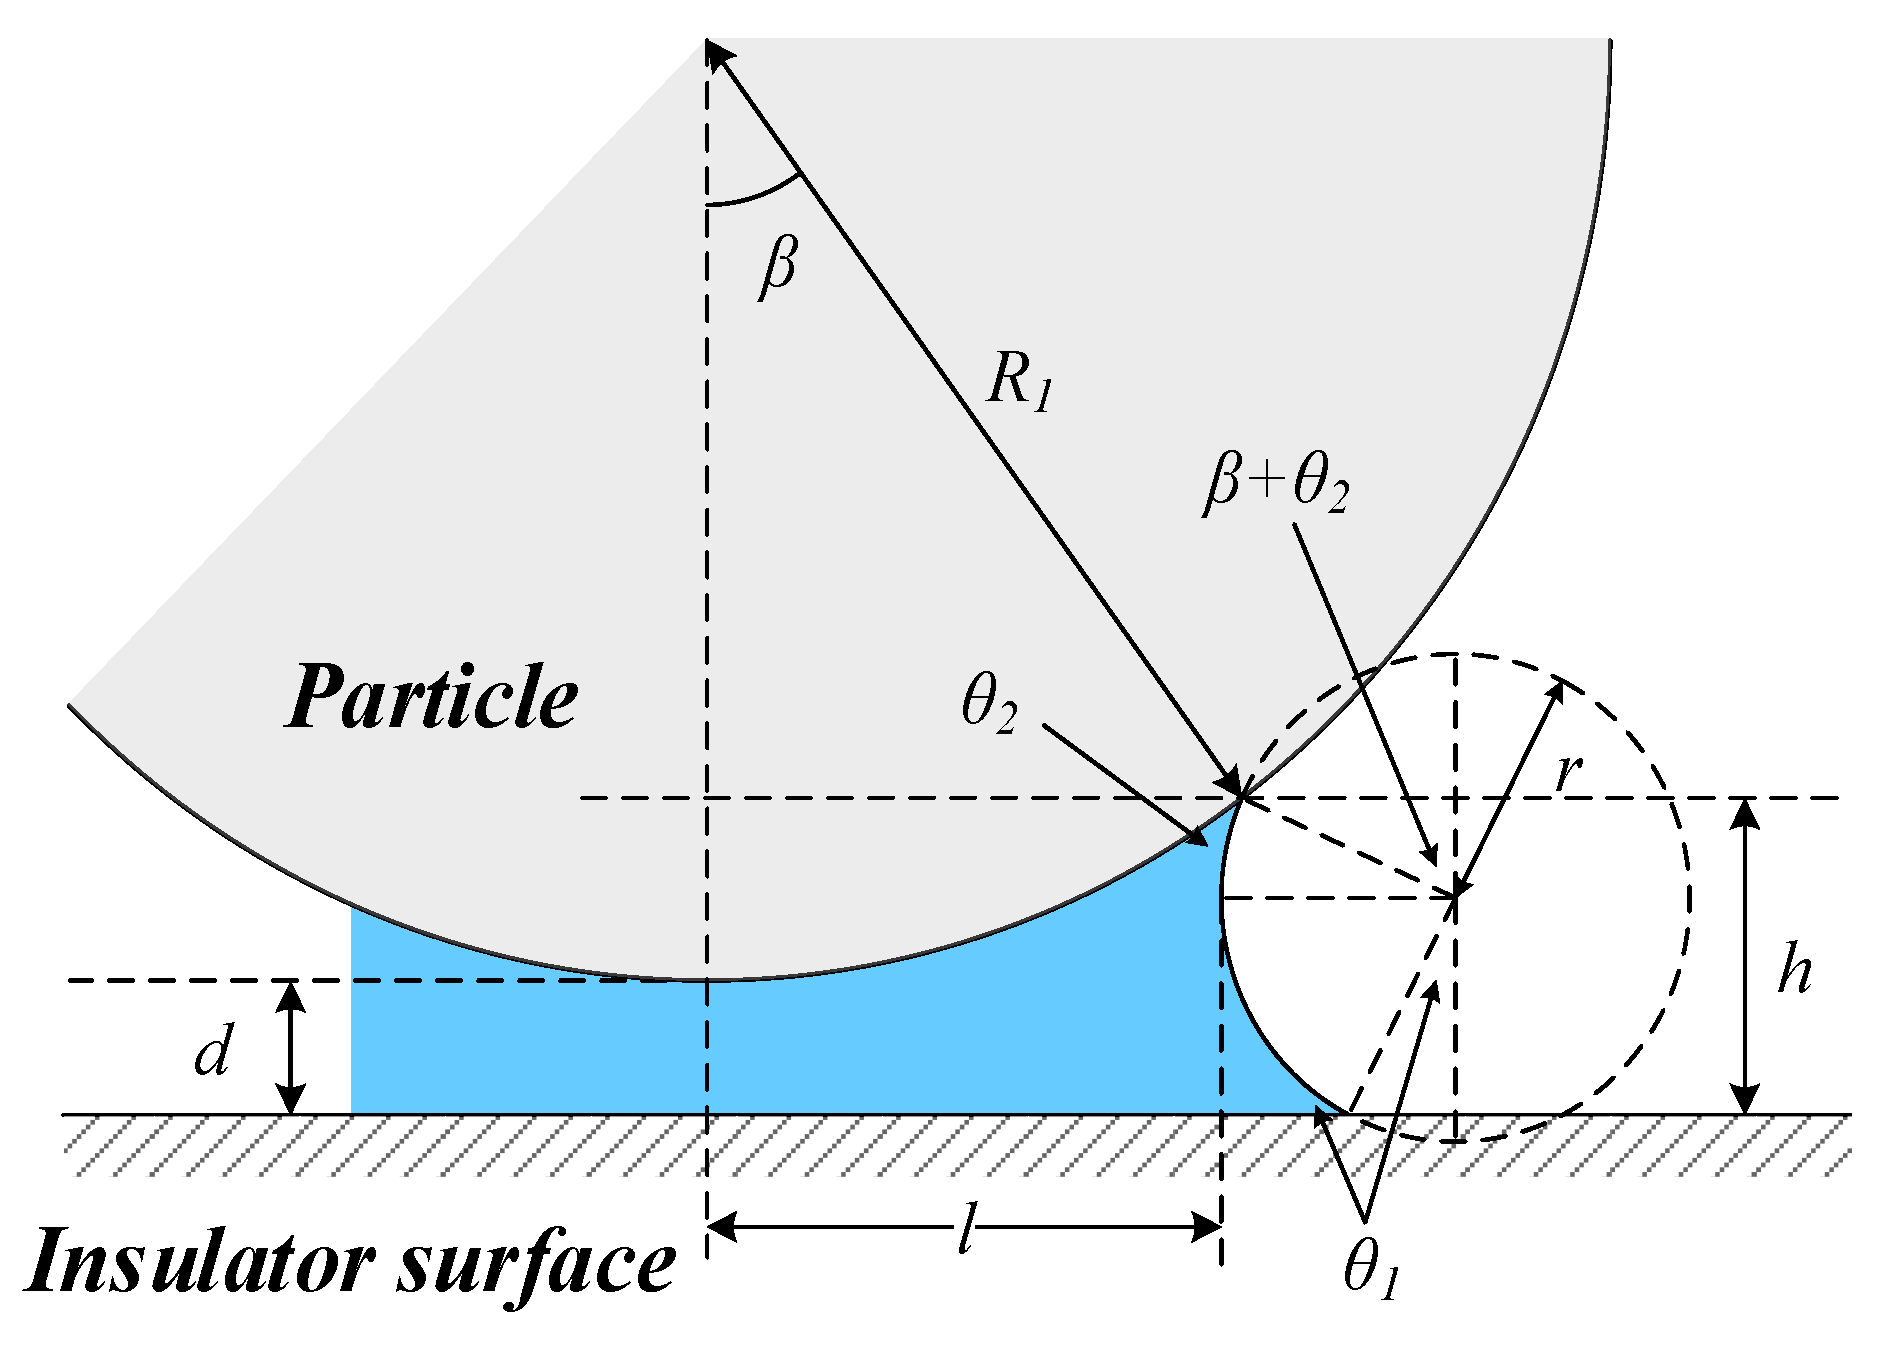
Particles at this stage are mainly affected by the adhesion force Fad produced by surface and liquid bridge, and the direction of adhesion force is downward along the surface normal. If the adhesion force is too weak, the particles cannot be adhered, and its velocity will change to V5. If the adhesion force is strong, the particles will be adhered to the surface. After this stage, the collision process between particle and surface is concluded.
The adhesion force between particle and surface includes Van der Waals force, capillary force, electrostatic force, chemical bond force, and so on [
35]. Among them, Van der Waals force (
Fvdw) and capillary force (
Fcap) play an important role in the adhesion force (
Fad). The contact model diagram between particle and surface is shown in
Figure 4. The adhesion force can be expressed as the following series of equations, as described in [
35,
36].
where,
H1 and
H2 are the Hamaker constant, and the magnitudes of these values are related to the medium: in the air medium
H1 = 10.38 × 10
−20 J, in the water medium
H2 = 1.90 × 10
−20 J [
35].
D is the distance between particle and surface, m;
h is the height of the liquid bridge, m;
rk is the Kelvin radius, m; θ
1 and θ
2 are the contact angles of the bottom liquid bridge and upper liquid bridge, respectively; β is liquid bridge angle of the particle;
c is contact angle coefficient; γ
w is the surface tension of water, γ
w = 0.073 N/m;
V0 is the molar volume of water,
V0 = 18 × 10
−6 m
3/mol;
Rg is the gas constant,
Rg = 8.31 J/(mol K);
T is the absolute temperature,
T = 290 K;
p is vapor pressure, Pa;
p0 is saturated vapor pressure, Pa;
cRH is relative humidity.
3.3. Adhesion Criterion of Particles
The energy loss of particles during collision is mainly composed of two parts: the collision energy loss caused by non-complete elastic deformation and the adhesion energy loss caused by adhesion force. The details are as follows.
When particles collide with the surface, the non-complete elastic deformation occurs, and the velocity of the particles will change to
V3.
At the ejection stages, the work done (
W1) by adhesion force is
where,
amax is the maximum effect distance of Van der Waals force,
amax = 0.4 nm;
amin is the minimum effect distance of Van der Waals force,
amin = 0.165 nm [
17].
At first, the particles fly toward the surface with the initial velocity
V1, and then through three stages of injection, collision deformation, and ejection, the final velocity
V5 becomes
In Equation (18), if (eV1)2 − 2W1/m > 0, it can be considered that the particles cannot be adhered to the surface. However, if (eV1)2 − 2W1/m < 0, it can be considered that the particles will be adhered to the surface.
4. Simulation Model
To analyze the reason why size distribution of contaminated particles on the porcelain insulator surface is concentrated in a specific range, a physical model of collision, rebound, and adhesion between particles and surface was built, and the adhesion of particles was simulated by COMSOL Multi-physics simulation software
® (5.2a). In the simulation model, four types of insulators were considered, including bell type insulator XP-160, aerodynamic type insulator XMP-160, double umbrella type insulator XWP-160, and the three-umbrella type insulator XSP-160. The structure and parameter of these four kinds of insulators are shown in
Table 2. In
Table 2,
H,
D and
L, respectively, represent height, umbrella skirt size and leakage distance.
In the simulation model, three pieces porcelain insulators were established to study the adhesion of contaminated particles. The top of the insulator string was set as the grounding terminal, and its potential was 0 kV; the bottom of the insulator string was set as the high voltage terminal, and its potential was 30 kV. The material of the umbrella skirt was set to porcelain and its relative dielectric constant was set to 6. The material of the fittings was set to steel and its relative dielectric constant was set to 10
12. In each simulation test, 9000 particles were released from the left side of the insulator. Among them, 3000 particles carried positive charges, its charge-mass ratio was 1.58 × 10
−4 C/kg; 3000 particles carried negative charges, and its charge-mass ratio was −3.04 × 10
−4 C/kg [
37]; 3000 particles had no charge. Previous studies have shown that CaSO
4 is the major component of contamination [
38], so the particle density was set to 2960 kg/m
3.
5. Influence of Different Factors on Particle Adhesion
The adhesion process of particles is affected by a variety of complex factors, including relative humidity, wind speed, precipitation, particle properties, electric field type, electric field strength, aerodynamic shape, material, and so on. The existing literature shows that the influences of relative humidity, wind speed, electric field type, electric field strength, and aerodynamic shape on the adhesion are obvious [
15,
17,
19,
21]. Therefore, this paper carried out a series of studies on the influences of these five factors. To highlight the influences of relative humidity, wind speed, electric field type, and electric field strength, the paper took the XP-160 insulator as the research object. In addition, four kinds of insulators were used to study the influence of aerodynamic shape.
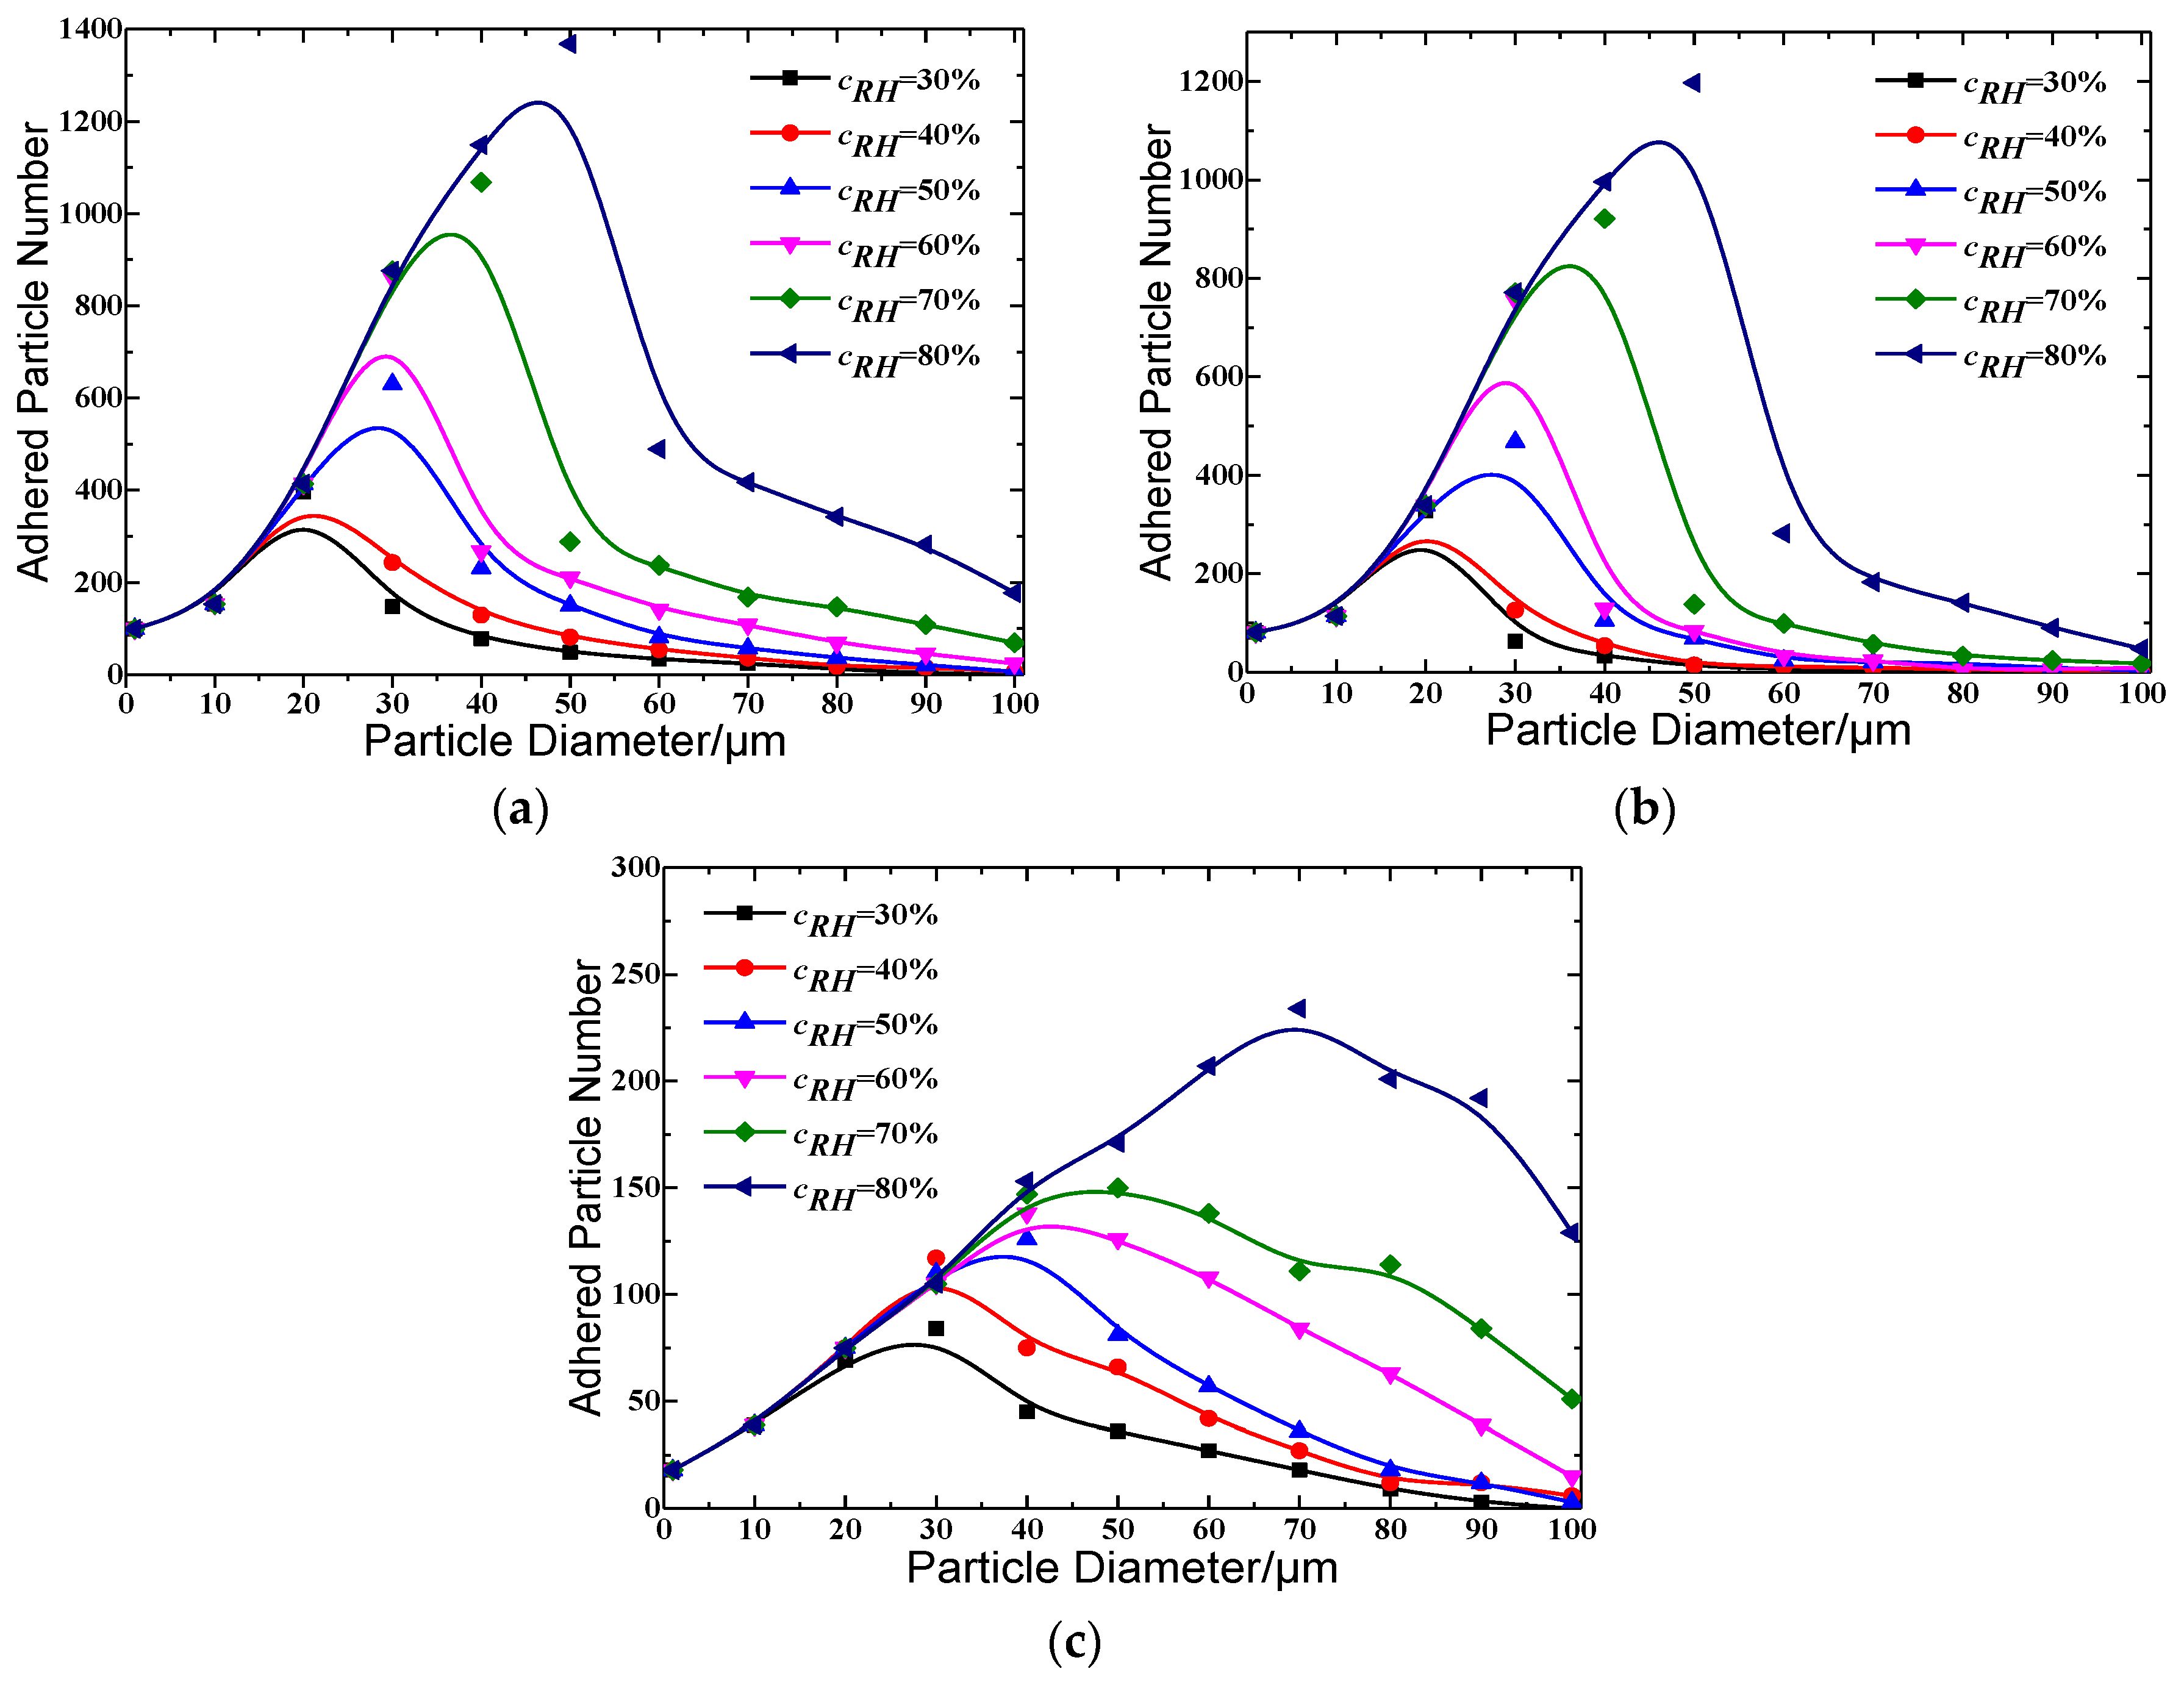
5.1. Influence of Relative Humidity
Historical meteorological data shows that annual average relative humidity of most cities in China is in the range of 50%–70%. Thus, the adhesion of particles was studied under relative humidity at 30%, 40%, 50%, 60%, 70%, and 80%, and the results are shown in
Figure 5. The data points are connected by a B-Spline curve. In the simulation model, the conditions were set as a positive DC electric field,
v = 4 m/s and
U = 30 kV.
Figure 5 shows that the higher the relative humidity, the easier the large particles are adhered, and the more the number of adhered particles. Specifically, at low relative humidity (
cRH = 30% and 40%), particles with sizes in the range of 10–30 μm were easily adhered, and the
D50 of adhered particles were 19.84 μm and 21.52 μm, respectively. With high relative humidity (
cRH = 70% and 80%), the particles with sizes in the range of 25–70 μm were easily adhered, and the
D50 of the adhered particles were 48.76 μm and 37.42 μm, respectively. With normal relative humidity (
cRH = 50% and 60%), the particles with sizes in the range of 15–40 μm were easily adhered, and the
D50 of the adhered particles were 29.47 μm and 30.14 μm, respectively. The measurement results were consistent with the statistical characteristics obtained above. In addition, it could also be found that the size distribution of adhered particles on the upper surface was similar to that of on all surface, and there was a small amount of adhered particles on the bottom surface. Moreover, the influence of relative humidity on the adhesion number of particles was relatively limited when the particle size was less than 15 μm and greater than 90 μm. However, when the particle size was in the range of 20–80 μm, the influence of relative humidity on the adhesion number of particles was quite significant.
In
Section 3.2, Equations (11)–(16) show that when relative humidity increases, the capillary force
Fcap will increase accordingly, and then the adhesion loss will also increase. Finally, the particles will be easier to adhere to the insulator surface with the same initial kinetic energy. For small particle (size ≤ 20 μm), the effect of fluid drag force is more obvious, and the trajectory of the particle is more likely to follow the change of wind direction. Therefore, it is easy to follow the movement of airflow, and bypass the insulator surface. So, collision and adhesion are difficult to happen. Although the small particles are easily adhered after collision, the number of adhered particles is rare due to the lower collision probability. For larger particles (size ≥ 80 μm), the effect of fluid drag force is remarkably weak, and the trajectory of particles cannot quickly follow the change of wind direction. Thus, the particles find it easy to pass through the boundary layer and achieve the collision. However, the energy loss during the collision process is so limited that the particles are not easily adhered, so there is a small number of adhered particles. However, for particles with sizes in the range of 20–80 μm, the order of magnitude of their initial kinetic energy and energy loss in collision are similar, so the adhesion is greatly affected by other external parameters. As relative humidity increases, the adhesion loss will increase correspondingly, which will cause the particles to be easily adhered to the surface. Therefore, the relative humidity has a significant influence on the adhesion number of particles, especially for particles with sizes in the range of 20–80 μm.
5.2. Influence of Wind Speed
In view of the fact that annual average wind speed in most cities of China is about 4m/s, the adhesions of the particles under wind speed of 2, 4, 6, 8 and 10 m/s were studied in this paper, respectively. The results are shown in
Figure 6. B-Spline curve is used to connect data points, and the simulation conditions are set as positive DC electric field,
cRH = 60% and
U = 30 kV.
As shown in
Figure 6, the influence of wind speed on adhesion of particles is significant. At low wind speed (
v = 4 m/s), the particles with greater size were easily adhered to the surface, and the size of adhered particles was mainly distributed in the range of 30–70 μm, and the
D50 is 49.22 μm. At high wind speed (
v = 10 m/s), the particles with smaller size were easily adhered, and the size of adhered particles was mainly distributed in the range of 10–30 μm, and the
D50 is 20.14 μm. When wind speed was in the range of 2–6 m/s, there were obvious changes of the size distribution of adhered particles. However, when wind speed was in the range of 6–10 m/s, the size distribution of the adhered particles showed little change, and it showed saturation. Therefore, for the area in which annual average wind speed is about 4 m/s, the particles with sizes in the range of 20–40 μm are more likely to be adhered. These simulation results support the statistical characteristics of the particle size distribution obtained from the above measurement results. In addition, the size distribution of adhered particles on the upper surface was similar to that of on the all surface, and there were a small number of adhered particles on the bottom surface.
According to
Figure 6, there is a certain concentration of the size distribution of adhered particles. A thin boundary layer will be formed near the insulator surface when airflow moves around the insulator [
11]. In the boundary layer, there is a significant gradient change of force in the direction of the normal vertical surface. The order of magnitude of viscous force increases remarkably and reaches an order of magnitude which is similar to that of the inertial force [
17]. Therefore, for the smaller particles, their trajectories tend to vary with the direction of the airflow due to the significant viscous force, so it is difficult to collide with the surface, and the number of adhered particles will be greatly reduced. However, for the larger particles, the inertia force is greater than the viscous force, and it plays a major role in the forces acting on the particles. Therefore, the change of airflow has little influence on its trajectory, which makes it easier to pass through the boundary layer and realize collision. Whereas, due to the larger initial kinetic energy and less energy loss during the collision, it is easier to experience rebound and fail to complete adhesion.
Especially for the bottom surface, due to the existence of the umbrella skirt, the turbulent flow around the bottom surface is remarkable, and it will greatly reduce the speed of the airflow. At the same time, the velocity of particles will also reduce. Finally, it causes the large particles to be easily adhered. As shown in
Figure 5c and
Figure 6c, there is a large amount of adhesion of larger particles on the bottom surface.
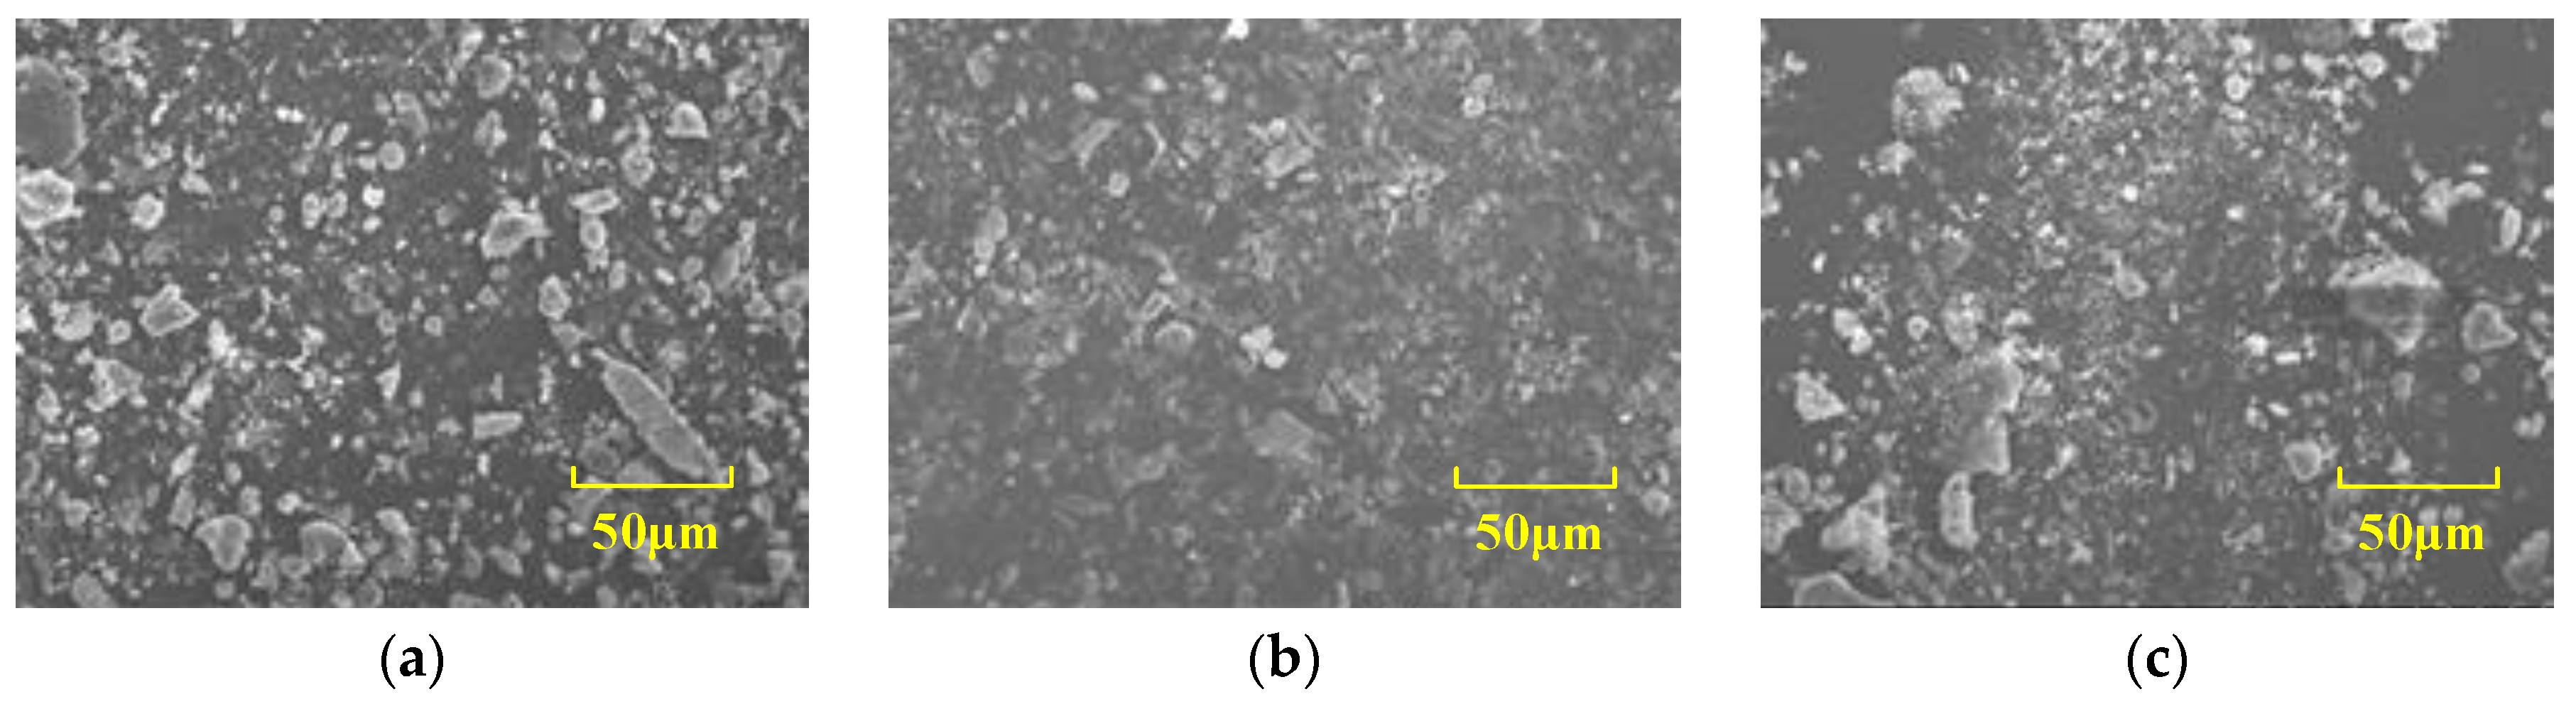
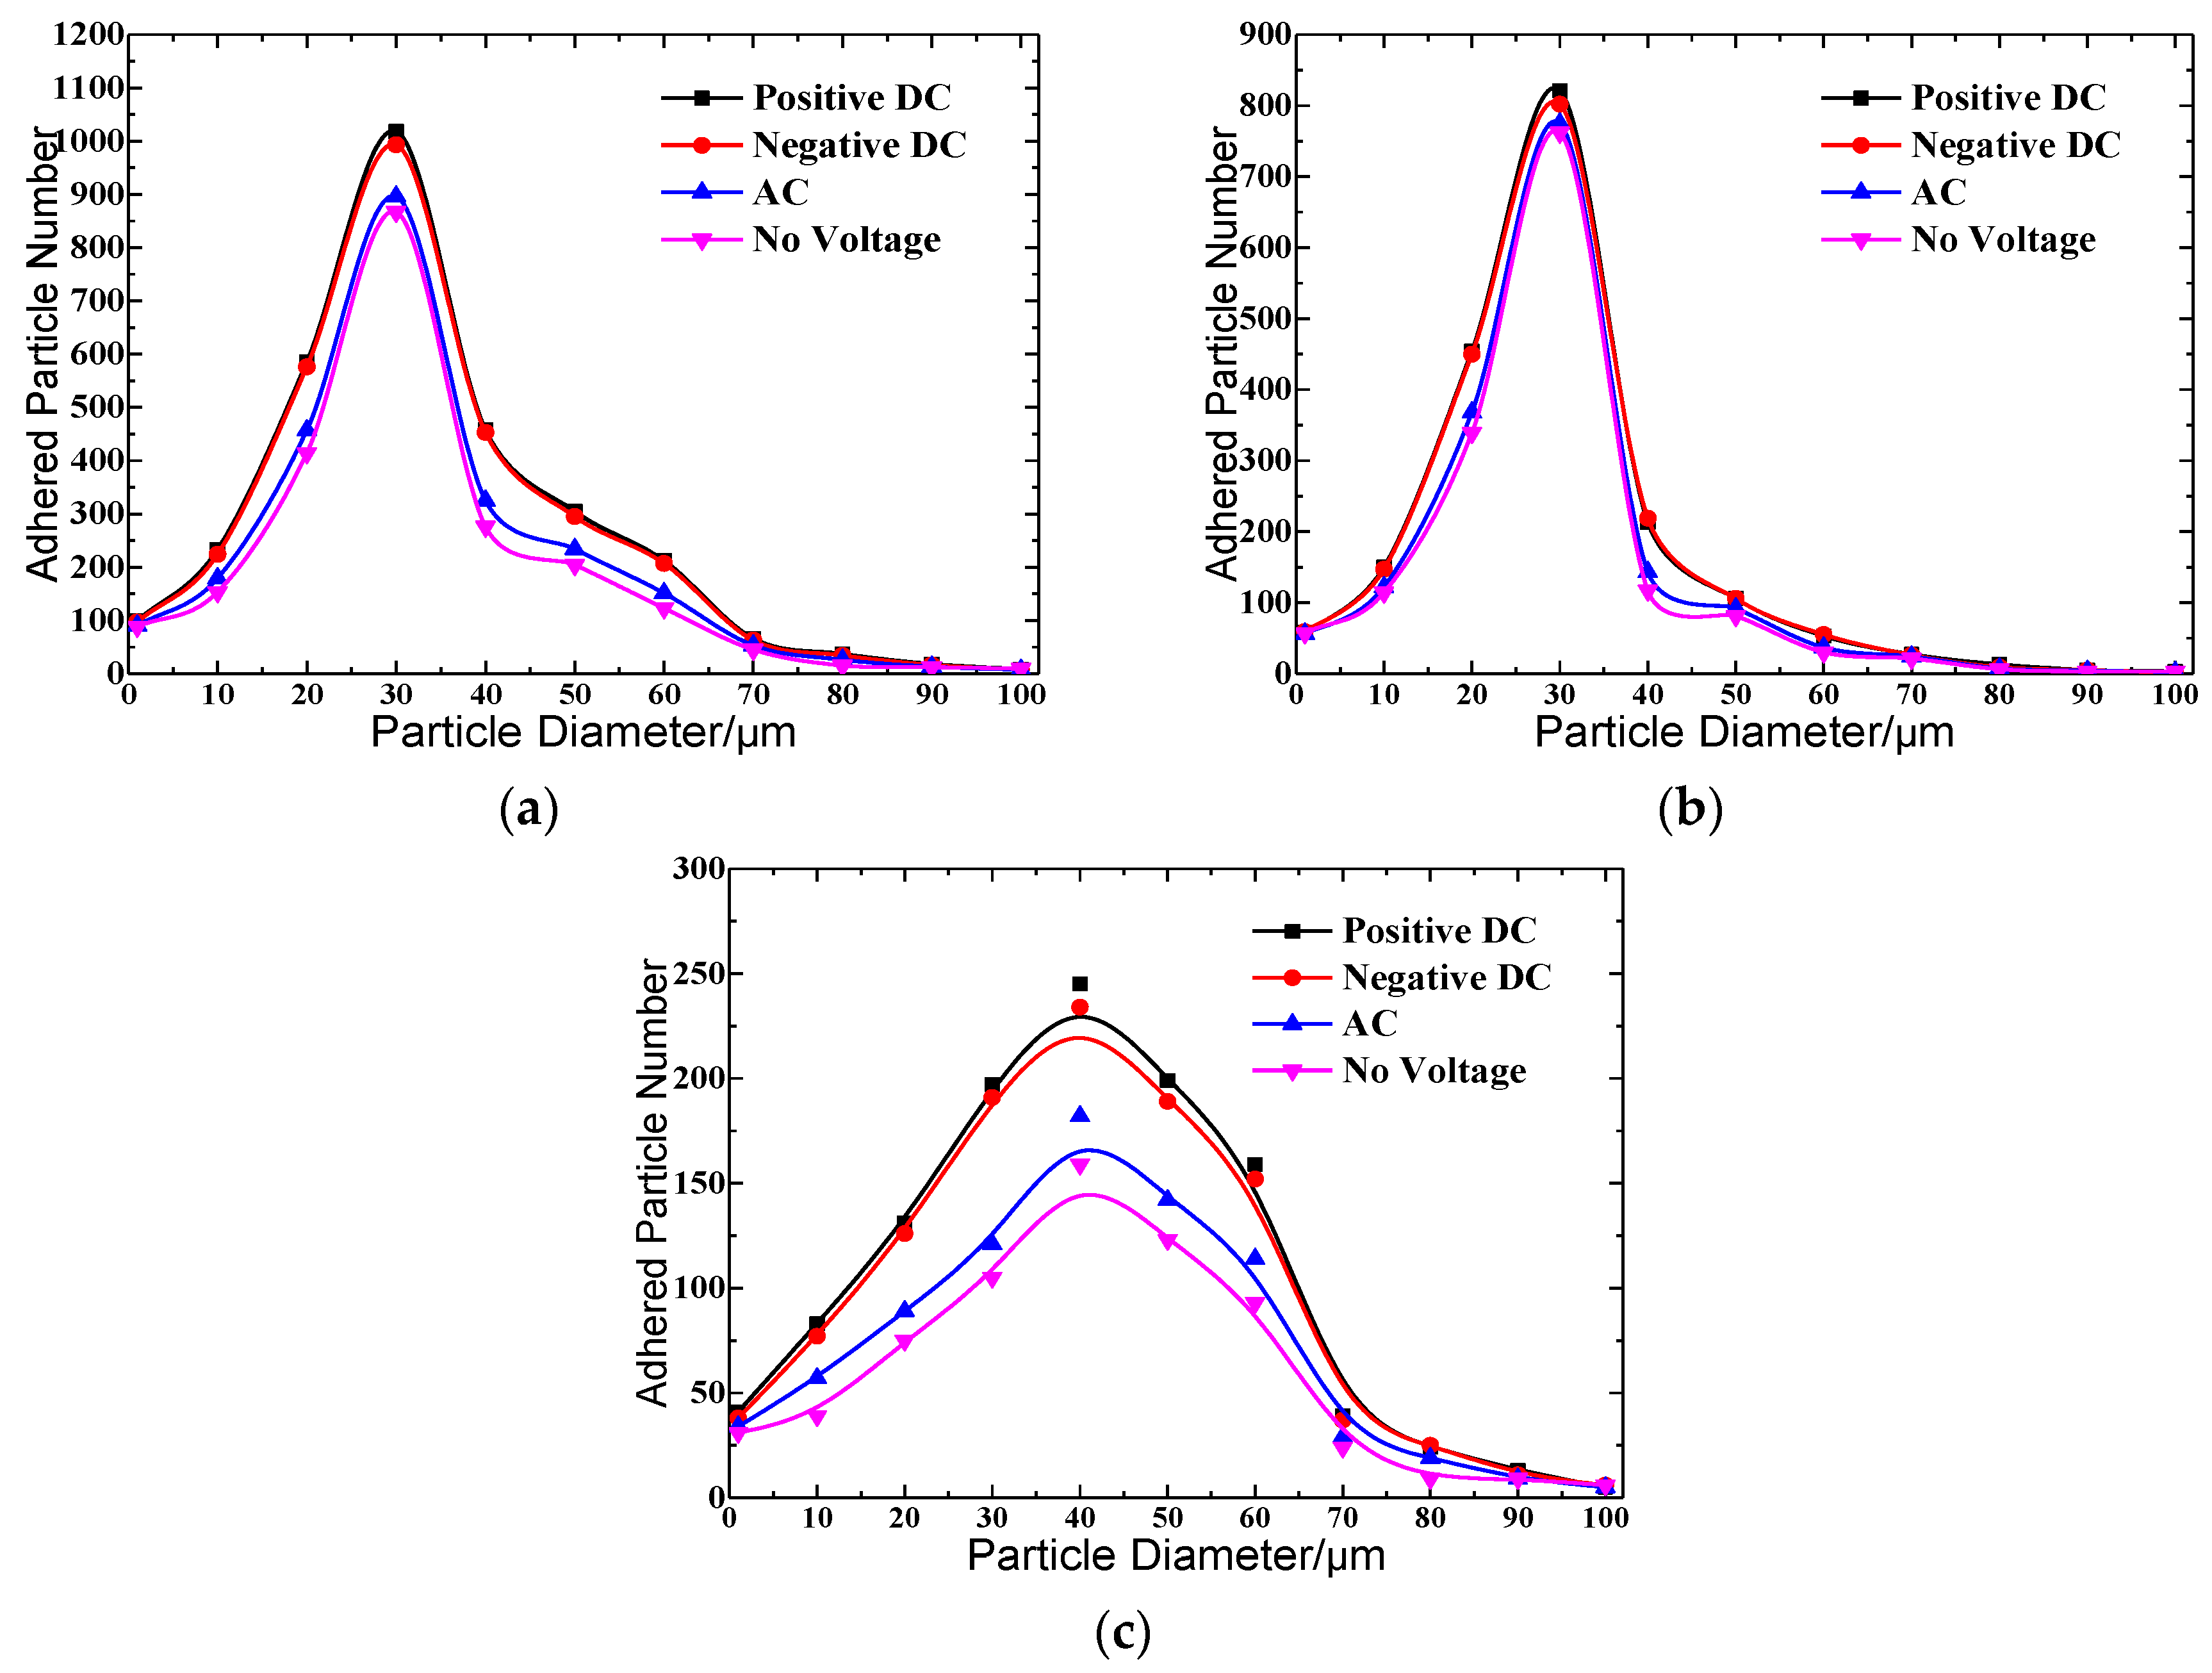
5.3. Influence of Electric Field Type
Adhesion of particles under four different electric field types were studied, including positive DC electric field, negative DC electric field, AC electric field, and no electric field. The voltages were set to +30 kV, −30 kV, 30sin (100π
t) kV, and 0 kV, respectively, and the results are shown in
Figure 7. In the simulation model, the simulation conditions were set to
cRH = 60%,
v = 4 m/s.
In
Figure 7, it shows that the influence of electric field type on adhesion is relatively weak. The difference of adhesion number curves under different electric field types is not obvious. The adhesion numbers of the particles with the same size from high to low, are positive DC electric field, negative DC electric field, AC electric field, and no electric field. The reason for these results is that the AC electric field changes periodically, which leads to the periodic change of the electric force acting on the particle, and it cannot achieve the continuous effect. Finally, the trajectory of particles is less affected. Under the condition of the DC electric field, the particles will move toward the surface with the effect of electric field force, because the electric field gradient near the insulator is perpendicular to the surface [
15]. At the same time, due to the continued effect of electric field force, the collision number of particles will show an obvious rise. Therefore, it leads to a higher adhesion number of particles under the DC electric field than that under the AC electric field and no electric field.
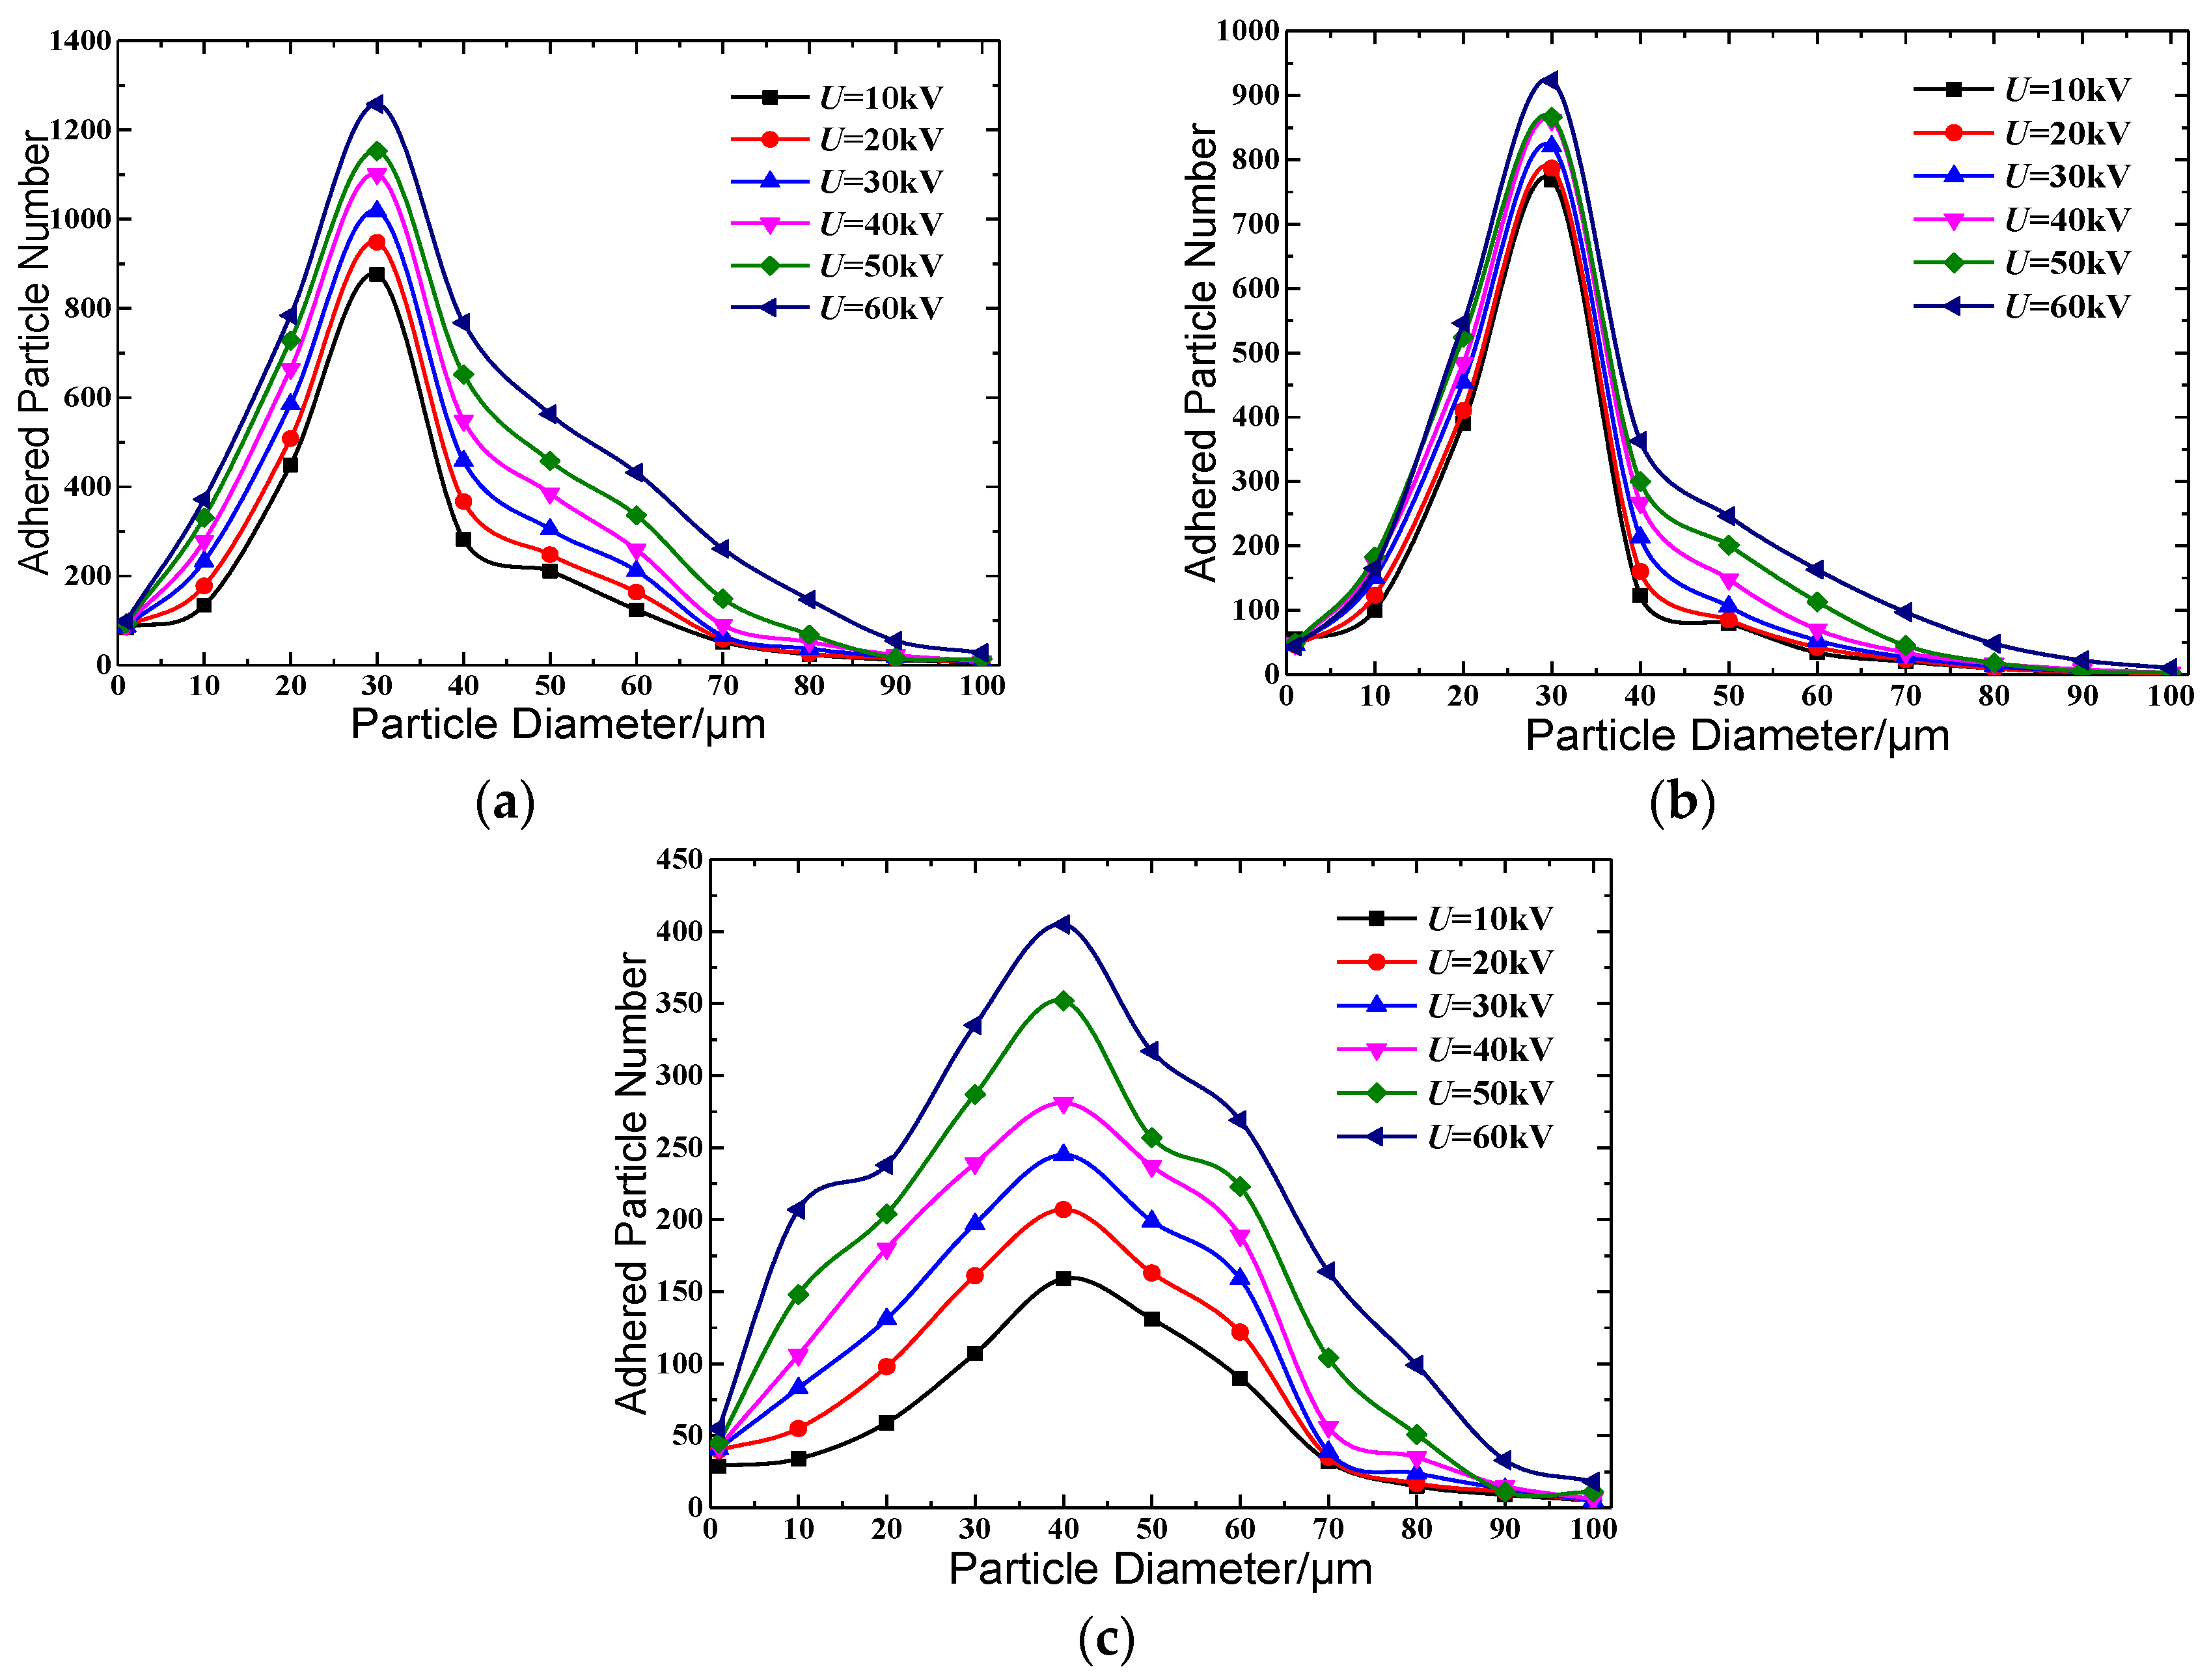
5.4. Influence of Electric Field Strength
The adhesion of particles at different voltage levels were studied, including 10, 20, 30, 40, 50, and 60 kV, and the results are shown in
Figure 8. In the simulation model, the conditions were positive electric field,
cRH = 60%,
v = 4 m/s.
Figure 8a shows that the greater the electric field strength, the more particles that are adhered to the insulator surface. The adhesion number of particles on the all surface reaches peak value when size is about 30 μm. In
Figure 8b,c, it shows that the adhesion number of particles on the upper surface is greater than that on the bottom surface, and the size distribution of adhered particles on the upper and bottom surface is different. The adhesion number of particles reaches peak value when the size is about 40 μm on the bottom surface, but the adhesion number of particles reaches peak value when the size is about 30 μm on the upper surface.
Furthermore, it was also found that when the particle size was in the range of 10–70 μm, the influence of electric field strength on the adhesion number was relatively obvious. However, when the particle size was less than 10 μm and greater than 70 μm, the influence of electric field strength on the adhesion number was very limited. This phenomenon can be explained by that the greater the electric field strength, the greater the electric field force. The electric field force causes more particles to move toward the insulator surface [
15], thereby increasing the number of adhered particles. For small particles, the influence of electric field force is relatively weak due to less electric charge. At the same time, the influence of fluid drag force was stronger compared with electric field force, so the change of electric field strength showed little influence on the adhesion number. For large particles, its charge was greater. The increase of electric field strength will increase the colliding number of particles, but it will also increase the velocity of the particles when collision happens, resulting in a decrease in the number of adhered particles. Therefore, the influence of electric field strength is limited.
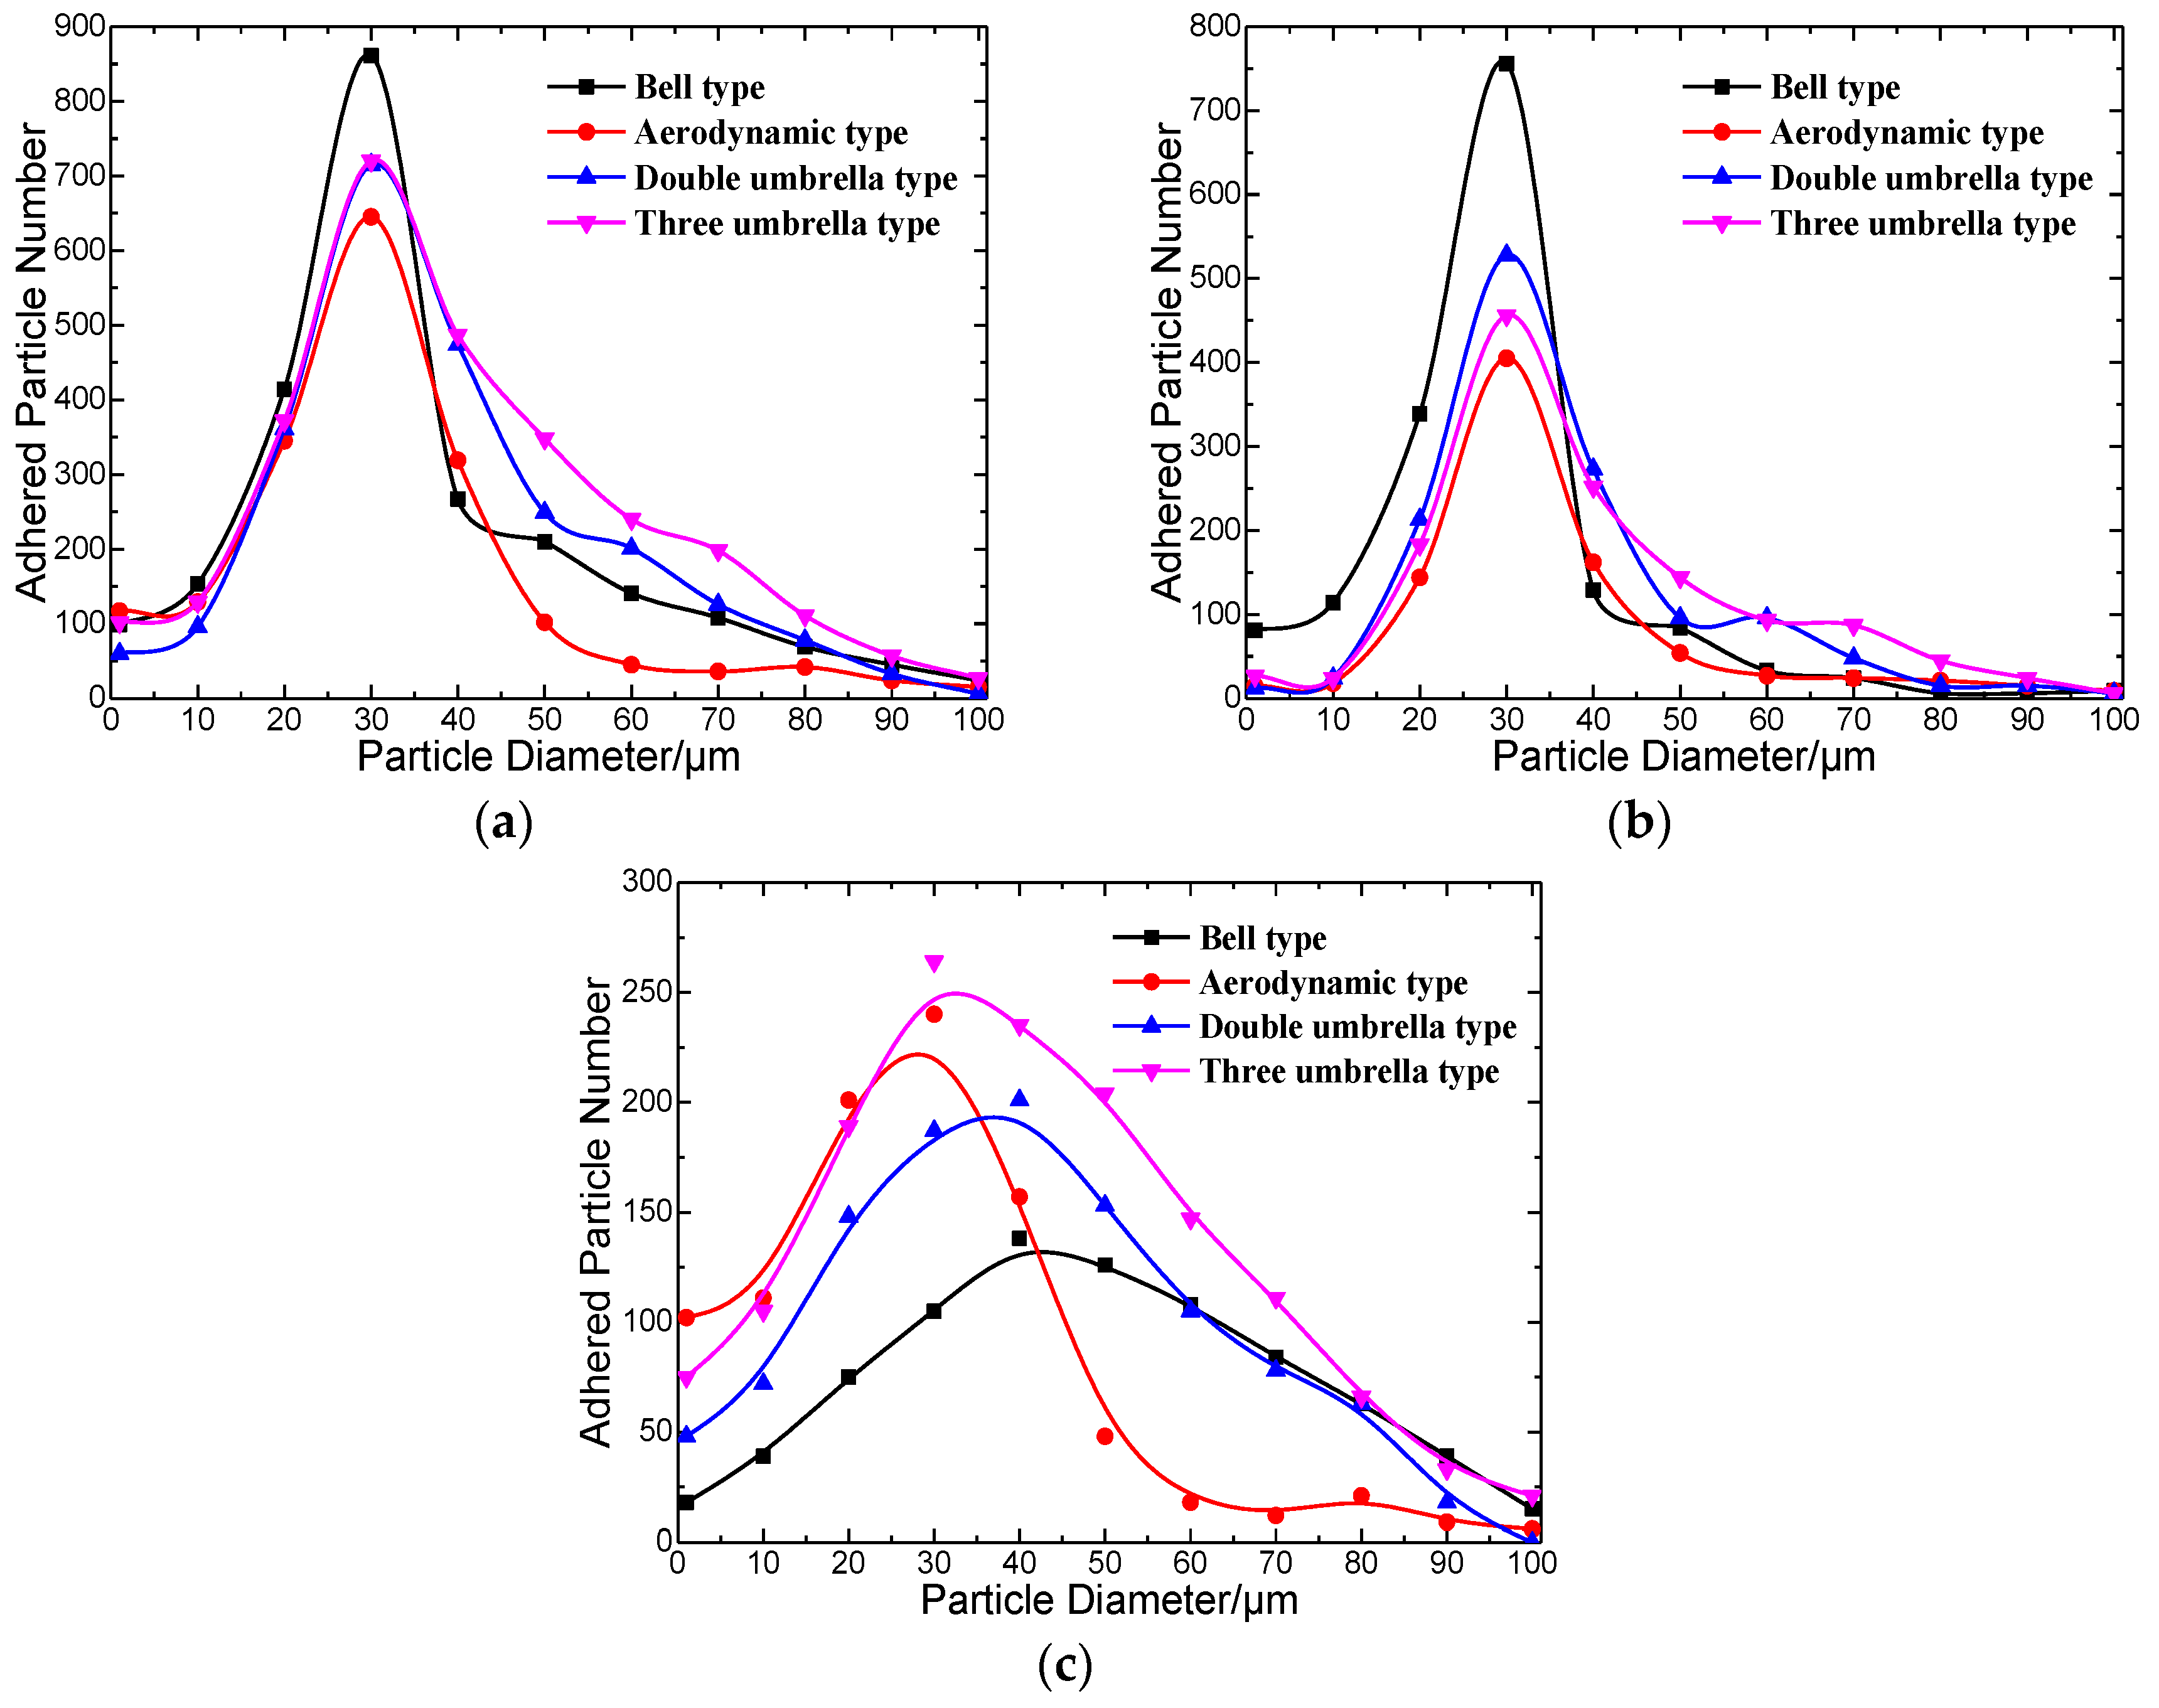
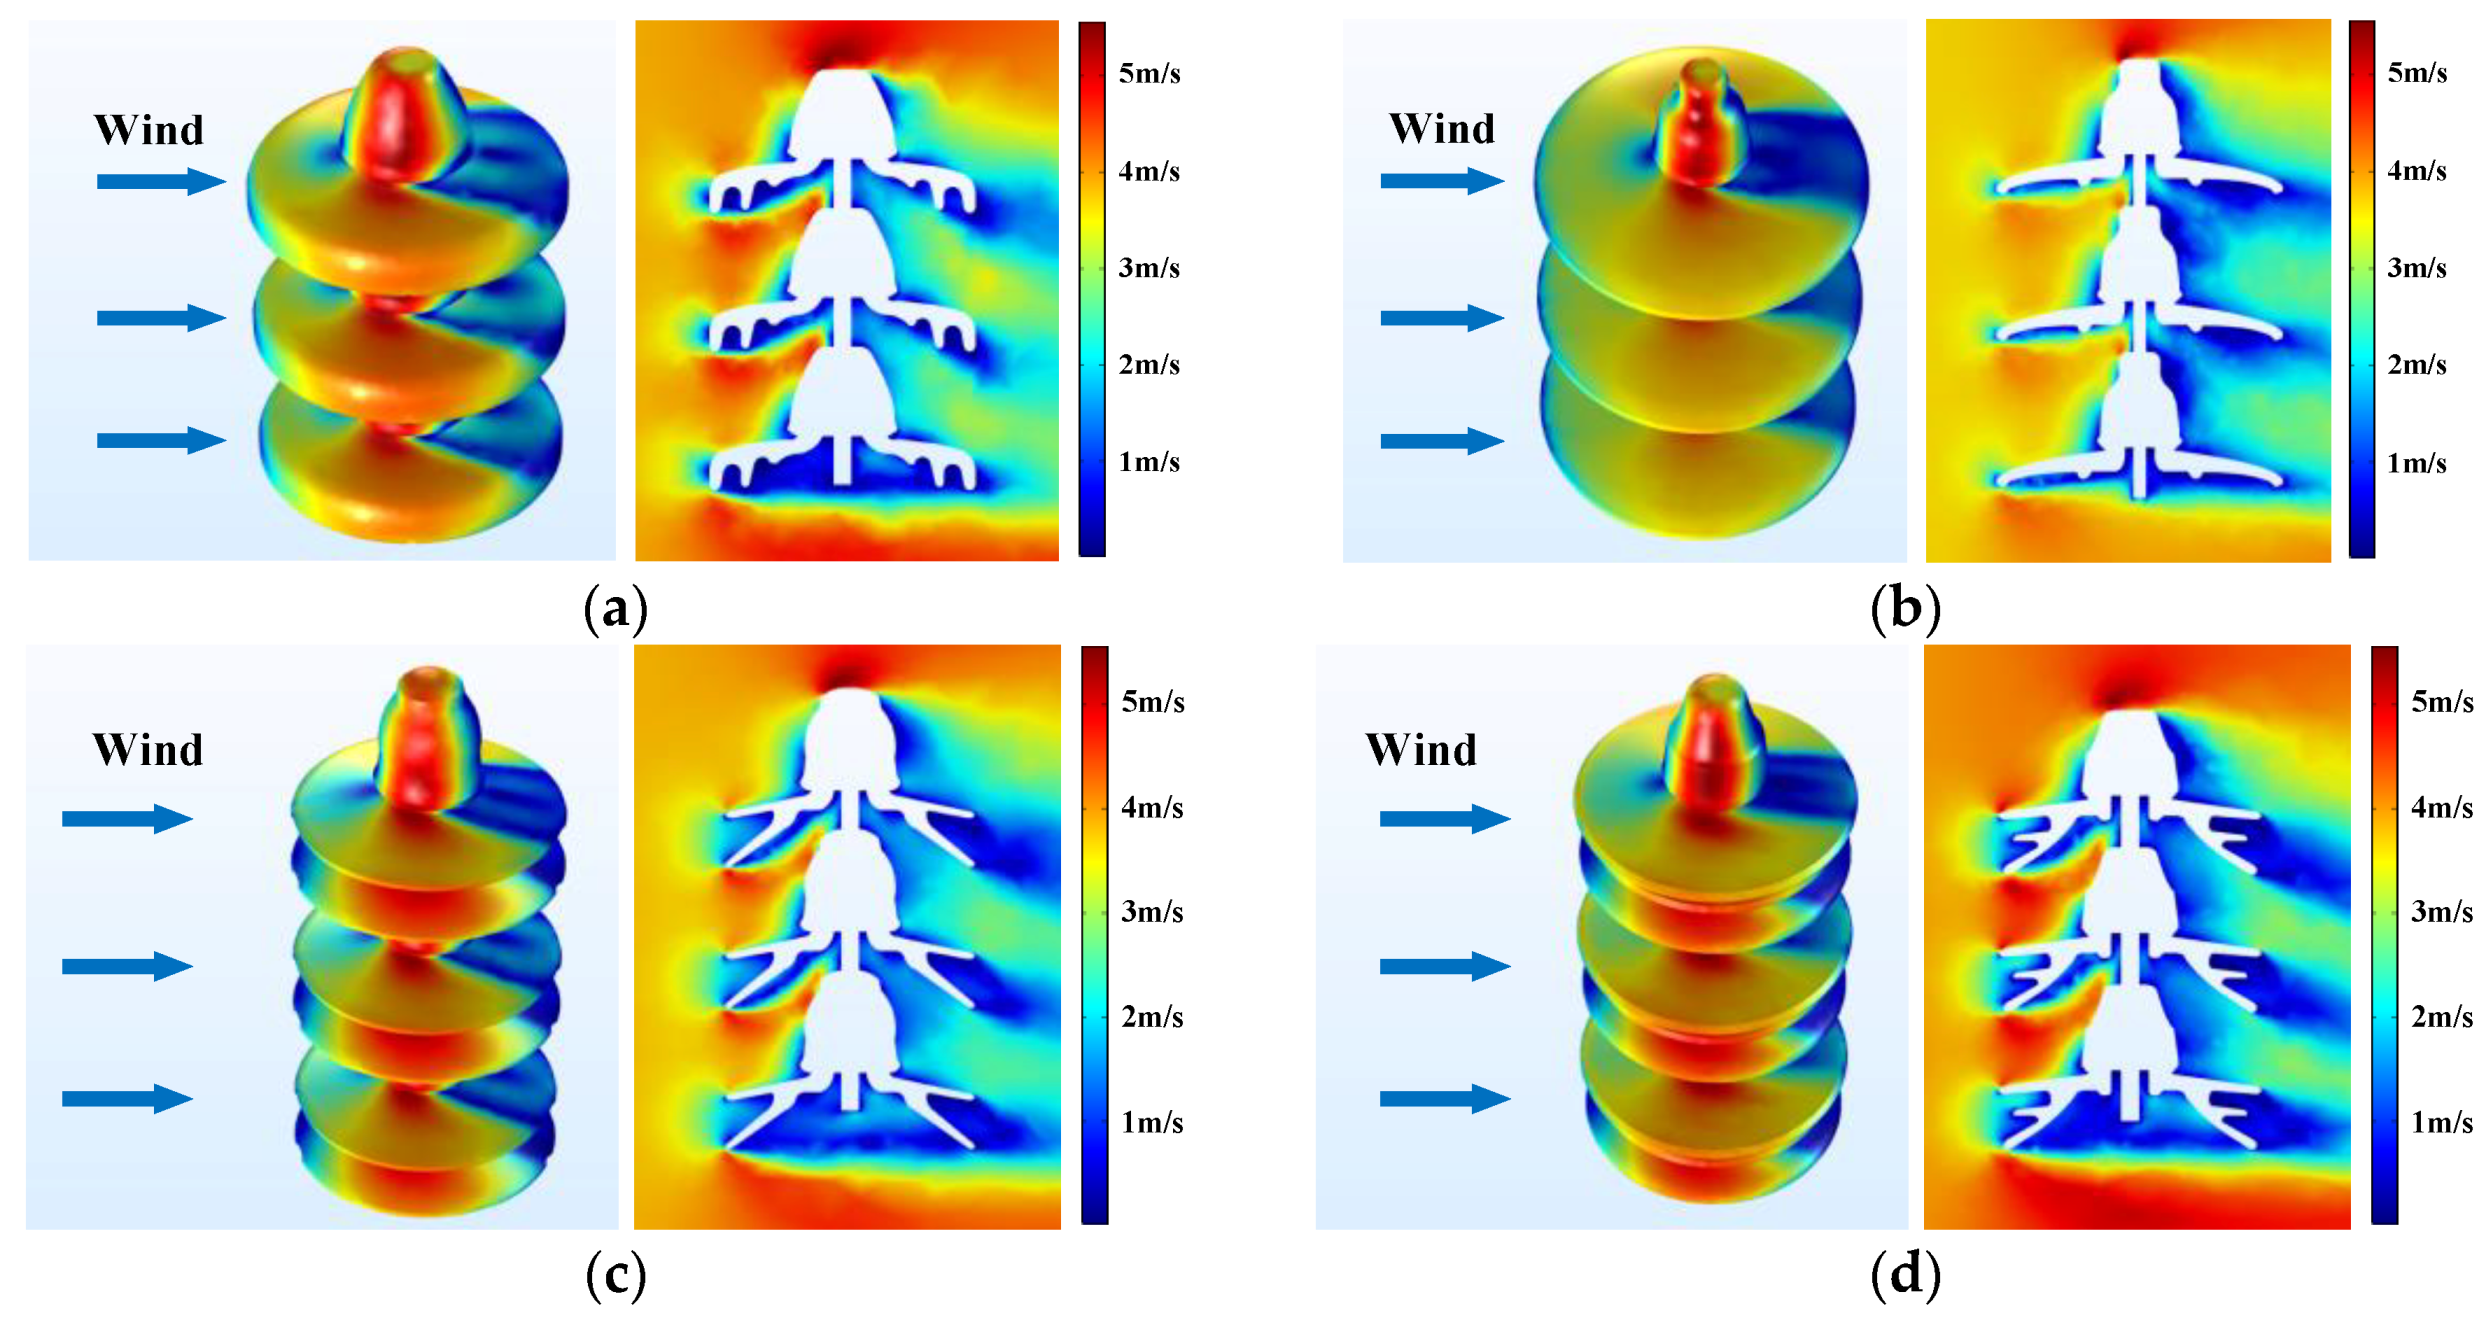
5.5. Influence of Aerodynamic Shape
In order to verify whether the above statistical characteristics are universally applicable, the adhesion of particles under the conditions of different aerodynamic shapes were studied, including the bell type insulator XP-160, aerodynamic type insulator XMP-160, double umbrella type insulator XWP-160 and the three-umbrella type insulator WSP-160. The results are shown in
Figure 9, and the airflow field diagrams for these four kinds of aerodynamic models are shown in
Figure 10. In addition, the same parameter conditions were set, including
cRH = 60%,
v = 4 m/s, positive DC electric field, and
U = 30 kV.
According to the
Figure 10, it can be found that there is no significantly low speed area around the bottom surface of the aerodynamic type insulator. The airflow is less disturbed because the structure of its umbrella skirts is relatively simple. However, for the bell type insulator, double umbrella type insulator, and the three-umbrella type insulator, there was obviously a low speed area around the bottom surface. The umbrella skirt structure of these three kinds of insulators is relatively complex, so the airflow is greatly disturbed (the blue part shown in the
Figure 10).
As can be seen from
Figure 9, the influence of aerodynamic shape on the adhesion is not significant. In general, the size distribution of adhered particles on the four kinds of insulators with different aerodynamic shape were similar, and the adhered particles were mainly concentrated in the range of 20–40 μm, and the adhesion number of particles reached peak value when size was about 30 μm. In particular, the adhesion number of particles on the bell type, double umbrella type, and three-umbrella type insulators was greater than that of the aerodynamic type insulator, especially for particles with sizes greater than 20 μm. This difference is attributed to the difference of the umbrella skirt structures of these four kinds of insulators. More particles can be adhered to the surface of the bell type, double umbrella type, and three-umbrella type insulators, due to the obvious low speed area around the insulators’ surface. In addition, this difference is more remarkable, especially on the bottom surface. In the
Figure 9c, it can be found that the adhesion number curve of greater particles (
R ≥ 45 μm) on the aerodynamic type insulator surface is the lowest.
6. Conclusions
Many contamination samples collected from porcelain insulator surfaces were measured, and obvious size distribution characteristics were found. Furthermore, an adhesion model was established to analyze the movement of particles, and the influences of different factors on adhesion were also studied. The following conclusions were obtained.
The size distribution of adhered particles on the porcelain insulator surface is basically in logarithmic normal distribution, and the D50 is about 20 μm, and the distribution of particles (R ≤ 5 μm and R ≥ 50 μm) is rare.
For small particles, their trajectory is easily affected by the fluid drag force, and it is difficult to experience collision and adhesion. For large particles, it is difficult to adhere to the surface due to great initial kinetic energy. Thus, there are significant size distribution characteristics of contaminated particles on the porcelain insulator surface.
In the process of adhesion, the influences of relative humidity and wind speed on the adhesion were remarkable, whilst the influences of electric field type, electric field strength, and aerodynamic shape were relatively weak.
In addition, it can be considered that the size distribution of contaminated particles on the glass insulator surface is similar to that of the porcelain insulator, because glass and porcelain all belong to a rigid medium. However, the surface of a composite insulator will experience micro-elastic deformation during collision, resulting in a difference of the size distribution, so more detailed research about adhesion will continue to be carried out.


