1. Introduction
Spectroscopic ellipsometry is widely recognized as a particularly useful experimental technique for determining the dielectric properties of thin layers because of its high sensitivity to their thickness [
1,
2]. Such possibilities are particularly useful in polymer research because polymer thin films find many important applications in various branches of technology, industry and medicine, of which we will mention only a few. For example, they are used in organic electronics as active or auxiliary layers, optoelectronic devices, shielding layers, electrostatic layers, protective layers, membranes, filters and implants [
3,
4]. This is why there is a huge need for research and knowledge related to thin polymer layers in all scientific and practical aspects, starting from their production, determining their properties and modification methods, and ending with the optimization of the parameters of the final product. Many of these needs can be met by studying the physicochemical processes occurring in thin layers of soft matter. Spectroscopic ellipsometry can be used in such studies, e.g., to monitor changes in the dielectric properties associated with such processes. Numerous examples have demonstrated the usefulness of spectroscopic ellipsometry in such studies, see, for example, refs. [
5,
6,
7,
8] and the references therein.
Adding the possibility of controlled heating or cooling of the sample during ellipsometric measurements opens the way to the study of temperature-dependent physicochemical processes [
9,
10,
11,
12]. The well-known Lorentz–Lorenz equation combines the optical properties of a material with electronic polarizability and the volume of its single repeating unit [
13], thus creating a convenient platform for inferring the microscopic properties of matter from its macroscopic properties. Due to this important relationship, the change in the refractive index of a thin polymer film can be related to a change in electronic polarizability and/or a change in the volume of its single repeating unit. Since changing the temperature of thin layers affects their refractive index and layer thickness, both effects must be considered [
14,
15,
16]. Within linear approximation, these changes can be related to the thin-film thermoptic coefficient (TOC) and the linear thermal expansion coefficient (LTEC) [
10,
12], which in turn are related to the temperature coefficient of electronic polarizability (TCEP) through the Lorentz–Lorenz equation. For materials in which both these effects compete, their LTEC and TOC must be determined with a very high accuracy in order to deduce from them the value of electronic polarizability. This is the case with polymer thin films. In the case of optical polymers, e.g., polymethyl methacrylate (PMMA), polycarbonate (PC), polystyrene (PS) or polyolefins such as polyethylene (PE) or polypropylene (PP), when used as optical elements, the thermo-optical effect may be perceived as unfavorable. However, in sensor applications exploiting this phenomenon, it is advantageous [
17].
From what has been said above, it follows that temperature-dependent spectroscopic ellipsometry is a very useful tool for this purpose [
10]. However, it should be remembered that ellipsometry is an indirect method of experimental optics in which ellipsometric angles are directly measured quantities [
16,
18,
19]. For this reason, it is necessary to rely on more or less complex analyses to determine, for example, the refractive index and the thickness of a thin layer [
16,
18]. It should also be noted that although temperature-dependent ellipsometry has long been successfully used to determine the thermo-optic coefficients and linear coefficients of thermal expansion [
10,
15,
20], an analysis of the sensitivity of ellipsometric angles to sample temperature changes has not yet been performed, despite the fact that a unified linear analysis (ULA) of the sensitivity of ellipsometric angles to the change in thickness of thin films was developed by Azzam, Elshazly-Zaghloul and Bashara [
21] as early as 1975. Of course, ULA has not been adapted to describe the temperature changes of the layer, which affect not only its thickness but also the refractive index. Therefore, bearing in mind the need to determine the values of thermo-optical parameters with the greatest possible accuracy, we develop such a data analysis method here. As examples of the practical application of this method, we identified the optimal spectral windows to accurately determine the LTEC for 50 to 150 nm-thick PMMA thin films deposited on transparent (SiO
2) and light-absorbing (Si (100)) substrates. The influence of the thin-film thickness on the accuracy of TOC and LTEC determination is discussed. Moreover, the analysis of temperature-dependent ellipsometry results developed here can be considered a convenient method for determining thermo-optical parameters such as the LTEC, TOC and TCEP.
2. Materials and Methods
This work concerns thin polymer layers deposited on Si and SiO
2 substrates in order to determine the thermal properties of these layers. Importantly, the proposed method provides a convenient platform for inferring the microscopic properties of matter, such as its electronic polarizability and the volume of its single repeating unit, based on its macroscopic properties. In this section, we briefly present the basic relationships, following our earlier work [
15]. The polarizability of a molecule,
is a measure of its ability to respond to the acting electric field,
and can be used to ultimately obtain the electric dipole moment,
p, which can be written as follows:
where the molecular polarizability:
is the sum of contributions
derived from the
i-th atom making up the molecule. Under the general assumptions of using the linear approximation, the dependence of the molecular polarizability
on temperature,
T, can be written as follows:
where
is the reference temperature, the infinitely small increase in temperature
is calculated with respect to the reference temperature
and the TCEP
is defined by:
On the other hand, molecular polarizability
can be expressed by macroscopic quantities using the Lorentz–Lorenz (LL) equation [
9], namely:
where
is the molar volume,
is Avogadro’s number and
n is the refractive index of the medium. Differentiating both sides of the above equation with respect to temperature leads us to the following relationship:
where quantity
, defined as:
is the thermo-optic coefficient (TOC),
and
is the volumetric thermal expansion coefficient (VTEC), defined as:
Therefore, the temperature coefficient of polarizability
can be written as follows:
In other words,
can be expressed as the sum of the TOC value proportional to the factor
which depends only on the refractive index of the medium and the VTEC. Note also that the volumetric coefficient of thermal expansion
can be expressed as the sum of the linear thermal expansion coefficients (LTECs)
along the main symmetry directions of the body under consideration, see, e.g., [
10] and the references therein. One of the experimental methods capable of determining all the physical quantities present on the right side of the relationship (9) is ellipsometry [
10,
12]. Its particularly valuable advantage is the very precise determination of the optical properties of thin layers and their thickness.
The use of spectroscopic ellipsometry also allows one to determine the spectral dispersion of the TOC [
10,
15]. Thus, using Equation (
9), the dependence of
on the wavelength of light
can also be determined. The experimental approach commonly used is quite natural. Namely, the refractive index
n and the film thickness
h are determined not only at the reference temperature, but the procedure is repeated for other temperatures. Then,
and
, explicitly defined by the following formula:
are calculated from the determined temperature dependences
and
, respectively. However, as already mentioned in the introduction, an analysis of the sensitivity of ellipsometric angles to temperature changes has not been developed so far.
3. Results
Standard ellipsometry measures the ratio of the overall complex reflectance or transmittance coefficients
defined as follows [
12]:
where the ratio of the two reflection (or transmission) coefficients
and
of polarized light parallel and perpendicular to the plane of incidence, respectively, is expressed by ellipsometric angles
and
. On the other hand,
depends on the film thickness and the complex dielectric functions of a particular optical system. Generally, for a given optical system, this is a known multi-variable function expressed by complex Fresnel reflection and transmission coefficients, see, for example, ref. [
21]. In the following, for the sake of clarity, as arguments for
, we will explicitly list only the variables related to the tested layer, since the other variables are considered to be known quantities. Changing the temperature of the materials affects the optical properties and the film thickness as discussed above. For most materials, the layer thickness usually increases and the refractive index decreases with increasing temperature; however, there are many exceptions to this rule.
To find out how a slight change in the temperature of a film affects the measured ellipsometric angles, it is convenient to extend the unified linear analysis developed by Azzam, Elshazly-Zaghloul and Bashara in order to compare the sensitivity of reflection and transmission ellipsometry on the thickness of the examined films [
21]. For this purpose, they introduced a complex sensitivity function, the real and imaginary projections of which determine the sensitivity factors of
and
. Although this approach is general in the sense that it can be applied to films of any initial thickness
, values of the remaining parameters of the optical model of the film under study are fixed therein. Considering the fact that changing the temperature of the film affects not only its thickness, but also its optical properties, it is clear that we need to extend the ULA, and, to distinguish it, we will call it the extended unified linear analysis (EULA). To move on, let us start by writing the main sensitivity relationship as outlined in ref. [
21], namely:
where
K is a complex sensitivity factor that couples a fractional change in film thickness
to a corresponding change in
[
21]. Now, we extend this approach to cases where the change in
may also be due to a change in the refractive index. To achieve this, we rewrite Equation (
12) as follows:
which takes a form similar to an exact differential if we identify
as the derivative (
calculated at the indicated reference point, marked by the label 0. Note that the sensitivity factor
K in Equation (
12) is also computed at this reference point. Therefore, we can write the following extended version of Equation (
13) with two variables:
where
n is the refractive index of the film. In Equation (
14), the first equation is nothing but the complete differential notation for
, the middle equation defines corresponding partial components
and
and the last equation defines the partial complex sensitivity factors
and
. Explicitly, these sensitivity factors are defined by the following relations:
The above-mentioned sensitivity factors of the ellipsometric angles
and
can be determined by direct differentiation of the main equation of reflection ellipsometry [
16], i.e., Equation (
11), from which differentials of ellipsometric angles
can be expressed by the differential of
as follows:
where
is the ellipsometric angle
corresponding to
and
is the ellipsometric angle’s
partial sensitivity factor associated with the variable
or
n, explicitly defined by:
Similarly, for ellipsometric angle
,
where
is the ellipsometric angle’s
partial sensitivity factor associated with the variable
or
n, explicitly defined by:
In the above expressions,
and
are the real and imaginary part of their arguments, and the identities for sensitivity are a direct consequence of the relationship
and the fact that
is a complex-valued function of the real arguments. For an absorbing substrate, its complex refractive index is
, where both
and
are real quantities. During EULA, we can separate
into components resulting from the change in layer thickness and the change in its refractive index according to Equation (
14). Here, we consider the case where the change in
h and
n is due to a change in the temperature of the film. First, let us note that the ratio of the overall complex reflectance coefficients
is not a function that is directly dependent on temperature. Of course, the temperature change affects not only the thin film but also other components of the given optical system, e.g., the substrate on which the thin film is deposited. In our approach to temperature-dependent thin-film ellipsometry, we directly account for all temperature-induced changes in
, except the thin film, for which we will apply the linear approximation to
developed above. To go further, we express the temperature-induced change in the film thickness
and its refractive index
by the linear thermal expansion coefficient and thermo-optic coefficient, respectively. Thus, we write:
and
Note that above we use the Greek symbol
to express a finite but slight change in the value of a physical quantity that follows that symbol. Substituting these expressions into Equation (
14), the corresponding relative change in
with respect to
can be written as follows:
Equation (
21) is important because it combines the contributions from the temperature-induced changes in layer thickness and refractive index that are proportional to their sensitivity factors
or
and their LTEC and TOC with the fractional change
due to these changes. Since most commonly in practice, the ellipsometric angles
and
are measured quantities, it will be convenient to write appropriate expressions just for these quantities. Namely, the changes in ellipsometric angles due to a temperature change of the thin film by
are, respectively:
for the angle
, and
for the angle
.
3.1. Unique Solution for the LTEC and TOC
It is hard not to notice that the complex Equation (
21) or the two real Equations (22) and (23) can be treated as a system of two equations for two unknowns
and
, i.e., the LTEC and TOC, respectively. To find a unique solution to this system of linear equations, one can use Cramer’s rule, which leads to the following solutions:
and
where
D in the numerators is the determinant of a
matrix of the respective sensitivity factors, explicitly written as follows:
which must be non-zero to obtain a unique solution. The last identities in Equations (24) and (25) are written to define the coefficients
,
,
and
.
3.2. Analysis of the Accuracy of TCEP, LTEC and TOC Determination
It should be noted that all these quantities
and
were determined within the linear approximation, which greatly facilitates an analysis of the accuracy of their determination. Namely, let us assume that the exact value of any quantity, say
q, lies in a certain interval with a finite width
. Thus, for the TCEP, using Equation (
9), we can write:
where
denotes derivative
f with respect to
. Now, for the sake of simplicity, we denote
by
x and
by
y and based on Equations (24) and (25), we get the following expressions for
and
:
and
From this, we can immediately see that the width of the confidence interval for determining the exact value of the LTEC depends on the coefficients
and
, while for the TOC, it depends on the coefficients
and
. Therefore, in order to maximize the accuracy of determining
and
the experimental conditions should be selected in such a way as to minimize the values of
. Moreover, to obtain the highest accuracy, the fact that
is a quantity independent of the wavelength of light can be used. Therefore, the center and width of the spectral window can be selected so that just
can be determined as precisely as possible. Then,
can be determined with a predetermined value of
using Equation (
22). This procedure is dictated by the fact that
is more accurately determined than
because its typical values are 0.02° and 0.1°, respectively. Note that the given
and
values in degrees must be converted to radians to be used in the equations above. To find the spectral relationship
with the same accuracy over the entire spectral range, a parametric relationship
can be used to determine the temperature derivatives of these parameters in the optimal spectral window, which are then applied to determine
over the entire spectral range.
When concluding the discussion on the accuracy of TCEP, LTEC and TOC determination, the presence of the first components on the right side of Equations (27) and (28) should also be mentioned, which are directly proportional to the accuracy of the determination of the refractive index
and the film thickness
, respectively. Since, in our approach, we treat all the quantities determined at the reference temperature as known, this also applies to the refractive index
and the thin-film thickness
. As for
and
, they must be determined; one of the ways to do this is to estimate their values based on the resolution of the ellipsometer. However, this does not take into account the effect of sample imperfections. Therefore, it will be more accurate to determine them on the basis of a statistical deviation from their mean value [
22].
4. Discussion
The extension of the ULA developed here and its application to temperature-dependent thin-film ellipsometry can not only provide a basis for a quantitative analysis of the physical effects that cause changes in
but can also be used to construct sensitivity maps and even to determine LTOC and VTEC values. Of course, to do this, we need to be able to calculate all
. In fact, the expression for computing the
value for a three-phase optical system has already been derived within the ULA in ref. [
16]. For the sake of clarity of presentation, we moved the derivation of the expressions for calculating complex sensitivity factors
to
Appendix A. Here, we will use the newly developed analysis to study the influence of the substrate and the thickness of a polymer thin film on the precise determination of the LTEC and TOC in temperature-dependent spectroscopic ellipsometry which, in turn, is necessary for the accurate determination of the temperature coefficient of electronic polarizability
of such a film. The obtained results should be particularly useful, for example, for people interested in research related to the LTEC and spectral dispersion of the TOC of thin films or surface layers, as well as for people who use spectroscopic ellipsometry. We chose thin polymer films as a research material because they present a challenge as their VTEC and TOC are relatively high and have opposite signs. This results in competitive contributions to
; therefore, the precision of LTEC and TOC determination has a great influence on the accuracy of determining the temperature coefficient of electronic polarizability
of such a film using Equation (
9). To better illustrate this point, let us first compare
deduced from published results, e.g., for PMMA at room temperature by Waxler et al. [
23] and Soave et al. in ref. [
24]. In ref. [
23], we find
(632.8 nm) = 1.4934,
°C
−1 and
°C
−1 which, according to Equation (
9), gives
°C
−1. On the other hand, from ref. [
24], we have
n0(632.8 nm)= 1.4916,
°C
−1 and
°C
−1, which gives
°C
−1. Interestingly, Berini et al. [
25] reported the same value of the refractive index
n(633 nm) = 1.4916 for PMMA as in [
24]. However, in the case of the thermo-optical coefficient measured by a very sensitive interferometric technique,
°C
−1 was given in the tested temperature range from 20 to 70 °C
−1 [
25]. As can be seen, values of
for PMMA as inferred from the cited data differ six fold. All of this clearly shows how important the accuracy of VTEC and TOC determination is.
4.1. Effect of Substrate and Thin Layer Thickness on Precise Determination of LTEC and TOC in Temperature-Dependent Spectroscopic Ellipsometry—Optimal Spectral Windows
Here, we are particularly interested in determining the optimal spectral window(s) width, which allows the precise determination of the LTEC, as the TOC dispersion can then be determined using
. As practical examples, we present the results of calculations for thin PMMA layers deposited on light-absorbing and non-absorbing substrates Si (100) and SiO
2, respectively, for the reference temperature
°C. Since our approach assumes that
of the thin polymer film and the thermo-optical properties of the substrate are known, we will take the necessary inputs from the available literature. Namely, in the case of the PMMA film, we use the data of Soave et al. [
24] and for the Si (100) substrate, we use data from the works of Jellison and Modine [
26,
27], while for SiO
2, data are from Ghosh [
28,
29].
4.1.1. Thin PMMA Films on a Si (100) Substrate
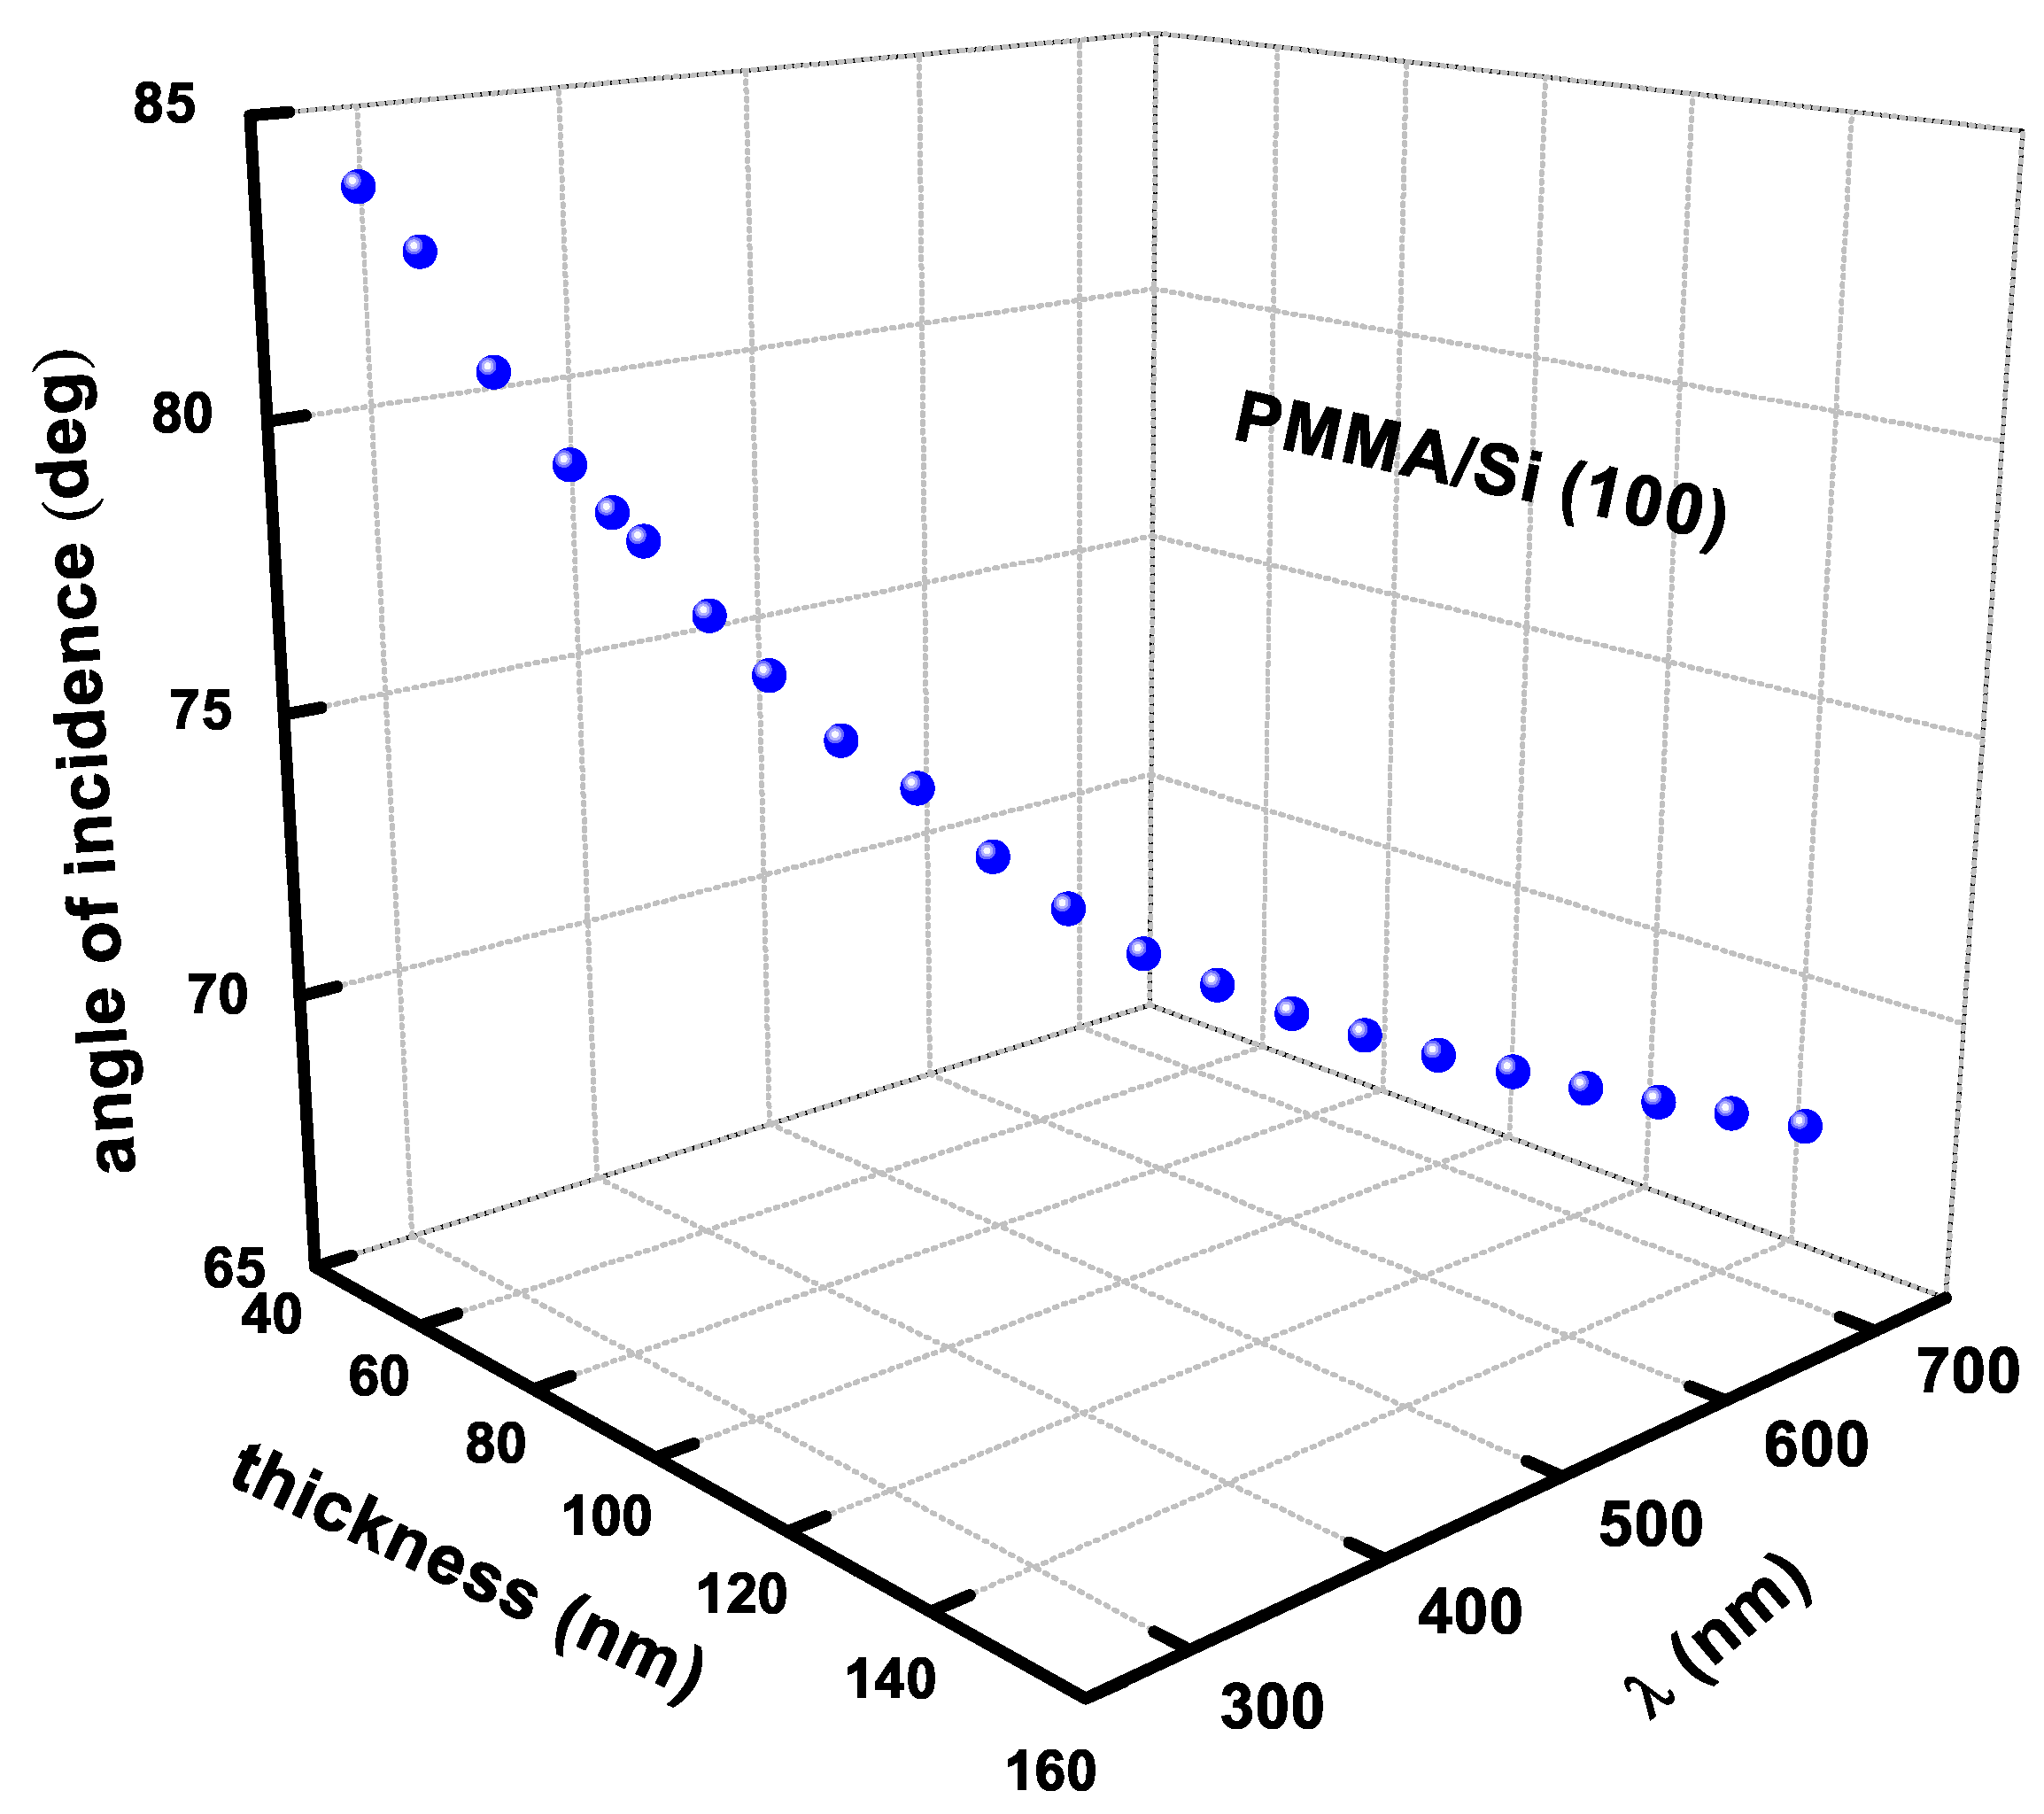
In variable-angle spectroscopic ellipsometry, the wavelength of light and the angle of its incidence can be selected to ensure optimal experimental conditions. In the selection of optimal experimental conditions, the 3D diagram shown in
Figure 1 may be helpful, in which the three coordinates
h,
and
of the drawn points define the maxima of the determinant
. We will highlight these coordinates with a label
p to indicate that they cause a peak in
D. As shown in
Figure 1, the maxima of the determinant
D for a layer thinner than 120 nm occur for incidence angles greater than 70 degrees and light wavelengths shorter than 560 nm.
Now, we will discuss the results for the coefficients
,
and
, defined in Equations (24) and (25), and appearing in Equations (28) and (29), which have a large impact on the accuracy of LTEC and TOC determination.
Figure 2a–f show the spectral dependence of these coefficients for six films with thicknesses of
h = 120, 90, 80, 70, 60 and 55 nm, respectively, at the indicated incidence angles
detuned from the corresponding
by 1°. We use this small incidence angle shift to avoid the singularity in
that occurs when
approaches zero. Additionally, in these charts, we have marked with dashed lines the values of
for these factors. This value is somewhat arbitrary, but should be as low as possible to ensure the greatest possible accuracy in determining the LTEC value. Therefore, it results from a compromise between the desired accuracy and the spectral width of the measurement window needed to determine the values
and
caused by temperature changes. Thus, we can see that if we want the values of these coefficients in Equations (28) and (29) not to exceed
for a given sample, then we should properly select the spectral window and the light incidence angle. In particular, as shown in
Figure 2, the spectral windows are defined by the region containing curves for
and
bounded by the assumed values
additionally, both these curves cross zero.
Importantly, the position of this spectral window, i.e., its center and width, depends largely on the thickness of the layer and, of course, the angle of incidence of light. It should also be noted that there is clearly a narrowing of the width of the spectral window as the thickness of the layers decreases. On the other hand, for thin films with a thickness of 70 and 60 nm, two spectral windows can be identified. The main reason for this is that the spectral dependence of the coefficients
and
, defined in Equation (
24) and appearing in Equation (
28), has a minimum for the Si (100) substrate in the considered spectral range. Therefore, by limiting the value of these parameters to a certain value, here
, it may be that an appropriate spectral window will be created on both sides of this minimum.
Figure 2 shows that this situation occurs for the PMMA layer with a thickness of 70 and 60 nm.
4.1.2. Thin PMMA Films on a SiO2 Substrate
We have discussed so far the results for PMMA thin films deposited on a Si substrate. In order to reveal the role of the substrate, we also performed appropriate calculations for the PMMA deposited on a SiO
2 substrate [
24]. To facilitate the comparison, we will present the results in a similar way to above for a thin PMMA film on a Si substrate. Thus, in
Figure 3, we show the 3D graph in which the three coordinates
,
and
of the drawn points define the maxima of the determinant
As shown in
Figure 3, the maxima of the determinant
for a layer thinner than 120 nm occur for incidence angles greater than 56.76 and light wavelengths shorter than 594.5 nm. Note the opposite sign of
D, which is due to the fact that PMMA’s refractive index is greater than SiO
2. Finally, in
Figure 4, we show the spectral relationships for the coefficients
,
and
at the indicated
values. These plots are dominated by the steep and linear behavior of
and the nearly zero values of
. However, much more important is the reduction in the achievable accuracy of LTEC and TOC determination, which forced us to quadruple the accuracy thresholds to the value of
.
A detuning of the incidence angle by about 1° is actually recommended; it increases the width of the spectral windows to about 20 nm without losing accuracy. Finally, let us add that with such a reduced accuracy, the LTEC and TOC can be determined for a 70 nm-thick PMMA film on a Si substrate measured at
(instead of
as in
Figure 2) in the spectral window from 350 to 450 nm. This example clearly demonstrates the advantages of using light-absorbing substrates in ellipsometry.
4.1.3. Discussion of the Results
At this point, we would like to discuss some physical aspects of the presented results for thin polymer films deposited on light-absorbing and transparent substrates. In both of these cases, a shift in the optimal spectral windows towards shorter light waves is clearly visible. An explanation for this fact can be found in the coefficient taking into account the difference in the optical paths of light reflected from the upper and lower surfaces of the film, see Equations (A1) and (A6), as it depends on the thickness of the film. Since this coefficient is also inversely proportional to the length of the incident light wave, its constant value forced by the interference condition leads to such an effect. This blue shift in the optimal spectral window can have a significant impact on the accuracy of the determination of LTECs and TOCs of thin films with the thickness range of 50 to 150 nm considered here. Moreover, it turns out that the determined spectral windows for precise LTEC determination are narrow, because only does not dominate in them. However, it is worth emphasizing the observed possibility of a more precise determination of the LTEC for layers with thicknesses of 60–70 nm, deposited on the Si substrate, which have two optimal spectral windows. Let us also note that the extended linear analysis of temperature-dependent ellipsometry developed here can be considered a convenient method for determining the thermoptic parameters LTEC and TOC, as it is based on the values of the coefficients , and determined at the reference temperature and for raw ellipsometric data.
4.1.4. Validity of the Linear Approximations
Guided by the need to determine the values of thermoptic parameters with the greatest possible accuracy, in this work, we have developed an appropriate mathematical analysis that facilitates this task. This analysis is based on a linear approximation of the exact ellipsometry equation (Equation (
11)). This also applies to the presented analysis of the accuracy of determining the LTEC and TOC, for which the correctness of the linear approximation was tacitly assumed. Therefore, it is important to check the range of temperature values for which such a linear approximation has an acceptable accuracy. For this purpose, we computed and compared the approximate (using Equation (
21)) and exact (using directly Equation (
11)) values of
for a PMMA layer with a thickness of 70 nm on a Si (100) substrate for
°C. The results of these calculation are presented in
Figure 5 and
Figure 6 for
and
, respectively, using the angle of incidence
detuned by
from the corresponding
.
As can be seen in these figures, for the assumed parameter values, the compliance of the curves calculated with the use of the EULA is excellent.
Considering that LTEC and TOC values are determined for the reference temperature, the thirty-degree spread of seems to be large enough. Of course, the width of the temperature range depends on and , so for inorganic materials which have much lower values of these parameters, may be correspondingly higher. Let us add that with the above-mentioned parameter values, the relative accuracy of the TOC determined for the 70 nm-thick PMMA film deposited on a Si (100) substrate is approximately and for the LTEC, it is


