Article

Improvement of the Electrocatalytic Properties for the Methanol Oxidation Reaction (MOR) of the CoPt Alloy

1
National Institute of R&D for Technical Physics, 700050 Iasi, Romania
2
ECE Department, University of Minnesota, Minneapolis, MN 55435, USA
*
Author to whom correspondence should be addressed.
Coatings 2024, 14(1), 17; https://doi.org/10.3390/coatings14010017
Submission received: 20 November 2023 / Revised: 15 December 2023 / Accepted: 21 December 2023 / Published: 23 December 2023
(This article belongs to the Special Issue Thin-Film Synthesis, Characterization and Properties)

Abstract

:
The commercialization of the Direct Methanol Fuel Cell (DMFC) is limited due to the high cost and low efficiency of the electrocatalysts. In this context, the development of new electrocatalysts able to efficiently oxidize the methanol and to have at the same time low price and high stability is one of the researcher’s milestones. In this work, CoPt alloys with different Pt content were prepared, and the efficiency of the alloys to be used as electrocatalysts for the methanol oxidation reaction (MOR) was investigated. Our data show that the electrocatalytic performance of the CoPt electrodeposited alloys is strongly influenced by the synthesis conditions, mainly by the potential applied during the synthesis. The best electrocatalytic activity was obtained for the samples prepared at −0.8 V/SCE.

1. Introduction

Due to the high energy density per volume units, methanol represents one of the promising fuels which can successfully replace the traditional ones (e.g., coal, oil, or natural gas) [1,2,3,4]. As a cheap fuel, methanol can be used in a Direct Methanol Fuel Cells (DMFCs) to produce energy for portable devices [5,6,7], following a complex mechanism of the Methanol Oxidation Reaction (MOR) by which six electrons are released. In this context, the development of a new class of catalysts able to efficaciously convert the methanol and to work as an anode in the DMFC device and, at the same time, to be highly active, to have a low price, and to have good stability is one of the challenges of the scientific community [8,9,10,11,12]. The standard catalyst commonly used for methanol oxidation is platinum (Pt) [13,14,15] but, unfortunately, the Pt catalyst surface is rapidly poisoned leading to a decrease in the catalysts active surface [16,17]. In order to avoid this process, a new class of MOR catalysts has been developed by alloying the Pt with Ru and by a preparation of binary catalysts [18,19,20,21,22]. Despite the good catalyst properties of the PtRu alloys, this class of catalysts has the disadvantage that Ru, as the Pt, is also a rare metal, its scarcity being higher than that of the Pt, leading to a higher price for the catalyst. In this context, the development of new classes of catalysts, being able to efficiently oxidize the methanol via MOR, possessing good resistance to the surface poisoning, and to be used as an anode in the DMFC is highly necessary. One of the approaches implemented by the research community is the replacement of Ru with Co, leading to the formation of CoPt catalysts [23,24,25]. The Co is also known as an oxophilic metal in the binary catalysts and has the advantage of being a cheap metal, leading to a decrease in the catalyst price. The CoPt alloys can be synthesized by several routes, among which we can mention the chemical reduction, electrochemical deposition or micellar technique [26,27,28,29,30,31].
Numerous studies are present in the literature on MORs catalyzed by PtM (where M represents Cu, Co and Fe) alloys in order to determine optimal alloy composition, particle size, particle shape or alloy crystalline structure. For example, the study reported by Zhu and co-workers [23] offers an efficient method for controlling the catalytic activity in an MOR through the development of suitable operating temperatures and magnetic fields. The synthesis of CoPt alloy nanoparticles, their activation, and the catalytic assessment for MOR were all described by Liu and colleagues. In the refluxing process, the authors explain how initial CoPt alloys with a Pt/Co ratio of 1/2 transform into stable alloys with a Pt/Co ratio of 3/1. The resulting Pt3Co particles display higher activity for MOR compared with commercial Pt/C and PtRu/C, respectively [32]. The effectiveness of Pt100–x(MnCo)x (16 < x < 41) catalysts toward MOR was examined by means of cyclic voltammetry and chronoamperometry [33]. Huang and co-workers demonstrated that the Pt/CoPt composite catalysts’ high dispersion, high alloying degree, and “clean” surface all led to their remarkable electro-catalytic activity and stability for the MOR [34]. Zhang and collaborators [35] developed a synthesis method in order to dope PtM alloys with nickel hydroxide onto nitrogen-doped graphene. The data indicated that the proposed electrocatalysts presents activity and stability toward MOR in alkaline conditions.
Recently, our group has published a study demonstrating that the electrodeposited CoPt alloy electrocatalytic activity can be increased from 10 to 85 mA cm−2 by controlling the electrodeposition bath composition [36]. The best electrocatalytic efficiency has been obtained for the CoPt nanowires prepared from the electrolyte at pH = 5.5, with saccharine addition and with all samples being prepared by applying an electrodeposition potential of −0.8 V/SCE (Saturated Calomel Electrode). When added to the electrochemical bath, saccharine, an additive used as a smoothing and stress-relieving agent, has a significant impact on the morphology, internal stress, hardness, microstructure, and crystalline structure of the materials that are prepared. Li and collaborators [37] have proved that the hard-magnetic CoPt nanoparticle manifest improved catalytic properties and stability under fuel cell conditions. The origin of this behavior resides in the crystalline structure of the hard-magnetic particles. Our group [38] has developed a new synthesis method of the CoPt alloys, able to prepare the hard-magnetic phase directly and without performing the thermal treatment. The aim of this study is to develop highly active electrocatalysts for the MOR, based on a CoPt electrodeposited alloy with a hexagonal structure obtained without additional annealing treatment by using the synthesis method developed by our group. More specifically, we have prepared, by electrodeposition, a CoPt alloy in the shape of thin films, and we tested the alloy’s capability to be used as a catalyst for the MOR. Firstly, the catalyst’s morphology, composition and crystalline structure function under the synthesis condition was determined by different techniques: Scanning Electron Microscopy (SEM), Atomic Force Microscopy (AFM), Energy-Dispersive X-ray Spectroscopy (EDX), X-ray Diffraction (XRD). Further, the electrocatalytic activity and the stability of the as-prepared materials was tested by cyclic voltammetry (CV) and chronoamperometry (CA) techniques. We found that the electrocatalytic performance of the CoPt electrodeposited alloys is strongly influenced of the synthesis conditions, more precisely by the potential applied during the synthesis. The best electrocatalytic activity was obtained for the sample prepared at −0.8 V/SCE.

2. Materials and Methods

2.1. Thin Film Electrodeposition

The CoPt thin films were prepared by electrodeposition from a hexachloroplatinate CoPt-aqueous solution, at pH 5.5. The electrochemical bath, containing 0.4 M H3BO3, 0.3 M NH4Cl, 0.1 M CoSO4·7H2O, 0.00386 M H2PtCl6, and 0.00389 M saccharine as Na salts, was prepared according to the procedure previously proposed by Tabakovic and co-workers [38]. In this work, the CoPt alloy was electrodeposited onto 0.5 cm2 area of Ta (5 nm)/Pt(5 nm)/Ru(75 nm) substrate thin film and sputtered on oxidized Si wafer. The electrodeposition was performed under controlled potential, by using a Bipotentiostat/Galvanostat HEKA PG 340 (Heka, Reutlingen, Germany). Five different samples were electrodeposited applying different pulse potentials ranging from −0.6 V/SCE to −1.0 V/SCE during 2.5 s time-on and 1 s time-off as “rest” potential of −0.1 V/SCE, necessary for the recovery of the diffusion layer after the electrodeposition. Prior to the CoPt thin films preparation, argon gas was purged in the electrochemical cell in order to remove dissolved oxygen. For an electrochemical cell, we used a home-made cell formed by three electrodes that consist of Pt wires as counter electrodes, an SCE as reference (R.E.) and the Si/SiO2/Ta(5 nm)/Pt(5 nm)/Ru(75 nm) thin layer as working electrode.
Due to the fact that the alloys electrodeposition rate is a function of the applied potential, the electrodeposition rate was determined for each different potential, in separate experiments. The CoPt thin film’s thickness was measured by profilometry, using a KLA Tencor Alpha Step IQ stylus-based surface profiler (KLA Corporation, Milpitas, CA, USA).

2.2. Characterization Methods

The microstructure of the thin layer surface was analyzed by high-resolution scanning electron microscopy (HR-SEM) (using a CrossBeam System Carl Zeiss NEON40EsB/ Oberkochen, Baden-Württemberg, Germany) and by atomic force microscopy (AFM) (using an AFM XE-100 from Park Systems, Suwon, Republic of Korea). The alloy’s composition was determined by EDX measurements using the same HR-SEM system, while the crystalline structure of the samples was analyzed by X-ray diffraction (XRD) (by means of a Bruker AXS D8-Advance X-ray Diffractometer/Bruker, Karlsruhe, Germany) with parallel optical geometry, using Cu Kα radiation).
Transmissions electron microscopy (TEM) analyses were performed by using an ultra-high-resolution transmission electron microscope (UHR-TEM) LIBRA®200MC (Carl Zeiss GmbH, Germany). For the TEM samples preparation, Gatan Dimple Grinder (Model 656/Gatan, Pleasanton, CA, USA) and a Gatan’s Precision Ion Polishing System (PIPS Model 691/Gatan, Pleasanton, CA, USA) were used.
The electrochemical characterization of the CoPt samples was performed by using cyclic voltammetry (CV) and chronoamperometry (CA), using the same home-made cell as for electrodeposition, utilizing a Gamry Reference 600TM (Potentiostat/Gamry Instruments, Warminster, PA, USA). Working electrodes having the same geometric surface area (0.5 cm2) for all the analyzed samples were utilized during the tests in order to compare the electrocatalytic properties of the samples. For all measurements, the cyclic voltammetry as well as the chronoamperometry experiments were performed in an aqueous solution of 2.0 M CH3-OH and 0.1 M H2SO4 at scan rates of 100 mV/s.
The evaluation of the electrochemical area (ECS) was performed using the Randles-Sevcik equation and cyclic voltammetry, the procedure being previously described [39,40,41].

3. Results and Discussions

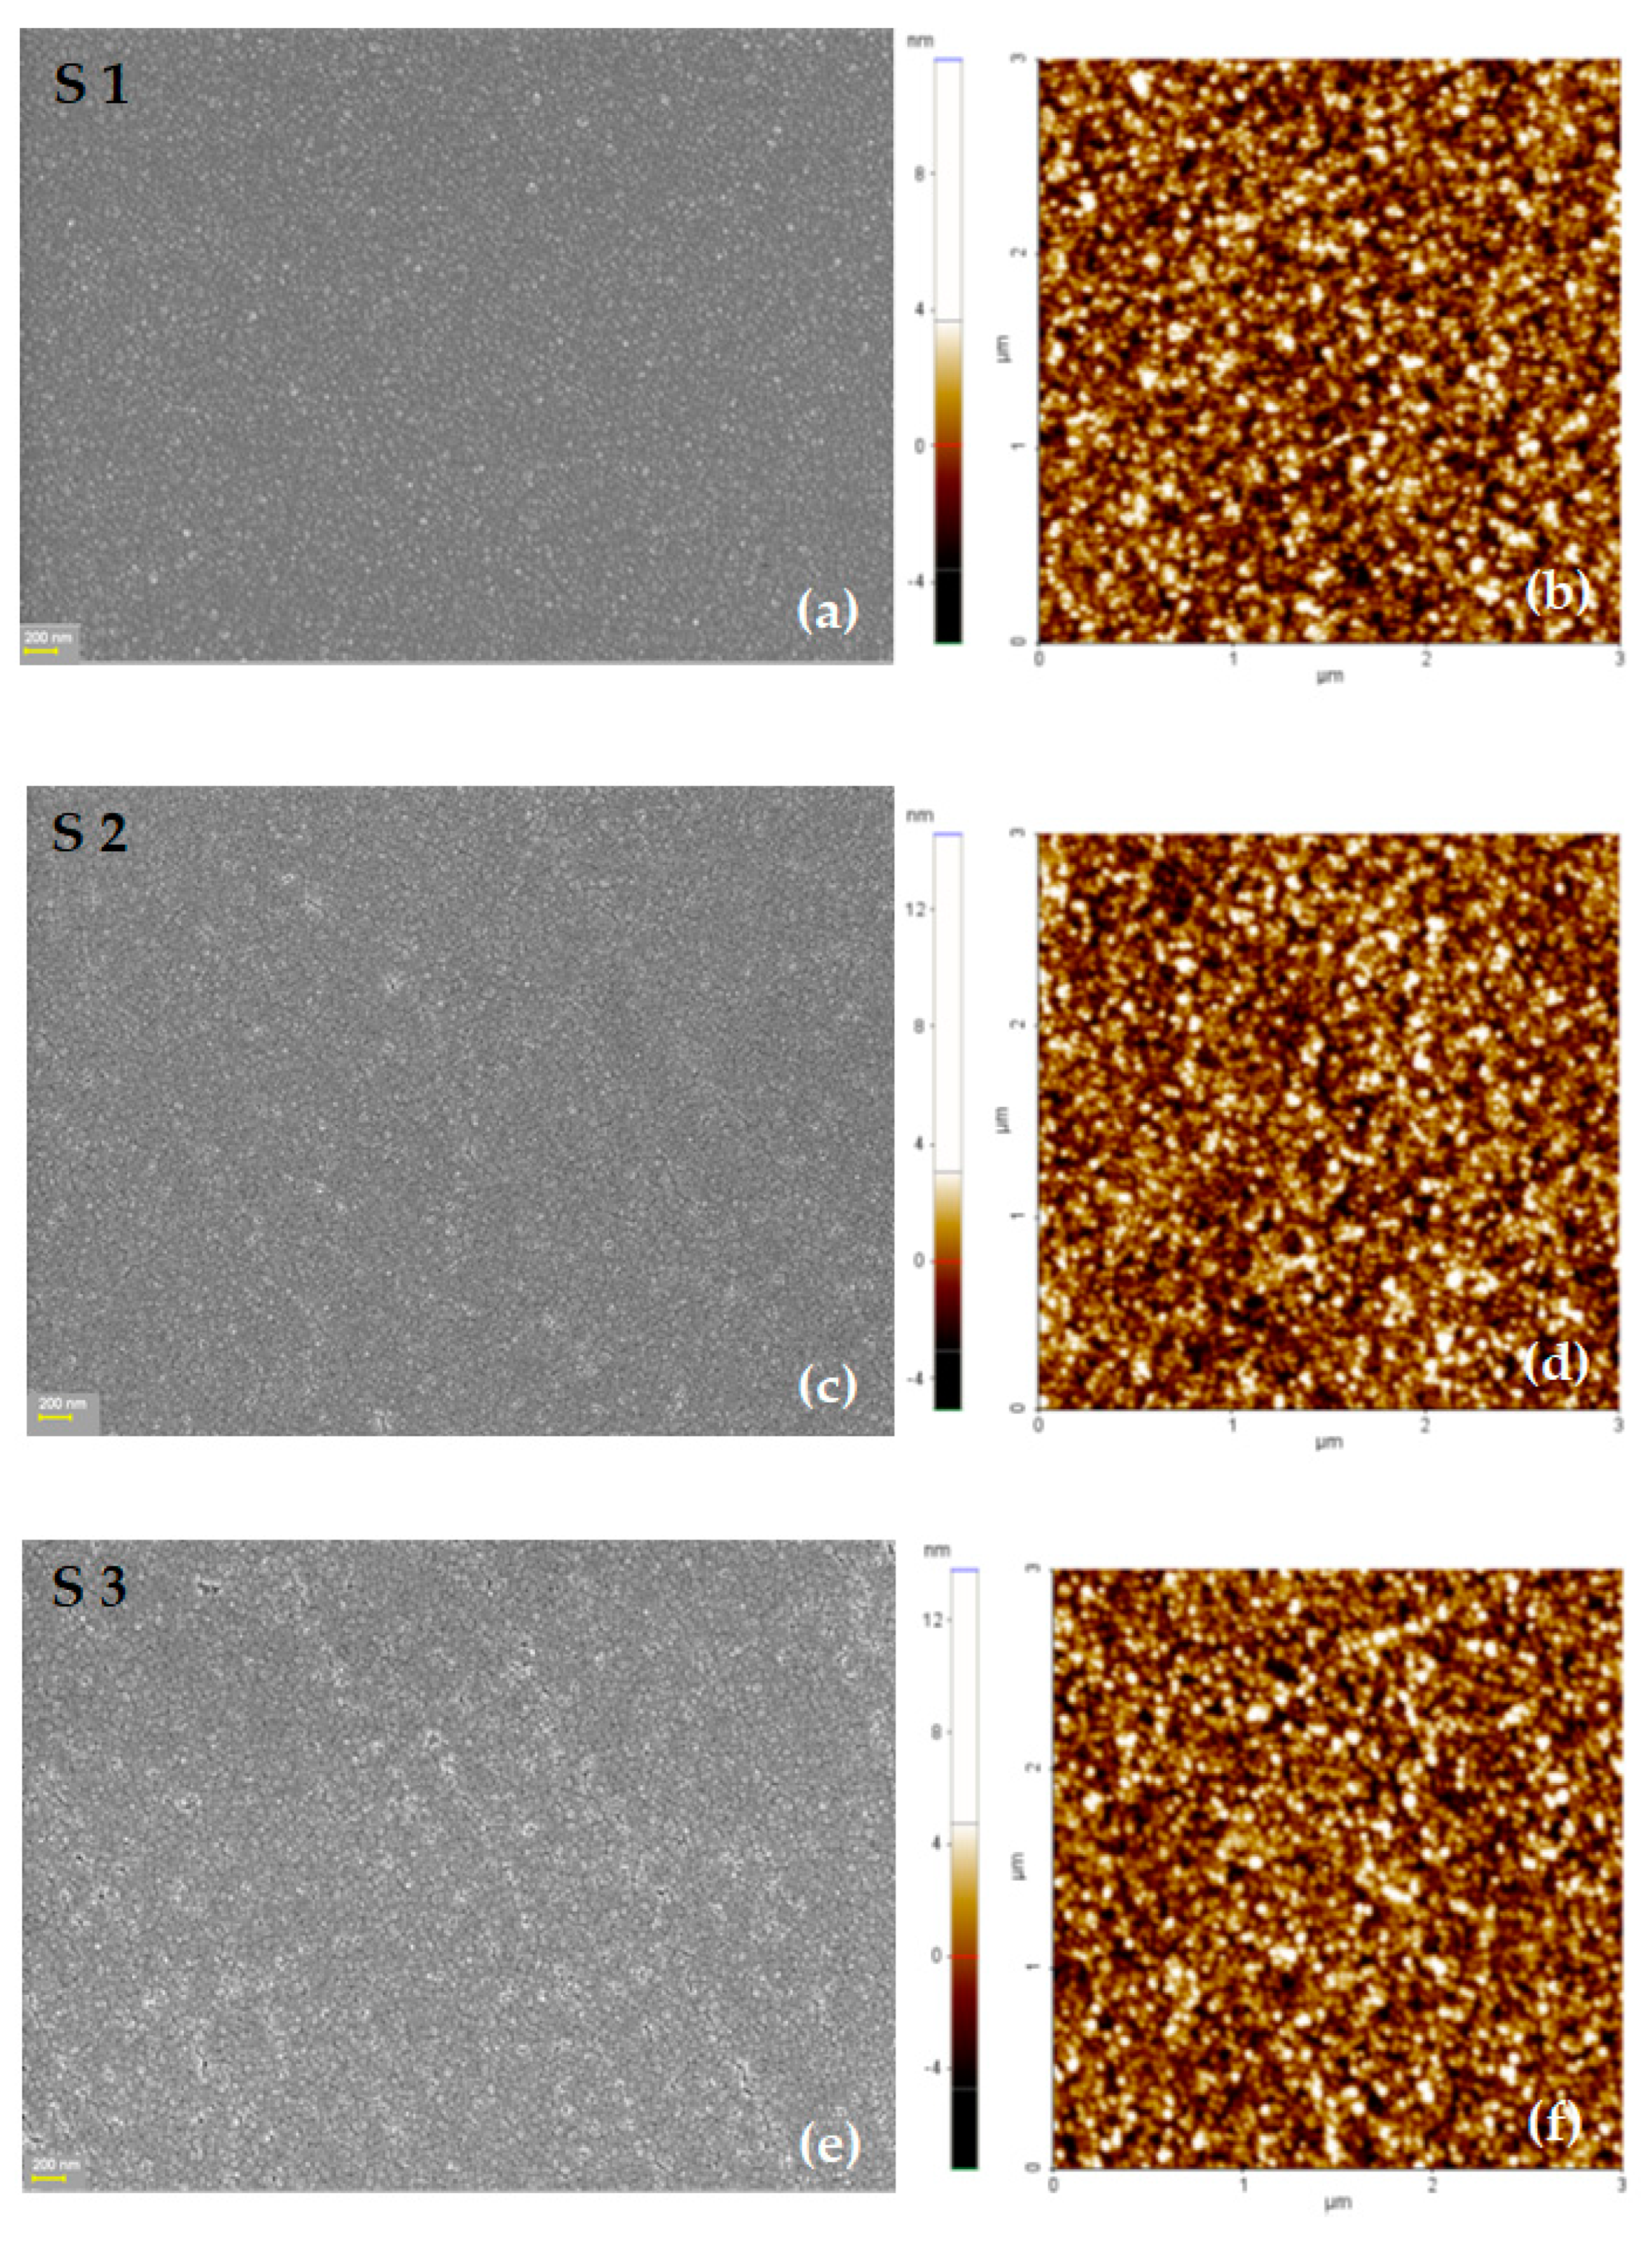
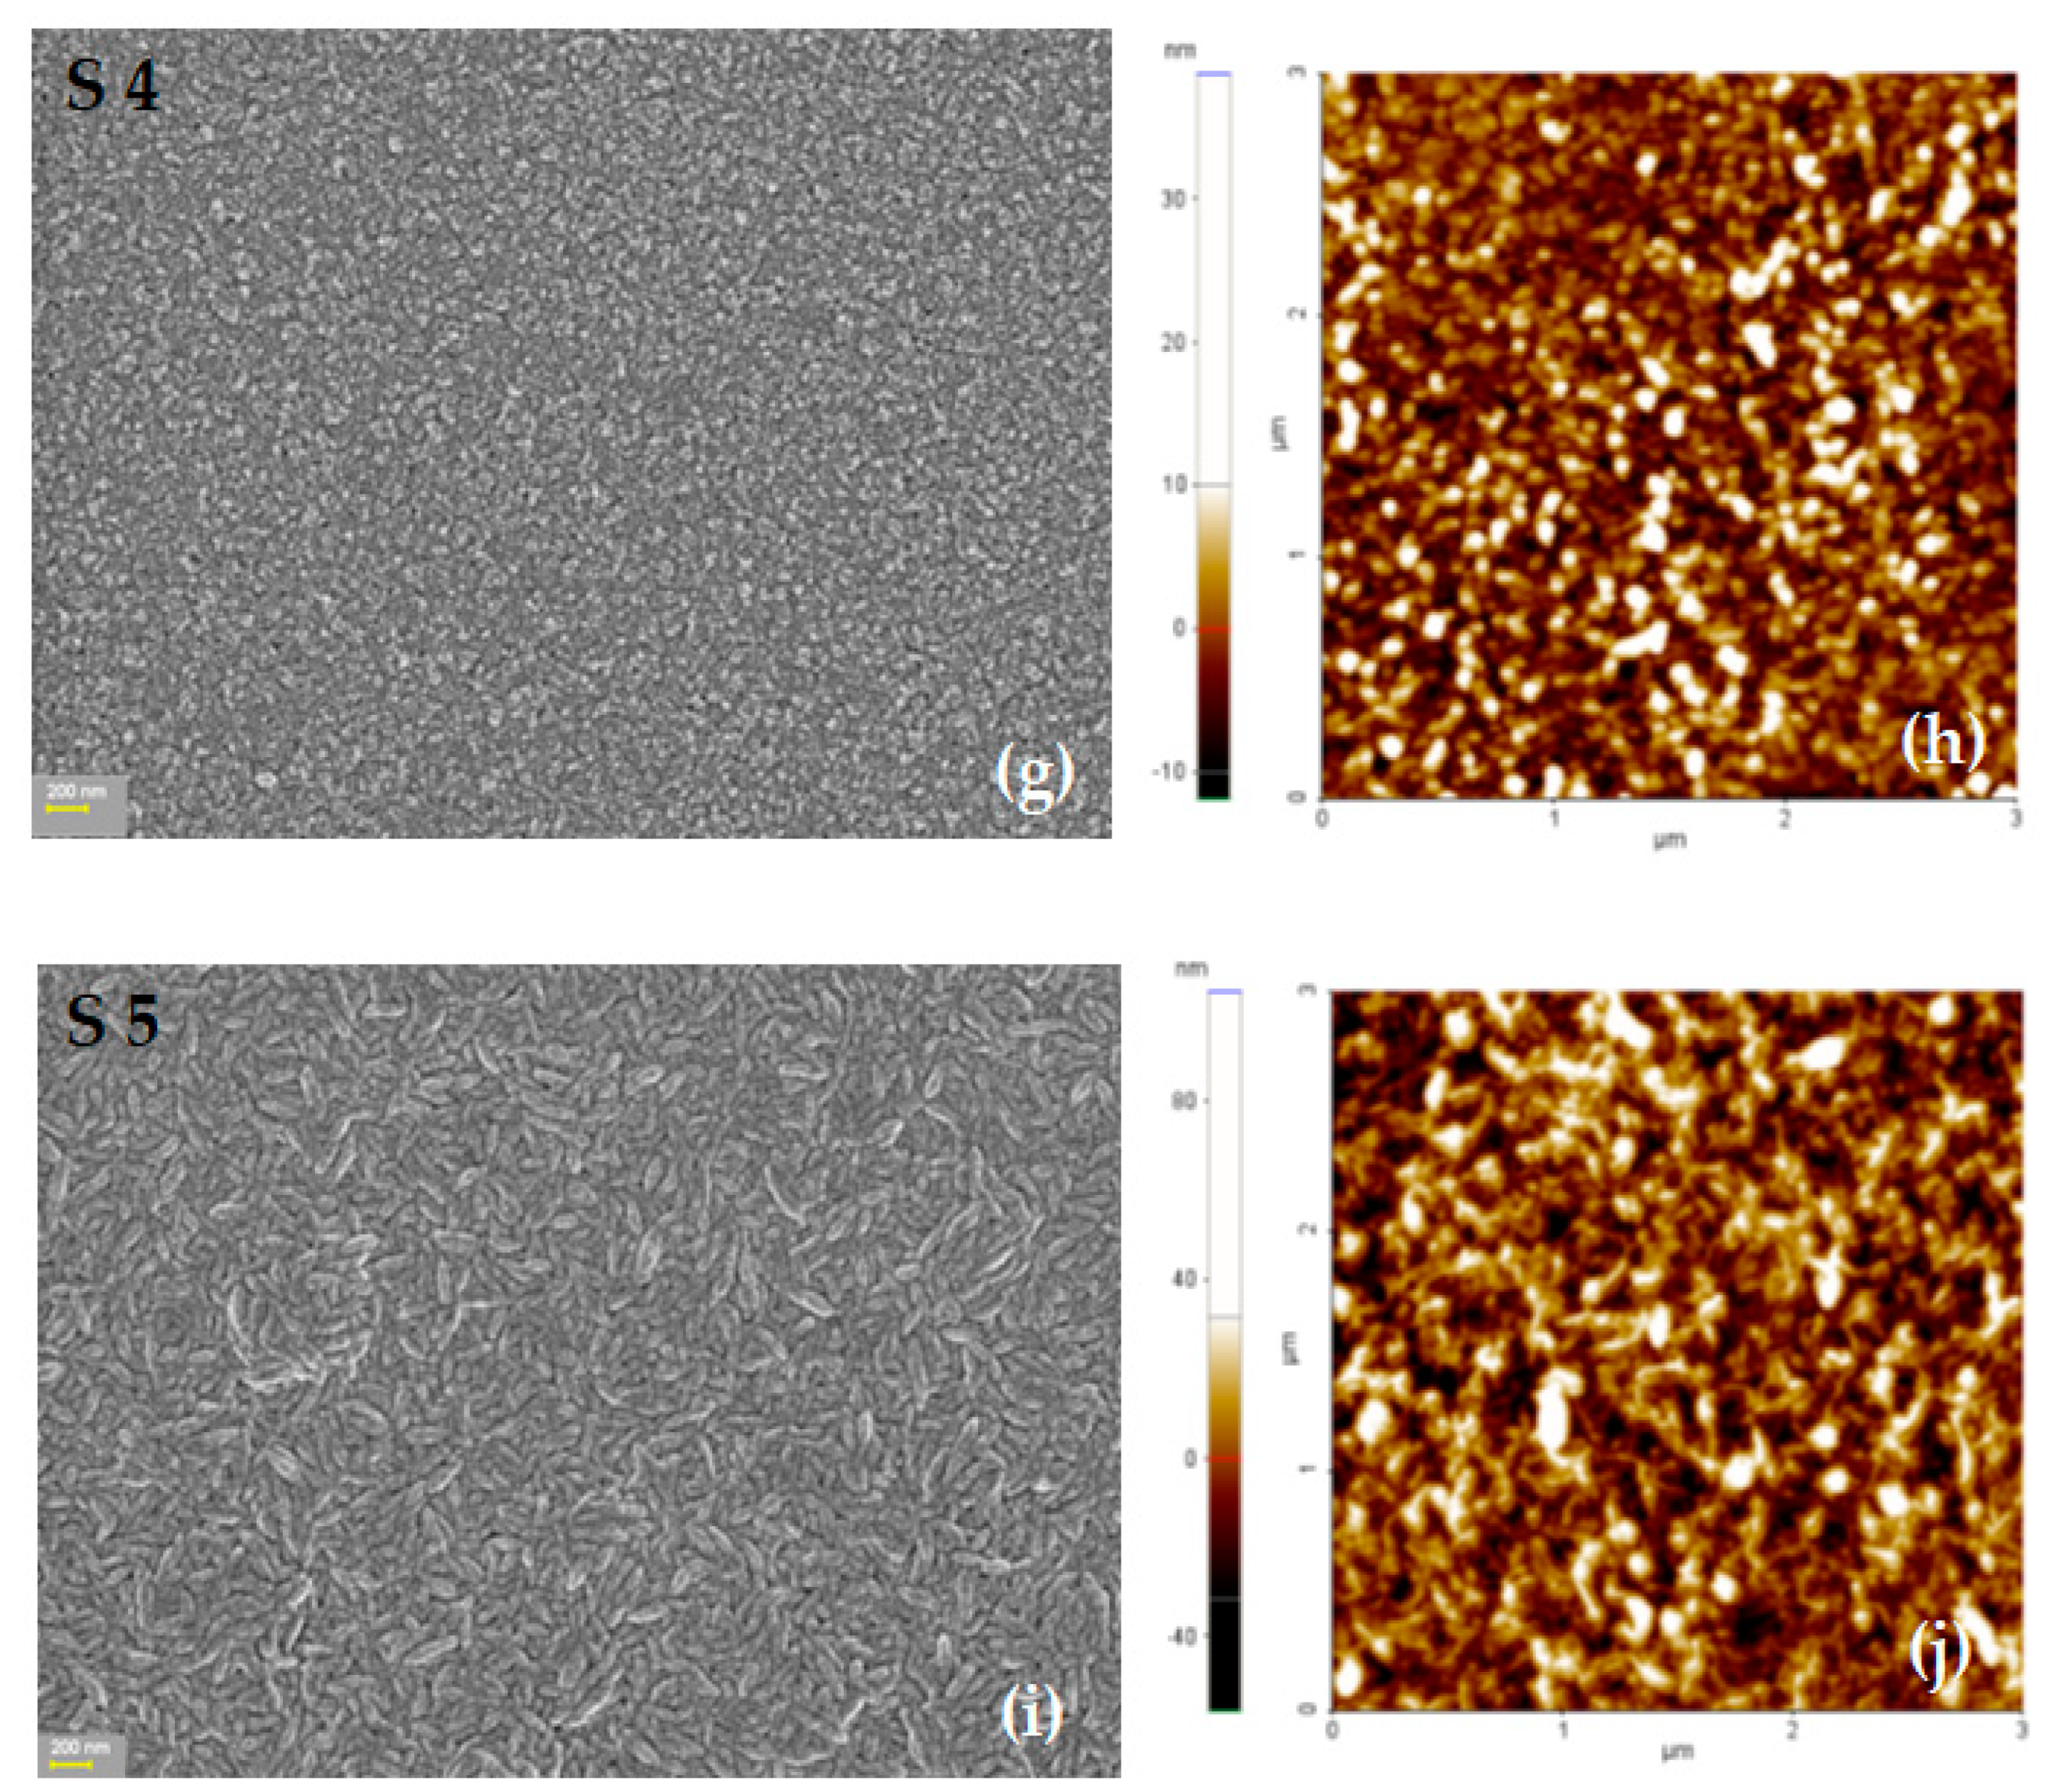
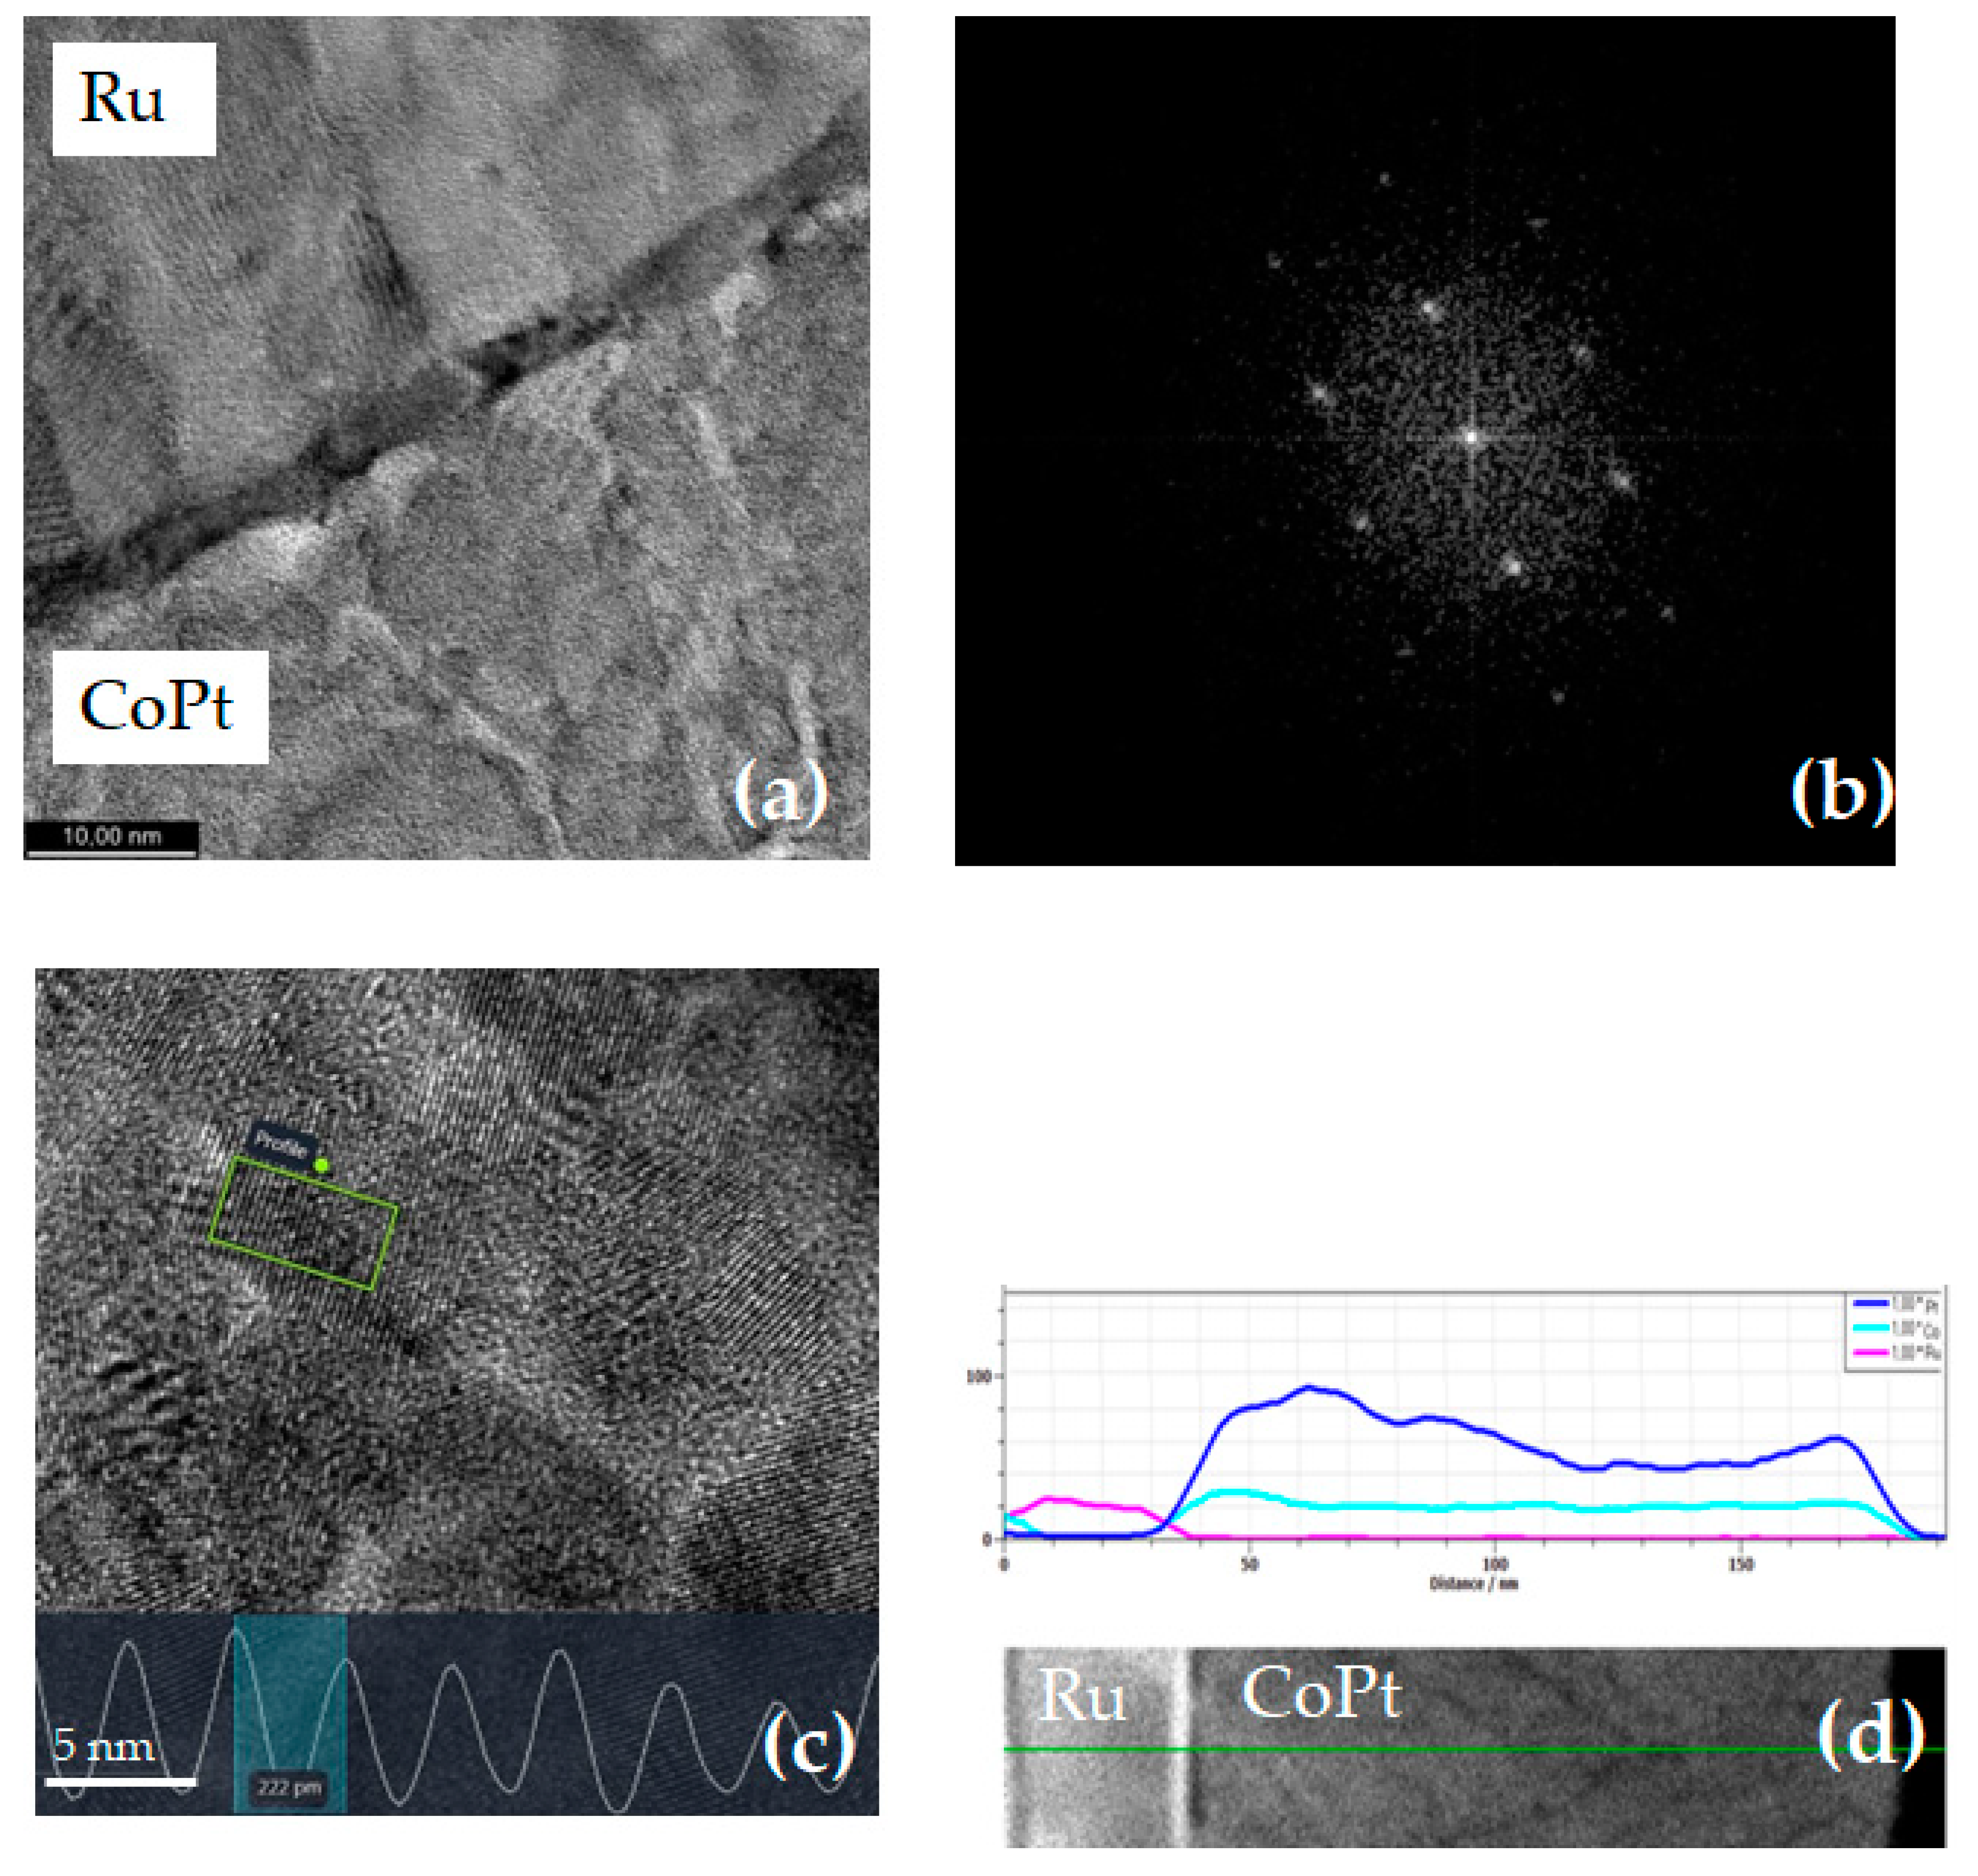
3.1. CoPt Thin Films Morphological and Compositional Characterization

Figure 1 presents the dependence of the electrodeposition rate of the CoPt alloy (expressed as a ratio of the thin film thickness (nm) vs. time) as function of the applied potential. The results clearly show that the electrodeposition rate increases with the increase in the value of the applied potential.
The effect of the applied potential on the as-prepared CoPt thin film microstructure was analyzed by using SEM and AFM techniques, the results being presented in Figure 2.
As can be observed from Figure 2, the electrodeposition potential strongly influences the thin layer microstructure. Thus, the CoPt thin layer prepared at low potential values (S1–S3 samples) consists of spherical grains, while the particles of CoPt electrodeposited at high potential values (S4–S5 samples) present an elongated shape. The thin layer grain size is also a function of the applied potential during the electrodeposition: it increases with the increase in the potential value. However, as can be observed on the SEM and AFM images presented in Figure 2a–f, the grains size of the S1–S3 samples slowly increases with the increase in the electrodeposition potential. On the other hand, the grain size of samples S4–S5 are larger than those of samples S1–S3 (as can be observed in Figure 2g–j). This behavior also influences the thin layer’s roughness factor, calculated from the AFM data, which varies from 1.34 nm for the thin layers prepared at −0.6 V/SCE to 12.43 nm in the case of the CoPt thin layers prepared at −1.0 V (the data are presented in Table 1), for a substrate roughness factor is 0.90 nm.
A strong influence of the electrodeposition potential value on the composition of the as-deposited CoPt alloys has also been observed, the results being presented in Table 1. The evaluation of the electrochemical area (data presented in Table 1), carried out by using the Randles–Sevcic equation and cyclic voltammetry, shows a small influence of the electrodeposition potential on the sample’s electrochemical area.
As can be observed from the data presented in Table 1, the CoPt alloy composition is strongly influenced by the value of the applied potential at which the electrodeposition takes place. Thus, the Pt content of the alloy decreases from 80% to 10% when the value of the applied potential increases from −0.6 V/SCE to −1.0 V/SCE. At the same time, with the decrease in the Pt content in the CoPt alloy, the thin-layer roughness factor increases. The increase in the CoPt thin layer roughness factor is strongly related to the increase in the Co content of the alloy, which leads to an increase in the grain size. This effect was previously observed by Tebbakn and co-workers [42].
The XRD data (Figure 3) shows that the CoPt electrodeposited thin films have a hexagonal crystalline structure, and the diffraction peaks at 2Θ = 43.6° and 2Θ = 69.5° and can be indexed as (002) and (110) hexagonal structures. Since both the Ru substrate and the electrodeposited CoPt thin layers have a hexagonal structure, there are very small differences on the peak’s positions on the diffractograms.
In order to better observe the crystalline structure of the materials and to show once more the fact that the samples crystalize in hcp system, we used the TEM. At the same time, in addition to the information’s on the crystalline structure, we obtained information about the microstructure, composition and homogeneity of the CoPt alloy material. To be visualized with TEM, the sample was prepared by a mechanical method, which goes through several steps. The schematic diagram of the TEM sample preparation is presented in Figure S1. In the first step, the thin film is cut and glued face to face, forming a sandwich with EPON 353ND (G1) resin. Then, the sample is mechanically polished with SiC abrasive paper (600 ÷ 4000 grit) until the sandwich thickness reaches 150 µm. In the next step, a disc with a diameter of 3 mm is cut using a homemade cutting tool. The disc is then polished by hand until the sample thickness is less than 100 µm, followed by dimpling the center of the sample using the Gatan Dimple Grinder (Model 656) until the sample thickness in the middle of the disc is approximately 10÷15 µm (according to color Si [43,44]). During the last step, the sample is fixed on the TEM copper grid with EPON 353ND resin (G1) and polished with argon ions in the Gatan’s Precision Ion Polishing System (PIPS Model 691). After the final polished step, the sample surface was observed by the TEM. The results obtained on the S3 sample are presented in Figure 4 (the S3 sample was chosen since this sample presents the best electrocatalytic properties as it will be showed further).
The lattice fringes in processed high-resolution TEM images indicate that the CoPt alloys are crystalline, the crystallites grains following the crystalline orientation of the Ru substrate (Figure 4a,b). Also, the analysis of the high-resolution TEM images (determined for the area from the green rectangle from the image presented in the Figure 4c), reveals that the particles have a lattice d spacing of 2.22 Å, matching the d-spacing in the (110) plane of CoPt with a hexagonal structure, according to the 1524154 cif file in Crystalography Open Database. Furthermore, the electron diffraction pattern (Figure 4c) demonstrates that the crystallites of the CoPt alloys in the shape of thin films are hcp. The EDX analysis carried out by the TEM shows that the electrodeposited alloys contain only Co and Pt, being well separated from the Ru support (Figure 4d). The data of the EDX analysis were acquired along the green line drawn on the image in the Figure 4d.

3.2. CoPt Thin Films Electrocatalytical Characterization

The cyclic voltammetry (CV) in an aqueous solution of 2.0 M CH3-OH and 0.1 M H2SO4 was used in order to investigate the electrocatalytic capability of the CoPt alloy in the shape of thin films, for MOR. All the CV curves were traced at scan rates of 100 mV/s. The obtained results are presented in Figure 5 (in all the graphs on the y-axis the parameter reported is the Current density (mA/cm2)).
The obtained data show that the electrodeposition potential strongly affects the electrocatalytic behavior of the as-prepared samples. Thus, for the samples prepared at small potential values, the maximum peak value slightly decreases from the 1st cycle to the 5th one (with 2.0% for the sample S1, prepared at −0.6 V, and with 5% for the sample S2, prepared at −0.7 V, respectively). This behavior is probably related to the high Pt concentration of the samples. During the MOR experiment, the sample surface is poisoned, leading to a decrease in Pt sites and, consequently, to a decrease in electrocatalytic activity. The samples prepared at high potential values present a high decrease in the maximum peak value (with 13% for the sample S4, prepared at −0.9 V, and with 30% for the sample S5, prepared at −1.0 V) due to the high Co content of the samples which leads to the dissolution of the samples during the CV experiments. A different behavior was obtained for sample S3, prepared at −0.8 V. In this case, the peak intensity value increases from the first cycle of the CV experiments to the fifth one with 25%, showing that this sample has the optimum characteristics to be used as catalysts for MOR. Despite the fact that samples S2 and S3 present similar physical properties, the catalytic activity of these two samples is different. This behavior is due to the different Co content in the samples (see Table 1), which leads to better catalytic performances of the alloy. This observation was also found by Mizutani and Ishibashi [45], which shows that the catalytic activity of the CoPt decreased with the increase in the Pt:Co ratio in the alloys.
The electrocatalytic activity for the methanol oxidation of the as-prepared CoPt alloys is a function of the surface properties of the thin films and not of the electrochemically active surface area (ECSA), since all the samples possess the same ECSA, 0.8 cm2. Table 2 summarizes the electrocatalytic parameters of the CoPt alloys.
The same evolution of the electrocatalytic activity of the CoPt electrodeposited alloys can be observed from the chronoamperometric measurements. The CA curves obtained at 0.6 V vs. SCE at room temperature in an aqueous solution of 2.0 M CH3-OH and 0.1 M H2SO4 are presented in Figure 6. Prior to the experiments, the electrolyte was de-aerated using argon gas.
As can be observed in Figure 6, the electrocatalytic activity of samples S1 (electrodeposited at −0.6 V) and S2 (electrodeposited at −0.7 V) rapidly decreases at the beginning of the experiment until the equilibrium value is reached, with the current staying stable until the end of the experiment. The electrocatalytic behavior of sample S4 (electrodeposited at −0.9 V) and of sample S5 (electrodeposited at −1.0 V) is different from those of S1 and S2: it rapidly decreases to 0 mA in the first minutes of the experiments. In contrast with the electrocatalytic behavior of samples S4 and S5, for sample S3, the electrocatalytic efficiency increases for the first 25 min at the beginning of the experiments, after which it decreases slowly, reaching an equilibrium value similar to that of sample S2. The results obtained by CA are in good agreement with those obtained by CV.
In order to understanding the electrocatalytic behavior of the CoPt thin layers, we analyzed the microstructure and the composition of the samples after performing the MOR experiments for 1000 min. The SEM analysis shows that the microstructure of samples S1–S3 does not present visible changes, as can be observed in Figure 7. The EDX measurements carried out on the surface of samples S1–S3 after the MOR experiments show a very small difference of +/−2% in the alloy composition.
Taking into account the obtained results, we can conclude that the surface of samples S1–S3 does not present major changes in terms of microstructure and chemical composition before and after performing the MOR experiments. A different behavior was observed by analyzing the surface of the S4–S5 samples after performing the MOR experiments. Thus, during the methanol oxidation experiments, the sample’s surface was completely dissolved, the EDX analysis showing the presence of the seed layer only. Since sample S5 presents a very different microstructure from that of the substrate, this sample was chosen as example to show the thin layer dissolution during the MOR. Figure 8 presents the surface of sample S5 before (a) and after (b) performing the MOR.

4. Conclusions

In conclusion, we report the influence of the synthesis parameters (the applied potential) on the electrocatalytic properties for the MOR of the CoPt thin films in the shape of thin layers. CoPt thin films with controlled thickness were prepared by pulse electrodeposition at different controlled potentials, ranging from −0.6 V/SCE to −1.0 V/SCE. The electrochemical bath contains a stable hexachloroplatinate solution at pH = 5.5, with a saccharine addition. The EDX analysis of the as-prepared samples shows that the Pt content of the alloy is a function of the applied potential. By adjusting the potential values during the electrodeposition, the Pt content in the alloy can be varied from 10% to 80%. The increase in the electrodeposition applied potential from −0.6 V/SCE to −1.0 V/SCE is accompanied by a decrease in the Pt content in the electrodeposited alloy. The variation in the alloy composition influences the thin layer microstructure. As was shown by SEM and AFM analysis, the grain size and the surface roughness factor increase with the decrease in the Pt content in the alloy. Although all the as-prepared samples manifest electrocatalytic activity, the electrodeposition potential strongly influences the electrocatalytic efficiency of the CoPt thin films for MOR. Thus, the samples prepared at low applied potential values, which have a high content of Pt, present a small decrease in the electrocatalytic efficiency, due to surface poisoning. In contrast, for the samples prepared at high applied potential values, the electrocatalytic activity rapidly decreases to zero, due to the dissolution of the alloy in the acidic media. The best electrocatalytic activity was obtained for the sample Co30Pt70 prepared at −0.8 V/SCE. For this sample, our measurements show that the electrocatalytic activity increases at the beginning of the experiment until reaching the equilibrium value, and stays stable for at least 1000 min.

Supplementary Materials

The supporting information can be downloaded at: https://www.mdpi.com/article/10.3390/coatings14010017/s1. Figure S1: Schematic diagram of the TEM sample preparation.

Author Contributions

Conceptualization, O.-G.D.-P.; methodology, O.-G.D.-P., I.T. and L.R.; formal analysis, L.R. and G.B.; investigation, O.-G.D.-P., L.R., G.B., I.T. and N.L.; resources O.-G.D.-P.; writing—original draft preparation, O.-G.D.-P.; writing—review and editing, O.-G.D.-P., G.B., I.T. and N.L.; supervision, O.-G.D.-P.; project administration, O.-G.D.-P.; funding acquisition, O.-G.D.-P. All authors have read and agreed to the published version of the manuscript.

Funding

This work was supported by a grant of the Ministry of Research, Innovation and Digitalization, CNCS-UEFISCDI, project number Project PN-III-P4-PCE-2021-1395/GreenEn, within PNCDI III.

Institutional Review Board Statement

Not applicable.

Informed Consent Statement

Not applicable.

Data Availability Statement

Data are contained within the article.

Acknowledgments

The authors thank Marieta Porcescu, Gabriel Ababei and Tiberiu Roman for their help and fruitful discussions about the results.

Conflicts of Interest

The authors declare no conflicts of interest.

References

  1. Zhang, X.; Hui, L.; Yan, D.; Li, J.; Chen, X.; Wu, H.; Li, Y. Defect Rich Structure Activated 3D Palladium Catalyst for Methanol Oxidation Reaction. Angew. Chem. Int. Ed. 2023, 62, e202308968. [Google Scholar] [CrossRef] [PubMed]
  2. Song, K.; Kim, J.; Kim, D.; Hong, S.; Kim, K.-J.; An, K.; Park, J.Y. Enhancing catalytic performance and hot electron generation through engineering metal-oxide and oxide-oxide interfaces. Catal. Today 2024, 425, 114306. [Google Scholar] [CrossRef]
  3. Luo, F.; Wu, J.; Chen, X.; Qiao, L.; Feng, W.; Liu, X.; Wu, X. Constructing a CrCoNi medium entropy alloy coordinated Pt ultrathin film as durable electrocatalysts for methanol oxidation reaction. J. Colloid Interface Sci. 2023, 651, 9–17. [Google Scholar] [CrossRef] [PubMed]
  4. Berretti, E.; Osmieri, L.; Baglio, V.; Miller, H.A.; Filippi, J.; Vizza, F.; Santamaria, M.; Specchia, S.; Santoro, C.; Lavacchi, A. Direct Alcohol Fuel Cells: A Comparative Review of Acidic and Alkaline Systems. Electrochem. Energy Rev. 2023, 6, 30. [Google Scholar] [CrossRef]
  5. Wang, S.; Sheng, T.; Yuan, Q. Low-Pt Octahedral PtCuCo Nanoalloys: “One Stone, Four Birds” for Oxygen Reduction and Methanol Oxidation Reactions. Inorg. Chem. 2023, 62, 11581–11588. [Google Scholar] [CrossRef] [PubMed]
  6. Zhou, Q.; An, Y.; Zhou, S.; Wang, Z.; Long, J.; Liao, W.; Chen, M.; Wang, Q. Precisely tuning the electronic structure of ordered PtFe alloy supported on multi-walled carbon nanotubes for enhanced methanol oxidation. J. Alloys Compd. 2023, 937, 168347. [Google Scholar] [CrossRef]
  7. Kim, Y.S.; Lee, J.W.; Kim, B.; Bae, J.W.; Chung, C.-H. Carbon-Neutralized Direct Methanol Fuel Cell Using Bifunctional (Methanol Oxidation/CO2 Reduction) Electrodes. Int. J. Energy Res. 2023, 2023, 9277179. [Google Scholar] [CrossRef]
  8. Iwasita, T. Electrocatalysis of methanol oxidation. Electrochim. Acta 2002, 47, 3663–3674. [Google Scholar] [CrossRef]
  9. Paredes-Salazar, E.A.; Calderón-Cárdenas, A.; Varela, H. Microkinetic Modeling of the Methanol Electro-oxidation Reaction on Platinum. ACS Catal. 2023, 13, 9366–9378. [Google Scholar] [CrossRef]
  10. Baruah, S.; Rani, B.; Sahu, N.K. Facile synthesis of PEG-glycerol coated bimetallic FePt nanoparticle as highly efficient electrocatalyst for methanol oxidation. Sci. Rep. 2023, 13, 13249. [Google Scholar] [CrossRef]
  11. Nguyen, A.Q.K.; Pham, H.Q.; Huynh, S.T.M.; Huynh, T.T. Milestones of Electrocatalyst Development for Direct Alcohol Fuel Cells. Adv. Sustain. Syst. 2023, 7, 2300205. [Google Scholar] [CrossRef]
  12. Guo, S.; Yu, S.; Chen, F.; Wang, L.; Guo, M.; Ren, T.; Zhang, C.; Li, C. Direct methanol fuel cell with enhanced oxygen reduction performance enabled by CoFe alloys embedded into N-doped carbon nanofiber and bamboo-like carbon nanotube. J. Colloid Interface Sci. 2023, 652, 429–439. [Google Scholar] [CrossRef] [PubMed]
  13. Kim, H.J.; Moon, C.J.; Lee, S.; Theerthagiri, J.; Hong, J.W.; Choi, M.Y.; Lee, Y.W. Modulating the synergy of Pd@Pt core–shell nanodendrites for boosting methanol electrooxidation kinetics. J. Mater. Sci Technol. 2023, 165, 153–160. [Google Scholar] [CrossRef]
  14. Peng, K.; Liu, L.; Bhuvanendran, N.; Lee, S.Y.; Xu, Q.; Su, H. Efficient one-dimensional Pt-based nanostructures for methanol oxidation reaction: An overview. Int. J. Hydrog. Energy 2023, 48, 29497–29517. [Google Scholar] [CrossRef]
  15. Lu, Z.; Kang, H.; Li, J.; Shang, J.; Yang, K.; Liu, R.; Li, Z.; Feng, F.; Guo, Y.; Zhao, H. Green preparation of self-supporting platinum nanoflower catalyst and its electrocatalytic oxidation performance of methanol. Carbon Resour. Convers. 2023, 6, 167–172. [Google Scholar] [CrossRef]
  16. Ren, H.; Humbert, M.P.; Menning, C.A.; Chen, J.G.; Shu, Y.; Singh, U.G.; Cheng, W.-C. Inhibition of coking and CO poisoning of Pt catalysts by the formation of Au/Pt bimetallic surfaces. Appl. Catal. A-Gen. 2010, 375, 303–309. [Google Scholar] [CrossRef]
  17. Chen, G.; Dai, Z.; Bao, H.; Zhang, L.; Sun, L.; Shan, H.; Liu, S.; Ma, F. Enhanced Anti-CO poisoning of platinum on mesoporous carbon spheres by abundant hydroxyl groups in methanol electro-oxidation. Electrochim. Acta 2020, 336, 135751. [Google Scholar] [CrossRef]
  18. Mishra, K.; Devi, N.; Siwal, S.S.; Thakur, V.K. Insight perspective on the synthesis and morphological role of the noble and non-noble metal-based electrocatalyst in fuel cell application. Appl. Catal. B Environ. 2023, 334, 122820. [Google Scholar] [CrossRef]
  19. Chan, C.-H.; Lee, S.Y.; Han, S.S. Origin of enhanced toluene hydrogenation by Pt–Ru catalysts for an efficient liquid organic hydrogen carrier. Int. J. Hydrog. Energy 2023, 48, 33590–33598. [Google Scholar] [CrossRef]
  20. Sekar, A.; Metzger, N.; Rajendran, S.; Elangovan, A.; Cao, Y.; Peng, F.; Li, X.; Li, J. PtRu Catalysts on Nitrogen-Doped Carbon Nanotubes with Conformal Hydrogenated TiO2 Shells for Methanol Oxidation. ACS Appl. Nano Mater. 2022, 5, 3275–3288. [Google Scholar] [CrossRef]
  21. Sandhya, A.L.M.; Pleskunov, P.; Bogar, M.; Xie, X.; Wieser, P.A.; Orság, M.; Dinhová, T.N.; Dopita, M.; Taccani, R.; Amenitsch, H.; et al. Tuning the morphology of sputter-deposited platinum catalyst: From compact layers to dispersed nanoparticles. Surf. Interfaces 2023, 40, 103079. [Google Scholar] [CrossRef]
  22. Wei, Y.-C.; Liu, C.-W.; Chang, W.-J.; Wang, K.-W. Promotion of Pt–Ru/C catalysts driven by heat treated induced surface segregation for methanol oxidation reaction. J. Alloys Compd. 2011, 509, 535–541. [Google Scholar] [CrossRef]
  23. Zhu, M.; Wang, Y.; Wu, Y.; Liu, J.; Zhang, J.; Huang, H.; Zheng, X.; Shen, J.; Zhao, R.; Zhou, W.; et al. Greatly Enhanced Methanol Oxidation Reaction of CoPt Truncated Octahedral Nanoparticles by External Magnetic Fields. Energy Environ. Mater. 2023, 6, e12403. [Google Scholar] [CrossRef]
  24. Chang, Y.; Chen, Y.; Yang, Z.; Wang, J.; Li, H. Lattice distortion of PtCo nanoparticles encapsulated in TiO2 nanotubes boosts methanol oxidation. J. Alloys Compd. 2023, 968, 171859. [Google Scholar] [CrossRef]
  25. Lu, Z.; Xie, J.; Hu, J.; Wang, K.; Cao, Y. In Situ Replacement Synthesis of Co@NCNT Encapsulated CoPt3@Co2P Heterojunction Boosting Methanol Oxidation and Hydrogen Evolution. Small 2021, 17, 2104656. [Google Scholar] [CrossRef] [PubMed]
  26. Cortes, M.; Gomez, E.; Valles, E. Magnetic CoPt (60–70 wt%Pt) microstructures fabricated by the electrochemical method. Micromech. Microeng. 2012, 22, 055016. [Google Scholar] [CrossRef]
  27. Park, D.-Y.; Myung, N.V. Magnetic Properties of Electrodeposited Cobalt-Platinum (CoPt) and Cobalt-Platinum-Phosphide (CoPtP) Thin Films. Front. Chem. 2021, 9, 733383. [Google Scholar] [CrossRef]
  28. Kumar, D.; Gupta, S.; Jin, T.; Nongjai, R.; Asokan, K.; Piramanayagam, S.N. Tailoring the structural and magnetic properties of masked CoPt thin films using ion implantation. AIP Adv. 2018, 8, 056504. [Google Scholar] [CrossRef]
  29. Meneses, F.; Bran, C.; Vázquez, M.; Bercoff, P.G. Enhanced in-plane magnetic anisotropy in thermally treated arrays of Co-Pt nanowires. Mater. Sci. Eng. B 2020, 261, 114669. [Google Scholar] [CrossRef]
  30. Abel, F.M.; Basina, G.; Tzitzios, V.; Alhassan, S.M.; Sellmyer, D.J.; Hadjipanayis, G.C. Ferromagnetic L10-Structured CoPt Nanoparticles for Permanent Magnets and Low Pt-Based Catalysts. ACS Appl. Nano Mater. 2021, 4, 9231–9240. [Google Scholar] [CrossRef]
  31. Mandal, M.; Das, B.; Mandal, K. Synthesis of CoxPt1−x alloy nanoparticles of different phase by micellar technique and their properties study. J. Colloid Interface Sci. 2009, 335, 40–43. [Google Scholar] [CrossRef] [PubMed]
  32. Liu, H.; Li, C.; Chen, D.; Cui, P.; Ye, F.; Yang, J. Uniformly dispersed platinum-cobalt alloy nanoparticles with stable compositions on carbon substrates for methanol oxidation reaction. Sci. Rep. 2017, 7, 11421. [Google Scholar] [CrossRef] [PubMed]
  33. Deshpande, P.; Prasad, B.L.V. Alloying with Mn Enhances the Activity and Durability of the CoPt Catalyst toward the Methanol Oxidation Reaction. ACS Appl. Mater. Interfaces 2023, 15, 26554–26562. [Google Scholar] [CrossRef] [PubMed]
  34. Huang, H.; Hu, X.; Zhang, J.; Su, N.; Cheng, J. Facile Fabrication of Platinum-Cobalt Alloy Nanoparticles with Enhanced Electrocatalytic Activity for a Methanol Oxidation Reaction. Sci. Rep. 2017, 7, 45555. [Google Scholar] [CrossRef]
  35. Zhang, K.; Wang, H.; Qiu, J.; Deng, Y.; Wu, Y.; Wu, J.; Shao, J.; Yan, L. Synergistic catalysis of PtM alloys and nickel hydroxide on highly enhanced electrocatalytic activity and durability for methanol oxidation reaction. Colloids Surf. A Physicochem. Eng. Asp. 2021, 625, 126942. [Google Scholar] [CrossRef]
  36. Dragos-Pinzaru, O.-G.; Stoian, G.; Borza, F.; Chiriac, H.; Lupu, N.; Tabakovic, I.; Stadler, B.J.H. CoPt Nanowires with Low Pt Content for the Catalytic Methanol Oxidation Reaction (MOR). ACS Appl. Nano Mater. 2022, 5, 8089–8096. [Google Scholar] [CrossRef]
  37. Li, J.; Sharma, S.; Liu, X.; Pan, Y.T.; Spendelow, J.S.; Chi, M.; Jia, Y.; Zhang, P.; Cullen, D.A.; Xi, Z.; et al. Hard-Magnet L10-CoPt Nanoparticles Advance Fuel Cell Catalysis. Joule 2019, 3, 124–135. [Google Scholar] [CrossRef]
  38. Tabakovic, I.; Qiu, J.M.; Dragos, O. Electrodeposition of Thin CoPt Films with Very High Perpendicular Anisotropy from Hexachloroplatinate Solution: Effect of Saccharin Additive and Electrode Substrate. J. Electrochem. Soc. 2016, 163, D287. [Google Scholar] [CrossRef]
  39. Randles, J.E.B. A cathode ray polarograph. Part II.—The current-voltage curves. Trans. Faraday Soc. 1948, 44, 327–338. [Google Scholar] [CrossRef]
  40. Sevčík, A. Oscillographic polarography with periodical triangular voltage. Collect. Czech. Chem. Commun. 1948, 13, 349–377. [Google Scholar] [CrossRef]
  41. Dmitriev, D.S.; Tenevich, M.I. Evaluation of the electrochemical active surface area for carbon felt and nanostruc-tured Ni coatings as electrocatalysts for hydrogen evolution reaction. Nanosyst. Phys. Chem. Math 2023, 14, 590–600. [Google Scholar] [CrossRef]
  42. Tebbakh, S.; Mentar, L.; Messaoudi, Y.; Khelladi, M.R.; Belhadj, H.; Azizi, A. Effect of cobalt content on electrodeposition and properties of Co–Ni alloy thin films. Inorg. Nano-Met. Chem. 2021, 51, 1796–1802. [Google Scholar] [CrossRef]
  43. TEM Analysis Services. Available online: https://www.tem-analysis.com/instruction-manuals/gatan-656-dimple-grinder-instruction-manual.pdf (accessed on 5 December 2023).
  44. Precision Ion Polishing System Owner’s Manual and User’s Guide. Available online: https://www.tem-analysis.com/instruction-manuals/gatan-691-pips-instruction-manual.pdf (accessed on 15 December 2023).
  45. Mizutani, N.; Ishibashi, K. Enhancing PtCo Electrode Catalyst Performance for Fuel Cell Vehicle Application. SAE Tech. Pap. 2016, 1, 1187. [Google Scholar] [CrossRef]
Figure 1. Dependence of electrodeposition rate of the CoPt alloy function of the applied potential.
Coatings 14 00017 g001
Figure 2. SEM images (left) and AFM images (right) of the CoPt thin films samples prepared at different applied potential/SCE: (a,b) −0.6 V; (c,d) −0.7 V; (e,f) −0.8 V; (g,h) −0.9 V; (i,j) −1.0 V.
Coatings 14 00017 g002aCoatings 14 00017 g002b
Figure 3. XRD patterns of CoPt films deposited at different electrodeposition potentials on Ru substrate.
Coatings 14 00017 g003
Figure 4. High-resolution TEM image of (a) CoPt/Ru interface, (b) electron diffraction pattern from CoPt thin film in TEM, (c) CoPt alloy showing the lattice fringes and measured lattice d-spacing, (d) EDX measurements at the Ru/CoPt interface.
Coatings 14 00017 g004
Figure 5. CV curves for MOR on CoPt thin film catalysts prepared from solutions with additives at different electrodeposition potentials: first cycle—black curve and 5th cycle—red curve.
Coatings 14 00017 g005
Figure 6. CA curve for MOR of the CoPt catalysts in aqueous solution of 2.0 M CH3-OH and 0.1 M H2SO4.
Coatings 14 00017 g006
Figure 7. SEM images of the CoPt thin films samples prepared at different applied potentials: (a) −0.6 V/SCE, (b) −0.7 V/SCE; (c) −0.8 V/SCE, after performing MOR experiments.
Coatings 14 00017 g007
Figure 8. SEM images of the S5 CoPt thin films samples surface prepared at −1.0 V/SCE: before (a) and after (b) performing the MOR.
Coatings 14 00017 g008
Table 1. CoPt thin film physical characteristics.
SampleElectrodeposition Potential (V/SCE)Electrodeposition Rate (nm/s)Thin Film Roughness Factor (nm)ECS Area (mm2)Alloy Concentration (%)Thin Film Composition
PtCo
S1−0.60.121.340.718020Co20Pt80
S2−0.70.231.490.857723Co23Pt77
S3−0.80.492.000.877030Co30Pt70
S4−0.91.353.830.925545Co45Pt55
S5−1.01.5212.430.961090Co90Pt10
Table 2. Electrocatalytic parameters of the CoPt alloys.
SampleElectrodeposition Potential (V/SCE)MOR Peak Position,
(V)
MOR Peak Max. Value, Ip
(mA cm−2)
MOR Peak Max. Value Variation
(%)
Cycle 1Cycle 5Cycle 1Cycle 5
S1−0.60.650.672.482.43↓ −2%
S2−0.70.660.7012.2111.55↓ −5.4%
S3−0.80.750.7725.3231.61↑ +24.84%
S4−0.90.860.8596.9084.59↓ −12.70%
S5−1.00.800.77103.0574.20↓ −27.99%
Disclaimer/Publisher’s Note: The statements, opinions and data contained in all publications are solely those of the individual author(s) and contributor(s) and not of MDPI and/or the editor(s). MDPI and/or the editor(s) disclaim responsibility for any injury to people or property resulting from any ideas, methods, instructions or products referred to in the content.

