

The Influence of Angle of Attack on the Icing Distribution Characteristics of DU97 Blade Airfoil Surface for Wind Turbines


Abstract
:1. Introduction
- (1)
- The effect of AOA on the icing distribution characteristics of the DU97 blade airfoil under icing conditions has not yet been identified.
- (2)
- There are few reports on the mechanism of heat transfer and flow for iced blade airfoils that has been affected by AOA.
2. Experiment
2.1. Setup
2.2. Experimental Procedure
3. Modeling
3.1. Mathematical Model
3.2. Geometry and Computational Mesh
3.3. Boundary Condition and Solution Method
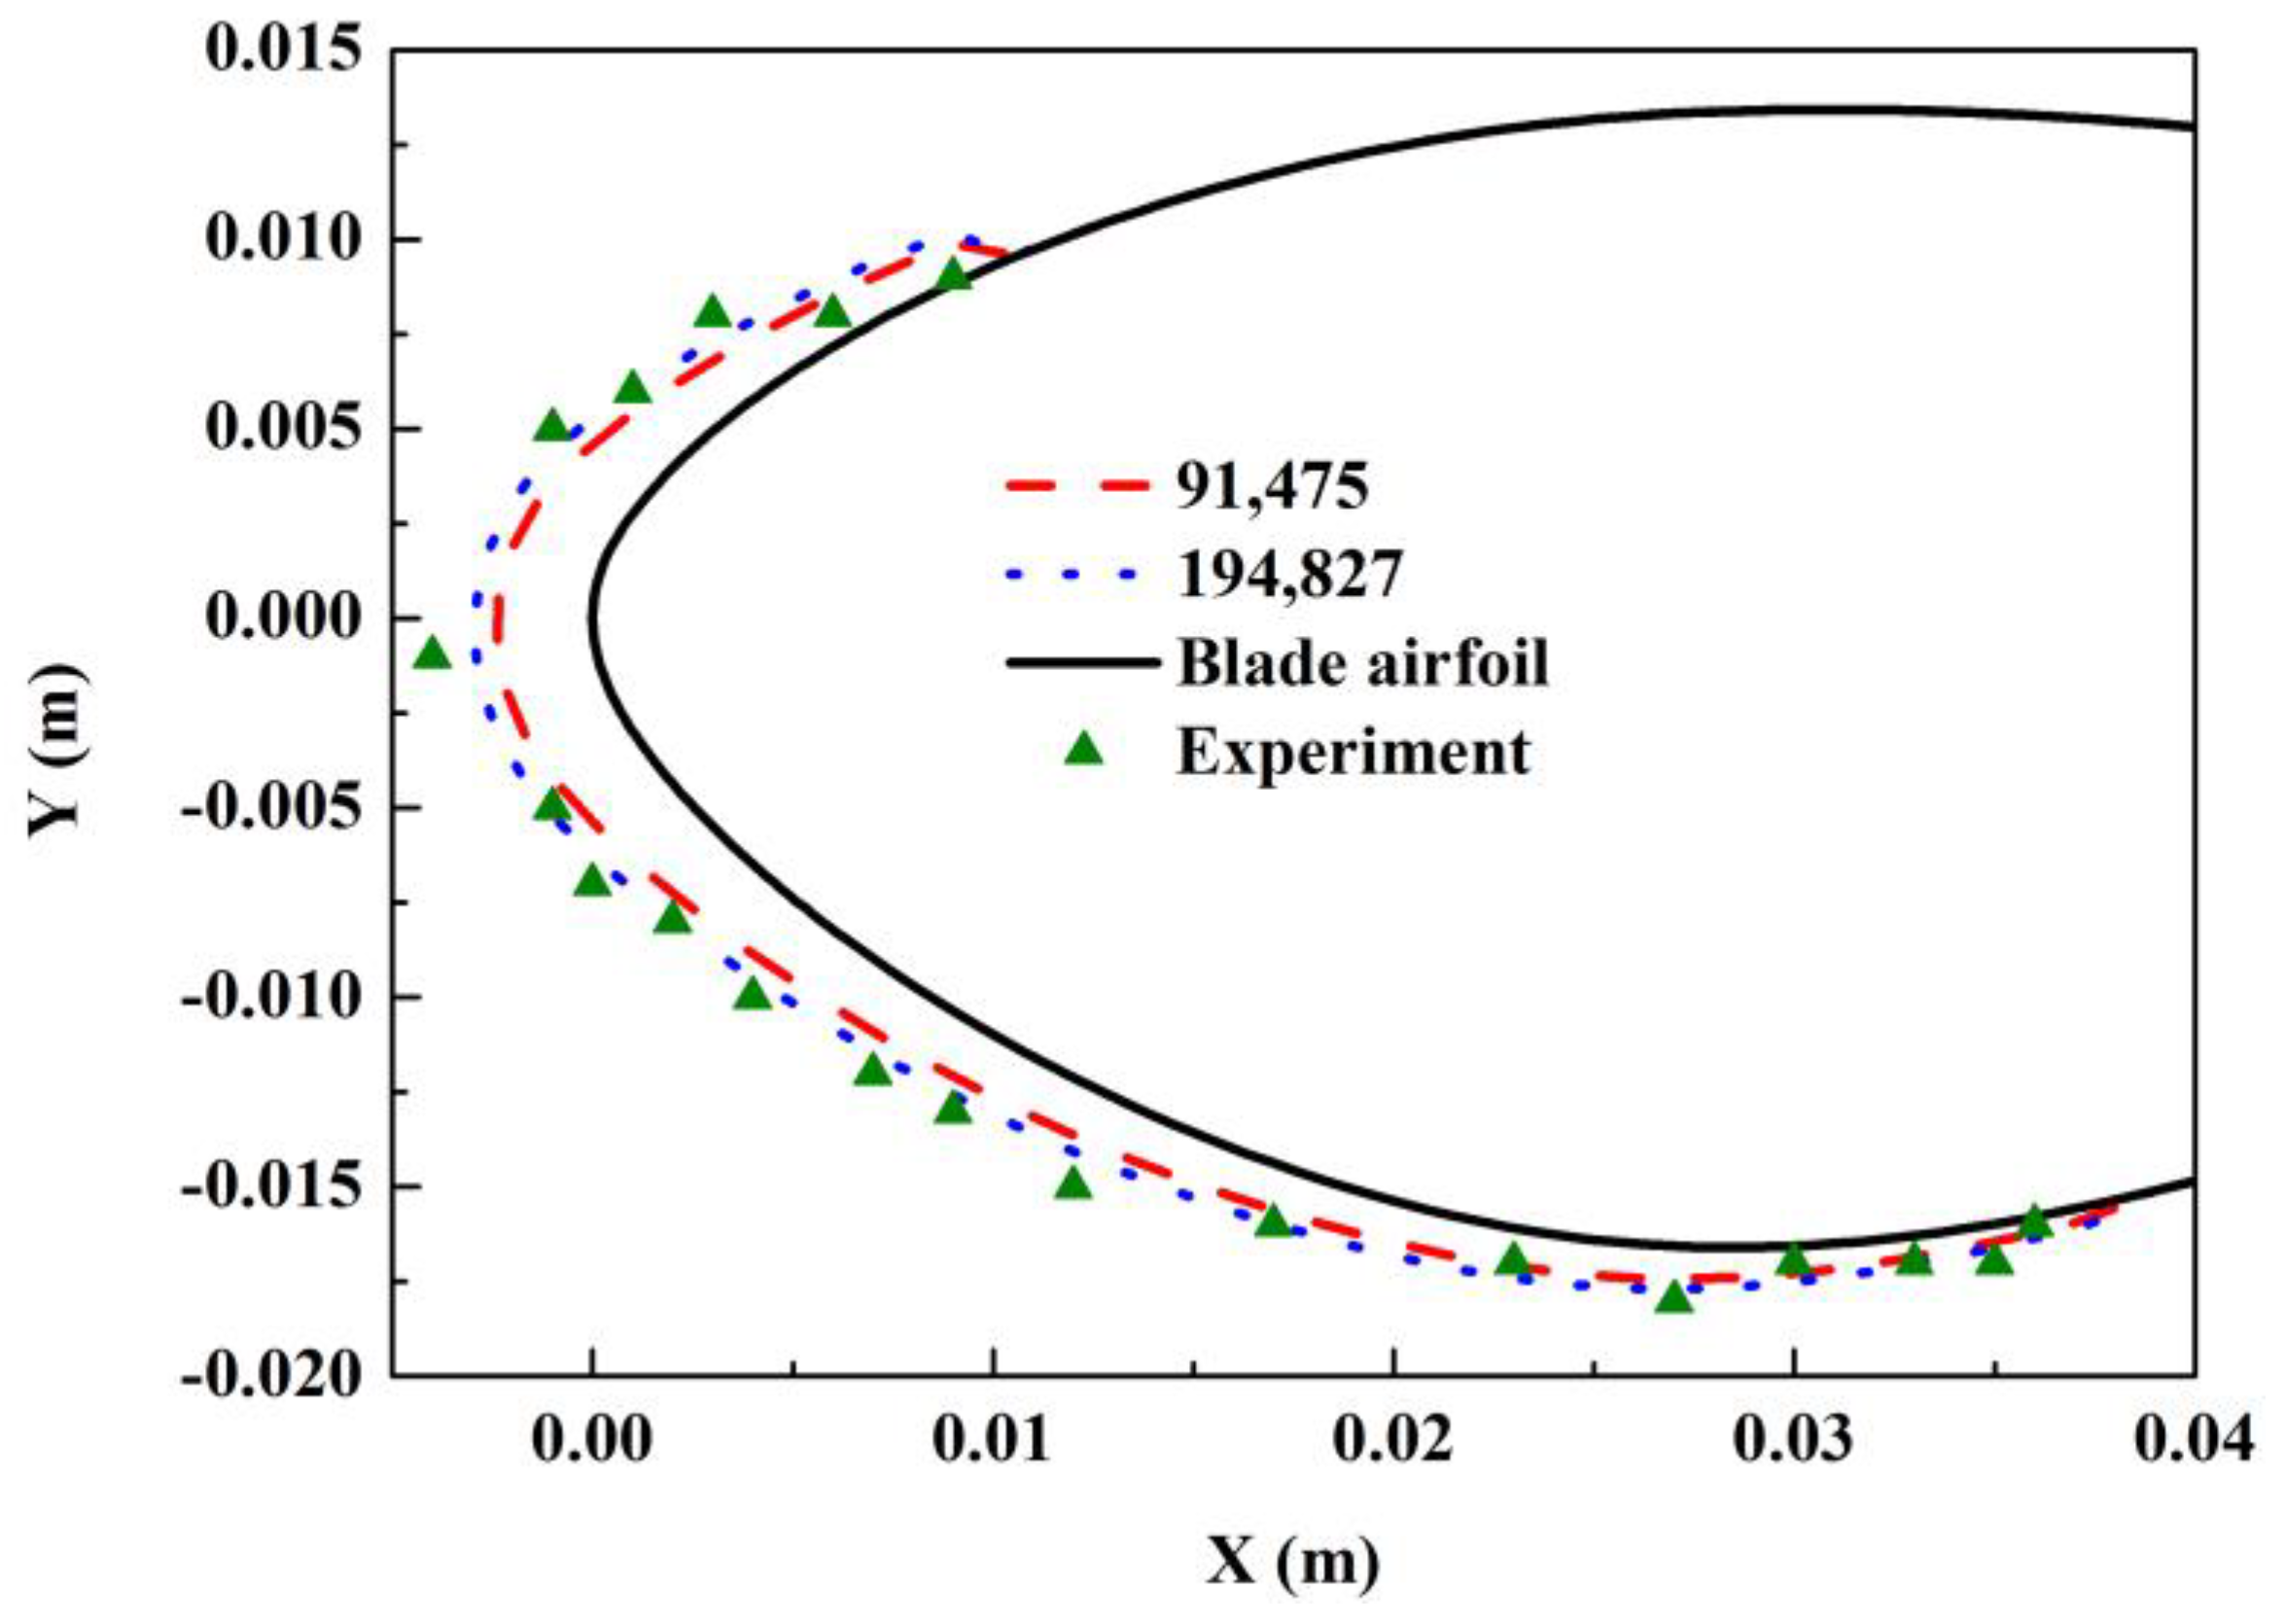
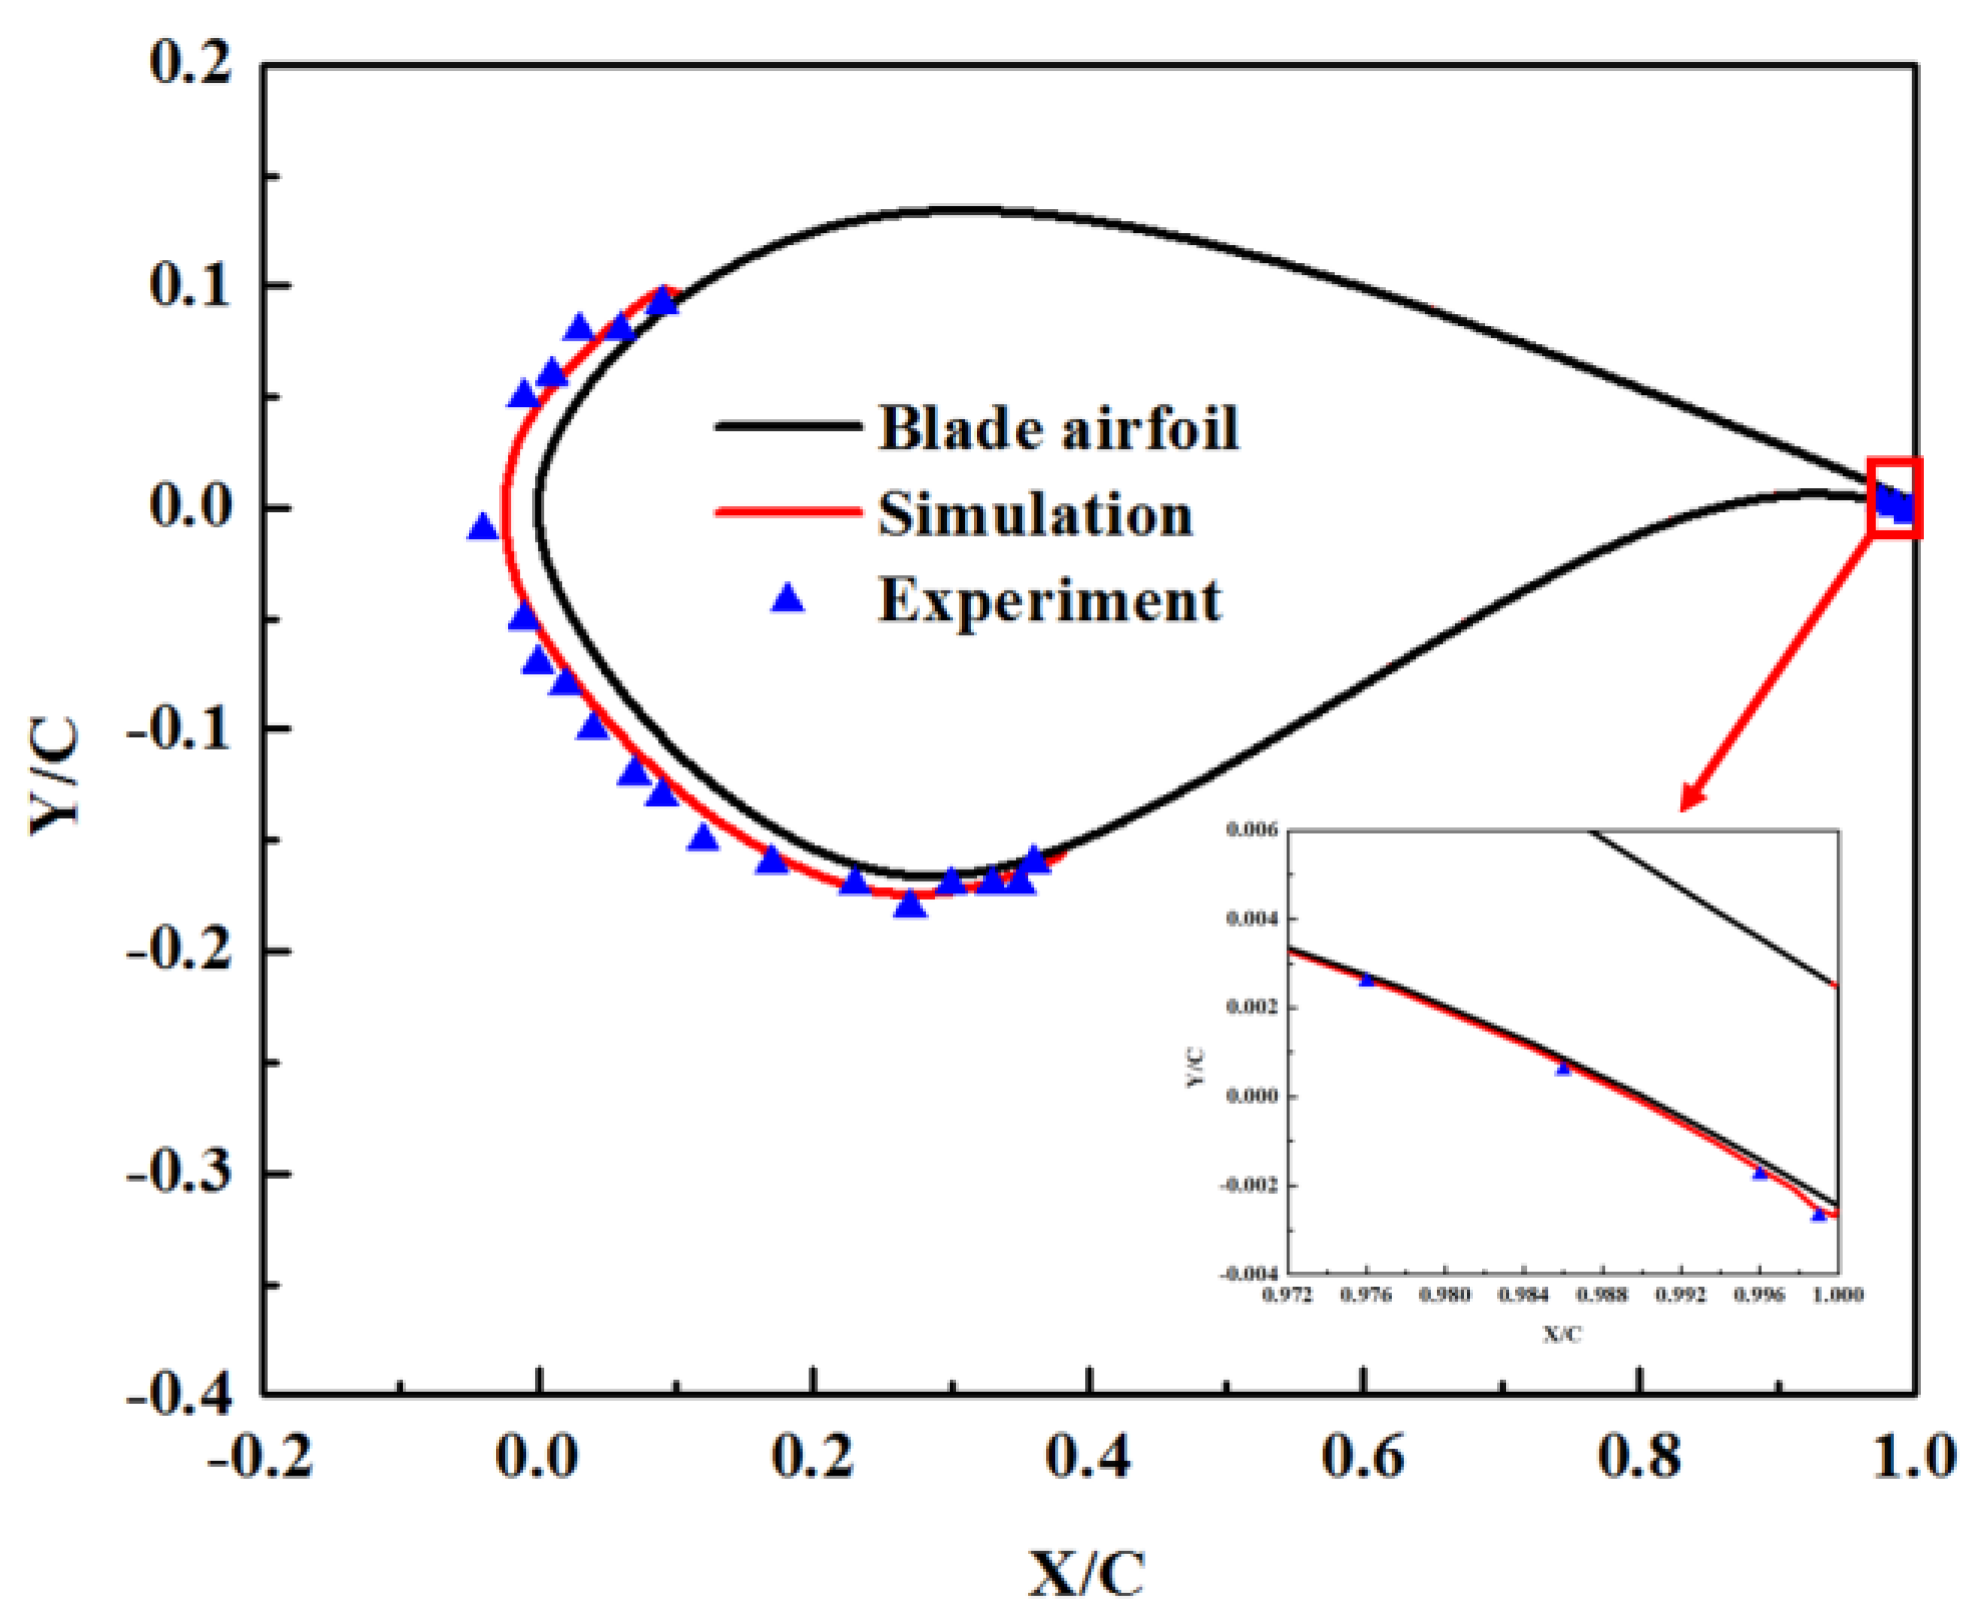
3.4. Model Validation
4. Results and Discussion
5. Conclusions
- (1)
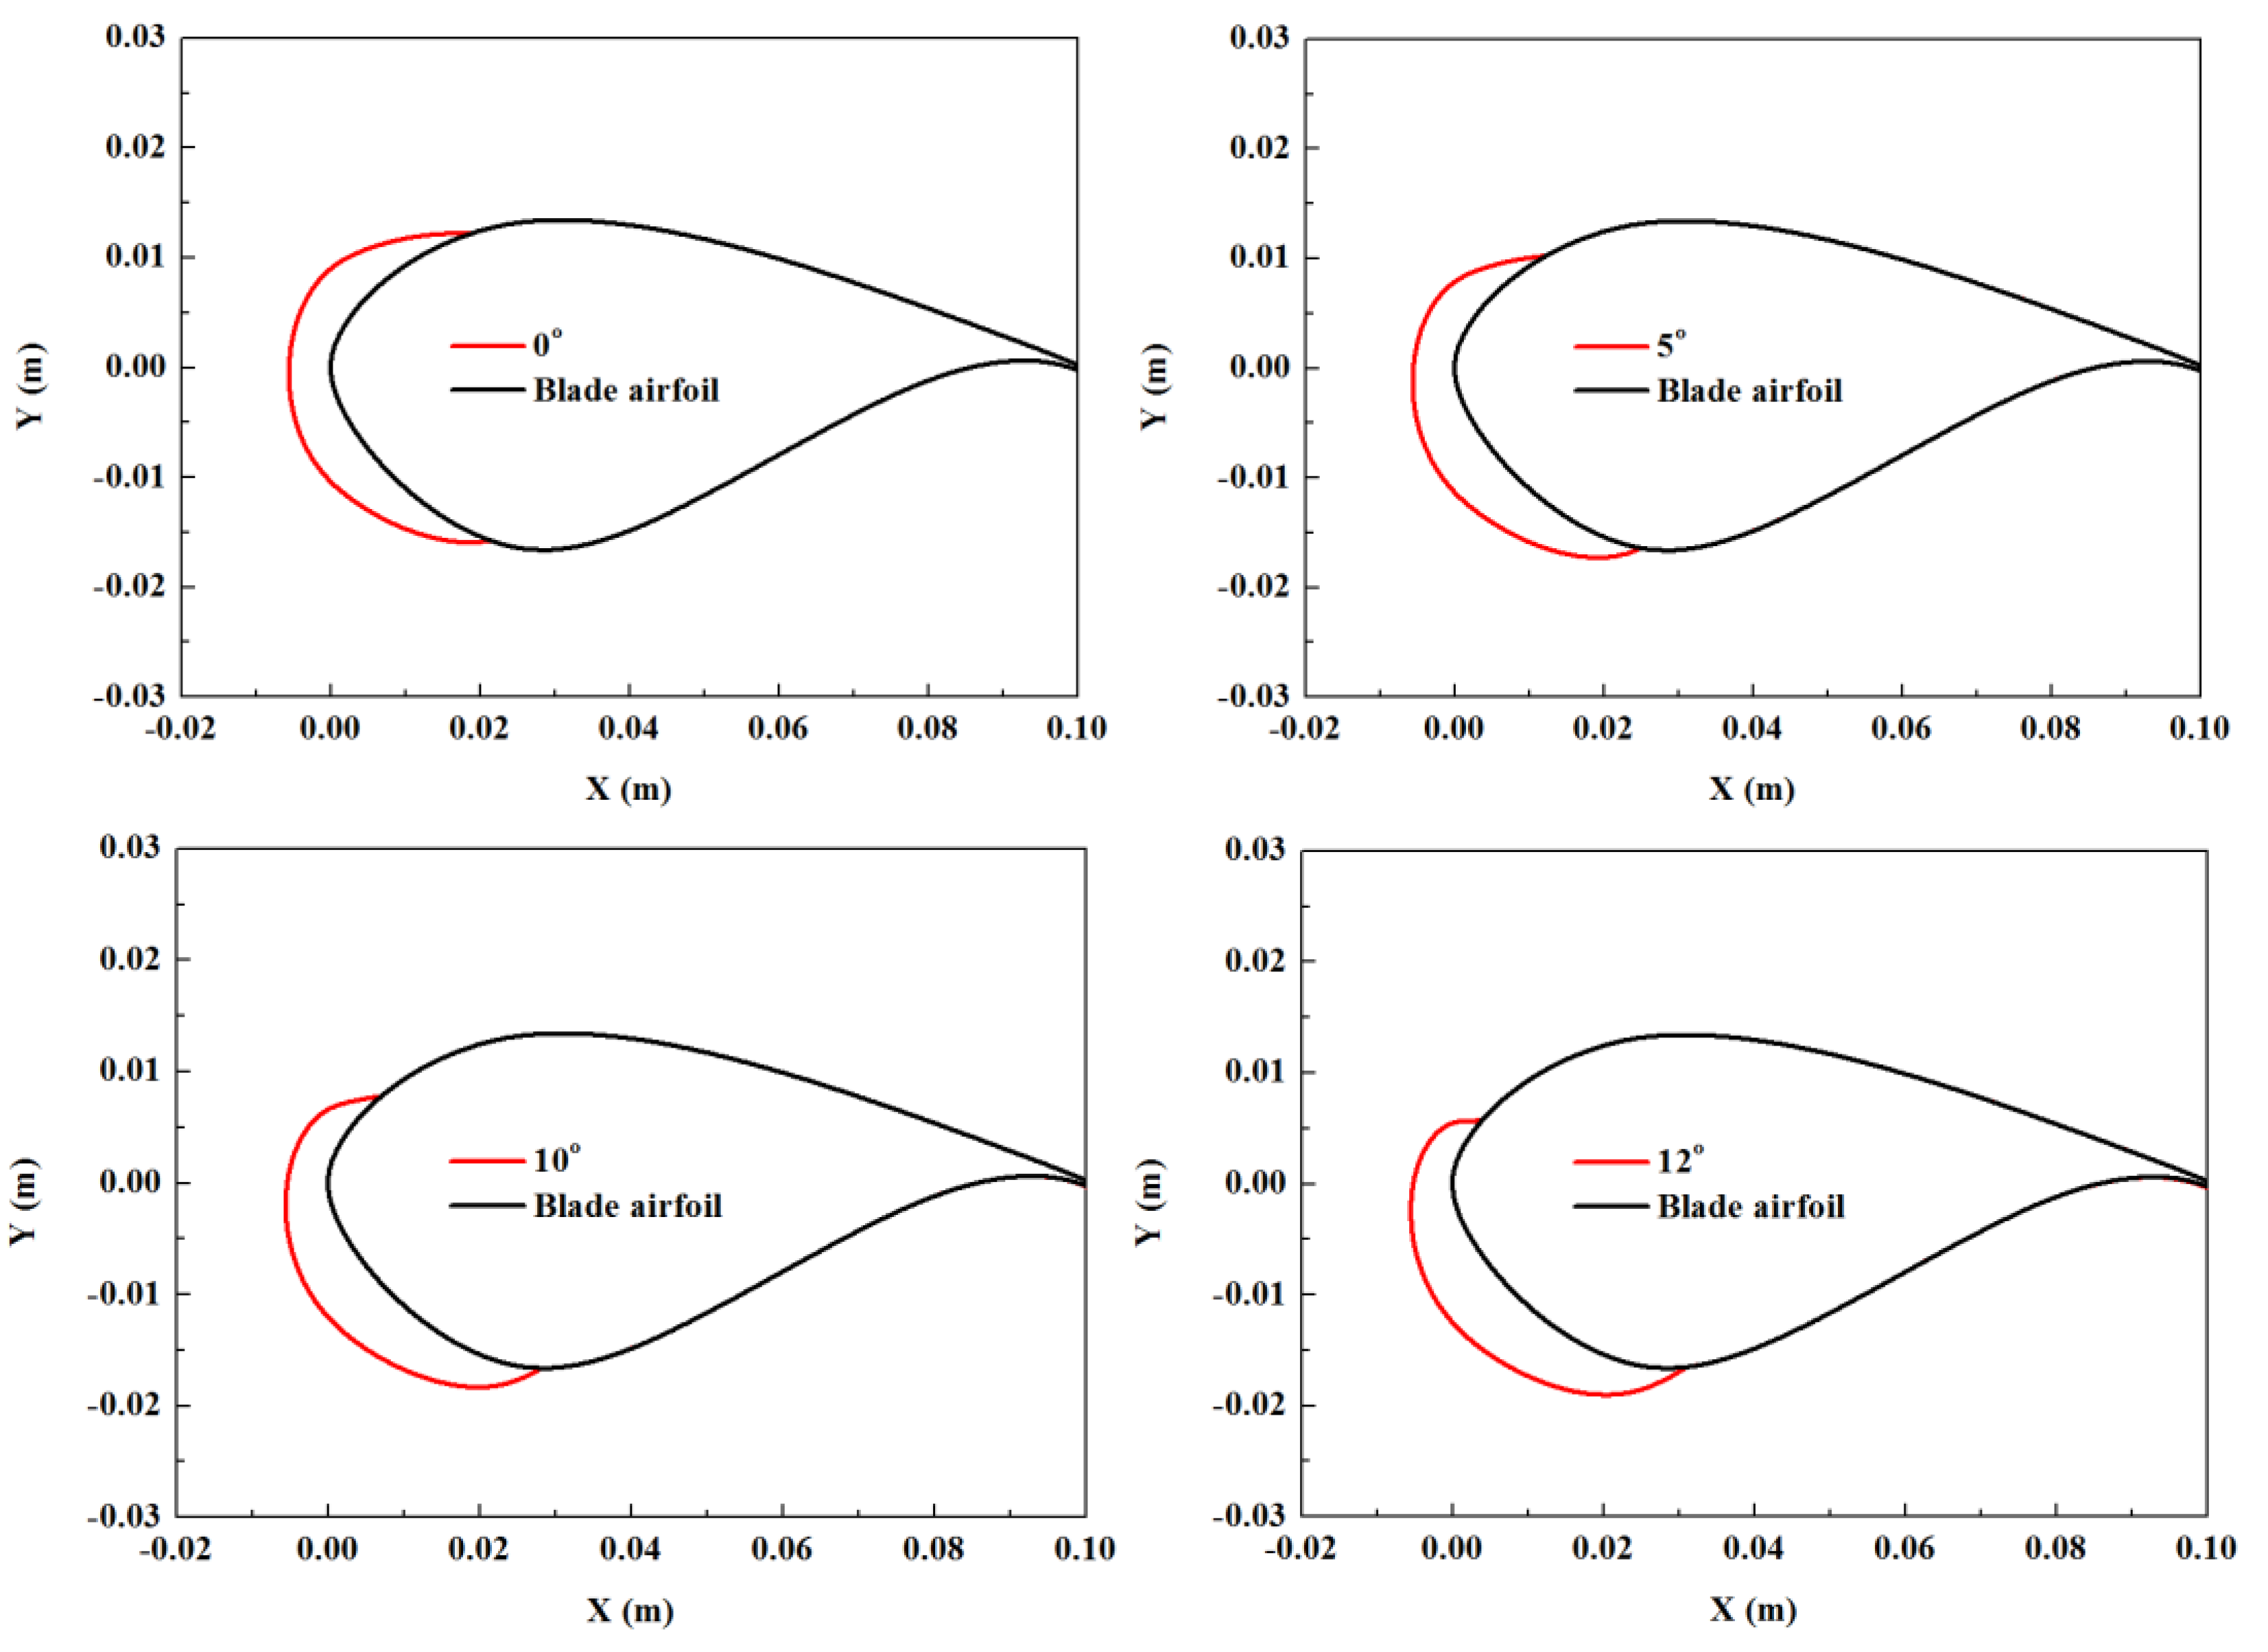
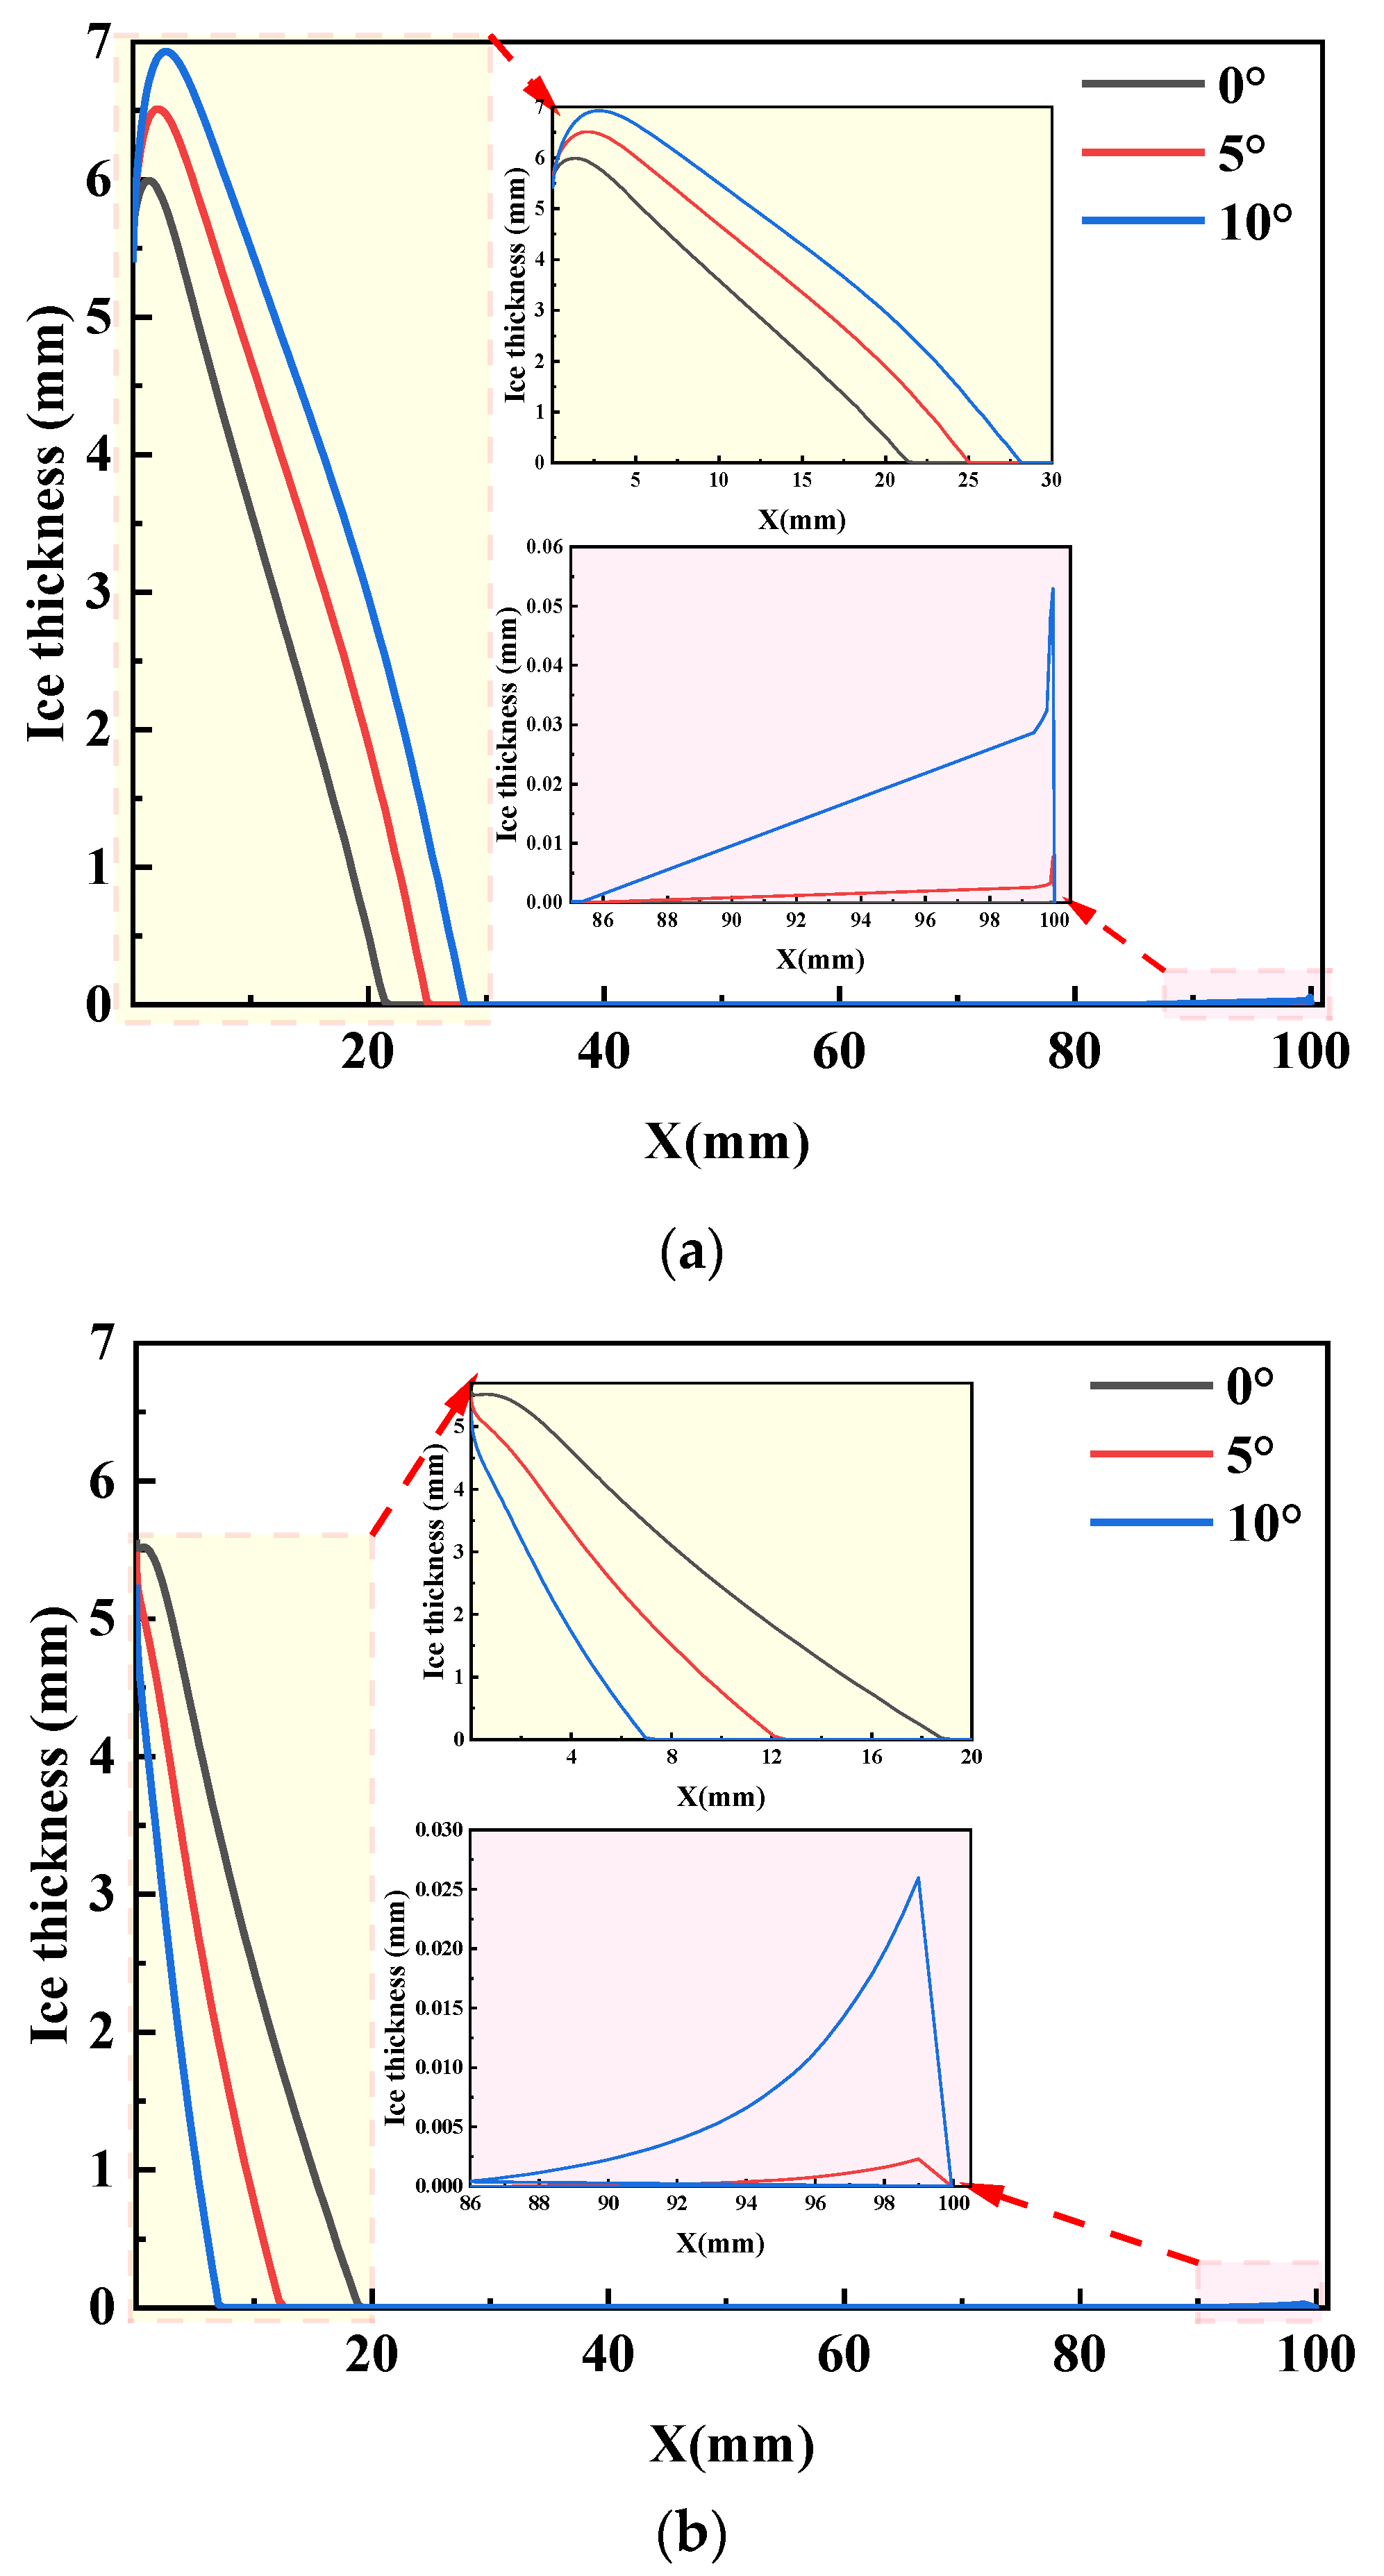
- The ice thickness distribution on the lower surface of the leading edge exhibits a trend of first rising and then declining along the chord direction, and the counterpart on the upper surface shows a gradually decreasing trend.
- (2)
- The peak ice accretion thickness on the trailing edge of DU97 blade airfoil rises significantly as AOA increases from 5° to 10°.
- (3)
- The ice distribution range on the upper surface of the trailing edge is broader than on the lower surface, which is due to the non-uniform droplet collection distribution on the blade airfoil surface.
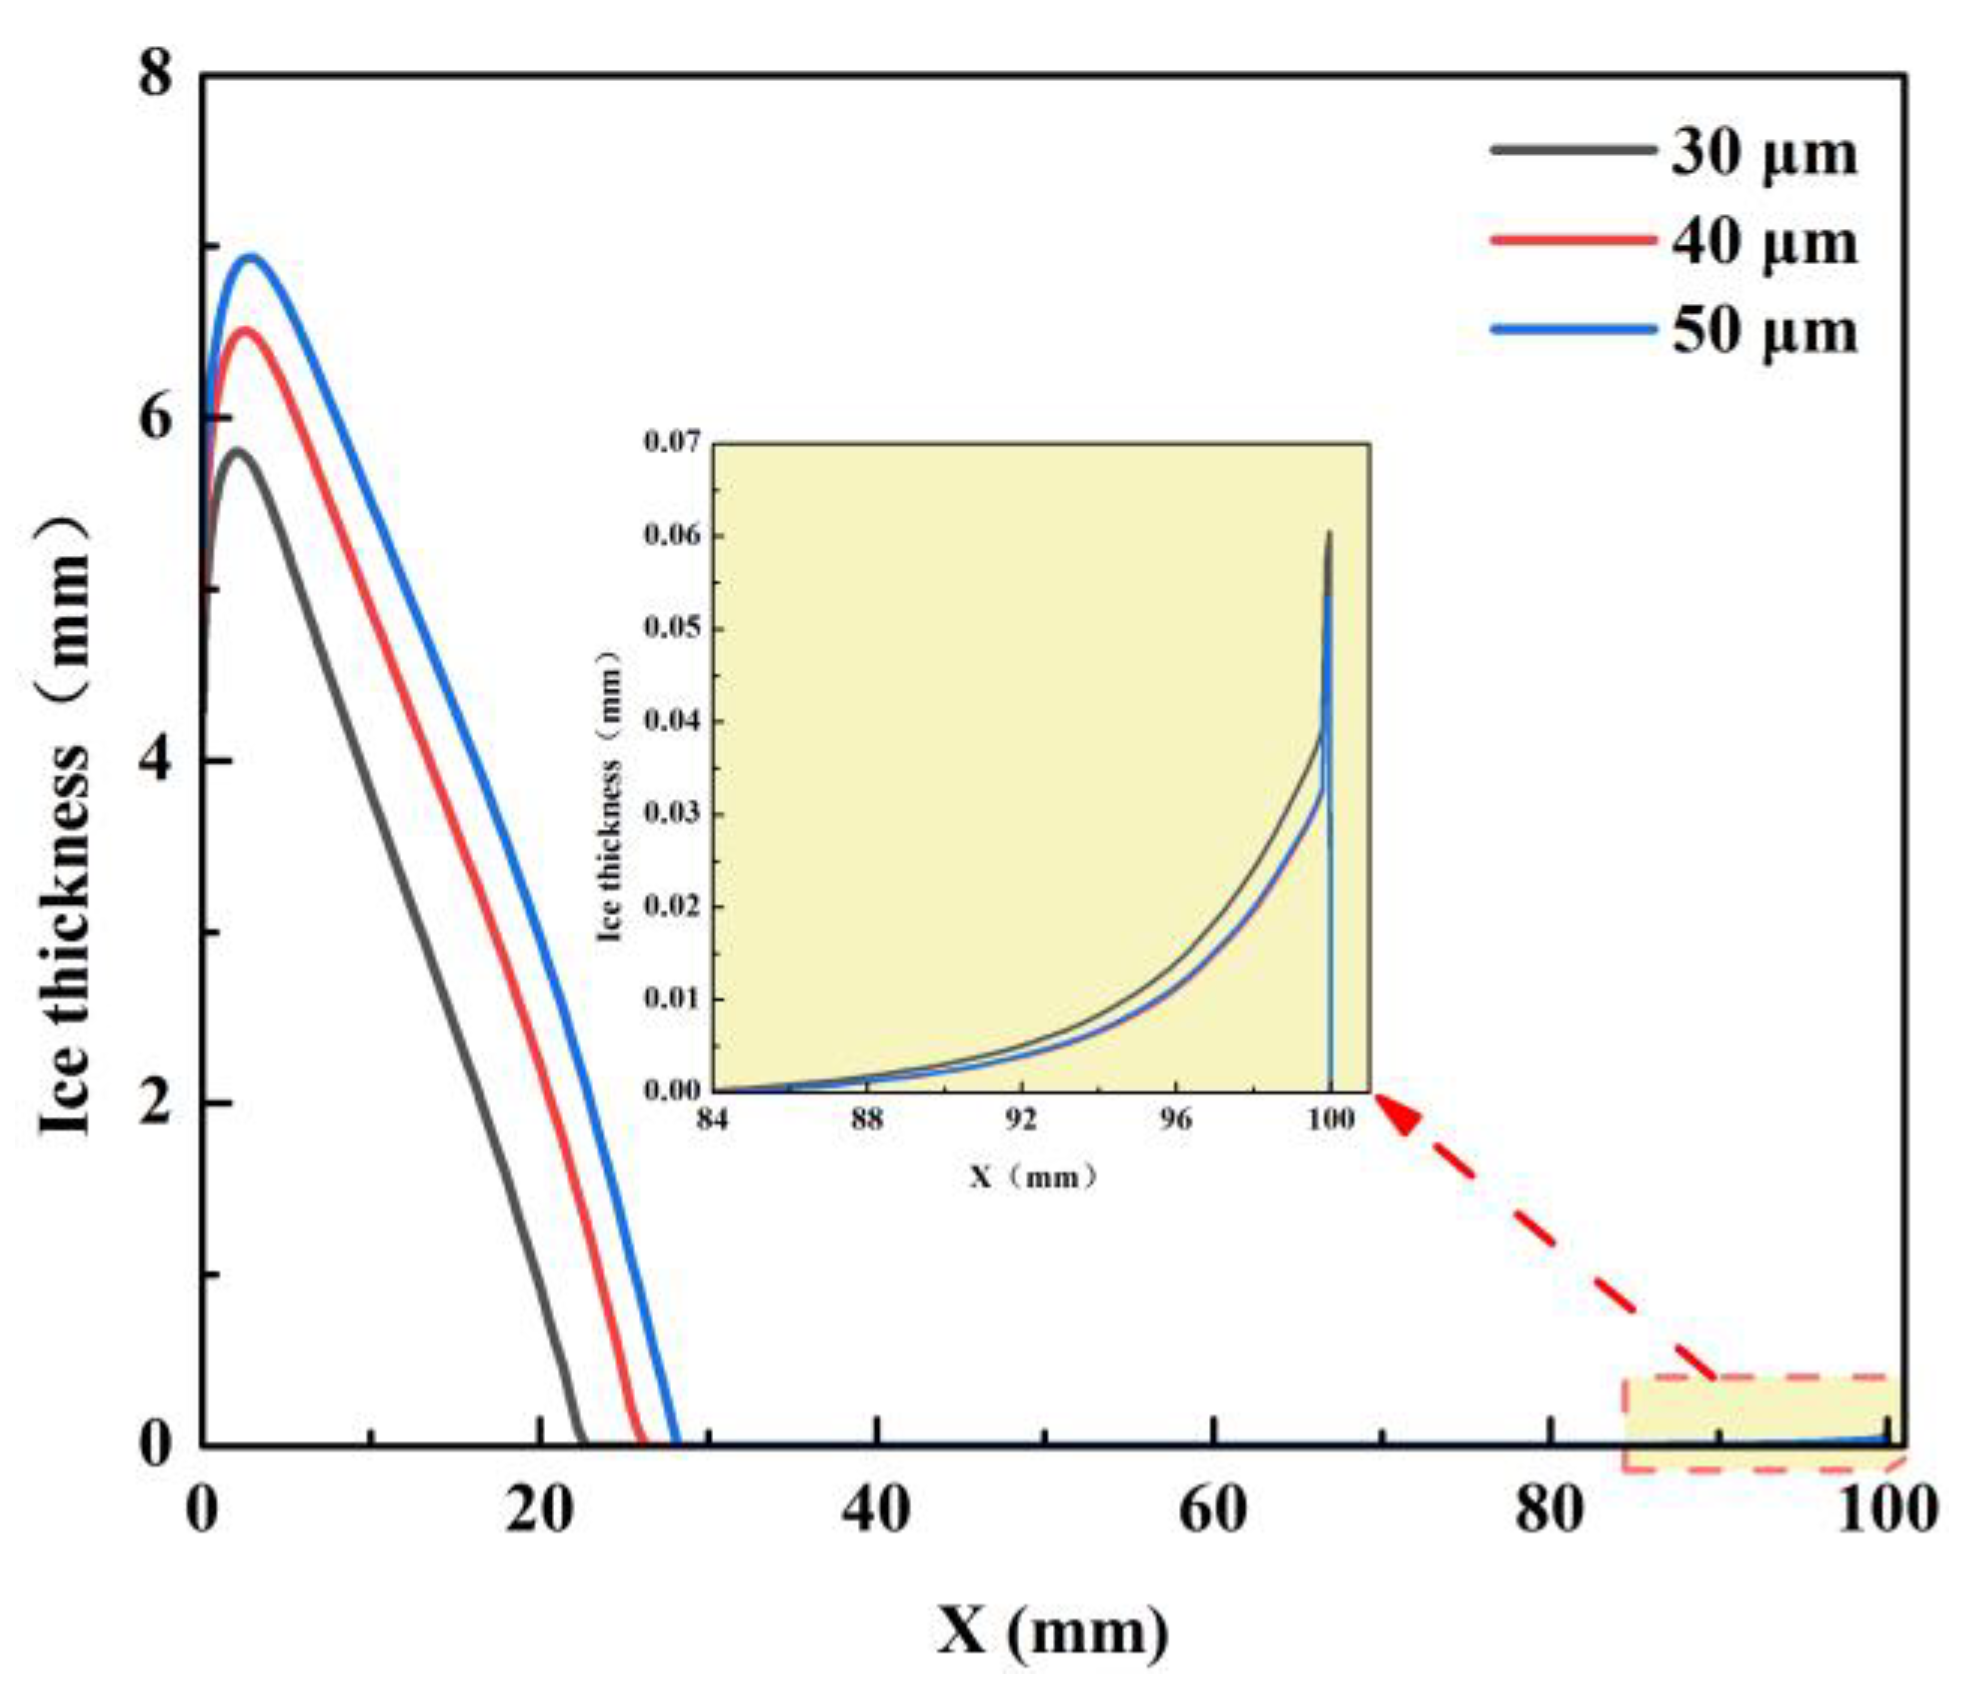
- (4)
- The peak ice thickness raises more dramatically for droplet sizes of 30–40 μm than droplet sizes of 40–50 μm.
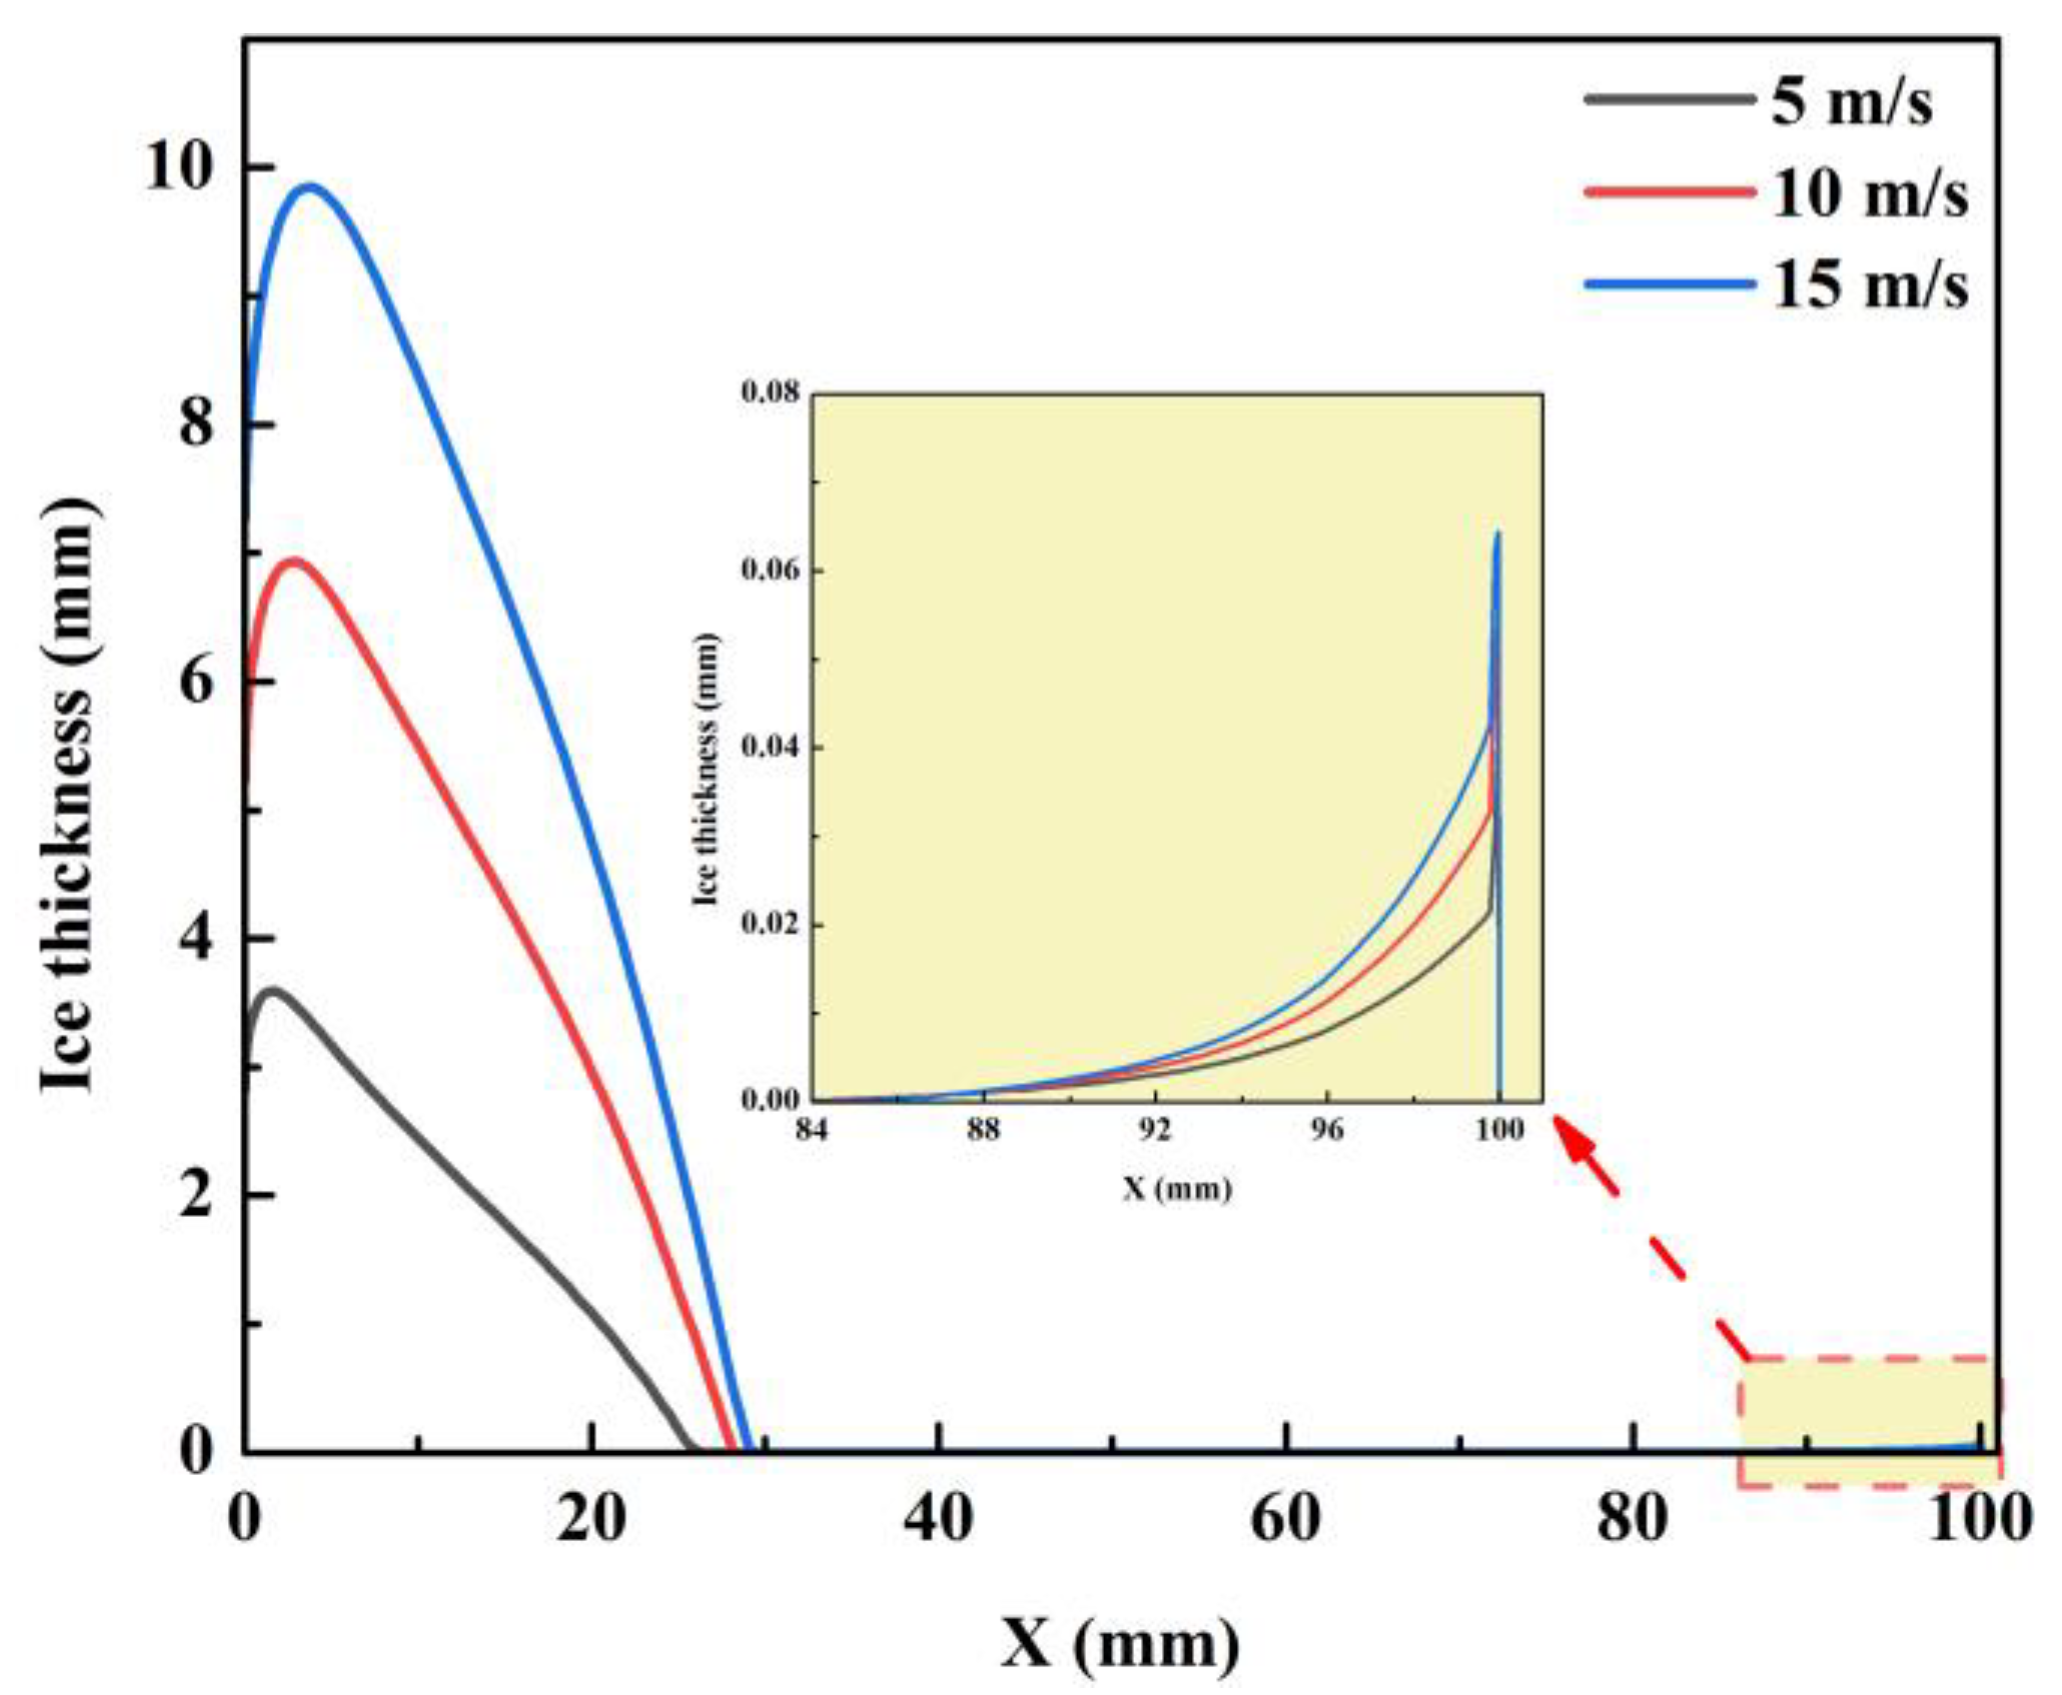
- (5)
- The peak ice thickness increases more significantly at wind speeds of 5–10 m/s than at wind speeds of 10–15 m/s.
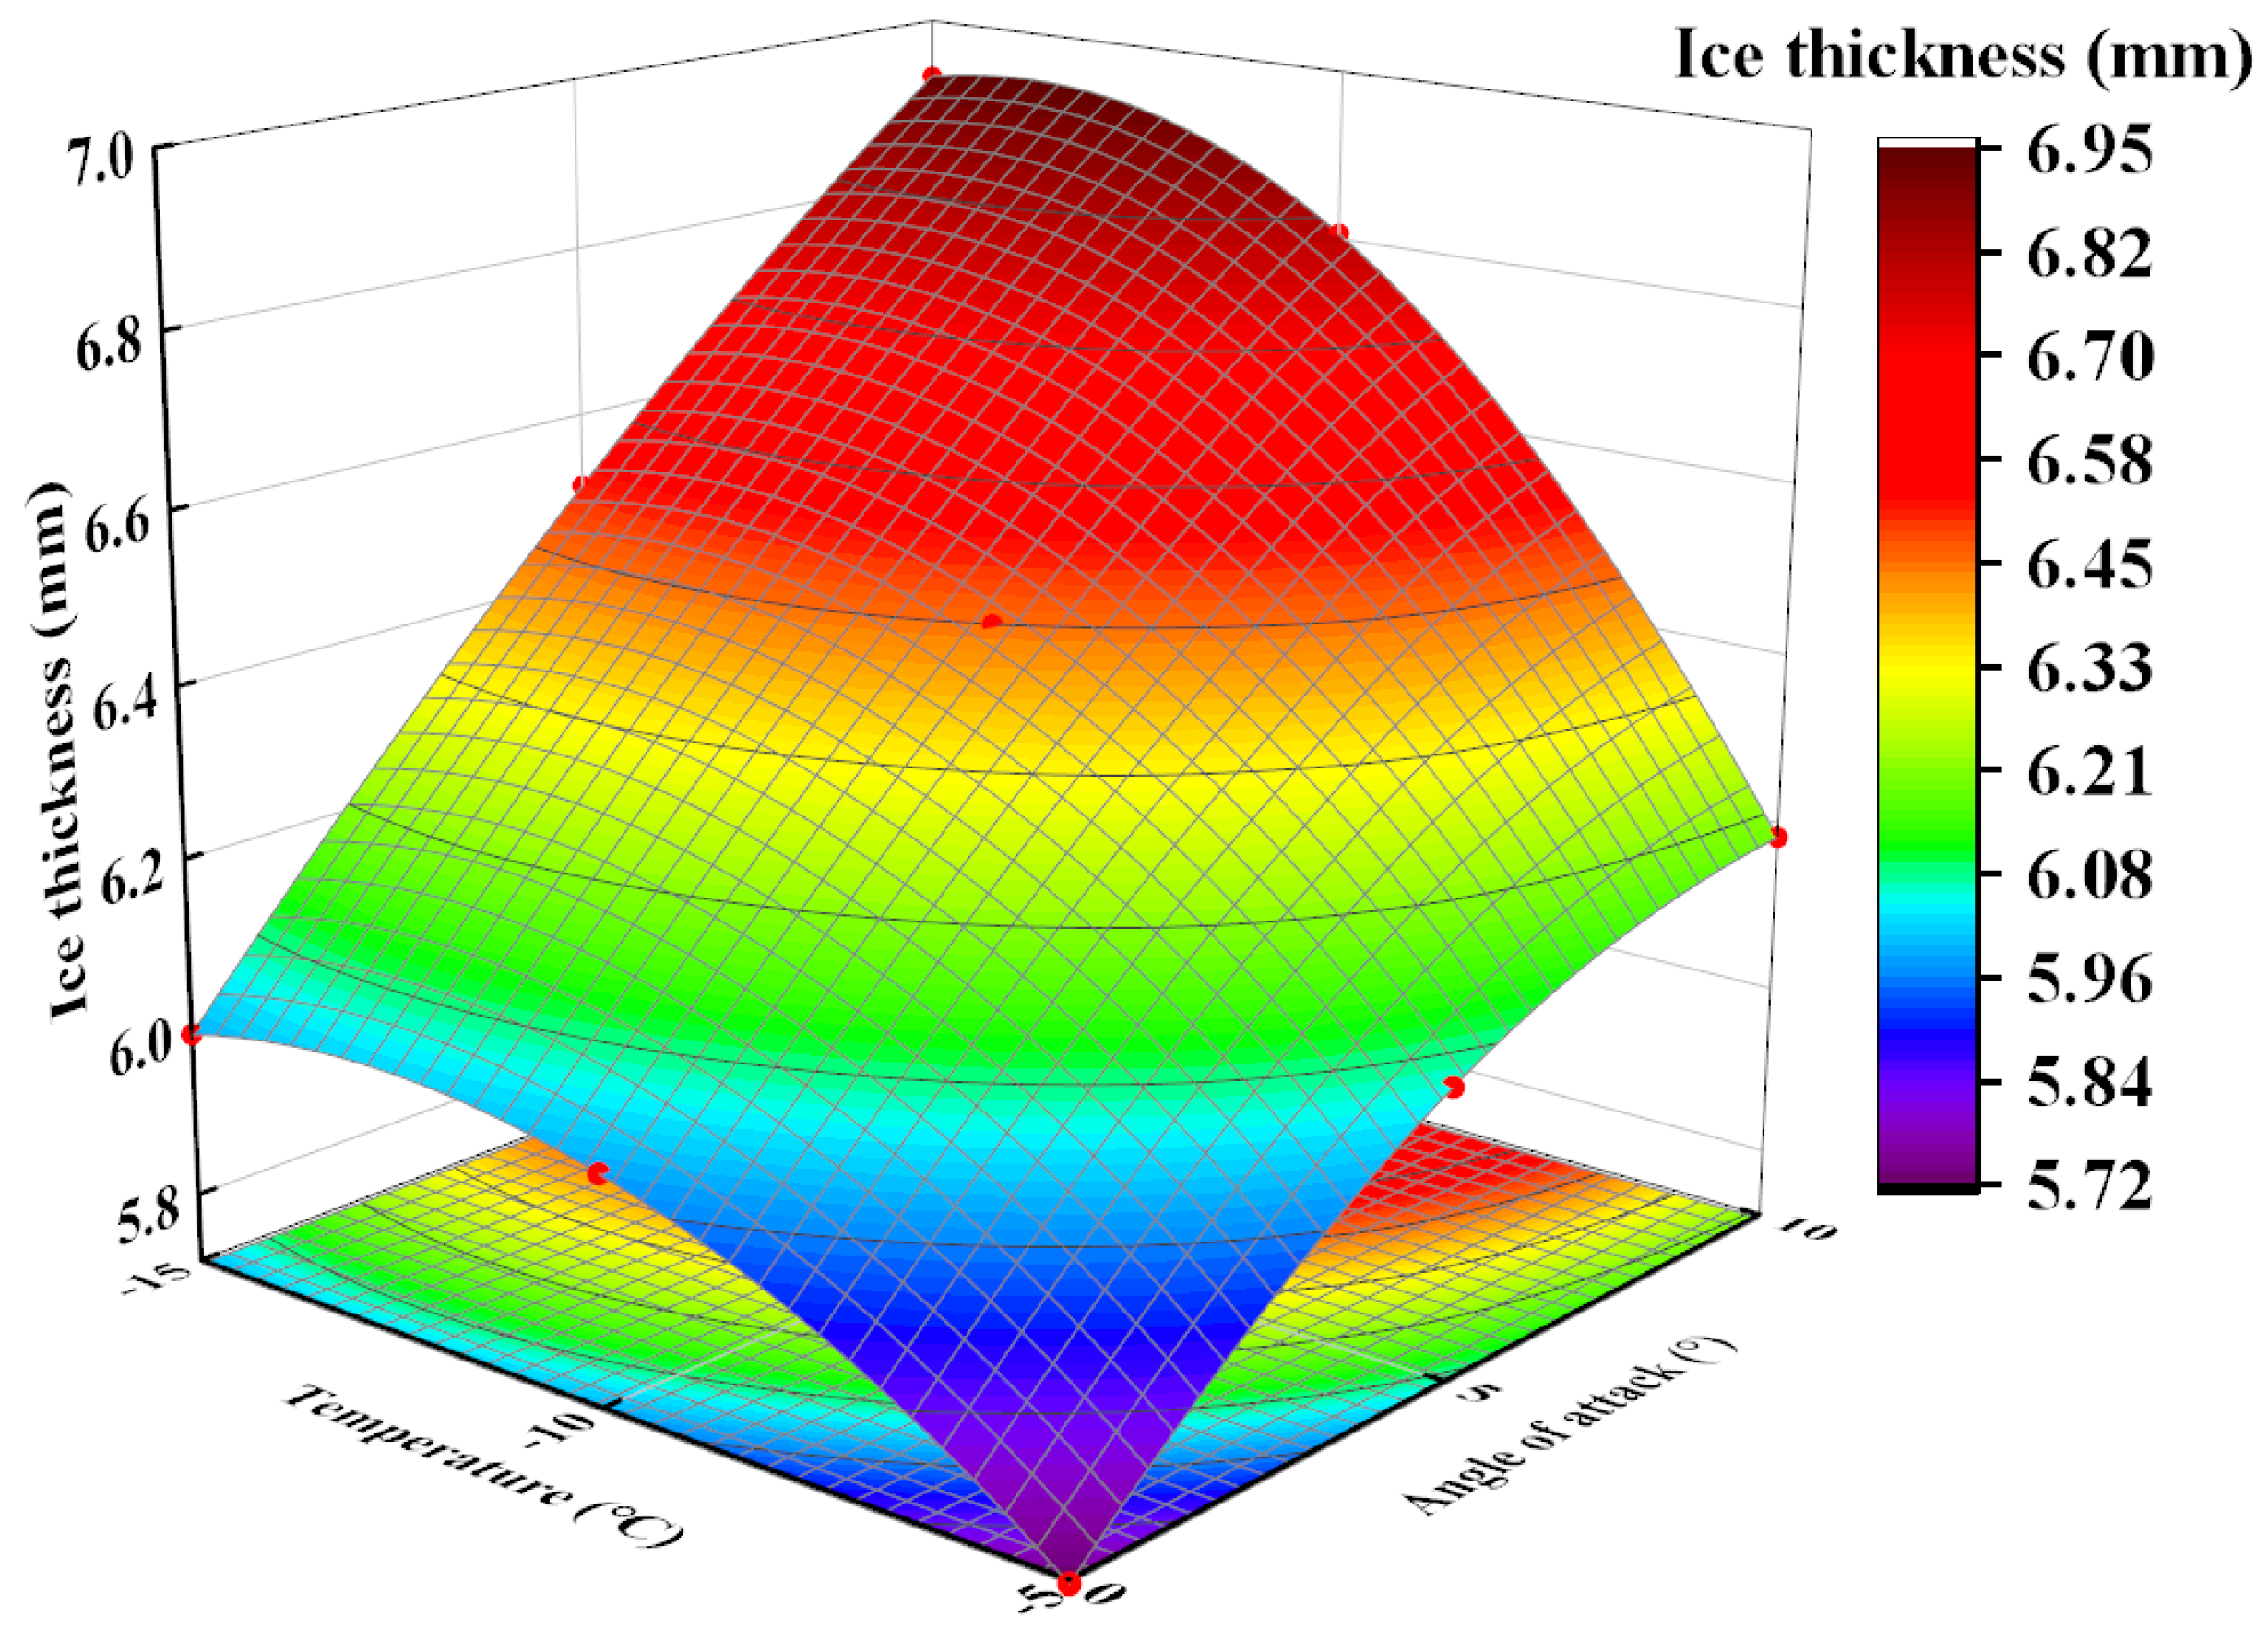
- (6)
- The peak ice accretion thickness is more significantly influenced by angle of attack than by ambient temperature, which is due to the combined effects of airflow characteristics induced by angle of attack and latent heat (phase change) and sensible heat (thermal convection and thermal radiation) induced by ambient temperature.
Author Contributions
Funding
Institutional Review Board Statement
Informed Consent Statement
Data Availability Statement
Conflicts of Interest
References
- Kusiak, A.; Zhang, Z.; Verma, A. Prediction, operations, and condition monitoring in wind energy. Energy 2013, 60, 1–12. [Google Scholar] [CrossRef]
- Lamraoui, F.; Fortin, G.; Benoit, R.; Perron, J.; Masson, C. Atmospheric icing impact on wind turbine production. Cold Reg. Sci. Technol. 2014, 100, 36–49. [Google Scholar] [CrossRef]
- Liu, Z.; Zhang, Y.; Li, Y. Superhydrophobic coating for blade surface ice-phobic properties of wind turbines: A review. Prog. Org. Coatings 2024, 187, 108145. [Google Scholar] [CrossRef]
- Manatbayev, R.; Baizhuma, Z.; Bolegenova, S.; Georgiev, A. Numerical simulations on static Vertical Axis Wind Turbine blade icing. Renew. Energy 2021, 170, 997–1007. [Google Scholar] [CrossRef]
- Xu, Z.; Zhang, T.; Li, X.; Li, Y. Effects of ambient temperature and wind speed on icing characteristics and anti-icing energy de-mand of a blade airfoil for wind turbine. Renew. Energy 2023, 217, 119135. [Google Scholar] [CrossRef]
- Li, Y.; Wang, S.; Liu, Q.; Feng, F.; Tagawa, K. Characteristics of ice accretions on blade of the straight-bladed vertical axis wind turbine rotating at low tip speed ratio. Cold Reg. Sci. Technol. 2018, 145, 1–13. [Google Scholar] [CrossRef]
- Shu, L.; Li, H.; Hu, Q.; Jiang, X.; Qiu, G.; McClure, G.; Yang, H. Study of ice accretion feature and power characteristics of wind turbines at natural icing environment. Cold Reg. Sci. Technol. 2018, 147, 45–54. [Google Scholar] [CrossRef]
- Gao, L.; Liu, Y.; Hu, H. An experimental investigation of dynamic ice accretion process on a wind turbine airfoil model consid-ering various icing conditions. Int. J. Heat Mass Tran. 2019, 133, 930–939. [Google Scholar] [CrossRef]
- Gao, L.; Liu, Y.; Zhou, W.; Hu, H. An experimental study on the aerodynamic performance degradation of a wind turbine blade model induced by ice accretion process. Renew. Energy 2018, 133, 663–675. [Google Scholar] [CrossRef]
- Jin, J.Y.; Virk, M.S. Experimental study of ice accretion on S826 & S832 wind turbine blade profiles. Cold Reg. Sci. Technol. 2019, 169, 102913. [Google Scholar] [CrossRef]
- Hu, Q.; Xu, X.; Leng, D.; Shu, L.; Jiang, X.; Virk, M.; Yin, P. A method for measuring ice thickness of wind turbine blades based on edge detection. Cold Reg. Sci. Technol. 2021, 192, 103398. [Google Scholar] [CrossRef]
- Homola, M.C.; Virk, M.S.; Wallenius, T.; Nicklasson, P.J.; Sundsbø, P.A. Effect of atmospheric temperature and droplet size varia-tion on ice accretion of wind turbine blades. J. Wind Eng. Ind. Aerodyn. 2010, 98, 724–729. [Google Scholar] [CrossRef]
- Jin, J.Y.; Virk, M.S. Study of ice accretion along symmetric and asymmetric airfoils. J. Wind. Eng. Ind. Aerodyn. 2018, 179, 240–249. [Google Scholar] [CrossRef]
- Wang, Q.; Yi, X.; Liu, Y.; Ren, J.; Li, W.; Wang, Q.; Lai, Q. Simulation and analysis of wind turbine ice accretion under yaw condi-tion via an Improved Multi-Shot Icing Computational Model. Renew. Energy 2020, 162, 1854–1873. [Google Scholar] [CrossRef]
- Hann, R.; Hearst, R.J.; Sætran, L.R.; Bracchi, T. Experimental and numerical icing penalties of an S826 airfoil at low Reynolds numbers. Aerospace 2020, 7, 46. [Google Scholar] [CrossRef]
- Baizhuma, Z.; Kim, T.; Son, C. Numerical method to predict ice accretion shapes and performance penalties for rotating vertical axis wind turbines under icing conditions. J. Wind. Eng. Ind. Aerodyn. 2021, 216, 104708. [Google Scholar] [CrossRef]
- Ibrahim, G.M.; Pope, K.; Naterer, G.F. Scaling formulation of multiphase flow and droplet trajectories with rime ice accretion on a rotating wind turbine blade. J. Wind. Eng. Ind. Aerodyn. 2023, 232, 105247. [Google Scholar] [CrossRef]
- Ibrahim, G.M.; Pope, K.; Naterer, G.F. Extended scaling approach for droplet flow and glaze ice accretion on a rotating wind turbine blade. J. Wind. Eng. Ind. Aerodyn. 2023, 233, 105296. [Google Scholar] [CrossRef]
- Reid, T.; Baruzzi, G.S.; Habashi, W.G. FENSAP-ICE: Unsteady conjugate heat transfer simulation of electrothermal de-icing. J. Aircr. 2012, 49, 1101–1109. [Google Scholar] [CrossRef]
- Hannat, R.; Morency, F. Numerical validation of conjugate heat transfer method for anti-/de-icing piccolo system. J. Aircr. 2014, 51, 104–116. [Google Scholar] [CrossRef]
- Beaugendre, H.; Morency, F.; Habashi, W.G. FENSAP-ICE’s three-dimensional in-flight ice accretion module: ICE3D. J. Aircr. 2003, 40, 239–247. [Google Scholar] [CrossRef]
- Ahn, G.B.; Jung, K.Y.; Myong, R.S.; Shin, H.B.; Habashi, W.G. Numerical and experimental investigation of ice accretion on ro-torcraft engine air intake. J. Aircr. 2015, 52, 903–909. [Google Scholar] [CrossRef]
- Clift, R.; Grace, J.R.; Weber, M.E. Bubbles, Drops, and Particles; Academic Press: New York, NY, USA, 1978. [Google Scholar]
- Beaugendre, H.; Morency, F.; Habashi, W.G. Development of a second generation in-flight icing simulation code. J. Fluids Eng. 2006, 128, 378–387. [Google Scholar] [CrossRef]
- Fouladi, H.; Habashi, W.G.; Ozcer, I.A. Quasi-Steady Modeling of Ice Accretion on a Helicopter Fuselage in Forward Flight. J. Aircr. 2013, 50, 1169–1178. [Google Scholar] [CrossRef]
- Tompson, B.E.; Marrochello, M.R. Rivulet formation in surface-water flow on an airfoil in rain. AIAA J. 1999, 37, 45–49. [Google Scholar] [CrossRef]
- Beaugendre, H.; Morency, F.; Habashi, W.G.; Benquet, P. Roughness implementation in FENSAP-ICE: Model calibration and influence on ice shapes. J. Aircr. 2003, 40, 1212–1215. [Google Scholar] [CrossRef]
- Croce, G.; De Candido, E.; Habashi, W.G.; Munzar, J.; Aubé, M.S.; Baruzzi, G.S.; Aliaga, C. FENSAP-ICE: Analytical Model for Spatial and Temporal Evolution of In-Flight Icing Roughness. J. Aircr. 2010, 47, 1283–1289. [Google Scholar] [CrossRef]
- Tran, P.; Brahimi, M.T.; Paraschivoiu, I.; Pueyo, A.; Tezok, F. Ice accretion on aircraft wings with thermodynamic effects. J. Aircr. 1995, 32, 444–446. [Google Scholar] [CrossRef]
- Von Donehoff, A.; Horton, E. A low-speed experimental investigation of the effect of a sandpaper type of roughness on boundary-layer transition. NACA Rep. 1956, 1349. [Google Scholar] [CrossRef]
- Zhang, Z.X.; Dong, Z.N. Viscous Fluid Mechanics; Tsinghua University Press: Beijing, China, 1999. (In Chinese) [Google Scholar]
- Battisti, L. Wind Turbines in Cold Climates; Springer Science and Business Media LLC: Dordrecht, The Netherlands, 2015. [Google Scholar]
- Lu, H.; Xu, Y.; Li, H.; Zhao, W. Numerical study on glaze ice accretion characteristics over time for a NACA 0012 airfoil. Coatings 2023, 14, 55. [Google Scholar] [CrossRef]


| Type | Values |
|---|---|
| Far-field | Pressure: 101,325 Pa Temperature: 258–268 K Speed: 5–15 m/s LWC: 0.6 g/m3 |
| Wall | No slip |
Disclaimer/Publisher’s Note: The statements, opinions and data contained in all publications are solely those of the individual author(s) and contributor(s) and not of MDPI and/or the editor(s). MDPI and/or the editor(s) disclaim responsibility for any injury to people or property resulting from any ideas, methods, instructions or products referred to in the content. |
© 2024 by the authors. Licensee MDPI, Basel, Switzerland. This article is an open access article distributed under the terms and conditions of the Creative Commons Attribution (CC BY) license (https://creativecommons.org/licenses/by/4.0/).
Share and Cite
Wang, C.; Lin, W.; Lin, X.; Wu, T.; Meng, Z.; Cai, A.; Xu, Z.; Li, Y.; Feng, F. The Influence of Angle of Attack on the Icing Distribution Characteristics of DU97 Blade Airfoil Surface for Wind Turbines. Coatings 2024, 14, 160. https://doi.org/10.3390/coatings14020160
Wang C, Lin W, Lin X, Wu T, Meng Z, Cai A, Xu Z, Li Y, Feng F. The Influence of Angle of Attack on the Icing Distribution Characteristics of DU97 Blade Airfoil Surface for Wind Turbines. Coatings. 2024; 14(2):160. https://doi.org/10.3390/coatings14020160
Chicago/Turabian StyleWang, Chuanxi, Weirong Lin, Xuefeng Lin, Tong Wu, Zhe Meng, Anmin Cai, Zhi Xu, Yan Li, and Fang Feng. 2024. "The Influence of Angle of Attack on the Icing Distribution Characteristics of DU97 Blade Airfoil Surface for Wind Turbines" Coatings 14, no. 2: 160. https://doi.org/10.3390/coatings14020160