
Factors Affecting the Strength Formation Mechanism and Water Stability of Geopolymer Stabilized Phosphogypsum in Road Construction
 ,
,
Abstract
:1. Introduction
2. Experimental Test
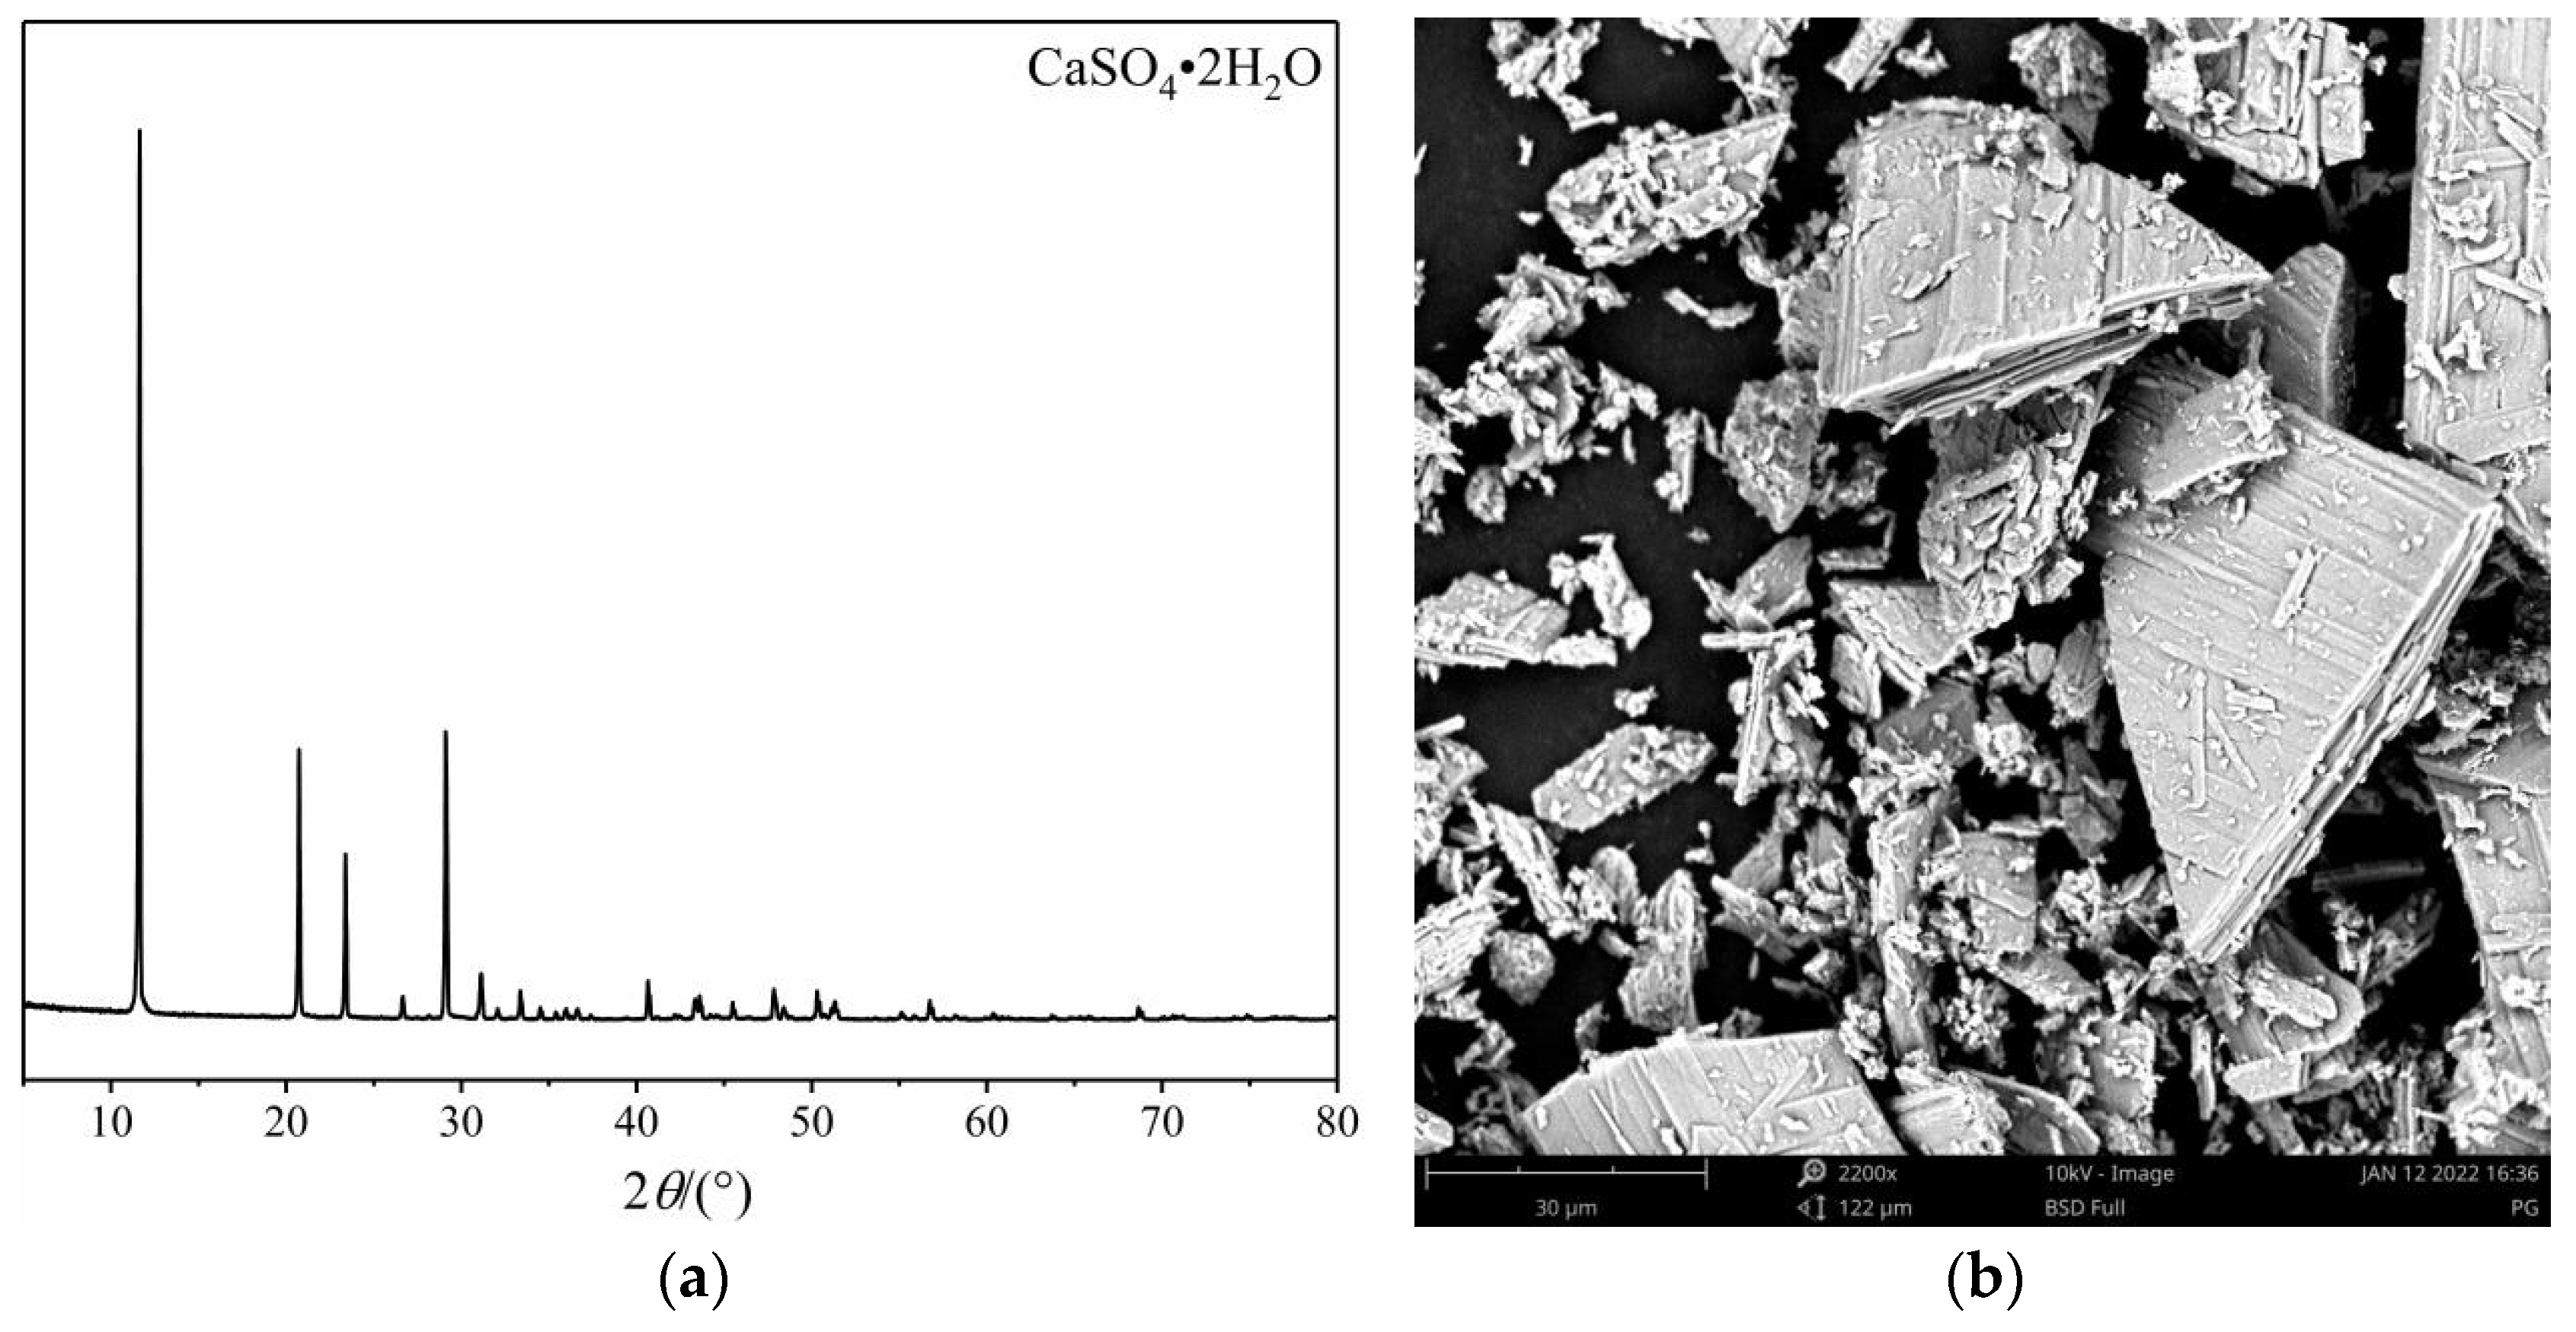
2.1. Materials
2.2. Mix Proportions
- is the solid alkali-activator content in g;
- is the FA content in g;
- is the GBFS content in g.
- (1)
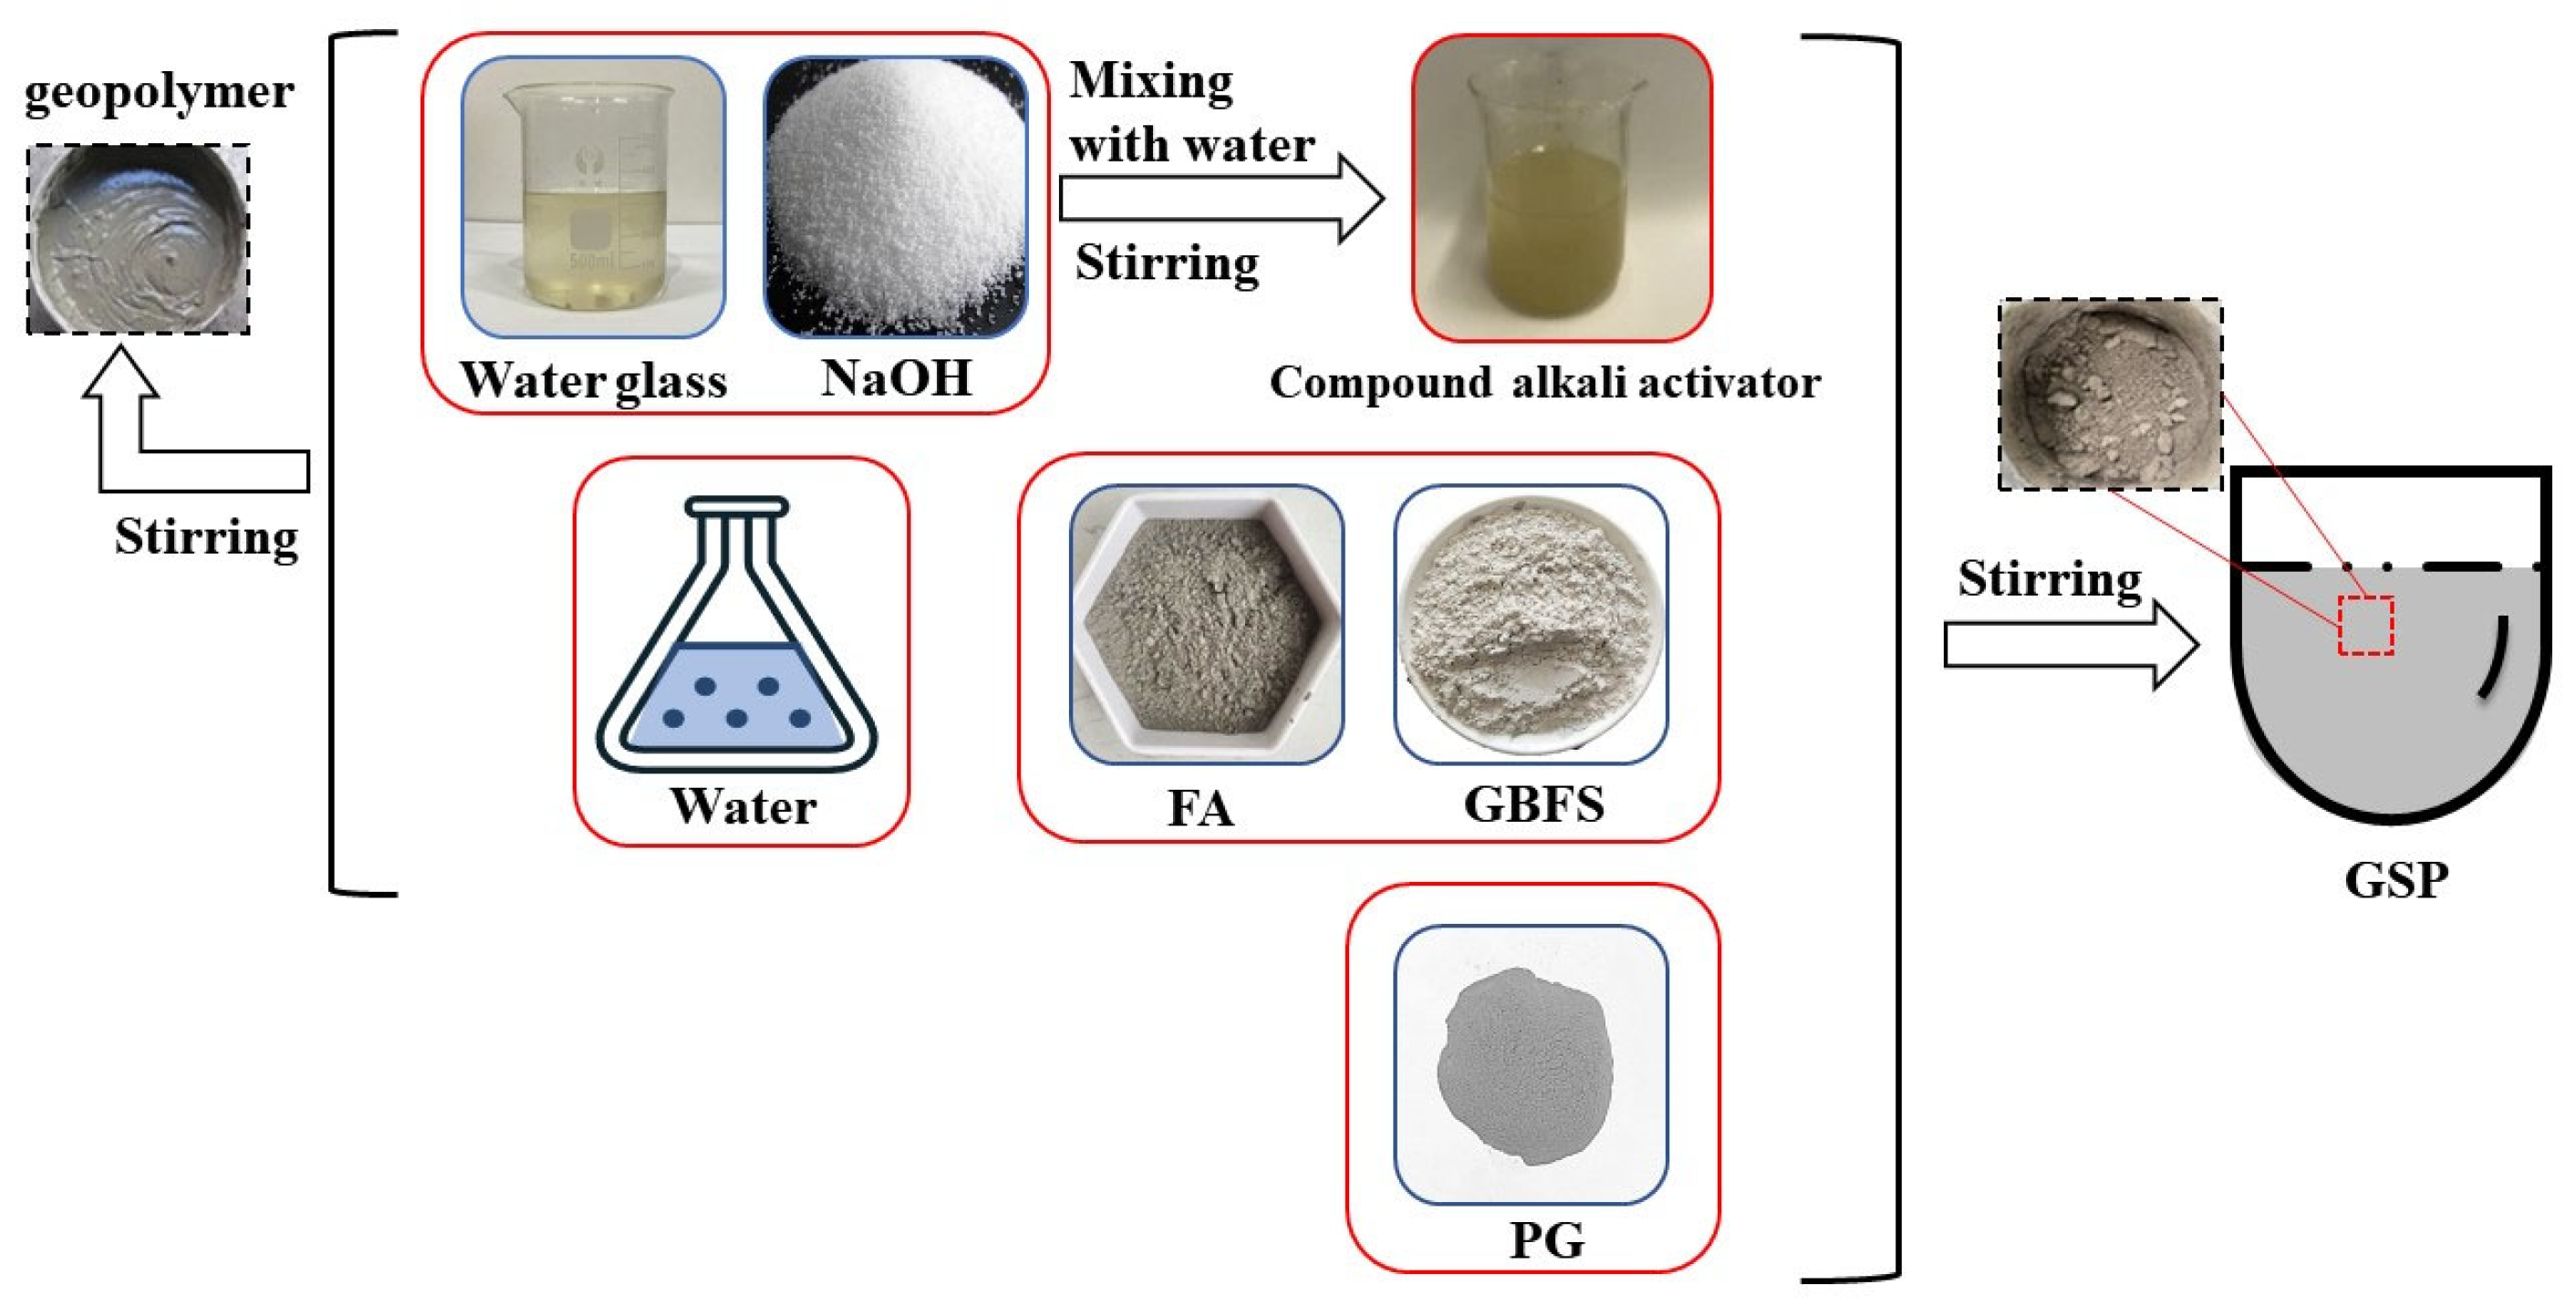
- Preparation of the alkali-activator: before preparing GSP, the alkali-activator should be prepared. To begin, weigh the water glass, then weigh the NaOH at a ratio of 20.3 g of NaOH for every 100 g of water glass. The NaOH should then be weighed after being dissolved in the water glass. The glass rod should next be used to stir until all of the NaOH particles have been dissolved, and then the mixture should be cooled. Water vapor will evaporate as the temperature decreases. Thus, the evaporated water ought to be added following the mixture’s complete cooling.
- (2)
- Preparation of GSP: Before sampling, the maximum dry density and optimum water content of the GSP were determined by a compaction test by the Test Methods of Soils for Highway Engineering (JTG 3430-2020) [34]. It was discovered that the optimum water content for GSP was about 20%, while the maximum dry density was around 1.5 g/cm3. To generate GSP samples by the mix ratios in Table 3, take into account the maximum dry density and optimum water content mentioned above. Then, combine the FA, GBFS, PG, and alkali-activator in the mixer in the ratio. A cylindrical sample is generated and placed in a standard curing box for curing by the Test Methods of Materials Stabilized with Inorganic Binders for Highway Engineering (JTG E51-2009) [35]. The sample has an inner diameter of 50 mm and a height of 50 mm.
2.3. Test Methods
2.3.1. Unconfined Compressive Strength (UCS)
- is the UCS, in MPa;
- is the maximum pressure at the time of sample failure, in N;
- is the cross-sectional area of the sample, in mm2.
2.3.2. Expansion and California Bearing Ratio (CBR)
2.3.3. Resilient Modulus
2.3.4. Cohesion Force and Internal Friction Angle
2.3.5. Softening Coefficient
2.3.6. Mass Loss Rate after Soaking and Average Water Absorption
2.3.7. Dry and Wet Cycle (DWC)
- is the strength loss rate in % under DWC conditions;
- is the UCS under standard curing conditions, in MPa;
- is the UCS under DWC conditions, in MPa.
2.3.8. X-ray Diffraction (XRD) and Scanning Electron Microscopy (SEM)
3. Results and Discussion
3.1. Mechanical Properties of GSP
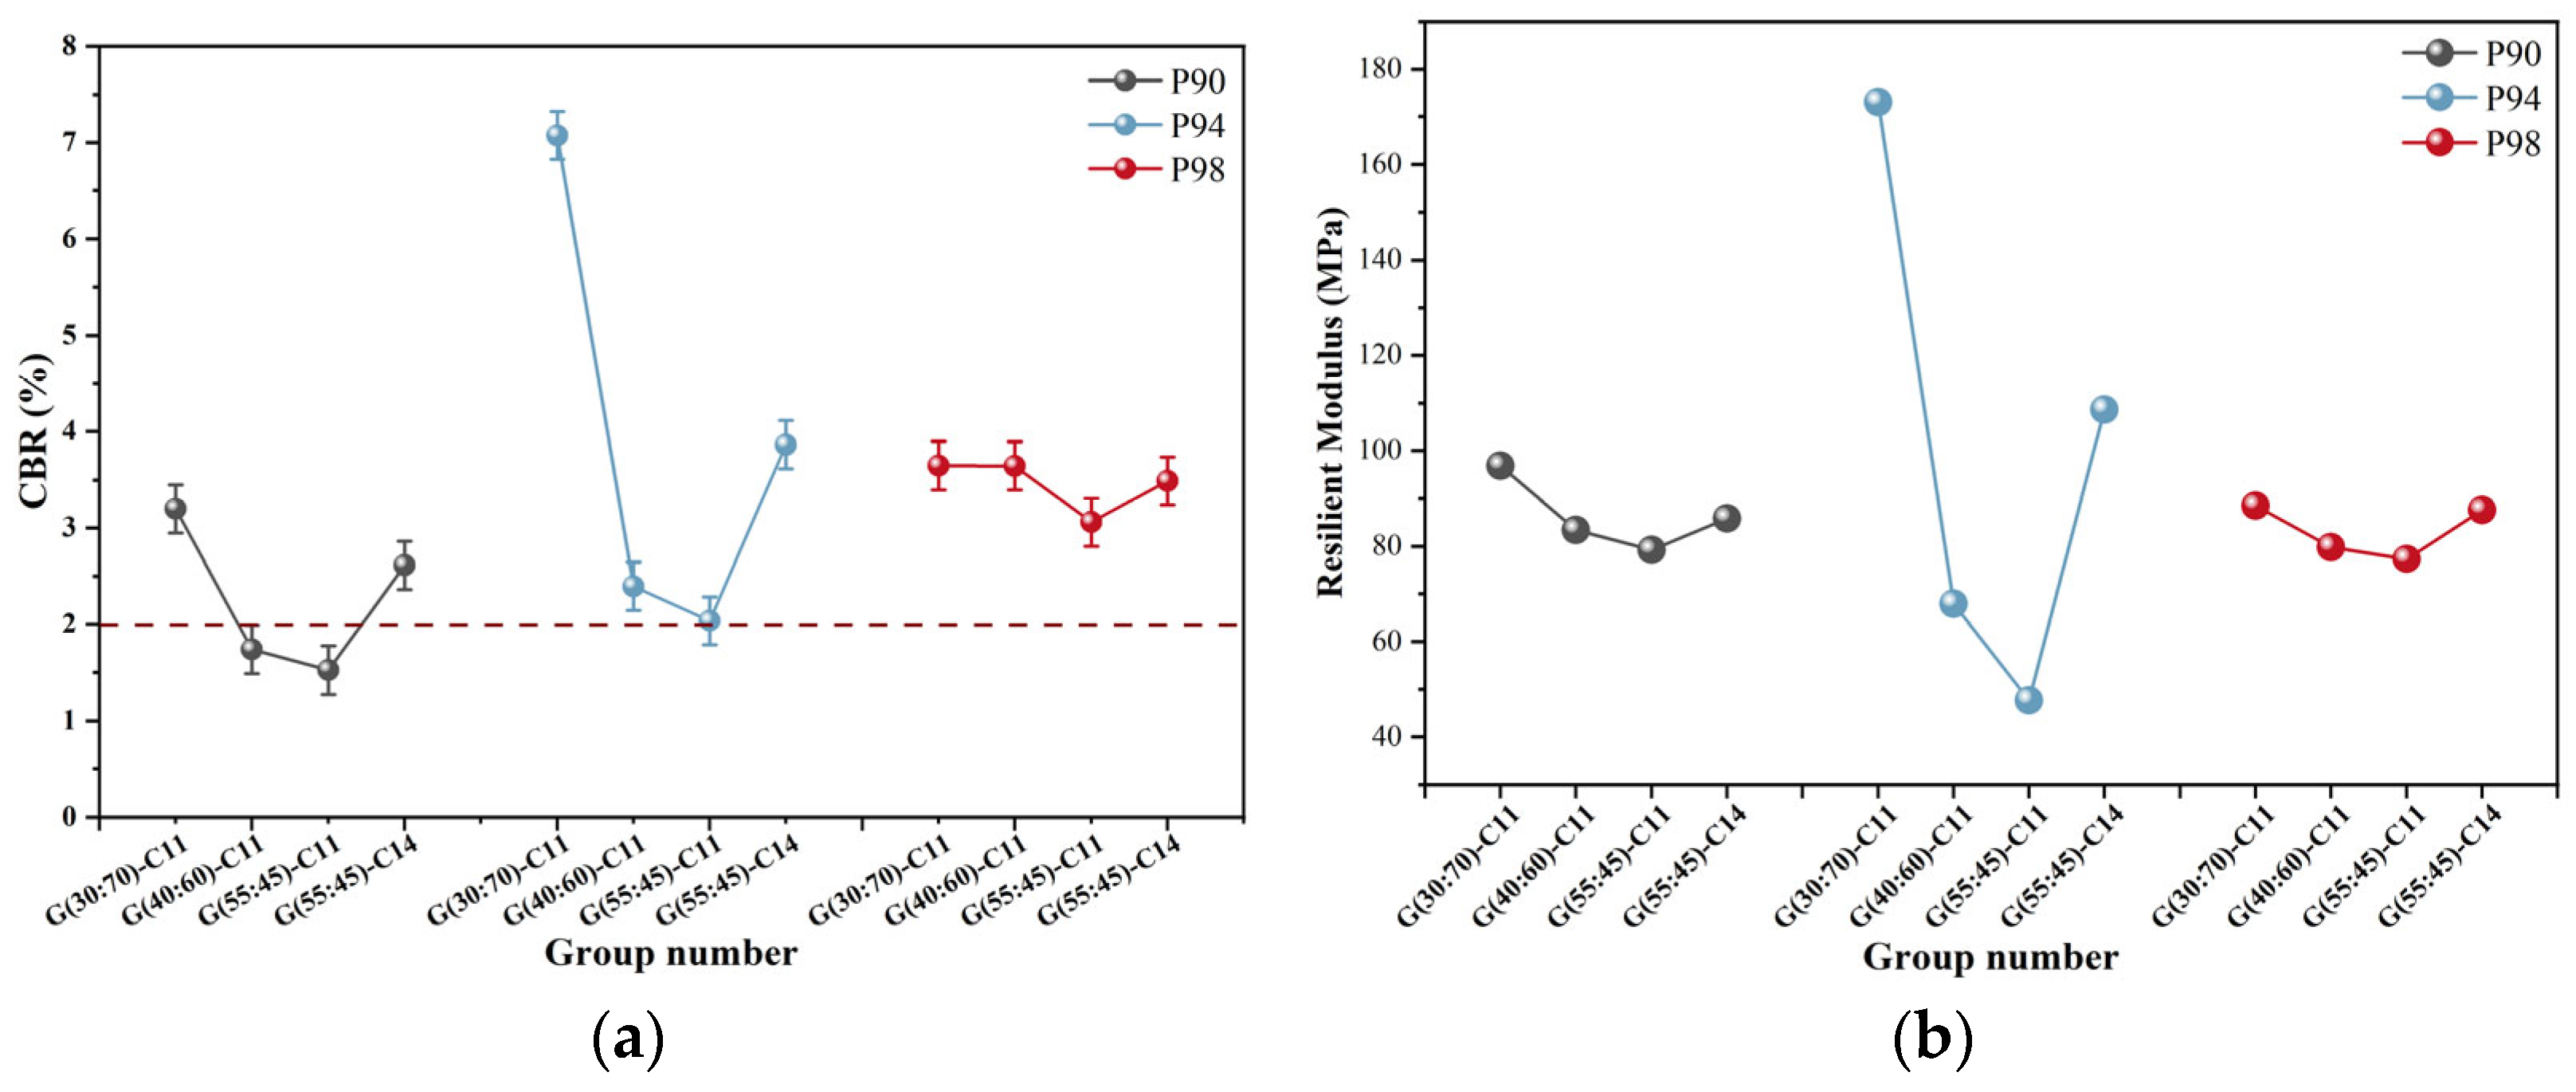
3.1.1. California Bearing Ratio (CBR) and Resilient Modulus
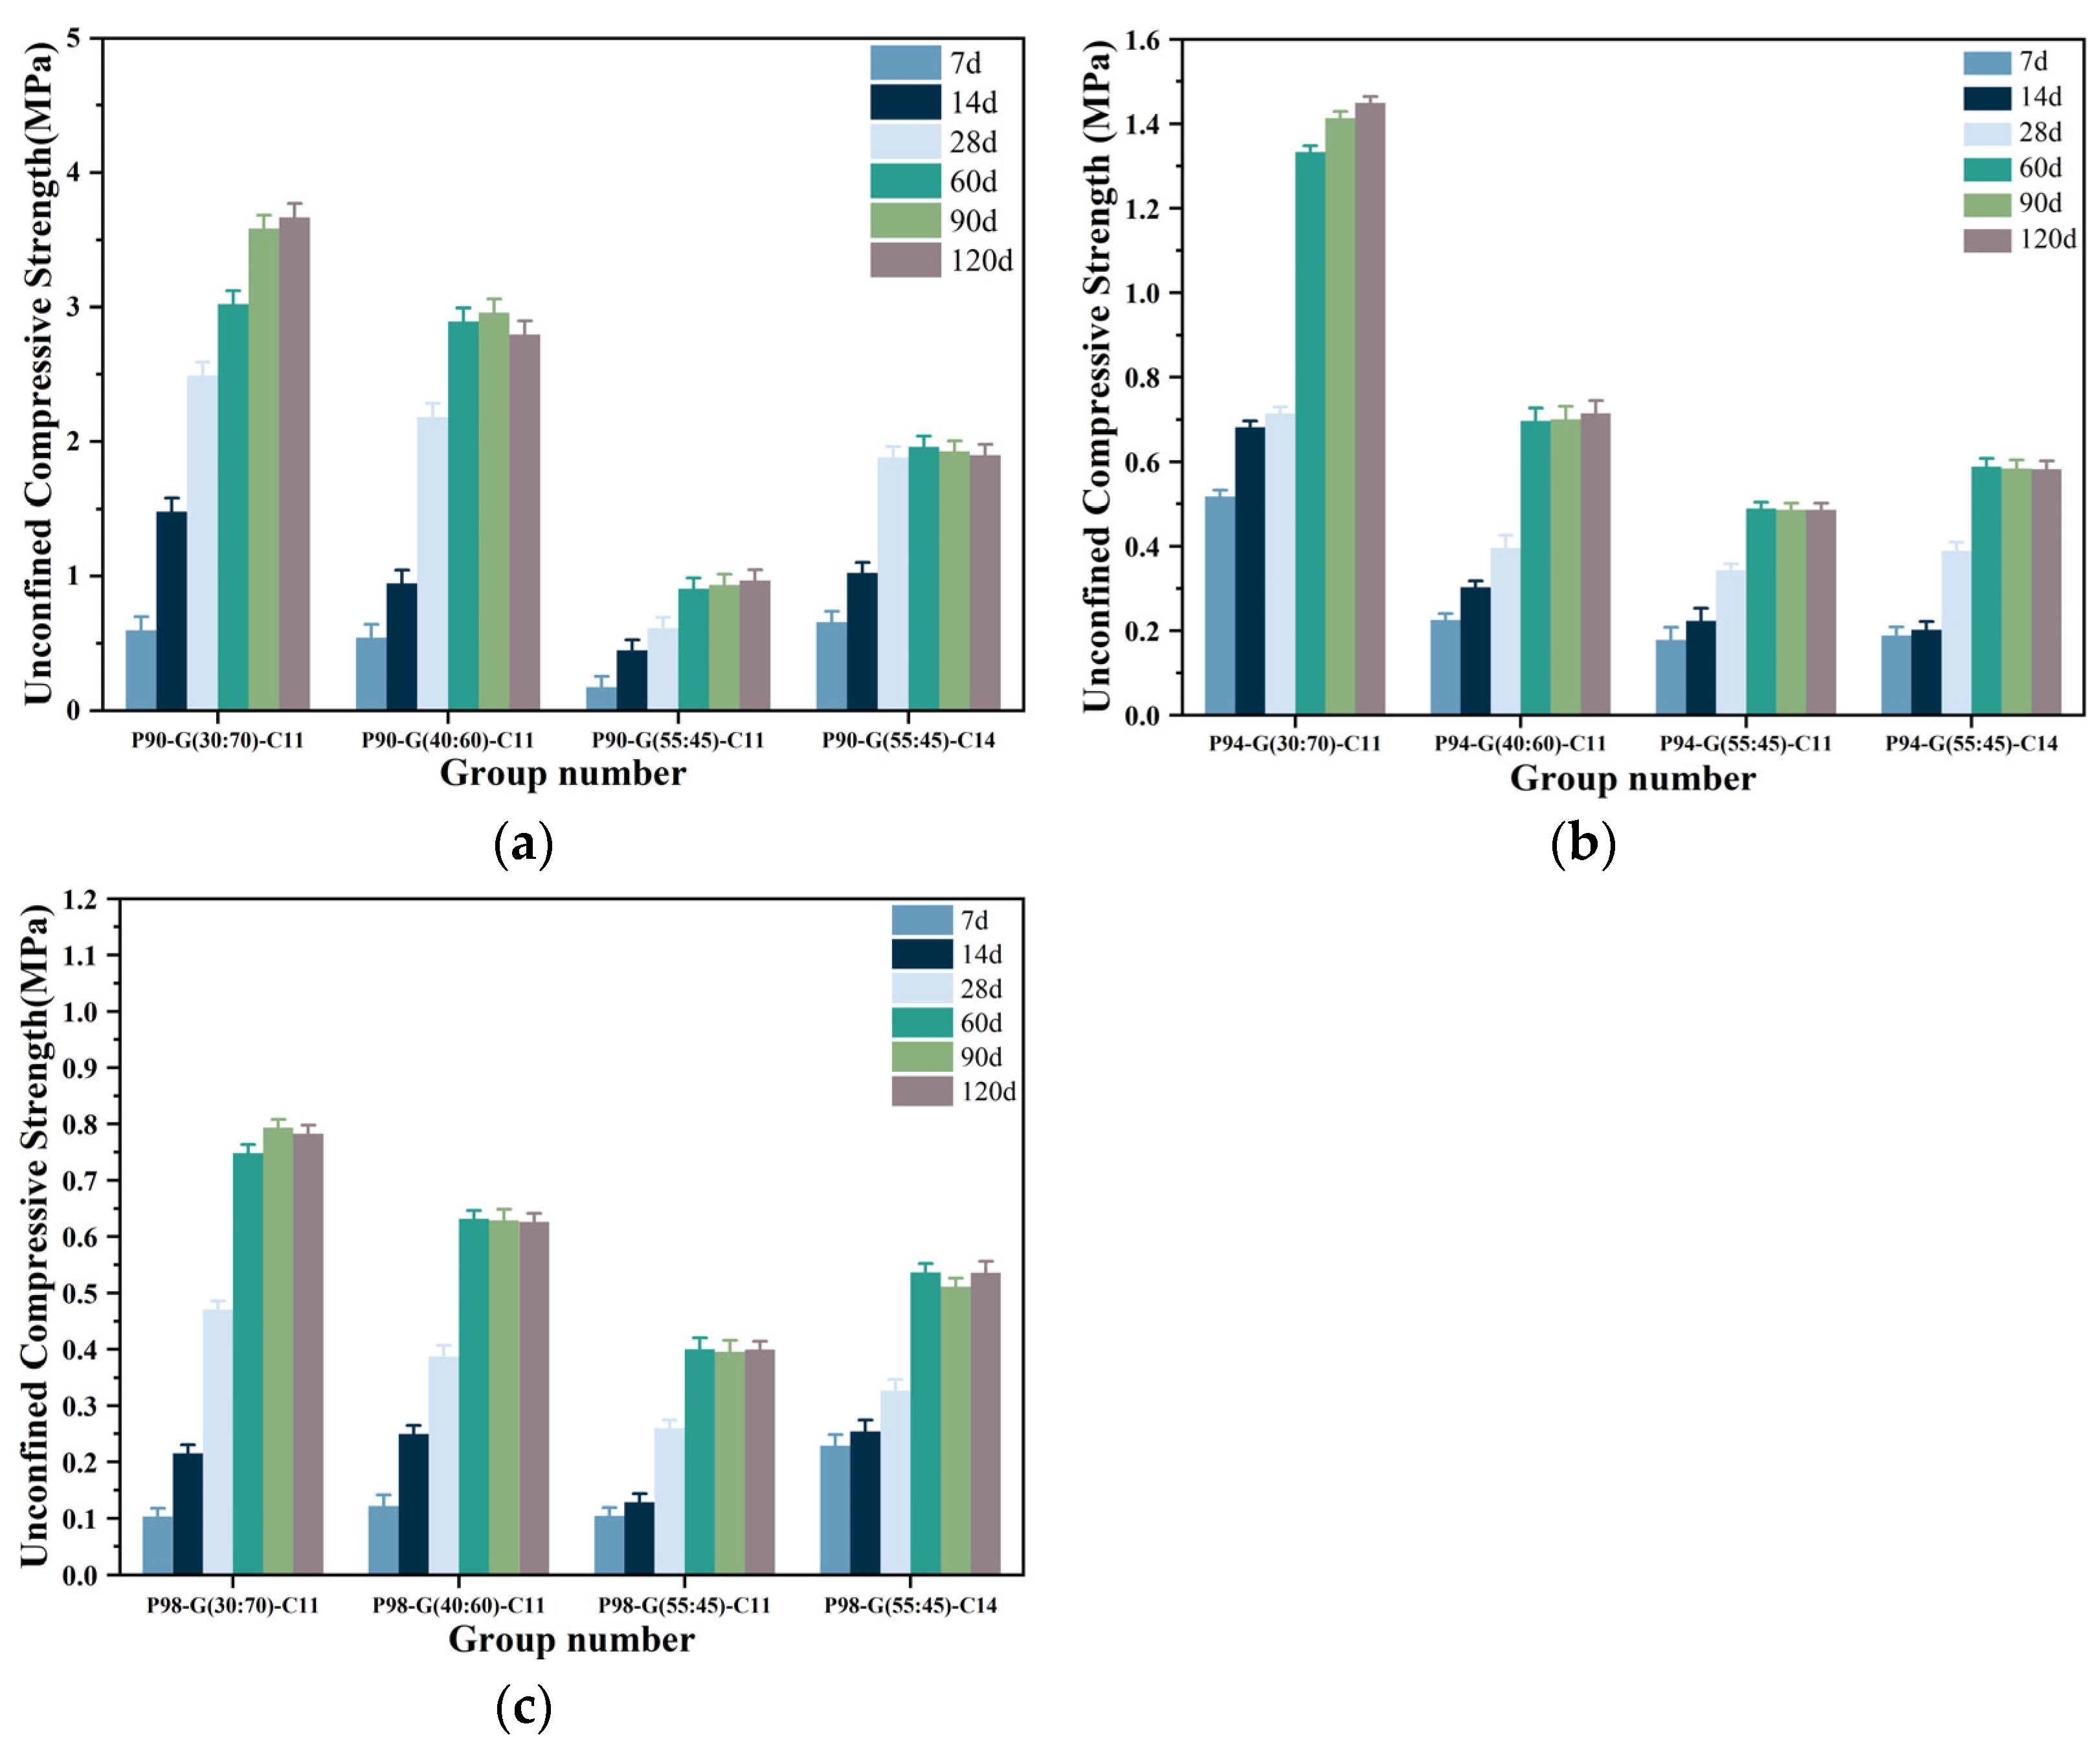
3.1.2. Unconfined Compressive Strength (UCS)
3.1.3. Cohesive Force and Internal Friction Angle
3.1.4. Discussion
3.2. Water Stability of GSP
3.2.1. Expansion and Average Water Absorption
3.2.2. The Properties of GSP after Soaking in Water
- (1)
- Softening coefficient
- (2)
- Mass loss rate after soaking in water (MLRs)
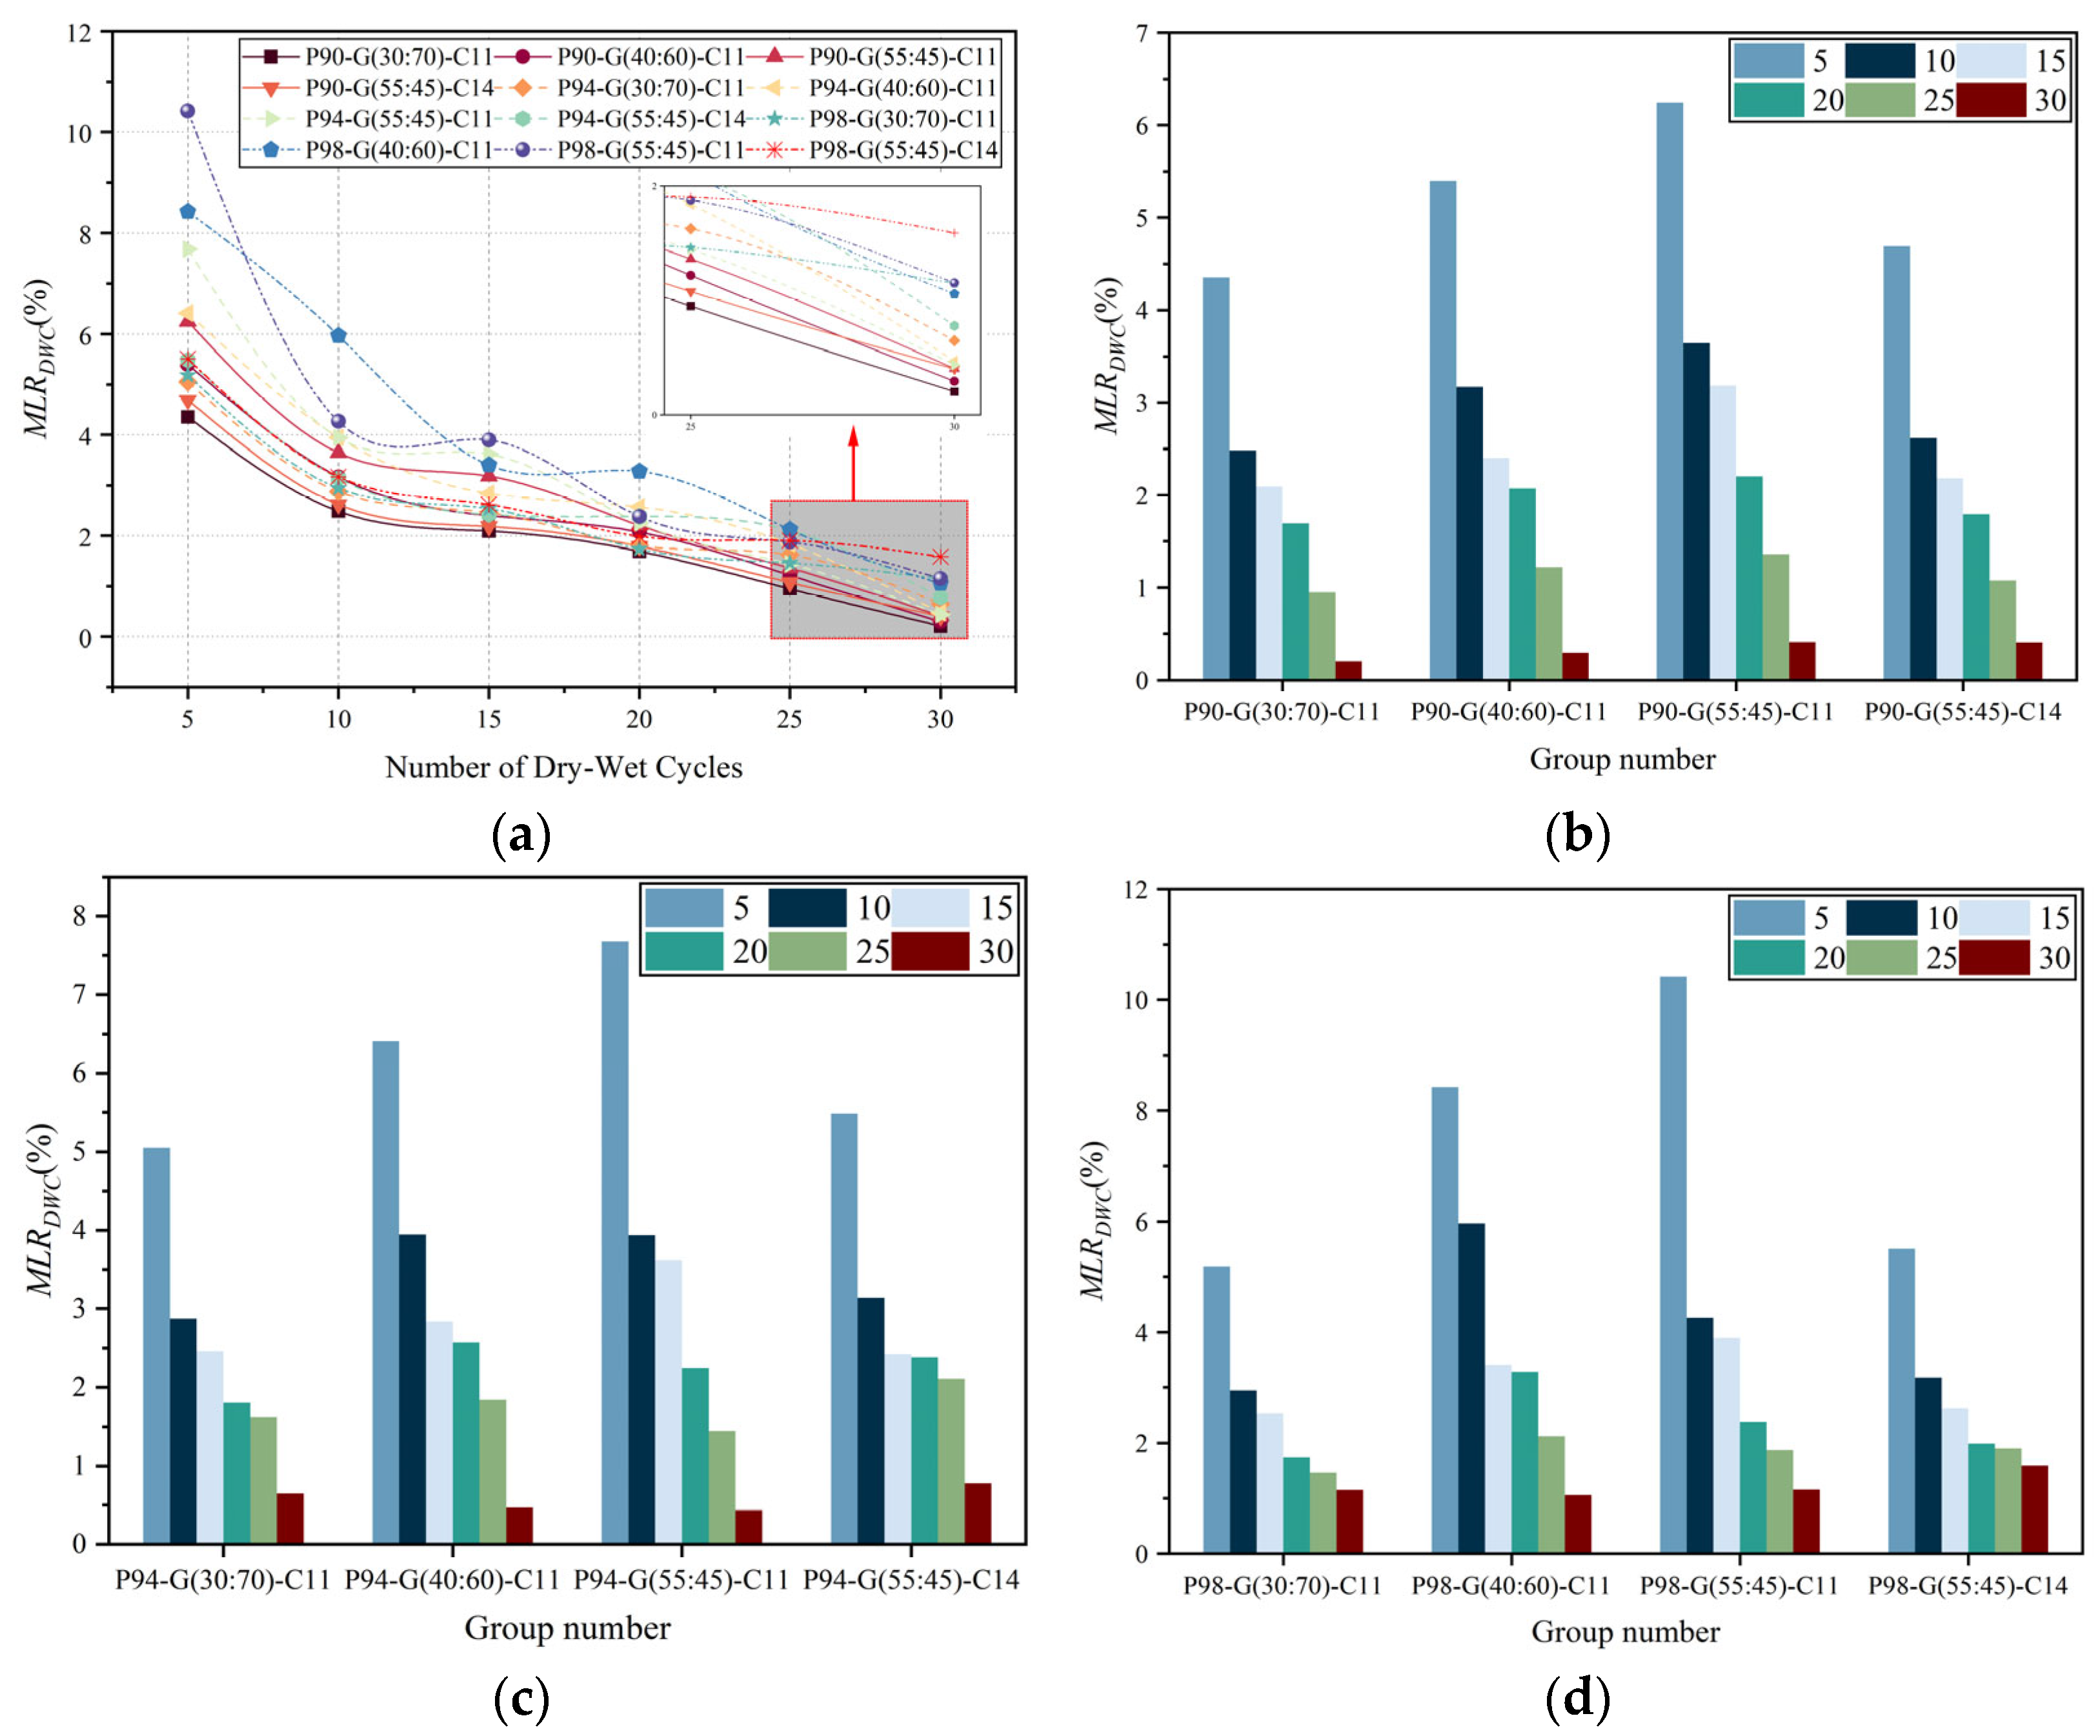
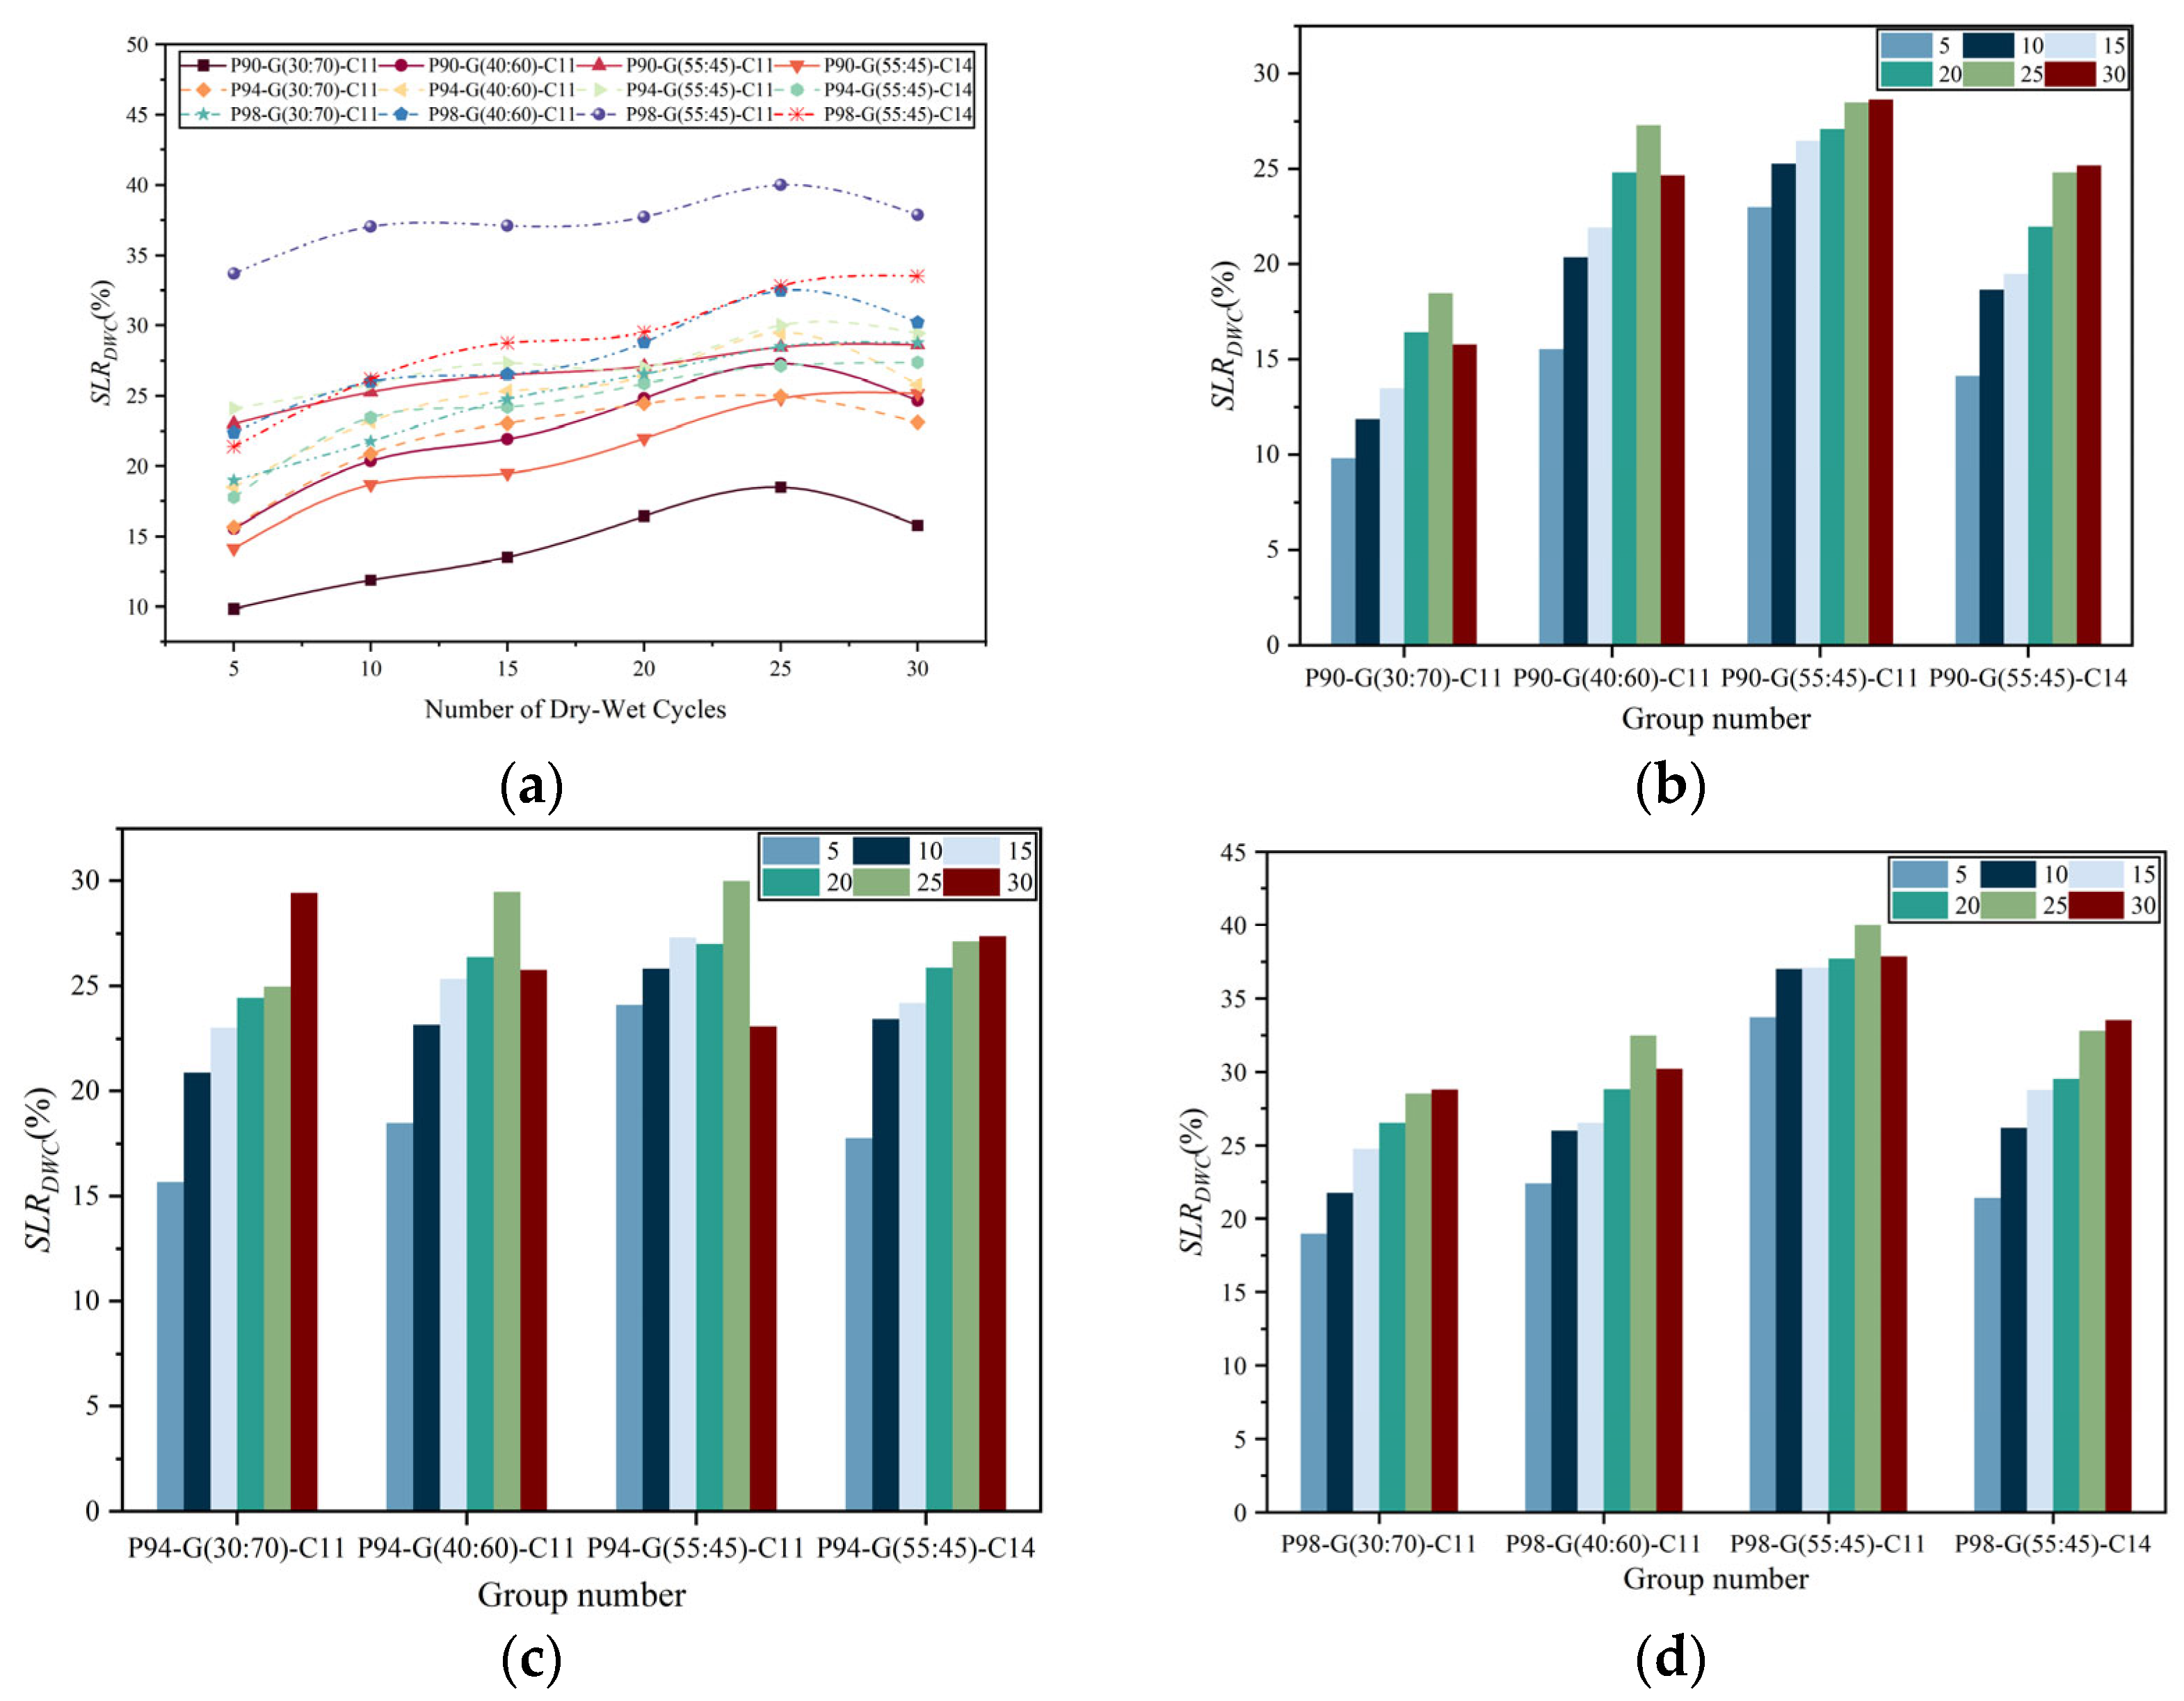
3.2.3. Dry and Wet Cycles (DWC)
3.2.4. Discussion
3.3. Discussion of Strength Formation Mechanism
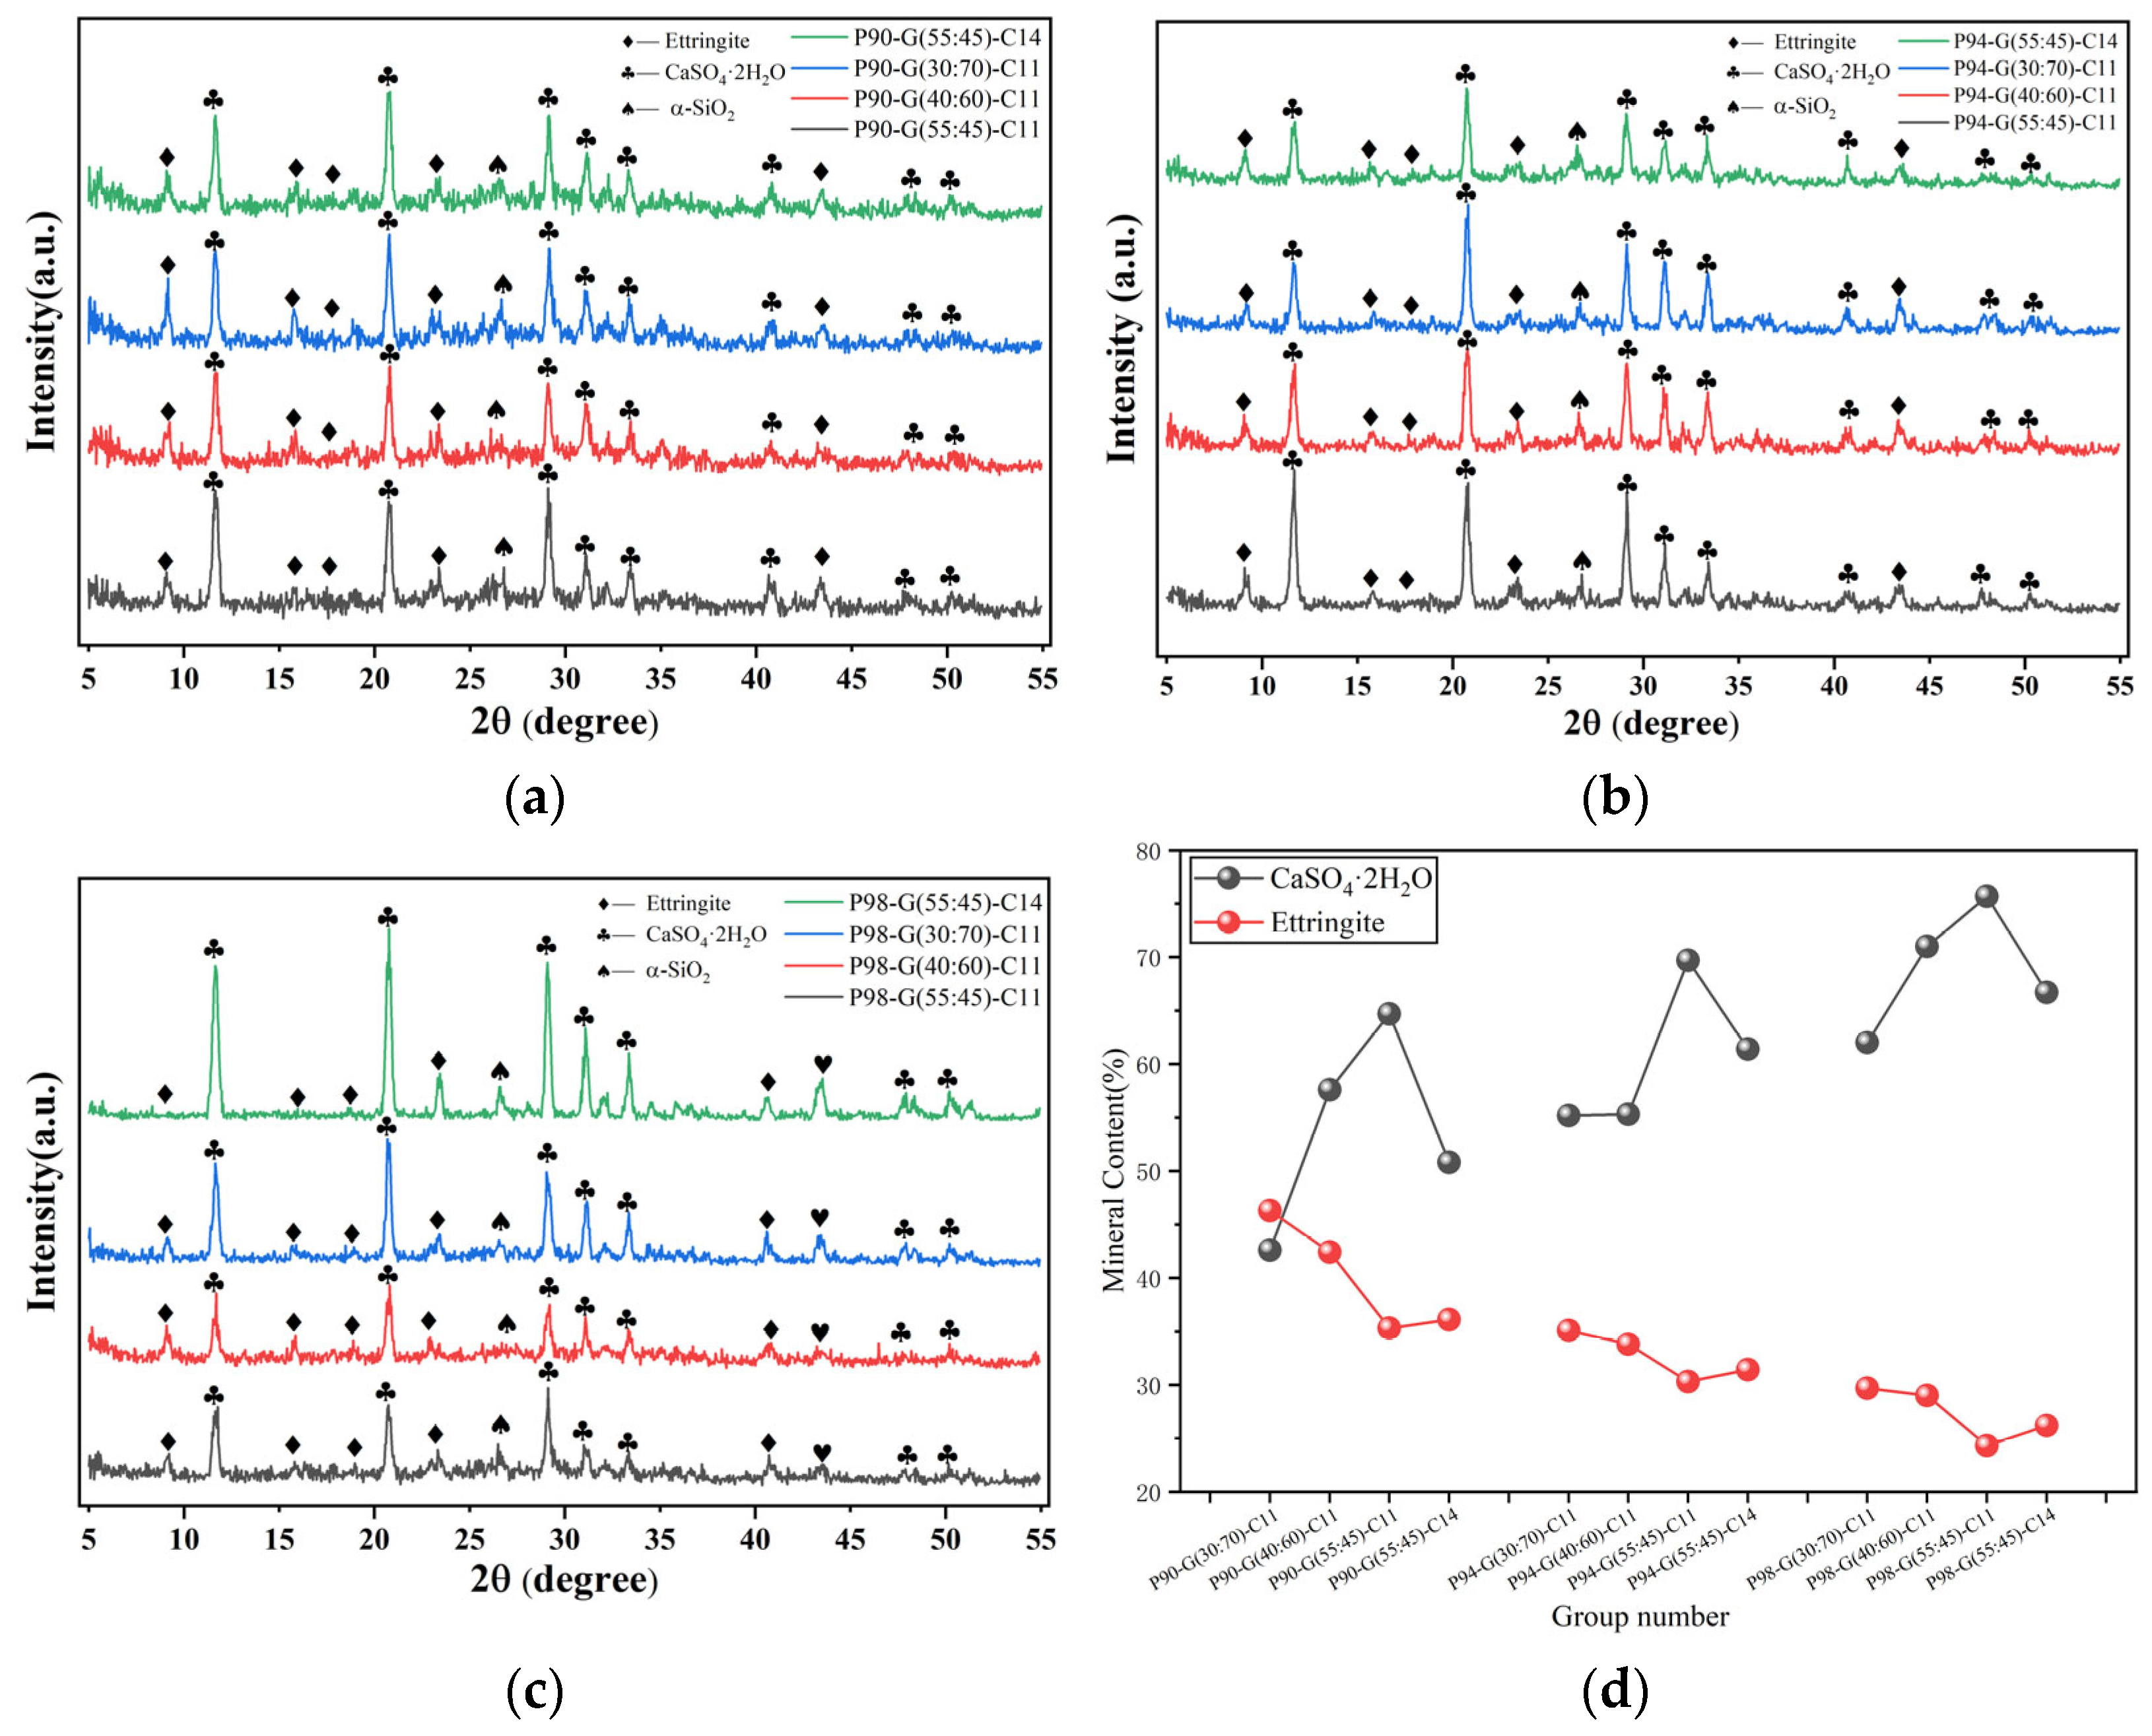
3.3.1. XRD
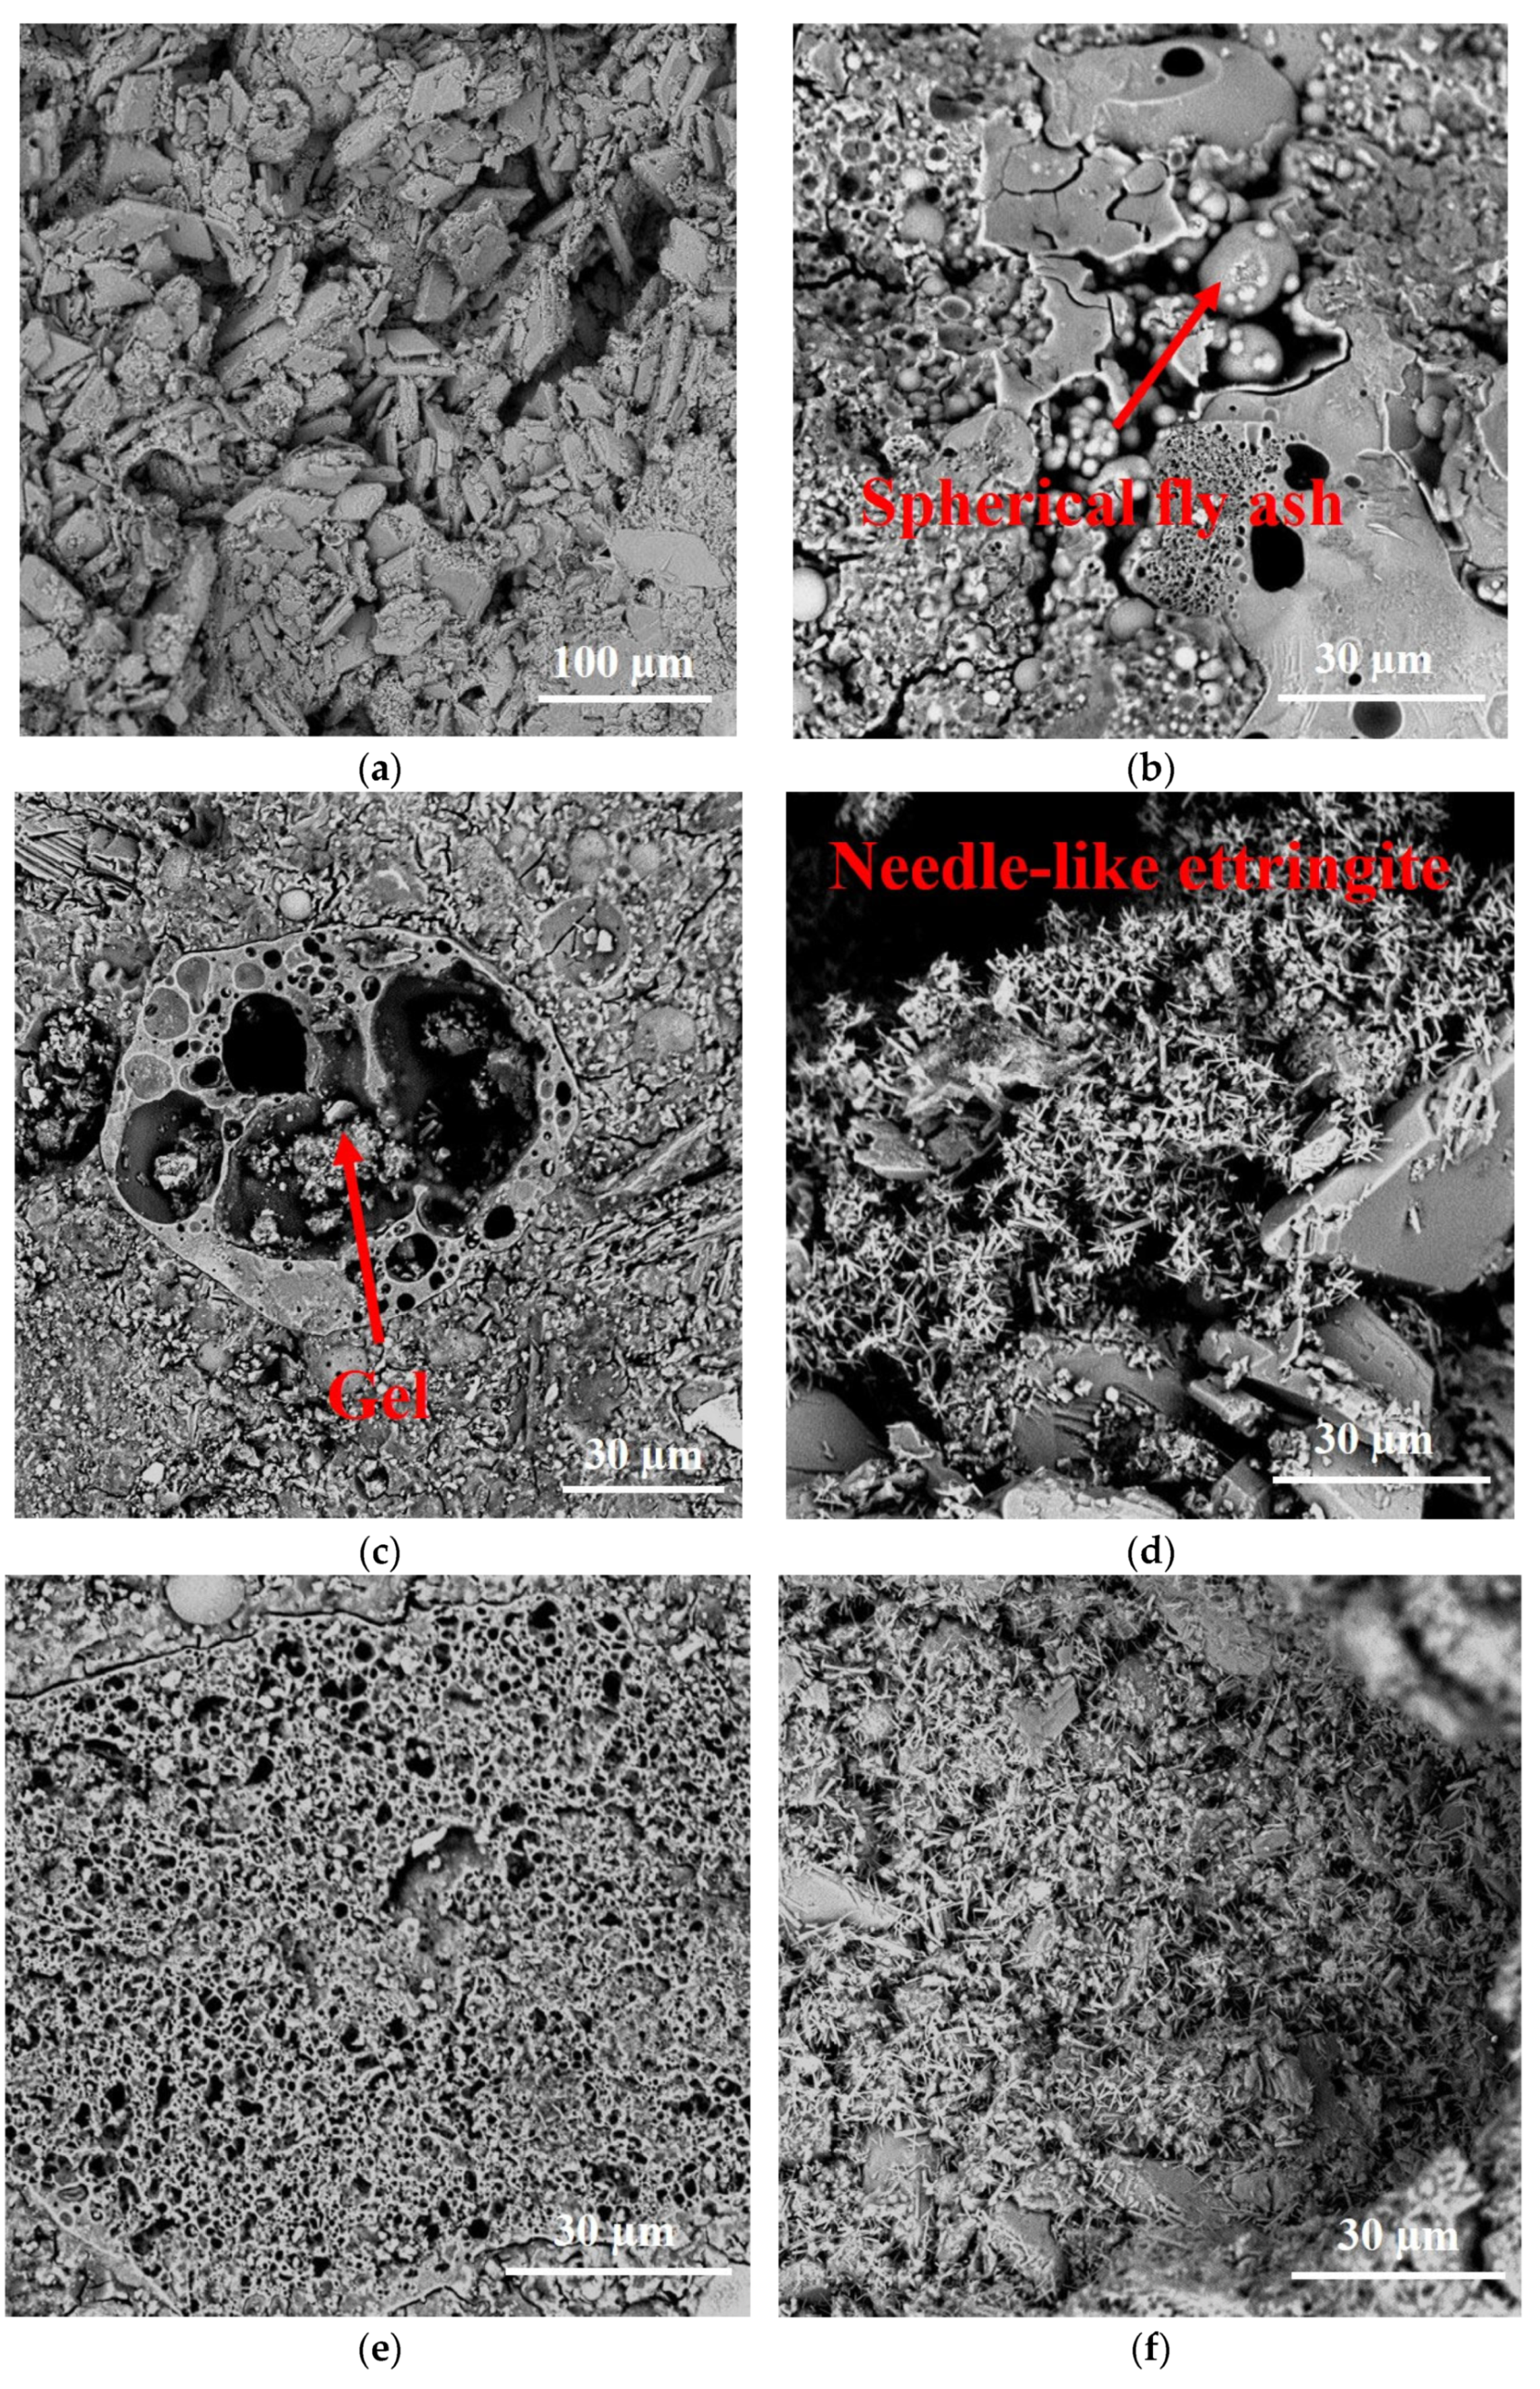
3.3.2. SEM
3.3.3. Strength Formation Mechanism
- (1)
- (2)
- Chemical reaction: GSP uses geopolymer as a curing agent to solidify PG as a roadbed filler. It takes into account the hydration products formed by geopolymer, which can react with PG to create a further hydration reaction to form ettringite and support the development of strength, in addition to the chemical cementation action of geopolymer. PG serves as a sulfate activator and a calcium source in this process, and water glass and sodium hydroxide serve as alkali-activator in this study. A few sources of silicon can also be found in a water glass at the same time. Lastly, with GBFS and FA, two potentially active alumino-silicate materials, ion dissolution and ion exchange will take place to generate C-S-H gel, N-A-S-H gel and ettringite under the double activation of sulfate and alkaline [17].
- (3)
- A combination of chemical reactions and physical actions: we believe that physical actions and chemical reactions in GSP promote strength development by, together, decreasing the porosity in GSP. Ettringite can fill the pores between PG particles thanks to its minor expansibility, and C-S-H gel with cementation property can connect dispersed PG particles, which promotes the development of strength [53]. The fewer number of pores and smaller pore size of the solidified soil when an equal amount of hydration products are produced, the larger the increase in density of the hydration products that fill the pores between particles and, hence, the more powerful the cementation effect the hydration products produce. This may encourage the initially distributed PG particles to cluster tightly together [54]. The large development and excessive expansion of ettringite in low-porosity soils, however, might cause disruption and splitting of solidified soil in the late stages of curing, which can cause strength reversion [55].
4. Conclusions
- (1)
- The content of geopolymer, the ratio of FA to GBFS in geopolymer, and the amount of alkali-activator in geopolymer all affect the mechanical properties of GSP. When the content of geopolymer increases, or the ratio of FA to GBFS decreases, or the alkali-activator increases, the mechanical properties of GSP will be better developed.
- (2)
- Physical compaction, chemical activation and ion exchange, gel and ettringite bonding, aggregation, and physical filling to produce a dense structure are the primary processes involved in the development of the mechanical strength of GSP.
- (3)
- There is a positive correlation between the mechanical properties, water stability, and durability of GSP. This is because all three properties are affected by the overall compactness of GSP. When the porosity in GSP is lower, its mechanical properties develop better and are less affected by the external environment, thus maintaining long-term mechanical properties.
- (4)
- The lower the ratio of FA to GBFS in geopolymer, the better the curing effect of GSP. This is because more FA results in less calcium and the FA utilized in this study has a low calcium content. N-A-S-H is now primarily produced to provide the geopolymer strength, but it does not act to bind the PG particles or allow for additional chemical reactions with the PG in the GSP.
- (5)
- The proper increase of alkali-activator mainly affects the stability effect of GSP by adjusting the pH of the overall hydration environment of GSP. The increase of pH will promote the rapid dissolution of ions in raw materials and further promote their ion exchange to form ettringite or C-S-H gel.
- (6)
- The possibility of GSP being implemented in practical engineering projects. This is because the pre-treatment process of GSP only requires sieving treatment of PG and adjusting the ratio in the geopolymer as a curing agent.
Author Contributions
Funding
Institutional Review Board Statement
Informed Consent Statement
Data Availability Statement
Conflicts of Interest
References
- Ferreira, D.F.S.; Oliveira, W.D.; Siqueira, M.R.S.; Silva, C.A.B.; Del Nero, J. Electronic confinement in α-pho-graphene devices by hydrogenation and width effect consonance. Mater. Lett. 2023, 347, 134609. [Google Scholar] [CrossRef]
- Contreras, M.; Pérez-López, R.; Gázquez, M.J.; Morales-Flórez, V.; Santos, A.; Esquivias, L.; Bolívar, J.P. Fractionation and fluxes of metals and radionuclides during the recycling process of phosphogypsum wastes applied to mineral CO2 sequestration. Waste Manag. 2015, 45, 412–419. [Google Scholar] [CrossRef] [PubMed]
- Shen, W.; Gan, G.; Dong, R.; Chen, H.; Tan, Y.; Zhou, M. Utilization of solidified phosphogypsum as Portland cement retarder. J. Mater. Cycles Waste Manag. 2012, 14, 228–233. [Google Scholar] [CrossRef]
- Mehta, P.K.; Brady, J.R. Utilization of phosphogypsum in portland cement industry. Cem. Concr. Res. 1977, 7, 537–544. [Google Scholar] [CrossRef]
- Ölmez, H.; Erdem, E. The effects of phosphogypsum on the setting and mechanical properties of Portland cement and trass cement. Cem. Concr. Res. 1989, 19, 377–384. [Google Scholar] [CrossRef]
- Ölmez, H.; Yilmaz, V.T. Infrared study on the refinement of phosphogypsum for cements. Cem. Concr. Res. 1988, 18, 449–454. [Google Scholar] [CrossRef]
- Zeng, L.-L.; Bian, X.; Zhao, L.; Wang, Y.-J.; Hong, Z.-S. Effect of phosphogypsum on physiochemical and mechanical behaviour of cement stabilized dredged soil from Fuzhou, China. Geomech. Energy Environ. 2021, 25, 100195. [Google Scholar] [CrossRef]
- Rashad, A.M. Phosphogypsum as a construction material. J. Clean. Prod. 2017, 166, 732–743. [Google Scholar] [CrossRef]
- Tayibi, H.; Choura, M.; López, F.A.; Alguacil, F.J.; López-Delgado, A. Environmental impact and management of phosphogypsum. J. Environ. Manag. 2009, 90, 2377–2386. [Google Scholar] [CrossRef]
- Papaslioti, E.-M.; Pérez-López, R.; Parviainen, A.; Sarmiento, A.M.; Nieto, J.M.; Marchesi, C.; Delgado-Huertas, A.; Garrido, C.J. Effects of seawater mixing on the mobility of trace elements in acid phosphogypsum leachates. Mar. Pollut. Bull. 2018, 127, 695–703. [Google Scholar] [CrossRef]
- Lütke, S.F.; Oliveira, M.L.S.; Silva, L.F.O.; Cadaval, T.R.S.; Dotto, G.L. Nanominerals assemblages and hazardous elements assessment in phosphogypsum from an abandoned phosphate fertilizer industry. Chemosphere 2020, 256, 127138. [Google Scholar] [CrossRef] [PubMed]
- Jalali, J.; Gaudin, P.; Capiaux, H.; Ammar, E.; Lebeau, T. Fate and transport of metal trace elements from phosphogypsum piles in Tunisia and their impact on soil bacteria and wild plants. Ecotoxicol. Environ. Saf. 2019, 174, 12–25. [Google Scholar] [CrossRef] [PubMed]
- Ngo, H.T.T.; Dang, V.Q.; Ho, L.S.; Doan, T.X. Utilization phosphogypsum as a construction material for road base: A case study in Vietnam. Innov. Infrastruct. Solut. 2021, 7, 88. [Google Scholar] [CrossRef]
- Meskini, S.; Samdi, A.; Ejjaouani, H.; Remmal, T. Valorization of phosphogypsum as a road material: Stabilizing effect of fly ash and lime additives on strength and durability. J. Clean. Prod. 2021, 323, 129161. [Google Scholar] [CrossRef]
- Calderón-Morales, B.R.S.; García-Martínez, A.; Pineda, P.; García-Tenório, R. Valorization of phosphogypsum in cement-based materials: Limits and potential in eco-efficient construction. J. Build. Eng. 2021, 44, 102506. [Google Scholar] [CrossRef]
- Gu, Z.; Fang, A.; Hua, S.; Zhao, Q.; Sun, L.; Xia, F.; Qian, L.; Ren, X. Development of a Soil Stabilizer for Road Subgrade Based on Original Phosphogypsum. J. Renew. Mater. 2021, 9, 253–268. [Google Scholar] [CrossRef]
- Mun, K.J.; Hyoung, W.K.; Lee, C.W.; So, S.Y.; Soh, Y.S. Basic properties of non-sintering cement using phosphogypsum and waste lime as activator. Constr. Build. Mater. 2007, 21, 1342–1350. [Google Scholar] [CrossRef]
- Shen, W.; Zhou, M.; Zhao, Q. Study on lime–fly ash–phosphogypsum binder. Constr. Build. Mater. 2007, 21, 1480–1485. [Google Scholar] [CrossRef]
- Shen, W.; Zhou, M.; Ma, W.; Hu, J.; Cai, Z. Investigation on the application of steel slag–fly ash–phosphogypsum solidified material as road base material. J. Hazard. Mater. 2009, 164, 99–104. [Google Scholar] [CrossRef]
- Parreira, A.B.; Kobayashi, A.R.K.; Silvestre, O.B. Influence of Portland Cement Type on Unconfined Compressive Strength and Linear Expansion of Cement-Stabilized Phosphogypsum. J. Environ. Eng. 2003, 129, 956–960. [Google Scholar] [CrossRef]
- Liu, Y.; Zhang, D.; You, L.; Luo, H.; Xu, W. Recycling phosphogypsum in subbase of pavement: Treatment, testing, and application. Constr. Build. Mater. 2022, 342, 127948. [Google Scholar] [CrossRef]
- Wang, Y.; Wang, X.; Ning, M.; He, J.; He, J.; Lei, Y.; Hou, S. The collaborative pollutants and carbon dioxide emission reduction and cost of ultra-low pollutant emission retrofit in China’s cement kiln. J. Clean. Prod. 2023, 405, 136939. [Google Scholar] [CrossRef]
- Davidovits, J.; Huaman, L.; Davidovits, R. Ancient organo-mineral geopolymer in South-American Monuments: Organic matter in andesite stone. SEM and petrographic evidence. Ceram. Int. 2019, 45, 7385–7389. [Google Scholar] [CrossRef]
- Silva, P.D.; Sagoe-Crenstil, K.; Sirivivatnanon, V. Kinetics of geopolymerization: Role of Al2O3 and SiO2. Cem. Concr. Res. 2007, 37, 512–518. [Google Scholar] [CrossRef]
- Gu, G.; Pei, Y.; Ma, T.; Chen, F.; Zhang, J.; Xu, F. Role of carbon fiber in the electrothermal behavior and geopolymerization process of carbon fiber-reinforced FA-GBFS geopolymer composite. Constr. Build. Mater. 2023, 369, 130597. [Google Scholar] [CrossRef]
- Gu, G.; Ma, T.; Chen, F.; Li, H.; Pei, Y.; Xu, F. Soft magnetic geopolymer in airport pavement induction heating: Effect of Fe powder distribution on the electromagnetic loss. Ceram. Int. 2023, 49, 1720–1730. [Google Scholar] [CrossRef]
- Gu, G.; Ma, T.; Chen, F.; Xu, F.; Zhang, J. Electromagnetic and mechanical properties of FA-GBFS geopolymer composite used for induction heating of airport pavement. Cem. Concr. Compos. 2022, 129, 104503. [Google Scholar] [CrossRef]
- GB/T 23456-2018; Phosphogypsum. Standard in China: Beijing, China, 2018.
- Xu, F.; Li, H.; Sun, T.; Zhou, Y.; Zhu, J.; Peng, C.; Lin, J. Enhancing the mechanical and durability properties of fly ash-based geopolymer mortar modified by polyvinyl alcohol fibers and styrene butadiene rubber latex. Mater. Express 2021, 11, 1453–1465. [Google Scholar] [CrossRef]
- Li, H.; Gao, P.; Xu, F.; Sun, T.; Zhou, Y.; Zhu, J.; Peng, C.; Lin, J. Effect of Fine Aggregate Particle Characteristics on Mechanical Properties of Fly Ash-Based Geopolymer Mortar. Minerals 2021, 11, 897. [Google Scholar] [CrossRef]
- Xu, F.; Deng, X.; Peng, C.; Zhu, J.; Chen, J. Mix design and flexural toughness of PVA fiber reinforced fly ash-geopolymer composites. Constr. Build. Mater. 2017, 150, 179–189. [Google Scholar] [CrossRef]
- Gu, G.; Xu, F.; Ruan, S.; Huang, X.; Zhu, J.; Peng, C. Influence of precast foam on the pore structure and properties of fly ash-based geopolymer foams. Constr. Build. Mater. 2020, 256, 119410. [Google Scholar] [CrossRef]
- Gu, G.; Xu, F.; Huang, X.; Ruan, S.; Peng, C.; Lin, J. Foamed geopolymer: The relationship between rheological properties of geopolymer paste and pore-formation mechanism. J. Clean. Prod. 2020, 277, 123238. [Google Scholar] [CrossRef]
- JTG 3430-2020; Test Methods of Soils for Highway Engineering. Standard in China: Beijing, China, 2020.
- JTG-E51-2009; Test Methods of Materials Stabilized with Inorganic Binders for Highway Engineering. Standard in China: Beijing, China, 2009.
- Lu, C.; Chen, J.; Gu, C.; Wang, J.; Cai, Y.; Zhang, T.; Lin, G. Resilient and permanent deformation behaviors of construction and demolition wastes in unbound pavement base and subbase applications. Transp. Geotech. 2021, 28, 100541. [Google Scholar] [CrossRef]
- JTG/T 3610-2019; Technical Specifications for Construction of Highway Subgrades. Standard in China: Beijing, China, 2019.
- Sivapullaiah, P.V.; Sridharan, A.; Raju, K.V.B. Role of amount and type of clay in the lime stabilization of soils. Proc. Inst. Civil. Eng. Ground Improv. 2000, 4, 37–45. [Google Scholar] [CrossRef]
- Gao, X.; Yu, Q.L.; Brouwers, H.J.H. Reaction kinetics, gel character and strength of ambient temperature cured alkali activated slag–fly ash blends. Constr. Build. Mater. 2015, 80, 105–115. [Google Scholar] [CrossRef]
- Granizo, M.L.; Alonso, S.; Blanco-Varela, M.T.; Palomo, A. Alkaline Activation of Metakaolin: Effect of Calcium Hydroxide in the Products of Reaction. J. Am. Ceram. Soc. 2002, 85, 225–231. [Google Scholar] [CrossRef]
- Alexander, A.E.; Shashikala, A.P. Studies on the microstructure and durability characteristics of ambient cured FA-GGBS based geopolymer mortar. Constr. Build. Mater. 2022, 347, 128538. [Google Scholar] [CrossRef]
- Görhan, G.; Kürklü, G. The influence of the NaOH solution on the properties of the fly ash-based geopolymer mortar cured at different temperatures. Compos. Part. B Eng. 2014, 58, 371–377. [Google Scholar] [CrossRef]
- Fernández-Jiménez, A.; Palomo, A. Composition and microstructure of alkali activated fly ash binder: Effect of the activator. Cem. Concr. Res. 2005, 35, 1984–1992. [Google Scholar] [CrossRef]
- Phair, J.W.; Van Deventer, J.S.J. Effect of silicate activator pH on the leaching and material characteristics of waste-based inorganic polymers. Miner. Eng. 2001, 14, 289–304. [Google Scholar] [CrossRef]
- Shekhovtsova, J.; Kearsley, E.P.; Kovtun, M. Effect of activator dosage, water-to-binder-solids ratio, temperature and duration of elevated temperature curing on the compressive strength of alkali-activated fly ash cement pastes. J. S. Afr. Inst. Civ. Eng. 2014, 56, 44–52. [Google Scholar]
- Heah, C.Y.; Kamarudin, H.; Bakri, A.M.M.A.; Bnhussain, M.; Luqman, M.; Nizar, I.K.; Ruzaidi, C.M.; Liew, Y.M. Kaolin-based geopolymers with various NaOH concentrations. Int. J. Miner. Metall. Mater. 2013, 20, 313–322. [Google Scholar] [CrossRef]
- Hammas, I.; Horchani-Naifer, K.; Férid, M. Solubility study and valorization of phosphogypsum salt solution. Int. J. Miner. Process. 2013, 123, 87–93. [Google Scholar] [CrossRef]
- ASTM D559/D559; Standard Test Methods for Wetting and Drying Compacted Soil-Cement Mixtures. ASTM International: West Conshohocken, PA, USA, 2015.
- Li, X.; Xu, F.; Chen, B.; Li, B.; Chen, Z.; Zhu, J.; Peng, C.; Lin, J. Investigation on the chloride ion erosion mechanism of cement mortar in coastal areas: From experiments to molecular dynamics simulation. Constr. Build. Mater. 2022, 350, 128810. [Google Scholar] [CrossRef]
- Singhi, B.; Laskar, A.I.; Ahmed, M.A. Mechanical Behavior and Sulfate Resistance of Alkali Activated Stabilized Clayey Soil. Geotech. Geol. Eng. 2017, 35, 1907–1920. [Google Scholar] [CrossRef]
- Zhang, M.; Guo, H.; El-Korchi, T.; Zhang, G.; Tao, M. Experimental feasibility study of geopolymer as the next-generation soil stabilizer. Constr. Build. Mater. 2013, 47, 1468–1478. [Google Scholar] [CrossRef]
- Bian, X.; Zeng, L.; Ji, F.; Xie, M.; Hong, Z. Plasticity role in strength behavior of cement-phosphogypsum stabilized soils. J. Rock. Mech. Geotech. Eng. 2022, 14, 1977–1988. [Google Scholar] [CrossRef]
- Kamruzzaman, A.H.M.; Chew, S.H.; Lee, F.H. Microstructure of cement-treated Singapore marine clay. Proc. Inst. Civil. Eng.Ground Improv. 2006, 10, 113–123. [Google Scholar] [CrossRef]
- Sivapullaiah, P.V.; Jha, A.K. Gypsum Induced Strength Behaviour of Fly Ash-Lime Stabilized Expansive Soil. Geotech. Geol. Eng. 2014, 32, 1261–1273. [Google Scholar] [CrossRef]
- Kuryatnyk, T.; Angulski da Luz, C.; Ambroise, J.; Pera, J. Valorization of phosphogypsum as hydraulic binder. J. Hazard. Mater. 2008, 160, 681–687. [Google Scholar] [CrossRef]
- Cherian, C.; Arnepalli, D.N. A Critical Appraisal of the Role of Clay Mineralogy in Lime Stabilization. Int. J. Geosynth. Ground Eng. 2015, 1, 8. [Google Scholar] [CrossRef]
- Yi, Y.; Li, C.; Liu, S.; Jin, F. Magnesium sulfate attack on clays stabilised by carbide slag- and magnesia-ground granulated blast furnace slag. Géotechnique Lett. 2015, 5, 306–312. [Google Scholar] [CrossRef]
- Fang, Y.; Kayali, O. The fate of water in fly ash-based geopolymers. Constr. Build. Mater. 2013, 39, 89–94. [Google Scholar] [CrossRef]
- Puligilla, S.; Mondal, P. Role of slag in microstructural development and hardening of fly ash-slag geopolymer. Cem. Concr. Res. 2013, 43, 70–80. [Google Scholar] [CrossRef]
- Yip, C.K.; Lukey, G.C.; van Deventer, J.S.J. The coexistence of geopolymeric gel and calcium silicate hydrate at the early stage of alkaline activation. Cem. Concr. Res. 2005, 35, 1688–1697. [Google Scholar] [CrossRef]
- Jha, A.K.; Sivapullaiah, P.V. Physical and strength development in lime treated gypseous soil with fly ash—Micro-analyses. Appl. Clay Sci. 2017, 145, 17–27. [Google Scholar] [CrossRef]


| Material | SiO2 | Al2O3 | CaO | SO3 | Fe2O3 | MnO | MgO | Na2O | K2O | P2O5 | TiO2 | Loss |
|---|---|---|---|---|---|---|---|---|---|---|---|---|
| FA | 35.01 | 21.09 | 27.56 | / | 0.32 | 0.16 | 12.87 | 0.36 | 0.27 | 0.05 | 0.26 | 1.49 |
| GBFS | 50.45 | 38.64 | 2.93 | / | 3.22 | 0.04 | 1.9 | 1.52 | 0.54 | 0.2 | 0.38 | 3.49 |
| PG | 16.31 | 3.68 | 25.89 | 40.91 | 0.73 | 0 | 0.93 | 2.45 | 0.77 | 0.87 | 0.07 | 22.95 |
| Colour | Modulus | Pomerol | Na2O (%) | SiO2 (%) |
|---|---|---|---|---|
| Colorless transparent liquid | 3.24 | 39.5 | 9.25 | 29 |
| Sample | FA (%) | GBFS (%) | Solid Activator (%) | Water-to-Solid | 28 d Compressive Strength |
|---|---|---|---|---|---|
| M | 25 | 75 | 11% | 0.3 | 50.84 |
| N | 30 | 70 | 11% | 0.3 | 55.71 |
| K | 35 | 65 | 11% | 0.3 | 45.11 |
| C | 40 | 60 | 11% | 0.3 | 70.93 |
| F | 45 | 55 | 11% | 0.3 | 49.97 |
| E | 50 | 50 | 11% | 0.3 | 46.01 |
| S | 55 | 45 | 11% | 0.3 | 61.67 |
| H | 60 | 40 | 11% | 0.3 | 54.83 |
| J | 60 | 40 | 14% | 0.3 | 77.99 |
| Sample | Geopolymer (wt%) | PG (wt%) | Composition in Geopolymer | ||
|---|---|---|---|---|---|
| FA (wt%) | GBFS (wt%) | Alkali-Activator (wt%) | |||
| P90-G(30:70)-C11 | 10 | 90 | 30 | 70 | 11 |
| P94-G(30:70)-C11 | 6 | 94 | |||
| P98-G(30:70)-C11 | 2 | 98 | |||
| P90-G(40:60)-C11 | 10 | 90 | 40 | 60 | 11 |
| P94-G(40:60)-C11 | 6 | 94 | |||
| P98-G(40:60)-C11 | 2 | 98 | |||
| P90-G(55:45)-C11 | 10 | 90 | 55 | 45 | 11 |
| P94-G(55:45)-C11 | 6 | 94 | |||
| P98-G(55:45)-C11 | 2 | 98 | |||
| P90-G(55:45)-C14 | 10 | 90 | 55 | 45 | 14 |
| P94-G(55:45)-C14 | 6 | 94 | |||
| P98-G(55:45)-C14 | 2 | 98 | |||
Disclaimer/Publisher’s Note: The statements, opinions and data contained in all publications are solely those of the individual author(s) and contributor(s) and not of MDPI and/or the editor(s). MDPI and/or the editor(s) disclaim responsibility for any injury to people or property resulting from any ideas, methods, instructions or products referred to in the content. |
© 2023 by the authors. Licensee MDPI, Basel, Switzerland. This article is an open access article distributed under the terms and conditions of the Creative Commons Attribution (CC BY) license (https://creativecommons.org/licenses/by/4.0/).
Share and Cite
Wu, Y.; Zhang, H.; Lin, H.; Wu, X.; Li, H.; Liu, Y.; Gu, G.; Xu, J.; Chen, S.; Tang, H.; et al. Factors Affecting the Strength Formation Mechanism and Water Stability of Geopolymer Stabilized Phosphogypsum in Road Construction. Coatings 2023, 13, 1652. https://doi.org/10.3390/coatings13091652
Wu Y, Zhang H, Lin H, Wu X, Li H, Liu Y, Gu G, Xu J, Chen S, Tang H, et al. Factors Affecting the Strength Formation Mechanism and Water Stability of Geopolymer Stabilized Phosphogypsum in Road Construction. Coatings. 2023; 13(9):1652. https://doi.org/10.3390/coatings13091652
Chicago/Turabian StyleWu, Yi, Hanbin Zhang, Haikun Lin, Xueting Wu, Heng Li, Yamei Liu, Gonghui Gu, Jin Xu, Shengying Chen, Haojun Tang, and et al. 2023. "Factors Affecting the Strength Formation Mechanism and Water Stability of Geopolymer Stabilized Phosphogypsum in Road Construction" Coatings 13, no. 9: 1652. https://doi.org/10.3390/coatings13091652