Article

Unraveling the Cracking Mechanisms of Air Plasma-Sprayed Thermal Barrier Coatings: An In-Situ SEM Investigation

1
Centre for Manufacturing and Materials, Coventry University, Coventry CV1 5FB, UK
2
Thermal Spray Innovations, 5662 Salzburg, Austria
3
CN Technical Services Ltd., Wisbech PE13 2XQ, UK
*
Author to whom correspondence should be addressed.
Coatings 2023, 13(9), 1493; https://doi.org/10.3390/coatings13091493
Submission received: 24 July 2023 / Revised: 17 August 2023 / Accepted: 21 August 2023 / Published: 24 August 2023
(This article belongs to the Special Issue Micro- and Nano- Mechanical Testing of Coatings and Surfaces)

Abstract

:
In this research work, real-time three-point bending coupled with the scanning electron microscopy (SEM) technique were used to study the crack formation and growth of air plasma spraying (APS) thermal barrier coatings (TBCs). The acquired micrographs were then used to study the strain fields in the vicinity of the cracking region using digital image correlation (DIC) analysis. Fractography analysis for the fractured regions of the APS coatings was also discussed. Based on real-time observation, it was found that roughness of the coatings’ free surface (e.g., valleys) can promote the initiation of cracks since it acts as stress concentration points. Pores and splats features of the coating microstructure contribute to crack branching and crack path deflection, respectively. The former phenomenon (i.e., crack branching) negatively affects the lifetime of the TBC system as it results in an increased fracture area, while the latter can improve the fracture toughness of the coatings and its durability through improving the coating’s ability to dissipate the energy required for crack propagation.

1. Introduction

Thermal barrier coatings (TBCs) are considered one of the most significant applications of thermal spraying, which are widely exploited in industrial components and aero gas turbines to protect underlaying substrate material from oxidation and corrosion, in addition to extending the working temperature limits of the substrate material [1,2]. For instance, TBC is broadly utilized to protect the hottest sections of gas turbine engines (e.g., turbine blades and vanes) [3,4,5], internal combustion engines components (e.g., combustion chambers) [2,6], and several parts that are subjected to severe working conditions in other industries [5]. In gas turbine engines, the utilization of TBCs in addition to internal cooling of the underlying superalloy components attains a temperature reduction of up to 300 °K in the surface of the superalloy component [7]. Hence, turbine engines can operate at temperatures beyond the melting temperature of the superalloy, thus increasing the energy efficiency and performance of engines. Furthermore, TBCs are widely used to provide insulation of the combustion chamber components of diesel engines (referred to as low heat rejection (LHR) engines) [2]. TBCs can reduce the heat transfer between the gases in the cylinder and the cylinder wall, promoting advantages including increased combustion temperature, fuel efficiency, thermal fatigue protection of the underlying metallic surfaces, and possible reduction of engine emissions [2,6]. During in-service working conditions, the TBCs system is typically exposed to different loading conditions (e.g., thermal, mechanical, wear, corrosion, fatigue damage, etc.) that act simultaneously [8]. An air plasma spray TBC system comprises two distinctive layers—the outer layer (namely top coat (TC)) is usually yttria-stabilized zirconia (YSZ). The TC layer provides thermal insulation to the substrate owing to its intrinsic low thermal conductivity in addition to its engineered lamellar microstructure that contains voids, cracks, and splat boundaries to achieve extrinsic reduced thermal conductivity and strain tolerance. The second layer (so-called bond coat (BC)) is normally a metallic alloy based on MCrAlY (M being Ni, Co, or both) which affords oxidation resistance and better adhesion, along with tolerating the misfit in the thermal expansion coefficient between the TC and the substrate material [9,10]. Therefore, many factors can contribute to the failure of TBCs, including varied thermomechanical loading conditions, their microstructure (existing pores and cracks), and the residual stresses developed due to thermal expansion mismatch between TBC layers [11]. Understanding TBCs’ failure behavior (i.e., crack initiation and propagation) can help to prolong its lifetime and provide potential for further development. The traditional or ex-situ fractographic analysis of failed samples, through comparing a coating’s microstructure before and after loading conditions [12,13,14,15,16], cannot provide deep insight into its cracking behavior. In contrast, real-time testing is a relatively new approach that offers a greater understanding of the deformation and fracture response of materials under different loading conditions with remarkable resolution and length scale [17,18,19,20].
The real-time bending method has been exploited to evaluate the failure behavior [21,22,23,24] and mechanical characteristics (e.g., flexural strength, failure strain, and flexural modulus) [18,20,23,25] of coatings. The bending test introduces a good chance to understand the response of coatings under different stress states (i.e., tension and compression) [23]. Furthermore, it is considered an efficient test method with which to monitor crack formation and propagation processes at the surface and through the thickness of the coatings, and to determine the stress intensity and strain energy at the generated crack tip [21]. Real-time bending testing has been utilized to quantify coating resistance for cracking, since the coatings that exhibit crack resistance have a high fracture toughness and adhere well to the substrate material [20,26]. During the bending experimentation, the stress state differs along the thickness, and the failure strength is typically influenced by the surface/edge condition, such as defects or scratches that permit early fracture. Therefore, it is crucial to monitor the deformation and failure mechanisms in the coatings, both on the surface and through the thickness. Scanning electron microscopy (SEM) and digital image correlation (DIC) techniques are the imaging and monitoring methods commonly utilized to study the deformation and failure response of TBCs [17]. As mentioned before, in-situ bending experimentation was used by researchers to determine the mechanical characteristics of TBC systems. For instance, Chen et al. [25] investigated the stiffness of freestanding APS-TBC samples using real-time three-point bending coupled with SEM. Inelastic nonlinear deformation behavior was reported for the tested beams. Moreover, the obtained elastic modulus was found to vary as a function of the thermal conditions, which can be attributed to microstructural changes such as sintering and cracks formation (e.g., intra-splat cracking). Patibanda et al. [18] conducted in-situ tensile and four-point bending tests of freestanding 8YSZ to study its mechanical characteristics (e.g., flexure strength and bending modulus) under varied stress states. It was found that the bending-determined values were higher than those obtained from uniaxial tension experimentation. This was attributed to the uniformity of the stress state along the tensile specimen while varied stress states were developed during bending across the specimen’s thickness, causing a higher failure strength. High temperature, real-time three-point bending coupled with the DIC technique was exploited to determine the elastic modulus and fracture toughness of APS TBCs by Zhu et al. [20]. It was reported that the increase in temperature has the effect of reducing the elastic modulus and fracture toughness of the studied TBC system while increasing the interfacial fracture toughness. Other researchers utilized the bending-driven failure test as an efficient method for evaluating the quality and load-bearing capacity of a TBC system. Martins et al. [21] found that the bond coat surface’s topography has an influence on the path and velocity of crack propagation. Yang et al. [22] used acoustic emission (AE) and DIC techniques to study the fracture of TBCs under bending experimentation, and a linear relationship between the released fracture energy and the associated AE signals was reported for the tested TBCs. Planques et al. [23] used in-situ bending along with the DIC method to observe the progression of surface strain fields in addition to detecting the crack initiation location and propagation paths when the TBC system was loaded in tension and compression. Different failure modes were detected. For instance, a segmentation crack and delamination took place when coatings were loaded in tension, while delamination cracks and spallation were observed under the compression state. Further studies utilized the in-situ bending experimentation using the SEM technique to comprehend the failure behavior of thermal barrier coatings deposited by different spraying techniques [9,24,26,27]. However, further investigations are needed to provide a deeper understanding of how cracks initiate and propagate in TBCs and to assign fracture features to the coating microstructure, thereby providing the potential to optimize coating designs to enhance the coating’s resistance to cracking. Furthermore, improved TBC performance and a longer service life can be attained. Conducting in-situ bending experiments permits direct observation and analyses of crack initiation, propagation, and branching mechanisms under controlled loading conditions. The in-situ approach can effectively help to identify the critical failure points and evaluate the coating’s overall structural integrity. The information obtained from the in-situ experimentation can be exploited for developing and validating numerical and analytical models that simulate crack behavior in TBCs, thereby creating the potential to simulate TBCs’ fracture behavior under different and complicated loading scenarios. This approach provides valuable insights into cracking behavior that might not be achievable through other methods, leading to a deeper understanding of the coating’s performance.
The aim of this research work is monitoring the crack initiation and propagation of the APS TBCs under mechanical bending experimentation to better understand the failure behavior of these coatings and to assign fracture features to the coating microstructure. A real-time three-point bending test coupled with a scanning electron microscope (SEM) was used in order to define the cracking response of the TBCs. The microstructure of the APS coating itself is heterogeneous, including varied features (e.g., pores, cracks, oxide inclusions and splat structure, etc.) that promote arbitrary crack initiation and propagation. Therefore, three in-situ bending experimentations were reported in this research work to define the common fracture characteristics of the APS coatings. Furthermore, the digital image correlation (DIC) technique was used to visualize the strain fields in the vicinity of the crack propagation path. Moreover, the in-situ observations were supplemented by fractographic analysis of the fractured coating.

2. Materials and Methods

2.1. Coating Deposition and Material Properties

Substrates for the evaluated samples were manufactured from Hastelloy-X, a nickel-based superalloy. Before coating deposition, samples were degreased with acetone and grit blasted using an automated, robotized grit blasting system built for aerospace component preparation. The bond coat was applied using an F4-MB type plasma torch and a commercial grade NiCoCrAlY powder (Amperit 410.860, Höganäs, Sweden) with approximately 23% Cobalt, 17% Chromium, 12.5% Aluminum, 0.45% Yttrium, and the balance Nickel. The powder was manufactured by gas atomization and had a particle size distribution D10: 45 µm, D90: 90 µm. The coating was applied to a thickness of approximately 190 µm in 8 passes of the plasma torch.
The ceramic topcoat was also applied using an F4-MB type plasma torch to a thickness of approximately 350 µm. The powder utilized for the ceramic layer was a commercial grade yttria-stabilized zirconia with approximately 7 weight percent yttrium oxide (Amperit 831.007, Höganäs, Sweden). The powder was produced by a plasma spheroidization process and had a particle size distribution D10: 16 µm, D90: 90 µm. The plasma-spheroidized powder is sometimes known as homogenized oven spheroidized powder (HOSP). This manufacturing process produces powder particles that are often hollow shells or they may contain untreated fine particles inside the shell structure. This powder morphology has the benefit of producing many lamellar porosity features that provide high thermal insulation, with some sacrifice in terms of thermal shock stability [28]. For both the bond coat and top coat, proprietary process parameters were used to deposit the coatings, and the samples can be considered examples of current state-of-the-art thermal barrier coatings used industrially; similar examples can be found in previously published work [29].
During the in-situ bending experimentation, the whole coating system including the substrate will be subjected to bending loading. For the flexural strength, strain, and deflection calculations, the mechanical characteristics (i.e., Young’s modulus) of the substrate material and the ceramic top coat are obtained from the literature. For instance, the Young’s modulus for the Hastelloy-X alloy and top coat are 205 and 48 GPa, respectively [30,31].

2.2. Sample Preparation

The dimensions of the as-sprayed TBC sample were approximately 25 × 25× 2.2 mm. The raw sample was first epoxy cold-molded to freeze the coatings on the substrate surface and to prevent the formation of cracks during the subsequent metallography preparation process. Subsequently, three bending bars were cut from the raw material with precision SiC cutting wheel on a Struers secotom-50 machine at low speed (0.07 mm/s) to minimize any possible damage during sectioning. Based on previous practices [26,27], the substrate for two bending bars was thinned by grinding in order to decrease the stiffness of the samples, while the substrate thickness of the third sample was kept without any thinning. It was found that the substrate thinning typically reduced the bending beam stiffness resulting in more deformation at lower stress levels; however, this practice is time consuming. In addition, the used in-situ stage has a 3 KN load cell that can achieve high bending limits. Hence, no thinning was performed for the third sample. Subsequently, the cross-sectioned bending specimens were ground (P400) until planer, followed by polishing using a diamond suspension with abrasive particle sizes of 9 and 3 µm. The final polishing stage was performed using a colloidal silica polishing suspension until a no-scratch mirror-finished surface was attained using Buehler AutoMet™ 300 (Lake Bluff, IL, USA). Subsequently, the mirror-finished TBC samples were carbon sputtered (≈15 nm thick) using a Safematic CCU-010 machine (Zizers, Switzerland) to reduce charging during in-situ SEM imaging. Due to the previous metallographic preparation procedures (i.e., cutting, grinding, and polishing), it is difficult to attain the same dimensions for all bending samples. Therefore, at least three measurements for the geometrical dimensions (length × width × thickness) of each bending sample were recorded and the average values were reported. The final dimensions of the beams (i.e., Sample #1, 2, and 3) were about 25 × 3.94 × 1.31 mm, 25 × 2.71 × 1.28 mm, 25 × 3.76 × 2.18 mm (length × width × thickness), respectively. The thickness of the APS coating system including TC and BC layers ranged between 0.47 and 0.53 mm for all the tested samples.

2.3. In-Situ Imaging

The TBC bending sample was monitored in real-time during bending experimentation with a field emission FEG-SEM (Zeiss Sigma 500 VP, Oberkochen, Germany) using secondary electron (SE) and back scattered electron (BSE) modes. The secondary electron signals are concentrated at the point where the primary electron beam interacts with the sample’s surface, which enables the recording of images of high quality and resolution, revealing details about 1–5 nm in size [32,33]. The SE imaging mode was used to record the bending driven fracture of sample #1 to obtain high quality images with fine features; however, it was found that, as cracking proceeded through the coating thickness, the charging phenomenon occurred, resulting in increased brightness in the cracked region. This can be attributed to the exposure of the non-carbon coated area (i.e., fracture region) to the imaging electron beam or even the fall of the conductive carbon layer from the APS coating surface. Therefore, the BSE imaging mode was used to capture the cracking behavior of the other bending samples (Sample #2 and 3). The APS coating has different layers of varied materials. Thus, the BSE imaging mode was utilized to obtain compositional contrast images. Furthermore, backscattered electrons (BSE) have high energy (50% to 80% of the incident electron beam energy), thus create good quality images and are less susceptible to the charging phenomenon of low conductive materials (e.g., ceramics) [34]. During the conducted in-situ tests, the field emission FEG-SEM was exploited to capture high quality images of the progressive failure of the APS coating using SE and BSE modes. The scanning parameters used during both imaging modes (SE and BSE) included an acceleration voltage of 10 KeV, a working distance of approximately 20 mm, and an aperture size of 30 µm. SEM images were recorded at different magnifications (e.g., 50x, 100x, 150x, 300x, and 1000x) during the in-situ bending experimentation to help with the subsequent fracture analysis. The recorded sequence of images for the APS coating during the bending experimentation was properly aligned to generate illustrative videos of the coating failure (see Supplementary Files).

2.4. Three-Point Bending Test

Three-point bending tests were performed inside an SEM equipped with a Micromecha Proxima testing stage (Schwerte, Germany). The stage has a 3 KN load cell and a built-in linear encoder to provide measurements for the mechanically applied forces and displacement, respectively (see Figure 1b). The crosshead movement of the in-situ stage was achieved using a drive screw located on the left-hand side, as illustrated in Figure 1b. The 3PB test was performed using the displacement control mode with a cross head speed of 2 µm/s and an interrupted loading mode, thereby at a defined displacement (50 µm), testing was paused and the progressive coating fracture was recorded along with the acquisition of high-resolution SEM images. Images with different magnifications were recorded-lower ones were used to provide an overall observation of the coating failure while higher magnifications were exploited to study the failure behavior of the coating. The beam sample was loaded in the 3PB testing rig with an outer support span of 20 mm in such a way that the coatings were subjected to tensile stress (see Figure 1a). During the in-situ bending test, the stage crosshead movement detected by the encoder and the applied force measured by the load cell were recorded. It is worth noting that the displacement measurement is the crosshead movement, which includes the machine compliance. Since the load cell is well calibrated (the error in the force measurements is within ±0.25%), the force measurement is reliable. Hence, all the calculations to determine the flexural strength and stain of the coatings (discussed in the following section) are based on the force measurements rather than on the crosshead displacement. The loading and support conditions of the three-point bending testing rig and the in-situ test setup inside the SEM are shown in Figure 1a.
The stresses and strain developed in the deformed beams can be calculated using the beam theory [35,36]. Since the coating was loaded in tension, the maximum stress and strain exist at the bottom beam surface (coating side) at the mid-span of the beam. The stress at failure (i.e., flexural strength) can be calculated as a function of the beam dimensions, applied bending moment, and cross-section moment of inertia according to [35]:
σ f s = 3 F f L 2 b d 2
where F f is the load at fracture, L is the support span, and b and d are beam width and thickness, respectively.
The maximum strain ( ε ) that occurs at the outer surface (i.e., coating) of the tested beam at the mid-span can be calculated for a measured deflection ( D ) by [37]:
ε = 6 D d L 2
The deflection ( D ) at beam mid-span can be obtained from the following expression [36]:
D = F L 3 48 E I
where E and I are the modulus of elasticity and moment of inertia, respectively. The substrate (i.e., Hastelloy-X) thickness is almost two times or more that of the coating thickness for all the tested samples, as well as being much stiffer (i.e., ESubstrate = 205 GPa and ETC = 48 GPa) [30,31]. Therefore, the modulus of elasticity used in the beam theory calculations is that of the substrate material.
The SEM images recorded during the in-situ bending trials under different stages of loading were subsequently used to obtain the spatial strain distribution across the coatings using the DIC technique. DIC typically needs the generation of an artificial speckle patten to track and analyze the surface displacements and strains between successive images recorded before and after deformation based on the gray-scale features [38]. However, the heterogeneous microstructure of the APS coatings itself contains distinguishing features (e.g., pores, cracks, different phases, splat boundaries, etc.), which permits the performance of the DIC analysis without the need for speckle pattern generation [26]. DIC provides a great opportunity to visualize the strain evolution during the deformation process, which can provide further understanding of the coating’s response to mechanical loading. In this work, the micrographs recorded during different stages of the in-situ experiments were imported to an open source 2D digital image correlation MATLAB code (i.e., Ncorr) and the DIC analysis was performed based on the cross-correlation matching approach [39,40]. Ncorr vers. 1.2 was employed to correlate the recorded SEM images [39]. First, a region of interest (ROI) was defined in the reference undeformed image, which was divided into small subsets of pixels (subsets typically overlap). The parameters used for the DIC analysis were a subset size of 30 pixels with a subset spacing of 2 pixels. Hence, the displacement calculations were conducted for every two pixels of the image. The subsets used to calculate the displacements are in a circular shape. Different iterations were conducted to select the appropriate DIC parameters (i.e., subset size and spacing). For instance, the subset size was selected to comprise enough regional variation of features, enabling successful tracking of subset locations while avoiding noisy displacement data, whereas subset spacing can help to attain good resolution results in the DIC analysis. After the displacements are computed at each predefined pixel spacing, the deformation fields can be obtained.

3. Results and Discussion

3.1. In-Situ Bending Sample #1

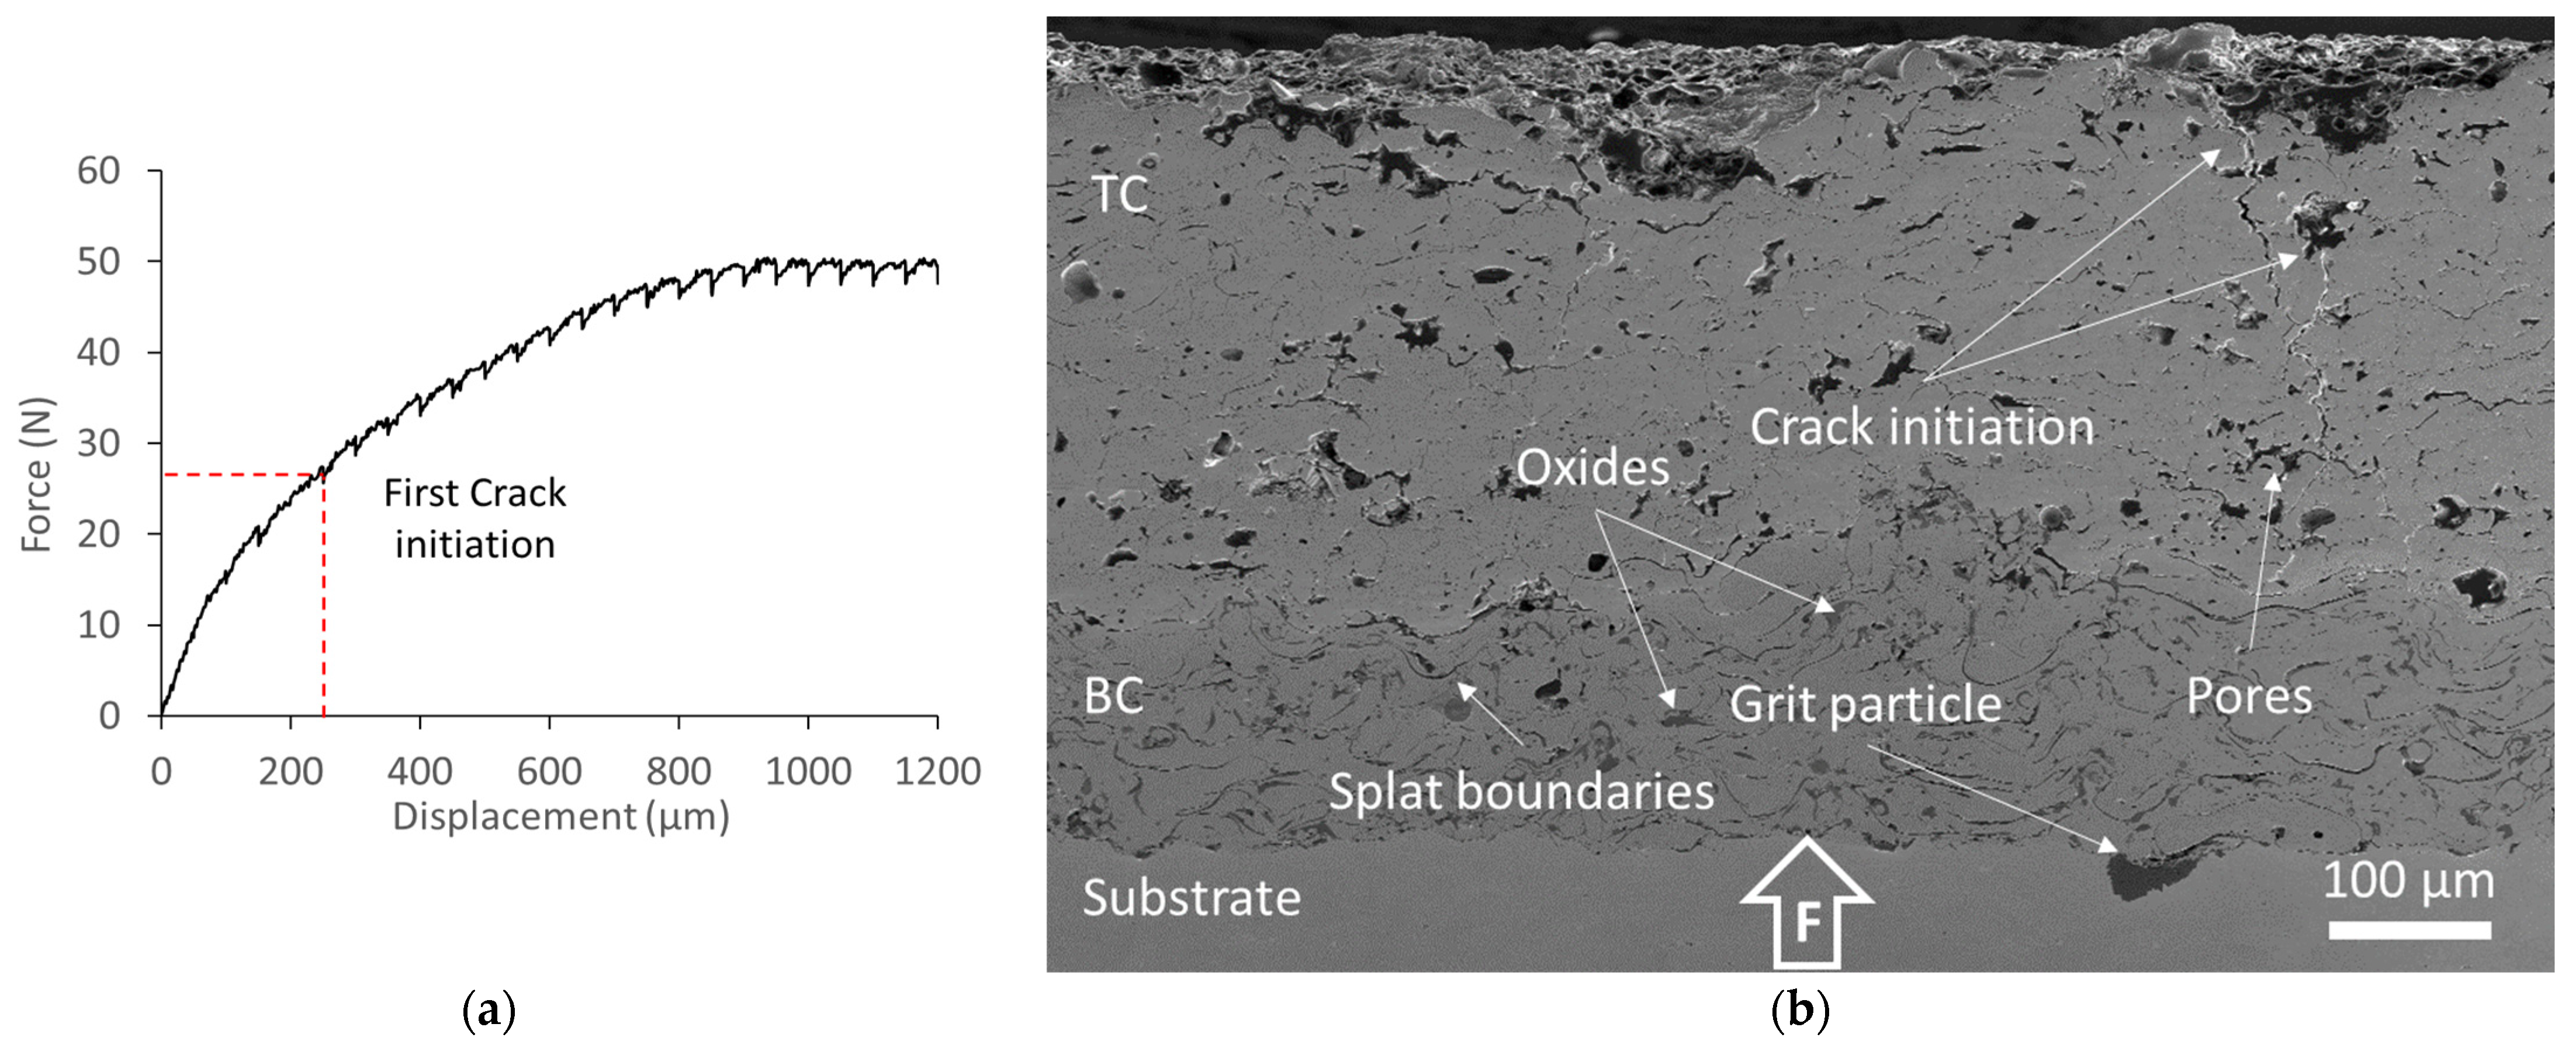
Recorded load-displacement data from the Proxima stage during the three-point bending test for sample #1 in an interrupted loading mode is shown in Figure 2a, where the displacement is the crosshead movement. Nearly linear elastic loading behavior was detected up to approximately 30 N, which is followed by considerable softening of the reaction force under the increasing crosshead displacement. The overall softening of the load-displacement curve and the multiple local unloading or small load drops can be recognized in the load–displacement curve, which correspond to the applied displacements at which micro-cracks occurred. Micrographs of the coating were acquired using SEM. The first crack observation was recorded at 27.27 N, and the related micrograph of the TBC coating is shown in Figure 2b. According to the beam theory, the flexural strength and maximum strain at which the first cracking of the coating was noted were approximately 121 MPa and 0.06%, respectively. The microstructure of the air plasma-sprayed TBC coating featured varied microstructural characteristics including pores, splat boundaries, oxide inclusions, different phases, etc. These microstructures are favorable for achieving strain tolerance and lower thermal conductivity; however, they can contribute to the failure of the coating, as will be discussed in the following section (see Figure 2b).
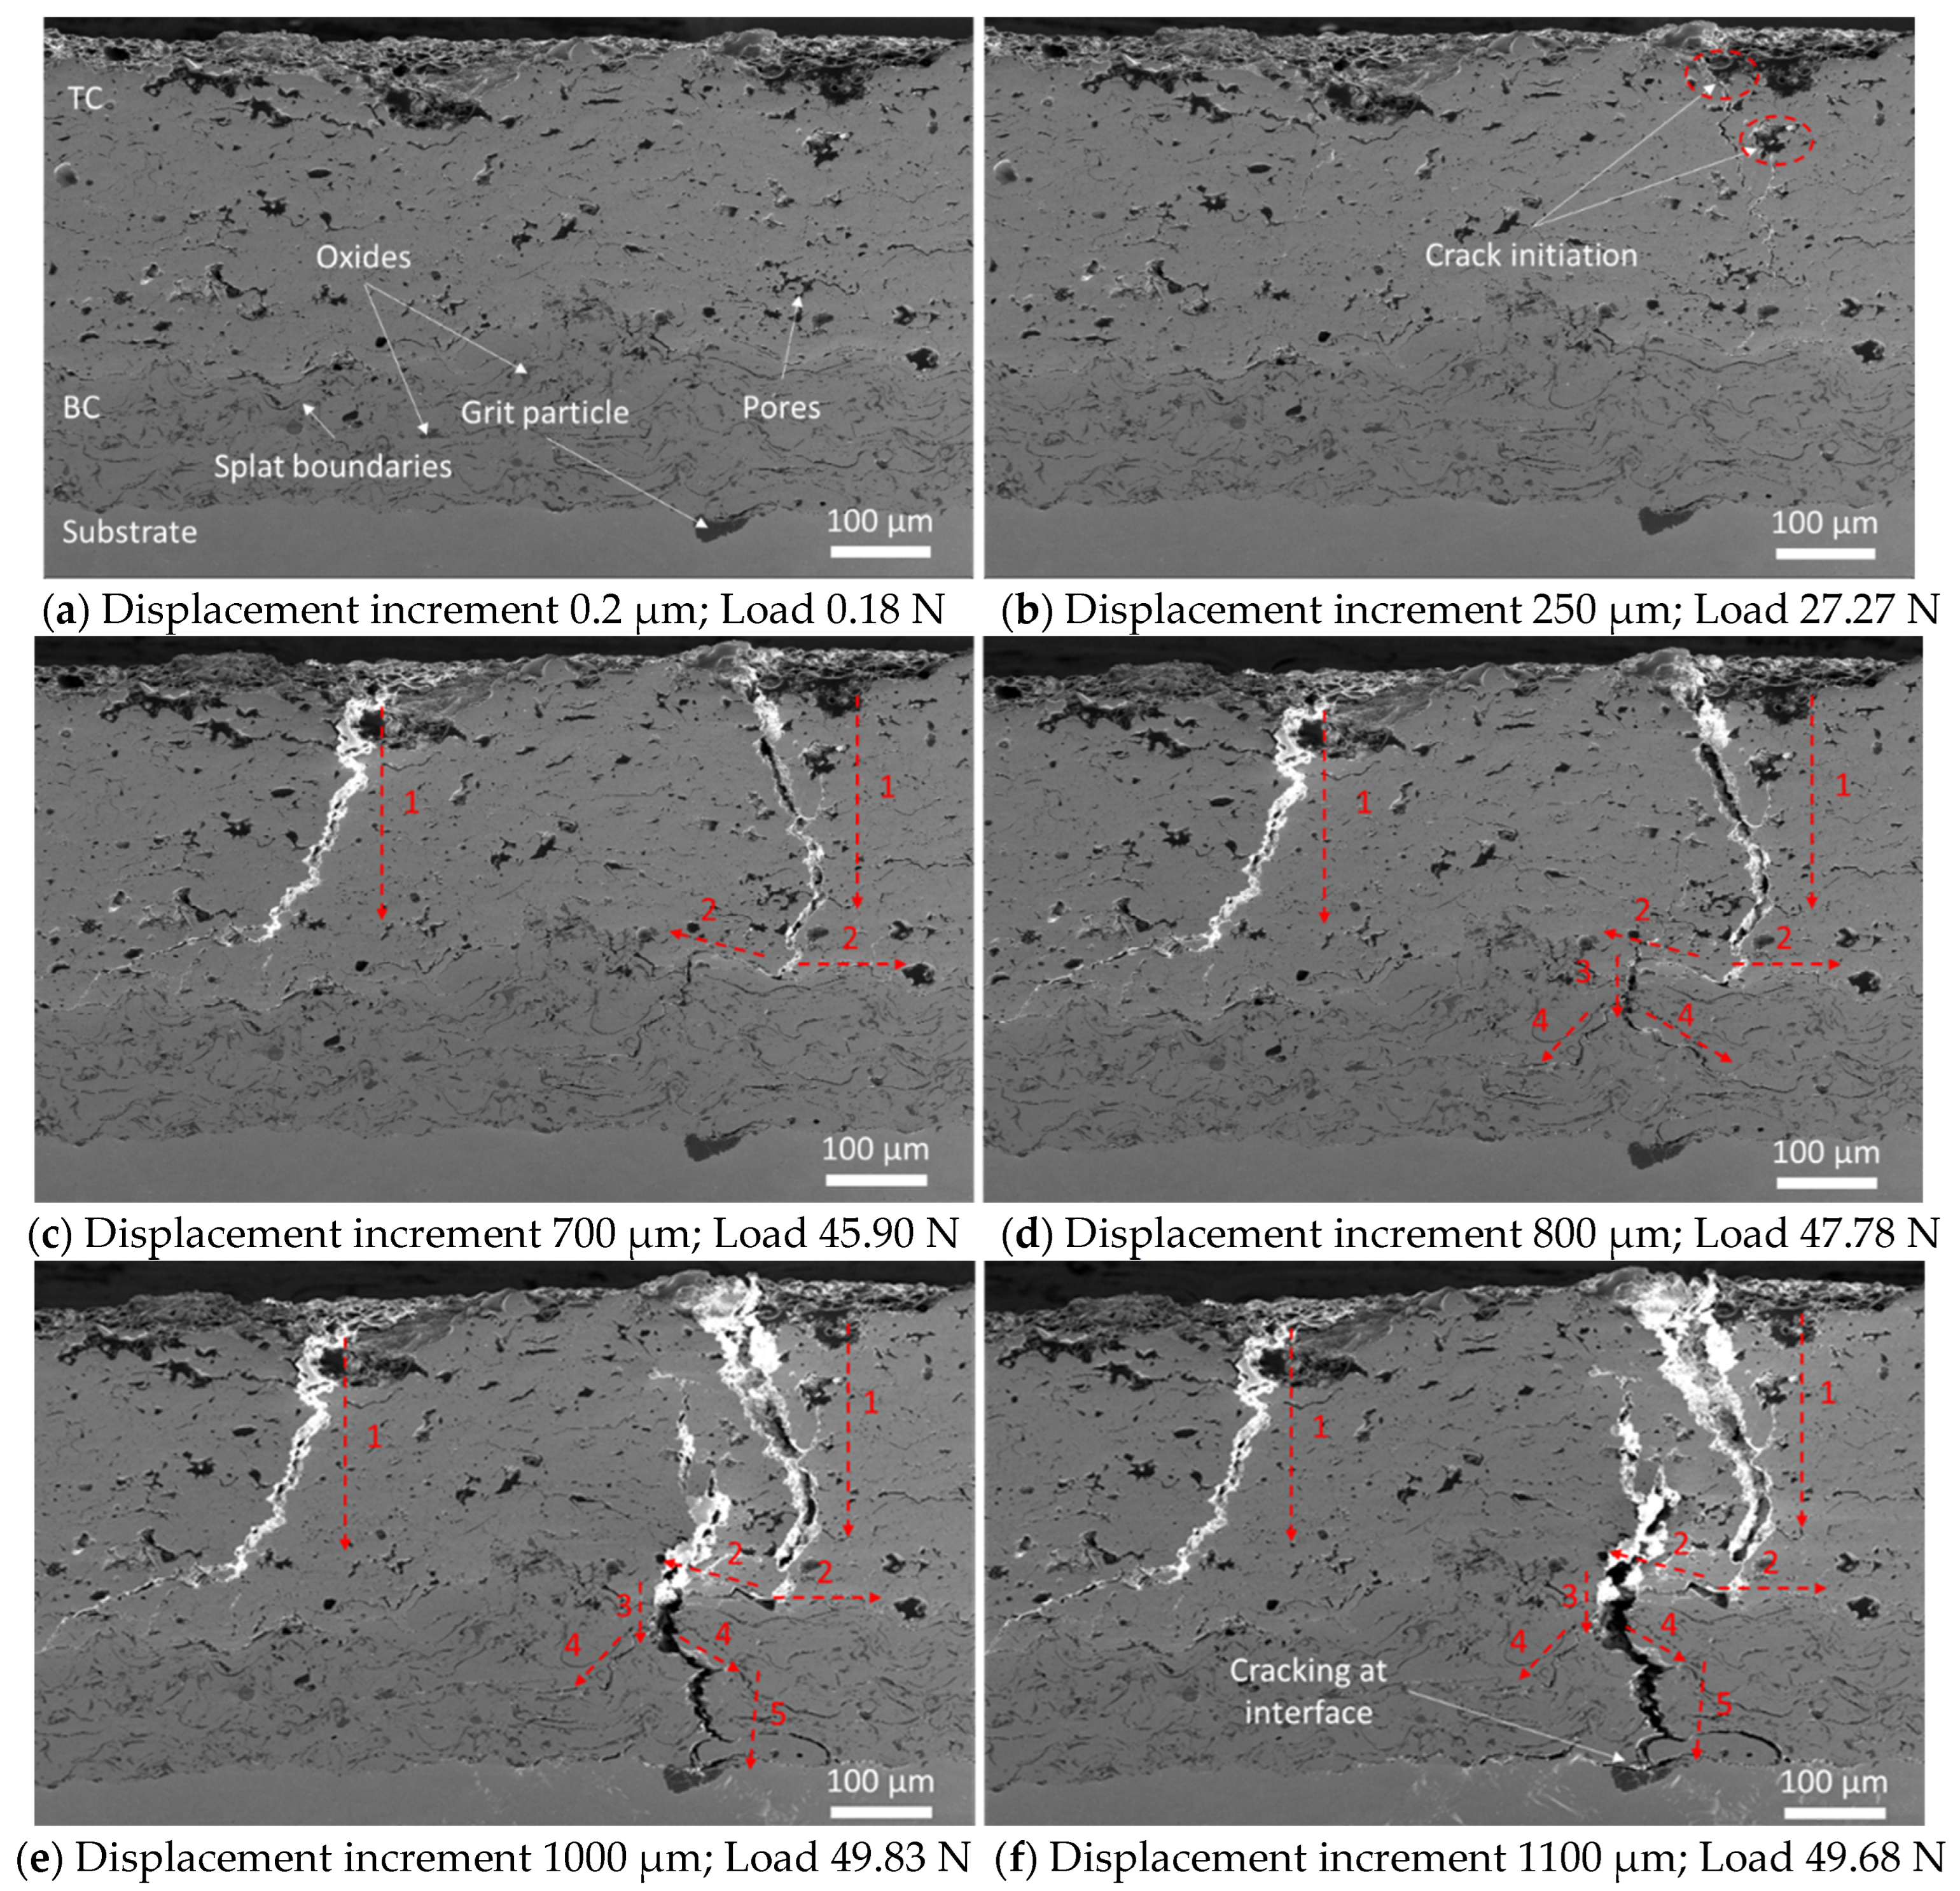
The cracking behavior of the APS coating under bending loading is shown in Figure 3. Since the coating sample was loaded in tension (central loading pin located below the substrate), the coating failure was expected to take place at the free surface exposed to the maximum in-plane tension state. The free surface of the top coat is recognized by considerable surface roughness, as indicated in the cross-section SEM images shown in Figure 3. The fracture of the APS-coatings was observed to initiate above the central loading area. Short cracks were seen to initiate in the valley region of the top coat surface and at the circumference of pre-existing pores in the TC layer (see Figure 3b). Surface roughness creates local stress concentrations at critical points, or irregularities (e.g., off-peaks or valley regions) on the coating’s surface and interfaces [41]. These stress concentrations can be the driving force behind crack initiation and propagation withing the coating system. For instance, one of the factors most affecting a TBC’s lifetime is the interfacial adhesion between the coating layers. Many researchers have studied the effect of surface roughness at the interfaces between TBC layers (e.g., surface roughness of BC and TGO) to quantify the stress distribution along the surface roughness using numerical modelling procedures [41,42,43]. It was demonstrated that rougher surfaces or interfaces led to easier crack initiation. In addition, stress localization was found to occur in the off-peak or valley regions, promoting micro-crack formation. These observations match well with the detection of the crack initiation behavior of APS coatings during the in-situ bending experiments. The first cracking observation was recorded at 0.06% flexural strain. It is worth mentioning that other cracks were observed at a lower magnification, initiating away from the central loading location. However, the main cracks at the beam mid-span area became dominant, causing localized strain relief in the surrounding material. Further straining causes the initiation of new cracks in addition to the enlargement and advancement of former cracks in the TC through thickness direction, as can be seen in Figure 3c,d. The main crack (i.e., the crack at the right side) propagated until it reached the TC/BC interface, then diverted at the splat boundary and propagated horizontally along the interface. Altering the direction of crack propagation is beneficial as it contributes to an increase in the fracture toughness of coatings and enhances their durability [44,45]. The propagation of horizontal cracks along the interface between the top coat and the bond coat can be considered an indication of inadequate adhesion between TC and BC layers, resulting in top coat spallation [26]. However, in this case, the crack was deflected at the TC/BC interface for a short distance; this may be due to the change of material. Then, it finds a weak point in the bond coat and proceeds with its vertical propagation through the thickness direction. Furthermore, the propagation of the crack across the TC/BC interface was noticed only in this sample, while in the other tested samples, cracks were propagated directly through the TC/BC interface. More loading causes the main crack to grow vertically through the BC layer, making its way towards the substrate surface. It was noticed that the lamellar oxide stringers within the bond coat layer introduce weak regions that facilitate the crack propagation process. APS coatings conventionally contain oxide inclusions because of the entrainment of ambient air into plasma jets, which restricts the effective bonding between the splats structures [46]. Hence, the crack propagation in the bond coat layer took place through oxide inclusions cracking, in addition to intersplat cracking. Crack branching took place at existing pores in the bond coat layer, as can be seen in Figure 3d (pointed out by dashed red arrows #4). Crack branching can negatively affect the performance of the TBC system, since more oxygen can infiltrate the TC layer, leading to accelerated growth of the TGO layer. However, during in-service conditions (e.g., high temperature), the TBC will have experienced some sintering and structural coalescence, which can mitigate the negative effect of crack branching. Subsequently, the crack reached the substrate surface, then bifurcated and propagated along the coating–substrate interface causing delamination of the coating (Figure 3e,f). Grit at the substrate surface due to the sandblasting operation seems to facilitate the initiated crack at the coating-substrate surface. It should be noted that the samples were grit-blasted using a commercial preparation system and the level of embedded grit is consistent with that found in commercial parts manufacturing. The increased bright contract in the SEM images at the crack regions in the ceramic top coat layer (Figure 3c–f) is due to the charging phenomenon resulting from the exposure of the non-carbon coated area (i.e., fracture region) to the imaging electron beam as mentioned before.
In order to provide further insights into the potential mechanisms responsible for crack propagation, branching, and deflection observed in the APS coatings, the following discussion is presented. A good understanding of the crack initiation and propagation mechanisms inside TBCs is important for prolonging their lifetime and performance. The crack takes place when the energy available for crack growth is sufficient to surpass the resistance of the material [47]. Yoffe [48] made the assumption that the crack growth occurs along the direction normal to the induced maximum stress, and the crack propagation process is stable provided that the propagation velocity is lower than a critical value. Once the crack velocity exceeds this critical value, the propagation process becomes unstable. At this point, the stress state at the crack tip changes and the hoop stress in the vicinity of the crack tip will have a maximum angle of approximately 60° from the crack propagation direction, which may result in crack branching. Another possible explanation for the crack branching phenomenon was given by Ravi-Chandar and Knauss [49], who suggested that existing microcracks in front of the main crack can lead to branching as a result of the growth and coalescence of the microcracks. The crack branching phenomenon leads to an increased cracking area, hence accelerating the deterioration of the coating system. Crack branching is particularly common in brittle materials where it can occur symmetrically or asymmetrically [47]. As mentioned before, and based on the in-situ observations, crack propagation occurred in the APS coating along the direction normal to the induced maximum tensile stresses, while asymmetrical crack branching took place due to the existence of microcracks and pores in front of the main crack. The crack branching mechanism is a complicated phenomenon as it is dependent on many factors, including crack tip speed and the stress intensity factor and its rate [47]. Therefore, numerical simulations are usually exploited to study crack branching. On the other hand, altering the path of crack propagation is a favorable mechanism for enhancing the toughness of brittle materials (e.g., ceramics). Crack deflection dissipates or absorbs the fracture energy needed for crack propagation and improves the fracture toughness of the coatings [44,45]. Various factors can affect crack propagation, such as changes in material properties, interfaces, stress gradients, and the presence of inclusions or defects. The conducted in-situ observations showed that crack deflection occurred at the splat boundaries.
The strain fields for the crack initiation and propagation processes in the APS coating after the in-situ bending experimentation were analyzed using the DIC technique. The strain distribution (exx and eyy) for sample #1 at different displacement increments, developed by the Ncorr MATLAB code [39], are shown in Figure 4a–d. DIC can effectively show the areas of high strain localization (e.g., crack initiation and propagation sites). The localized strain in the x-direction is noticeably high due to tensile stresses that developed within the coating layers during the bending loading, promoting the development of vertical cracks through the thickness direction (Figure 4b–d). The strain (exx) increases with increased bending load due to crack enlargement, especially in the main crack area at the right side, which matches well with the SEM micrographs. In contrast, the strain levels at areas adjacent to the cracks are relatively lower, which confirms that the main cracks at the beam mid-span area became dominant, causing localized strain relief in the surrounding material; this emphasizes the concentration of deformation and stress at the crack sites. It is worth mentioning that the strain measurement of the DIC is a localized value (caused by the induced crack opening), therefore it is much higher than the values of flexural strain calculated based on the bending theory. For instance, the DIC strain measurement (maximum exx) at the onset of crack initiation is around 0.2, while the flexural strain was calculated to be 0.0006. The maximum strain in the x-direction can effectively capture the propagation path of the vertical cracks developed in the TC layer. On the other hand, the strain distribution in the y-direction (eyy) can give an indication of the strain localization caused by the development of horizonal or interfacial cracks at the TC/BC interface, as shown in Figure 4c,d, which agrees with the crack propagation analysis highlighted in the previous section. After a certain crack opening, the DIC analysis failed to detect the displacement evaluation since the similarity between the undeformed and deformed microstructures was considerably deteriorated owing to the coating failure.
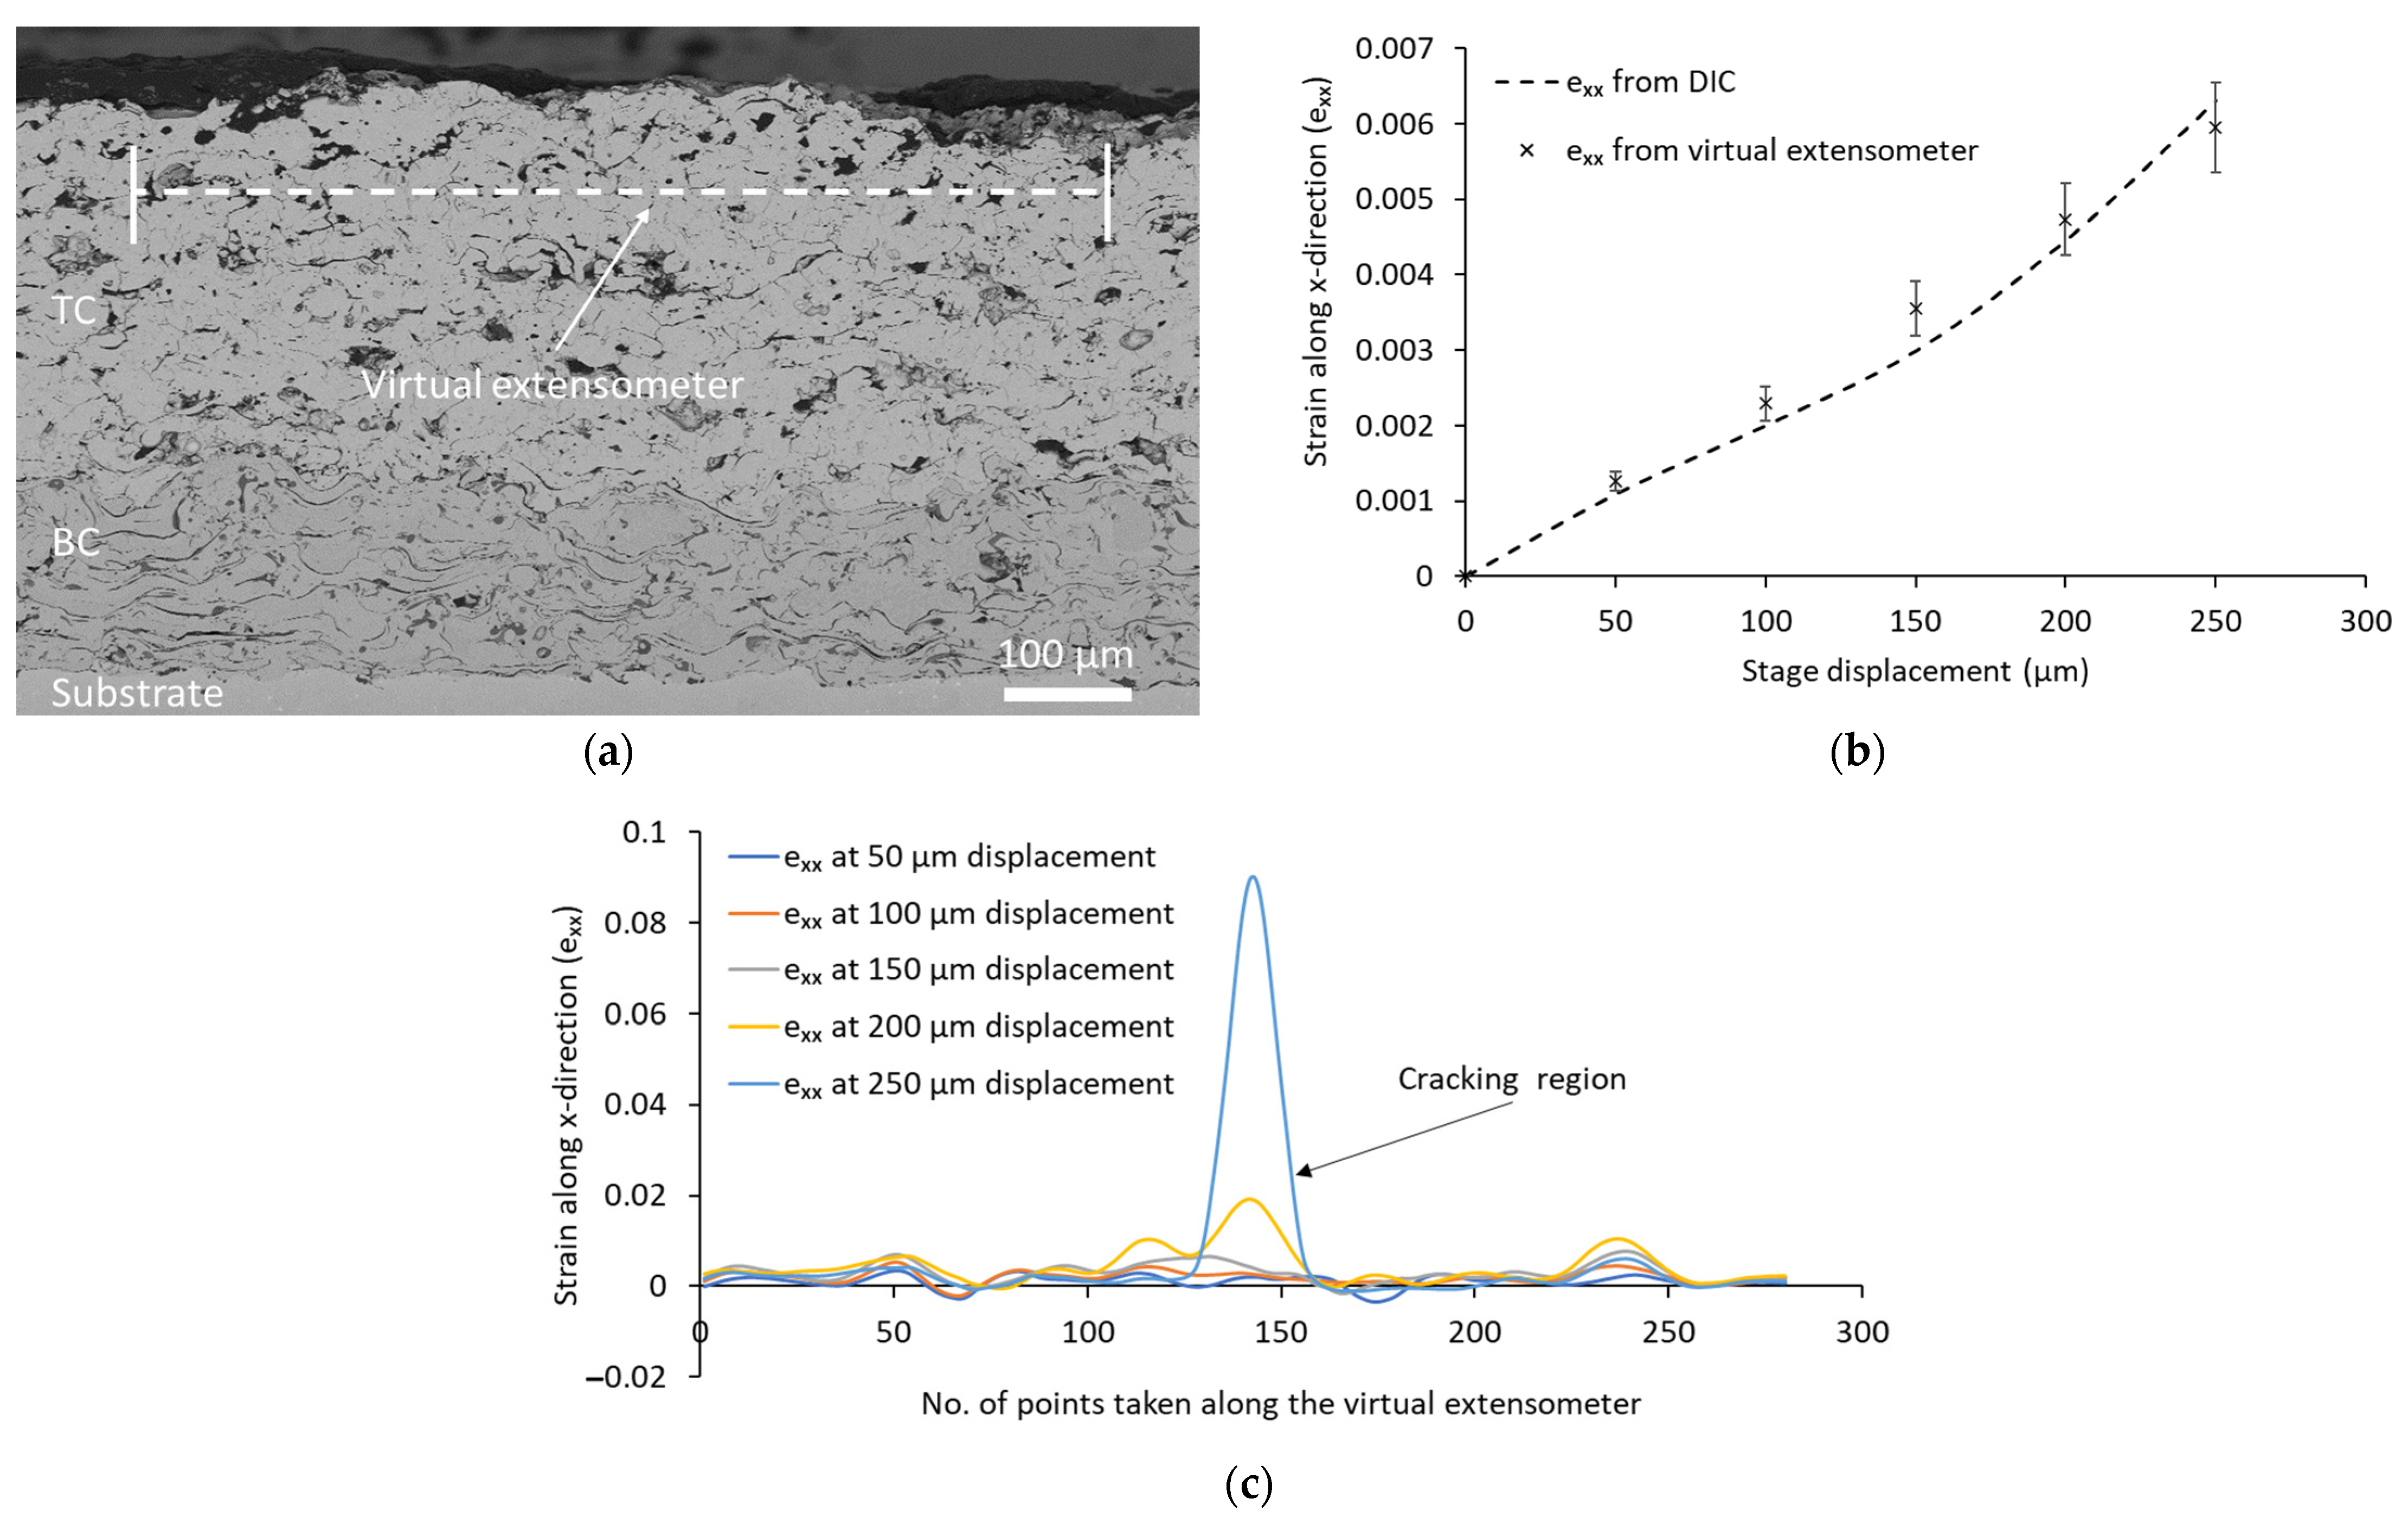
As mentioned before, the DIC strain prediction (exx) at the onset of crack initiation does not match well with the theoretical calculations. Hence, to ensure the reliability of the conducted DIC analysis, a virtual extensometer was used to verify the DIC measurements. The virtual extensometer technique is quite similar to the conventional methods of strain measurement at the macroscopic level. In this technique, the displacement between two points in each image was chosen to calculate the strain [18]. Thus, the change in the horizontal extension (x-direction) between two points defined within the TC layer at nearly 75 µm from its free surface (see Figure 5a) was measured at different displacements up to the coating’s failure to calculate the developed strain. Furthermore, the strain in the x-direction (exx) along the trace of the imposed virtual extensometer was extracted from the DIC software, averaged, and compared to the corresponding values obtained from the virtual extensometer at different bending displacements, as shown in Figure 5b. There is acceptable agreement between the strain calculations from the virtual extensometer and the averaged DIC measurements at different stages of displacement. Moreover, the evolution of strain values attains an almost linear behavior that corresponds to the increase in bending displacement, which is confirmed by both DIC and virtual extensometer measurements. This trend may be attributed to the inherent brittleness of the coating material. The DIC strain (exx) distribution along the trace of the virtual extensometer at different bending displacements is shown in Figure 5c. It can be noticed that, as the bending displacement increases, strain concentration takes place in the cracking area, which can be recognized as peaks, see Figure 5c. However, the regions surrounding the cracks are characterized by relatively low strain values. Furthermore, the strain distribution along the extensometer line reveals an uneven pattern, which may be attributed to the heterogeneous microstructure of the APS coatings. These microstructural features may cause differing strain accommodations.

3.2. In-Situ Bending Sample #2

The force-displacement curve for the in-situ bending experimentation of sample #2 and a BSE micrograph for the cross-section of the APS coating at the onset of first crack observation are shown in Figure 6a,b. The applied bending load induced elastic deformation in sample #2, reaching a maximum of approximately 30 N, followed by load softening owing to crack formation and propagation, which reduced the stiffness of the beam specimen (see Figure 6a). First crack formation was observed at 21.8 N, which was located just above the central support pin in the area of the induced maximum strain (marked by a dashed red circle in Figure 6b). Also, it seems that a micro-void near the coating’s free surface and at the location of the maximum stress contributes to facilitating the initiation of the crack. The calculated flexural strength and strain for sample #2 at crack formation are nearly 148 MPa and 0.07%, respectively.
Selected micrographs for the fracture behavior of the APS coating (sample #2) under bending loading are shown in Figure 7a–f. The crack formation took place at the coating’s free surface in the mid-span area above the central loading point, which is characterized by the maximum tensile stress state. As mentioned before, the pre-existing pore near the TC free surface seems to weaken this area and facilitate the crack initiation (see Figure 7b). Unlike the other two tested samples, the main crack initiation did not occur in the valley regions of the TC free surface. However, the formation of other vertical cracks away from the mid-span region at the valley regions of the TC layer was recorded. Further straining causes the central main crack to become dominant, resulting in stress relief in the other secondary cracks located away from the central loading point. Figure 7c,d show the enlargement and vertical propagation of the central crack in the thickness direction. Existing pores in the TC layer act as center points for short horizontal crack generation (i.e., crack branching), pointed out by dashed red arrows #2 in Figure 7c,d. Increasing the bending load resulted in one crack branch becoming dominant and growing faster towards the TC/BC interface. Once this crack branch reached the TC/BC interface, it propagated directly into the BC layer without altering its path due to the good adhesion between these layers. The crack changed its growing path and bifurcated at the BC layer due to the splat structure of BC (Figure 7e,f). As mentioned previously, the oxide inclusions in the BC layer introduce weak points along with weakening the bonding between the splats structures, leading to facilitation of the crack propagation process. Finally, the crack reached the substrate surface and propagated along the coating–substrate interface, causing local delamination of the coating.
The strain mapping (exx and eyy) developed by the Ncorr code [39] for the crack formation and growth in the APS coating (sample #2) after the real-time bending test are shown in Figure 8a–d. Formation of the main vertical crack at an early-stage loading was successfully detected by a strain field (exx) corresponding to the induced maximum tensile stress at the TC layer (see Figure 8b). The exx-strain map reveals the region of high strain concentration (crack opening area) and can effectively capture the propagation path of the central vertical crack. For instance, crack branching was detected by the DIC analysis (x-strain map), as can be seen in Figure 8c,d, and was accompanied by strain localization in the corresponding regions in the eyy-strain map. The DIC strain measurement (maximum exx) at the onset of crack initiation is around 0.02. Increasing the bending load resulted in more strain localization in the crack region due to stress concentration, while the areas adjacent to and away from the crack are featured with low strain values (Figure 8b–d). Once more, this observation correlates with the detected cracking behavior, where strain localization occurs in the primary cracks’ area at the center of the beam, leading to strain relief in the adjacent regions. The strain distribution in the y-direction (eyy) shows no sign of the initiation of horizontal cracks (strain localization) at the interface between TC and BC layers, which matches with the crack propagation analysis conducted in the prior section. Due to the induced excessive increase in the cracking area caused by the bending load, the DIC system was unable to generate the displacement and strain fields for the APS coating; the cracking within the coating introduces challenges to tracking and correlating the microstructural features, leading to difficulties in developing the displacement and strain maps.
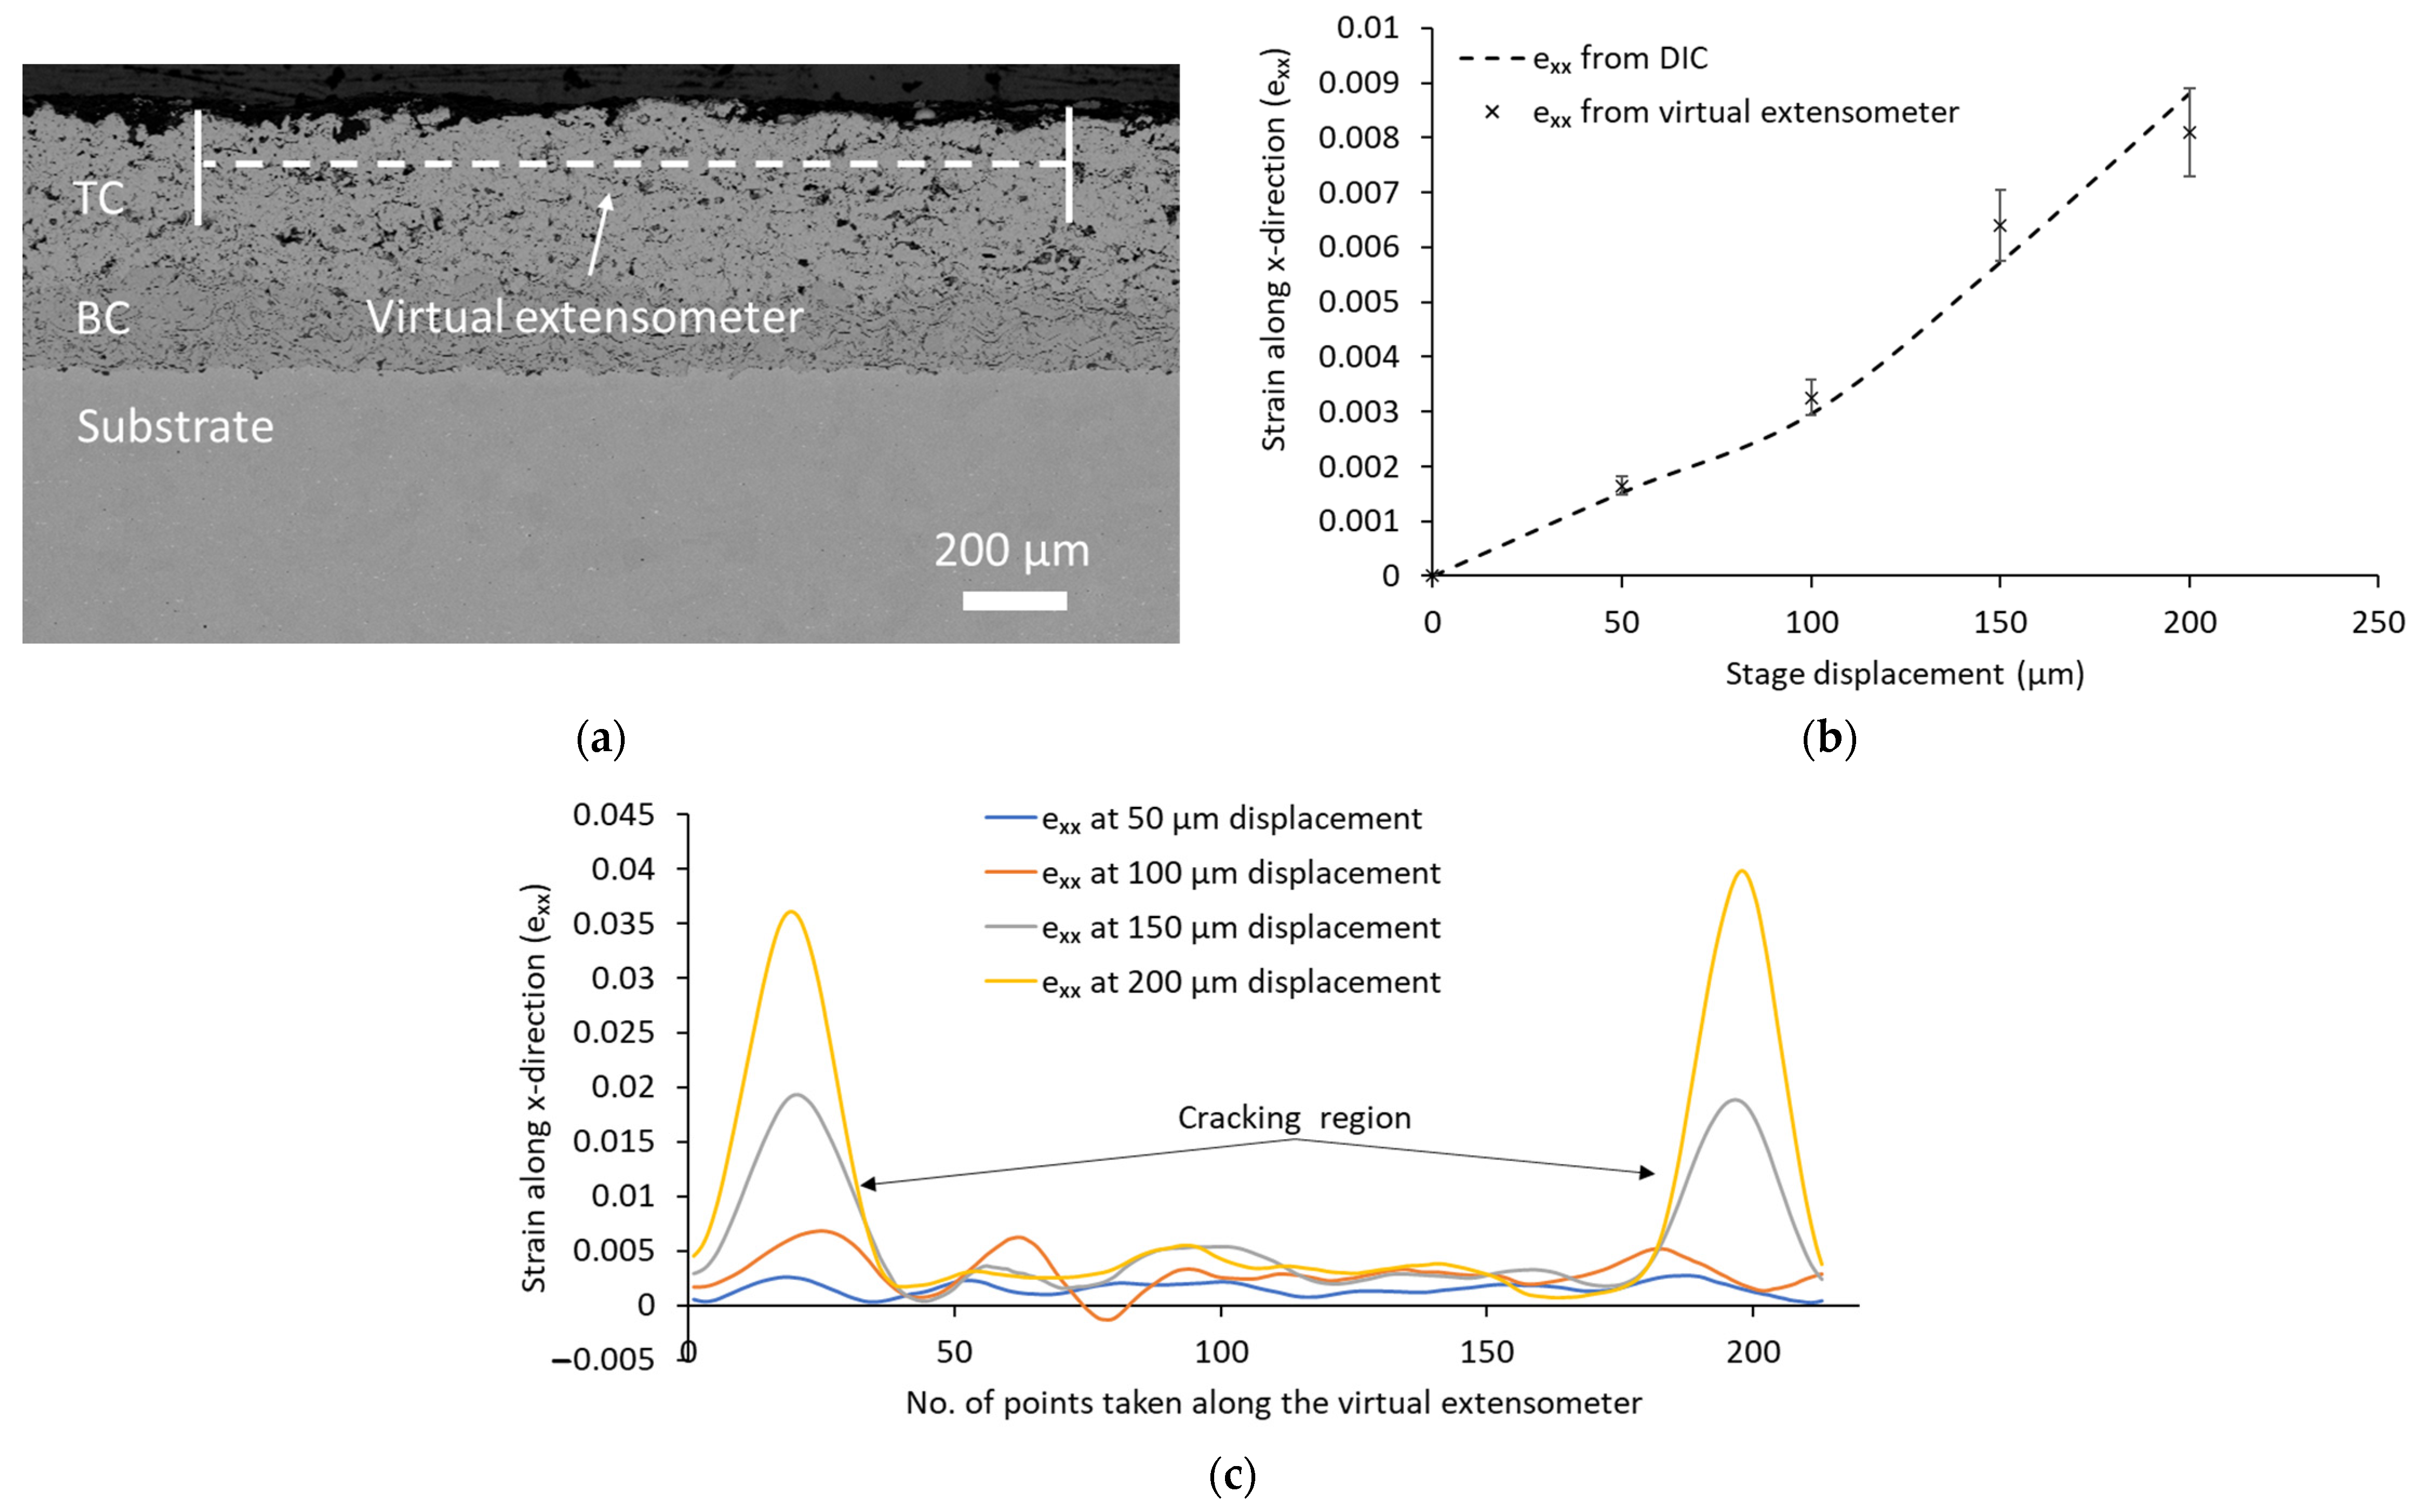
In order to verify the obtained DIC measurements for sample #2, a virtual extensometer was employed to measure the change in the horizontal displacement between two points defined in the TC layer at approximately 90 µm from its free surface at different displacements and up to the failure of the APS coating, see Figure 9a. The strain in the x-direction (exx), computed through the virtual extensometer, is compared to the averaged strain values obtained from the DIC exx-map along the extensometer line at different bending displacements, see Figure 9b. The strain values calculated from the virtual extensometer acceptably agreed with those obtained from averaging the DIC measurements at different stage displacements, as shown in Figure 9b. The strain measurements exhibited a linearity with the progression of the bending load up to failure. Figure 9c shows the distribution of strain in the x-direction (exx) obtained from the DIC analysis along the virtual extensometer line at different bending displacements. The strain distribution shows the concentration of strain within the cracking area, indicated by the central peak, whereas relatively lower strain values are observed in other regions, as shown in Figure 9c, which matches with the DIC strain fields introduced in the prior section. Moreover, the DIC strain measurements in Figure 9c show an uneven distribution, which may be related to the varied microstructural features of the coatings, thereby accommodating the strain differently.

3.3. In-Situ Bending Sample #3

Load-displacement data obtained from the Proxima testing stage during the conducted 3PB experimentation in a stepwise loading mode are shown in Figure 10a. It can be seen that linear loading behavior was detected up to approximately 200 N; subsequently, load softening was recorded due to the reduced stiffness of the beam specimen. The partial unloading can be recognized in the load–displacement curve as corresponding to the displacements at which the micrographs of the coating were acquired. The first crack observation was recorded at 149.28 N and the related micrograph of the TBC coating can be seen in Figure 10b. According to the beam theory, the flexural strength and maximum strain at which the first cracking of the coating was noted are approximately 251 MPa and 0.12%, respectively. The APS-TBCs microstructure is characterized by features including pores, oxide inclusions, splat boundaries, different phases, etc. The pores and splat structure of these coatings help to compensate for the thermal expansion mismatch among the TBC system layers and to achieve lower thermal conductivity (see Figure 10b).
Figure 11 shows the fracture of the APS-TBC coatings during the in-situ bending test. Since the coating sample was loaded in tension, crack initiation was first recorded as taking place at the free surface exposed to the maximum in-plane tension state. The TC free surface features significant surface roughness as indicated in the cross-section SEM images, see Figure 11. The fracture of the APS-coatings was observed to initiate above the central loading area. Primarily two short cracks were initiated at approximately 0.7 mm at each side of the central loading pin at the coating free surface, where the maximum strain was imposed (see Figure 11b), leading to a loss of the coatings’ stiffness. The cracks were observed to initiate in the valley regions of the top coat surface, as these areas may introduce stress concentration points that facilitate the crack initiation and propagation process. The flexural strain at which the first cracking of the brittle coating was observed is 0.12%. It is worth mentioning that other cracks were observed at a lower magnification initiating away from the central loading location. However, the main cracks at the beam mid-span area became dominant, causing localized strain relief in the surrounding material. As can be seen in Figure 11c,d, further straining caused cracks to enlarge and propagate vertically in the thickness direction towards the bond coat. At a certain point, crack branching takes place at the main crack that developed to the right of the loading point, as existing pores can act as center sites for small horizontal crack generation. The same crack changed its propagation path and deviated at the splat boundaries (crack propagated along the splat interface) within the bond coat layer as shown in Figure 11d (dashed red arrow 3). Since the toughness of materials is measured by their ability to restrict or prevent crack propagation, the microstructural features such as splat boundaries that cause crack deflection are important mechanisms that impart increased toughness to prolong the life of the thermal barrier coating [44,45]. On the other hand, the main crack (on the left side) propagated vertically through the top coat layer, the TC/BC interface, and the bond coat layer without any observation of crack branching or deviation phenomena. Moreover, it can be noted that when cracks reached the interface between the top coat and the bond coat, they propagated directly into the BC layer without changing their growth path, which gives an indication of the good adhesion between the TC and BC layers, which matches with the literature [9,27]. More deformation results in cracks proceeding towards the substrate (see Figure 11e,f) through the cracking of oxide inclusions and intersplat cracking. After the main crack (on the right side) approached the substrate surface, the propagation direction was diverted to be nearly parallel to the BC/substrate interface, which led to local delamination of the APS coatings due to the loss of adhesion to the surface of the substrate. Also, secondary through-thickness cracks were developed from the coating’s free surface, as seen in Figure 11f.
Figure 12a–c shows the strain distribution in the x and y directions (exx and eyy) generated by the DIC analysis for the micrographs obtained during the in-situ bending of sample #3. Again, the strain maps were able to detect the crack initiation and propagation locations in the APS coating layers. The strain map (exx) best represents the deformation fields that took place in the tensile loading direction of the coating due to the applied bending moment promoting the development of vertical cracks. These vertical cracks can be observed at each local maximum, suggesting that these strain fields resulted from crack opening pseudo-strains (see Figure 12b,c). The growth of these cracks was driven by bulk tensile stresses in the thermal barrier coating (TC). The DIC strain measurement (maximum exx) at the onset of crack initiation is around 0.02, while the strain map (eyy) can reveal the strain concentration in the vertical direction that may contribute to horizontal cracks formation. Therefore, the strain map (exx) has higher values compared to those of the y-strain map. The DIC maps show the concentration of the deformation fields in the main crack on the right side, which agrees with the in-situ observations being that the crack on the right is the dominant crack. Furthermore, strain localization in the eyy-strain map can be spotted, which may be attributed to the diversion of the crack propagation path at the splat boundary within the BC layer, see Figure 12c. This observation matches with the crack path explanation introduced in the previous section.
The verification process for the DIC analysis of sample #3 was achieved by comparing the strain values computed through a virtual extensometer imposed on the TC layer at approximately 100 µm from its free surface (see Figure 13a) and the averaged DIC measurements along the extensometer line. Figure 13b shows an acceptable match between the strain (exx) calculated from the virtual extensometer and the averaged strain values obtained from the DIC strain field in the x-direction at different bending displacements (up to failure of coating). Again, the strain evolution under the different bending displacements up to failure showed nearly a linear trend as can be seen in Figure 13b. Figure 13c shows the distribution of strain in the x-direction (exx) obtained from the DIC analysis along the extensometer line at different bending displacements, which confirms the strain localization at the cracking regions (two peaks at the extreme ends of the graph). Again, the distribution of exx-strain along the extensometer line (Figure 13c) exhibited an uneven pattern that could be attributed to the microstructure heterogeneity of the APS coatings.
Based on the previous observations from the conducted in-situ bending tests, the main features for the cracking behavior of the APS coating under mechanical loading can be simplified in the developed schematic representation shown in Figure 14.
In this schematic:
  • Bending moment (M) is applied to the coating specimen in such a way that the coating free surface is subjected to the maximum stress ( σ m a x ).
  • Due to the high tensile stresses experienced in the outer surface of the TC layer, the crack initiated at stress concentration areas such as the valley region or at the region where the maximum strain is induced above the central loading point.
  • The crack propagated vertically through the thickness direction of the TC layer, and crack branching took place when pre-existing pores came along with the crack propagation path leading to increased cracking area.
  • The crack propagated through the TC/BC interface by further straining, subsequently the crack changed its propagation path (i.e., deviated) at a splat boundary.
  • The crack continued its relative vertical propagation through the thickness direction of the BC layer until it reached the BC/substrate interface, leading to local delamination between the coating and the substrate.

3.4. Fractography Analysis

The fracture mechanism of the APS coating was studied based on the recorded micrographs for the failed samples. The same fracture mechanism was detected for the tested samples, therefore the fractography analysis introduced in this section is based on the SEM images obtained for sample #3 at high magnification for the different fracture regions of the coating (i.e., top coat and bond coat), see Figure 15a,b. It can be seen that, along the sides of the main crack region, numerous secondary cracks developed, which may result from the opening of pre-existing microcracks and pores within the coating microstructure or from a failure of the splat boundaries (see Figure 15a). By magnifying the fracture area within the dashed white square (Figure 15a), splat cracking can be recognized, which can be assumed to be the main mechanism for crack propagation within the ceramic coating layer. Another factor that can contribute to crack propagation under the mechanical loading is the loss of cohesion between splats. The splat cracking mechanism has been detected by other researchers [8,27]. For instance, splat cracking along with the interlinking of the pre-existing cracks were the dominant mechanisms for crack propagation for different coatings (i.e., APS and HVOF-sprayed Al2O3-40ZrO2 coatings) under in-situ bending-driven failure experimentation [27]. Mušálek et al. [8] conducted in-situ bending tests on free-standing plasma sprayed ceramic (alumina) and metallic (stainless steel 316L) coatings to observe their fracture behavior. For the ceramic coatings, splat cracking was defined as a prime failure mechanism. Also, splat debonding was detected in the regions weakened by pores. For the bond coat layer, the fracture mechanisms of crack propagation are assumed to be mainly due to the cracking of oxide inclusions along with splat debonding and cracking, as seen in Figure 15b. Splat debonding can take place in coatings at regions where the splat bonds were weakened by pores and oxide stringers [8,46]. For instance, Mušálek et al. [9] introduced a fractography analysis of a failed APS-TBC coating under bending experimentation and showed that loose bonding between splats structures in the BC layer permitted crack propagation along the splat-splat interface. The oxides or voids (pores and microcracks) at the splats interface were assumed to deteriorate the splats bonding strength. Many fracture features (fragments of cracked splats or loosened splats) were observed in the fracture area for the APS-TBC coating. Hence, it can be confirmed that the microstructural defects that pre-exist in the coating microstructure, such as pores, cracks, and splat boundaries, may act as stress concentration points and affect the crack propagation process. The most typical fracture mechanisms for the coating layers were splat cracking and splat debonding as well as the cracking of lamellar oxides in BC layer. The fracture analysis of the failed coatings is based on previous fractographic investigations [8,15,16].

4. Conclusions

The microstructure of the APS coating contains different features (e.g., pores, cracks, oxides inclusions and splat structure, etc.) that promote arbitrary crack initiation and propagation. Therefore, real-time 3PB experimentations were carried out inside an SEM chamber to study the cracking behavior of air plasma spray TBCs to define the common fracture characteristics of the APS coatings, followed by DIC and fractography analysis to highlight the following conclusions:
  • Crack initiation can take place at locations of high stress concentration (e.g., valleys regions) that are not necessarily at the theoretical point of maximum stress. This behavior can be attributed to the coatings’ high surface roughness, resulting in locally weakened regions (i.e., valleys) where cracks can originate.
  • Crack branching occurred when the path of crack propagation came along with pre-existing microstructural defects (e.g., pores and micro cracks), thereby affecting the durability of the TBC system and facilitating its failure. The increased cracking area promotes oxygen infiltration through the TC layer, leading to accelerated growth of the TGO layer beyond critical thickness and causing coating delamination. The splat microstructure of the APS-TBC helped to deviate the crack propagation path, which can help to enhance the fracture toughness of the coatings by dissipating the energy required for crack propagation.
  • Based on the fractography analysis, it can be inferred that the dominant crack propagation mechanism in the top coat is splat cracking. On the other hand, for the bond coat, crack propagation occurs through cracking of the lamellar oxide stringers, along with splat cracking and debonding.
  • DIC measurements can provide an effective method with which to track the crack initiation and propagation process in APS coatings. The developed strain maps showed higher strain levels within the cracking region, indicating localized deformation and stress concentration.
The current research involved studying the cracking behavior of the as-deposited APS coatings without subjecting them to any heat treatment or oxidation procedures to imitate in-service working conditions. The provided observation may differ when the coatings are subjected to thermal loading procedures such as heat treatment and thermal cycling. In future work, in-situ bending experimentation will be conducted on heat-treated coatings to provide deep insights into the effect of heat treatment on the cracking behavior of the coating system. Heat treatment processes can significantly alter the microstructure, mechanical properties, and residual stresses within the coating, which, in turn, can influence its response to external mechanical loading.

Supplementary Materials

The following supporting information can be downloaded at: https://www.mdpi.com/article/10.3390/coatings13091493/s1, Figure S1: Fracture of APS Coating-Sample_1; Figure S2: Fracture of APS Coating-Sample_2; Figure S3: Fracture of APS Coating-Sample_3.

Author Contributions

M.B. proposed this article idea and structured the paper in addition to revising the paper; N.C. produced the samples used in this study; M.A. (Mohamed Amer), M.A. (Muhammad Arshad) and Q.H. were responsible for developing the work plan, data collecting, and analysis, as well as writing the paper; N.C., V.J. and J.N. were responsible for revising and refining this article. All authors have read and agreed to the published version of the manuscript.

Funding

This research received no funding.

Institutional Review Board Statement

Not applicable.

Informed Consent Statement

Not applicable.

Data Availability Statement

Data are contained within the article.

Conflicts of Interest

The authors declare that there are no conflict of interest regarding the publication of this manuscript.

References

  1. Wortman, D.J.; Nagaraj, B.A.; Duderstadt, E.C. Thermal Barrier Coatings for Gas Turbine Use. Mater. Sci. Eng. A 1989, 120, 433–440. [Google Scholar] [CrossRef]
  2. Durat, M.; Kapsiz, M.; Nart, E.; Ficici, F.; Parlak, A. The Effects of Coating Materials in Spark Ignition Engine Design. Mater. Des. 2012, 36, 540–545. [Google Scholar] [CrossRef]
  3. Padture, N.P.; Gell, M.; Jordan, E.H. Thermal Barrier Coatings for Gas-Turbine Engine Applications. Science 2002, 296, 280–284. [Google Scholar] [CrossRef] [PubMed]
  4. Vaßen, R.; Kaßner, H.; Stuke, A.; Hauler, F.; Hathiramani, D.; Stöver, D. Advanced Thermal Spray Technologies for Applications in Energy Systems. Surf. Coat. Technol. 2008, 202, 4432–4437. [Google Scholar] [CrossRef]
  5. Mondal, K.; Nuñez, L., III; Downey, C.M.; Van Rooyen, I.J. Thermal Barrier Coatings Overview: Design, Manufacturing, and Applications in High-Temperature Industries. Ind. Eng. Chem. Res. 2021, 60, 6061–6077. [Google Scholar] [CrossRef]
  6. Ramalingam, S.; Murugesan, E.; Rajendran, S.; Ganesan, P. Application of Thermal Barrier Coating for Improving the Suitability of Annona Biodiesel in a Diesel Engine. Therm. Sci. 2016, 20, 973–979. [Google Scholar] [CrossRef]
  7. Xu, H.; Guo, H.; Gong, S. 16-Thermal Barrier Coatings. In Developments in High Temperature Corrosion and Protection of Materials; Woodhead Publishing Series in Metals and Surface Engineering; Gao, W., Li, Z.B.T., Eds.; Woodhead Publishing: Sawston, UK, 2008; pp. 476–491. ISBN 978-1-84569-219-3. [Google Scholar]
  8. Mušálek, R.; Kovářík, O.; Matějíček, J. In-Situ Observation of Crack Propagation in Thermally Sprayed Coatings. Surf. Coat. Technol. 2010, 205, 1807–1811. [Google Scholar] [CrossRef]
  9. Mušálek, R.; Taltavull, C.; Galisteo, A.J.L.; Curry, N. Evaluation of Failure Micromechanisms of Advanced Thermal Spray Coatings by In Situ Experiment. In Key Engineering Materials; Trans. Tech. Publ.: Zurich, Switzerland, 2014; Volume 606, pp. 187–190. [Google Scholar]
  10. Evans, A.G.; Mumm, D.R.; Hutchinson, J.W.; Meier, G.H.; Pettit, F.S. Mechanisms Controlling the Durability of Thermal Barrier Coatings. Prog. Mater. Sci. 2001, 46, 505–553. [Google Scholar] [CrossRef]
  11. Gok, M.G.; Goller, G. State of the Art of Gadolinium Zirconate Based Thermal Barrier Coatings: Design, Processing and Characterization. In Methods for Film Synthesis and Coating Procedures; InTech Open: London, UK, 2019. [Google Scholar]
  12. Musalek, R.; Matejicek, J.; Vilemova, M.; Kovarik, O. Non-Linear Mechanical Behavior of Plasma Sprayed Alumina under Mechanical and Thermal Loading. J. Therm. Spray Technol. 2010, 19, 422–428. [Google Scholar] [CrossRef]
  13. Prchlik, L.; Pisacka, J.; Sampath, S. Deformation and Strain Distribution in Plasma Sprayed Nickel-Aluminum Coating Loaded by a Spherical Indenter. Mater. Sci. Eng. A 2003, 360, 264–274. [Google Scholar] [CrossRef]
  14. Choi, W.B.; Wu, Y.; Sampath, S.; Gouldstone, A. Modified Indentation Techniques to Probe Inelasticity in Ni-5% Al Coatings from Different Processes. J. Therm. Spray Technol. 2009, 18, 65–74. [Google Scholar] [CrossRef]
  15. Zhou, Y.C.; Tonomori, T.; Yoshida, A.; Liu, L.; Bignall, G.; Hashida, T. Fracture Characteristics of Thermal Barrier Coatings after Tensile and Bending Tests. Surf. Coat. Technol. 2002, 157, 118–127. [Google Scholar] [CrossRef]
  16. Kovářík, O.; Siegl, J.; Procházka, Z. Fatigue Behavior of Bodies with Thermally Sprayed Metallic and Ceramic Deposits. J. Therm. Spray Technol. 2008, 17, 525–532. [Google Scholar] [CrossRef]
  17. Amer, M.; Hayat, Q.; Janik, V.; Jennett, N.; Nottingham, J.; Bai, M. A Review on In Situ Mechanical Testing of Coatings. Coatings 2022, 12, 299. [Google Scholar] [CrossRef]
  18. Patibanda, S.; Nagda, V.J.; Kalra, J.; Sivakumar, G.; Abrahams, R.; Jonnalagadda, K.N. Mechanical Behavior of Freestanding 8YSZ Thin Films under Tensile and Bending Loads. Surf. Coat. Technol. 2020, 393, 125771. [Google Scholar] [CrossRef]
  19. Zhou, M.; Yao, W.B.; Yang, X.S.; Peng, Z.B.; Li, K.K.; Dai, C.Y.; Mao, W.G.; Zhou, Y.C.; Lu, C. In-Situ and Real-Time Tests on the Damage Evolution and Fracture of Thermal Barrier Coatings under Tension: A Coupled Acoustic Emission and Digital Image Correlation Method. Surf. Coat. Technol. 2014, 240, 40–47. [Google Scholar] [CrossRef]
  20. Zhu, W.; Wu, Q.; Yang, L.; Zhou, Y.C. In Situ Characterization of High Temperature Elastic Modulus and Fracture Toughness in Air Plasma Sprayed Thermal Barrier Coatings under Bending by Using Digital Image Correlation. Ceram. Int. 2020, 46, 18526–18533. [Google Scholar] [CrossRef]
  21. Martins, J.P.; Yu, H.; Chen, Y.; Brewster, G.; McIntyre, R.; Xiao, P. Effect of Bond Coat Topography on the Fracture Mechanics and Lifetime of Air-Plasma Sprayed Thermal Barrier Coatings. Surf. Coat. Technol. 2021, 421, 127447. [Google Scholar] [CrossRef]
  22. Yang, L.; Zhong, Z.C.; You, J.; Zhang, Q.M.; Zhou, Y.C.; Tang, W.Z. Acoustic Emission Evaluation of Fracture Characteristics in Thermal Barrier Coatings under Bending. Surf. Coat. Technol. 2013, 232, 710–718. [Google Scholar] [CrossRef]
  23. Planques, P.; Vidal, V.; Lours, P.; Proton, V.; Crabos, F.; Huez, J.; Viguier, B. Characterization of the Mechanical Properties of Thermal Barrier Coatings by 3 Points Bending Tests and Modified Small Punch Tests. Surf. Coat. Technol. 2017, 332, 40–46. [Google Scholar] [CrossRef]
  24. Jiang, P.; Fan, X.; Sun, Y.; Li, D.; Wang, T. Bending-Driven Failure Mechanism and Modelling of Double-Ceramic-Layer Thermal Barrier Coating System. Int. J. Solids Struct. 2018, 130, 11–20. [Google Scholar] [CrossRef]
  25. Chen, Y.; Li, C.; Zhao, X.; Xiao, P. Measurements and Understanding of the Stiffness of an Air Plasma Sprayed Thermal Barrier Coating. Surf. Coat. Technol. 2020, 394, 125678. [Google Scholar] [CrossRef]
  26. Musalek, R.; Vilemova, M.; Matejicek, J.; Rey, U.; Carlos, J. In-Situ Observation of Ongoing Microstructural Changes in Functionally Graded Thermal Spray Coating during Mechanical Loading. In Proceedings of the Surface Modification Technologies XXVIII, Tampere, Finland, 16–18 June 2014; pp. 571–579. [Google Scholar]
  27. Kiilakoski, J.; Musalek, R.; Lukac, F.; Koivuluoto, H.; Vuoristo, P. Evaluating the Toughness of APS and HVOF-Sprayed Al2O3-ZrO2-Coatings by in-Situ-and Macroscopic Bending. J. Eur. Ceram. Soc. 2018, 38, 1908–1918. [Google Scholar] [CrossRef]
  28. Bertrand, G.; Bertrand, P.; Roy, P.; Rio, C.; Mevrel, R. Low Conductivity Plasma Sprayed Thermal Barrier Coating Using Hollow Psz Spheres: Correlation between Thermophysical Properties and Microstructure. Surf. Coat. Technol. 2008, 202, 1994–2001. [Google Scholar] [CrossRef]
  29. Curry, N.; Markocsan, N.; Li, X.-H.; Tricoire, A.; Dorfman, M. Next Generation Thermal Barrier Coatings for the Gas Turbine Industry. J. Therm. Spray Technol. 2011, 20, 108–115. [Google Scholar] [CrossRef]
  30. Haynes International HASTELLOY® X Alloy Principal Features. Available online: https://haynesintl.com/docs/default-source/pdfs/new-alloy-brochures/high-temperature-alloys/brochures/x-brochure.pdf?sfvrsn=15b829d4_40 (accessed on 8 May 2023).
  31. Rösler, J.; Bäker, M.; Aufzug, K. A Parametric Study of the Stress State of Thermal Barrier Coatings: Part I: Creep Relaxation. Acta Mater. 2004, 52, 4809–4817. [Google Scholar]
  32. Joshi, M.; Bhattacharyya, A.; Ali, S.W. Characterization Techniques for Nanotechnology Applications in Textiles. Indian J. Fibre Text. Res. 2008, 33, 304–317. [Google Scholar]
  33. Suzuki, E. High-resolution Scanning Electron Microscopy of Immunogold-labelled Cells by the Use of Thin Plasma Coating of Osmium. J. Microsc. 2002, 208, 153–157. [Google Scholar] [CrossRef]
  34. Robinson, V.N.E. Imaging with Backscattered Electrons in a Scanning Electron Microscope. Scanning 1980, 3, 15–26. [Google Scholar] [CrossRef]
  35. ASTM C1161-02; Standard Test Method for Flexural Strength of Advanced Ceramics at Ambient Temperature. ASTM International: West Conshohocken, PA, USA, 2002; pp. 1–21.
  36. Gere, J.M. Deflections of Beams. In Mechanics of Materials; Thomson Learning: Independence, KY, USA, 2004. [Google Scholar]
  37. ASTM D790-17; Standard Test Methods for Flexural Properties of Unreinforced and Reinforced Plastics and Electrical Insulating Materials. ASTM International: West Conshohocken, PA, USA, 2017.
  38. Zhao, J.; Sang, Y.; Duan, F. The State of the Art of Two-dimensional Digital Image Correlation Computational Method. Eng. Rep. 2019, 1, e12038. [Google Scholar] [CrossRef]
  39. Blaber, J.; Adair, B.; Antoniou, A. Ncorr: Open-Source 2D Digital Image Correlation Matlab Software. Exp. Mech. 2015, 55, 1105–1122. [Google Scholar] [CrossRef]
  40. Pan, B. Reliability-Guided Digital Image Correlation for Image Deformation Measurement. Appl. Opt. 2009, 48, 1535–1542. [Google Scholar] [CrossRef] [PubMed]
  41. Jiang, J.; Wang, W.; Zhao, X.; Liu, Y.; Cao, Z.; Xiao, P. Numerical Analyses of the Residual Stress and Top Coat Cracking Behavior in Thermal Barrier Coatings under Cyclic Thermal Loading. Eng. Fract. Mech. 2018, 196, 191–205. [Google Scholar] [CrossRef]
  42. Li, S.; Qi, H.; Song, J.; Yang, X.; Che, C. Effect of Bond-Coat Surface Roughness on Failure Mechanism and Lifetime of Air Plasma Spraying Thermal Barrier Coatings. Sci. China Technol. Sci. 2019, 62, 989–995. [Google Scholar] [CrossRef]
  43. Song, J.; Qi, H.; Shi, D.; Yang, X.; Li, S. Effect of Non-Uniform Growth of TGO Layer on Cracking Behaviors in Thermal Barrier Coatings: A Numerical Study. Surf. Coat. Technol. 2019, 370, 113–124. [Google Scholar] [CrossRef]
  44. Chen, Y.; Zhang, R.; Zhang, G.; Jiang, P.; Song, J.; Chu, X. Toughening Mechanism of Thermal Barrier Coatings. Int. J. Thermophys. 2021, 42, 1–16. [Google Scholar] [CrossRef]
  45. Steinbrech, R.W. Toughening Mechanisms for Ceramic Materials. J. Eur. Ceram. Soc. 1992, 10, 131–142. [Google Scholar] [CrossRef]
  46. Dong, X.-Y.; Luo, X.-T.; Ge, Y.; Li, C.-J. Enhancing the Hot-Corrosion Resistance of Atmospheric Plasma Sprayed Ni-Based Coatings by Adding a Deoxidizer. Mater. Des. 2021, 211, 110154. [Google Scholar] [CrossRef]
  47. Sun, Y.; Edwards, M.G.; Chen, B.; Li, C. A State-of-the-Art Review of Crack Branching. Eng. Fract. Mech. 2021, 257, 108036. [Google Scholar] [CrossRef]
  48. Yoffe, E.H. LXXV. The Moving Griffith Crack. Lond. Edinb. Dublin Philos. Mag. J. Sci. 1951, 42, 739–750. [Google Scholar] [CrossRef]
  49. Ravi-Chandar, K.; Knauss, W.G. An Experimental Investigation into Dynamic Fracture: III. On Steady-State Crack Propagation and Crack Branching. Int. J. Fract. 1984, 26, 141–154. [Google Scholar] [CrossRef]
Figure 1. (a) Schematic representation of the specimen, loading, and support conditions for the three-point bending test (unit: mm), (b) bending sample within Micromecha Proxima stage mounted within SEM.
Coatings 13 01493 g001
Figure 2. Sample #1 (a) load vs. crosshead displacement curve, (b) first crack observation in the coating.
Coatings 13 01493 g002
Figure 3. Cracking behavior of APS-TBC coatings during in-situ 3PB experimentation for sample #1, (af) selected SEM micrographs for the crack propagation process.
Coatings 13 01493 g003
Figure 4. The strain fields (exx and eyy) evolution for sample #1 at different displacements (a) 150 µm (b) 250 µm (c) 450 µm (d) 600 µm.
Coatings 13 01493 g004
Figure 5. Sample #1 (a) location of the virtual extensometer in the TC layer, (b) comparison of strain (exx) between averaged DIC measurements and virtual extensometer at different displacements, (c) distribution of strain (exx) along the trace of the virtual extensometer obtained from DIC analysis at different displacements.
Coatings 13 01493 g005
Figure 6. Sample #2 (a) load vs. crosshead displacement curve, (b) first crack observation in the coating.
Coatings 13 01493 g006
Figure 7. Cracking behavior of APS-TBC coatings during in-situ 3PB experimentation for sample #2, (af) selected SEM micrographs for the crack propagation process.
Coatings 13 01493 g007
Figure 8. The strain fields (exx and eyy) evolution for sample #2 at different displacements (a) 150 µm (b) 250 µm (c) 450 µm (d) 600 µm.
Coatings 13 01493 g008
Figure 9. Sample #2 (a) location of the virtual extensometer in the TC layer, (b) comparison of strain (exx) between averaged DIC measurements and virtual extensometer at different displacements, (c) distribution of strain (exx) along the trace of the virtual extensometer obtained from DIC analysis at different displacements.
Coatings 13 01493 g009
Figure 10. Sample #3 (a) load vs. crosshead displacement curve, (b) first crack observation in the coating.
Coatings 13 01493 g010
Figure 11. Cracking behavior of APS-TBC coatings during in-situ 3PB experimentation for sample #3, (af) selected SEM micrographs for the crack propagation process.
Coatings 13 01493 g011
Figure 12. The strain fields (exx and eyy) evolution for sample #3 at different displacements (a) 150 µm (b) 250 µm (c) 450 µm.
Coatings 13 01493 g012
Figure 13. Sample #3 (a) location of the virtual extensometer in the TC layer, (b) comparison of strain (exx) between averaged DIC measurements and virtual extensometer at different displacements, (c) distribution of strain (exx) along the trace of the virtual extensometer obtained from DIC analysis at different displacements.
Coatings 13 01493 g013
Figure 14. Schematic representation for bending driven failure of APS-TBC coating.
Coatings 13 01493 g014
Figure 15. Detailed micrographs of the fractured area (a) top coat, (b) bond coat.
Coatings 13 01493 g015
Disclaimer/Publisher’s Note: The statements, opinions and data contained in all publications are solely those of the individual author(s) and contributor(s) and not of MDPI and/or the editor(s). MDPI and/or the editor(s) disclaim responsibility for any injury to people or property resulting from any ideas, methods, instructions or products referred to in the content.

