
Cracking Behavior of Gd2Zr2O7/YSZ Multi-Layered Thermal Barrier Coatings Deposited by Suspension Plasma Spray

 , ,
, ,  , ,
, , 
Abstract
:1. Introduction
2. Experimental Methods
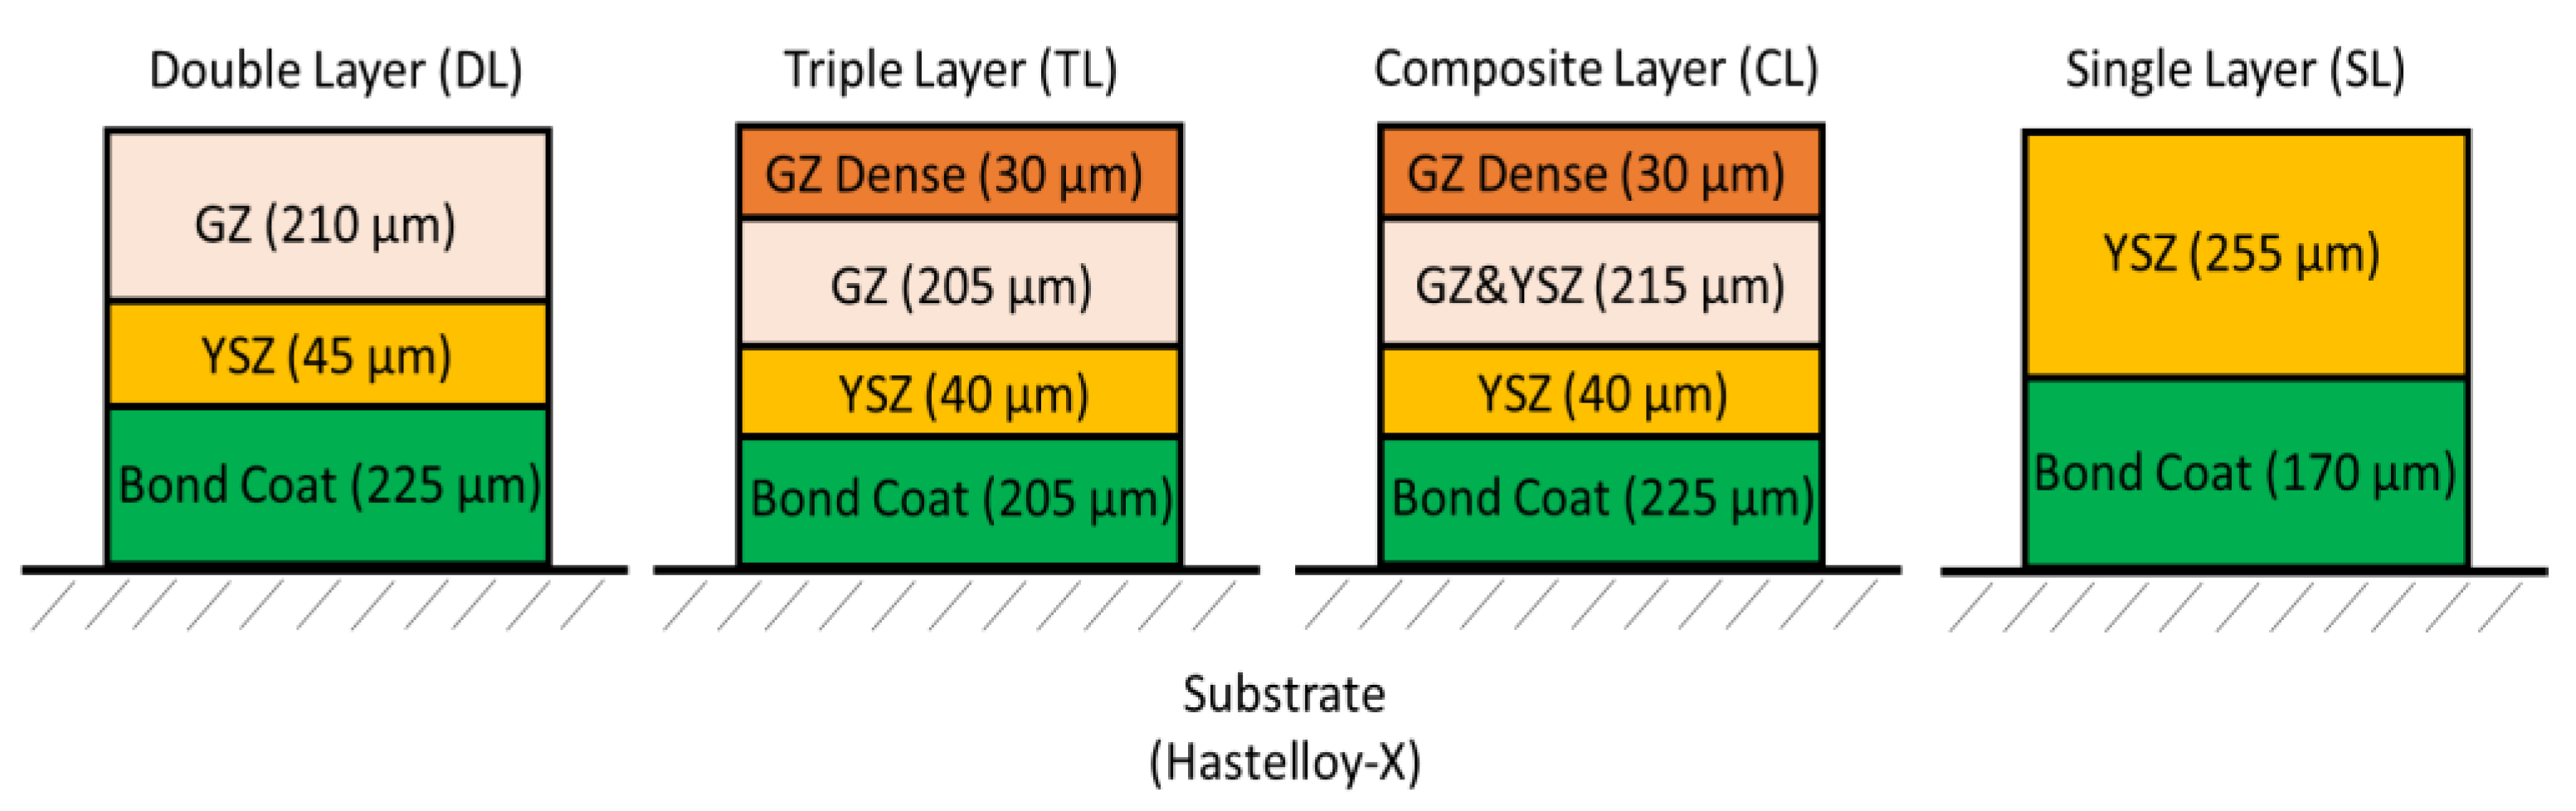
2.1. Samples Preparation
2.2. Thermal Treatment
2.3. Material Characterisation
2.3.1. Metallography
2.3.2. Microstructure
2.3.3. XRD Analysis
2.4. Mechanical Characterization
3. Results and Discussion
3.1. Microstructure
3.2. XRD Analysis
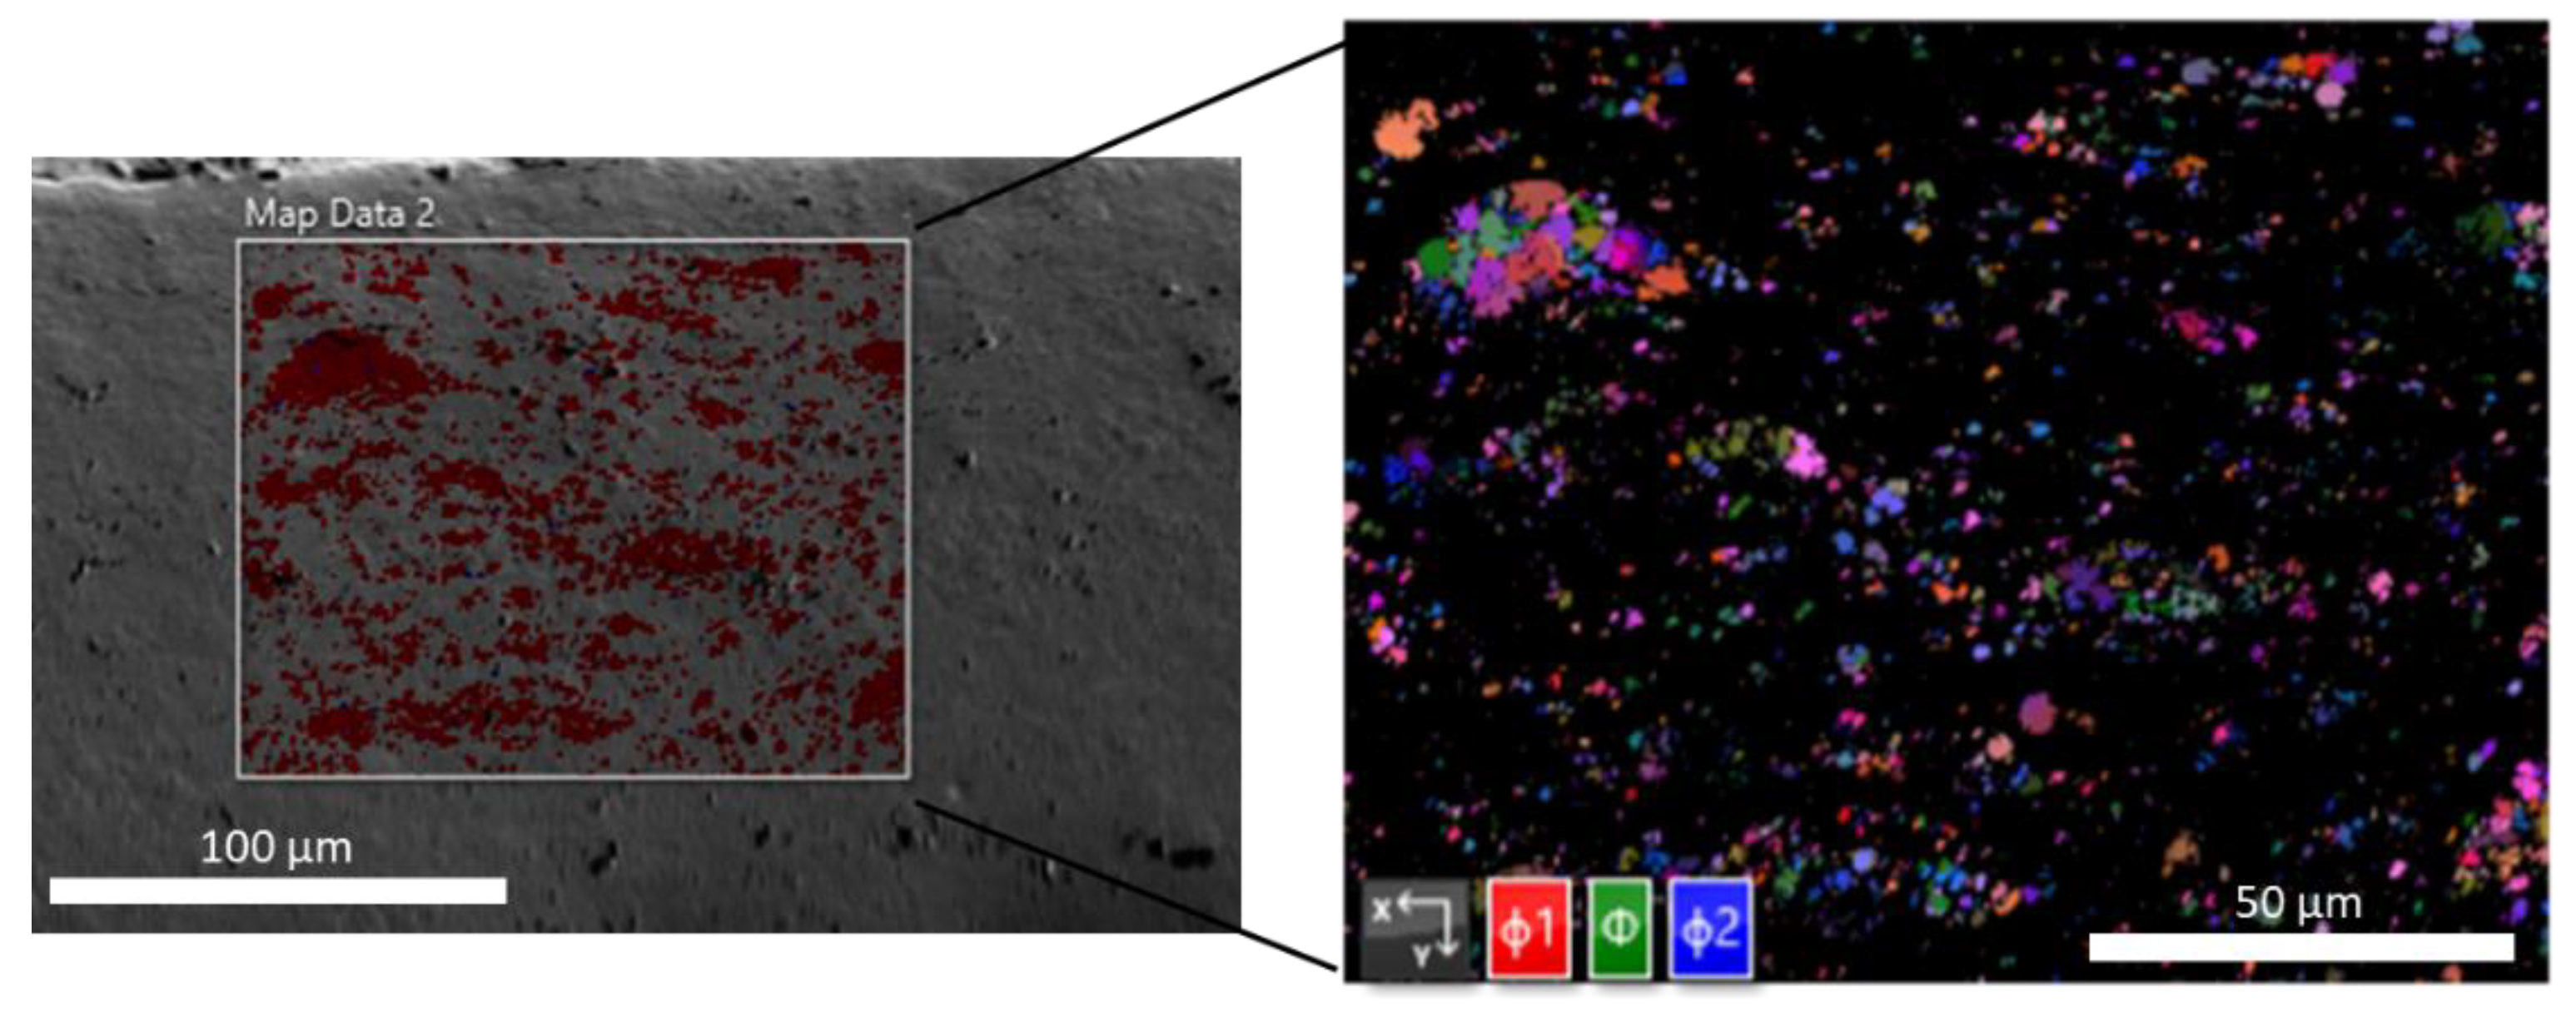
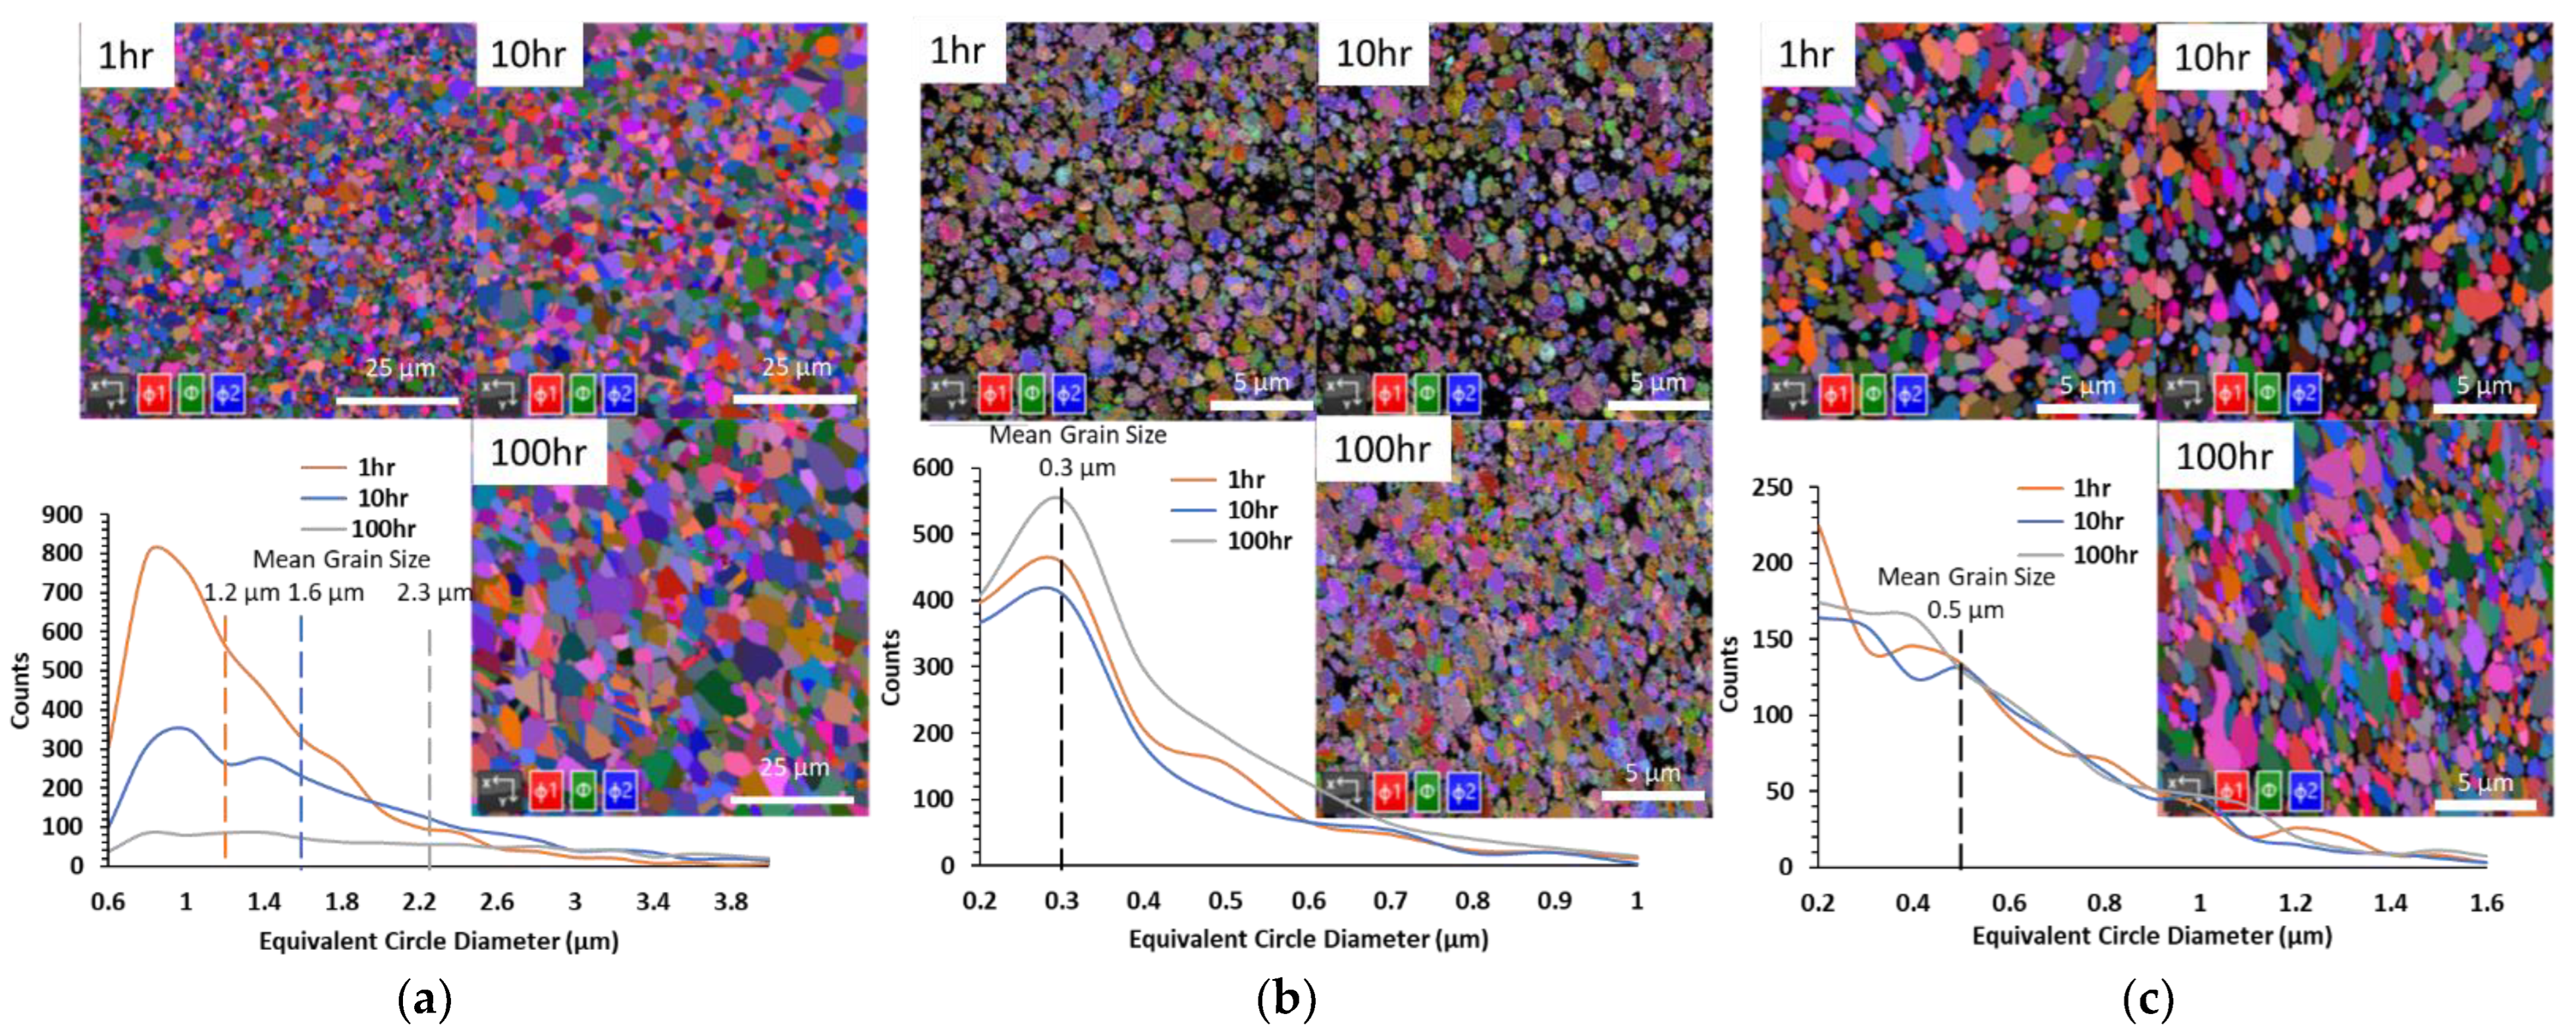
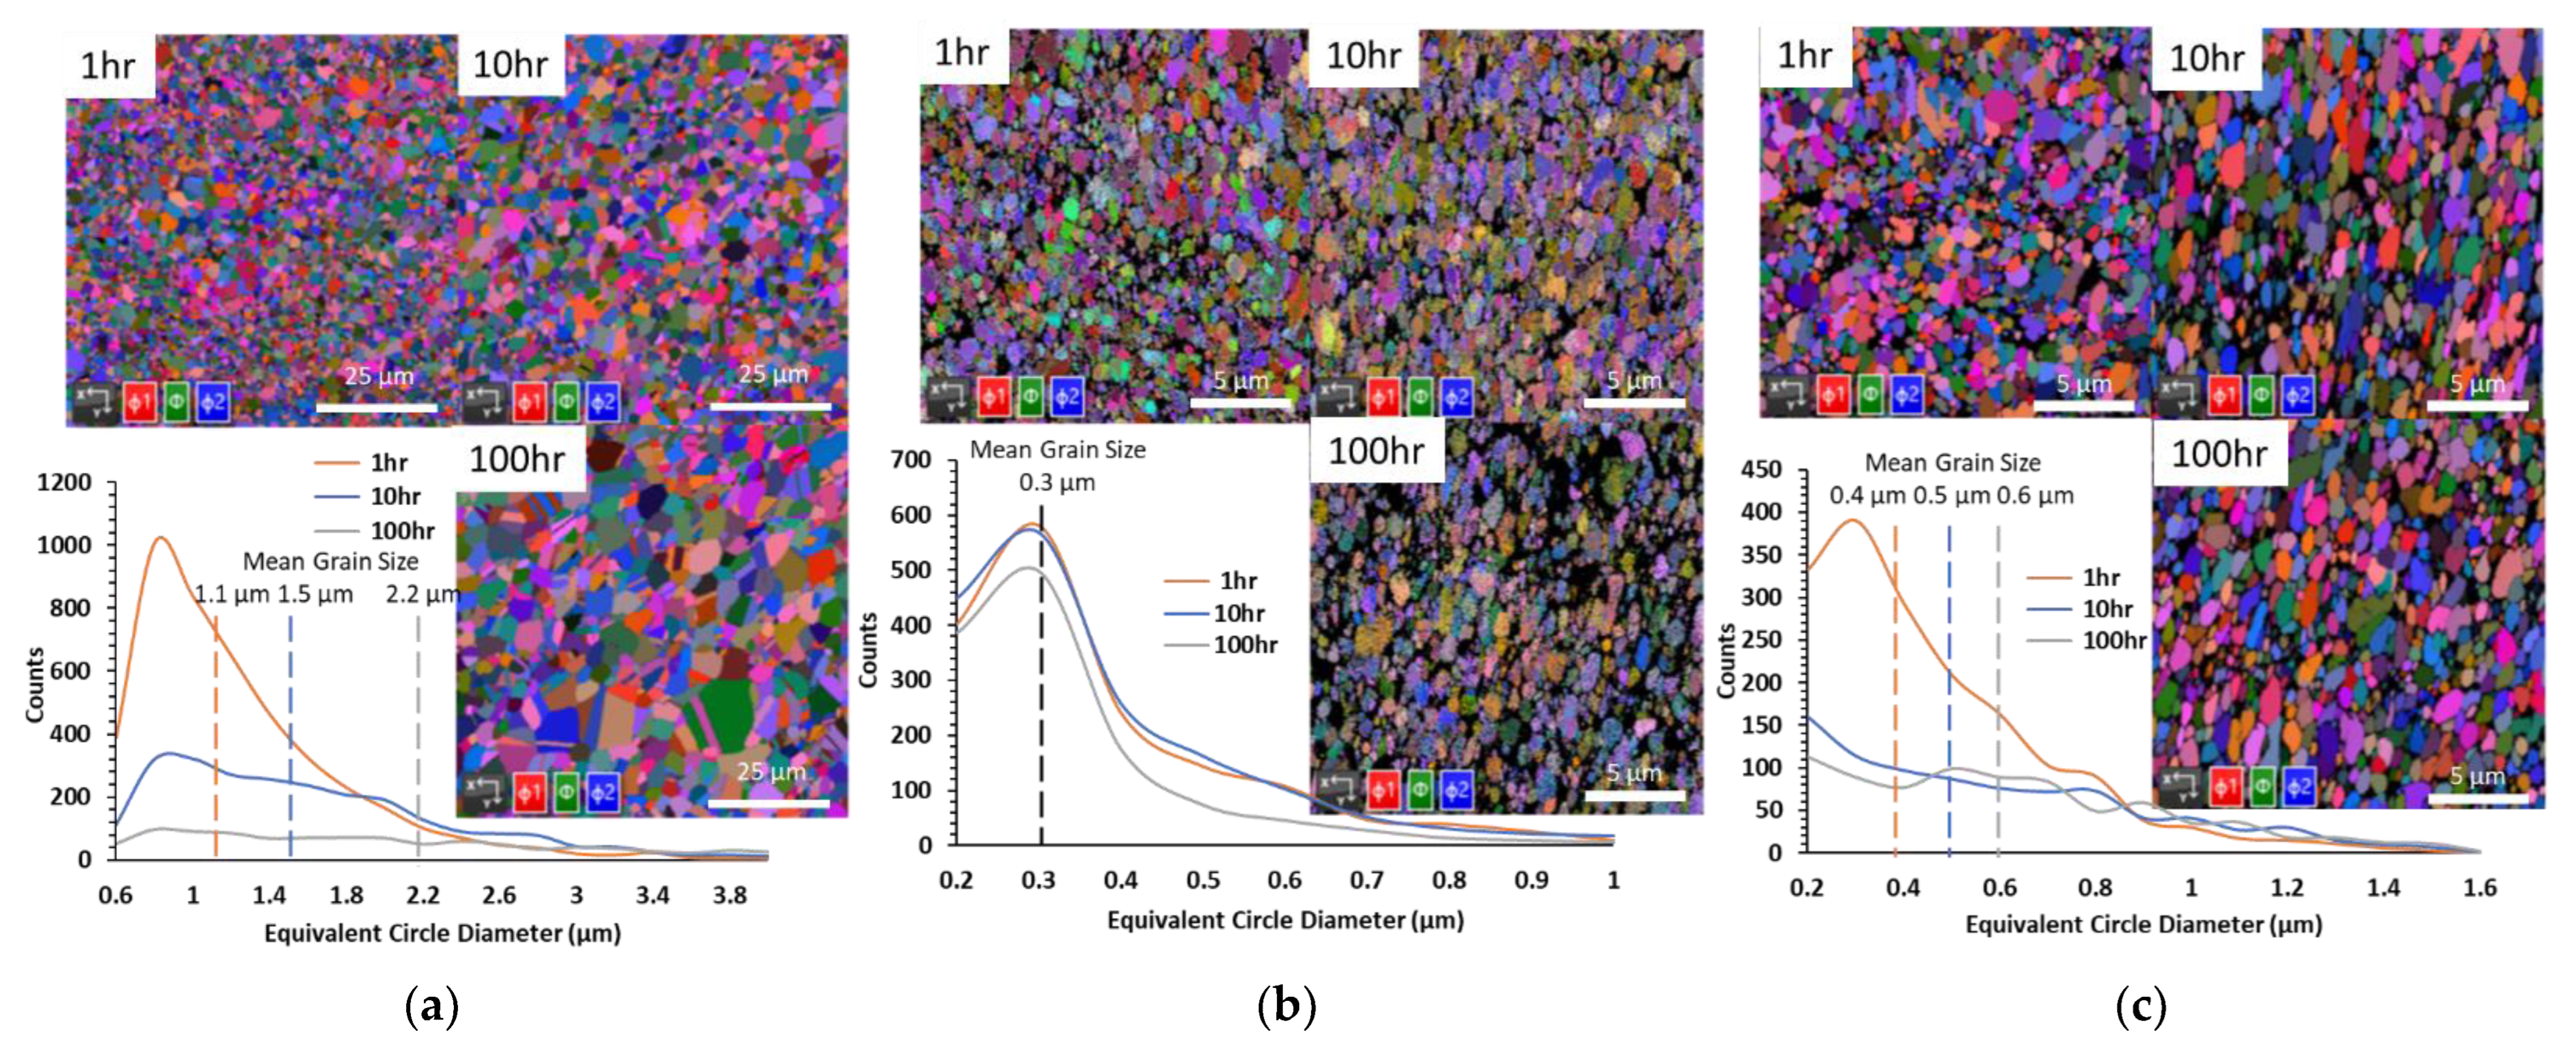
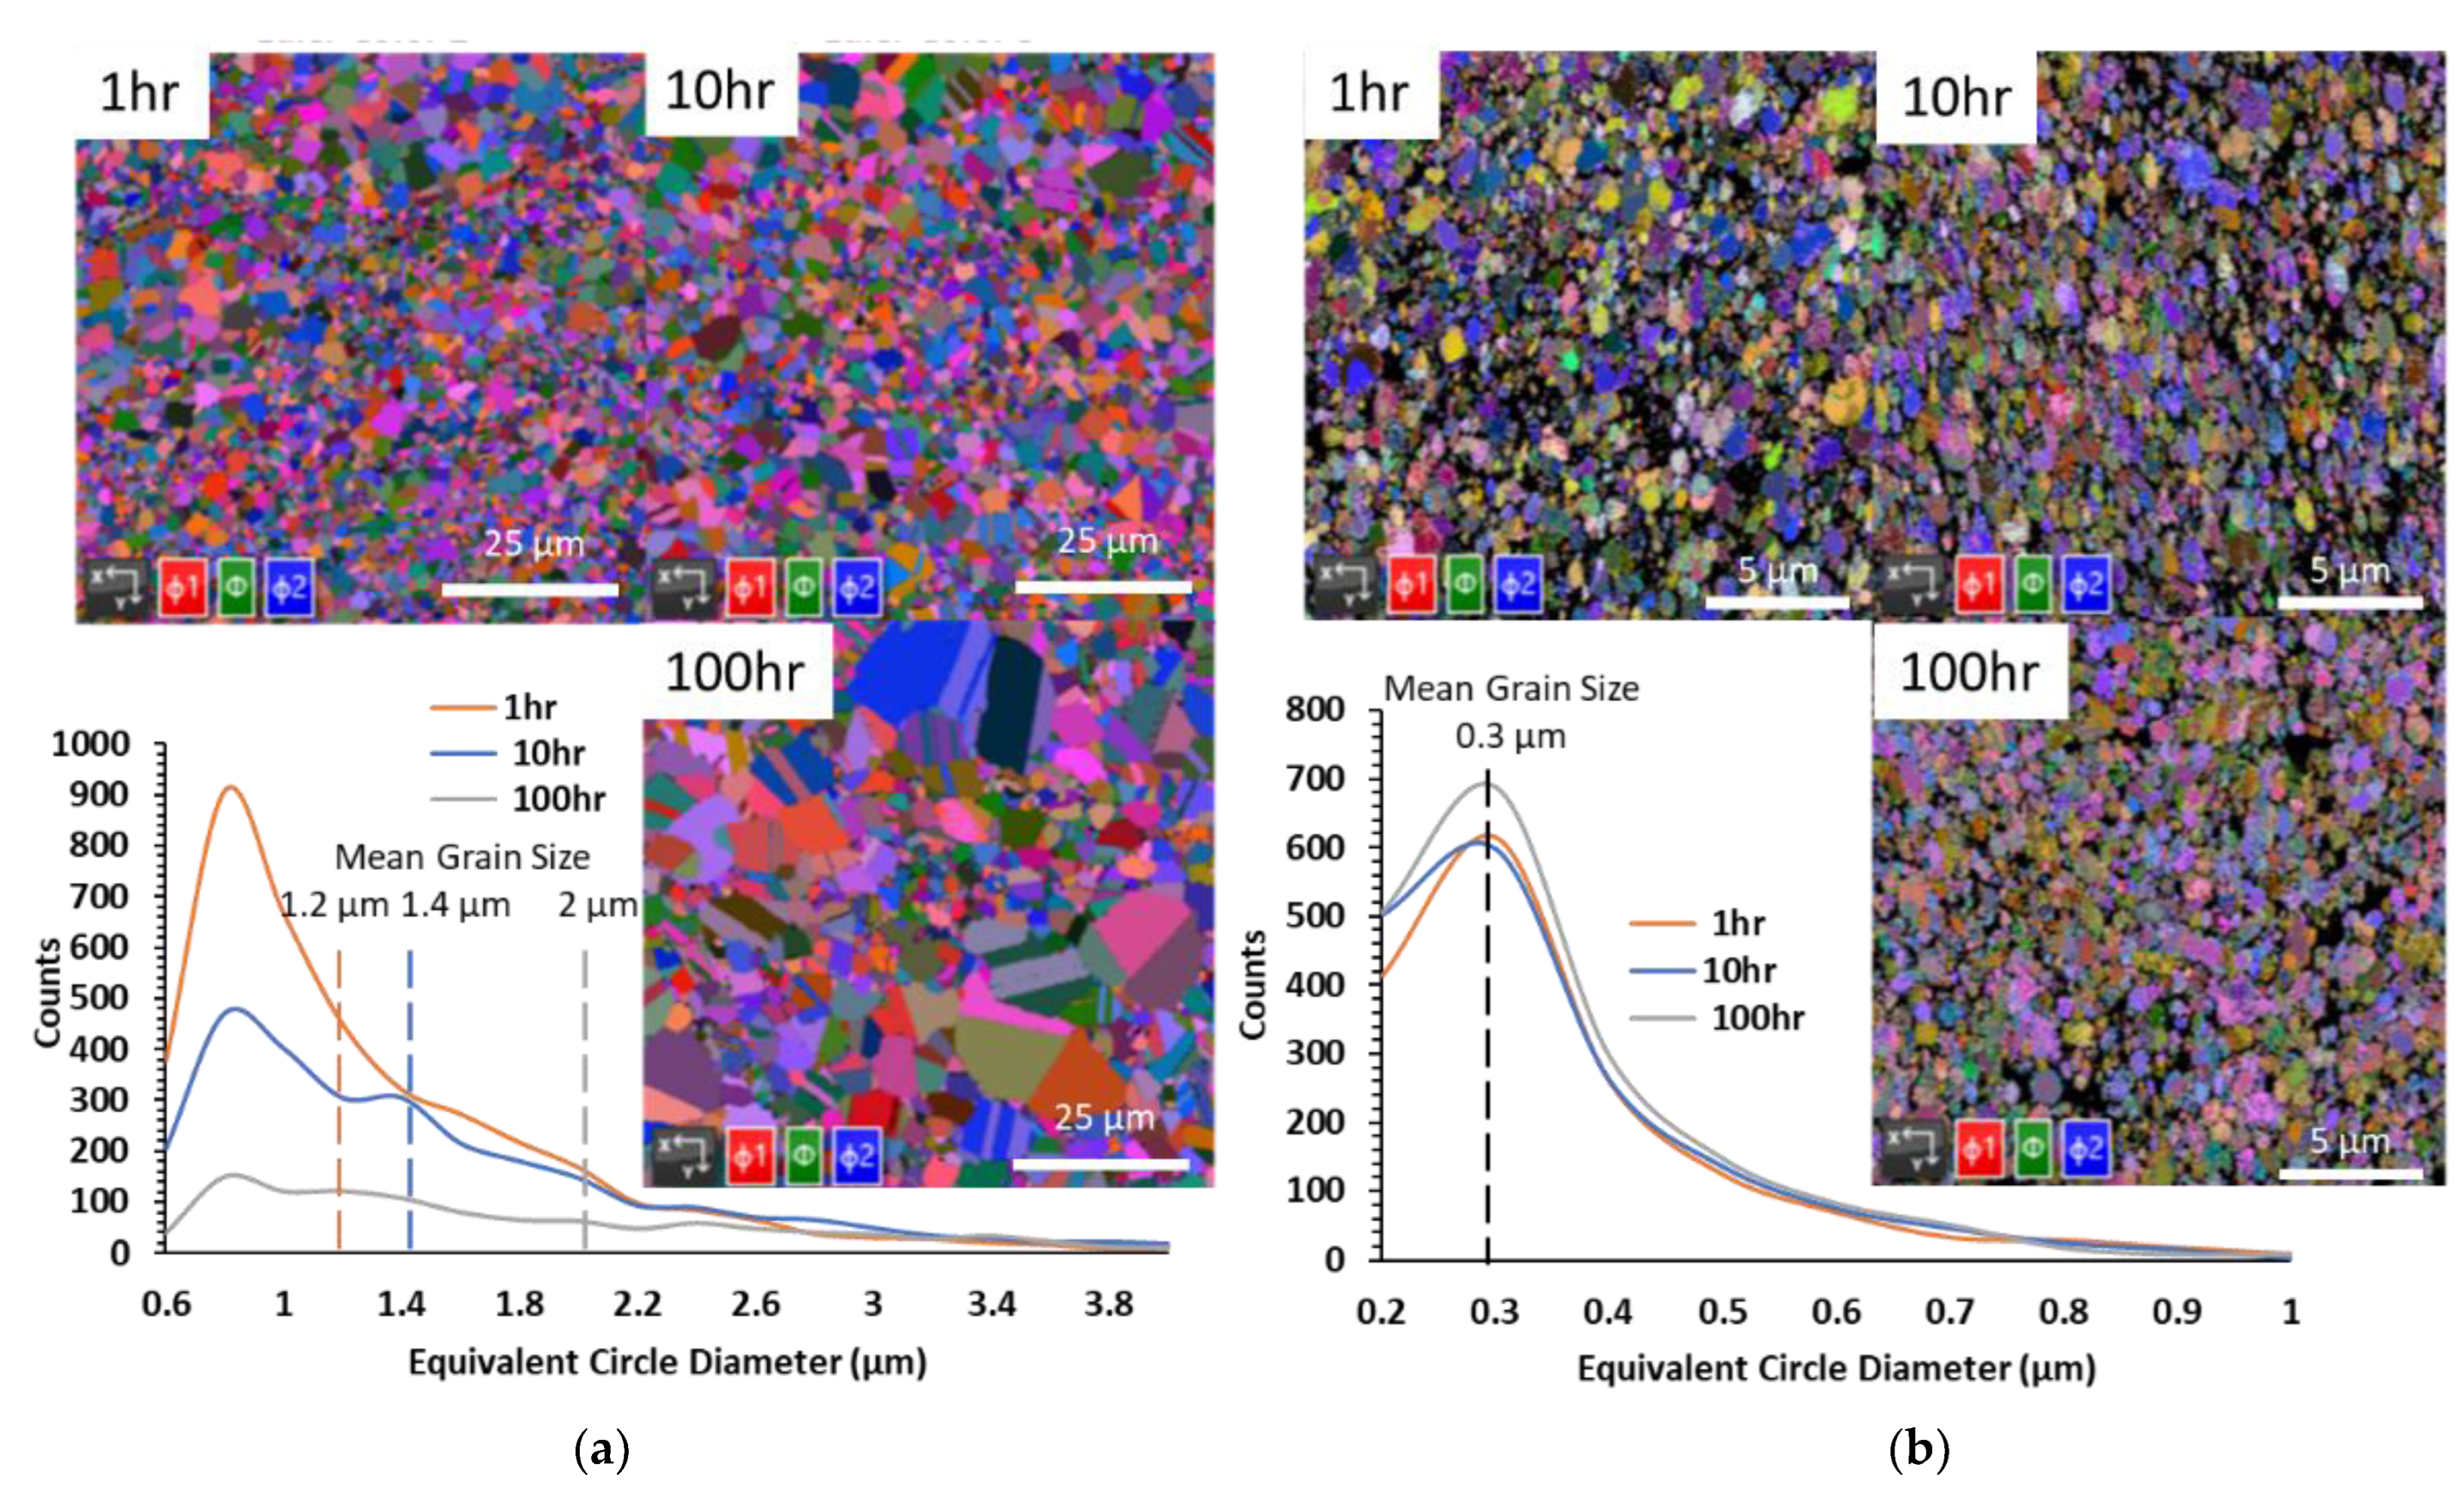
3.3. EBSD Analysis
3.4. Evaluation of Mechanical Properties
4. Conclusions
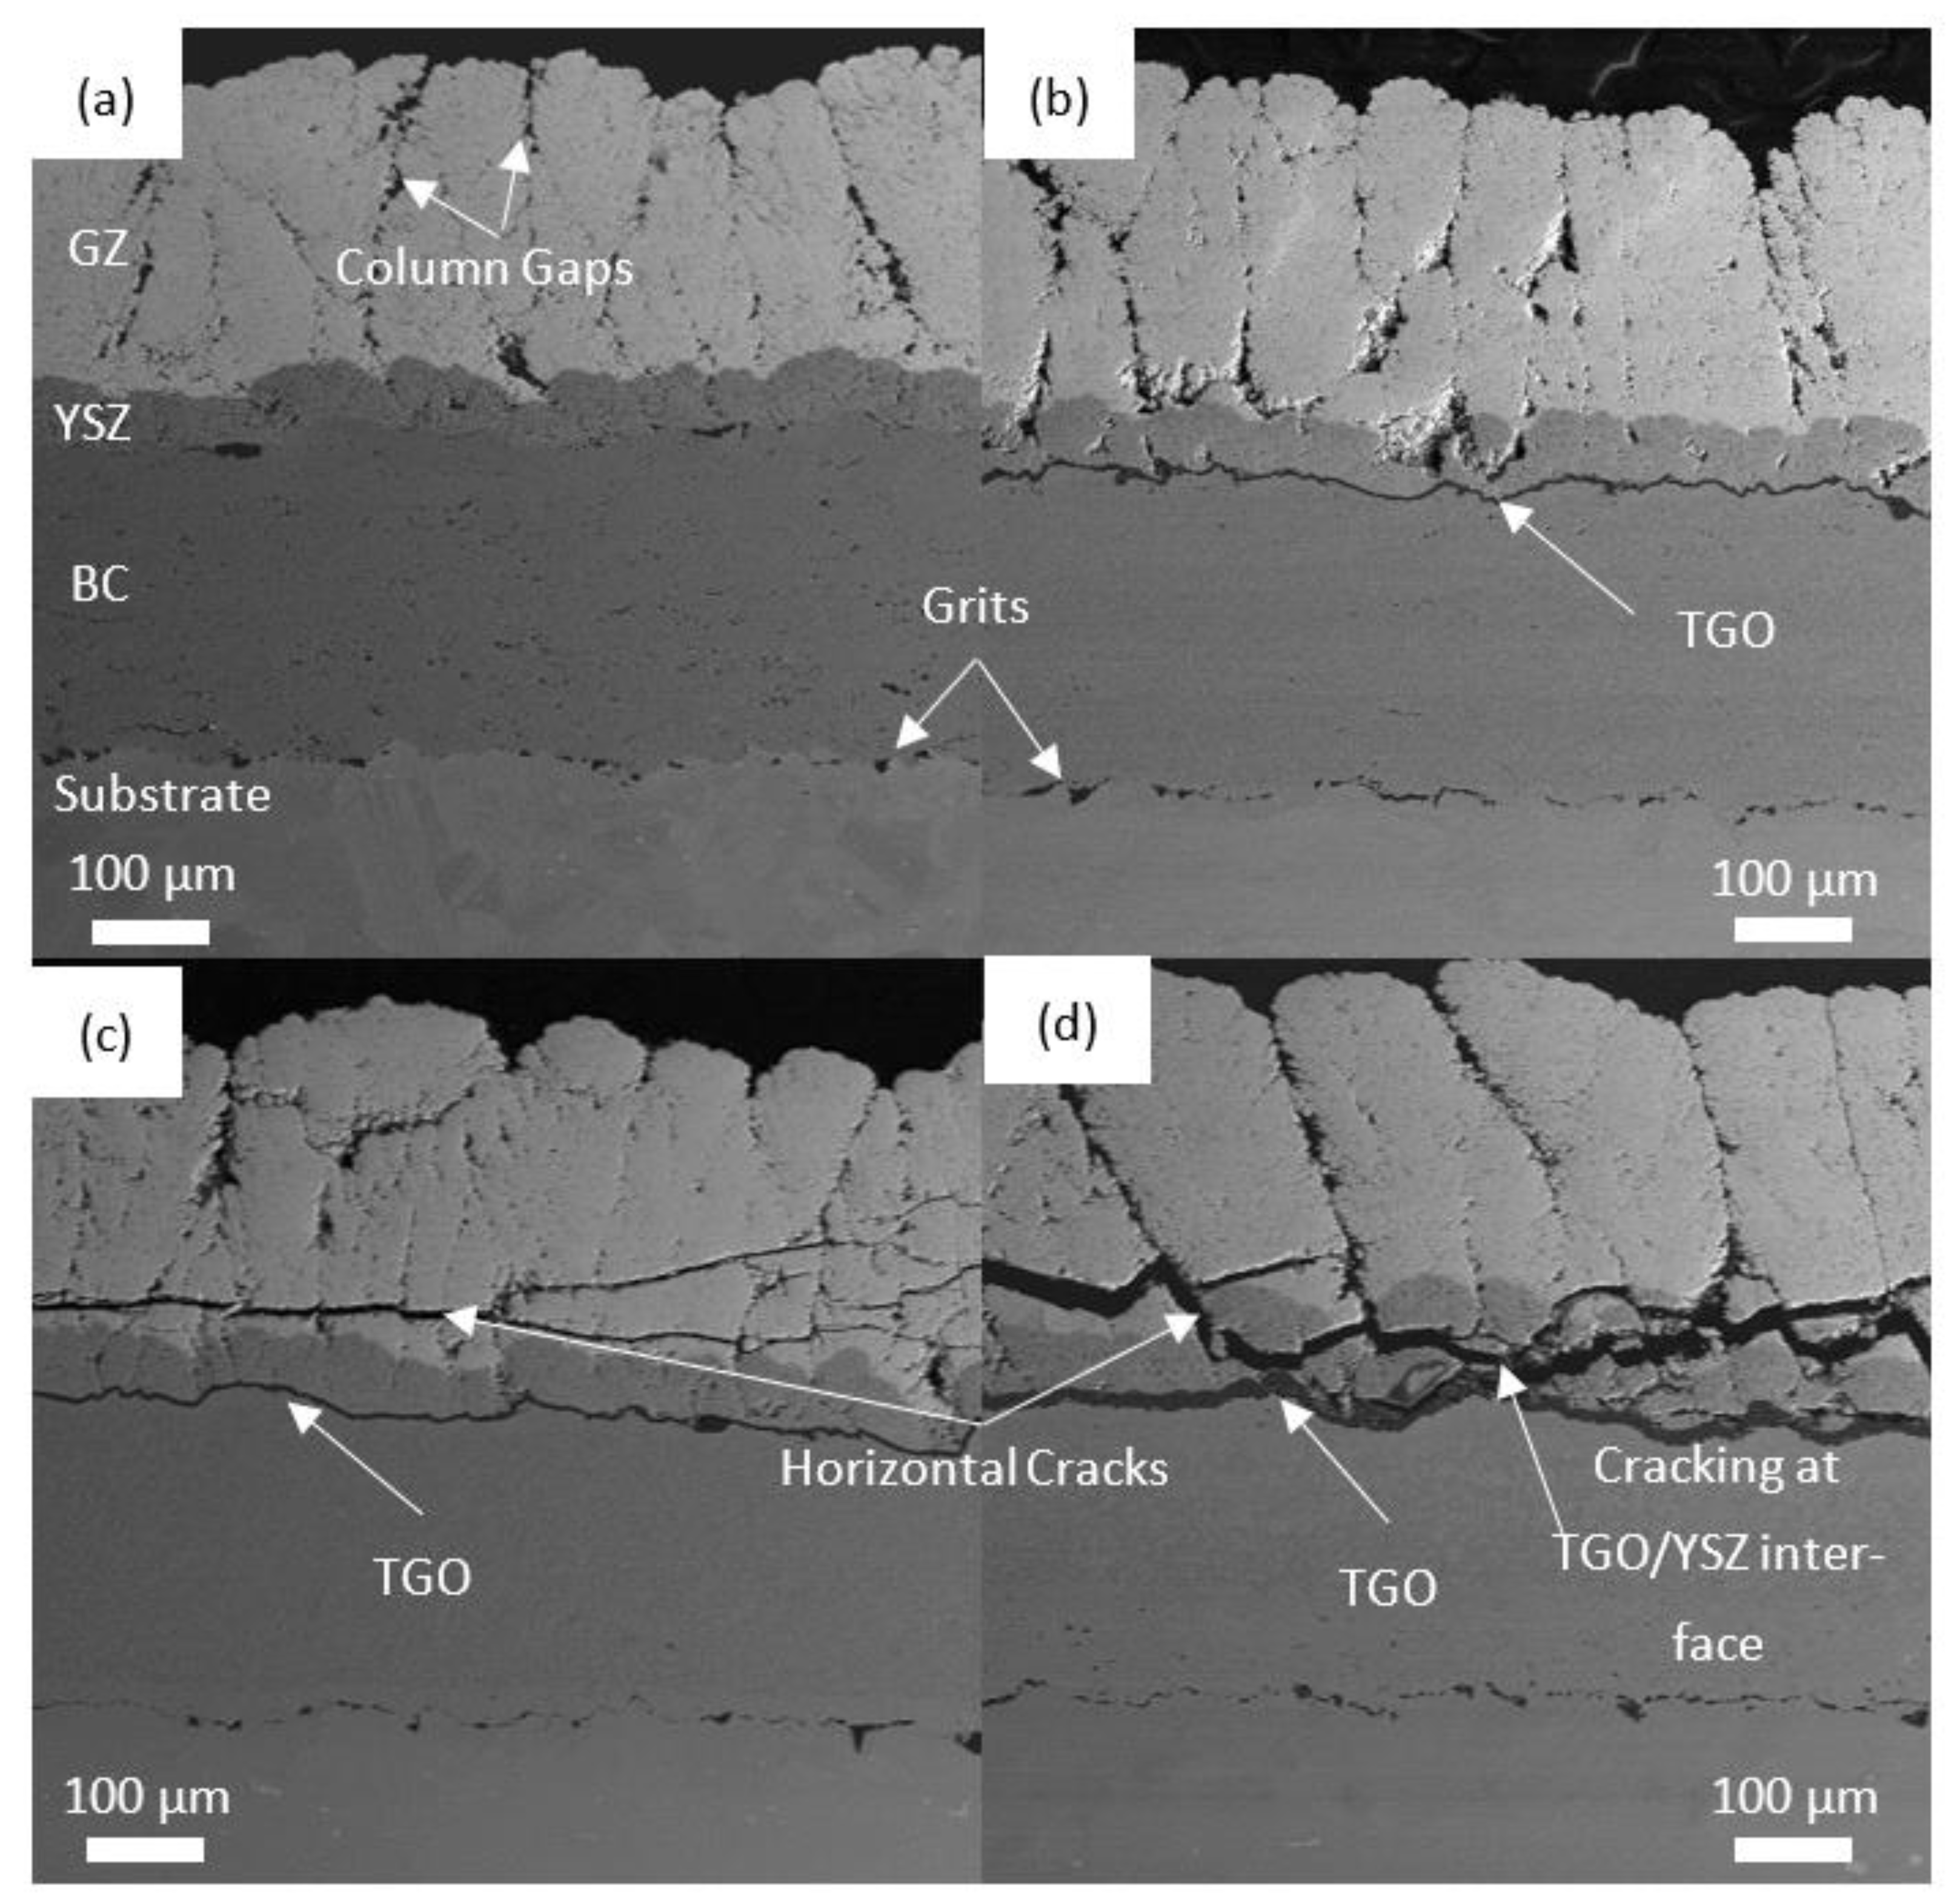
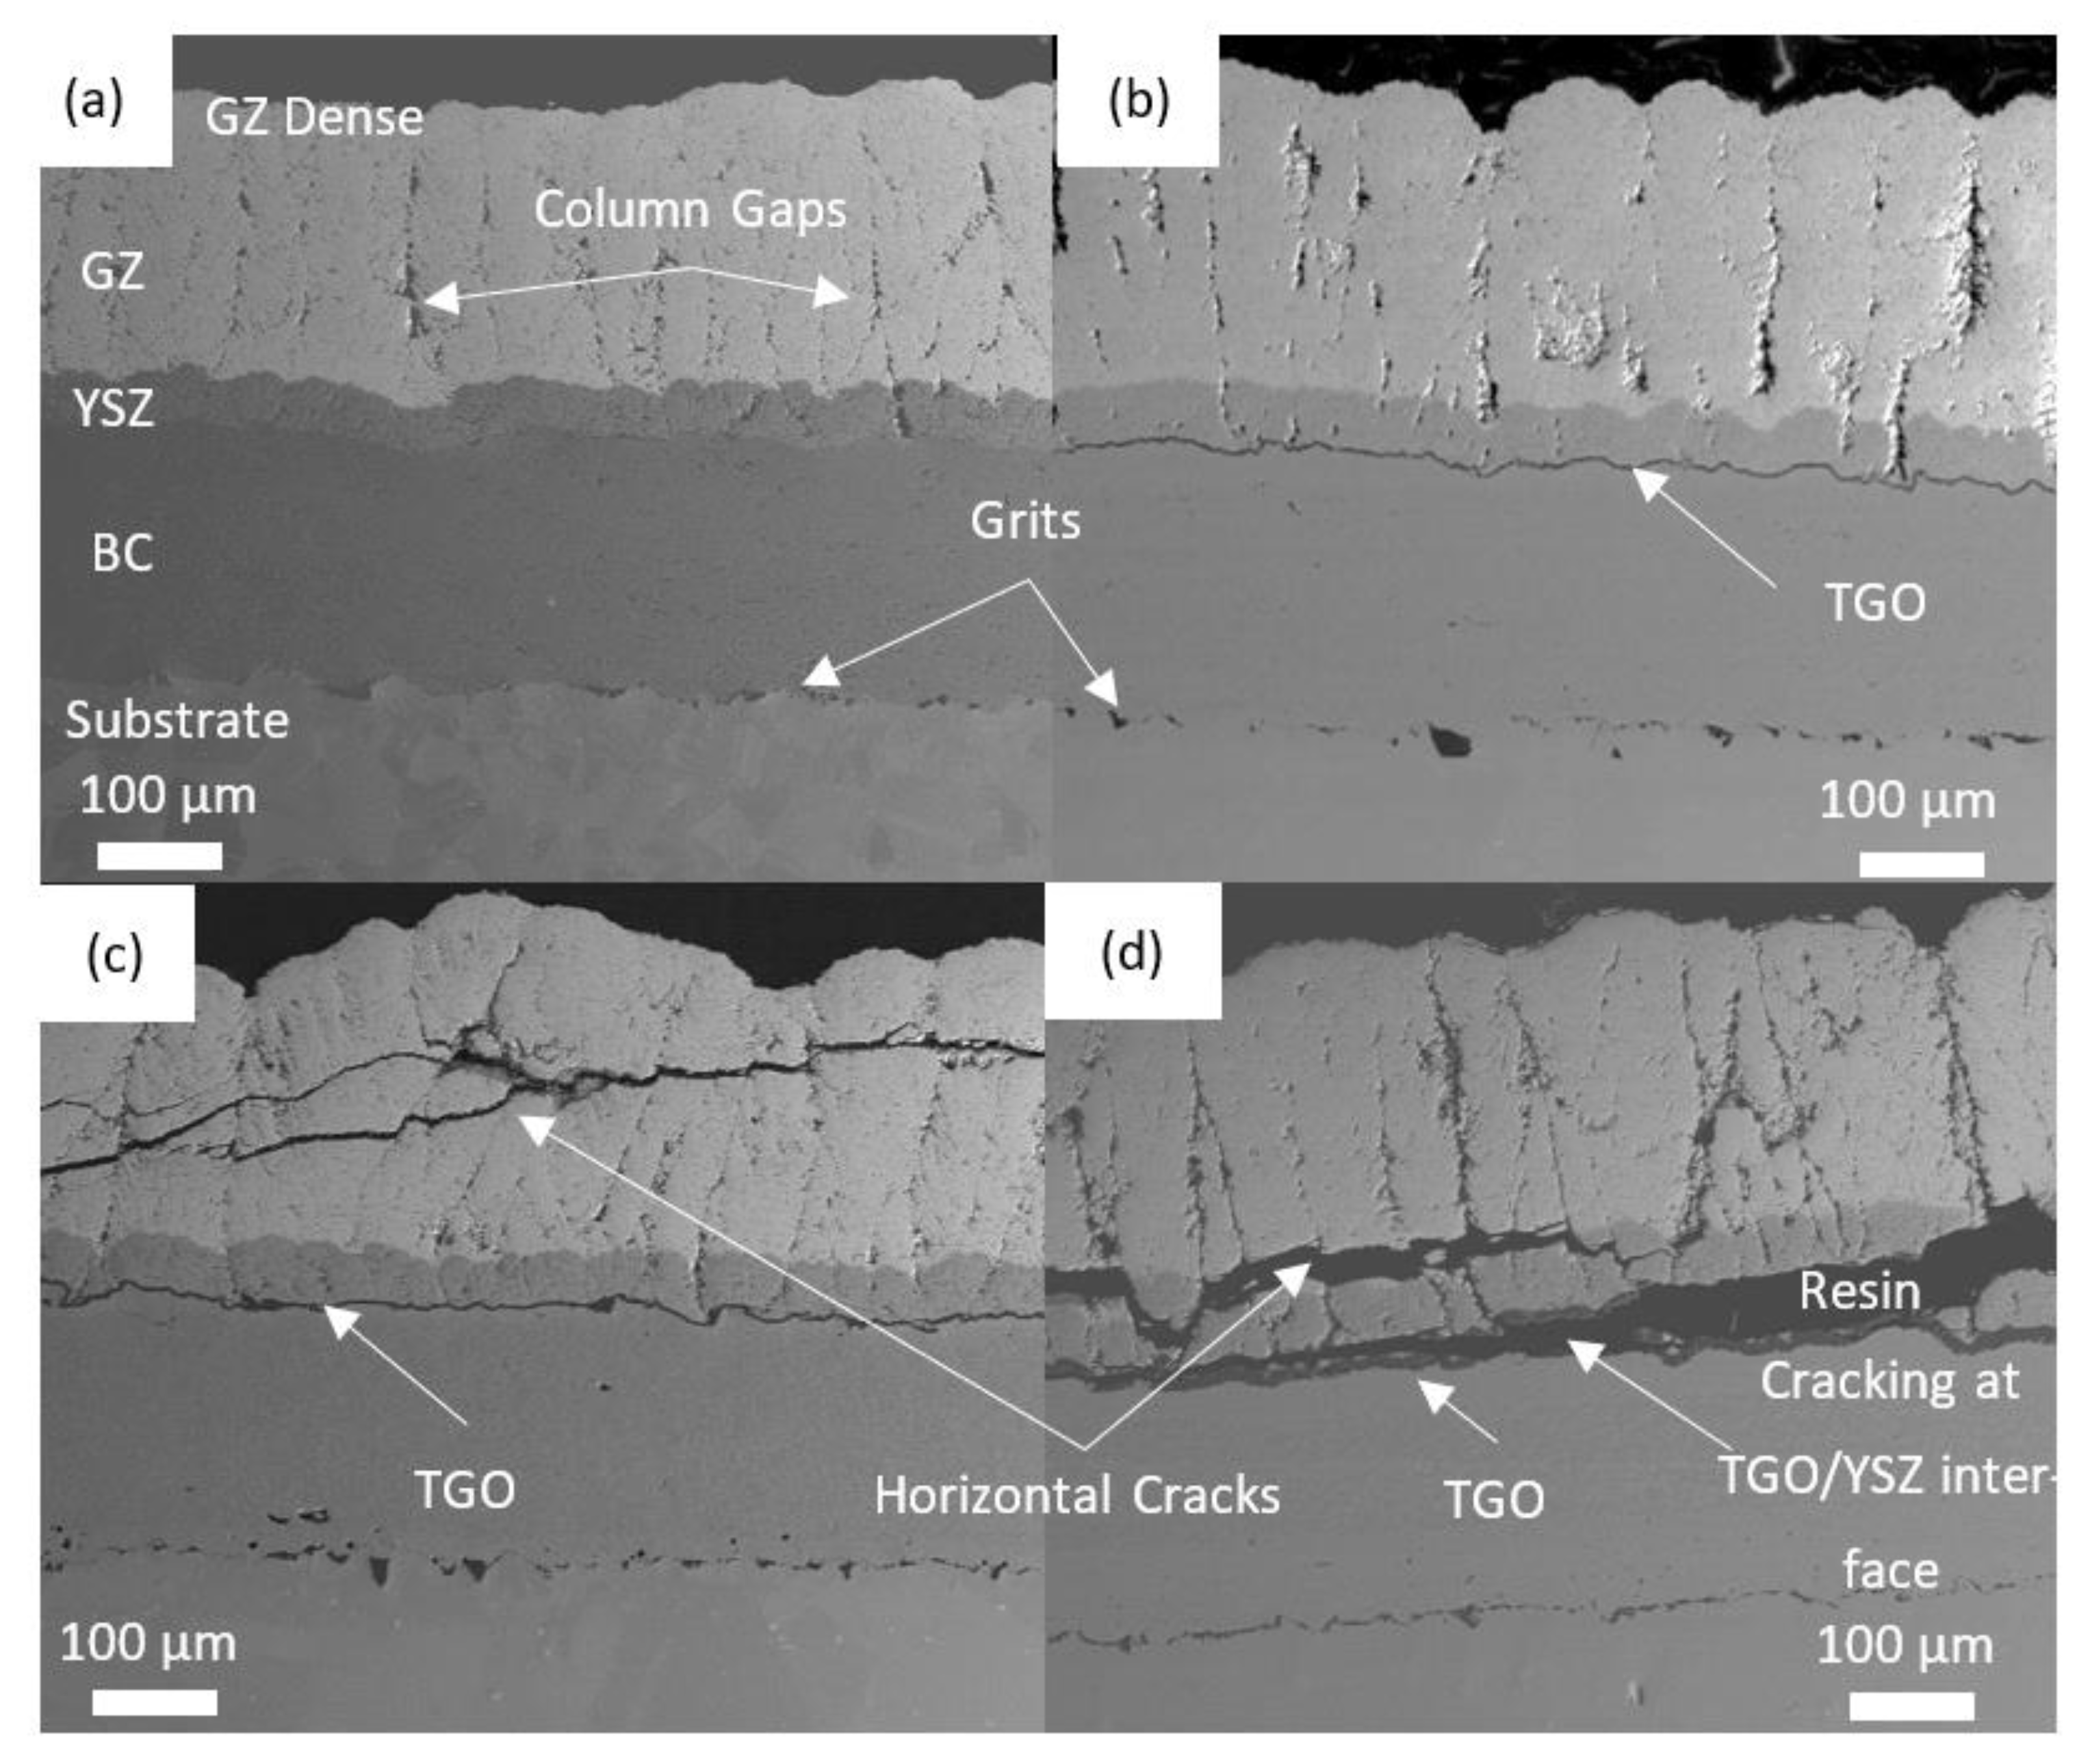
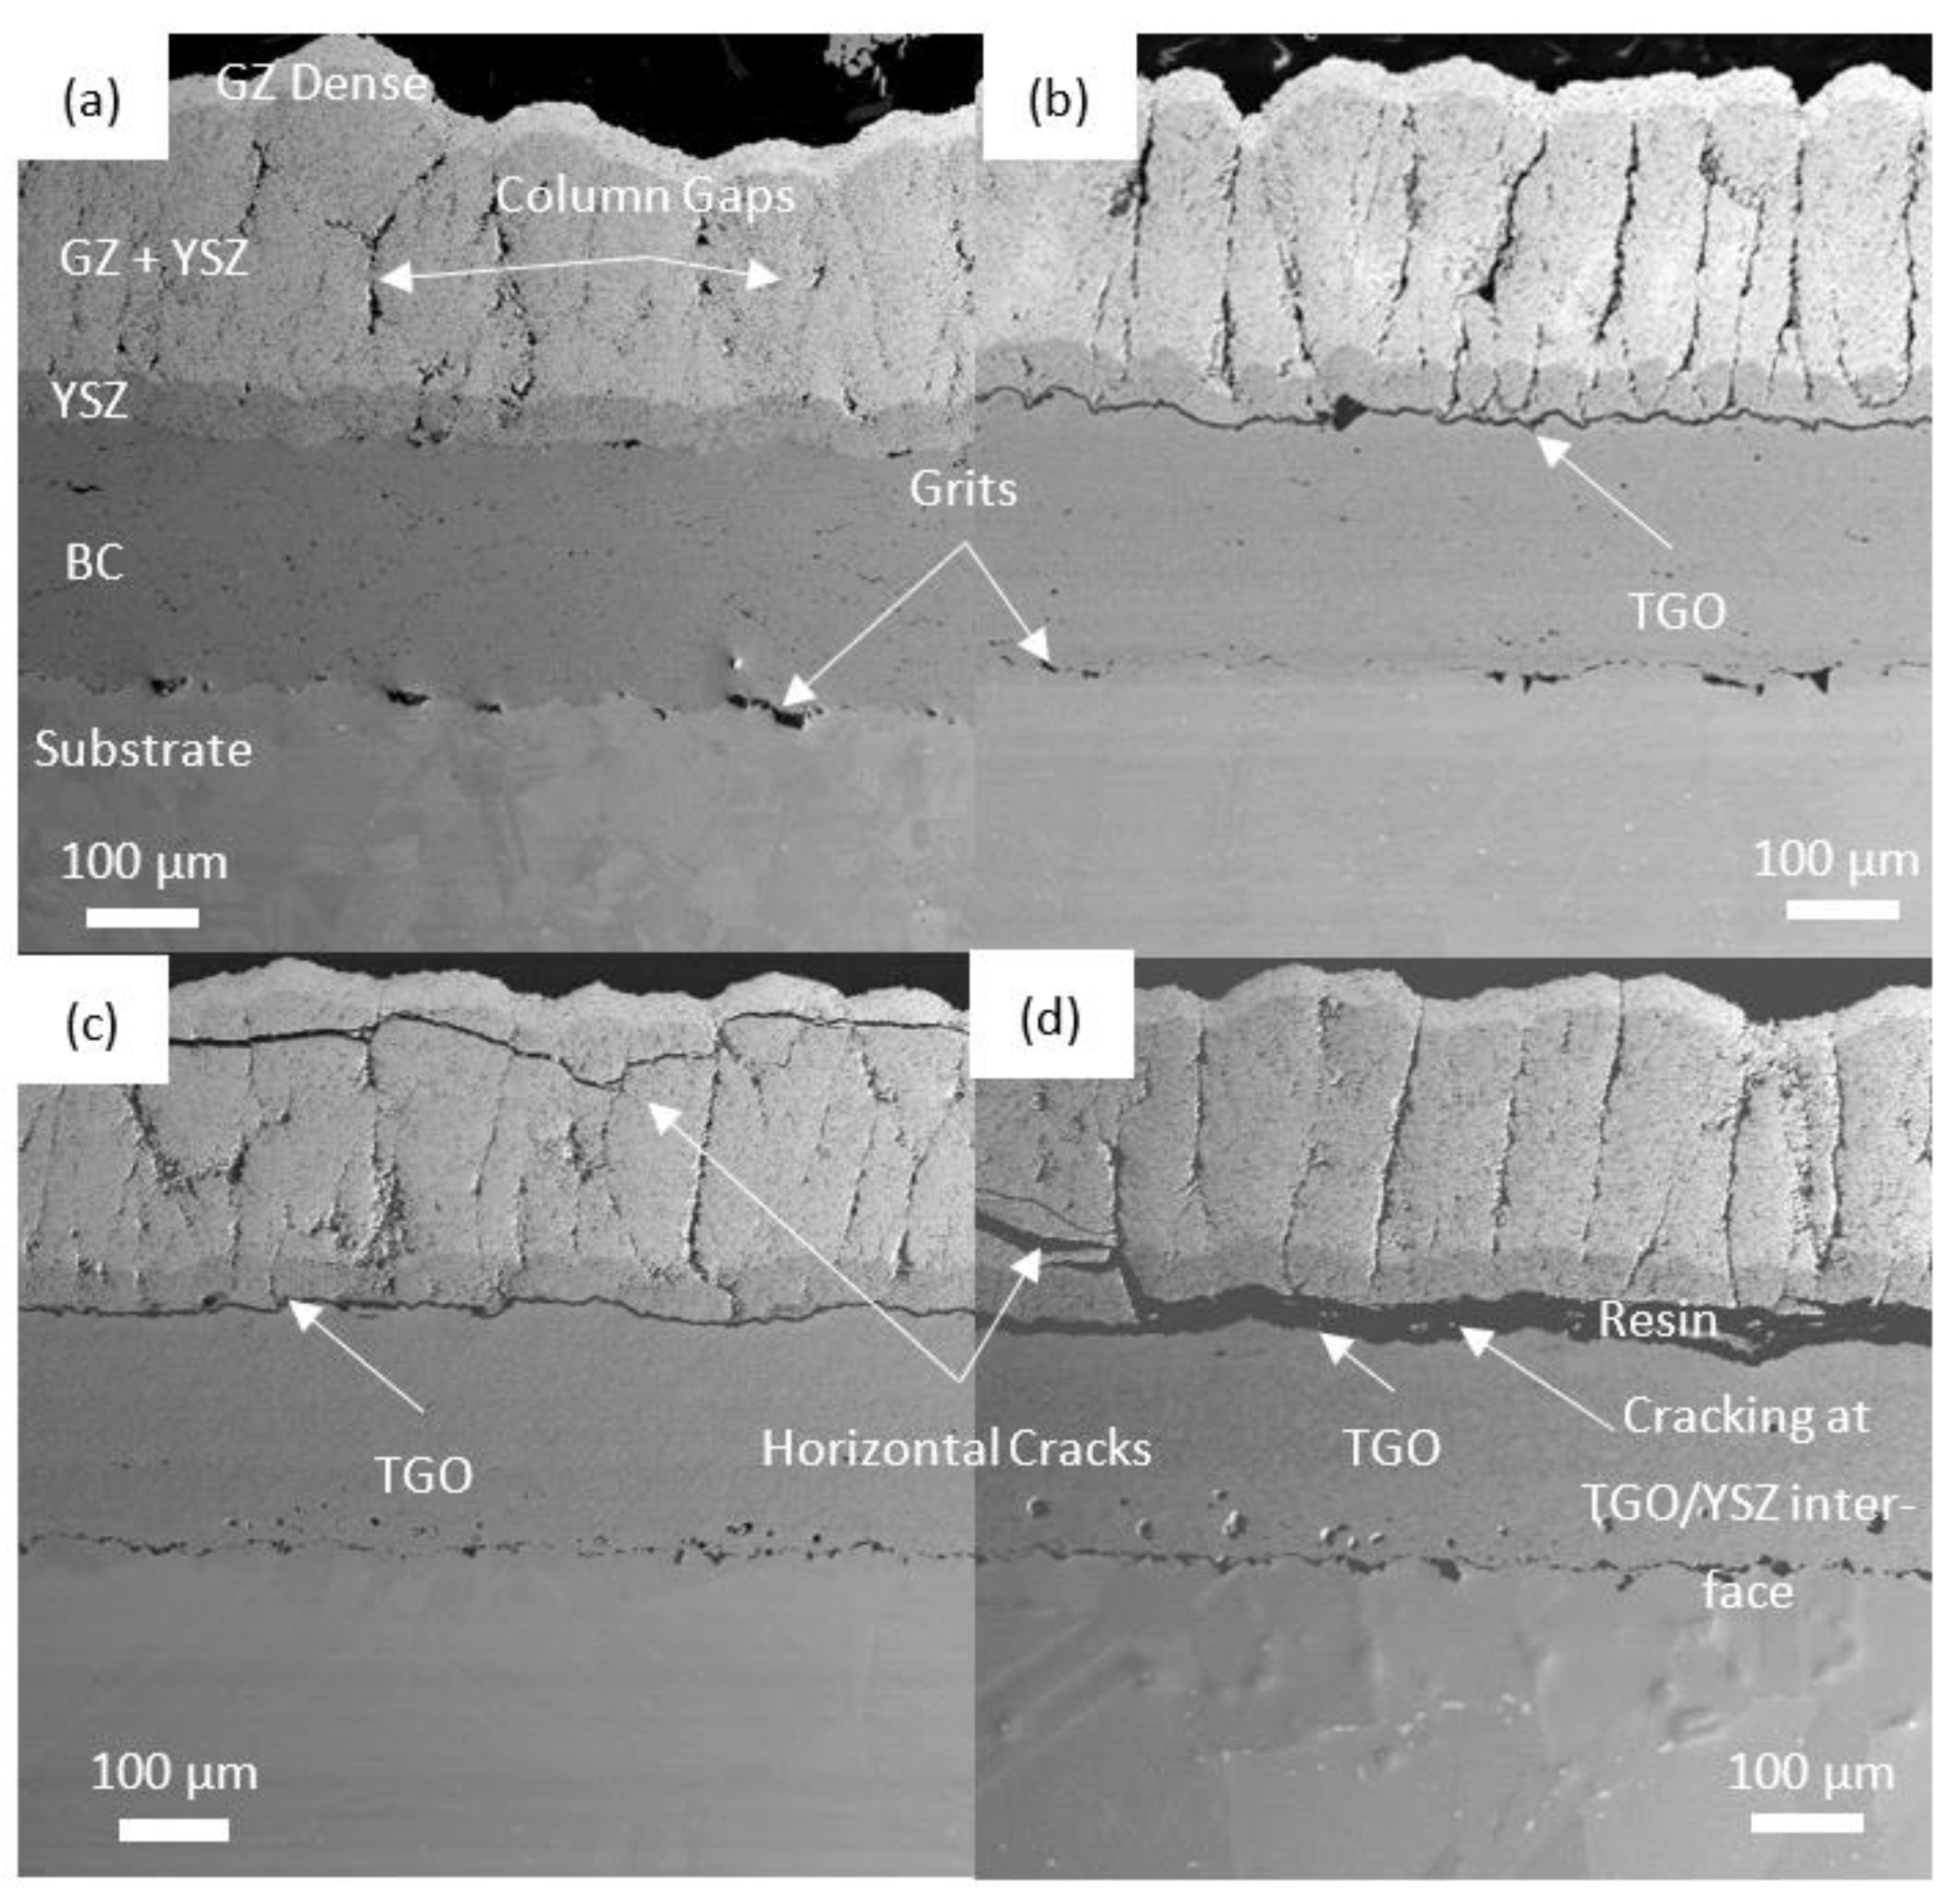
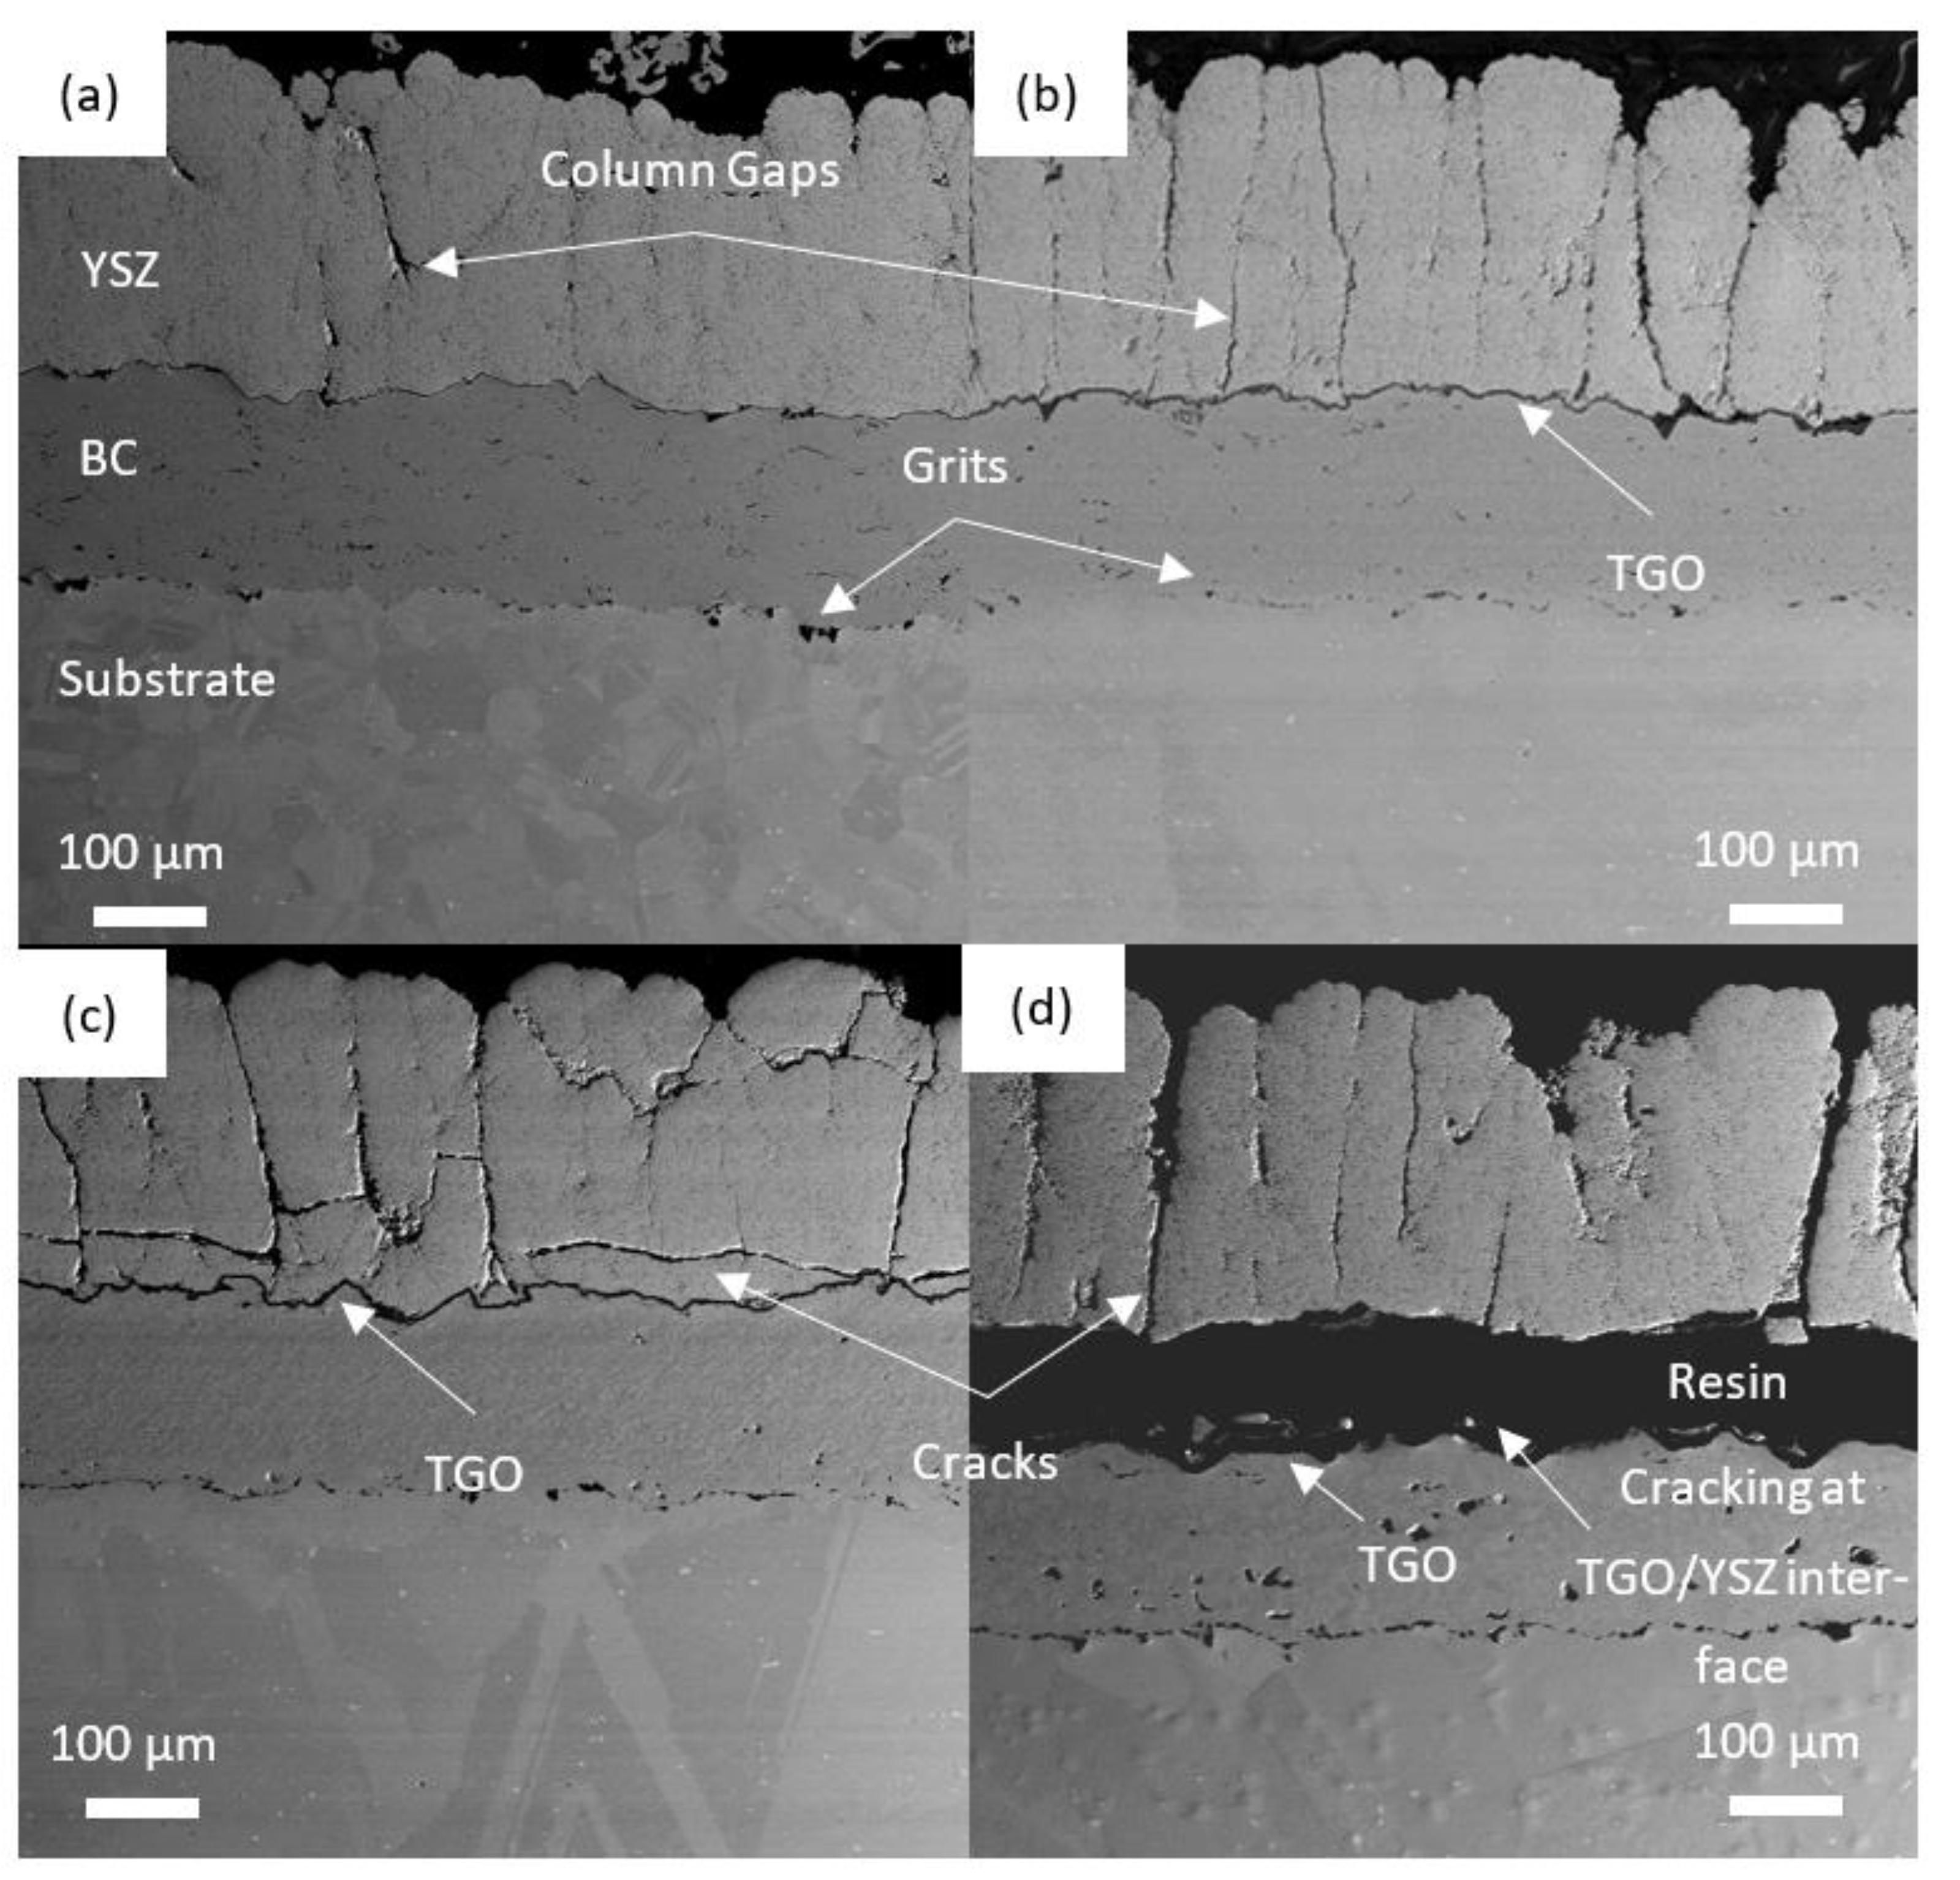
- Different cracking behaviors were detected for the 10 h and 100 h treatment conditions (horizontal cracks within ceramic layer and at TGO/YSZ interface, respectively). These cracking types can be attributed to thermal residual stresses developed within coatings due to thermal expansion mismatch and TGO thickness increase beyond critical value, accordingly.
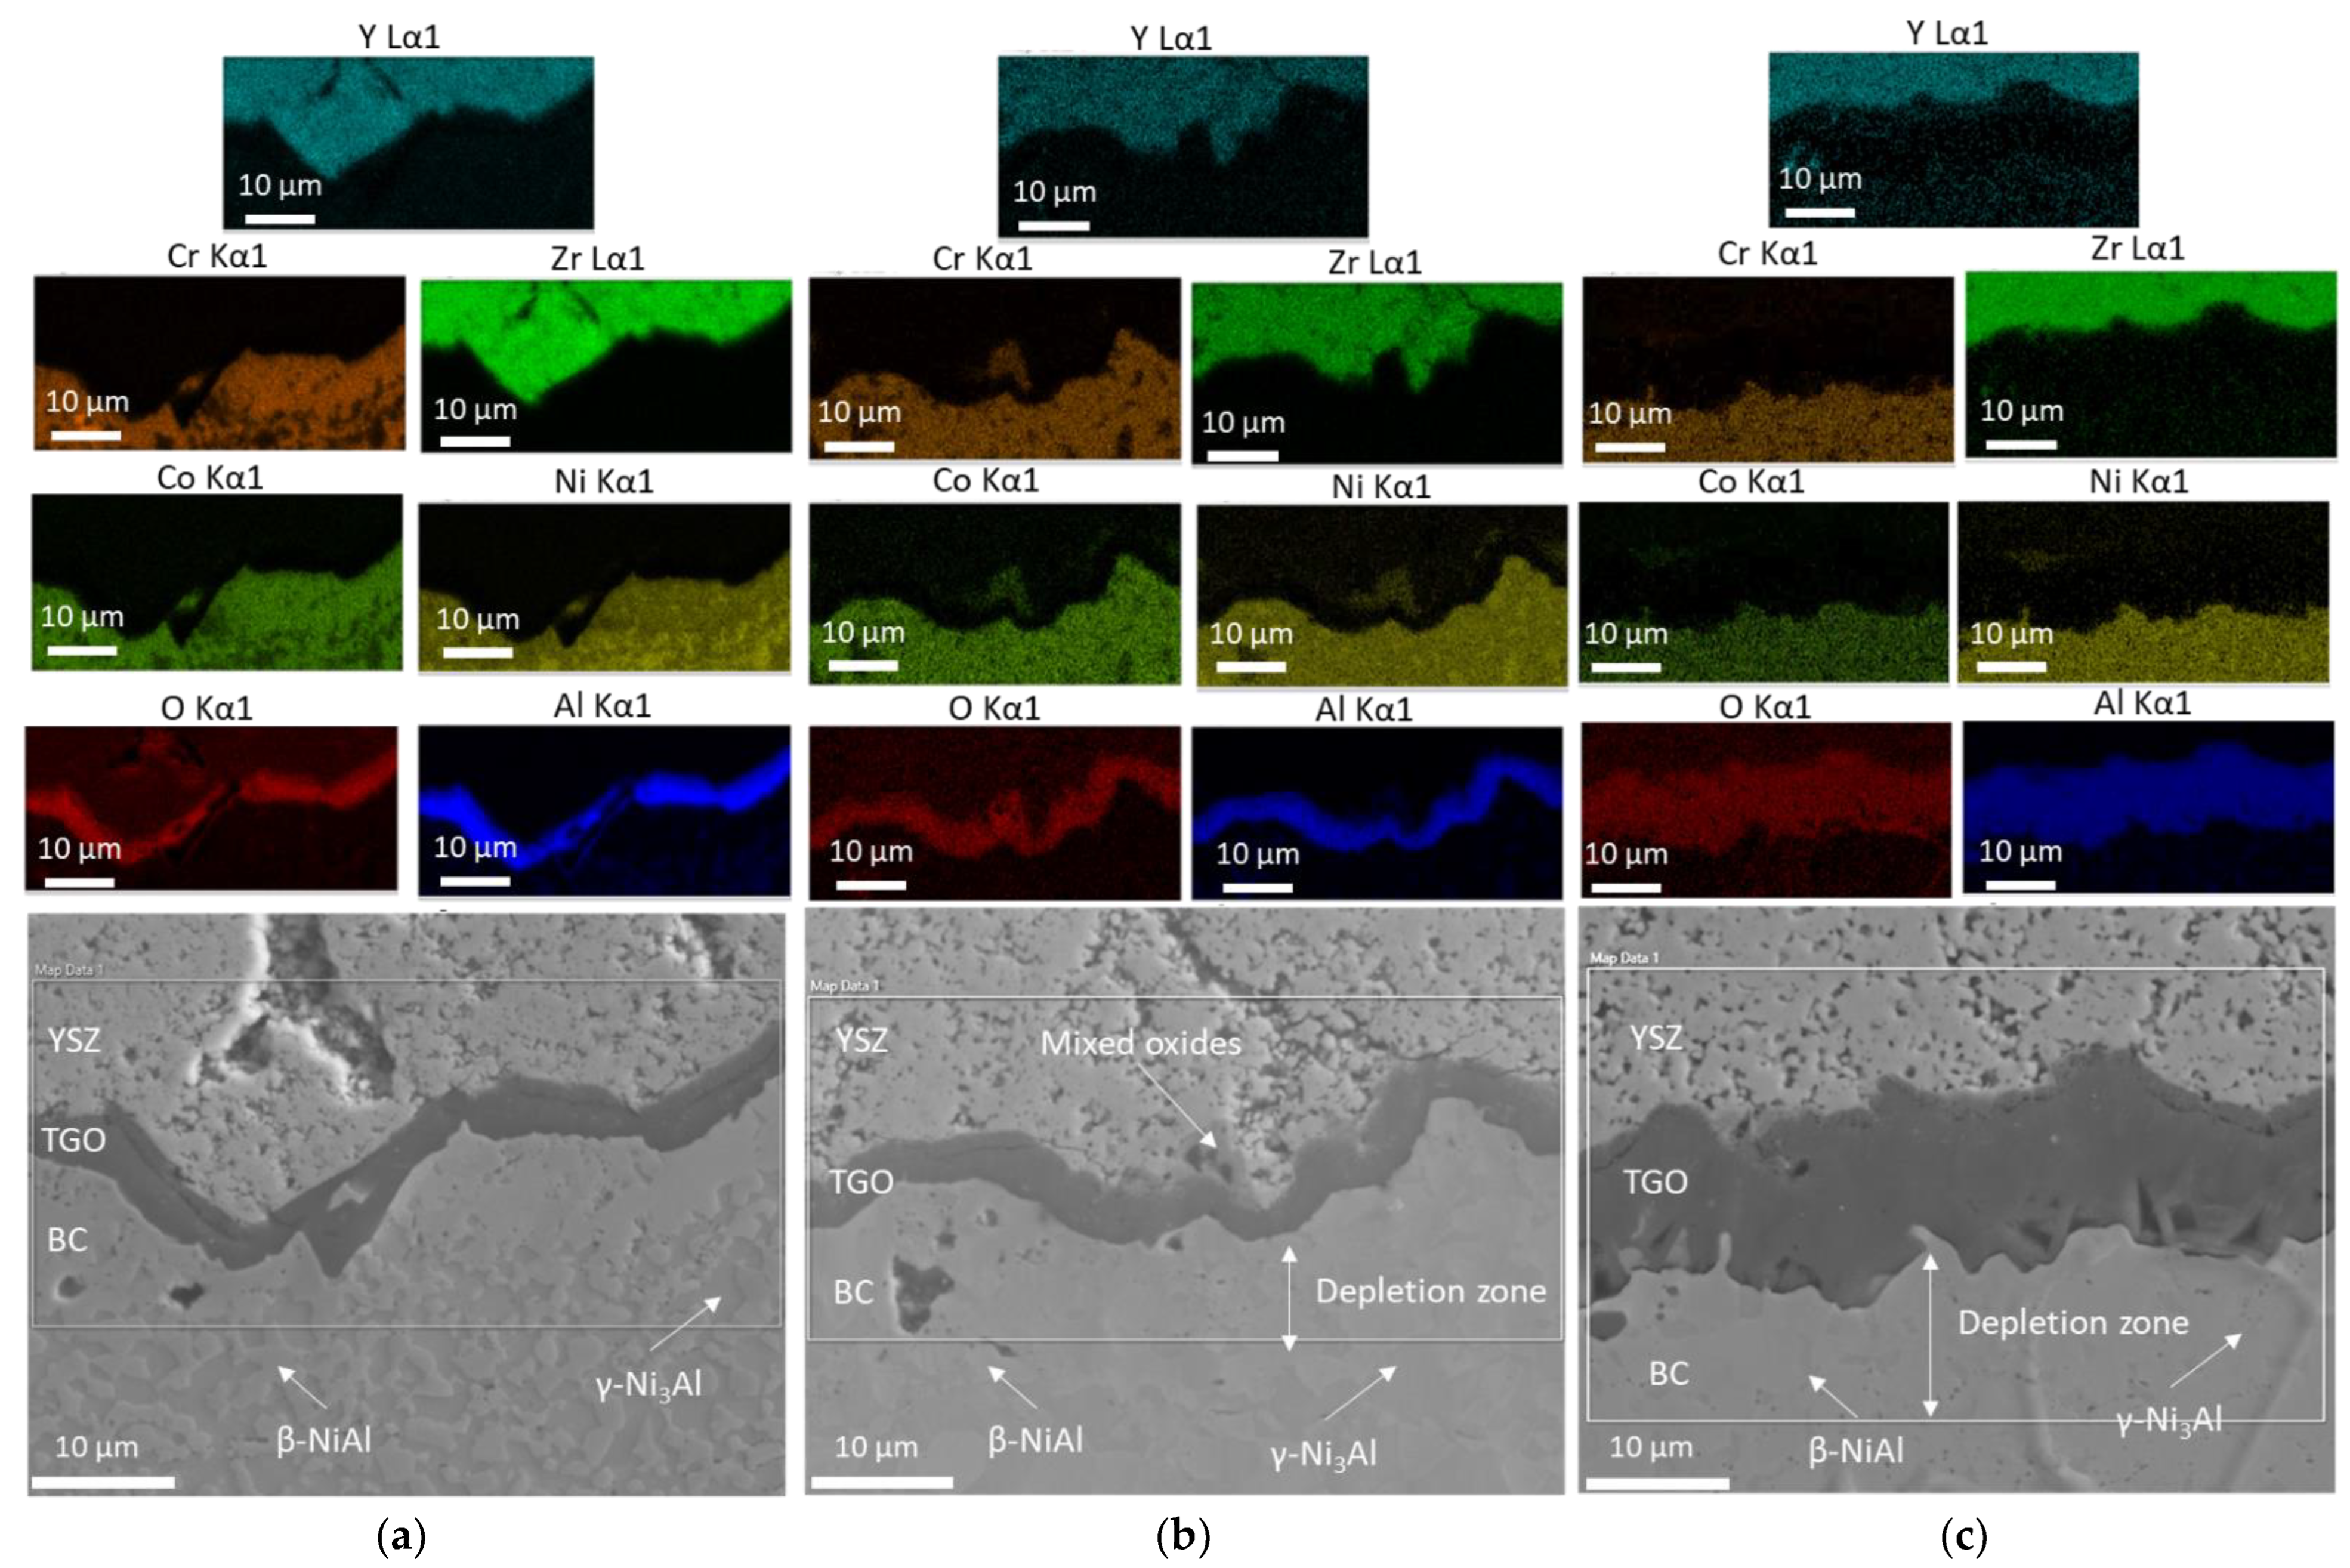
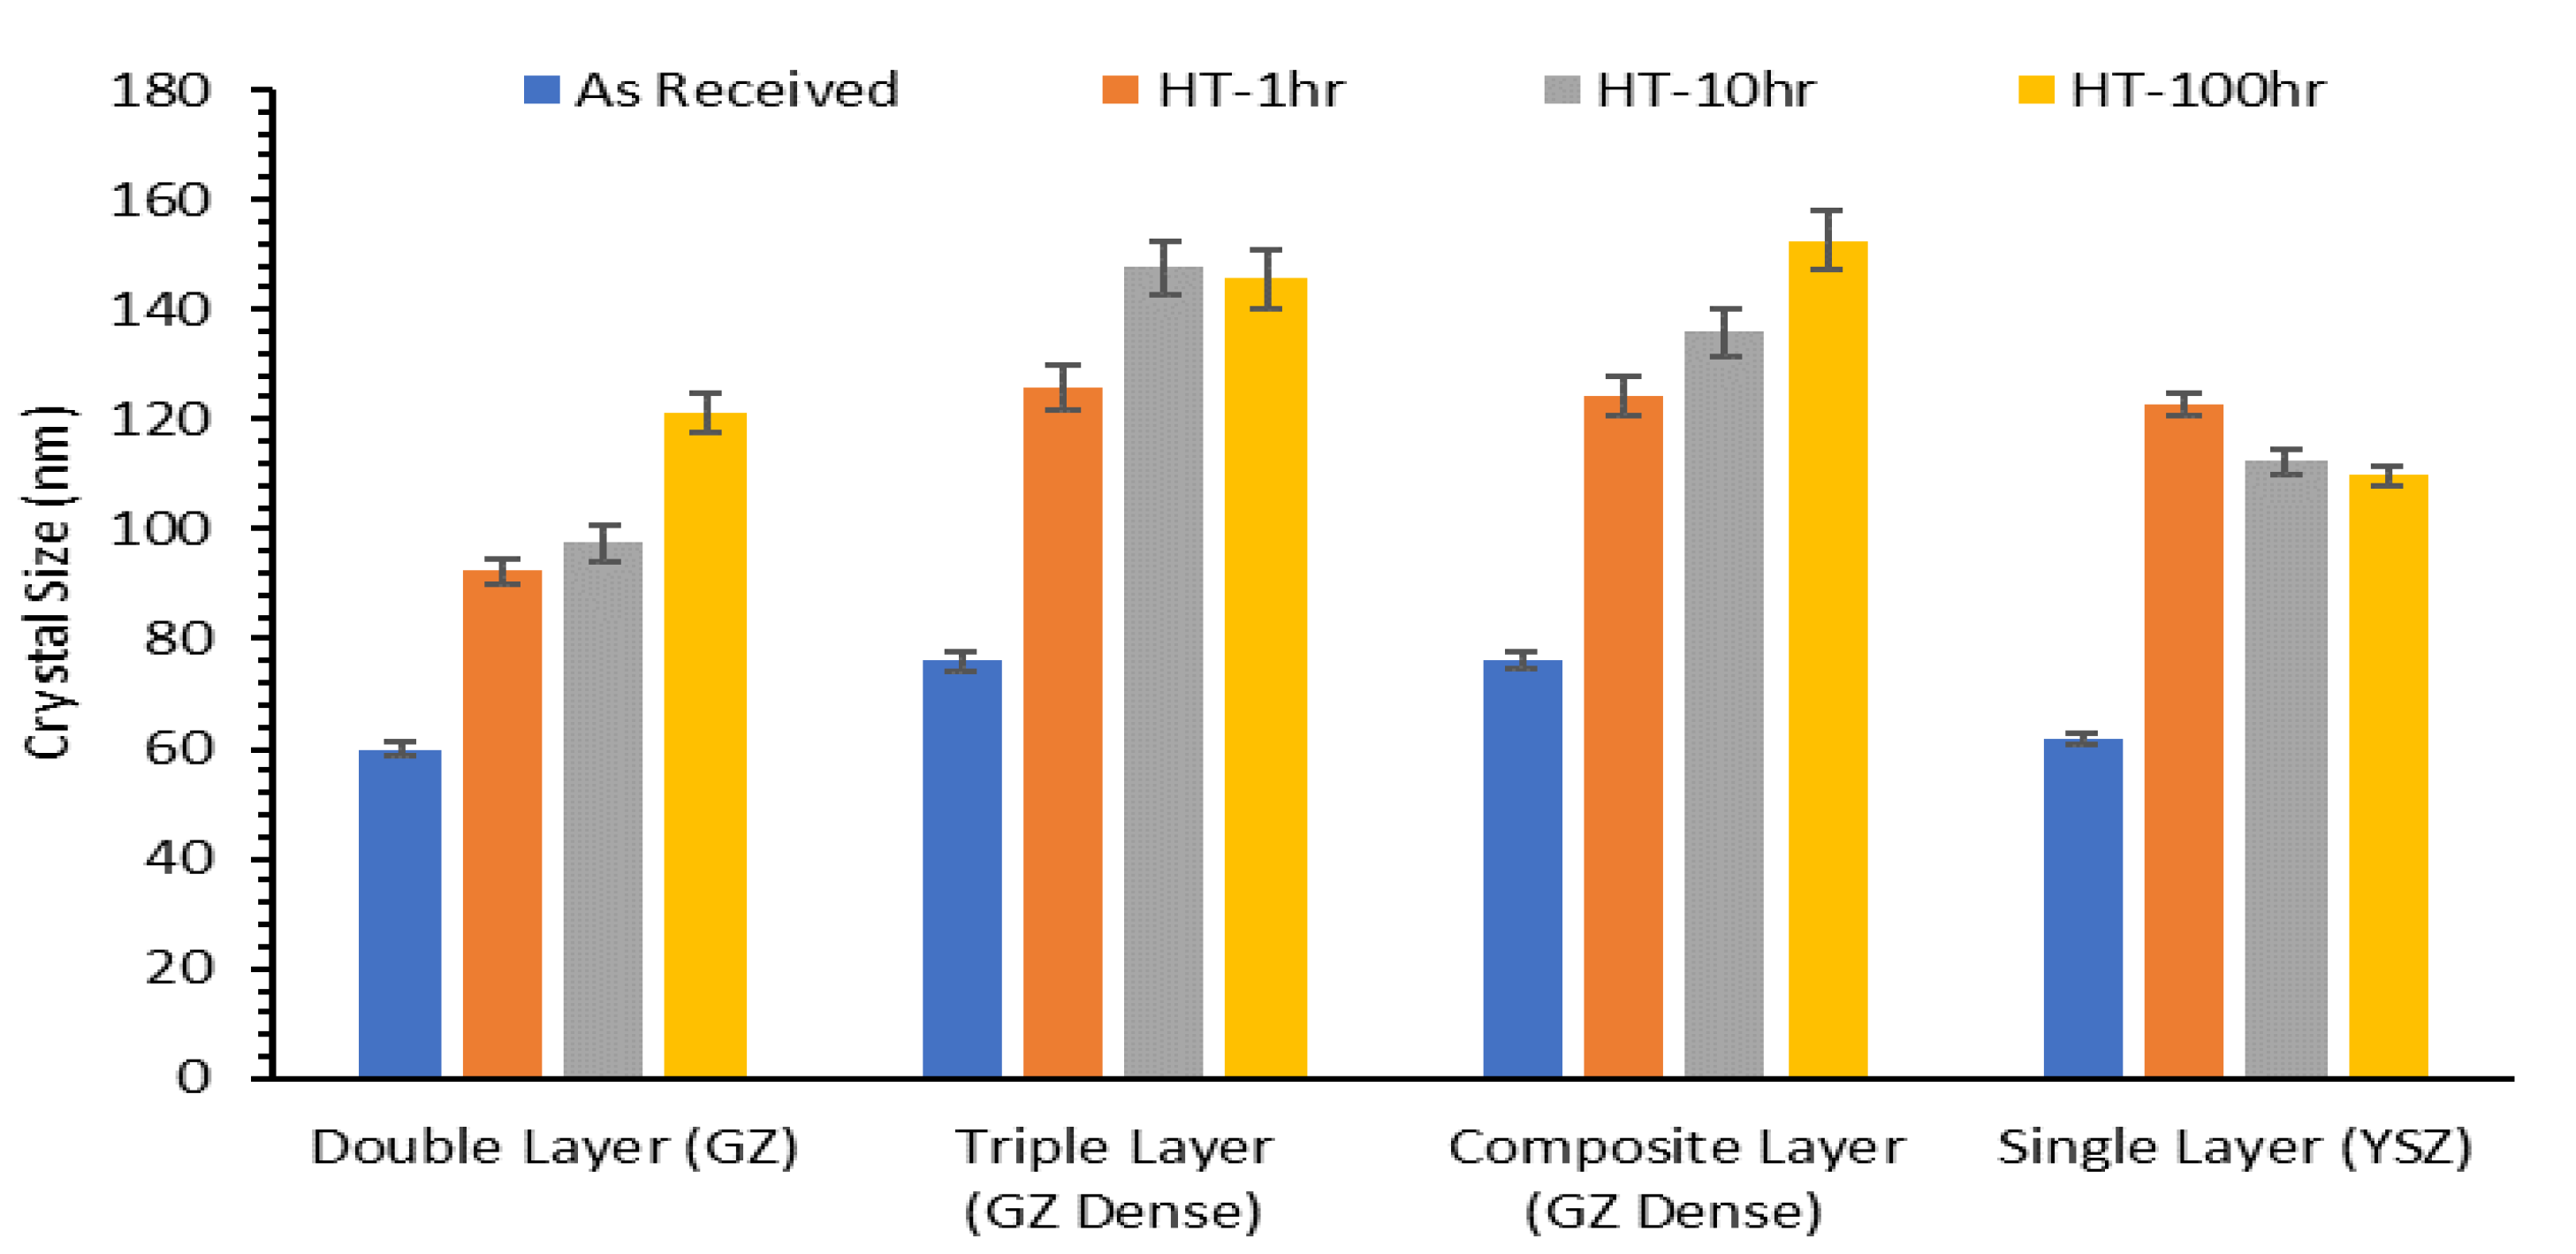
- EBSD mappings revealed that grain growth and formation mechanisms were activated for TBCs layers, and phase transformation (β to γ phase) took place in the BC layer.
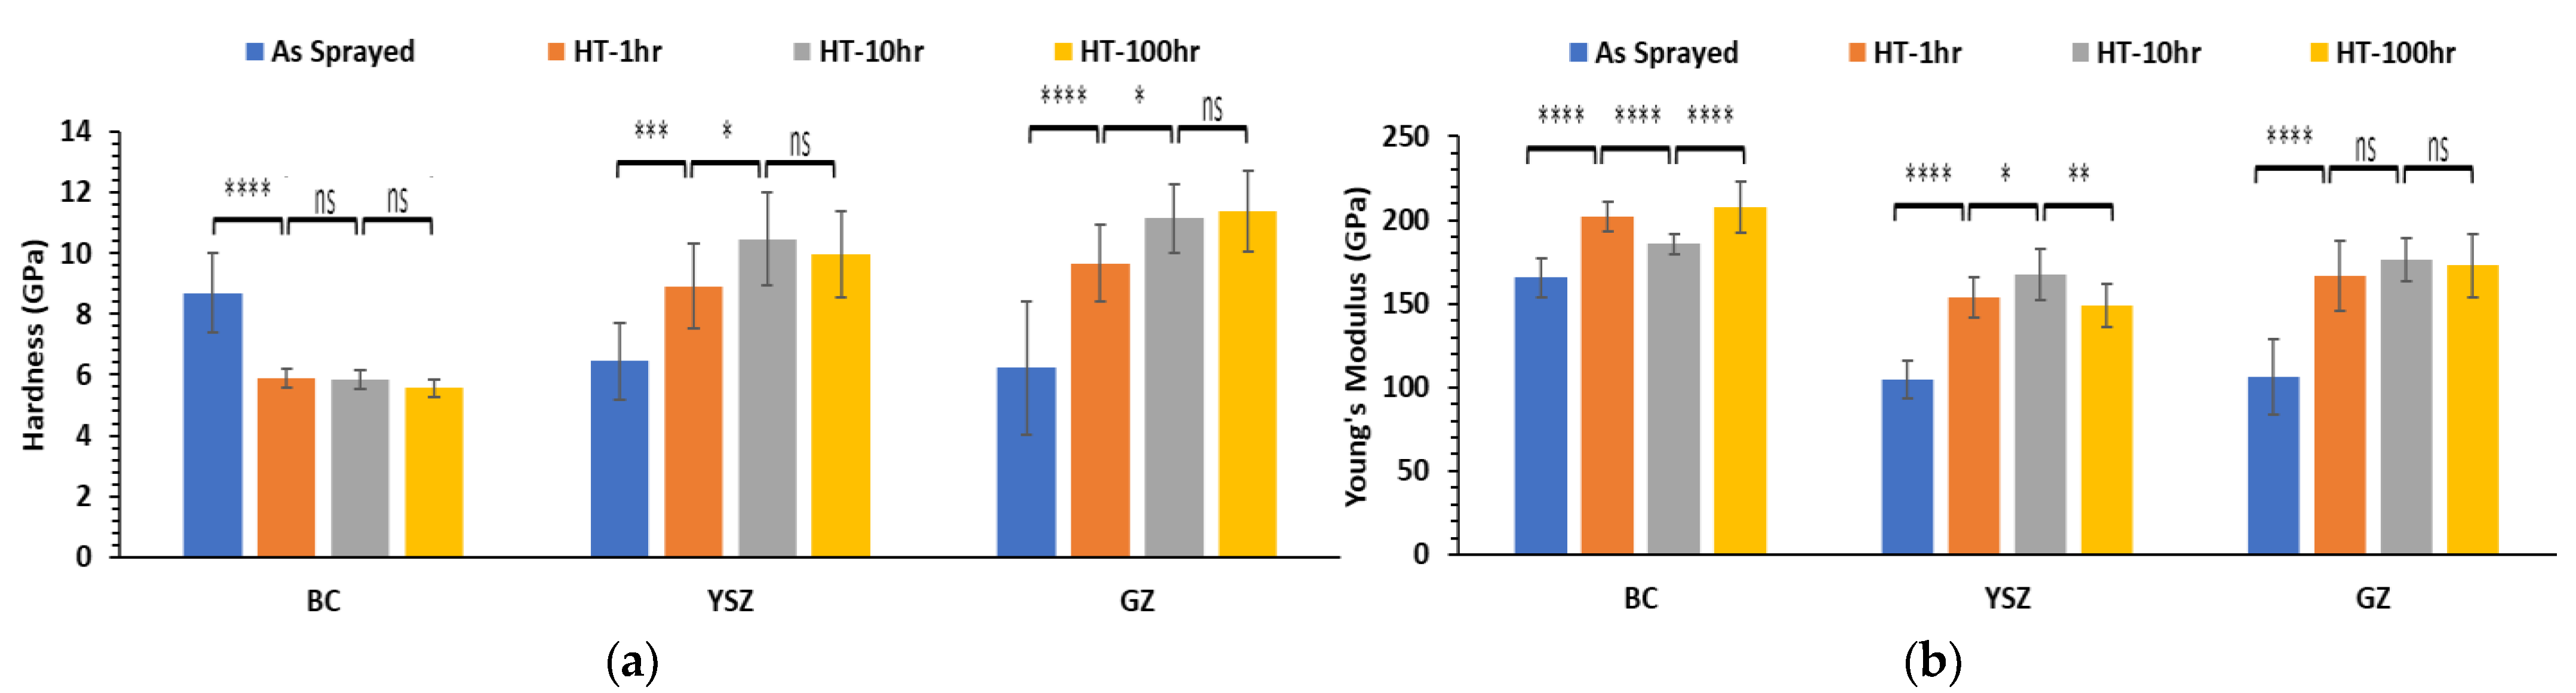
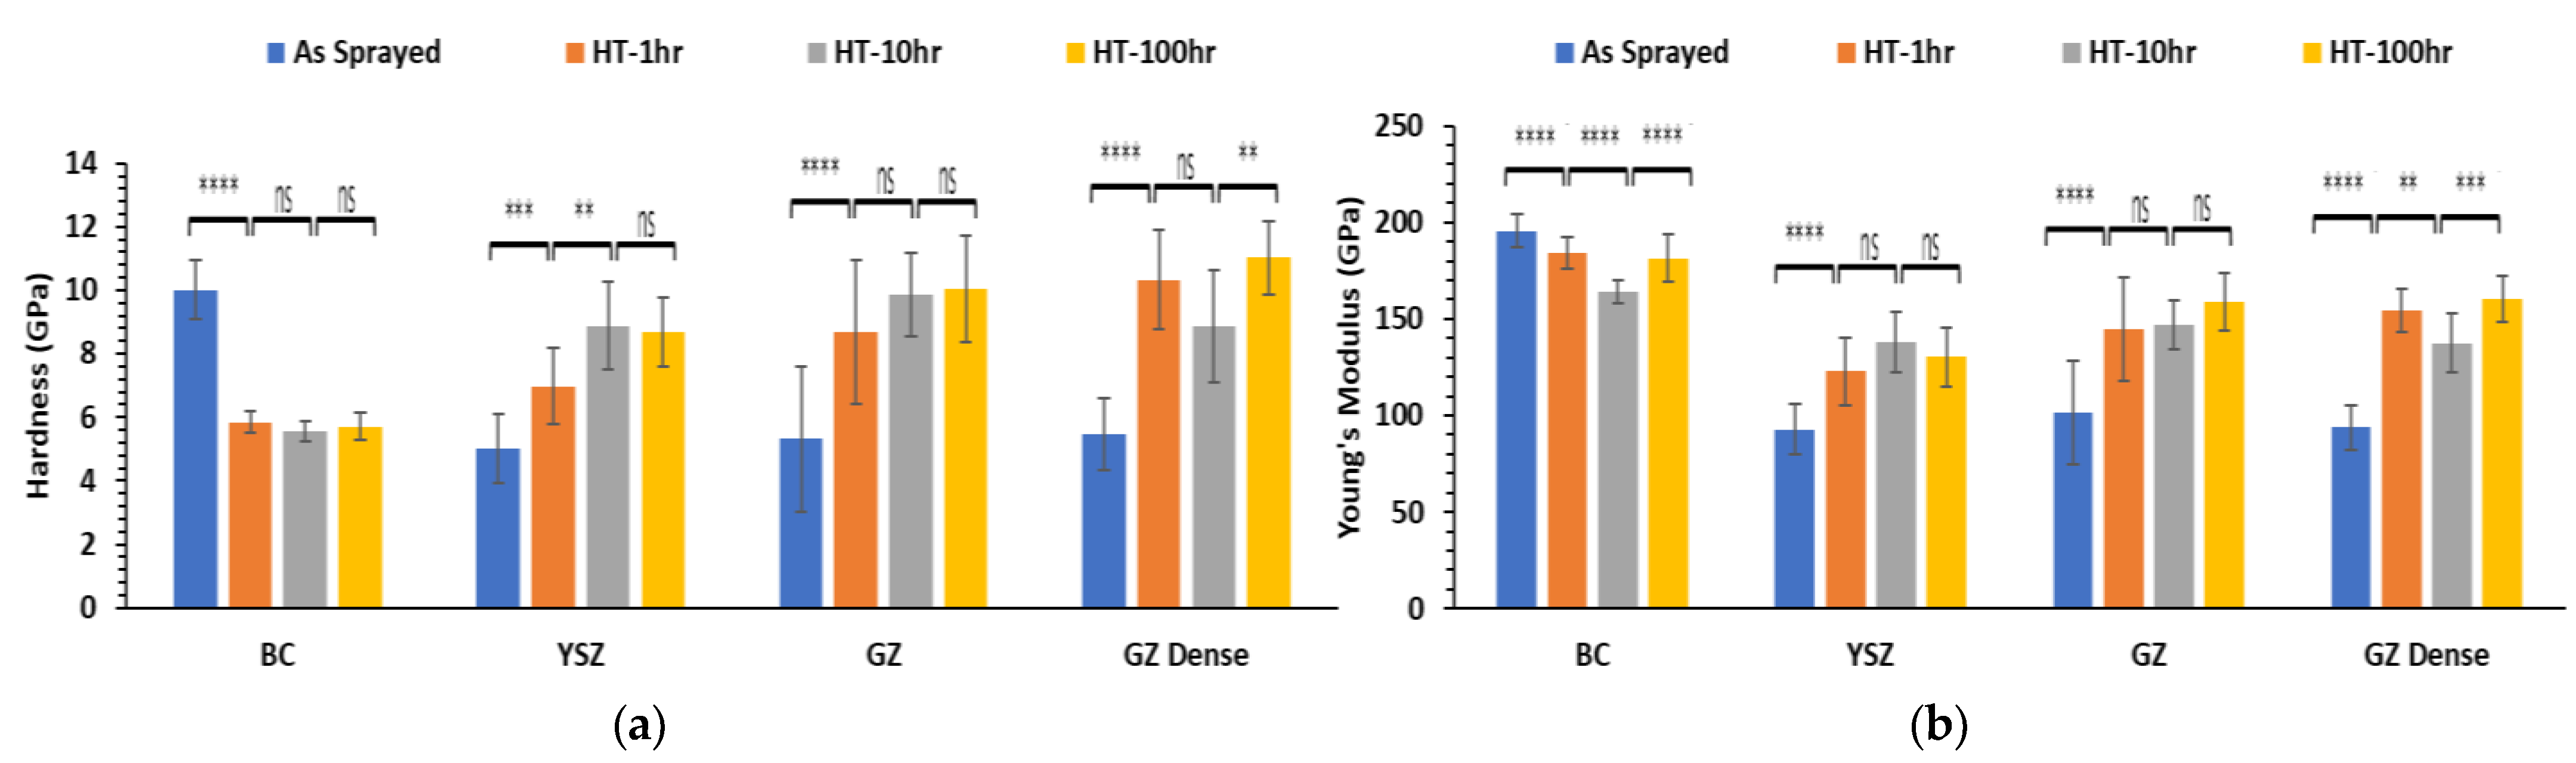
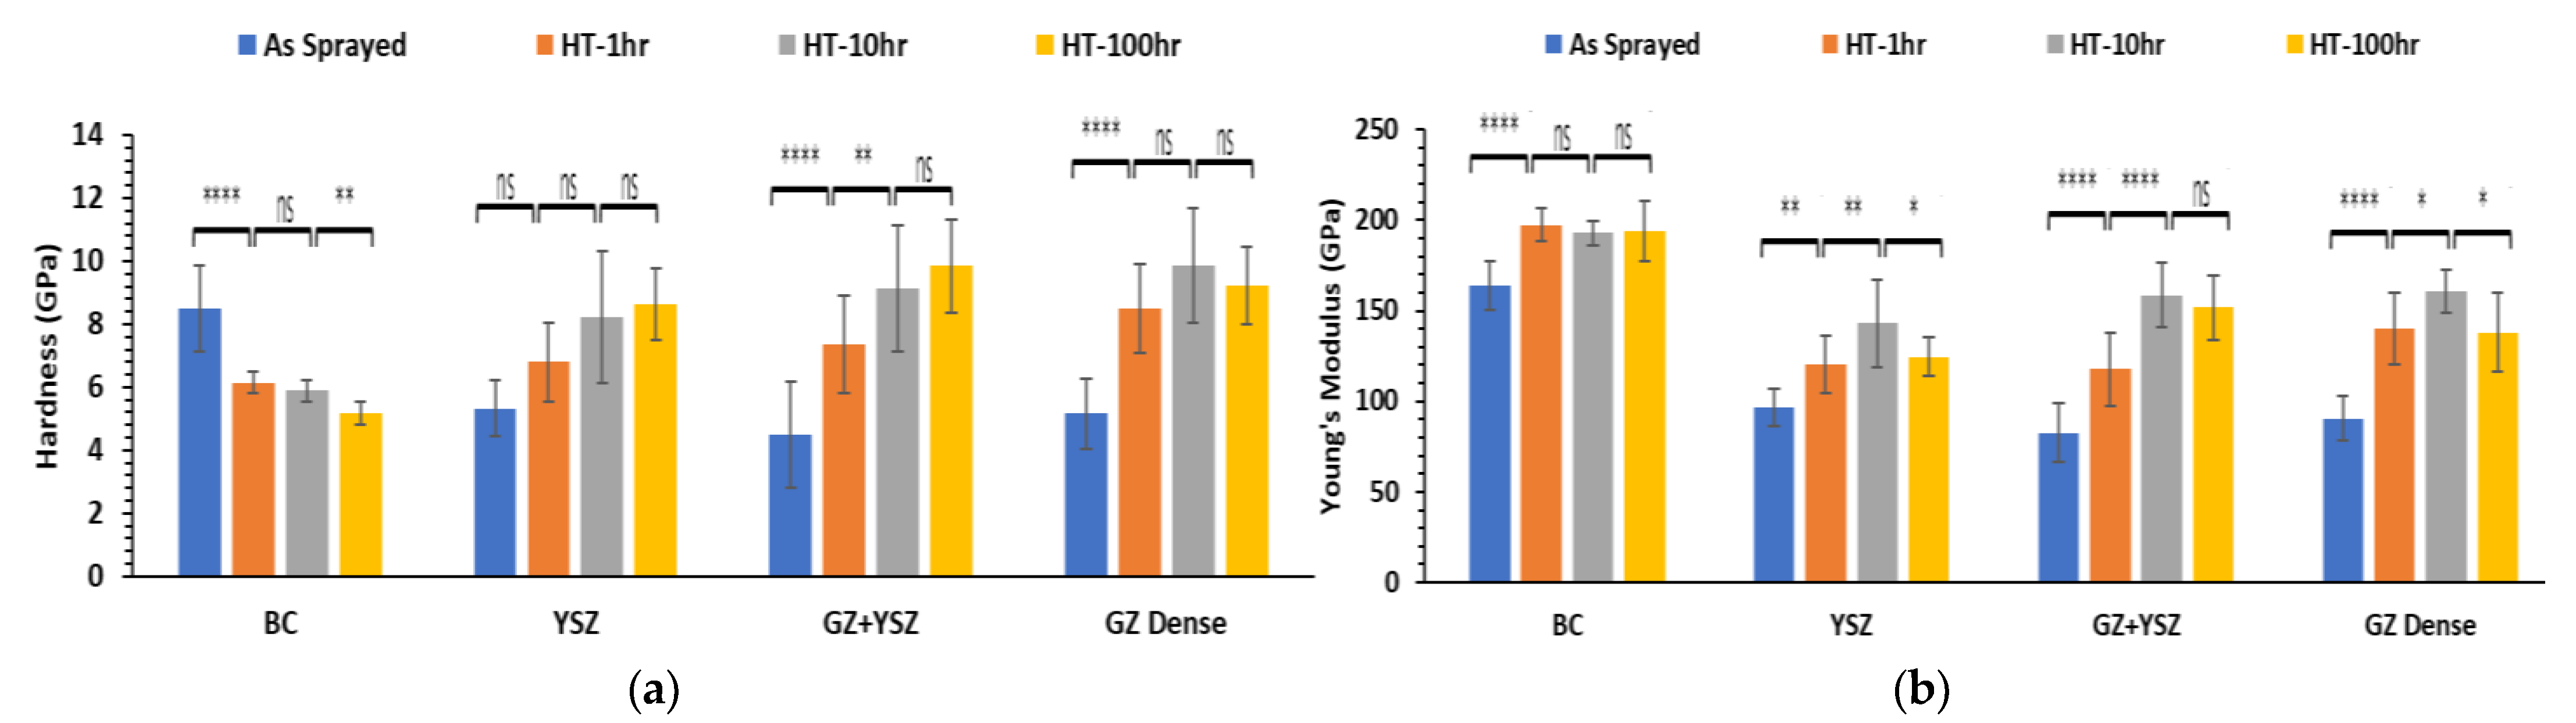
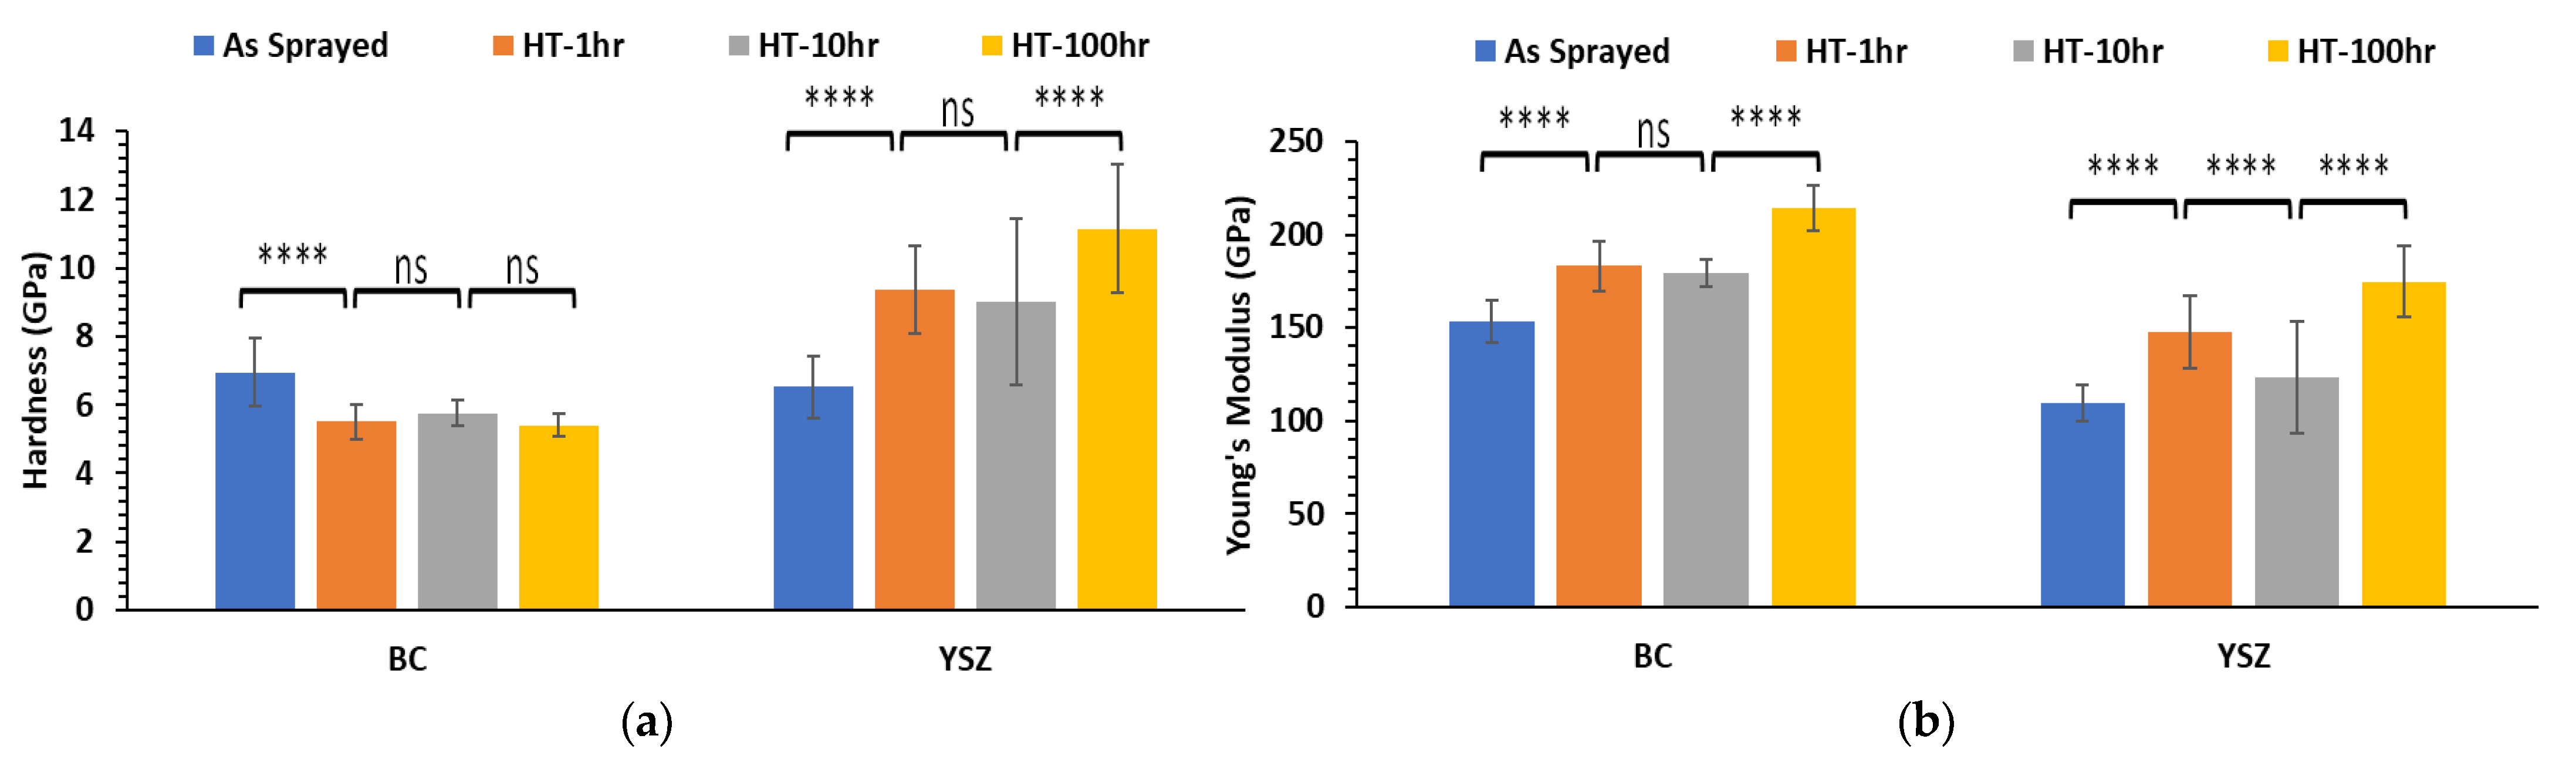
- The reduction in hardness of the BC layer was related to the observed grain coarsening mechanism, whereas elastic modulus variation is attributed to induced phase transformation. The increase in hardness and elastic modulus measurements for the TBC ceramic layers after thermal treatment, can be attributed to the sintering at high temperature as well as the developed residual stresses within the ceramic layers (GZ + YSZ) due to the mismatch in coefficient of thermal expansion (CTE) between the TBC layers.
Author Contributions
Funding
Institutional Review Board Statement
Informed Consent Statement
Data Availability Statement
Acknowledgments
Conflicts of Interest
References
- Wortman, D.J.; Nagaraj, B.A.; Duderstadt, E.C. Thermal Barrier Coatings for Gas Turbine Use. Mater. Sci. Eng. A 1989, 120, 433–440. [Google Scholar] [CrossRef]
- Stöver, D.; Funke, C. Directions of the Development of Thermal Barrier Coatings in Energy Applications. J. Mater. Process. Technol. 1999, 92, 195–202. [Google Scholar] [CrossRef]
- Vaßen, R.; Kaßner, H.; Stuke, A.; Hauler, F.; Hathiramani, D.; Stöver, D. Advanced Thermal Spray Technologies for Applications in Energy Systems. Surf. Coat. Technol. 2008, 202, 4432–4437. [Google Scholar] [CrossRef]
- Durat, M.; Kapsiz, M.; Nart, E.; Ficici, F.; Parlak, A. The Effects of Coating Materials in Spark Ignition Engine Design. Mater. Des. 2012, 36, 540–545. [Google Scholar] [CrossRef]
- Ramalingam, S.; Murugesan, E.; Rajendran, S.; Ganesan, P. Application of Thermal Barrier Coating for Improving the Suitability of Annona Biodiesel in a Diesel Engine. Therm. Sci. 2016, 20, 973–979. [Google Scholar] [CrossRef] [Green Version]
- DeMasi-Marcin, J.T.; Gupta, D.K. Protective Coatings in the Gas Turbine Engine. Surf. Coat. Technol. 1994, 68, 1–9. [Google Scholar] [CrossRef]
- Mahade, S.; Zhou, D.; Curry, N.; Markocsan, N.; Nylén, P.; Vaßen, R. Tailored Microstructures of Gadolinium Zirconate/YSZ Multi-Layered Thermal Barrier Coatings Produced by Suspension Plasma Spray: Durability and Erosion Testing. J. Mater. Process. Technol. 2019, 264, 283–294. [Google Scholar] [CrossRef]
- Mahade, S.; Curry, N.; Björklund, S.; Markocsan, N.; Nylén, P.; Vaßen, R. Functional Performance of Gd2Zr2O7/YSZ Multi-Layered Thermal Barrier Coatings Deposited by Suspension Plasma Spray. Surf. Coat. Technol. 2017, 318, 208–216. [Google Scholar] [CrossRef]
- Gok, M.G.; Goller, G. State of the Art of Gadolinium Zirconate Based Thermal Barrier Coatings: Design, Processing and Characterization. In Methods for Film Synthesis and Coating Procedures; IntechOpen: London, UK, 2019. [Google Scholar]
- Harris, A. Cyclic Durability of Thermal Barrier Coatings Subject to CMAS Attack, University of Connecticut. 2018. Available online: https://opencommons.uconn.edu/dissertations/1732 (accessed on 1 December 2022).
- Clyne, T.W.; Gill, S.C. Residual Stresses in Thermal Spray Coatings and Their Effect on Interfacial Adhesion: A Review of Recent Work. J. Therm. Spray Technol. 1996, 5, 401–418. [Google Scholar] [CrossRef]
- Thompson, J.A.; Clyne, T.W. The Effect of Heat Treatment on the Stiffness of Zirconia Top Coats in Plasma-Sprayed TBCs. Acta Mater. 2001, 49, 1565–1575. [Google Scholar] [CrossRef]
- Ballard, J.D.; Davenport, J.; Lewis, C.; Doremus, R.H.; Schadler, L.S.; Nelson, W. Phase Stability of Thermal Barrier Coatings Made from 8 Wt.% Yttria Stabilized Zirconia: A Technical Note. J. Therm. Spray Technol. 2003, 12, 34–37. [Google Scholar] [CrossRef]
- Brandon, J.R.; Taylor, R. Phase Stability of Zirconia-Based Thermal Barrier Coatings Part II. Zirconia-Ceria Alloys. Surf. Coat. Technol. 1991, 46, 91–101. [Google Scholar] [CrossRef]
- Aygun, A.; Vasiliev, A.L.; Padture, N.P.; Ma, X. Novel Thermal Barrier Coatings That Are Resistant to High-Temperature Attack by Glassy Deposits. Acta Mater. 2007, 55, 6734–6745. [Google Scholar] [CrossRef]
- Li, W.; Zhao, H.; Zhong, X.; Wang, L.; Tao, S. Air Plasma-Sprayed Yttria and Yttria-Stabilized Zirconia Thermal Barrier Coatings Subjected to Calcium-Magnesium-Alumino-Silicate (CMAS). J. Therm. Spray Technol. 2014, 23, 975–983. [Google Scholar] [CrossRef]
- Zhang, D.-B.; Wang, B.-Y.; Cao, J.; Song, G.-Y.; Liu, J.-B. Investigation on the Thermo-Chemical Reaction Mechanism between Yttria-Stabilized Zirconia (YSZ) and Calcium-Magnesium-Alumino-Silicate (CMAS). Front. Mater. Sci. 2015, 9, 93–100. [Google Scholar] [CrossRef]
- Wu, J.; Guo, H.; Abbas, M.; Gong, S. Evaluation of Plasma Sprayed YSZ Thermal Barrier Coatings with the CMAS Deposits Infiltration Using Impedance Spectroscopy. Prog. Nat. Sci. Mater. Int. 2012, 22, 40–47. [Google Scholar] [CrossRef] [Green Version]
- Mensah, P.F.; Diwan, R.; Nandikolla, S.; Coker, O.; Sahoo, P. Thermo-Mechanical Study of the Role of Gd2Zr2O7 (GZ) in Improving Life of YSZ and GZ Double Layered Thermal Barrier Coatings. In Proceedings of the ASME International Mechanical Engineering Congress and Exposition; American Society of Mechanical Engineers: New York, NY, USA, 2012; Volume 45233, pp. 3083–3088. [Google Scholar]
- Krämer, S.; Yang, J.; Levi, C.G. Infiltration-inhibiting Reaction of Gadolinium Zirconate Thermal Barrier Coatings with CMAS Melts. J. Am. Ceram. Soc. 2008, 91, 576–583. [Google Scholar] [CrossRef]
- Levi, C.G.; Hutchinson, J.W.; Vidal-Sétif, M.-H.; Johnson, C.A. Environmental Degradation of Thermal-Barrier Coatings by Molten Deposits. MRS Bull. 2012, 37, 932–941. [Google Scholar] [CrossRef] [Green Version]
- Wu, J.; Wei, X.; Padture, N.P.; Klemens, P.G.; Gell, M.; García, E.; Miranzo, P.; Osendi, M.I. Low-thermal-conductivity Rare-earth Zirconates for Potential Thermal-barrier-coating Applications. J. Am. Ceram. Soc. 2002, 85, 3031–3035. [Google Scholar] [CrossRef]
- Leckie, R.M.; Krämer, S.; Rühle, M.; Levi, C.G. Thermochemical Compatibility between Alumina and ZrO2–GdO3/2 Thermal Barrier Coatings. Acta Mater. 2005, 53, 3281–3292. [Google Scholar] [CrossRef]
- Bakan, E.; Mack, D.E.; Mauer, G.; Vaßen, R. Gadolinium Zirconate/YSZ Thermal Barrier Coatings: Plasma Spraying, Microstructure, and Thermal Cycling Behavior. J. Am. Ceram. Soc. 2014, 97, 4045–4051. [Google Scholar] [CrossRef]
- Jiang, C.; Jordan, E.H.; Harris, A.B.; Gell, M.; Roth, J. Double-Layer Gadolinium Zirconate/Yttria-Stabilized Zirconia Thermal Barrier Coatings Deposited by the Solution Precursor Plasma Spray Process. J. Therm. Spray Technol. 2015, 24, 895–906. [Google Scholar] [CrossRef]
- Zhong, X.; Zhao, H.; Zhou, X.; Liu, C.; Wang, L.; Shao, F.; Yang, K.; Tao, S.; Ding, C. Thermal Shock Behavior of Toughened Gadolinium Zirconate/YSZ Double-Ceramic-Layered Thermal Barrier Coating. J. Alloys Compd. 2014, 593, 50–55. [Google Scholar] [CrossRef]
- Mahade, S.; Curry, N.; Björklund, S.; Markocsan, N.; Nylén, P. Thermal Conductivity and Thermal Cyclic Fatigue of Multilayered Gd2Zr2O7/YSZ Thermal Barrier Coatings Processed by Suspension Plasma Spray. Surf. Coat. Technol. 2015, 283, 329–336. [Google Scholar] [CrossRef] [Green Version]
- Doleker, K.M.; Karaoglanli, A.C.; Ozgurluk, Y.; Kobayashi, A. Performance of Single YSZ, Gd2Zr2O7 and Double-Layered YSZ/Gd2Zr2O7 Thermal Barrier Coatings in Isothermal Oxidation Test Conditions. Vacuum 2020, 177, 109401. [Google Scholar] [CrossRef]
- Shen, Z.; Liu, Z.; Huang, Z.; Mu, R.; He, L.; Liu, G. Thermal Shock Life and Failure Behaviors of La2Zr2O7/YSZ, La2Ce2O7/YSZ and Gd2Zr2O7/YSZ DCL TBCs by EB-PVD. Mater. Charact. 2021, 173, 110923. [Google Scholar] [CrossRef]
- Karaoglanli, A.C.; Doleker, K.M.; Ozgurluk, Y. Interface Failure Behavior of Yttria Stabilized Zirconia (YSZ), La2Zr2O7, Gd2Zr2O7, YSZ/La2Zr2O7 and YSZ/Gd2Zr2O7 Thermal Barrier Coatings (TBCs) in Thermal Cyclic Exposure. Mater. Charact. 2020, 159, 110072. [Google Scholar] [CrossRef]
- Doleker, K.M.; Ozgurluk, Y.; Ahlatci, H.; Karaoglanli, A.C. Evaluation of Oxidation and Thermal Cyclic Behavior of YSZ, Gd2Zr2O7 and YSZ/Gd2Zr2O7 TBCs. Surf. Coat. Technol. 2019, 371, 262–275. [Google Scholar] [CrossRef]
- Doleker, K.M.; Karaoglanli, A.C. Comparison of Oxidation Behavior of YSZ and Gd2Zr2O7 Thermal Barrier Coatings (TBCs). Surf. Coat. Technol. 2017, 318, 198–207. [Google Scholar] [CrossRef]
- Li, B.; Sun, J.; Guo, L. CMAS Corrosion Behavior of Sc Doped Gd2Zr2O7/YSZ Thermal Barrier Coatings and Their Corrosion Resistance Mechanisms. Corros. Sci. 2021, 193, 109899. [Google Scholar] [CrossRef]
- Kuppusami, P.; Ch, J.R. Evaluation of Microstructure and Coating Integrity of EB-PVD Deposited Bi-Layers of 7YSZ/Gd2Zr2O7 and 7YSZ/Y2O3-Gd2Zr2O7 Top Coats on Bond Coated Superalloys. Surf. Coat. Technol. 2022, 440, 128488. [Google Scholar]
- Shen, Z.; Liu, G.; Liu, Z.; He, L.; Mu, R.; Wang, L. Dy Doped Gd2Zr2O7 Thermal Barrier Coatings: Thermal Expansion Coefficient, Microstructure and Failure Mechanism. Appl. Surf. Sci. Adv. 2021, 6, 100174. [Google Scholar] [CrossRef]
- Liu, Z.; Shen, Z.; Liu, G.; He, L.; Mu, R.; Xu, Z. Sm-Doped Gd2Zr2O7 Thermal Barrier Coatings: Thermal Expansion Coefficient, Structure and Failure. Vacuum 2021, 190, 110314. [Google Scholar] [CrossRef]
- Li, B.; Wu, J.; He, X.; Wang, B.; Guo, L. Sc-Doped Gd2Zr2O7 Coating on YSZ Thermal Barrier Coatings to Resist CMAS+ Molten Salt Attack. Ceram. Int. 2022, 48, 11662–11671. [Google Scholar] [CrossRef]
- Zhong, X.; Zhao, H.; Liu, C.; Wang, L.; Shao, F.; Zhou, X.; Tao, S.; Ding, C. Improvement in Thermal Shock Resistance of Gadolinium Zirconate Coating by Addition of Nanostructured Yttria Partially-Stabilized Zirconia. Ceram. Int. 2015, 41, 7318–7324. [Google Scholar] [CrossRef]
- Thakare, J.G.; Pandey, C.; Mulik, R.S.; Mahapatra, M.M. Microstructure and Mechanical Properties of D-Gun Sprayed Cr3C2-NiCr Coating on P91 Steel Subjected to Long Term Thermal Exposure at 650 °C. Mater. Res. Express 2019, 6, 1165h1. [Google Scholar] [CrossRef]
- Thakare, J.G.; Pandey, C.; Mulik, R.S.; Mahapatra, M.M. Mechanical Property Evaluation of Carbon Nanotubes Reinforced Plasma Sprayed YSZ-Alumina Composite Coating. Ceram. Int. 2018, 44, 6980–6989. [Google Scholar] [CrossRef]
- Mahade, S.; Curry, N.; Jonnalagadda, K.P.; Peng, R.L.; Markocsan, N.; Nylen, P. Influence of YSZ Layer Thickness on the Durability of Gadolinium Zirconate/YSZ Double-Layered Thermal Barrier Coatings Produced by Suspension Plasma Spray. Surf. Coat. Technol. 2019, 357, 456–465. [Google Scholar] [CrossRef]
- Mahade, S.; Curry, N.; Björklund, S.; Markocsan, N.; Joshi, S. Durability of Gadolinium Zirconate/YSZ Double-Layered Thermal Barrier Coatings under Different Thermal Cyclic Test Conditions. Materials 2019, 12, 2238. [Google Scholar] [CrossRef] [Green Version]
- Scardi, P.; Leoni, M. Whole Powder Pattern Modelling. Acta Crystallogr. Sect. A Found. Crystallogr. 2002, 58, 190–200. [Google Scholar] [CrossRef]
- Oliver, W.C.; Pharr, G.M. An Improved Technique for Determining Hardness and Elastic Modulus Using Load and Displacement Sensing Indentation Experiments. J. Mater. Res. 1992, 7, 1564–1583. [Google Scholar] [CrossRef]
- Image, J. Softonic. Available online: http://imagej.en.softonic.com/ (accessed on 1 December 2022).
- Dong, H.; Yang, G.; Li, C.; Luo, X.; Li, C. Effect of TGO Thickness on Thermal Cyclic Lifetime and Failure Mode of Plasma-sprayed TBC S. J. Am. Ceram. Soc. 2014, 97, 1226–1232. [Google Scholar] [CrossRef]
- Vaßen, R.; Traeger, F.; Stöver, D. New Thermal Barrier Coatings Based on Pyrochlore/YSZ Double-layer Systems. Int. J. Appl. Ceram. Technol. 2004, 1, 351–361. [Google Scholar] [CrossRef]
- Vencl, A.A.; Mrdak, M.R. Thermal Cycling Behaviour of Plasma Sprayed NiCr-Al-Co-Y2O3 Bond Coat in Thermal Barrier Coating System. Therm. Sci. 2019, 23, 1789–1800. [Google Scholar] [CrossRef]
- Bai, M.; Maher, H.; Pala, Z.; Hussain, T. Microstructure and Phase Stability of Suspension High Velocity Oxy-Fuel Sprayed Yttria Stabilised Zirconia Coatings from Aqueous and Ethanol Based Suspensions. J. Eur. Ceram. Soc. 2018, 38, 1878–1887. [Google Scholar] [CrossRef]
- Chen, Y.; Zhao, X.; Bai, M.; Yang, L.; Li, C.; Wang, L.; Carr, J.A.; Xiao, P. A Mechanistic Understanding on Rumpling of a NiCoCrAlY Bond Coat for Thermal Barrier Coating Applications. Acta Mater. 2017, 128, 31–42. [Google Scholar] [CrossRef]
- Vignesh, B.; Oliver, W.C.; Kumar, G.S.; Phani, P.S. Critical Assessment of High Speed Nanoindentation Mapping Technique and Data Deconvolution on Thermal Barrier Coatings. Mater. Des. 2019, 181, 108084. [Google Scholar] [CrossRef]
- Zou, Z.; Donoghue, J.; Curry, N.; Yang, L.; Guo, F.; Nylén, P.; Zhao, X.; Xiao, P. A Comparative Study on the Performance of Suspension Plasma Sprayed Thermal Barrier Coatings with Different Bond Coat Systems. Surf. Coat. Technol. 2015, 275, 276–282. [Google Scholar] [CrossRef]
- Kyaw, S.; Jones, A.; Hyde, T. Predicting Failure within TBC System: Finite Element Simulation of Stress within TBC System as Affected by Sintering of APS TBC, Geometry of Substrate and Creep of TGO. Eng. Fail. Anal. 2013, 27, 150–164. [Google Scholar] [CrossRef]


Disclaimer/Publisher’s Note: The statements, opinions and data contained in all publications are solely those of the individual author(s) and contributor(s) and not of MDPI and/or the editor(s). MDPI and/or the editor(s) disclaim responsibility for any injury to people or property resulting from any ideas, methods, instructions or products referred to in the content. |
© 2023 by the authors. Licensee MDPI, Basel, Switzerland. This article is an open access article distributed under the terms and conditions of the Creative Commons Attribution (CC BY) license (https://creativecommons.org/licenses/by/4.0/).
Share and Cite
Amer, M.; Curry, N.; Hayat, Q.; Sharma, R.; Janik, V.; Zhang, X.; Nottingham, J.; Bai, M. Cracking Behavior of Gd2Zr2O7/YSZ Multi-Layered Thermal Barrier Coatings Deposited by Suspension Plasma Spray. Coatings 2023, 13, 107. https://doi.org/10.3390/coatings13010107
Amer M, Curry N, Hayat Q, Sharma R, Janik V, Zhang X, Nottingham J, Bai M. Cracking Behavior of Gd2Zr2O7/YSZ Multi-Layered Thermal Barrier Coatings Deposited by Suspension Plasma Spray. Coatings. 2023; 13(1):107. https://doi.org/10.3390/coatings13010107
Chicago/Turabian StyleAmer, Mohamed, Nicholas Curry, Qamar Hayat, Rohit Sharma, Vit Janik, Xiang Zhang, Jon Nottingham, and Mingwen Bai. 2023. "Cracking Behavior of Gd2Zr2O7/YSZ Multi-Layered Thermal Barrier Coatings Deposited by Suspension Plasma Spray" Coatings 13, no. 1: 107. https://doi.org/10.3390/coatings13010107