Article

Effects of Y2O3 Content on Wear Resistance and Corrosion Resistance of 316L/TiC Coating Fabricated by Laser Cladding

1
School of Naval Architecture and Shipping College, Guangdong Ocean University, Zhanjiang 524088, China
2
School of Electronics and Information Engineering, Guangdong Ocean University, Zhanjiang 524088, China
3
School of Materials and Engineering, Guangdong Ocean University, Zhanjiang 524088, China
*
Author to whom correspondence should be addressed.
Coatings 2023, 13(8), 1348; https://doi.org/10.3390/coatings13081348
Submission received: 21 June 2023 / Revised: 14 July 2023 / Accepted: 28 July 2023 / Published: 31 July 2023
(This article belongs to the Special Issue Recent Development in Post-processing for Additive Manufacturing)

Abstract

:
Laser cladding technology is a surface modification technology emerging in recent years, and it is widely used in the marine engineering field. Since the structural steels used in marine engineering are mostly carbon steels, their wear resistance and corrosion resistance are poor. In this paper, 316 L stainless steel/TiC composite coatings with different Y2O3 addition amounts were fabricated on Q355B steel surface using the laser cladding technology, and the phase composition, microstructure, microhardness, wear resistance, and corrosion resistance of the coatings were investigated with an X-ray diffractometer (XRD), a scanning electron microscope (SEM), a digital microhardness tester, a friction and wear tester, and an electrochemical workstation. When Y2O3 is added, the crystals in the bottom part of the coating are basically broken and the organisation becomes more dense. When the Y2O3 addition amount is 2%, the hardness is highest, the frictional coefficient curve of the coating exhibits a stable descending trend, and the coating mass loss is the lowest. When Y2O3 is added at 1%, the dynamic potential polarisation curve shows high corrosion potential and low corrosion current density and exhibited the best performance in EIS. The added Y2O3 evidently improves the wear resistance and corrosion resistance of 316 L stainless steel/TiC composite coatings, and this provides a new possibility that a composite coating modified with rare earth oxide is used for repair of marine engineering structures.

1. Introduction

As the world’s population continues to grow and land resources are increasingly depleted, the oceans are attracting more and more attention from coastal countries [1], and to “develop marine equipment and construct marine engineering” is one of the important contents of China’s strategy of building a powerful marine country. Q355B steel is a kind of common low-alloy high-strength marine steel, with excellent comprehensive mechanical properties, and it is widely used in such engineering fields with loading effects such as ship manufacturing, petroleum storage tank, bridge structure, special equipment, and hoisting machinery [2,3]. The marine service environment is severe, and this alloy steel has poor wear resistance and corrosion resistance, greatly shortening the useful life of marine engineering structures, limiting their application in environments, and bringing serious difficulty in offshore works. Therefore, using surface treatment means to improve the surface properties and repair damaged surface can effectively reduce the cost and save materials. Shot peening [4], built-up welding [5], thermal spraying [6], microarc oxidation [7], and laser cladding [8] are commonly used surface treatment methods. The laser cladding technology, as a novel surface modification technology, is a new surface reinforcement method, in which coating materials are prefabricated on the substrate surface with different filling modes, then laser irradiation makes the coating materials and the thin layer of substrate surface melt simultaneously and the melt solidifies quickly, to form a surface cladding layer exhibiting metallurgical bonding with the substrate and having extremely low dilution rate, thus significantly improving various physical and chemical properties, including wear resistance, heat resistance, corrosion resistance, and anti-oxidation property of the substrate surface [9,10,11].
With its excellent corrosion resistance, 316 L austenitic stainless steel is widely used in the marine engineering field. However, in some application environments, low hardness and poor wear resistance may cause unrepairable defects of parts [12]. Therefore, a cermet phase can be introduced into the 316 L austenitic stainless steel to improve its microstructure, thus improving its mechanical properties. Because of its light weight, high toughness, high hardness, and good wear resistance, titanium carbide (TiC) is widely used as a cermet phase [13]. Due to good wettability with 316 L, TiC becomes the preferential second-phase reinforcing material. In addition, the TiC particles dispersed in steel has very strong capability to capture hydrogen and its isotopes, greatly inhibiting the penetration and diffusion of hydrogen isotopes in the material [14]. Niu et al. [15] prepared TiC ceramic coating-reinforced 304 parts using the wire and arc additive manufacturing (WAAM)-laser cladding (LC) hybrid manufacturing technology, and investigated the microstructures and mechanical properties of the 304 WAAM substrate and TiC coating. Results show that a coating with good bonding property and without defects is obtained and the coating has better wear resistance and lower wear rate. Yuan et al. [16] fabricated FeCrAl/TiC composite coating on ferrite/martensite (F/M) steel surface using the laser cladding technology, and studied the microstructure and wear resistance of the coating. Results show that the added TiC can effectively refine the crystalline grains, promoting the transition from columnar to equiaxed grains and inhibiting the generation of coating cracks and that the wear resistance of the composite coating is improved. Chen et al. [17] optimized the process parameters for LC-MMC coating using the Taguchi method and the empirical statistical model, and prepared single-layer multi-track TiC-reinforced Ni-based coating with the coaxial laser cladding technology, not only verifying the correctness of the mathematical model but also effectively improving the microhardness of the coating. Liu et al. [18] fabricated TiC-reinforced CoCrFeNiMo high-entropy alloy coating on Ti6Al4V alloy surface using the laser cladding technology, and investigated the effects of the mass fraction of TiC on the microstructure, corrosion resistance, wear resistance, and electrochemical properties of the coating. Results show that the added TiC improves the hardness and shaping quality of the coating. The wear rate of the CoCrFeNiMo/TiC coating decreases with the increase in the mass fraction of TiC, and the coating with 20% of TiC added has the highest corrosion resistance and wear resistance. The addition of TiC hard phase particles can improve the comprehensive properties of the coating to a certain extent for all of high-entropy alloy, Fe-based, Ni-based, and stainless steel materials; however, the thermal physical properties of ceramic phase particles differ greatly from those of alloy powder, possibly resulting in increased coating defects. Therefore, introduction of rare earth oxides is taken into account to optimize the mechanism of effect of TiC on coatings. Zhang et al. [19] fabricated TiC-reinforced Ti-based composite coating on Ti6Al4V surface using the laser cladding technology, and investigated the effects of Y2O3 on the shaping quality and microstructure of the composite coating. When 2wt % of Y2O3 is added, the cracks are fully eliminated, with the number of pores decreasing sharply. Ding et al. [20] prepared Mo-12Si-8.5B-Y2O3 composite coating on Ni-based alloy surface using the laser cladding technology, and studied the effects of Y2O3 on the microstructure and properties of the coating. Results show that with the increase in Y2O3 content, both microhardness and high-temperature anti-oxidation property of the coating are improved.
Nevertheless, there are few reports on Y2O3-reinforced 316 L stainless steel/TiC composite material. Consequently, in this paper, with Q355B carbon steel as the study object, 316 L stainless steel/TiC/Y2O3 coating was fabricated using the laser cladding technology, the effects of trace Y2O3 on the microstructure, hardness, wear resistance, and corrosion resistance of the 316 L stainless steel/TiC coating were analysed, and the potential possibilities were discussed to provide some theoretical basis for achieving optimization of the content of rare earth oxides.

2. Materials and Methods

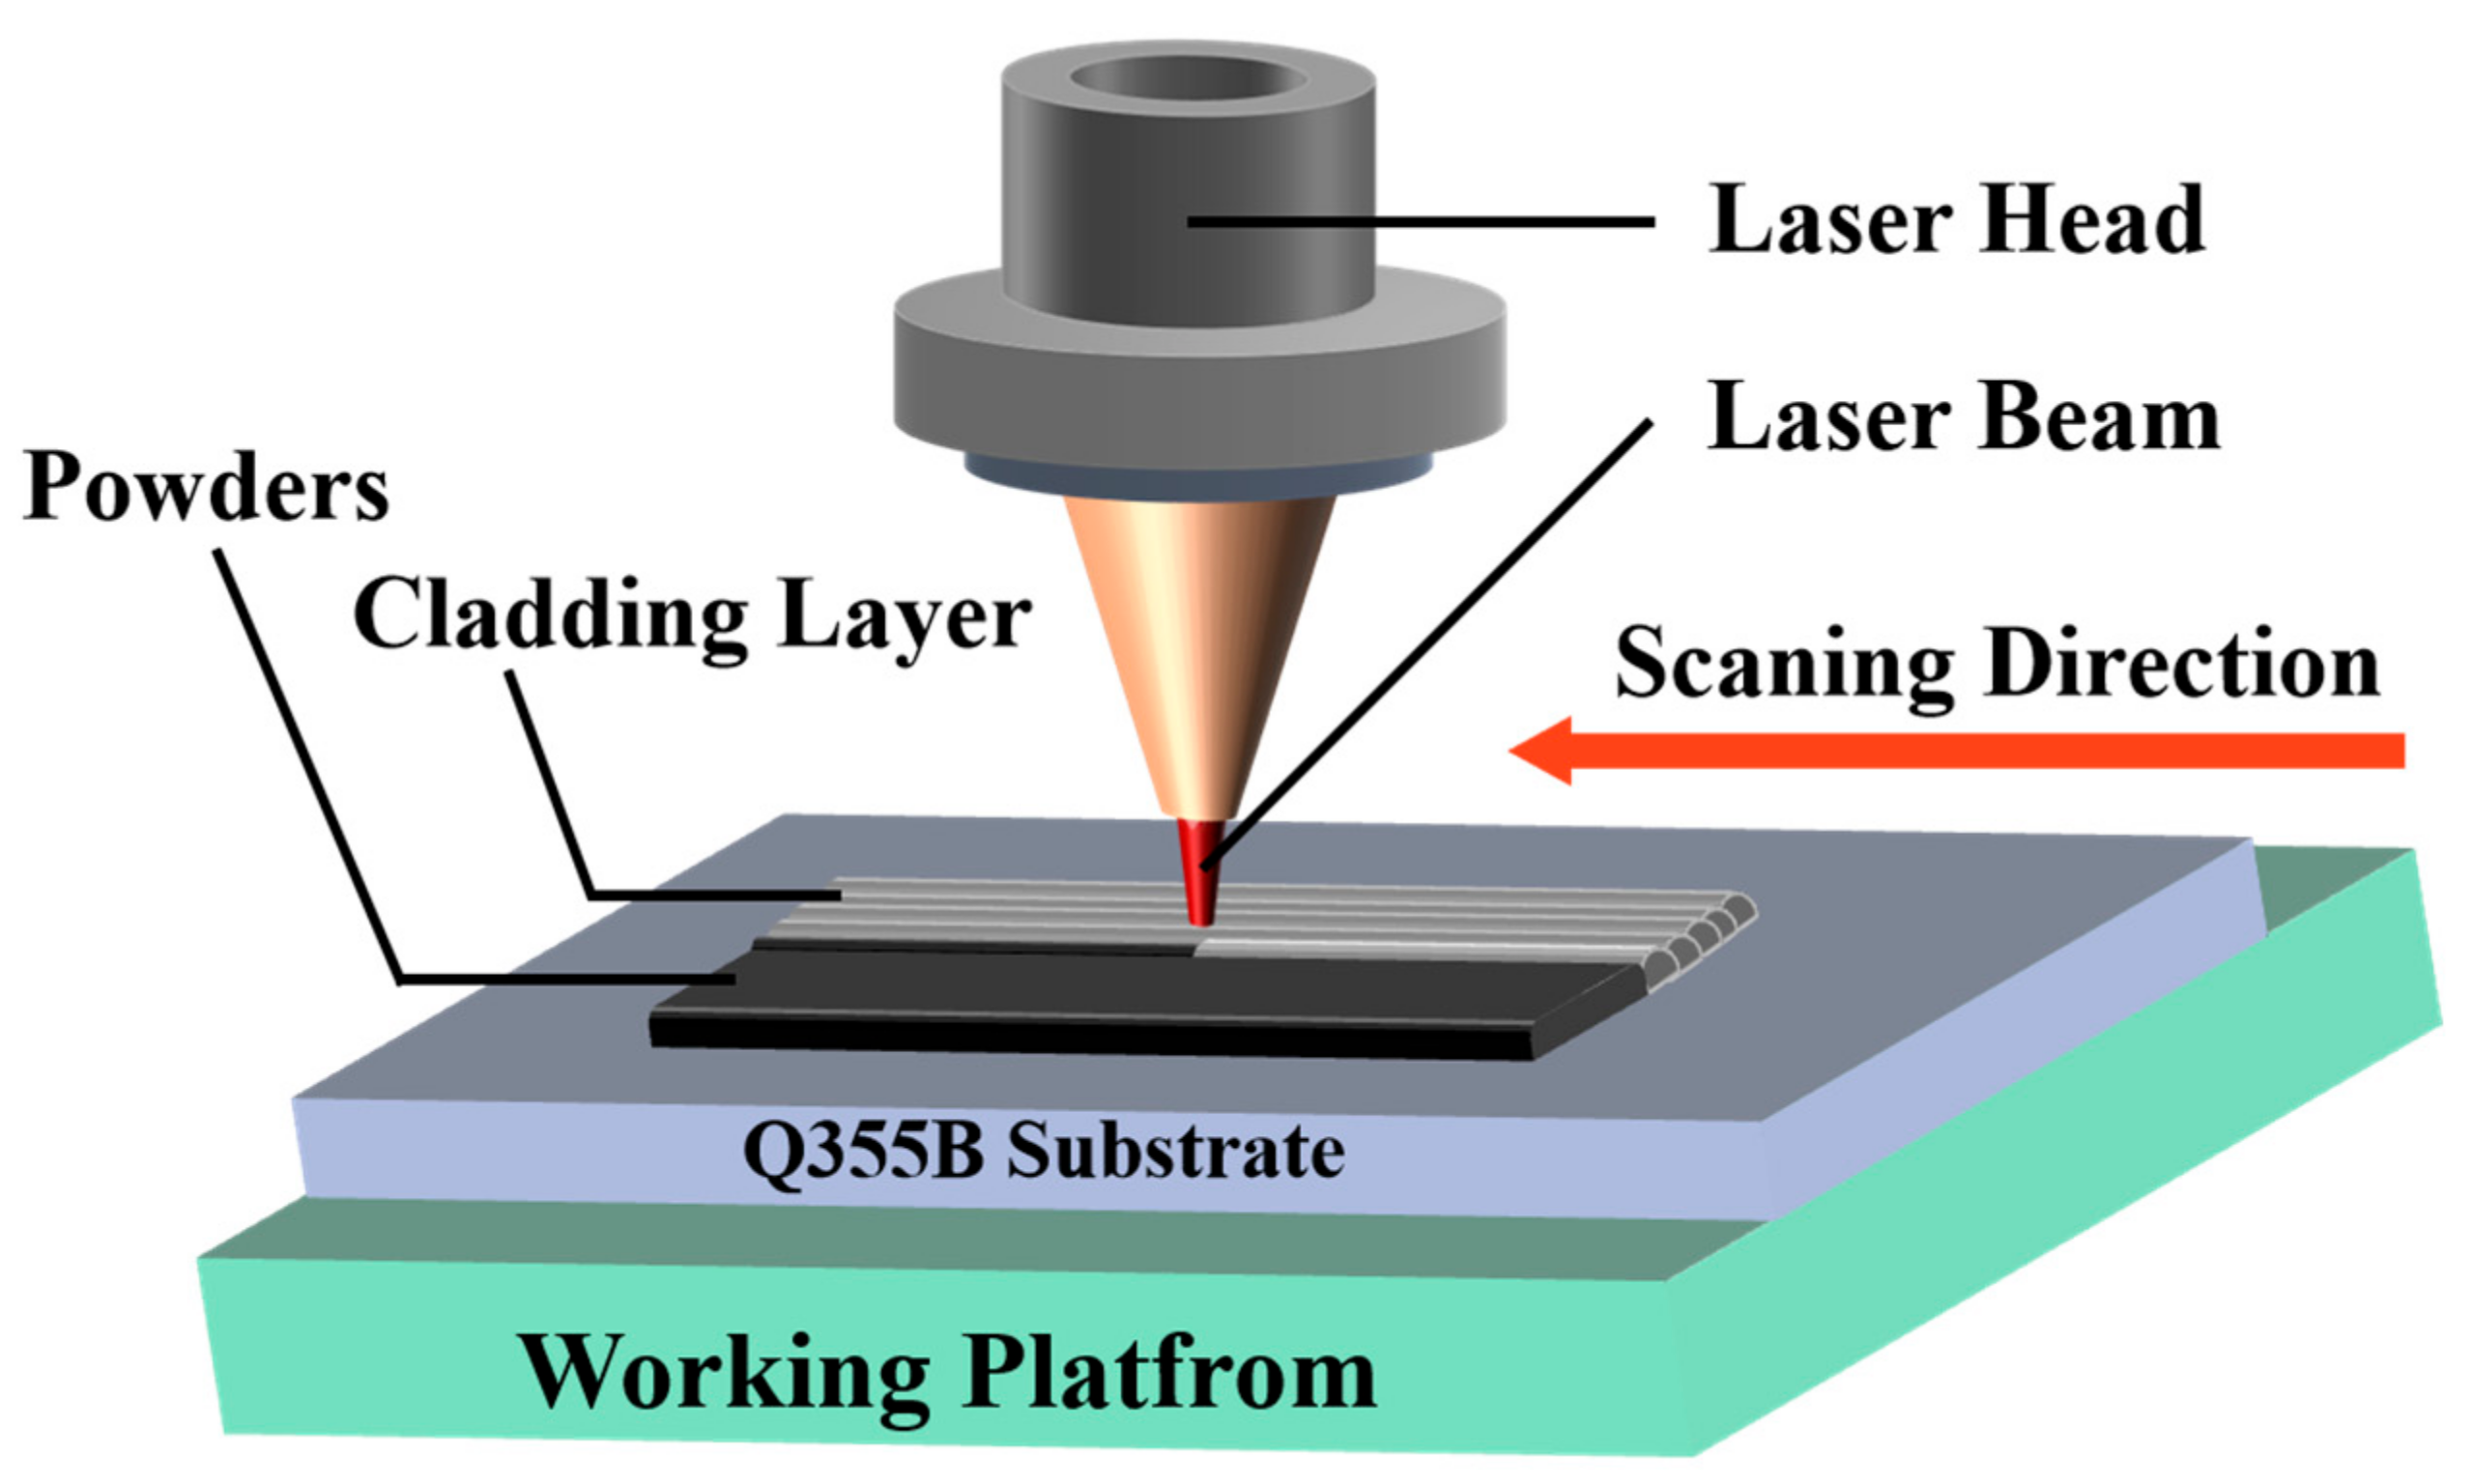
2.1. Sample Preparation

In this paper, Q355B carbon steel meeting new China national standards produced by Tianjin Bengang Iron and Steel Trade Co., Ltd., (Tianjin Bengang Iron and Steel Trade, Tianjin, China) was selected as substrate material, and the sample was 50 mm × 50 mm × 3 mm in size, with the chemical composition shown in Table 1. The powder materials were 316 L stainless steel spherical powder, TiC spherical powder (purity > 99.9%), and Y2O3 (yttrium oxide) powder (purity > 99.9%) prepared using the gas atomization method, and the chemical composition of the 316 L stainless steel spherical powder is shown in Table 2.
Before the experiment, the surface of the substrate was dry rubbed for polishing with three kinds of ordinary sandpaper (#400, #1000, and #2000) in turn, and was cleaned with absolute ethanol and acetone to remove oil stains and then was oven dried. The powder proportion is shown in Table 3. The mixed powder included 90% (mass fraction) of 316 L powder and 10% (mass fraction) of TiC powder.
Figure 1 is the schematic diagram of processing by laser cladding. The experimental equipment used was an XL-F2000W optical fibre continuous laser processing system, and the method used was the powder presetting method, with a powder laying height of 1 mm ± 0.1 mm. The following were selected for the experiment: laser power of 1200 W, scanning speed of 700 mm/min, defocus amount of +5 mm, and cladding track spacing of 1.6 mm, and the fabricated samples had smooth surface, without cracks, air pores, and shrinking edges.

2.2. Characterizations of the Samples

2.2.1. Surface Macro/Micromorphology and Phase Compositions

Two groups of samples with sizes of 10 mm × 20 mm (experiment group 1) and 20 mm × 20 mm (experiment group 2) were taken through cutting with a wire cutting machine along the laser output path and in the direction perpendicular to the cladding layer. The samples in experiment group 1 underwent thermal inlaying with a Laizhou Weiyi ZXQ-5 thermal inlaying machine. In experiment group 2, a copper foil (size of 10 mm × 100 mm) was stuck to the back of each sample with conductive silver adhesive and then the sample was sealed with epoxy resin. Two groups of samples underwent wetting grinding for polishing of substrate surface with six kinds of ordinary sandpaper (#400, #800, #1000, #1500, #2000, and #2000) in turn. The samples in experiment group 1 were chemically eroded with aqua regia corrosive solution until the surface of the samples discoloured (about 20 s). After the corrosion was completed, the samples were cleaned and oven dried. The microstructure of the treated samples was observed with a TESCAN AMBER GMH field emission scanning electron microscope (FE-SEM) and an energy dispersive spectrometer (EDS), and the elements and their content were analysed. A phase analysis was conducted for the cladding layer with a SHIMADZU XRD-6100 XRD. The 2θ angle scanning range was 10–90°.

2.2.2. Friction and Wear Tests

The microhardness distribution in the cladding layer cross-section was measured with an MHVD-1000AT digital microhardness tester (SIOMM, Shanghai, China) under a load of 200 gf and a load holding time of 10 s. Point selection was started from ~10 μm to the top of the cladding layer, indentations were selected as test points at a spacing of 10 μm, 14 points were selected in the vertical direction, and three were selected in the horizontal direction. The average value of microhardness from three times of measurement at a point was calculated as the microhardness value of the point. The friction and wear resistance of the cladding layer was tested with a Zhongke Kaihua HSR-2M high-speed reciprocating friction and wear tester (Zhongke Kaihua, Lanzhou, China). The friction mode was reciprocating dry friction, the applied load was 20 N, the reciprocating speed was 300 t/min, the movement distance was 5 mm, and the friction time was 60 min. The frictional pairs were Si3N4 spheres with a diameter of 6.0 mm. After the wear test was completed, the samples were cleaned with an ultrasonic cleaning machine, and then oven dried. Afterwards, the samples were weighed with an electronic balance with an accuracy of 0.0001 g.

2.2.3. Electrochemical Tests

The samples and platinum electrodes were cleaned with distilled water before the test with an GHI660 multi-channel electrochemical workstation (Chenhua, Shanghai, China). The classical three-electrode system was selected for the test, the selected reference electrode was a saturated calomel electrode, the selected auxiliary electrode was a platinum sheet with a size of 1 × 1 cm and the working electrodes were the samples in experimental group 2. The test electrolyte solution was NaCl aqueous solution with a mass fraction of 0.035. To obtain a stable open-circuit potential, the samples needed to be soaked in the electrolyte solution for 30 min before test. The EIS test was carried out at the stable open-circuit potential, the scanning frequency range was 0.01–10 kHz, and sinusoidal signal with an amplitude of 5 mV was selected for the test. The obtained impedance data were fitted with the software.

3. Results and Discussion

3.1. Morphology and XRD Phases

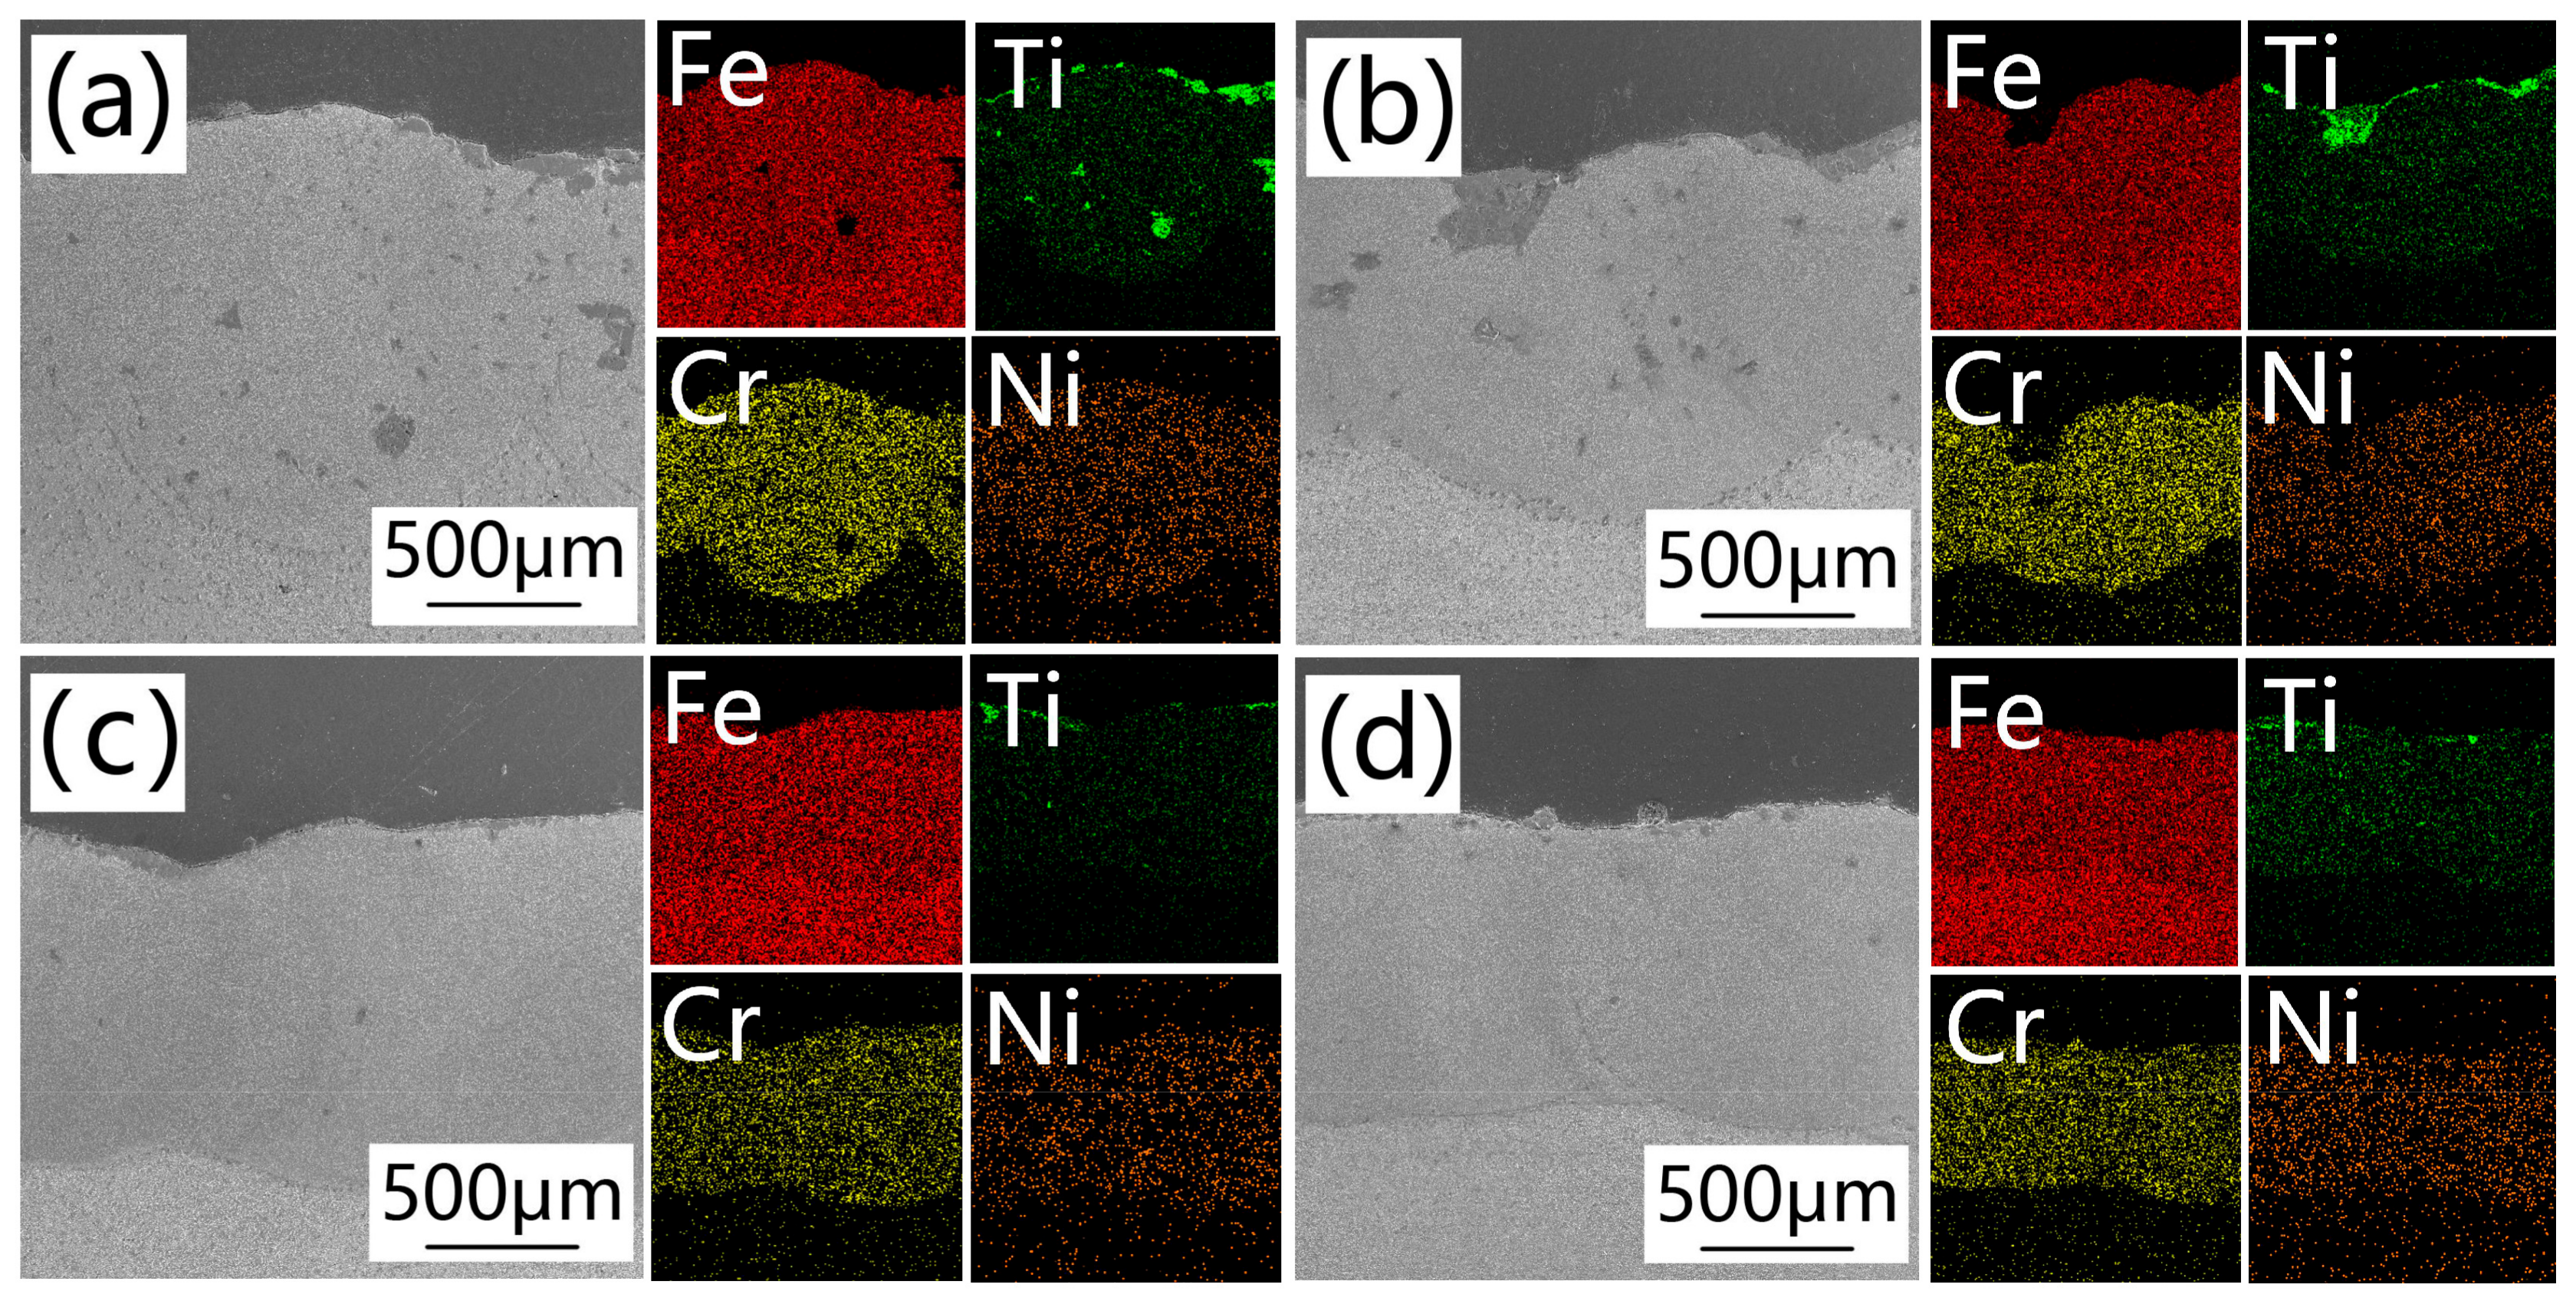
3.1.1. Macro Morphology

To explore the effect of Y2O3 content on the shaping quality of coatings, microphotos of coating cross-section were taken with an SEM at a magnification of 100, and energy spectrum analysis was conducted using the surface scanning method. Figure 2 shows the microphotos of the samples with different Y2O3 addition amounts and corresponding energy spectrum diagrams, and the macro morphology of cross-section of a sample can characterize the shaping quality of the cladding layer. As shown in Figure 3, the microstructure distribution of coating is more even in samples S2 and S3 (Figure 2c,d) than in samples S0 and S1 (Figure 2a,b). According to the energy spectrum analysis results in Table 4, it can be seen that the elements Fe, Cr, and Ni are distributed consistently and evenly in samples S0 and S1, but the element Ti exhibits evident enrichment phenomenon in the coating and the coating top. Analysis indicates that there may be the following two causes: on the one hand, there are TiC residues on the coating surface, the TiC particles have large size and small density (4.93 g/cm3) and a part of TiC may float up in the molten pool, thus the element Ti is enriched in the coating top; on the other hand, the cause of the enrichment of element Ti inside the coating may be that the melt liquid inside the coating has a low viscosity, affecting the convection in the molten pool, causing weak diffusion of melting TiC, thus resulting in poor quality of the cladding layer [21]. According to Takamichi and Roderick [22], the dynamic viscosity (μ) of melt liquid is defined as follows:
μ = α m kT γ
where α is a constant, m is atom mass, k is Boltzmann constant, γ denotes the surface tension of liquid, and T is the working temperature of liquid. The coatings of samples S1, S2 and S3 are modified by Y2O3, resulting in higher laser power absorption rate and lower surface tension, so the temperature of molten pool increases [23]. According to Equation (1), with the increase in the temperature of molten pool, the working temperature of liquid increases accordingly, so that the dynamic viscosity of molten pool decreases, promoting the Marangoni convection in the molten pool, further benefiting the diffusion of melt liquid. This indicates that the added Y2O3 can increase the laser absorption rate of coating and decrease the viscosity in the molten pool, promoting the convection in the molten pool, causing the melt liquid to be distributed evenly in the molten pool, thus improving the coating quality.

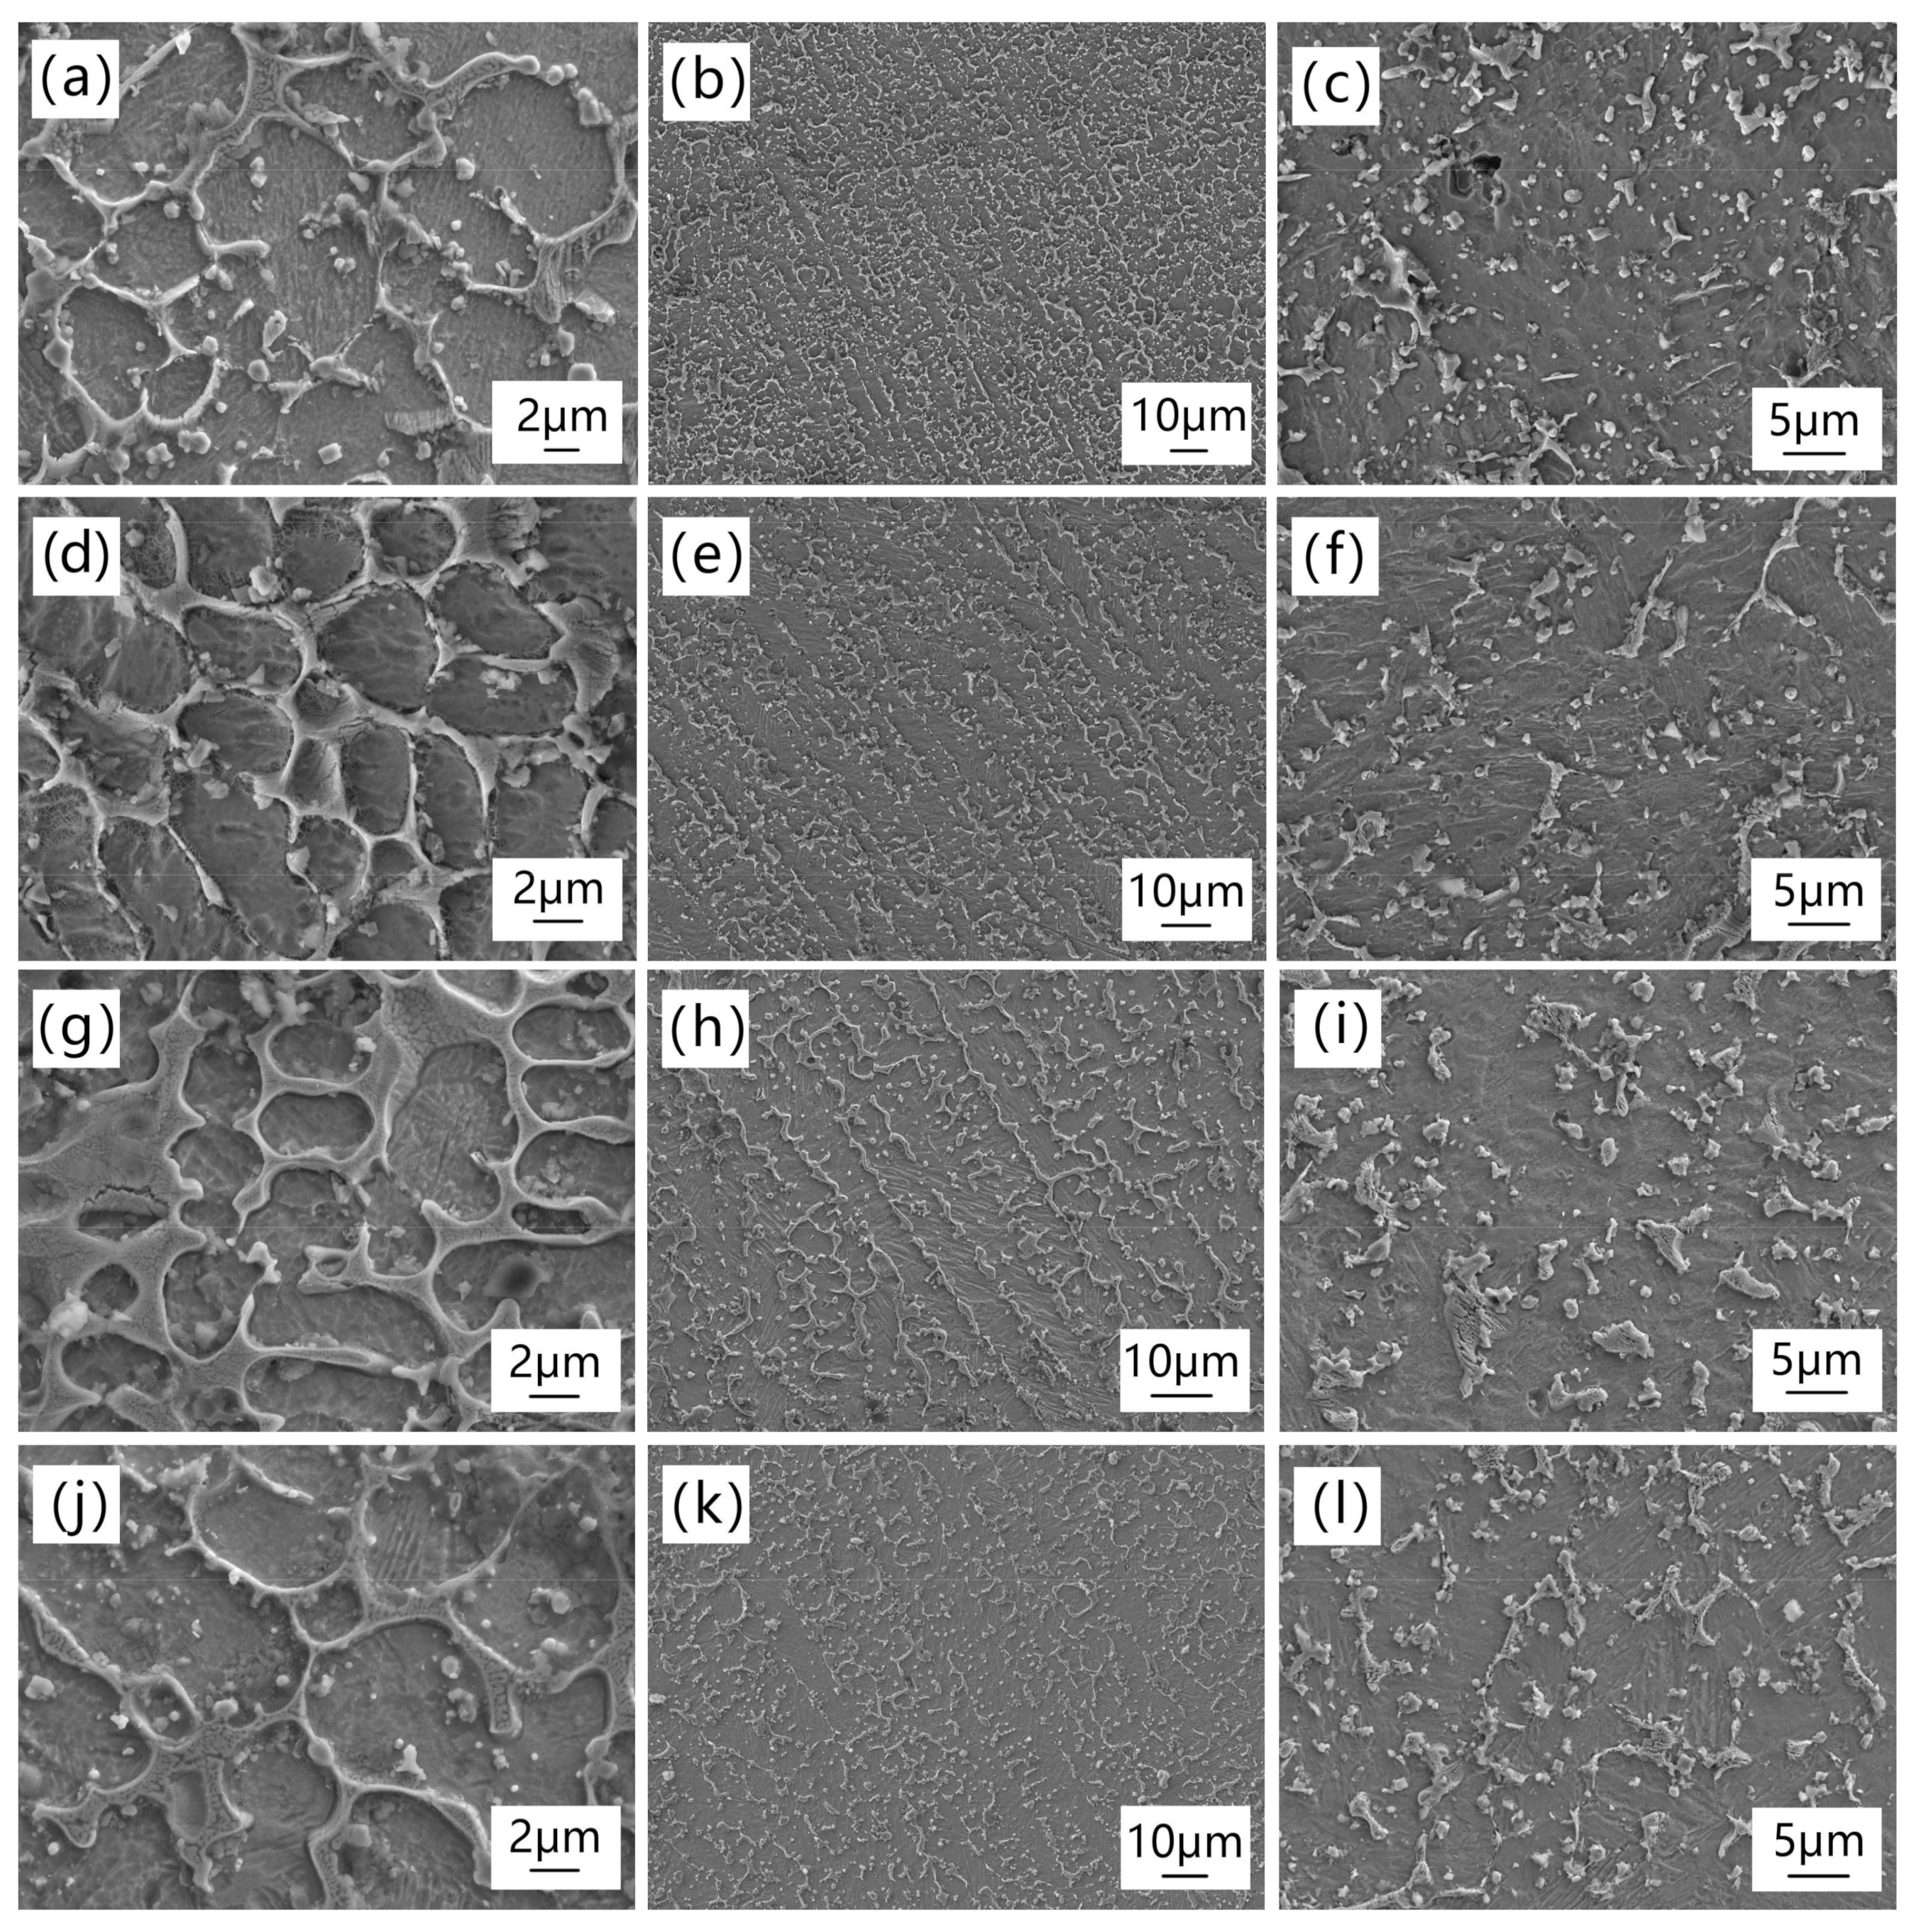
3.1.2. Microstructure
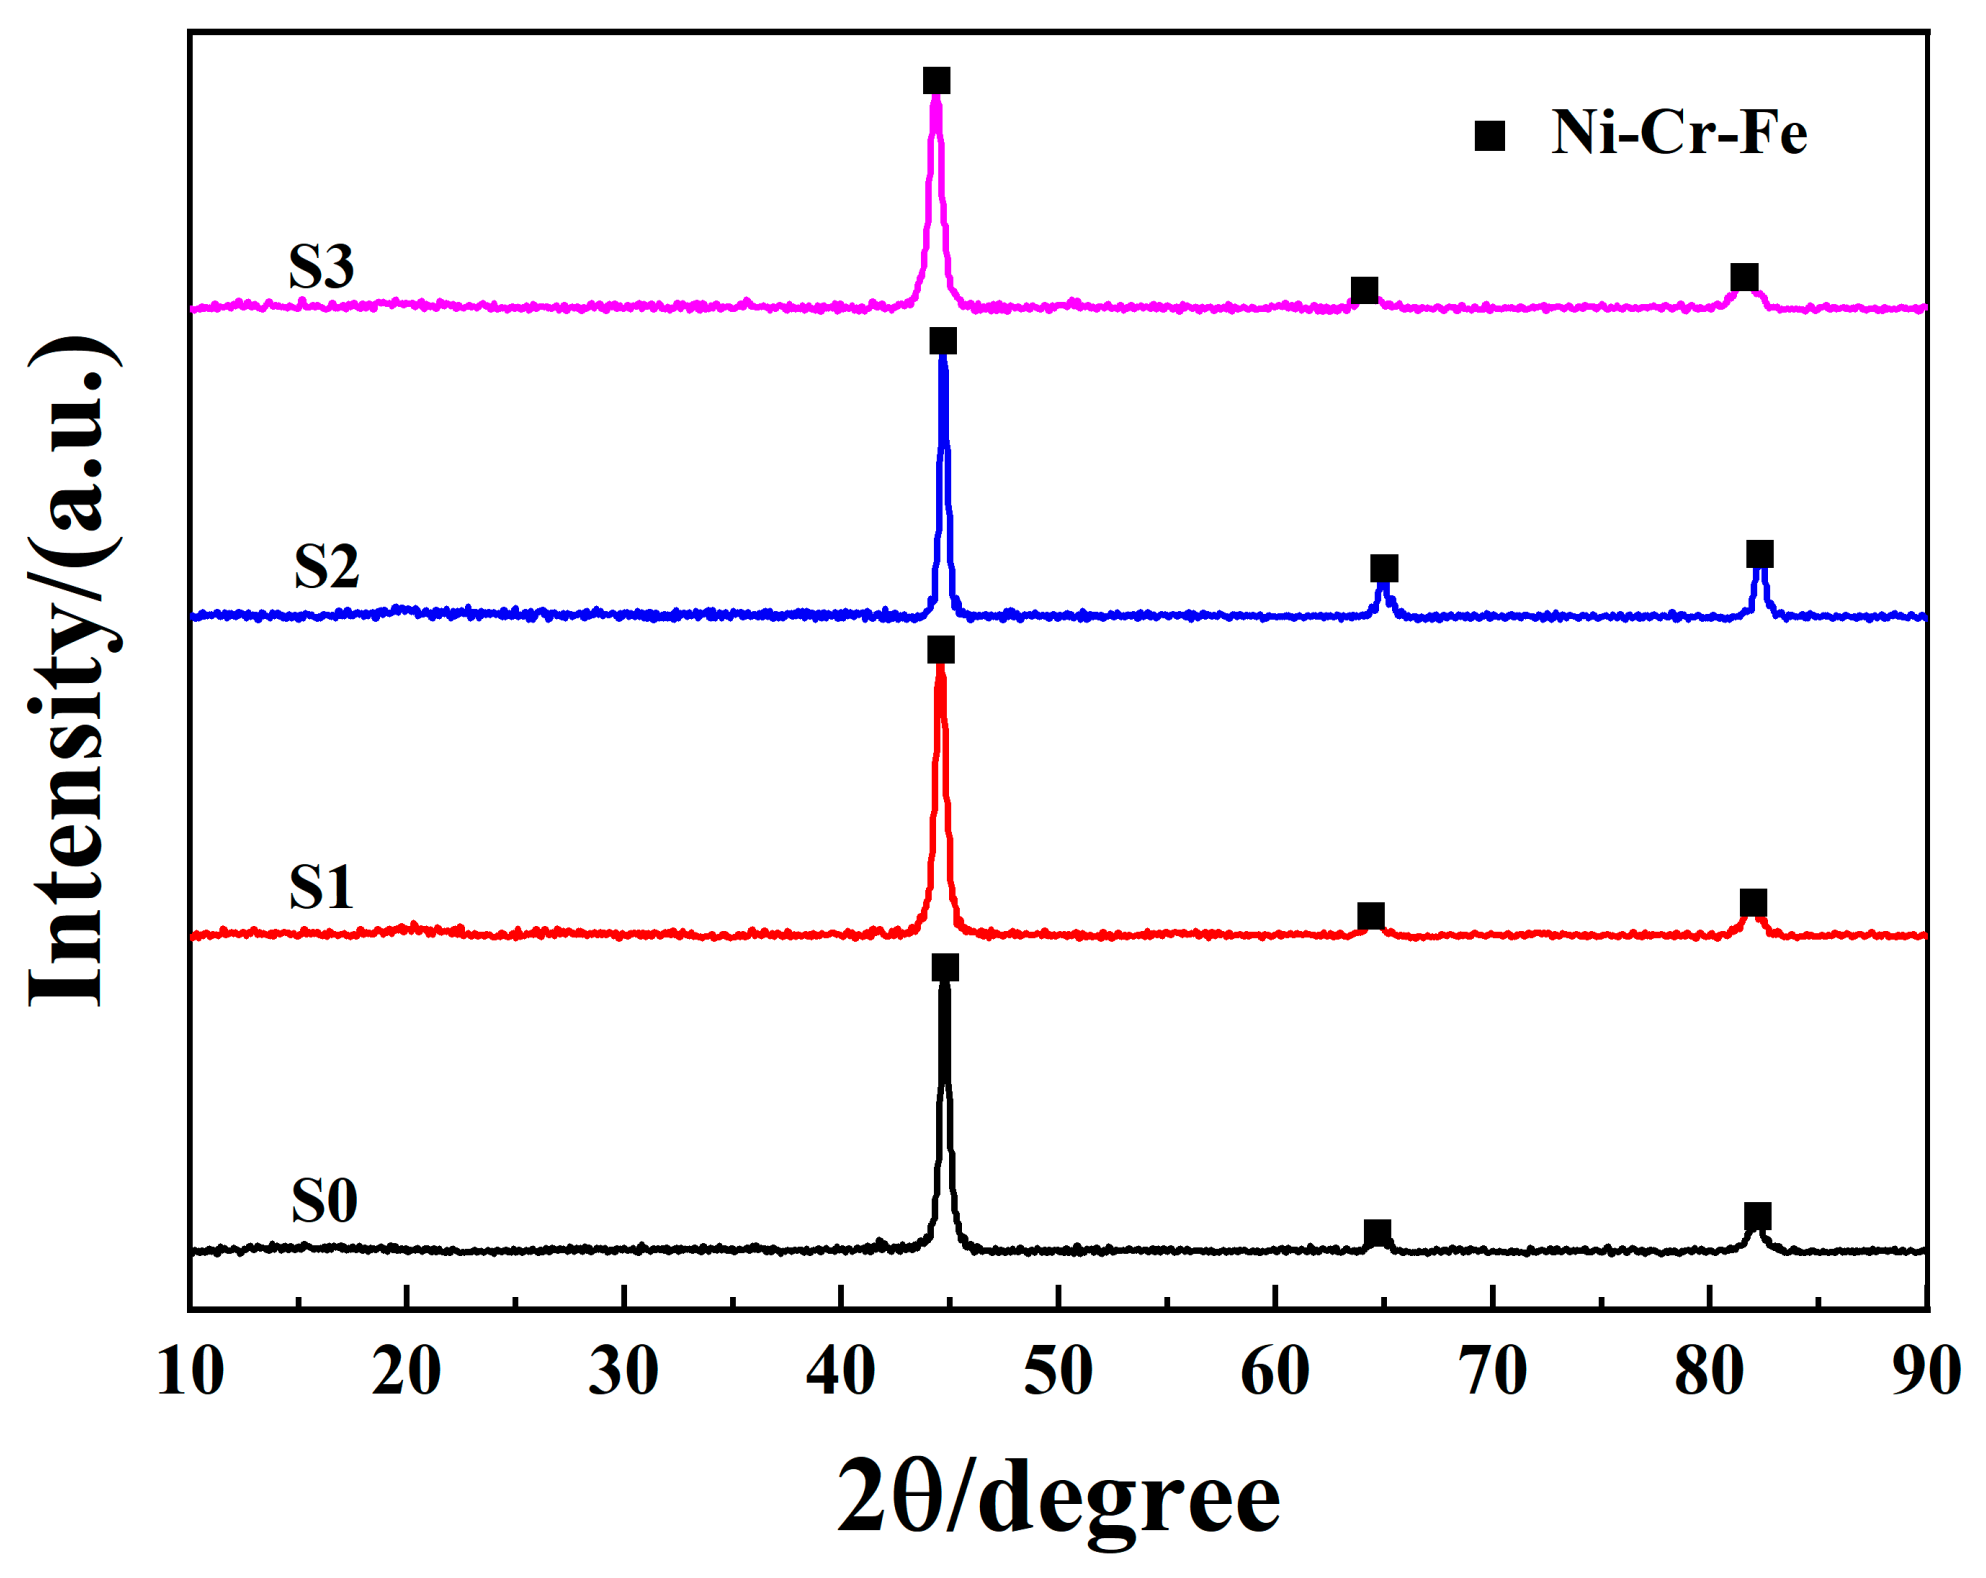
To investigate the effect of Y2O3 content on the evolution mechanism of microstructure of coatings, microphotos of the top, middle, and bottom parts of coating cross-section of samples were taken with an SEM, and the microphotos were then analysed. Figure 3 shows the microphotos of the top, middle, and bottom parts of coating cross-section of different samples taken with an SEM. It can be discerned that after Y2O3 is added, the coatings are free of defects and have better shaping quality. Figure 3a,d,g,j are the SEM images of top part of coating of the samples, and it can be seen that the top parts of coating are basically composed of cellular crystals. Figure 3b,e,h,k are the SEM images of the middle part of the coating of the samples, and it can be seen that the middle parts of coating are basically composed of columnar crystals, whose direction is basically perpendicular to the bottom of the cladding layer. Figure 3c,f,i,l are the SEM images of the bottom part of coating of the samples, and it can be seen that some crystals in the bottom parts of the coating are broken and the breakage phenomenon is more evident in the samples with Y2O3 added. Because the energy density of the laser beam follows the Gaussian distribution in the experiment, the temperature exhibits a diffusive distribution in the direction from the coating top to the substrate. The microstructure of coating typically depends on the temperature gradient (G) at solid–liquid interface and the solidification rate (R) of liquid at the interface [24]. In the experiment, the ratio of temperature gradient to solidification rate of liquid at interface (G/R) increases gradually in the direction from the coating top to the substrate. In the top part of coating, the melt liquid comes into contact with external air and then cools down, so the G/R value is the smallest, with dense cellular crystals generated. In the middle part of the coating, the temperature gradient of melt liquid becomes gentle, the G/R value increases, and the crystals grow in the direction perpendicular to the solid–liquid interface (that is, the direction with the quickest heat dissipation), forming columnar crystals. The cause is that the stirring by laser and the floating of unmolten particles lead to enlargement of crystal nuclei and further refinement of crystalline grains [24]. In the bottom part of the coating, the G/R value is the largest, and it can be discerned from Figure 3f,i,l that the added Y2O3 breaks the growth of crystals, having an effect of refining the microstructure. The causes of such effect are as follows: First, Y2O3 is a rare earth element oxide, with large grain size and high density (5.03 g/cm3), and the Y2O3 is mostly distributed in the middle and lower parts of melt liquid in general, so the refinement effect is more evident in the middle and lower parts of the coating. This can also interpret why there is a molten undiffused Ti element distributed in the upper part of coating of samples S0 and S1. Second, in the process of the experiment, unmolten rare earth element is enriched in the frontier of crystal boundary, inhibiting the growth of microstructure [25]. Such a behaviour decreases the Gibbs free energy of the system, further reducing the driver for crystallization in the system, thus causing the crystal growth to be broken. Third, in the nucleation process, crystal nuclei are formed with priority to attaching to Y2O3, and they, as new heterogeneous crystal nuclei, continue to crystallize, so the nucleation rate is increased, and refining grains can be realized. When the Y2O3 content is increased, the size of grains in the bottom part of coating does not lessen continuously, so there are air pores occurring in the bottom part of coating of sample S0 and the dendritic crystals in the bottom part of coating of samples S1 and S3 are not fully broken. The above indicates that when the Y2O3 addition amount is 2% (sample S2), the dendritic crystals in the bottom part of coating are fully broken, and there are no air pores in the cladding layer, so the microstructure refinement effect is evident.

3.1.3. XRD Phases

To explore the effect of Y2O3 content on the phase composition of coatings, XRD analysis was carried out with an XRD. Figure 4 shows the XRD results of the samples with different Y2O3 addition amounts. It can be discerned that the added Y2O3 does not change the phase composition of coating, which is Ni-Cr-Fe austenite phase and that the diffraction peaks are very sharp, indicating a good crystallinity of the coating. The main diffraction peak of the Ni-Cr-Fe austenite phase occurs at 44.5°, and its width does not increase with the increase in Y2O3 content. The diffraction peaks of sample S2 at 65.0° and 82.4° are wider than those of other samples, and it is inferred that the rare earth oxide added at a proper amount has grain refinement effect. In addition, the intensities of diffraction peaks of sample S2 are higher than those of diffraction peaks of other samples, and it is inferred that the volume fraction of the precipitating Ni-Cr-Fe austenite phase in sample S2 increases, relative to other samples. The reason why Y2O3 is not detected may be as follows: Y2O3 is a rare earth element oxide, and the atoms after decomposition have large radii (the Y atom radius is 162 pm), with small solubility in the coating, so the atoms are hard to be detected by XRD [26]. In addition, the content of Y2O3 in the samples is very low (1%–3%) and X-ray diffraction is not sensitive enough for diffraction identification of samples in this range, when there are also sharp and intense diffraction peaks of Ni-Cr-Fe leading to Y2O3 that cannot be detected due to the relative intensity being too low.

3.2. Microhardness and Friction and Wear

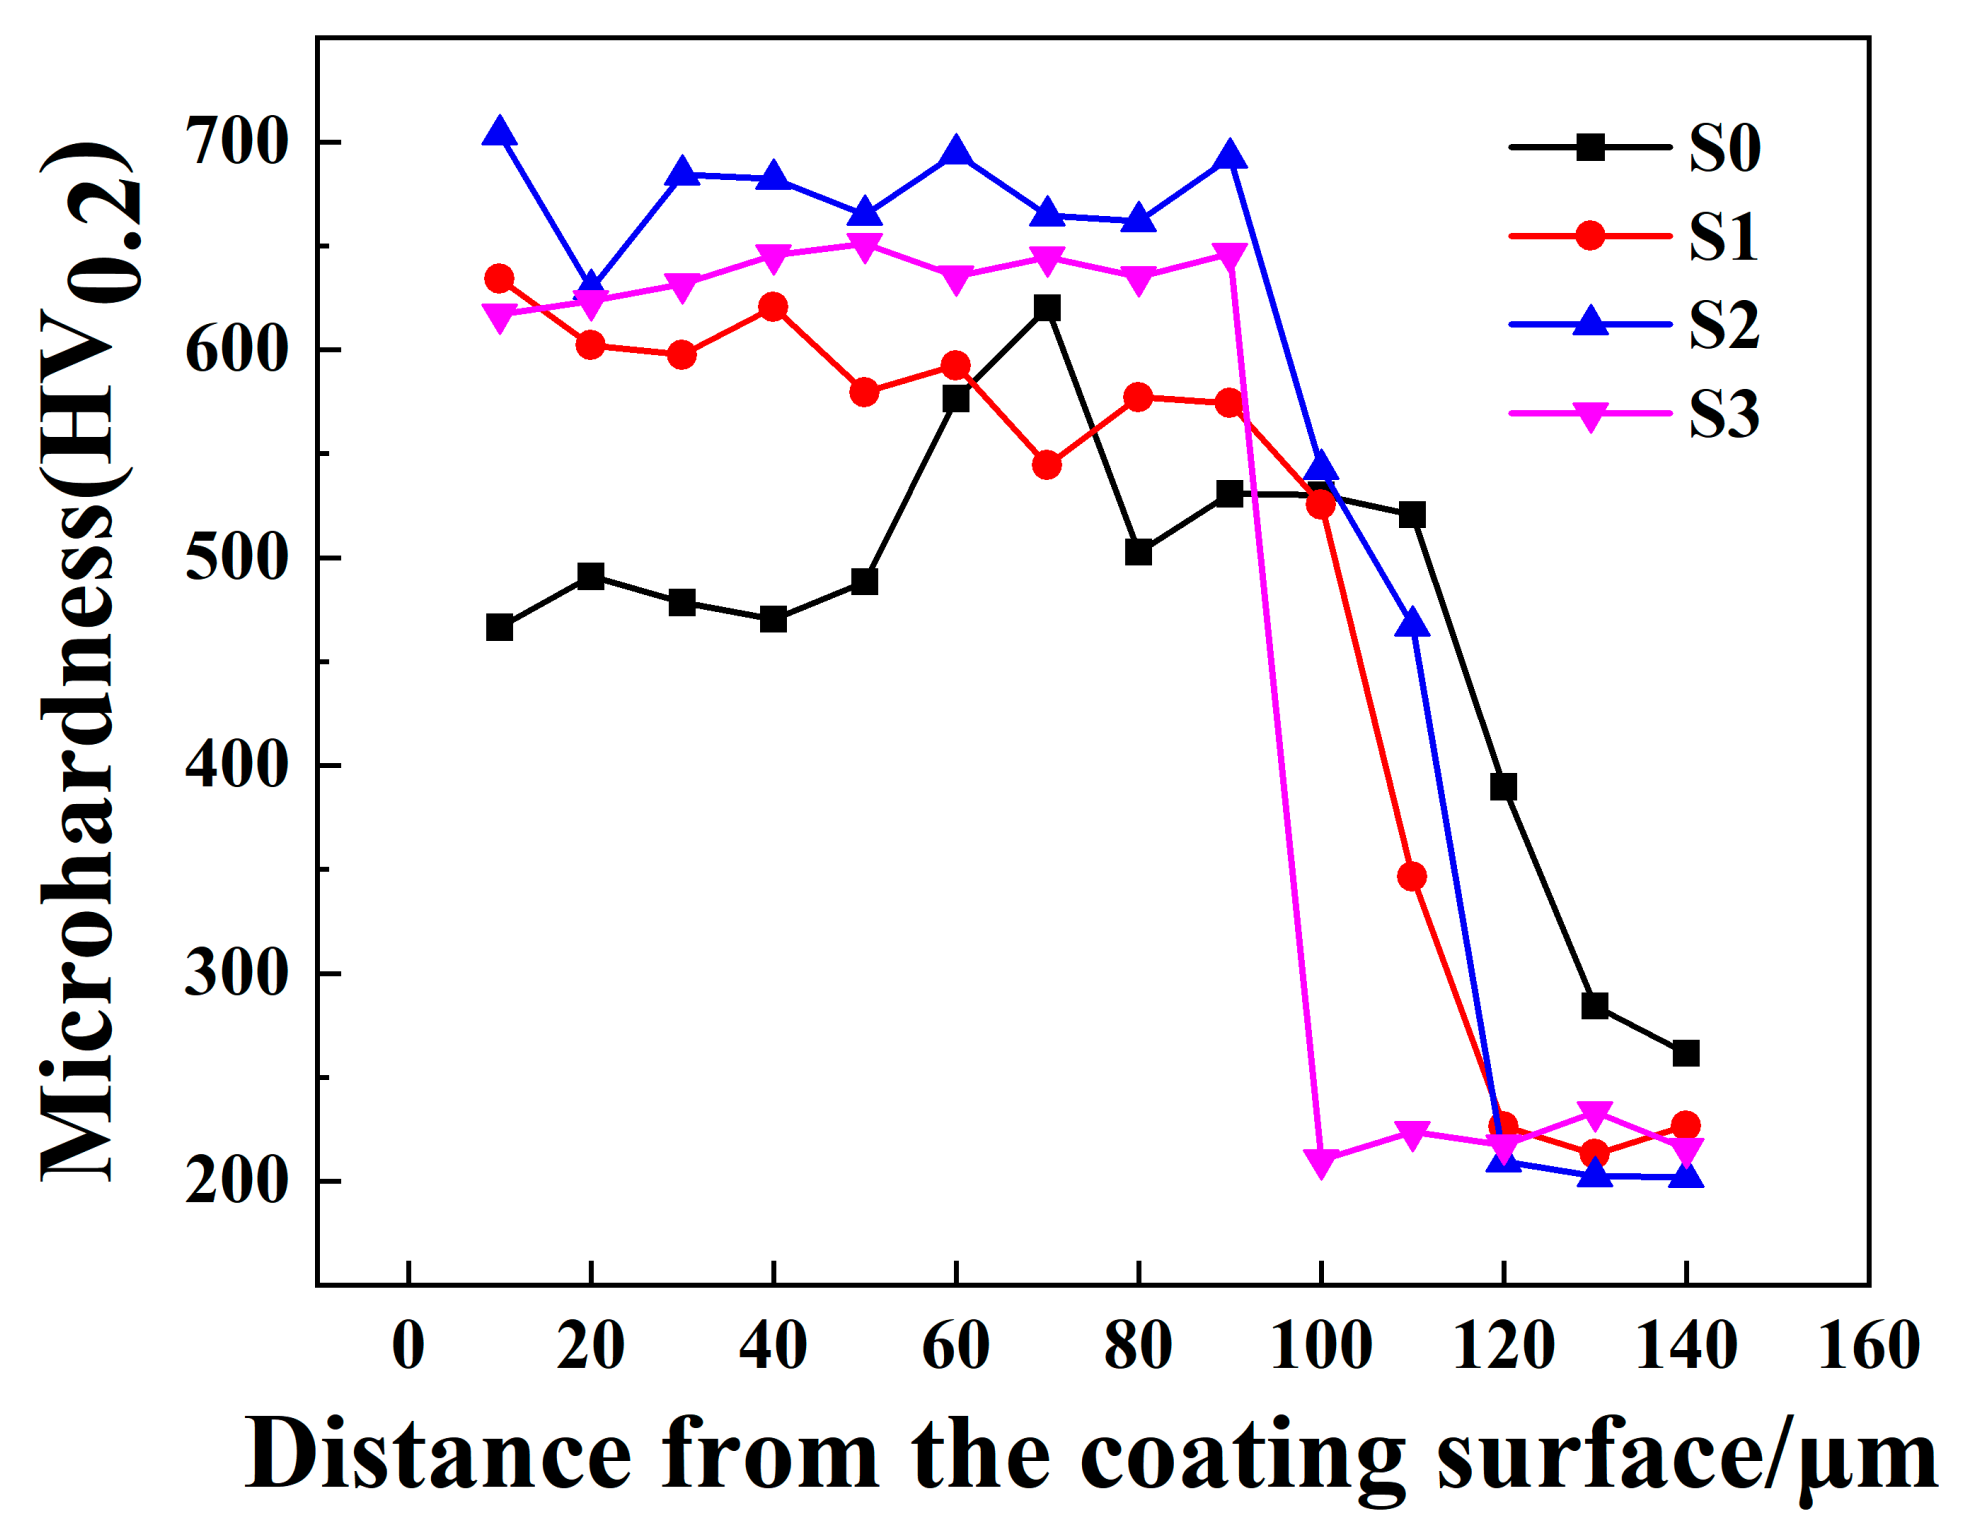
3.2.1. Microhardness

To investigate the effect of Y2O3 content on coating hardness, the Vickers hardness values of the samples were tested. Figure 5 shows the microhardness change curve of cross-section of the samples in the direction from the coating top to the substrate. As can be discerned from Figure 5, all samples S1, S2, and S3 exhibit evident increase in coating microhardness, compared with sample S0. The coating microhardness of sample S2 is as high as 703.43 HV0.2, which is approximately 3.7 times that of the substrate (190 HV0.2). The coating microhardness of sample S3 reaches 651.07 HV0.2, which is approximately 3.4 times that of the substrate. The coating microhardness of sample S1 is 634.07 HV0.2, which is approximately 3.3 times that of the substrate. The results indicate that all coatings exhibit hardness increase after cladding, and the coatings with Y2O3 added exhibits more evident hardness increase. The reason is that Y2O3 can result in fine grain strengthening and dispersion strengthening [20]. Furthermore, the microhardness exhibits a small fluctuation amplitude in coatings with Y2O3 added, indicating that the added Y2O3 can also uniform the microstructure.
It can be evidently found from the figure that, at a position that is 100 μm from the top of cladding layer, the hardness of the sample without Y2O3 added is as high as 620.07 HV0.2. According to Figure 2, the element distribution diagrams of cross-section of samples based on energy spectrum analysis, it can be discerned that there is element Ti enriched in the top part of coating, and it is inferred that the molten TiC residues are the cause of the sudden increase in hardness of the coating without Y2O3 added.

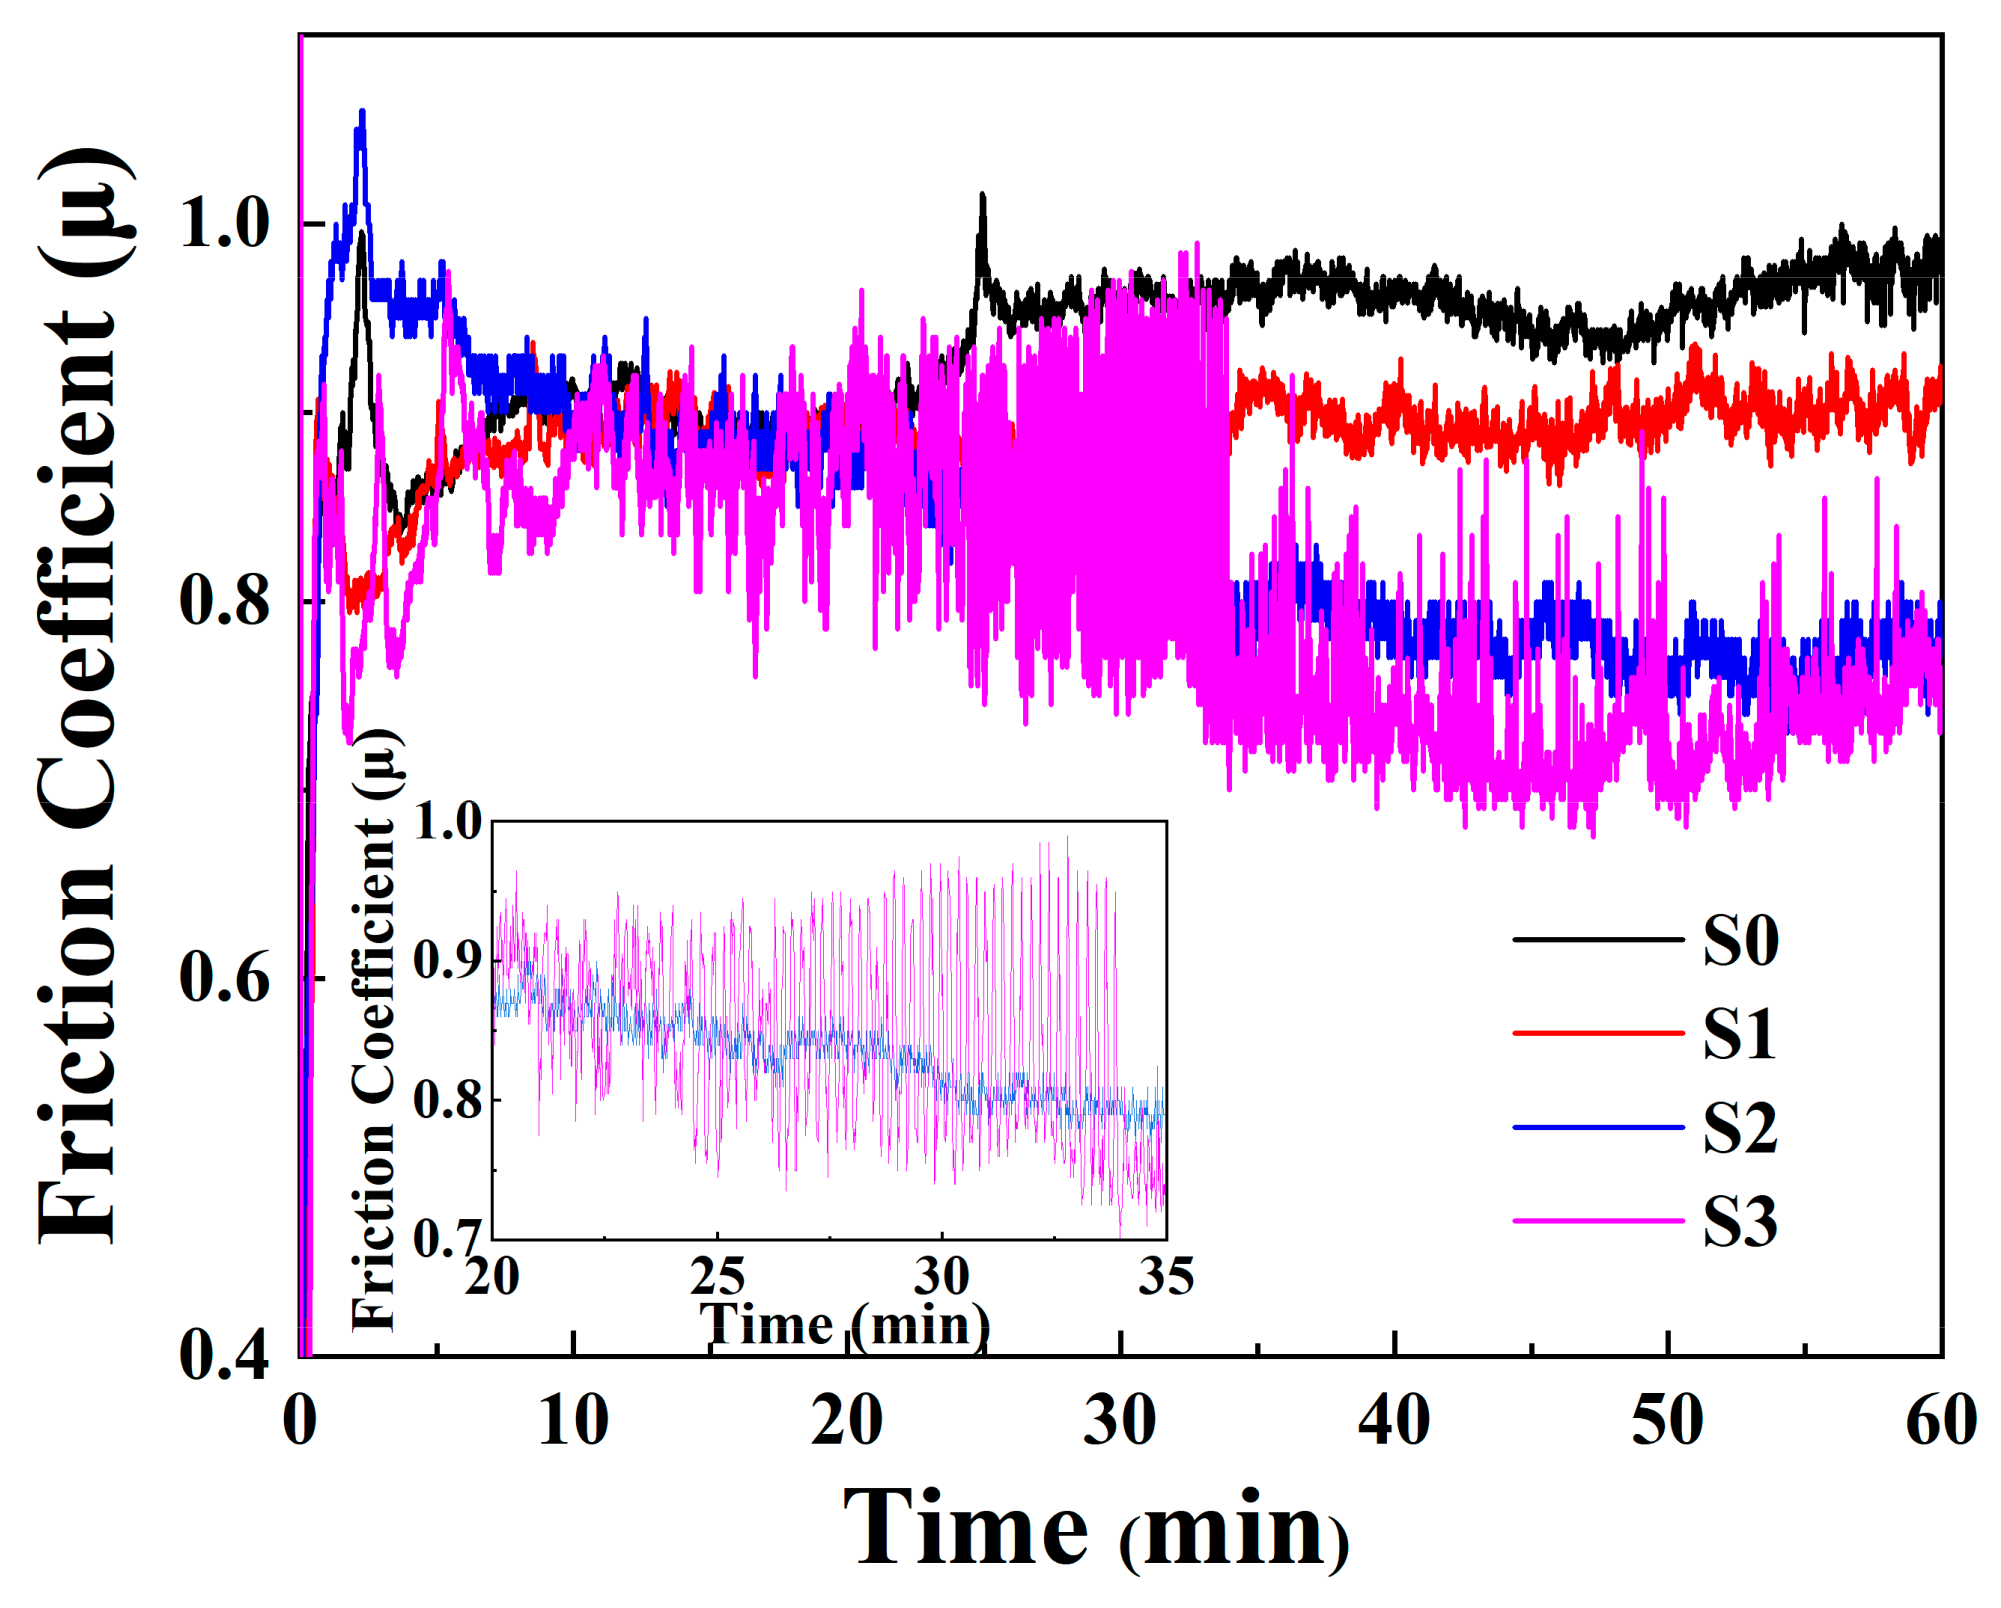
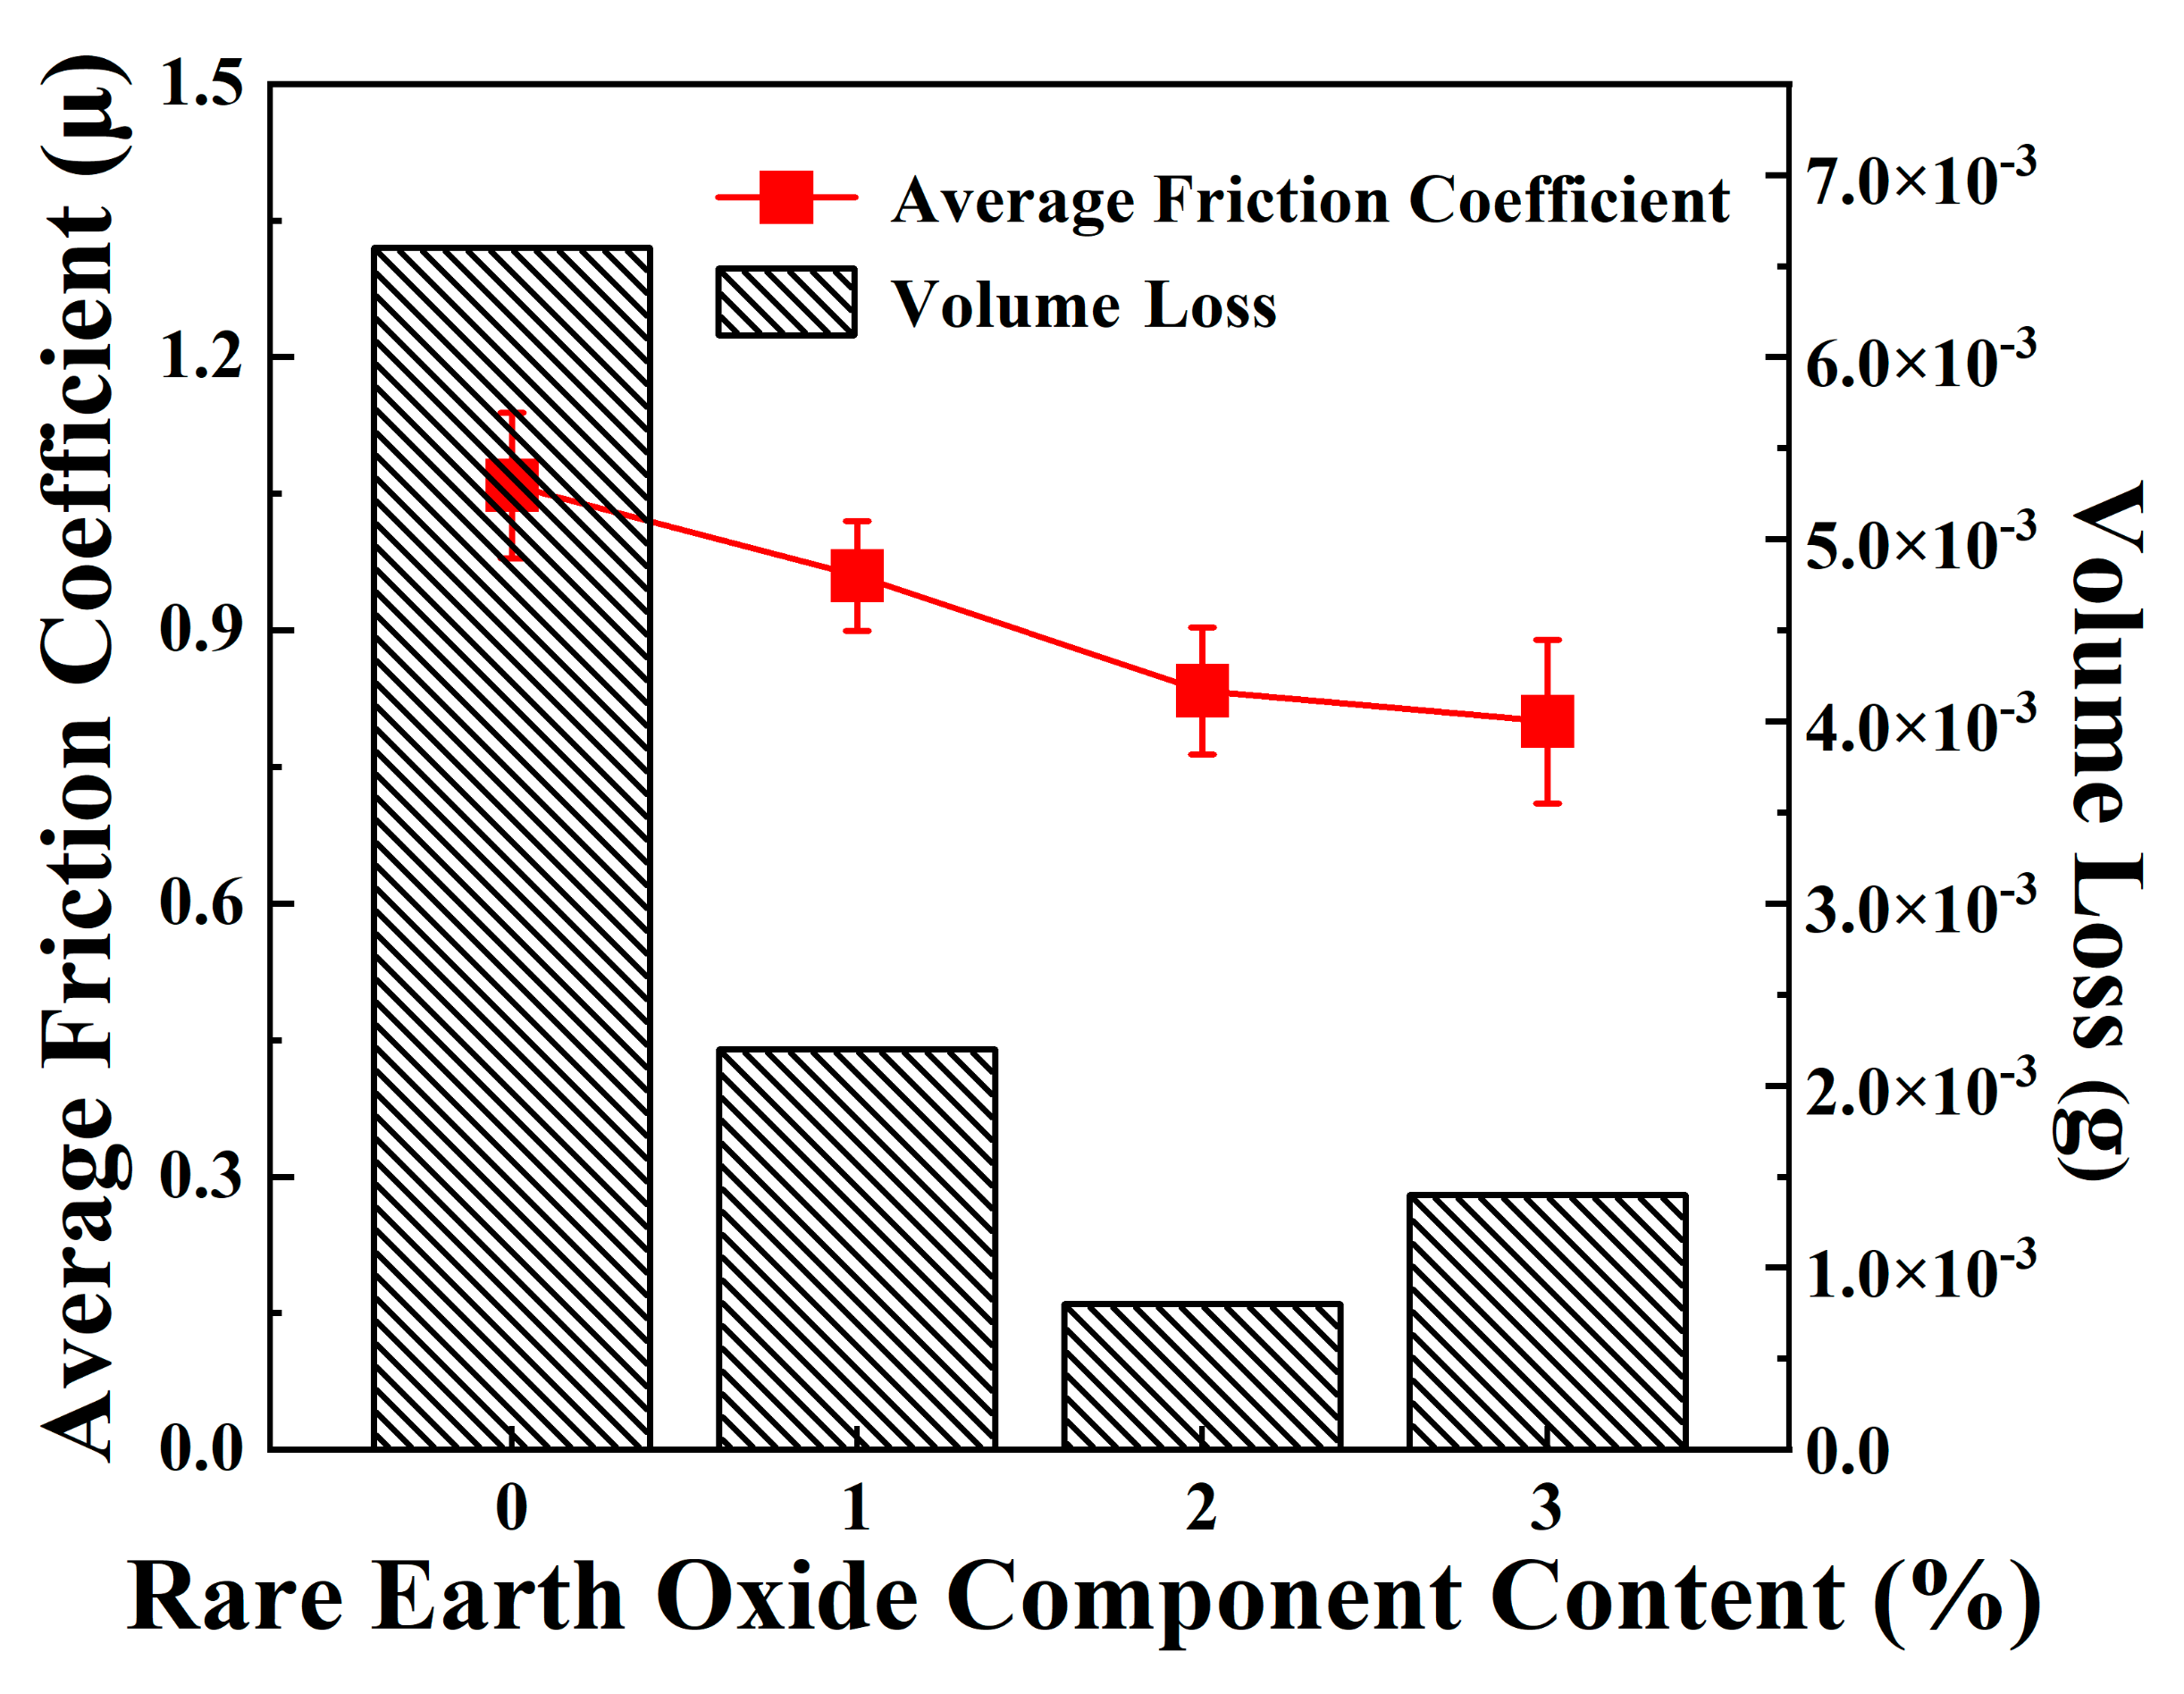
3.2.2. Friction and Wear

To explore the effect of Y2O3 content on the wear resistance of coatings, the samples underwent friction and wear test. Figure 6 shows the frictional coefficient curves over time of coatings with different Y2O3 addition amounts. There is dry sliding between frictional pairs and coating, so the frictional coefficient curve fluctuates largely in the first 20 min. Comparison shows that the added Y2O3 dramatically reduces the frictional coefficient of the coatings. The frictional coefficient curve of coating of sample S0 exhibits an ascending trend with a small range of fluctuation in a duration of 60 min, and the frictional coefficient fluctuates in the range of 0.8–1.0. The frictional coefficient curve of the coating of sample S1 exhibits a stable trend, with frictional coefficient fluctuating around 0.9. The frictional coefficient curve of the coating of sample S2 exhibits a descending trend, with frictional coefficient finally stabilized around 0.8. The frictional coefficient curve of coating of sample S3 fluctuates severely in the range of 0.7–1.0, and the reason may be that element Y has a good activity and the added excess Y2O3 may result in the formation of many inclusions, thus reducing the wear resistance [27].
Figure 7 shows the average frictional coefficient values and wear loss values of coatings with different Y2O3 addition amounts. It can be seen that the coatings with Y2O3 added exhibit significant decrease in wear loss, showing good wear resistance. The coating of sample S3 has the lowest mass loss, which is 0.008 g. The microhardness of coating is inversely proportional to the mass wear loss of coating, which is consistent with the classical Archard’s wear law [28]. The hardness of coating material is directly proportional to the wear resistance of coating. The higher the hardness of coating material is, the better the wear resistance of the coating will be. It is found from the comprehensive microhardness and friction and wear tests that when the Y2O3 addition amount is 2% (sample S2), the sample has the best wear resistance.

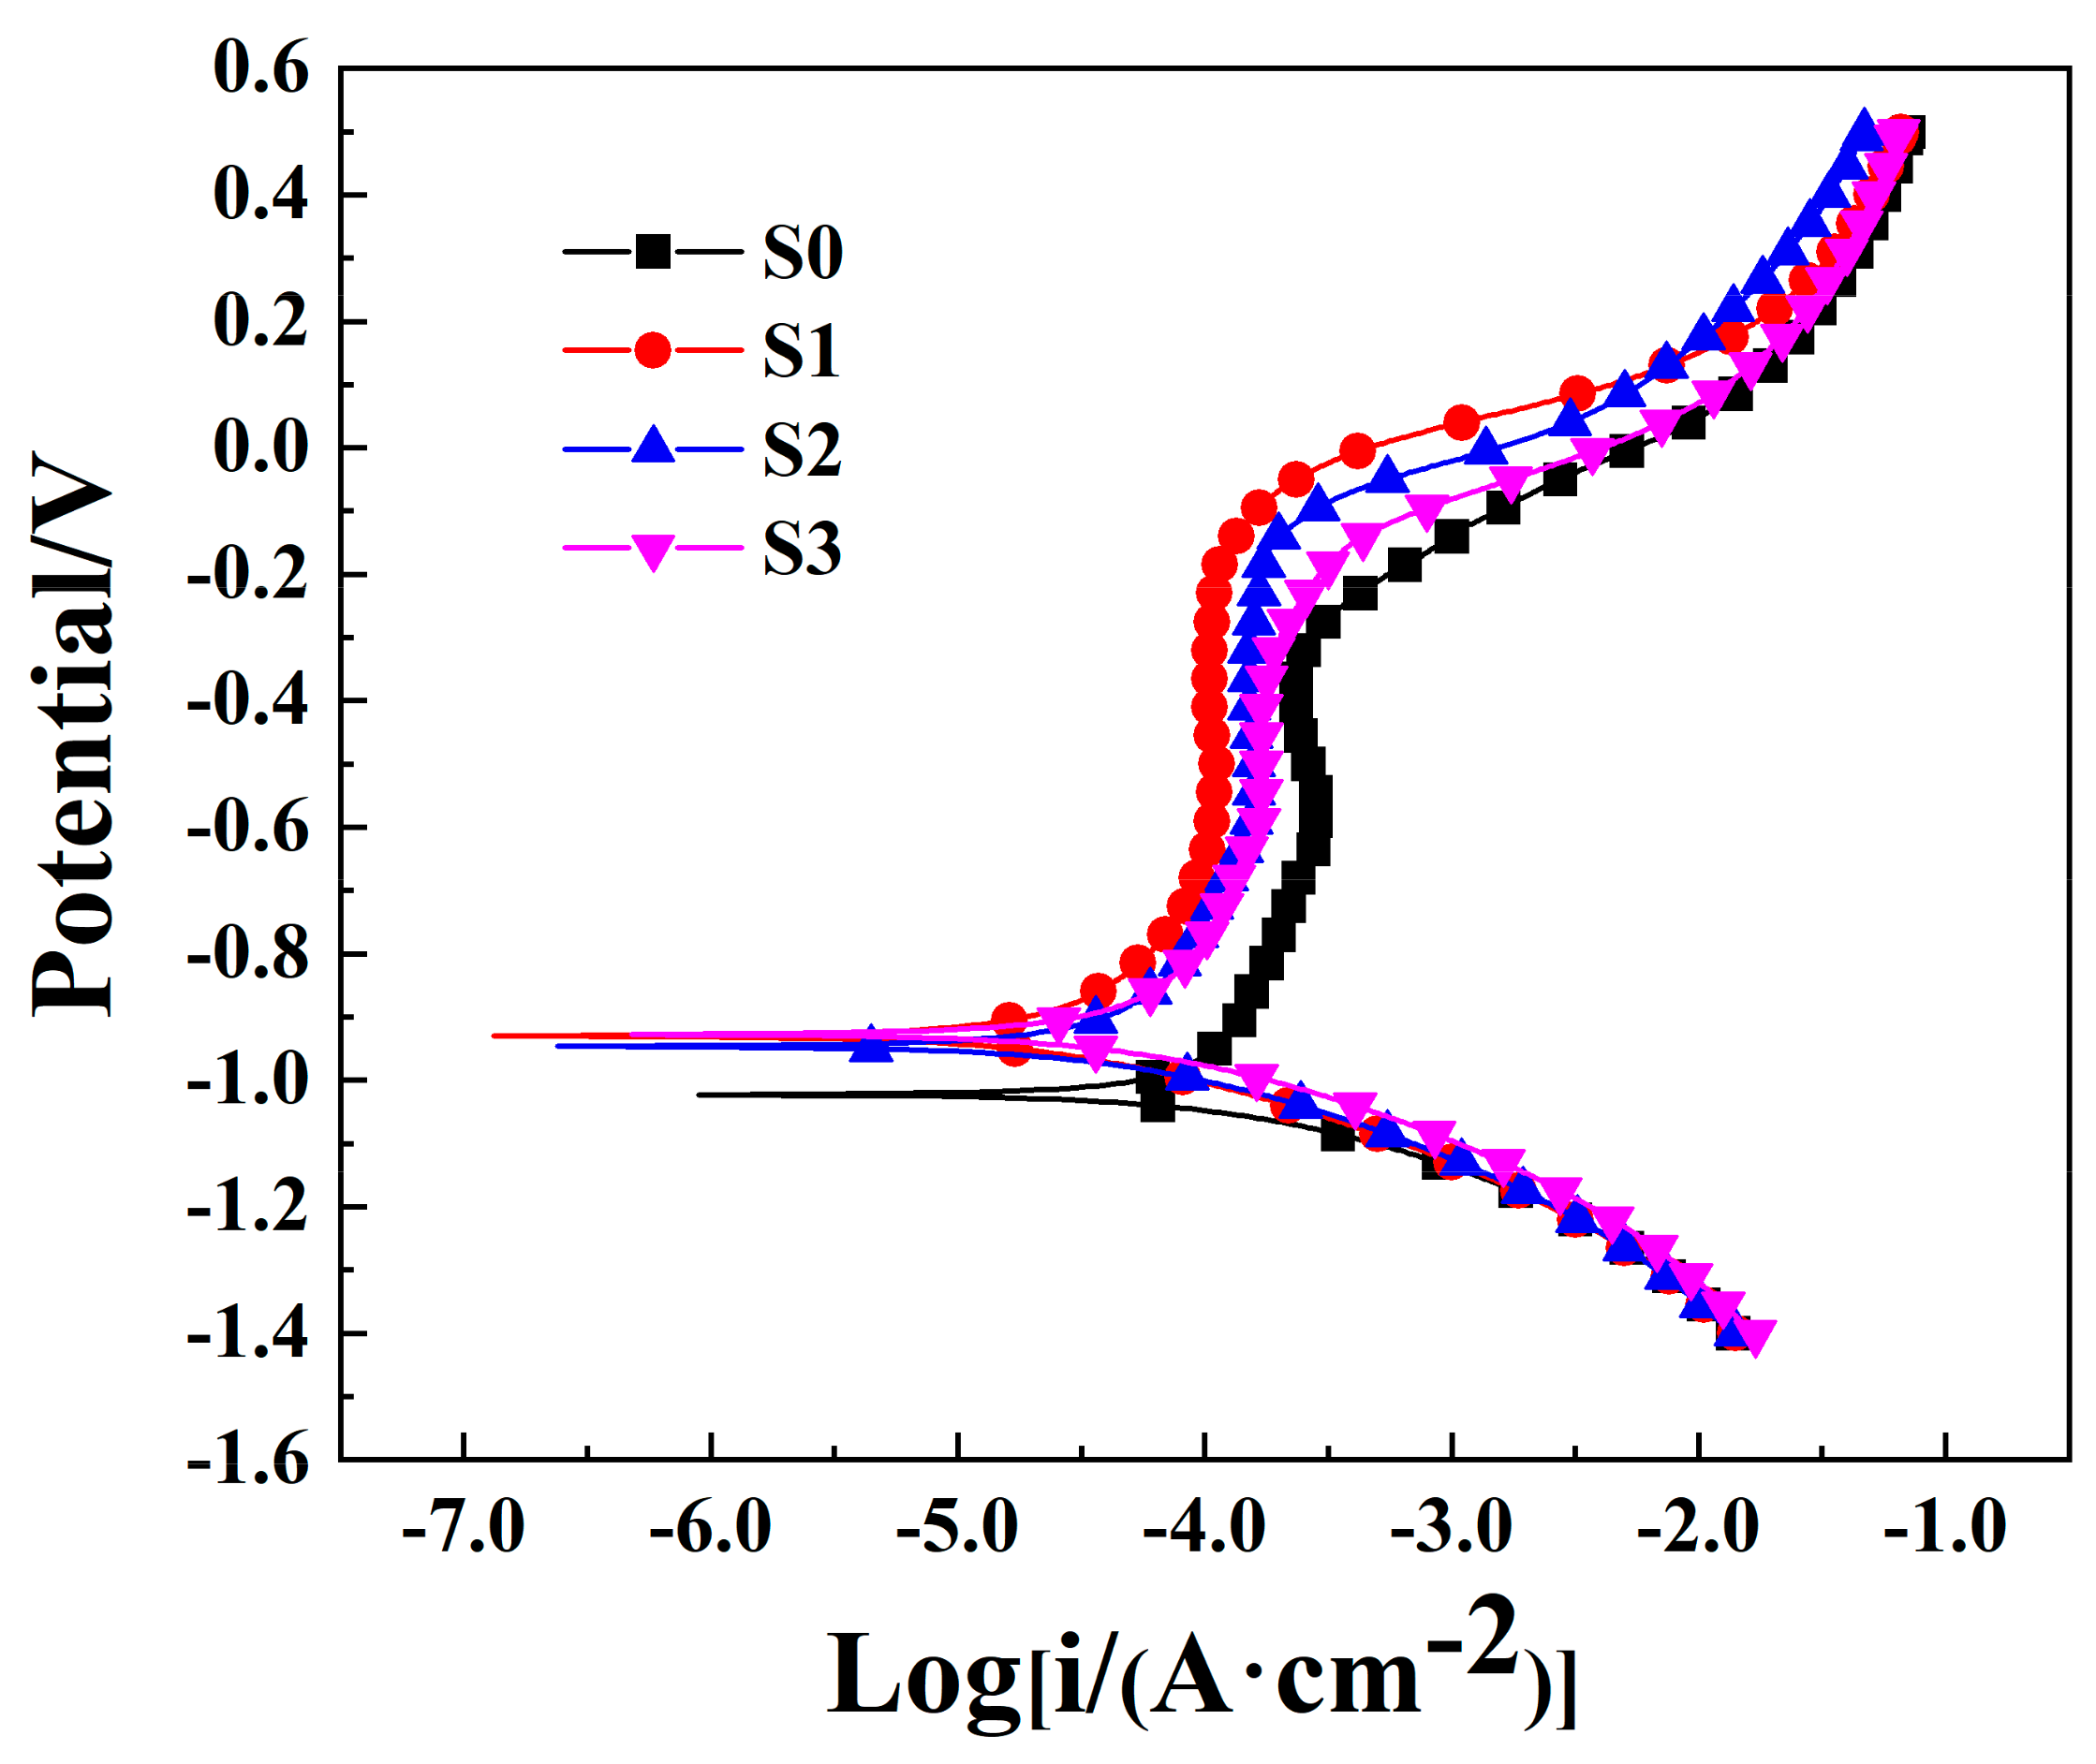
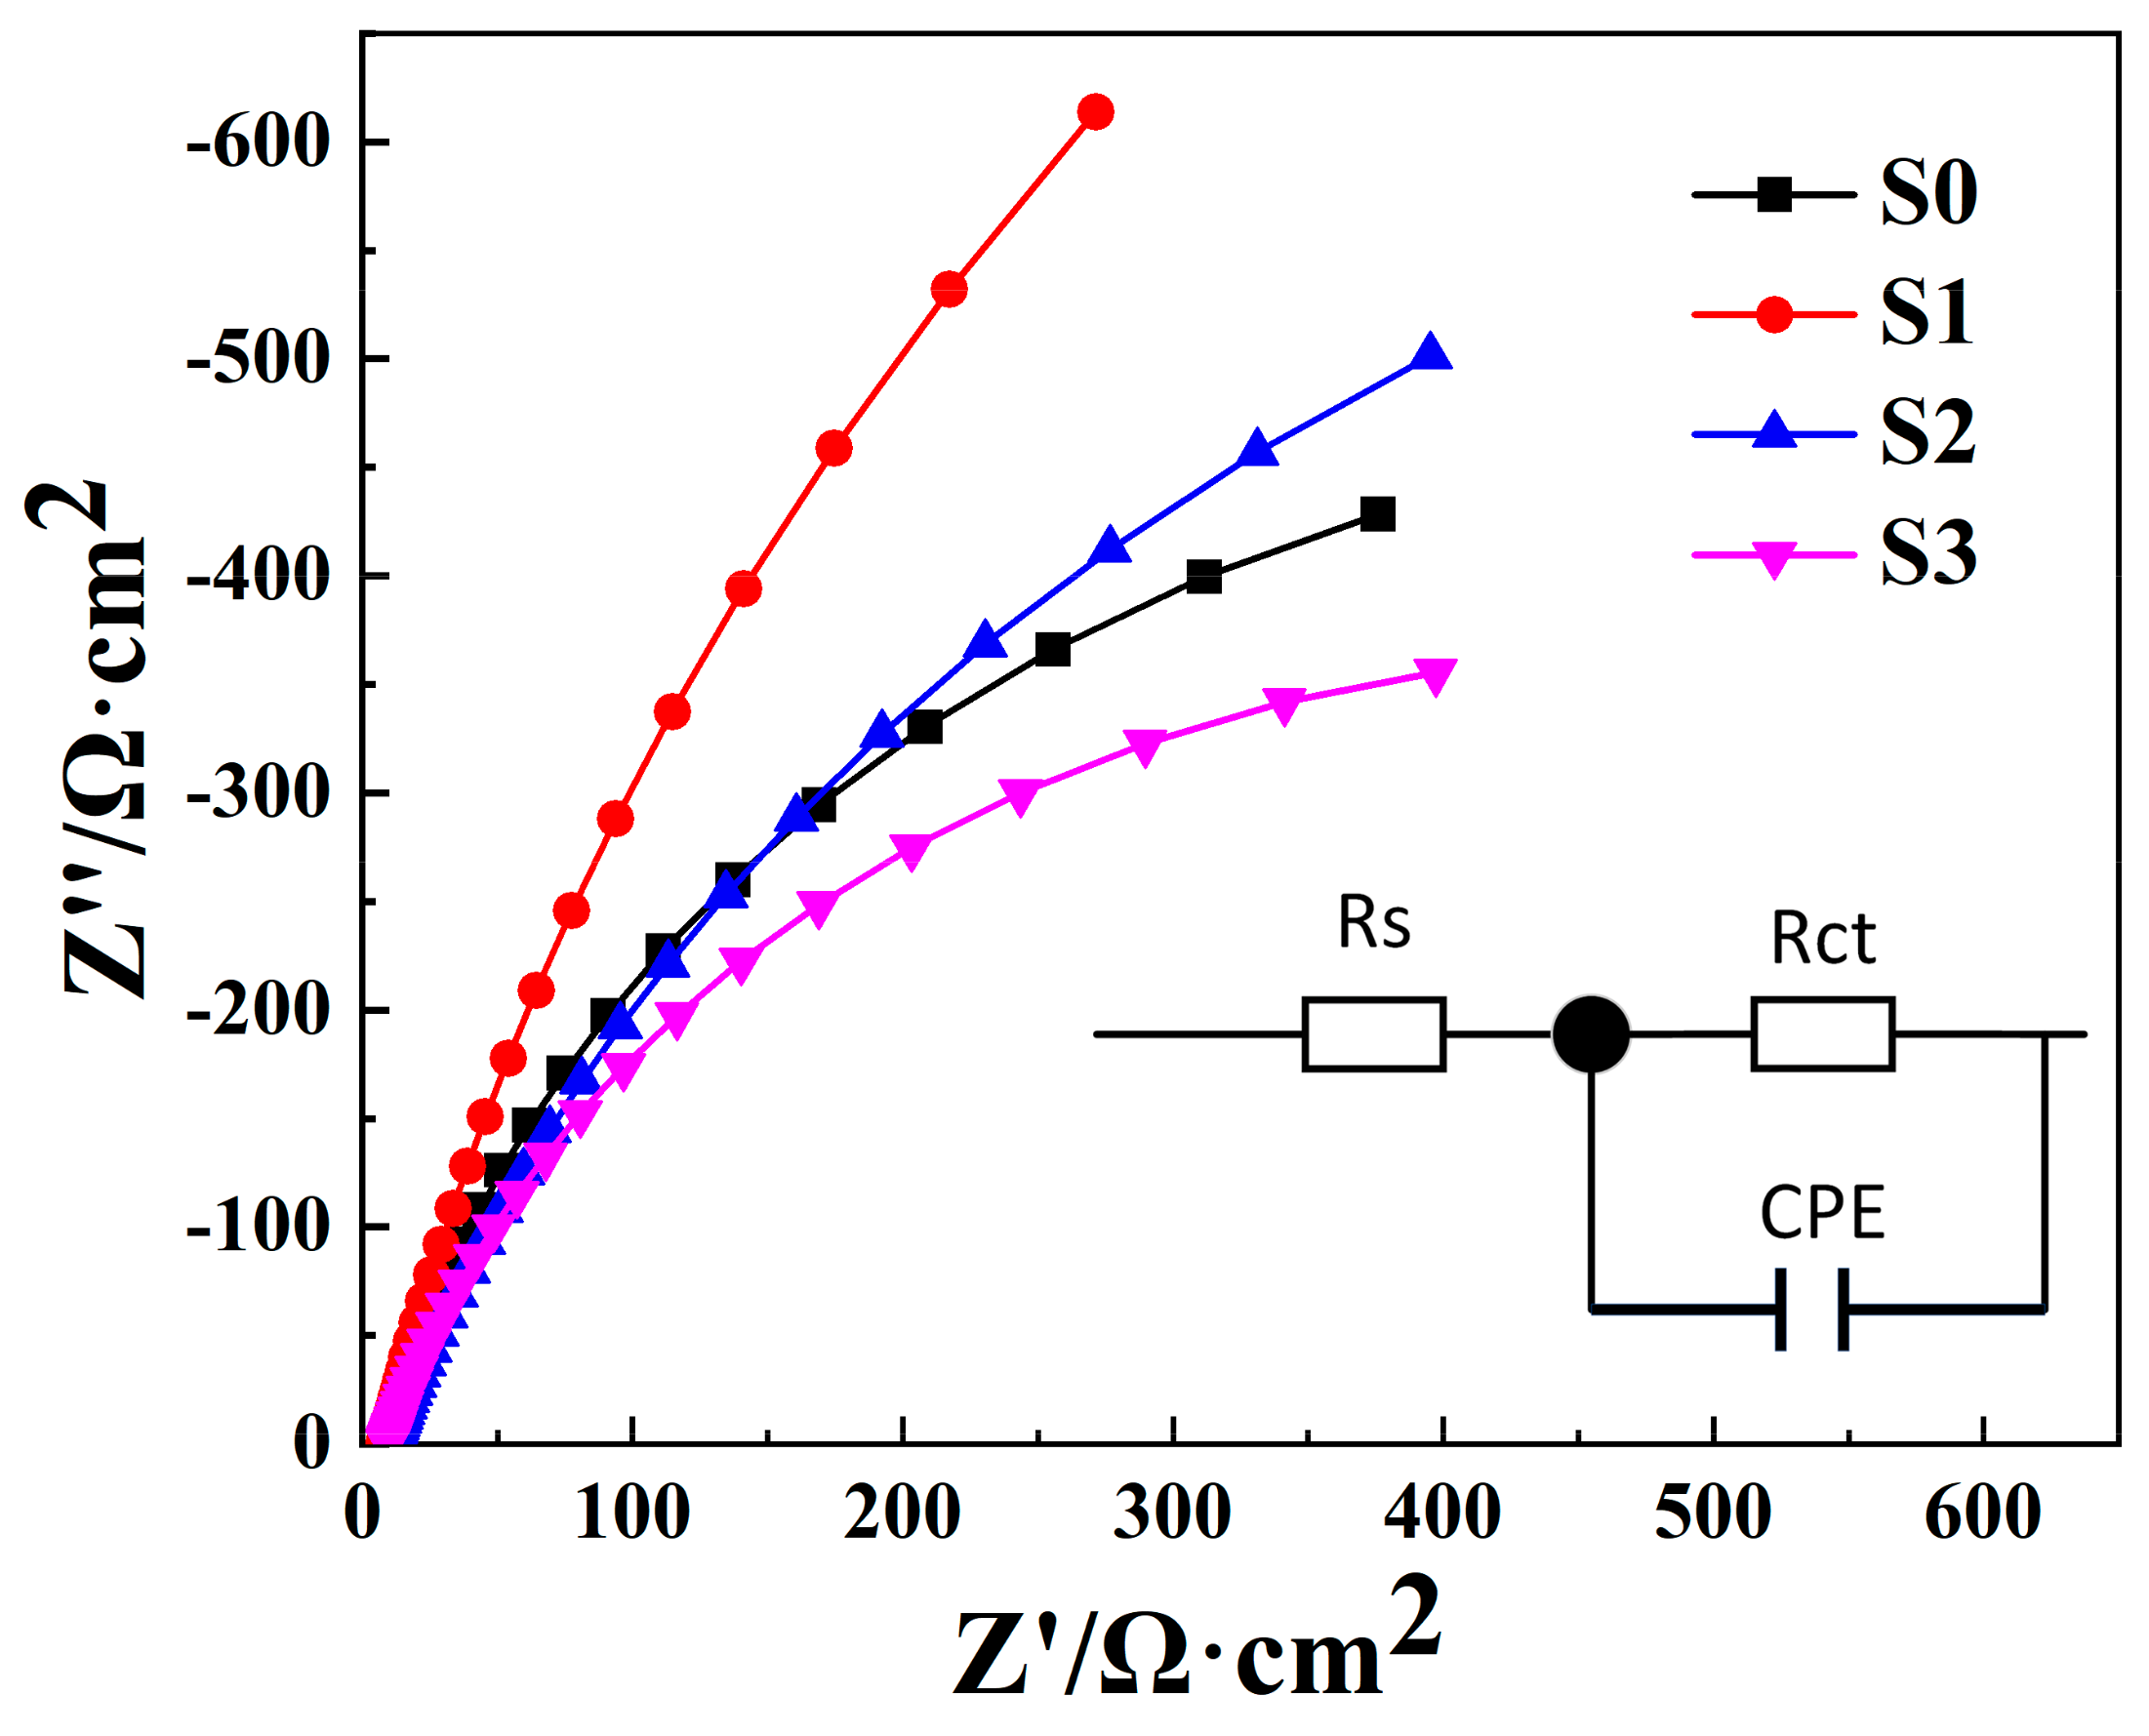
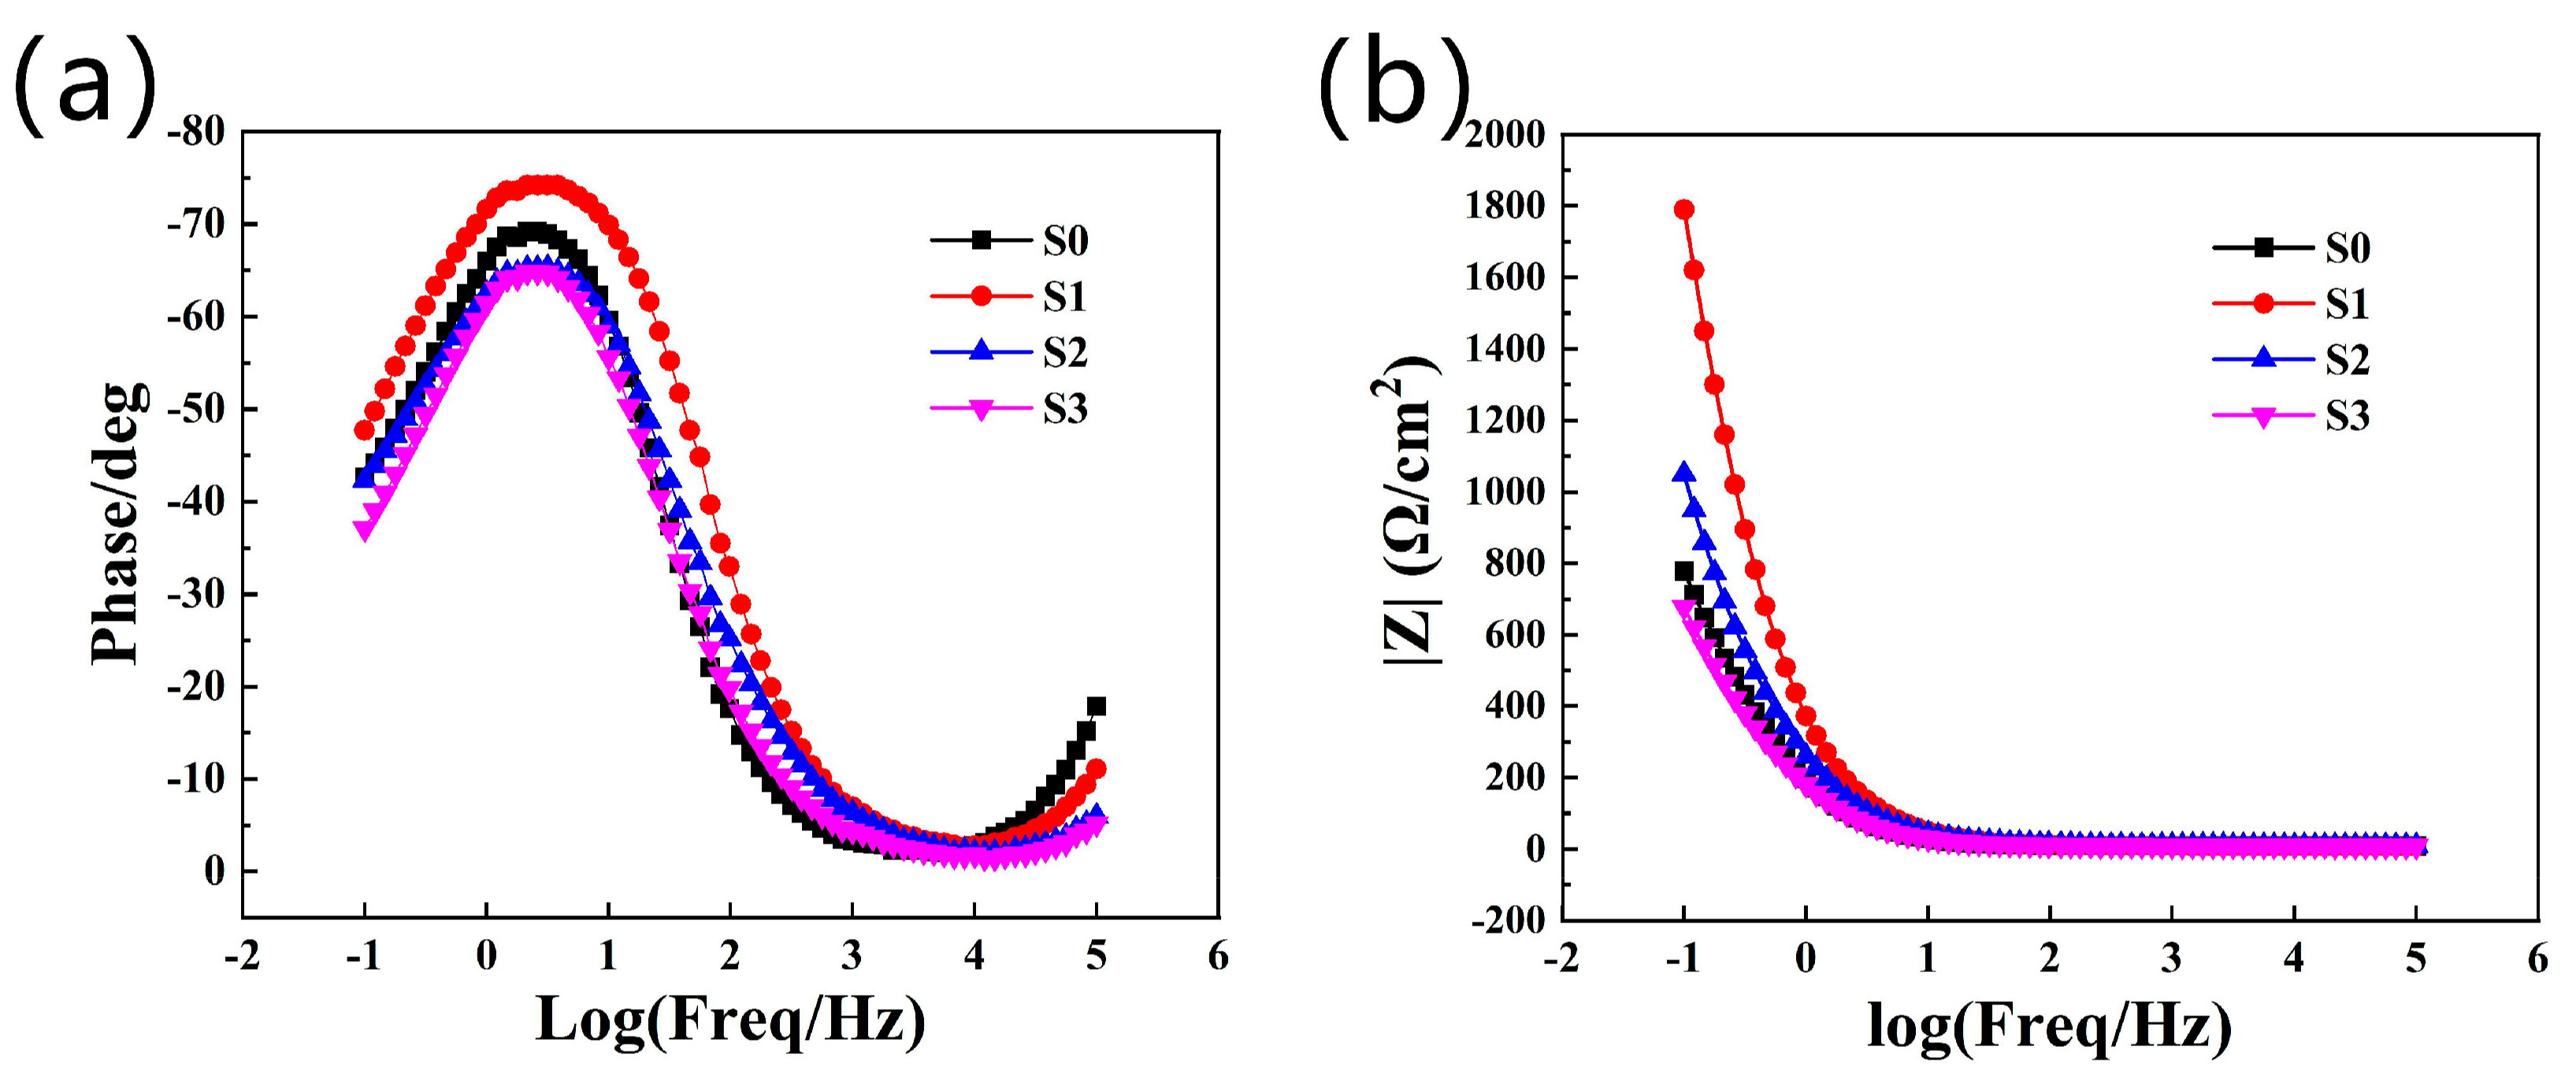
3.3. Electrochemical Corrosion Test

To investigate the effect of Y2O3 content on the corrosion resistance of coatings, the samples were put into 3.5wt% NaCl solution to undergo electrochemical test. Figure 8 shows the potentiodynamic polarization curves of samples with different Y2O3 addition amounts in NaCl solution with mass fraction of 3.5wt%. Thin chromium-oxide film is easily formed on the surface of 316 L austenitic stainless steel [29], which is present as a passivated zone in Figure 8. Previous studies have indicated the improvement in corrosion resistance with laser surface treatment of austenitic stainless steel [30]. After the TiC hard phase is introduced, the size of passivated zone of coating basically remains unchanged for samples S1–S3, the corrosion potential increases and the corrosion current density decreases, indicating that the coatings with Y2O3 added have some resisting effect on chloride [31].
Table 5 shows the corrosion potential and corrosion current density of samples calculated using the Tafel extrapolation method. Both corrosion potential and corrosion current density jointly determine the corrosion rate, which marks the corrosion degree of material. Corrosion potential: S1 > S3 > S2 > S0; corrosion current density: S0 > S3 > S2 > S1. Comparison shows that the added Y2O3 can change the corrosion potential and corrosion current density of 316/TiC coating in neutral salt solution. The reason may be that Y2O3 has a microstructure refinement effect, making the coating generate denser oxide film, thus slowing down the galvanic interaction in the electrolytic cell and achieving improvement of corrosion resistance. According to the Nyquist curves (Figure 9), each sample exhibits a single capacitive reactance arc in the solution. The larger the capacitive reactance arc diameter is, the greater the capacitive impedance will be, and the better the corrosion resistance will be [32]. When the Y2O3 addition amount is 1% (sample S1), the sample has high corrosion potential (−0.925 V) and low corrosion current density (2.014 × 10⁻⁵A/cm2) and the capacitive reactance arc diameter is the largest, indicating that sample S1 has the best corrosion resistance.
Figure 10 shows the Bode plots of samples with different Y2O3 addition amounts in NaCl solution with mass fraction of 3.5wt%, where there is a primary constant. As can be seen from Figure 10a, sample S1 has the largest absolute value of phase angle of coating, which is ~75° higher than those of phase angle of coating of other samples. It can be seen from Figure 10b that sample S1 has the largest impedance of coating, which is ~1.8 × 10³Ω·cm2, evidently higher than the coatings of other samples. This indicates that the coating of sample S1 has the smallest corrosion rate, further demonstrating that sample S1 has the best corrosion resistance.
Electrochemical impedance spectra are for analysis of corrosion mechanism by measuring the impedance versus sine wave frequency, and are often used to characterize the corrosion resistance of coatings. The data underwent EIS spectral fitting with software, and the equivalent circuit diagram is shown in Figure 9, where Rs denotes the resistance of the solution, and Rct denotes charge transfer resistance. Since the surface roughness of metal cannot be neglected, a CPE long-phase-angle component is needed to substitute for the double-layer capacitor. There is n as a coefficient. When n is close to 1, it indicates capacitance. When n is close to 0, it indicates resistance. When n is close to −1, it indicates inductance. All calculated errors after fitting are less than 20%, and the fitting results are shown in Table 6. According to reference [33], the larger the Rct is, the better the corrosion resistance of coating. The closer to 1.0 the CPE-P is, the denser and evener the passivation film generated on the coating will be [34]. The Rct value of the coating of sample S1 is 3176 Ω·cm2, which is approximately 2.7 times that of coating of sample S0, and the CPE-P of sample S1 is the closest to 1.0, indicating that the sample with Y2O3 addition amount of 1% (sample S1) has the best corrosion resistance.
These analyses indicate that the added Y2O3 can improve the corrosion resistance of coatings. When the Y2O3 addition amount is 1% (sample S1), the sample has the best corrosion resistance.

4. Conclusions

The 316 L/TiC/Y2O3 composite coatings were fabricated on Q355B substrate surface using the laser cladding technology, the modification effects of trace Y2O3 on 316 L/TiC coating were investigated, and verification was carried out separately from the following aspects, i.e., microstructure, hardness, wear resistance, and corrosion resistance. The main conclusions drawn are as follows:
(1) The added Y2O3 does not change the phase of the coating, which is Ni-Cr-Fe austenite phase. The coatings with Y2O3 added are free of defects and have better shaping quality. The added Y2O3 can achieve control of the grain size in the middle and lower parts of coatings, causing the coating microstructure to be denser.
(2) When the Y2O3 addition amount is 2% (sample S2), the hardness is as high as 703.43 HV0.2, which is approximately 3.7 times that of the substrate, the frictional coefficient curve of the coating exhibits a stable descending trend with an average frictional coefficient of 0.83, and the coating mass loss is the lowest, 0.008 g. This indicates that the Y2O3 content of 2% has the most evident improvement effects on the hardness and wear resistance of coating.
(3) When the Y2O3 addition amount is 2% (sample S1), the sample has high corrosion potential (−0.925 V) and low corrosion current density (2.014 × 10⁻⁵ A/cm2) and the capacitive reactance arc diameter is the largest, indicating that the corrosion tendency is small and the corrosion rate is low. In the EIS, the Rct value of the sample with Y2O3 addition amount of 1% is 3176 Ω·cm2, which is approximately 2.7 times that of the sample without Y2O3 added, and the CPE-P is the closest to 1.0, indicating that the Y2O3 addition amount of 1% can evidently improve the corrosion resistance of the coating.

Author Contributions

Conceptualization, D.J. and W.S.; project administration, W.S.; formal analysis, H.Z., T.W., Y.D., K.L. and C.L.; validation, H.Z., K.L. and C.L.; investigation, H.Z., T.W. and Y.D.; writing—original draft preparation, D.J. and W.S. All authors have read and agreed to the published version of the manuscript.

Funding

This research was funded by National Natural Science Foundation of China, grant No. 62073089 and the Special Project for Key Fields of Higher Education in Guangdong Province, grant No. 2020ZDZX2061; The authors are also grateful for the support from Guangdong Provincial Key Laboratory of South China Sea Marine Ranch Intelligent Equipment.

Institutional Review Board Statement

Not applicable.

Informed Consent Statement

Not applicable.

Data Availability Statement

Not applicable.

Acknowledgments

The authors sincerely thank Wenqing Shi of Guangdong Ocean University for his supervisory work on this thesis.

Conflicts of Interest

The authors declare no conflict of interest.

References

  1. Ji, J.; Liu, H.; Yin, X. Evaluation and Regional Differences Analysis of the Marine Industry Development Level: The Case of China. Mar. Policy 2023, 148, 105445. [Google Scholar] [CrossRef]
  2. Zhou, X.; Yang, J.; Wang, W.; Xu, L.; Shi, Y. Mechanical Properties and Creep Strain of Q355 Cold-Formed Steel at Elevated Temperature. J. Constr. Steel Res. 2021, 180, 106577. [Google Scholar] [CrossRef]
  3. Wang, B.; Wang, N.; Yang, Y.; Zhong, H.; Ma, M.; Zhang, X.; Liu, R. Fabrication, Microstructures and Mechanical Properties of ZrO 2 Dispersion-Strengthened Q345 Steel. Trans. Nonferrous Met. Soc. China 2018, 28, 1132–1140. [Google Scholar] [CrossRef]
  4. Ranaware, P.G.; Rathod, M.J.; Bakare, C. Investigation of Nanocrystallization Behaviour of AISI 316 Stainless Steel under Adiabatic and Non-Adiabatic Severe Plastic Deformation Conditions. Mater. Today Proc. 2021, 43, 3079–3084. [Google Scholar] [CrossRef]
  5. Yadav, P.; Khanna, P. Effect of Input Parameters on Weld Bead Geometry and Weld Dilution for Weld Surfacing of Flux Cored 308L Stainless Steel on Low Carbon Steel. Mater. Today Proc. 2022, 62, 3608–3616. [Google Scholar] [CrossRef]
  6. Manjunatha, M.; Kulkarni, R.S.; Krishna, M. Investigation of HVOF Thermal Sprayed Cr3C2-NiCr Cermet Carbide Coatings on Erosive Performance of AISI 316 Molybdenum Steel. Procedia Mater. Sci. 2014, 5, 622–629. [Google Scholar] [CrossRef] [Green Version]
  7. Guo, P.; Shao, Y.; Zeng, C.; Wu, M.; Li, W. Oxidation Characterization of FeAl Coated 316 Stainless Steel Interconnects by High-Energy Micro-Arc Alloying Technique for SOFC. Mater. Lett. 2011, 65, 3180–3183. [Google Scholar] [CrossRef]
  8. Zhan, M.J.; Sun, G.F.; Wang, Z.D.; Shen, X.T.; Yan, Y.; Ni, Z.H. Numerical and Experimental Investigation on Laser Metal Deposition as Repair Technology for 316L Stainless Steel. Opt. Laser Technol. 2019, 118, 84–92. [Google Scholar] [CrossRef]
  9. Sun, Z.; Chen, L.; Chen, X.; Meng, F.; Yu, T.; Zhao, J. Analysis and Prediction of Cu-Sn-Ti Alloy Deposited on 316 L Steel by Coaxial Laser Cladding. Optik 2023, 282, 170839. [Google Scholar] [CrossRef]
  10. Tao, X.P.; Zhang, S.; Zhang, C.H.; Wu, C.L.; Chen, J.; Abdullah, A.O. Effect of Fe and Ni Contents on Microstructure and Wear Resistance of Aluminum Bronze Coatings on 316 Stainless Steel by Laser Cladding. Surf. Coat. Technol. 2018, 342, 76–84. [Google Scholar] [CrossRef]
  11. Ouyang, W.; Xu, Z.; Chao, Y.; Liu, Y.; Luo, W.; Jiao, J.; Sheng, L.; Zhang, W. Effect of Electrostatic Field on Microstructure and Mechanical Properties of the 316L Stainless Steel Modified Layer Fabricated by Laser Cladding. Mater. Charact. 2022, 191, 112123. [Google Scholar] [CrossRef]
  12. Wang, B.; Yao, B.; Han, Z. Annealing Effect on Wear Resistance of Nanostructured 316L Stainless Steel Subjected to Dynamic Plastic Deformation. J. Mater. Sci. Technol. 2012, 28, 871–877. [Google Scholar] [CrossRef]
  13. Jin, C.; Plucknett, K.P. Microstructure Instability in TiC-316L Stainless Steel Cermets. Int. J. Refract. Met. Hard Mater. 2016, 58, 74–83. [Google Scholar] [CrossRef]
  14. Pérez Escobar, D.; Wallaert, E.; Duprez, L.; Atrens, A.; Verbeken, K. Thermal Desorption Spectroscopy Study of the Interaction of Hydrogen with TiC Precipitates. Met. Mater. Int. 2013, 19, 741–748. [Google Scholar] [CrossRef]
  15. Niu, F.; Bi, W.; Li, C.; Sun, X.; Ma, G.; Wu, D. TiC Ceramic Coating Reinforced 304 Stainless Steel Components Fabricated by WAAM-LC Integrated Hybrid Manufacturing. Surf. Coat. Technol. 2023, 465, 129635. [Google Scholar] [CrossRef]
  16. Yuan, Q.; Chai, L.; Yang, T.; Wang, H.; Shen, J.; Guo, N.; Yin, X.; Xiao, J. Laser-Clad FeCrAl/TiC Composite Coating on Ferrite/Martensitic Steel: Significant Grain Refinement and Wear Resistance Enhancement Induced by Adding TiC. Surf. Coat. Technol. 2023, 456, 129272. [Google Scholar] [CrossRef]
  17. Chen, L.; Yu, T.; Chen, X.; Zhao, Y.; Guan, C. Process Optimization, Microstructure and Microhardness of Coaxial Laser Cladding TiC Reinforced Ni-Based Composite Coatings. Opt. Laser Technol. 2022, 152, 108129. [Google Scholar] [CrossRef]
  18. Zhicheng, L.; Dejun, K. Effects of TiC Mass Fraction on Microstructure, Corrosive–Wear and Electrochemical Properties of Laser Cladded CoCrFeNiMo High–Entropy Alloy Coatings. Tribol. Int. 2023, 186, 108640. [Google Scholar] [CrossRef]
  19. Zhang, Z.; Yang, Q.; Yu, Z.; Wang, H.; Zhang, T. Influence of Y2O3 Addition on the Microstructure of TiC Reinforced Ti-Based Composite Coating Prepared by Laser Cladding. Mater. Charact. 2022, 189, 111962. [Google Scholar] [CrossRef]
  20. Ding, Z.; Fang, Z.; Wang, G.; Wu, C.; Yang, S. Microstructure and Properties of Mo-Si-B-Y2O3 Composite Coating on Nickel-Based Alloy by Laser Cladding. Opt. Laser Technol. 2023, 164, 109473. [Google Scholar] [CrossRef]
  21. Zhang, B.; Liao, H.; Coddet, C. Microstructure Evolution and Density Behavior of CP Ti Parts Elaborated by Self-Developed Vacuum Selective Laser Melting System. Appl. Surf. Sci. 2013, 279, 310–316. [Google Scholar] [CrossRef]
  22. Ding, Y.; Bi, W.; Zhong, C.; Wu, T.; Gui, W. A Comparative Study on Microstructure and Properties of Ultra-High-Speed Laser Cladding and Traditional Laser Cladding of Inconel625 Coatings. Materials 2022, 15, 6400. [Google Scholar] [CrossRef] [PubMed]
  23. Wang, L.; Yang, L.; Huang, Y.; Yuan, Y.; Jia, C. Effects of Y2O3 Addition on the Microstructure and Wear-Resistant Performance of TiN/TiB-Reinforced Ti-Based Laser-Clad Coatings on Ti-6Al-4V Alloys. Mater. Today Commun. 2021, 29, 102752. [Google Scholar] [CrossRef]
  24. Xu, Z.; He, Z.; Wang, Z.; Zhang, J. Effects of CeO2 on the Microstructure and Properties of Laser Cladding 316L Coating. J. Mater. Eng. Perform. 2019, 28, 4983–4990. [Google Scholar] [CrossRef]
  25. Du, M.; Wang, L.; Gao, Z.; Yang, X.; Liu, T.; Zhan, X. Microstructure and Element Distribution Characteristics of Y2O3 Modulated WC Reinforced Coating on Invar Alloys by Laser Cladding. Opt. Laser Technol. 2022, 153, 108205. [Google Scholar] [CrossRef]
  26. Xu, Z.; Wang, Z.; Chen, J.; Qiao, Y.; Zhang, J.; Huang, Y. Effect of Rare Earth Oxides on Microstructure and Corrosion Behavior of Laser-Cladding Coating on 316L Stainless Steel. Coatings 2019, 9, 636. [Google Scholar] [CrossRef] [Green Version]
  27. Xia, M.; Liu, A.; Hou, Z.; Li, N.; Chen, Z.; Ding, H. Microstructure Growth Behavior and Its Evolution Mechanism during Laser Additive Manufacture of In-Situ Reinforced (TiB+TiC)/Ti Composite. J. Alloys Compd. 2017, 728, 436–444. [Google Scholar] [CrossRef]
  28. Rupert, T.J.; Schuh, C.A. Sliding Wear of Nanocrystalline Ni–W: Structural Evolution and the Apparent Breakdown of Archard Scaling. Acta Mater. 2010, 58, 4137–4148. [Google Scholar] [CrossRef]
  29. Köse, C. Characterization of Weld Seam Surface and Corrosion Behavior of Laser-Beam-Welded AISI 2205 Duplex Stainless Steel in Simulated Body Fluid. J. Mater. Sci. 2020, 55, 17232–17254. [Google Scholar] [CrossRef]
  30. KöSe, C. An Investigation of the Surface Characterization of Laser Surface Remelted and Laser Beam Welded AISI 316L Stainless Steel. Int. J. Electrochem. Sci. 2016, 11, 3542–3554. [Google Scholar] [CrossRef]
  31. Meng, G.; Li, Y.; Shao, Y.; Zhang, T.; Wang, Y.; Wang, F. Effect of Cl on the Properties of the Passive Films Formed on 316L Stainless Steel in Acidic Solution. J. Mater. Sci. Technol. 2014, 30, 253–258. [Google Scholar] [CrossRef]
  32. Balaraju, J.N.; Ezhil Selvi, V.; Rajam, K.S. Electrochemical Behavior of Low Phosphorus Electroless Ni–P–Si3N4 Composite Coatings. Mater. Chem. Phys. 2010, 120, 546–551. [Google Scholar] [CrossRef]
  33. Zhang, H.; Zou, Y.; Zou, Z.; Shi, C. Effects of CeO2 on Microstructure and Corrosion Resistance of TiC-VC Reinforced Fe-Based Laser Cladding Layers. J. Rare Earths 2014, 32, 1095–1100. [Google Scholar] [CrossRef]
  34. Huang, Y.S.; Zeng, X.T.; Hu, X.F.; Liu, F.M. Heat Treatment Effects on EN-PTFE-SiC Composite Coatings. Surf. Coat. Technol. 2005, 198, 173–177. [Google Scholar] [CrossRef]
Figure 1. Schematic diagram of laser cladding processing.
Coatings 13 01348 g001
Figure 2. Cross-sectional SEM plot and EDS energy spectrum of sample coating with different amounts of Y2O3 addition: (a) Cross-section SEM and EDS spectra of specimen S0; (b) Cross-section SEM and EDS spectra of specimen S1; (c) Cross-section SEM and EDS spectra of specimen S2; (d) Cross-section SEM and EDS spectra of specimen S3.
Coatings 13 01348 g002
Figure 3. SEM images of the upper, middle and lower sections of samples with different amounts of Y2O3: (a) the top, (b) middle, and (c) bottom part of the laser-cladding layer of S0; (d) the top, (e) middle, and (f) bottom part of the laser-cladding layer of S1; (g) the top, (h) middle, and (i) bottom part of the laser-cladding layer of S2; (j) the top, (k) middle, and (l) bottom part of the laser-cladding layer of S3.
Coatings 13 01348 g003
Figure 4. XRD pattern of different addition of Y2O3.
Coatings 13 01348 g004
Figure 5. Stepped hardness curves for coatings with different Y2O3 additions.
Coatings 13 01348 g005
Figure 6. Friction coefficient curves for coatings with different Y2O3 additions.
Coatings 13 01348 g006
Figure 7. Average friction coefficient and wear of coatings with different Y2O3 additions.
Coatings 13 01348 g007
Figure 8. Dynamic potential polarisation curves for coatings with different Y2O3 additions.
Coatings 13 01348 g008
Figure 9. Nyquist curve with different addition of Y2O3.
Coatings 13 01348 g009
Figure 10. Bode plots of coatings with different Y2O3 additions.
Coatings 13 01348 g010
Table 1. Chemical composition of Q355B carbon steel. wt%.
MaterialsCPSSiNTiMnOther
Q355B0.1800.0110.0060.1800.0060.0011.1300.380
Table 2. Chemical composition of 316 L austenitic stainless steel spherical powder. wt%.
MaterialsCPSGuSiNiMnMoCr
316 L≤0.03≤0.03≤0.03≤0.750.30–0.6511.00–14.001.00–2.502.00–3.0018.00–20.00
Table 3. Quality ratios for cladding powder materials.
SampleMixed Powders/wt%Y2O3 Powder/wt%
S01000
S1991
S2982
S3973
Table 4. Cross-section energy spectrum analysis results of samples with different additive amounts of Y2O3.
CoatingAtomic Fraction/wt%
FeCrNiTi
S081.547.923.277.28
S182.598.323.405.69
S285.487.613.183.73
S379.9811.604.973.64
Table 5. Electrochemical corrosion voltage and corrosion current of coatings with different addition of Y2O3.
SampleS0S1S2S3
Ecorr (V)−1.010−0.925−0.941−0.929
Icorr (A/cm2)7.762 × 10−52.014 × 10−53.215 × 10−53.819 × 10−5
Table 6. Fitting equivalent circuit parameters.
SampleS0S1S2S3
Rs/(Ω·cm2)9.477.98410.069.09
Rct/(Ω·cm2)115831761778969.5
CPE-T0.864780.872780.803530.8244
CPE-P107.24 × 10−555.475 × 10−589.2 × 10−5123.03 × 10−5
Disclaimer/Publisher’s Note: The statements, opinions and data contained in all publications are solely those of the individual author(s) and contributor(s) and not of MDPI and/or the editor(s). MDPI and/or the editor(s) disclaim responsibility for any injury to people or property resulting from any ideas, methods, instructions or products referred to in the content.

