Article

Non-Invasive Characterization of Maiolica Layer Structure by Terahertz Time-Domain Imaging

by
Rosarosa Manca
1,2,*,
Laura Chiarantini
3,
Edoardo Tartaglia
2,
Francesco Soldovieri
4,
Costanza Miliani
1 and
Ilaria Catapano
4
1
Institute of Heritage Science, National Research Council of Italy (CNR), Via Cardinale Guglielmo Sanfelice 8, 80134 Napoli, Italy
2
Earth Sciences Department, University of Florence, Via G. La Pira 4, 50121 Firenze, Italy
3
Center of Electronic Microscopy and Microanalysis (MEMA), University of Florence, Via G. Capponi 3r, 50121 Firenze, Italy
4
Institute for Electromagnetic Sensing of the Environment, National Research Council of Italy (CNR), Via Diocleziano 328, 80124 Napoli, Italy
*
Author to whom correspondence should be addressed.
Coatings 2023, 13(7), 1268; https://doi.org/10.3390/coatings13071268
Submission received: 31 May 2023 / Revised: 7 July 2023 / Accepted: 14 July 2023 / Published: 19 July 2023

Abstract

:
The characterization of the layered structure is of paramount importance for the study of maiolica wares (tin-glazed pottery). This paper presents the potentialities of Terahertz Time-Domain Imaging (THz-TDI) as a tool to perform non-invasive stratigraphic analysis of the maiolica objects under test. Samples with different types of stratigraphy, as testified by preliminary SEM-EDS analysis, were investigated by THz-TDI in laboratory conditions. The collected THz data were processed by means of noise filtering procedures and a time-of-flight-based imaging approach and the achieved results corroborate the ability to identify glaze layers, whose electromagnetic properties, i.e., the refraction index and the dielectric permittivity value, were estimated by taking into account both THz-TDI and SEM-EDS data. However, layers applied over the white glaze (namely, a transparent overglaze and a luster decoration) were not detected, probably since their thickness is below the range resolution of the adopted THz-TDI system. Morphological features hidden under the surface were also identified and they provided information about the manufacturing technique.

1. Introduction

Maiolica is the Italian term to describe earthenware artifacts coated with tin glazes. Tin glazing technology arrived in Italy in the 13th century and reached its most refined peaks during the Renaissance [1,2,3]. Over the centuries, the creation of maiolica objects became an artistic branch, characterized by its own productive and decorative styles [4,5,6,7]. Therefore, the maiolica manufacturing process was not a standard but it changed in time from region to region, and often each atelier used its own recipes.
Since maiolica is a multilayer structure made of several thin layers, the exploitation of technologies providing information about their layered structure can help in the study of the productive process, allowing for the identification of distinctive features of single manufacturers or chronological and geographical trends. Moreover, information about internal features is crucial to determine the state of conservation of a glazed artifact, highlighting detachments, inhomogeneities, or other defects under the surface.
The main analytical technique used for the study of maiolica is Scanning Electron Microscopy coupled with Energy-Dispersive Spectroscopy (SEM-EDS), which provides information on both the composition and the microstructure of a sample [4,5,6,7,8]. However, SEM-EDS is micro-destructive, which is performed on polished cross sections made through the glazes into the ceramic bodies. This is an issue, not only since complete objects or particularly precious ones cannot be sampled, but also since a single sample is not always representative of the whole artifact. Therefore, the possibility of acquiring stratigraphic information by non-invasive methods is extremely valuable. However, while there are many non-invasive techniques which provide compositional information (e.g., Raman Microscopy, Reflectance Spectroscopy, X-Ray Fluorescence Spectroscopy, Ion Beam Analysis, etc.) [6,7,8,9,10,11,12,13,14], the non-invasive characterization of the layer structure of a glazed earthenware is still challenging. A few attempts have been made in the past by Optical Coherence Tomography (OCT) [15,16,17], Macro X-ray Fluorescence Scanning (MA-XRF) with Monte Carlo simulations [9], and Micro-Computed Tomography (µCT) [18,19].
In this study, we use Terahertz Time-Domain Imaging (THz-TDI) in reflection mode [20,21,22] for the non-invasive stratigraphic characterization of maiolica sherds from the collection of the Museo Nazionale del Bargello in Florence.
THz radiation lies between infrared and microwaves, in the frequency range between 0.1 THz and 10 THz. This range was also known as the ‘THz gap’ between electronics and optics, i.e., between dielectric relaxation phenomena and vibrational spectroscopy [23,24]. THz radiation is non-ionizing, penetrates most dielectric materials, and interacts with both intramolecular and intermolecular motions of solid matter [25,26,27]. In particular, THz waves can penetrate more in-depth compared to IR radiation and allow for the characterization of materials transparent to X-rays, thus providing information somehow complementary to IR multispectral imaging and X-ray tomography [20,21,25]. Moreover, several materials have characteristic spectroscopic features at THz frequencies; therefore, THz spectroscopy can be used to identify materials based on their spectral fingerprint as well as on the computation of their refractive index [25,26,27,28,29].
THz-TDI is a cutting-edge technique, which is finding increasing interest in different applications [30,31] including, for example, the biomedical context [32,33] and the characterization of composite materials [34,35]. The technique had also important applications in the field of Cultural Heritage in the last 15 years. The first study was carried out by Koch et al., on wood dendrochronology [36]. Later, Fukunaga et al. investigated different types of artworks [20,25,37] and, at present, THz surveys of wall, canvas, and panel paintings are quite common [38,39,40,41,42,43,44,45,46,47,48,49,50,51,52,53,54]. In addition, THz-TDI was exploited to investigate maiolica tiles and their multilayer structure in [55].
This paper provides a further contribution, assessing the pros and cons of THz-TDI as a tool to characterize maiolica artworks, and it presents results referred to three sherds. The investigated sherds were selected by accounting for preliminary SEM-EDS analysis, which allowed for the classification of the sherds on the basis of the manufacturing and decorative technique used [56]. Indeed, one sample was decorated with colored glazes, one with colored glazes and luster, and one with colored glazes covered by a transparent overglaze (coperta). Accordingly, THz-TDI capability of characterizing white and colored glazes, the luster decoration and the transparent overglaze is presented and discussed by considering the information provided by the SEM-EDS surveys. In addition, SEM-EDS and THz-TDI information are exploited together to estimate the refraction index and the dielectric permittivity of the glaze.
The paper is organized as follows: The Italian maiolica technique and the investigated samples are described in Section 2; Section 3 deals with THz data acquisition and processing; Section 4 summarizes the results, which are discussed in Section 5; conclusions and future works are provided in Section 6.

2. Materials

2.1. Italian Maiolica Technique

A maiolica can be described as a multi-layered object made of a once-fired earthenware body, covered by a glaze made white and opaque by tin oxide, and then painted with inorganic colors [4]. The majority of these colors fuse into the glaze during firing in the form of metallic ions (Figure 1a), while only a few of them, such as antimony yellow, form a proper pigment layer on top of the white tin glaze (Figure 1b). Moreover, a transparent overglaze (historically called ‘coperta’) is sometimes applied on top of the painted decoration in order to protect it and enhance its brilliance (Figure 1b).
The composition of the overglaze is similar to the one of the white glaze, except for the absence of the tin-oxide opacifier [4]. After having been glazed, colored and, optionally, over-glazed, the artifact was fired for a second time.
Typical thicknesses of Italian maiolica tin glazes range between 60 μm and 300 μm, the great majority being thicker than 150 μm; the transparent overglazes had similar thicknesses (between c. 60 and 230 μm) [4]. Furthermore, a maiolica could be decorated with lusters, i.e., thin films (0.2–0.5 μm) containing nanoparticles of metallic silver and copper, which gave metallic, iridescent reflections to the surfaces (Figure 1b) [5]. Lusterware had to be fired a third time.
Not only the chemical composition, but also the number and thickness of the applied layers influence the appearance and quality of the final maiolica ware [4,5,6,7].

2.2. Investigated Maiolica Sherds

Three sherds of the maiolica collection of the Museo Nazionale del Bargello in Florence manufactured between the 15th and 16th centuries in Central Italy are investigated. Sherd selection was made by taking into account preliminary SEM-EDS analysis, which provided information about the layer structure (number and thickness of the layers) of the samples [56].
Fragments for microscopic investigation were sampled and their cross sections were analyzed by means of Reflected Light Microscopy (RLM) and SEM-EDS. RLM was performed with a Zeiss Axio Scope A1 optical microscope (Carl Zeiss SMT Ltd., Cambridge, UK), equipped with a camera (resolution 5-megapixel) and a dedicated image analysis software Zen lite 3.1. SEM-EDS analysis was carried out at the “Centro di Servizi di Microscopia Elettronica e Microanalisi (M.E.M.A.)” of the University of Florence by using a Zeiss EVO MA15 Scanning Electron Microscope (Carl Zeiss SMT Ltd., Cambridge, UK) coupled with an Oxford INCA250 Energy-Dispersive Spectrometer (Carl Zeiss SMT Ltd., Cambridge, UK) operating at 15 kV accelerating potential and 700 pA probe current.
Figure 2 shows the macroscopic pictures of the sherds and the microscopic images (RLM and SEM-EDS) of the analyzed cross sections. Table 1 summarizes the samples information and their stratigraphy as provided by the SEM-EDS analysis.
The sherd, referred to as Sample B_aut3, is a fragment from the base of a bowl decorated with small tulips having blue stems and brown flowers; it has a depression in the region where the tulips depart, and its surface is smooth to the touch.
The sherd named Sample C_aut2 has a flat morphology with the external rim and the blue decorative lines in relief.
The sherd named Sample B_aut4 is a fragment of a jar and has a strongly concave shape. In addition, similar to that of sample B_aut3, its surface is smooth to the touch.
Samples B_aut3 and C_aut2 have a layer structure similar to that represented in the scheme in Figure 1a. Sample B_aut3 has a single glaze layer over the ceramic bisque (Figure 2, first row); the white tin glaze is decorated with cobalt blue and manganese brown and the colorants are embedded in the upper portion of the glaze. Sample C_aut2 is decorated with cobalt blue and with a metallic (silver- and copper-based) yellow luster (Figure 2, second row). Note that the luster layer is very thin to be detected by SEM-EDS.
Finally, sample B_aut4 has a more complex layered structure, comparable to the one represented in the scheme in Figure 1b. Indeed, the white ground glaze is decorated with green, blue, and orange-yellow colors and a transparent overglaze (coperta) is applied on the top. For this sample, the THz-TDI analysis was focused on the orange-yellow portion since the orange-yellow pigment (lead antimonate) has a peculiar behavior, forming a separate layer between the white ground and the transparent overglaze (Figure 2).
Based on the SEM-EDS measures, the mean thickness of the total glaze layer (white ground + colorant/pigment layer + overglaze) is 210 ± 20 μm for all samples. In sherd B_aut4, the thickness of the transparent overglaze is 60 ± 20 μm and that of the orange-yellow pigment layer is 20 ± 10 μm.

3. Methods

3.1. THz-TD Imaging Working Principle

THz-TD imaging is based on the emission of a picosecond-short pulse, i.e., a THz pulse, which impinges on the sample under test (e.g., the sherd in Figure 3a) and interacts with it. Back-reflected pulses, or reflections, produced by the sample surface and each further inner interface occurring between materials with different refraction indexes are detected and stored as a function of the time-of-flight (ToF), i.e., the time that the signal employs to propagate from the emitter to the material interface and to return to the receiver (Figure 3b). The first reflection occurring in time is due to the interface between the air and the outer surface of the sample (i.e., the sample side close to the THz probes, which in this case is the outer glaze); subsequent pulses correspond to inner material interfaces. Therefore, the THz waveform collected from a single point accounts for the depth profile of the sample in that point, while a bi-dimensional cross-sectional image (also called B-scan or radargram) is obtained by collecting data, i.e., THz waveforms along a line (Figure 3c). Finally, the scan of an area generates a data cube (Figure 3d), from which different representations of the sample can be extrapolated, such as cross-sectional images along different lines, slices at different depths, and pseudo color 2D images (more details are provided in Section 3.4).
It is worth pointing out that the ToF, T, depends on the distance, d, between the THz probes and the encountered material interfaces as well as on the electromagnetic velocity, v, of the wave in the medium where the propagation occurs:
T = 2 d v
Being v = c / n , where c is the light velocity ( c 3 e 8 m / s ) and n is the refractive index of the medium where the propagation occurs. From Equation (1), it is possible to estimate the refractive index n provided that the ToF and the distance d are known.
n = T c 2 d
Moreover, assuming that the material is non-magnetic (i.e., μ = μ o , μ o being the air magnetic permeability), isotropic, and lossless, the relative dielectric permittivity, ε r , can be computed as follows:
ε r = n 2

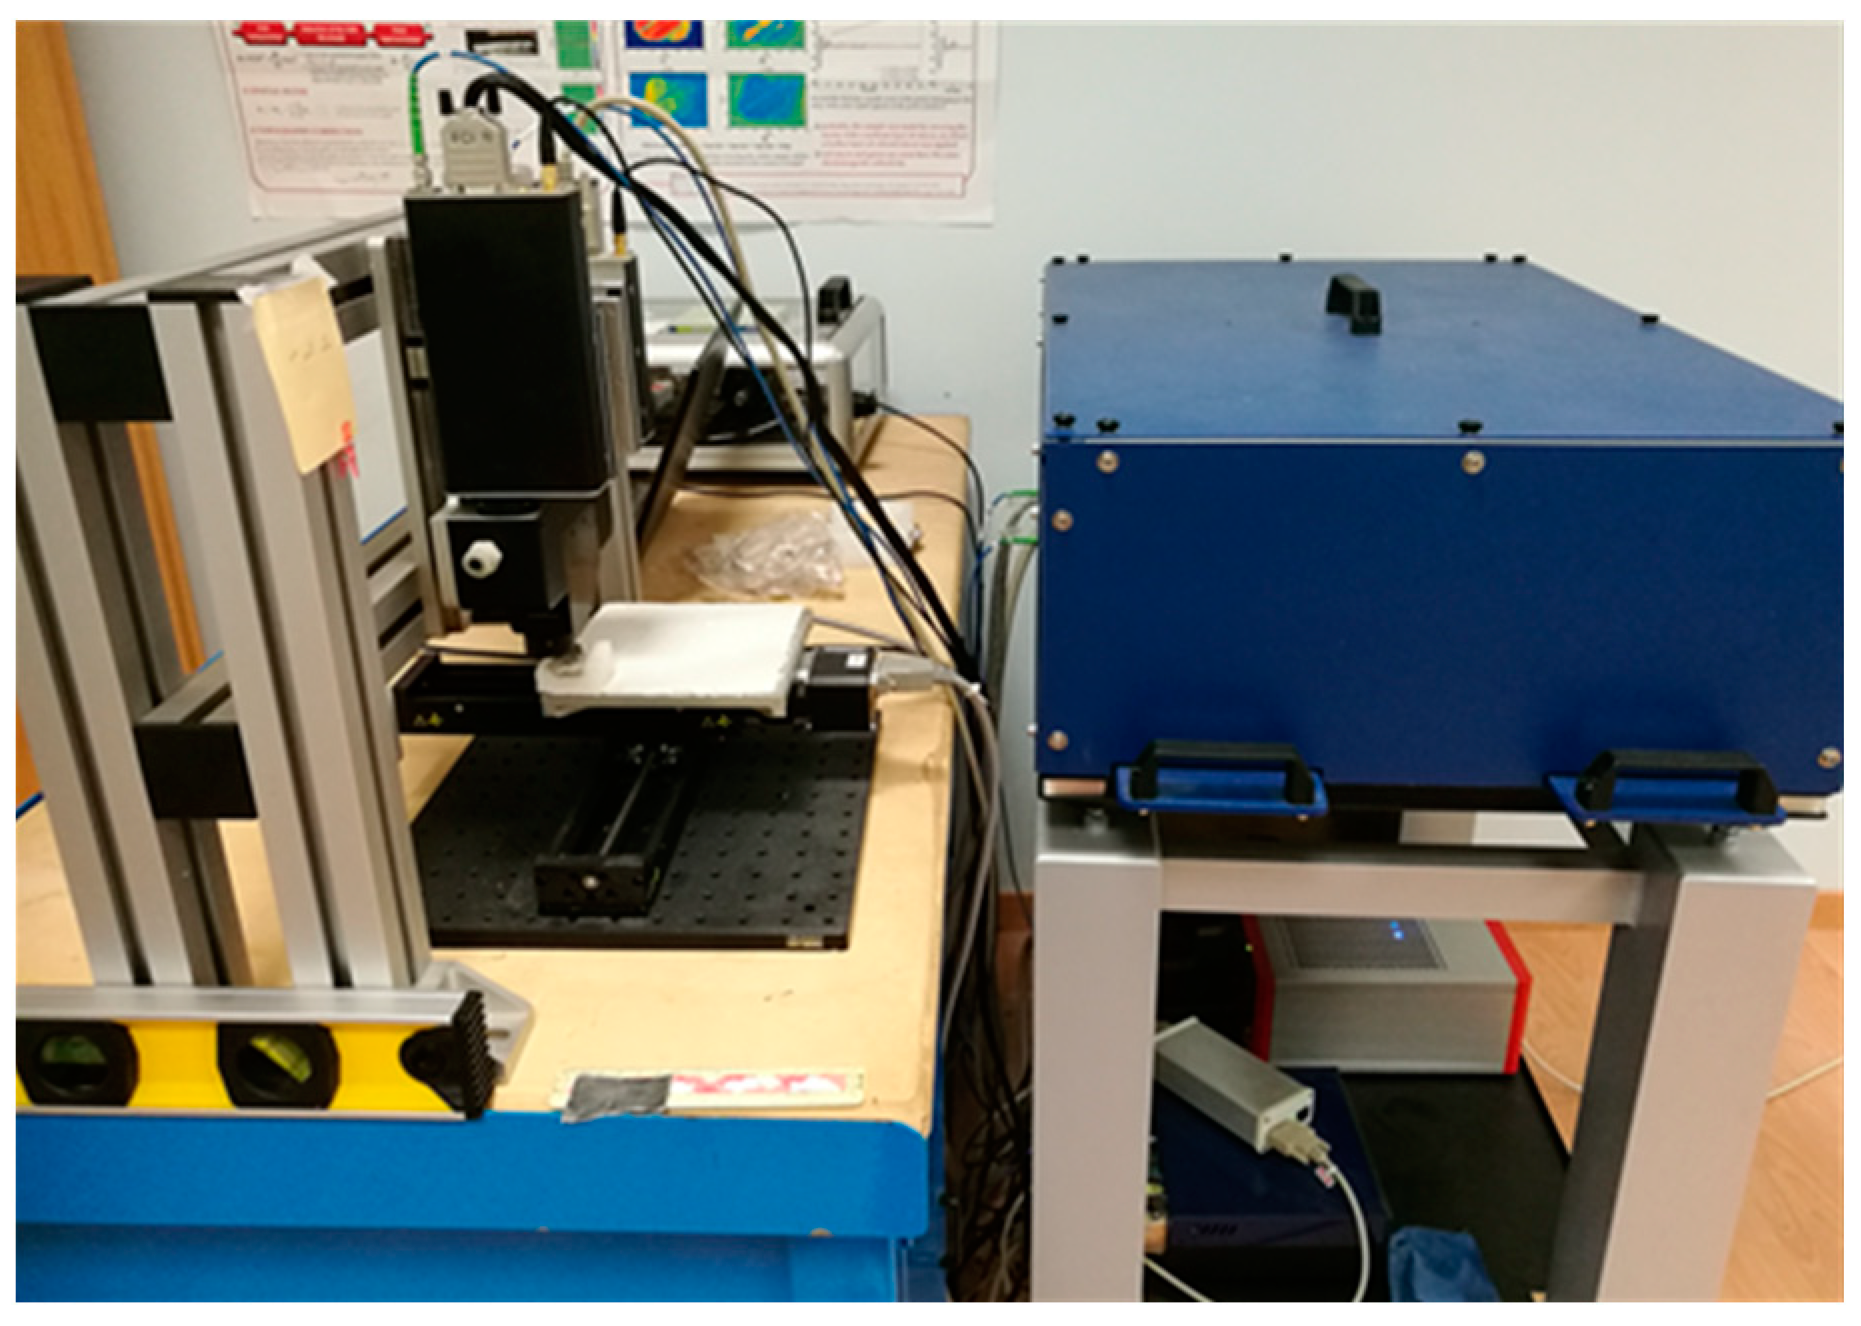
3.2. THz-TD Equipment

The maiolica sherds were analyzed by using the Zomega Fiber-Coupled Terahertz (FiCO) system (Zomega Terahertz Corp., New York, NY, USA) installed at the Institute of Electromagnetic Sensing of the Environment, National Research Council of Italy. The system is shown in Figure 4 and described in detail in [55]. FiCO is a Time-Domain System (TDS) made up of three main components: (a) The 1.5 µm laser source with an average power higher than 200 mW; (b) the base unit, which splits the source optical signal into the pump and probe beam used for THz waves generation and detection; (c) the transmitting and receiving modules, which are coupled with fiber optic and are reconfigurable in transmission and reflection mode. The laser source and the base unit are mounted on a movable optical table, optically connected to each other, and covered by means of an aluminum box, which protects the optical alignment and ensures operator safety with respect to the laser ray. The system is equipped with an imaging module, which allows for measurements in normal reflection mode on a planar area, whose maximum size is 150 mm × 150 mm. The transmitting and receiving modules are obtained in a fixed position and manually moved at the focal distance from the sample. The sample is placed on top of the automatic planar scanner and it is moved in both spatial directions with a minimum spatial offset of 0.12 mm.
The observation time window of the system is T m a x = 100 ps and it is movable along a range of 1 ns, while the nominal spectral bandwidth is B = 3.0 THz. The work frequency band is reduced to less than 2 THz when the system works in reflection mode.
It is worth pointing out that the observation time window and the bandwidth constrain the maximum reachable investigation distance (zmax) and the range or depth resolution (Δz), which are respectively:
z m a x = T m a x × v 2       Δ z = v 2 B
For the experiment presented in this paper, the usable bandwidth B of the system is about 1.1 THz [57]. Therefore, the range resolution in air (v = c) is about 140 μm.
The spatial resolutions along the x and y axis are related to the beam width of the radiated THz pulse, which is about 1.5 mm, and to the scanning offset.
The amplitude of the THz signal is provided in arbitrary units by the THz system.

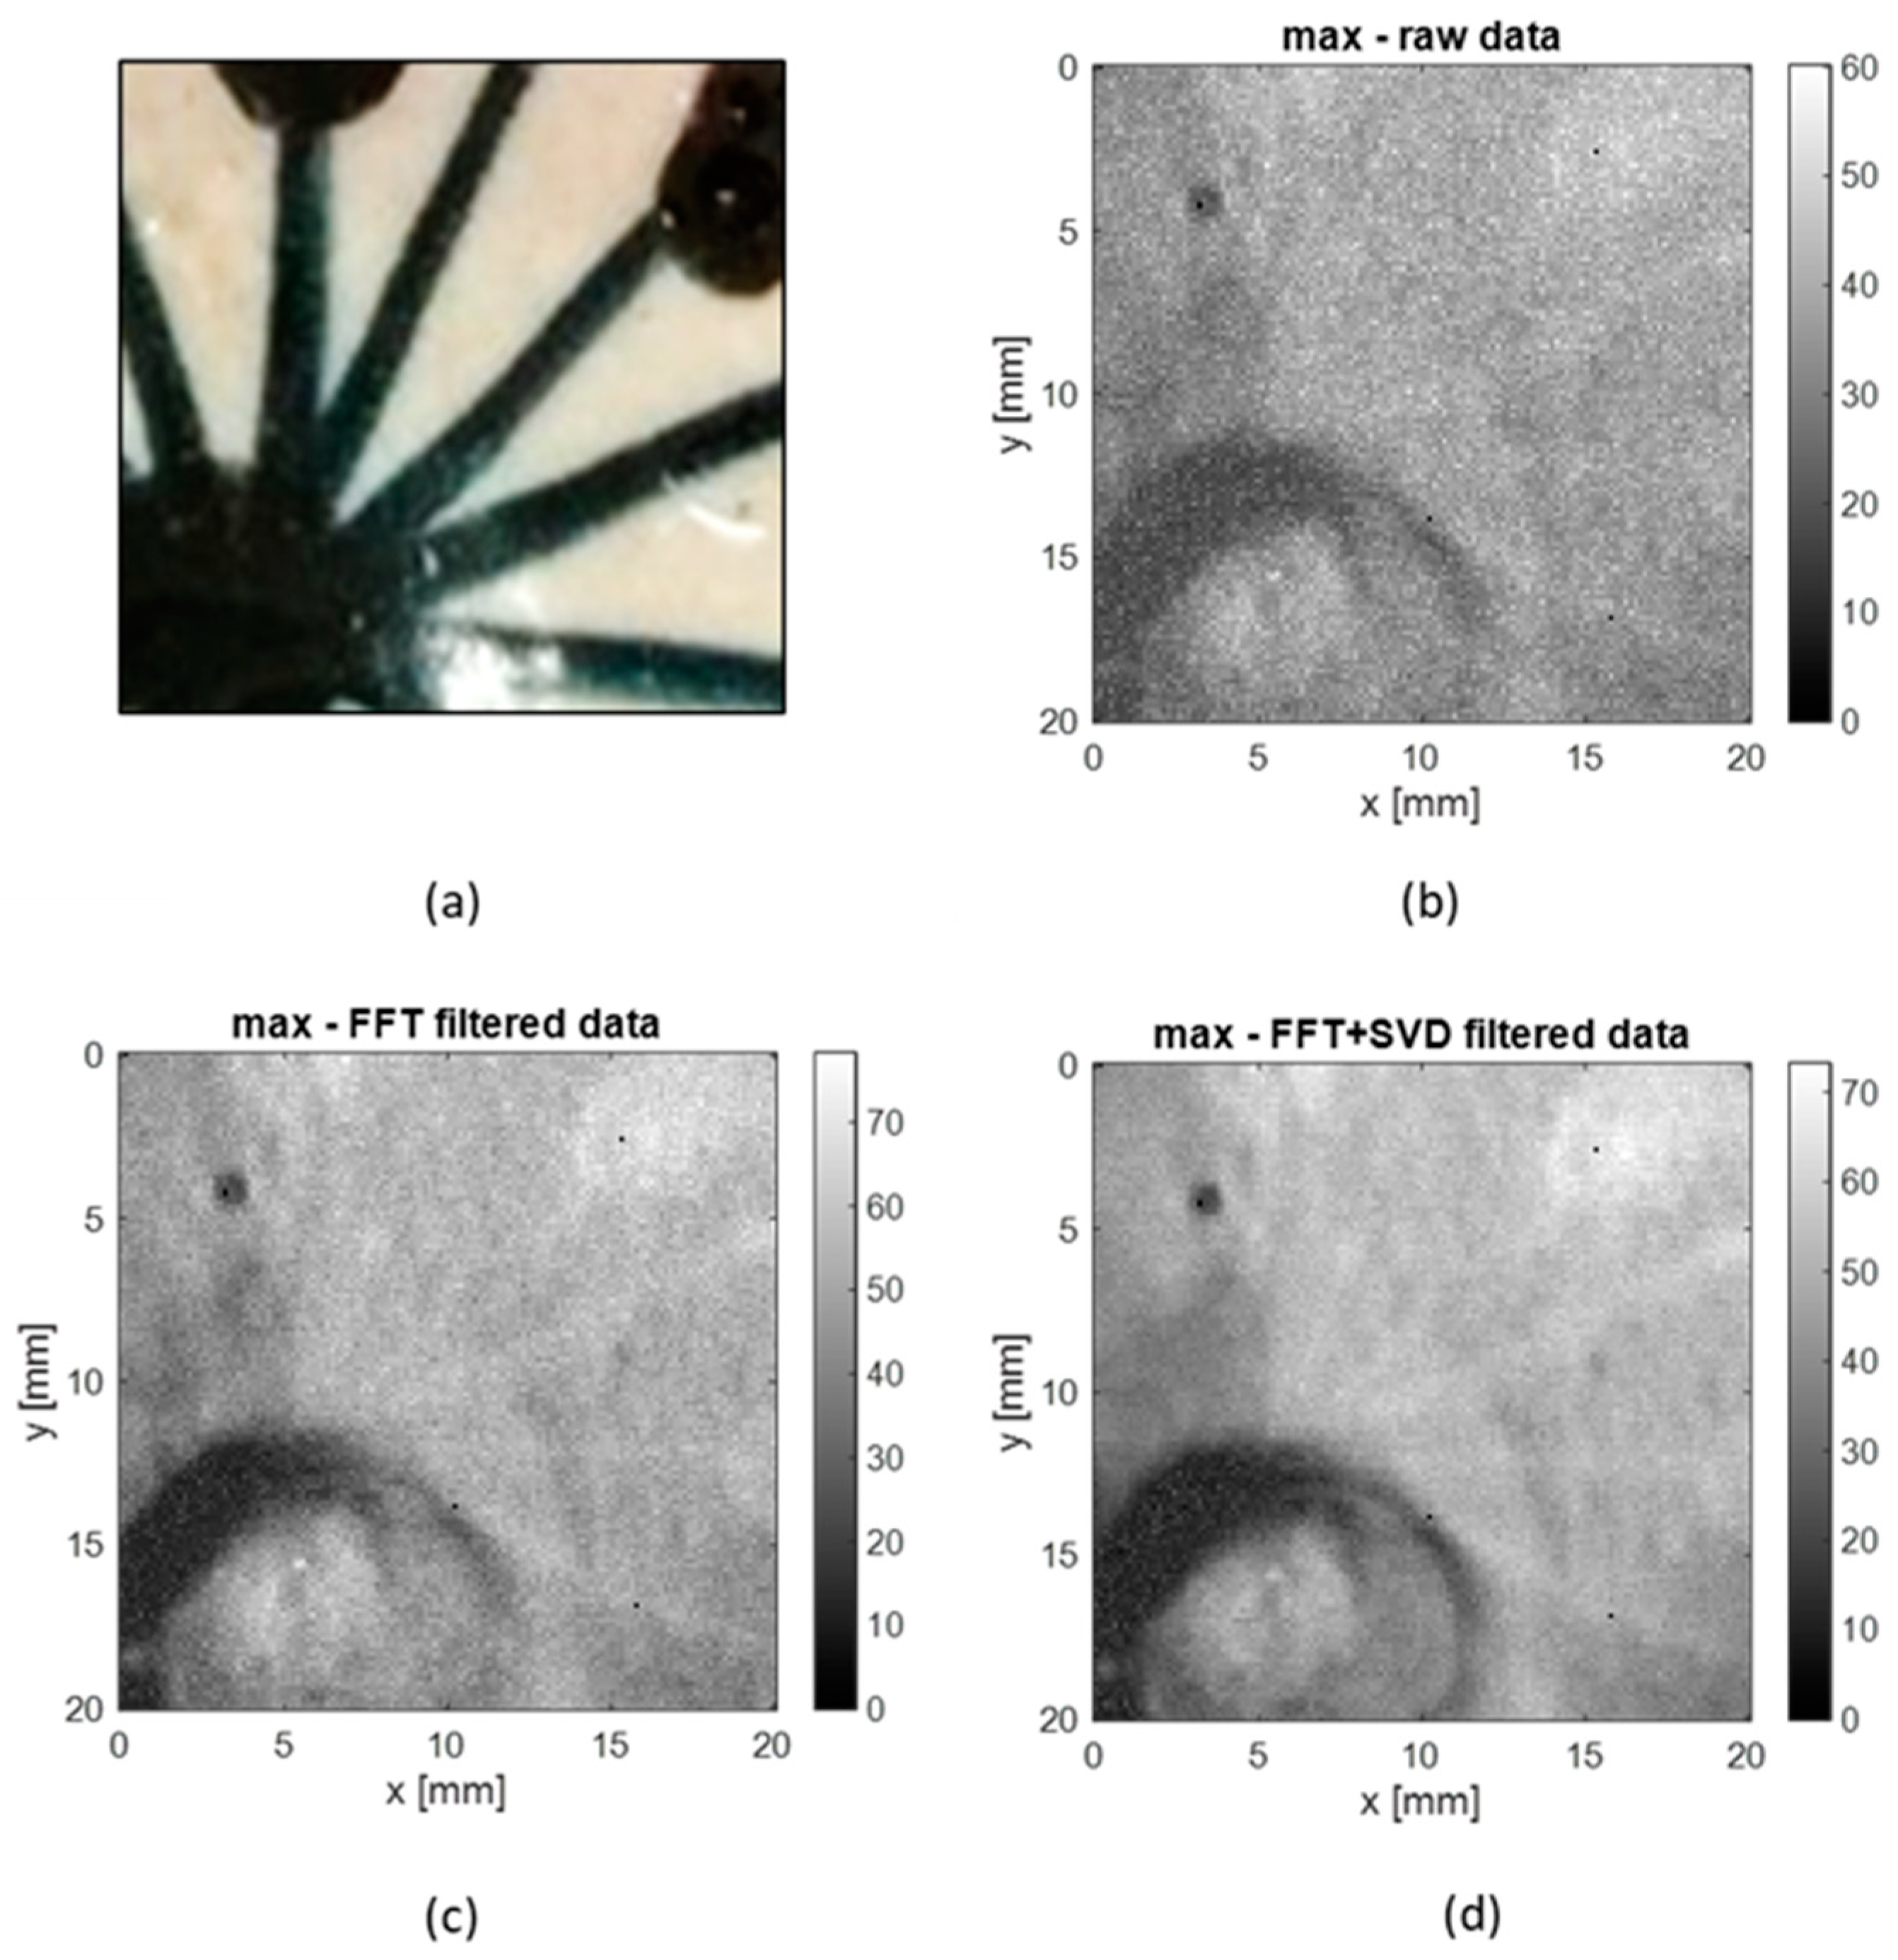
3.3. Data Processing

The raw THz data were processed by means of filtering procedures devoted to mitigating the effects of environmental noise. First, the Fourier Filtering (FFT) procedure, as in [55], is applied, and then the Singular Value Decomposition (SVD) approach, as in [58], is used.
The FFT procedure performs a band-pass filter and removes low and high frequency signal components, which are outside the actual working frequency range of the TDI-THz system. Let s t be the raw measured THz signal at the generic measurement point, the filtered signal is given by:
s ^ t = I F F Π F F s t
where FF and IFF denote the direct and inverse Fourier’s transforms, respectively, while Π is band pass filter. Herein, the signal components outside the frequency range from 40 GHz to 2.40 THz are filtered out.
The SVD approach accounts for a truncated SVD representation of the data. Let S ^ be the M × N dimensional Fourier filtered data matrix, where M is the number of measurement points and N the number of time samples discretizing each collected THz waveform in the observation time window. Noise components are mitigated by considering the filtered data matrix given by:
S ~ t = i = 1 P σ i u i v i T
where the triple σ i , u i ,   v i i = 1 Q denotes the SVD of S ^ , Q m i n M , N being its rank, and the threshold P < Q is set in a way that the energy of the filtered signal S ~ is about the 90%–95% of the energy of S ^ . It is worth pointing out that S ~ t is made up of M elements, which are the N dimensional vectors s ~ m t with m = 1, …, M, representing the filtered signals collected in all the measurement points.
Finally, a topography correction procedure was performed by aligning the first reflection of each acquired waveform to the time t = 0 ps. The procedure is fully described in [55,58]. It makes the air−sample interface artificially flat in order to compensate for the time-delay differences introduced by the surface topography of the sample. This is useful when not perfectly analyzing the flat samples and simplifies the comparison between both different samples and different areas of the same sample. However, since this correction may affect the topography of the inner material interfaces and thus, the depth profile of the sample, both the aligned and non-aligned data must be considered for interpreting the results properly, and this was carried out in the present study.

3.4. Representation of Data
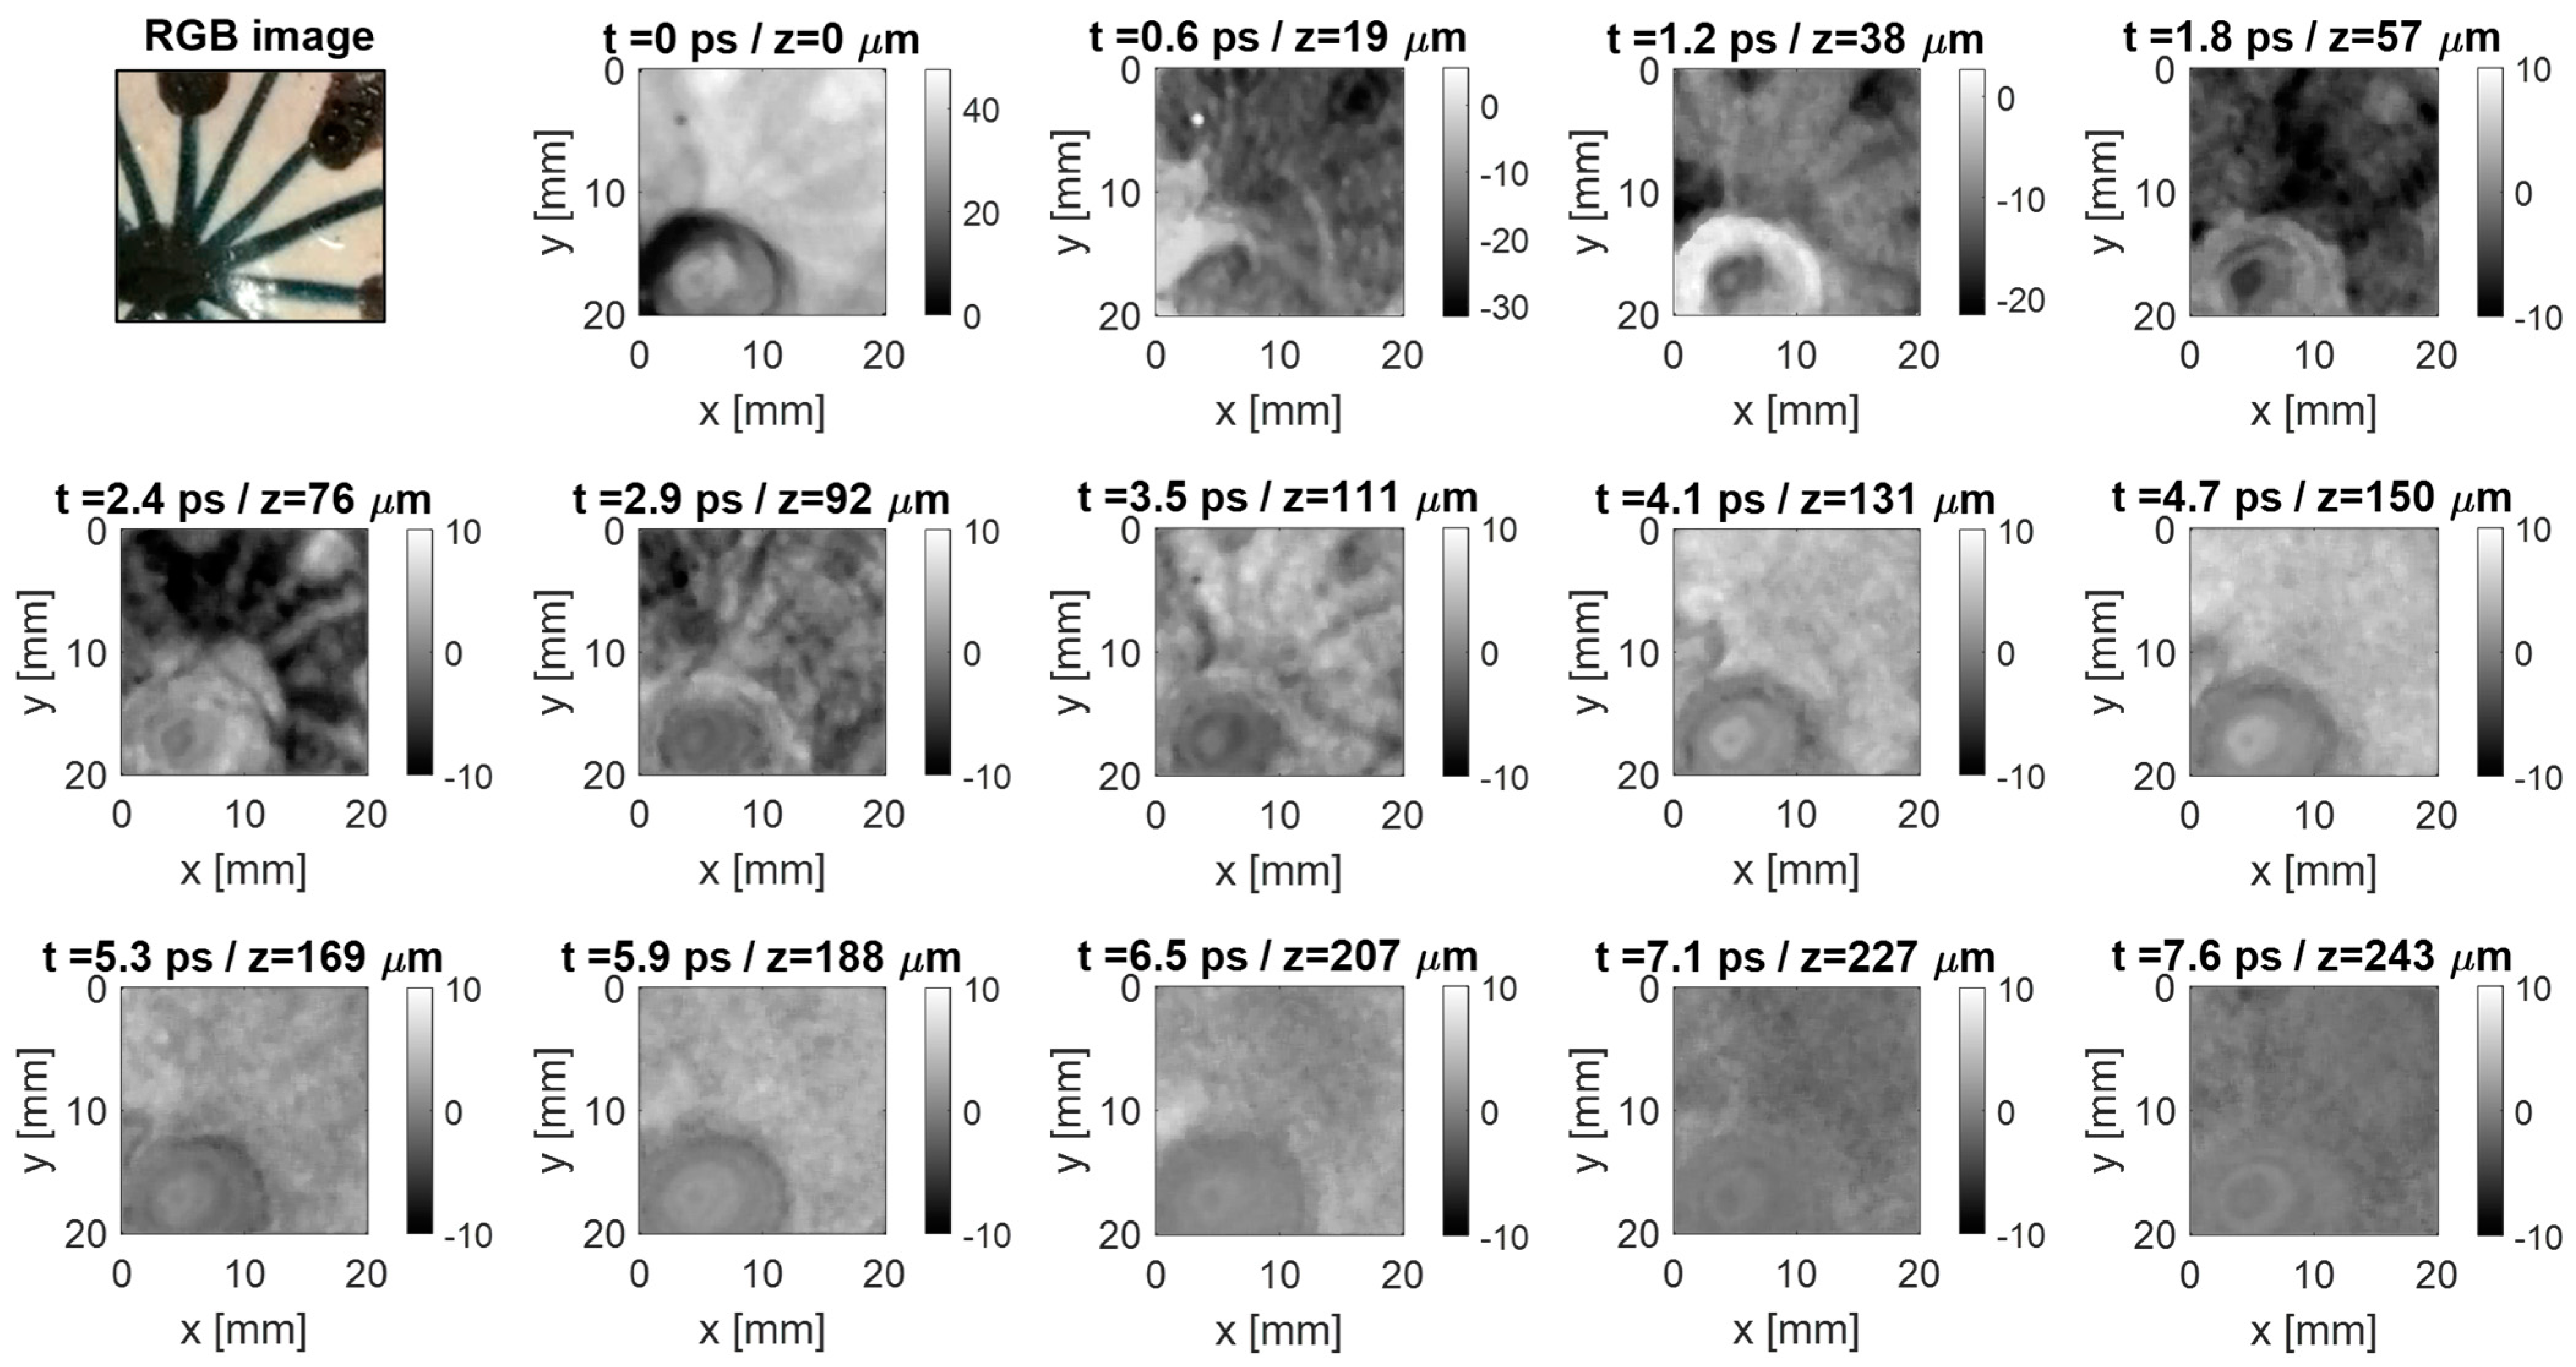
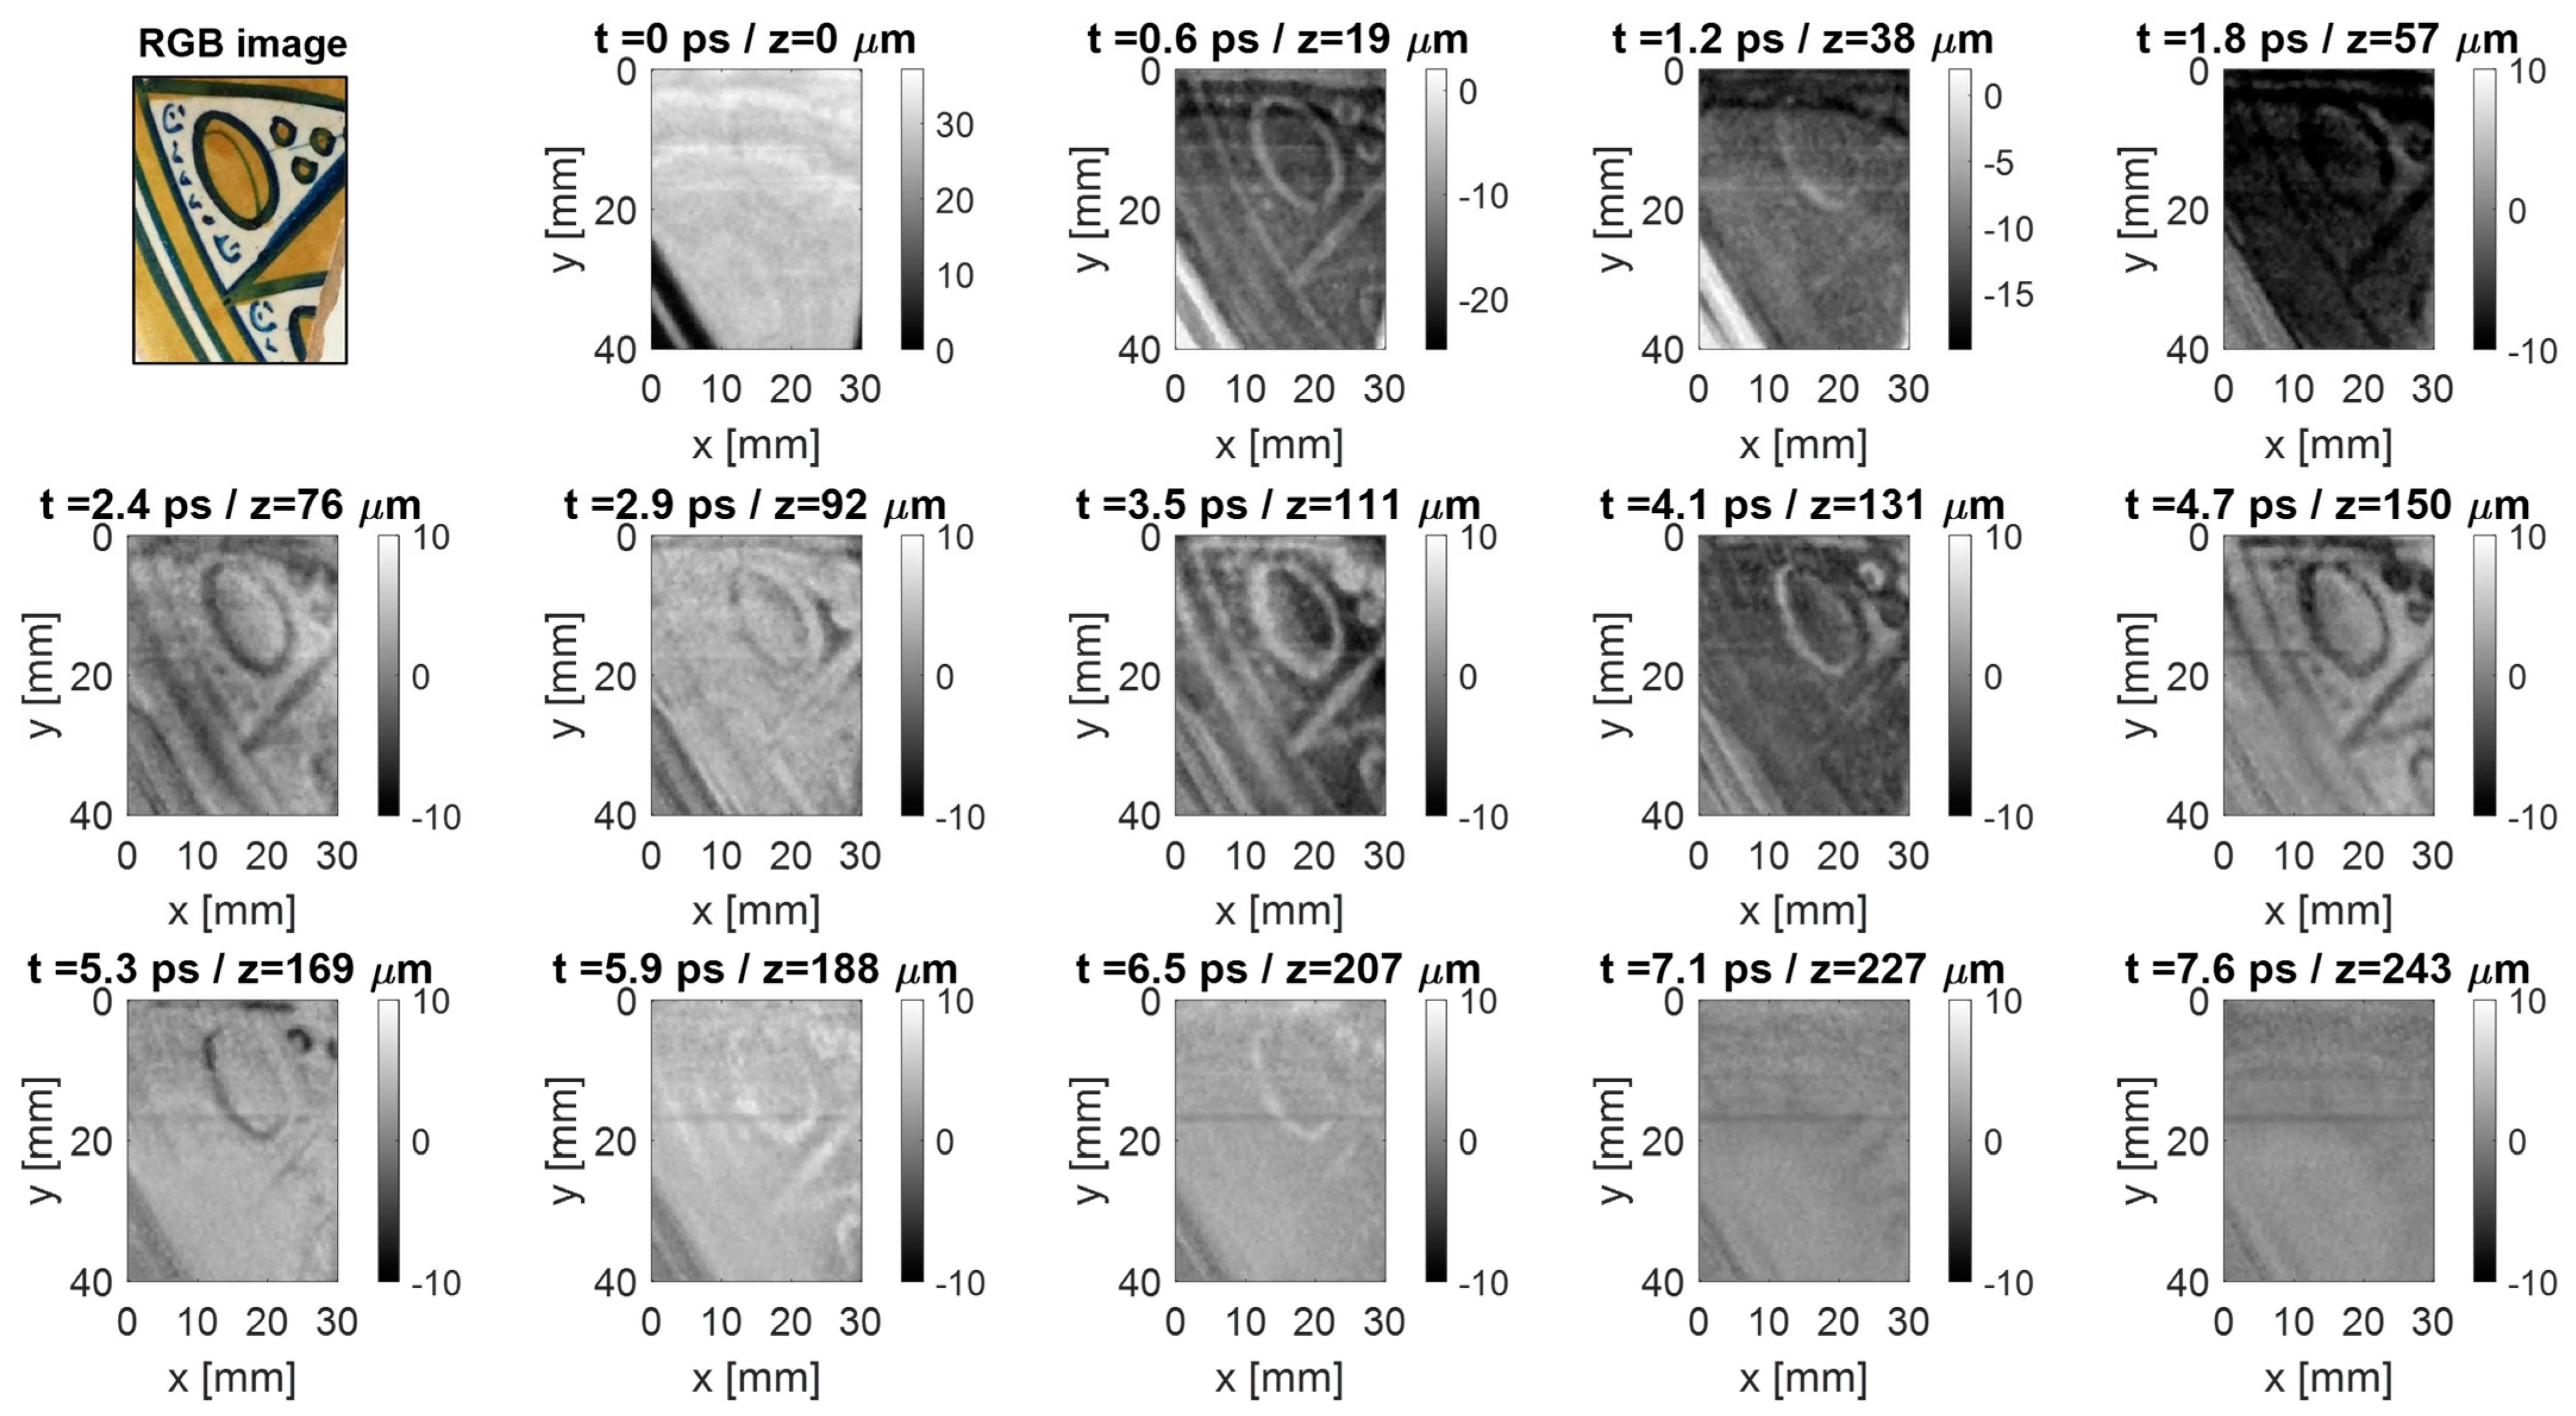
There are many ways to represent THz data cubes in more readable 2D plots [21]. Pseudo color images, B-scans (or radargrams), and C-scans at different depths have been considered to represent the THz data and gather information on the surveyed maiolica sherds.
Pseudo color images have been obtained by plotting in each pixel the maximum, the minimum, or the total value of the amplitude of the filtered signal s ~ m t with m = 1, …, M. The amplitude values are given by the THz system in arbitrary units and are shown in the pseudo color images below using a gray scale. These images provide 2D visualizations of the sample related to its reflectivity map; therefore, they allow for the detection of materials with different refractive indexes. However, they do not account for depth information, and thus are not suitable to perform a stratigraphic characterization.
B-scans (or radargrams or cross-sectional images) are spatial-time maps obtained by representing the filtered signals referred to the same measurement line all together (see, for example, Figure 3c). The spatial axis represents the measurement points, while the time axis accounts for the time-of-flight, which is related to the propagation depth inside the sample. The B-scans provide 2D images representing cross-section views of the inner structure of the sample and provide information on the presence and location of possible inner layers. Therefore, they allow for stratigraphic analysis.
C-scans at different depths (or depth slices) provide a 3D characterization of the inner feature of the sample and account for the entire data matrix S ~ t . Herein, each C-scan has been obtained by computing, at each measurement point, the average of the amplitude of the signal in consecutive intervals of the observation time window, where the useful signal occurs. The width of these time intervals remains constant and is set by taking into account the frequency bandwidth of the system. Moving the time range along the observation time window, different C-scans, representing horizontal cuts of the sample from its surface (i.e., the side close to the transmitting/receiving probe) toward its bottom, are obtained. It is worth pointing out that the time-alignment procedure described in Section 3.3 was applied in order to plot the C-scans at different depths, thus correcting time misalignments of the reflection due to the surface topography of the air−sample interface. Moreover, in the figures given below, the color scale of the first three C-scans ranges from the minimum detected value (black) to the maximum one (white), while the other C-scans are represented in a fixed color scale ranging from −10 to +10; this avoids saturation effects and losses of relevant details.

4. Results

4.1. Sherd B_aut3

As already mentioned, sample Baut3 is a fragment from the base of a bowl; it has a depression, surrounded by a radial decoration of small tulips with blue stems and brown flowers. An area of 20 × 20 mm2, with the depression in the bottom left corner, was scanned by THz-TDI with a spatial offset of 0.15 mm (Figure 5a). Figure 5b–d show the THz pseudo color images obtained by plotting the maximum amplitude value of the raw, FFT filtered, and FFT + SVD filtered waveform collected at each measurement point, respectively. The comparison of the THz images makes clear the effect of the filtering procedures and corroborates their effectiveness as a tool to improve the readability of the THz images and to make the extrapolation of useful information easier. Stems and flowers are, indeed, roughly visible in Figure 5b, become clear in Figure 5c, and are better visualized in Figure 5d.
THz pseudo color images also show that the painted tulips and stems appear as the areas with the highest reflectivity, i.e., the areas where the maximum amplitude of the THz waveform is attained. This suggests that the colored glaze has higher relative permittivity compared to the white glaze areas. However, it is worth noting that there is no appreciable variation between brown and blue colored areas.
In addition, a black circle appears in the bottom left corner, i.e., for x in [0–12] mm and y in [12–20] mm, while a black dot is in the point of coordinates x = 4 mm and y = 4 mm. The presence of these features with low reflectivity is due to the surface topography of the sherd. Indeed, they correspond to areas where the surface changes its slope, and thus the incident angle is not null. As a consequence, the system does not detect at all or detects only partially the reflected signal. Moreover, several curved lines are visible around the central depression and suggest that a potter’s wheel was used to manufacture this ware.
The above features appear clearly in the C-scans at different depths (Figure 6), which also provide hints about the stratigraphy of the sample. The C-scans have been obtained by exploiting the alignment procedure, which sets the zero of the time axis of each trace in correspondence of the first reflection [55,58].
The C-scans at different depths show that the colored decorations produce an alteration of the THz signal in the time range [0–3.5] ps. This is coherent with the literature and the SEM image (Figure 2, first row), which show that manganese and cobalt colorants fused into the upper part of the glaze by forming a type of layer; therefore, the presence of an inner interface is expected in the colored areas. Moreover, starting from 4.1 ps, the C-scans are rather homogeneous (except for the effect of the shaded zone due to the cavity), suggesting that the signal is coming from the white ground glaze. Finally, from t = 6.5 ps, the entire image starts to be quite homogeneous suggesting that, from this time instant, the contributions to the THz waveform are given by the ceramic body.
To corroborate the information about the sample stratigraphy, the B-scans have been also considered. For the sake of brevity, only a representative B-scan is shown in Figure 7 along with the THz waveforms referred to as white, blue, and brown spots. As stated, the first strong reflection is due to the interface between the air and the sample surface, and it is more intense in the colored regions. Further reflections occur at t = 2.7 ps, 3.9 ps, and 6.5 ps. The reflection at t = 3.9 ps is relevant in the waveform referred to the white point, while that at t = 2.7 ps is distinctively high in the colored areas (both blue and brown ones). Finally, the reflection at t = 6.5 ps is attributable to the interface between the glaze and the ceramic body.

4.2. Sherd C_aut2

An area of 30 × 40 mm2 was scanned with a spatial offset of 0.15 mm. Figure 8a–c show the RGB image of the investigated area, the THz pseudo color images achieved by computing the maximum amplitude value of the filtered THz waveforms, and that accounting for the minimum value, respectively. In this case, THz pseudo color images only provide information about the sherd decoration. Specifically, the blue lines are well discernible in Figure 8c, while the lustered decorations are indistinguishable from the white areas. This result suggests that the metallic luster does not affect in an appreciable way the amplitude of the THz signal. This is due both to the fact that the layer is very thin (it was not visible even in SEM-EDS images) and the metals typical of the luster (silver and copper) are present only in the form of nanoparticles [5].
Figure 9 shows the C-scans at different depths, while Figure 10 shows a representative B-scan and the waveforms of a white, blue, and lustered spot. The blue decorations appear in the C-scans from 0.6 ps to 5.9 ps and some details are better visible in some C-scans than in other ones. It is interesting to note that, for this sherd, the blue decorations appear starting from the second C-scan of Figure 9 and show a lower reflectivity than the white ones. This behavior is different with respect to that observed for the previous sample (B_aut3) and it is ascribable to the fact that now the blue decorations are in relief. Fortunately, the roughness due to the relief decoration does not introduce defocusing effects, as it is corroborated by the first C-scan, which shows that an about constant signal amplitude characterizes the sample surface. After t = 6.5 s, the signal is uniform, suggesting that it is generated by the ceramic body.
Moreover, by accounting for the B-scan and the waveforms, some other reflections appear following the main one due to the air−glaze interface: all the waveforms show a weak reflection after 1.7 ps whose amplitude changes with the decoration color. In addition, the waveforms corresponding to white and lustered areas have a further reflection at about 3.5 ps, while this reflection appears shifted at about 4.5 ps in the waveform corresponding to the blue decorated area. Finally, as for the previous sample, all the waveforms exhibit a non-negligible reflection at t = 6.5 ps.

4.3. Sherd B_aut4

A narrow area of 30 × 10 mm2 corresponding to the flattest portion of the sherd was investigated. Orange-yellow and blue decorations are present in the analyzed area, which was scanned with a spatial offset of 0.15 mm as in the previous samples (Figure 11a).
Figure 11b shows that the yellow brushstrokes are mapped in the THz pseudo color image referred to the maximum values and show a higher reflectivity than the white ground; conversely, the blue lines are not visible.
This result is confirmed by the C-scans at different depths (Figure 12), even if they are affected by the curvature of the sherd. Specifically, the orange-yellow decorations are visible in the C-scans at t = 0 ps (representing the interface between the air and the sample) and at t = 1.2 ps, corresponding to the minimum of the first reflection (see also the right panel of Figure 13, which shows the waveforms corresponding to orange-yellow, blue, and white areas). Moreover, the C-scans referred to the other times are quite homogeneous and reveal the presence of a relative maximum for t belonging to the range [2.4–2.9] ps and to the range [5.9–6.5] ps. The first range corresponds to the transition from the colored glaze to the uniform white glaze, while the second range corresponds to the glaze-ceramic interface. Note that, although the maximum amplitude of the waveform due to the blue decoration is higher than that referred to the white glaze (Figure 13, right panel), the blue decoration does not appear in the pseudo color image as well as in the C-scans. This unexpected behavior could be due to a combined effect of the blue lines’ thinness and of the low difference between the maximum values of the signal given by blue and white areas.
As a final remark, it is worth pointing out that the behavior of the C-scans, the B-scans, and the waveform does not allow for the detection of the transparent overglaze layer, which has a mean thickness of 60 μm according to the SEM-EDS analysis (Figure 2). This is possibly due to the fact that the reflectivity of the glaze and the overglaze are very similar to be distinguished and/or the overglaze thickness is below the range resolution of the adopted THz-TDI system.

5. Discussion

The presented results revealed that THz-TDI is a useful non-invasive technology, which provides information about the reflective behavior of the white and colored glazes, as well as about the overall stratigraphy of the maiolica sherds.
Specifically, with reference to the analyzed sherds, THz imaging made it possible to identify colored and white areas, while it did not distinguish the luster decorations from the white glaze. This result is suggested by the pseudo color images, which show that the amplitude of the reflected waveform changes in correspondence of the colored glaze areas but not of the luster. In addition, it is confirmed by the ToF analysis, i.e., by C-scans at different depths, B-scans, and waveforms, which showed that THz signals referred to the luster and the white glaze exhibited the same behavior in time. On the other hand, it was not possible to identify the transparent overglaze (60 ± 20 μm) present in sherd B_aut4, probably since the range resolution of the adopted THz-TDI system was not sufficient and the reflectivity of the glaze and the overglaze are very similar to be distinguished. For this sherd, THz images did not allow for the identification of the blue decoration, which is possibly due to the limited amount of color present.
ToF analysis corroborates that the three sherds were produced with the same manufacturing technique (i.e., that of the Italian Renaissance maiolica). Specifically, the presented THz-TDI results reveal that the interface between the glaze and the ceramic body always occurs at about 6.5 ps after the first reflection (air−sample interface). Moreover, the glaze itself appears as a two-layer structure. In fact, it is possible to recognize an upper glaze layer accounting for the decoration fingerprints and located from t = 0 ps up to t = 3–4 ps, and a lower glaze layer extended up to 6.5 ps which is quite homogeneous. This difference in the THz response between the upper and lower part of the glaze was seen both in the colored and in the white areas and may be related to both an inhomogeneous distribution of the coloring and opacifying agents in the glaze and to the weathering of the surface during the prolonged burial.
By taking into account that the average total thickness of the glaze estimated by the SEM-EDS is d = 210 ± 20 μm and that the ToF needed by the THz pulse to cross the glaze layer is T = 6.5 ps for all the three sherds, it was possible to calculate the average refraction index, nglaze, and relative permittivity, εglaze, values of the glaze according to Equations (2) and (3):
n g l a z e = T c 2 d = 6.5   e 12 3 e 8 2   * 210 e 6 = 4.7 ± 0.4  
ε g l a z e = n g l a z e 2 = 22   ± 4
The εglaze value was used in Figure 6, Figure 9, and Figure 12 to convert the ToF [ps] in depth [μm]. Let us observe that THz-TDI results in [55], regarding the maiolica made in Naples in the 19th century, revealed different characteristics for the maiolica glazes. They were, indeed, thicker (c. 500 µm) than the ones analyzed in the present study and their estimated average relative permittivity was εglaze = 6. These differences may indicate that different materials and techniques were adopted in Renaissance Tuscany (this study) and in 19th century Naples [55].
Finally, it is worth pointing out that in the case of the sherd Baut3, THz-TDI revealed the presence of features with a circular pattern, which provided information about the manufacturing technique by suggesting that the original ware was manufactured on the potter’s wheel.

6. Conclusions

Maiolica wares are artworks that can be regarded as layered objects, whose structure depends on the manufacturing process. Therefore, non-invasive technologies allowing for the stratigraphic characterization of the whole object are now worth consideration since they may improve knowledge about manufacturing, dating, and place of production.
On the other hand, THz technology is increasingly adopted in the frame of cultural heritage, especially in the study of paintings and frescos, and it allows for the identification of layers made from different materials (e.g., the canvas, the preparatory gypsum layer, and the paint layer), the detection of gold foils, as well as of repainting, hidden details, and defects due to the aging (e.g., cracks). As a further contribution to the available literature in assessing the THz ability to investigate layered artifacts, this paper has presented results referred to three maiolica sherds from the Museo Nazionale del Bargello in Florence. The surveys have been carried out in laboratory by using a THz-TD system, whose imaging capabilities have been improved by using a data filtering procedure devoted to reducing the measurement noise caused by the environmental conditions (specifically humidity and temperature).
The presented results corroborate advantages and drawbacks of THz-TDI by con-firming its ability to discern between colored and white areas as well as to characterize the glaze structure. For the analyzed samples, the glaze appears as made by an upper layer, possibly affected by the inhomogeneous distribution of the coloring and opacifying agents as well as by the weathering action on the surface, and a bottom, homogeneous layer. On the other hand, THz-TDI was not able to recognize layers with thickness of a few tens of micron (or less), such as the transparent overglaze and the luster decoration. In addition, it was possible to investigate only almost flat portions of the sherds since the adopted THz system allows for only the measurement in normal reflection mode. Finally, the combined use of THz-TDI and SEM-EDS allowed us to estimate the mean relative permittivity (εr = 22) and refraction index (n = 4.7) of the studied Italian Renaissance maiolica glazes.
Further surveys of other maiolica sherds and other cultural heritage objects with a layered structure are ongoing, as well as the design of specific data processing procedures aimed at enhancing the amount of information retrievable by THz-TDI surveys. In addition, the study of the THz signal in the frequency domain will be considered in order to further investigate the capability of highlighting differences between different glaze colors.

Author Contributions

Conceptualization, R.M. and I.C.; data curation, R.M. and I.C.; funding acquisition, C.M. and I.C.; investigation, R.M., L.C., E.T. and I.C.; methodology, R.M. and I.C.; project administration, C.M.; resources, F.S., C.M. and I.C.; software, R.M. and I.C.; supervision, I.C.; visualization, R.M. and I.C.; writing—original draft, R.M. and I.C.; writing—review and editing, R.M., L.C., E.T., F.S., C.M. and I.C. All authors have read and agreed to the published version of the manuscript.

Funding

This study was partially funded by the European Research Infrastructure for Heritage Science (E-RIHS), project CIR01_00016 SHINE—Potenziamento dei nodi italiani in E-RIHS—Rafforzamento del capitale umano—CUP B82F20000810001.

Institutional Review Board Statement

Not applicable.

Informed Consent Statement

Not applicable.

Data Availability Statement

The data presented in this study are available on request from the corresponding author.

Acknowledgments

The authors acknowledge the Musei del Bargello, and specifically the curator Marino Marini, for allowing the analyses.

Conflicts of Interest

The authors declare no conflict of interest. The funders had no role in the design of the study; in the collection, analyses, or interpretation of data; in the writing of the manuscript, or in the decision to publish the results.

References

  1. Goldthwaite, R.A. The Economic and Social World of Italian Renaissance Maiolica *. Renaiss. Q. 1989, 42, 1–32. [Google Scholar] [CrossRef]
  2. Kingery, W.D. Painterly Maiolica of the Italian Renaissance. Technol. Cult. 1993, 34, 28–48. [Google Scholar] [CrossRef]
  3. Wilson, T. Italian Maiolica and Europe: Medieval, Renaissance, and Later Italian Pottery in the Ashmolean Museum, Oxford, with Some Examples Illustrating the Spread of Tin-Glazed Pottery Across Europe; Ashmolean Museum of Art and Archaeology, University of Oxford: Oxford, UK, 2017; ISBN 1-910807-16-8. [Google Scholar]
  4. Tite, M.S. The Production Technology of Italian Maiolica: A Reassessment. J. Archaeol. Sci. 2009, 36, 2065–2080. [Google Scholar] [CrossRef]
  5. Pérez-Arantegui, J.; Molera, J.; Larrea, A.; Pradell, T.; Vendrell-Saz, M.; Borgia, I.; Brunetti, B.G.; Cariati, F.; Fermo, P.; Mellini, M.; et al. Luster Pottery from the Thirteenth Century to the Sixteenth Century: A Nanostructured Thin Metallic Film. J. Am. Ceram. Soc. 2004, 84, 442–446. [Google Scholar] [CrossRef]
  6. Van de Voorde, L.; Vandevijvere, M.; Vekemans, B.; Van Pevenage, J.; Caen, J.; Vandenabeele, P.; Van Espen, P.; Vincze, L. Study of a Unique 16th Century Antwerp Majolica Floor in the Rameyenhof Castle’s Chapel by Means of X-Ray Fluorescence and Portable Raman Analytical Instrumentation. Spectrochim. Acta B At. Spectrosc. 2014, 102, 28–35. [Google Scholar] [CrossRef]
  7. Manca, R. Non-Invasive, Scientific Analysis of 19th-Century Gold Jewellery and Maiolica. A Contribution to Technical Art History and Authenticity Studies. PhD Thesis, Università Degli Studi di Firenze, Florence, Italy, 2021. [Google Scholar]
  8. Fortina, C.; Santagostino Barbone, A.; Turbanti Memmi, I. Sienese ‘Archaic’ Majolica: A Technological Study of Ceramic Bodies and Coatings *. Archaeometry 2005, 47, 535–555. [Google Scholar] [CrossRef]
  9. Barcellos Lins, S.A.; Manso, M.; Barcellos Lins, P.A.; Brunetti, A.; Sodo, A.; Gigante, G.E.; Fabbri, A.; Branchini, P.; Tortora, L.; Ridolfi, S. Modular MA-XRF Scanner Development in the Multi-Analytical Characterisation of a 17th Century Azulejo from Portugal. Sensors 2021, 21, 1913. [Google Scholar] [CrossRef]
  10. Colomban, P. Non-Destructive Raman Analysis of Ancient Glasses and Glazes. In Modern Methods for Analysing Archaeological and Historical Glass; Janssens, K., Ed.; John Wiley & Sons Ltd: Oxford, UK, 2013; pp. 275–300. ISBN 978-1-118-31423-4. [Google Scholar]
  11. Gulmini, M.; Scognamiglio, F.; Roselli, G.; Vaggelli, G. Composition and Microstructure of Maiolica from the Museum of Ceramics in Ascoli Piceno (Italy): Evidences by Electron Microscopy and Microanalysis. Appl. Phys. A 2015, 120, 1643–1652. [Google Scholar] [CrossRef]
  12. Pappalardo, G.; Costa, E.; Marchetta, C.; Pappalardo, L.; Romano, F.P.; Zucchiatti, A.; Prati, P.; Mandò, P.A.; Migliori, A.; Palombo, L.; et al. Non-Destructive Characterization of Della Robbia Sculptures at the Bargello Museum in Florence by the Combined Use of PIXE and XRF Portable Systems. J. Cult. Herit. 2004, 5, 183–188. [Google Scholar] [CrossRef]
  13. Vanni, R.; Manca, R.; Chiari, M.; Mangani, S.M.E.; Benvenuti, M. Italian Maiolica between the 18th and 20th Century: The Contribution of Ion Beam Analysis. In Proceedings of the Congresso Tematico AIAr, Padova, Italy, 29 June–1 July 2022. [Google Scholar]
  14. Zucchiatti, A.; Bouquillon, A.; Lanterna, G.; Lucarelli, F.; Mando, P.A.; Prati, P.; Salomon, J.; Vaccari, M.G. PIXE and μ-PIXE Analysis of Glazes from Terracotta Sculptures of the Della Robbia Workshop. Nucl. Instrum. Methods Phys. Res. Sect. B Beam Interact. Mater. At. 2002, 189, 358–363. [Google Scholar] [CrossRef]
  15. Targowski, P.; Rouba, B.; Wojtkowski, M.; Kowalczyk, A. The Application of Optical Coherence Tomography to Non-Destructive Examination of Museum Objects. Stud. Conserv. 2004, 49, 107–114. [Google Scholar] [CrossRef]
  16. Read, M.; Cheung, C.S.; Ling, D.; Korenberg, C.; Meek, A.; Kogou, S.; Liang, H. A Non-Invasive Investigation of Limoges Enamels Using Both Optical Coherence Tomography (OCT) and Spectral Imaging: A Pilot Study. In Proceedings of the Optics for Arts, Architecture, and Archaeology VII, Munich, Germany, 12 July 2019; Targowski, P., Groves, R., Liang, H., Eds.; SPIE: Bellingham, WA, USA, 2019; p. 2. [Google Scholar]
  17. Targowski, P.; Góra, M.; Wojtkowski, M. Optical Coherence Tomography for Artwork Diagnostics. Laser Chem. 2006, 1–11. [Google Scholar] [CrossRef] [Green Version]
  18. Bernardini, F.; Vecchiet, A.; De Min, A.; Lenaz, D.; Mendoza Cuevas, A.; Gianoncelli, A.; Dreossi, D.; Tuniz, C.; Montagnari Kokelj, M. Neolithic Pottery from the Trieste Karst (Northeastern Italy): A Multi-Analytical Study. Microchem. J. 2016, 124, 600–607. [Google Scholar] [CrossRef]
  19. Yang, Y.; Wang, L.; Wei, S.; Song, G.; Kenoyer, J.M.; Xiao, T.; Zhu, J.; Wang, C. Nondestructive Analysis of Dragonfly Eye Beads from the Warring States Period, Excavated from a Chu Tomb at the Shenmingpu Site, Henan Province, China. Microsc. Microanal. 2013, 19, 335–343. [Google Scholar] [CrossRef]
  20. Fukunaga, K. THz Technology Applied to Cultural Heritage in Practice; Cultural Heritage Science; Springer Japan: Tokyo, Japan, 2016; ISBN 978-4-431-55883-5. [Google Scholar]
  21. Jackson, J.B.; Bowen, J.; Walker, G.; Labaune, J.; Mourou, G.; Menu, M.; Fukunaga, K. A Survey of Terahertz Applications in Cultural Heritage Conservation Science. IEEE Trans. Terahertz Sci. Technol. 2011, 1, 220–231. [Google Scholar] [CrossRef]
  22. Catapano, I.; Picollo, M.; Fukunaga, K. Terahertz Waves and Cultural Heritage: State-of-the-Art and Perspectives. In Sensing the Past; Masini, N., Soldovieri, F., Eds.; Geotechnologies and the Environment; Springer International Publishing: Switzerland, 2017; Volume 16, pp. 313–323. ISBN 978-3-319-50516-9. [Google Scholar]
  23. Tonouchi, M. Cutting-Edge Terahertz Technology. Nat. Photon 2007, 1, 97–105. [Google Scholar] [CrossRef]
  24. Chamberlain, J.M. Where Optics Meets Electronics: Recent Progress in Decreasing the Terahertz Gap. Philos. Trans. R. Soc. London. Ser. A Math. Phys. Eng. Sci. 2004, 362, 199–213. [Google Scholar] [CrossRef]
  25. Fukunaga, K.; Ogawa, Y.; Hayashi, S.; Hosako, I. Terahertz Spectroscopy for Art Conservation. IEICE Electron. Express 2007, 4, 258–263. [Google Scholar] [CrossRef] [Green Version]
  26. Parrott, E.P.J.; Zeitler, J.A. Terahertz Time-Domain and Low-Frequency Raman Spectroscopy of Organic Materials. Appl. Spectrosc. 2015, 69, 1–25. [Google Scholar] [CrossRef]
  27. Leahy-Hoppa, M.R.; Miragliotta, J.; Osiander, R.; Burnett, J.; Dikmelik, Y.; McEnnis, C.; Spicer, J.B. Ultrafast Laser-Based Spectroscopy and Sensing: Applications in LIBS, CARS, and THz Spectroscopy. Sensors 2010, 10, 4342–4372. [Google Scholar] [CrossRef] [Green Version]
  28. Öhrström, L.; Bitzer, A.; Walther, M.; Rühli, F.J. Technical Note: Terahertz Imaging of Ancient Mummies and Bone. Am. J. Phys. Anthropol. 2010, 142, 497–500. [Google Scholar] [CrossRef] [PubMed]
  29. Scheller, M. Real-Time Terahertz Material Characterization by Numerical Three-Dimensional Optimization. Opt. Express 2011, 19, 10647. [Google Scholar] [CrossRef] [PubMed]
  30. Castro-Camus, E.; Koch, M.; Mittleman, D.M. Recent Advances in Terahertz Imaging: 1999 to 2021. Appl. Phys. B 2022, 128, 12. [Google Scholar] [CrossRef]
  31. Wang, Q.; Xie, L.; Ying, Y. Overview of Imaging Methods Based on Terahertz Time-Domain Spectroscopy. Appl. Spectrosc. Rev. 2022, 27, 249–264. [Google Scholar] [CrossRef]
  32. Samanta, D.; Karthikeyan, M.; Banerjee, A.; Inokawa, H. Tunable Graphene Nanopatch Antenna Design for On-Chip Integrated Terahertz Detector Arrays with Potential Application in Cancer Imaging. Nanomedicine 2021, 16, 1035–1047. [Google Scholar] [CrossRef]
  33. Zappia, S.; Scapaticci, R.; Lodi, M.B.; Fanti, A.; Ruello, G.; Crocco, L.; Catapano, I. Non-Destructive Characterization of Magnetic Polymeric Scaffolds Using Terahertz Time-of-Flight Imaging. IEEE Trans. THz Sci. Technol. 2023, 305–315. [Google Scholar] [CrossRef]
  34. Liu, L.; Das, A.; Megaridis, C.M. Terahertz Shielding of Carbon Nanomaterials and Their Composites—A Review and Applications. Carbon. 2014, 69, 1–16. [Google Scholar] [CrossRef]
  35. Wang, B.; Zhong, S.; Lee, T.-L.; Fancey, K.S.; Mi, J. Non-Destructive Testing and Evaluation of Composite Materials/Structures: A State-of-the-Art Review. Adv. Mech. Eng. 2020, 12, 168781402091376. [Google Scholar] [CrossRef] [Green Version]
  36. Koch, M.; Hunsche, S.; Schuacher, P.; Nuss, M.C.; Feldmann, J.; Fromm, J. THz-Imaging: A New Method for Density Mapping of Wood. Wood Sci. Technol. 1998, 32, 421–427. [Google Scholar] [CrossRef]
  37. Fukunaga, K. Non-Destructive THz Pulsed TDI of Giotto Masterpiece. News Conserv. 2009, 10, 2. [Google Scholar]
  38. Anastasi, R.F. Terahertz NDE for Under Paint Corrosion Detection and Evaluation. In Proceedings of the AIP Conference Proceedings—AIP, Brunswick, MA, USA, 19 June 2006; Volume 820, pp. 515–522. [Google Scholar]
  39. Jackson, J.B.; Mourou, M.R.; Whitaker, J.F.; Duling, I.N.; Williamson, S.L.; Menu, M.; Mourou, G.A. Terahertz Time-Domain Reflectometry Applied to the Investigation of Hidden Mural Paintings. In Proceedings of the 2008 Conference on Lasers and Electro-Optics, San Jose, CA, USA, 4–9 May 2008; pp. 1–2. [Google Scholar]
  40. Adam, A.J.L.; Planken, P.C.M.; Meloni, S.; Dik, J. TeraHertz Imaging of Hidden Paint Layers on Canvas. Opt. Express 2009, 17, 3407. [Google Scholar] [CrossRef] [Green Version]
  41. Groves, R.M.; Pradarutti, B.; Kouloumpi, E.; Osten, W.; Notni, G. 2D and 3D Non-Destructive Evaluation of a Wooden Panel Painting Using Shearography and Terahertz Imaging. NDT E Int. 2009, 42, 543–549. [Google Scholar] [CrossRef]
  42. Alfeld, M.; Broekaert, J.A.C. Mobile Depth Profiling and Sub-Surface Imaging Techniques for Historical Paintings—A Review. Spectrochim. Acta Part B At. Spectrosc. 2013, 88, 211–230. [Google Scholar] [CrossRef]
  43. Seco-Martorell, C.; López-Domínguez, V.; Arauz-Garofalo, G.; Redo-Sanchez, A.; Palacios, J.; Tejada, J. Goya’s Artwork Imaging with Terahertz Waves. Opt. Express 2013, 21, 17800. [Google Scholar] [CrossRef] [Green Version]
  44. Doria, A.; Giovenale, E.; Gallerano, G.P.; Picollo, M.; Fukunaga, K. A Millimeter Wave/Terahertz 3D Scanner for Wall Painting Investigation. In Proceedings of the 2014 39th International Conference on Infrared, Millimeter, and Terahertz waves (IRMMW-THz), Tucson, AZ, USA, 14–19 September 2014; pp. 1–2. [Google Scholar] [CrossRef]
  45. Doria, A.; Gallerano, G.P.; Giovenale, E.; Casini, A.; Cucci, C.; Picollo, M.; Poggesi, M.; Stefani, L.; Fukunaga, K.; Tamassia, M. Vis-NIR Hyperspectral and Terahertz Imaging Investigations on a Fresco Painting on “Tavella” by Alessandro Gherardini. J. Infrared Milli Terahz Waves 2017, 38, 390–402. [Google Scholar] [CrossRef]
  46. Skryl, A.S.; Jackson, J.B.; Bakunov, M.I.; Menu, M.; Mourou, G.A. Terahertz Time-Domain Imaging of Hidden Defects in Wooden Artworks: Application to a Russian Icon Painting. Appl. Opt. 2014, 53, 1033. [Google Scholar] [CrossRef]
  47. Picollo, M.; Fukunaga, K.; Labaune, J. Obtaining Noninvasive Stratigraphic Details of Panel Paintings Using Terahertz Time Domain Spectroscopy Imaging System. J. Cult. Herit. 2015, 16, 73–80. [Google Scholar] [CrossRef]
  48. Dandolo, C.L.K.; Jepsen, P.U. Wall Painting Investigation by Means of Non-Invasive Terahertz Time-Domain Imaging (THz-TDI): Inspection of Subsurface Structures Buried in Historical Plasters. J. Infrared Milli Terahz Waves 2016, 37, 198–208. [Google Scholar] [CrossRef] [Green Version]
  49. Dandolo, C.L.K.; Guillet, J.-P.; Ma, X.; Fauquet, F.; Roux, M.; Mounaix, P. Terahertz Frequency Modulated Continuous Wave Imaging Advanced Data Processing for Art Painting Analysis. Opt. Express 2018, 26, 5358. [Google Scholar] [CrossRef]
  50. Koch Dandolo, C.L.; Lopez, M.; Fukunaga, K.; Ueno, Y.; Pillay, R.; Giovannacci, D.; Le Du, Y.; Bai, X.; Menu, M.; Detalle, V. Toward a Multimodal Fusion of Layered Cultural Object Images: Complementarity of Optical Coherence Tomography and Terahertz Time-Domain Imaging in the Heritage Field. Appl. Opt. 2019, 58, 1281. [Google Scholar] [CrossRef]
  51. Cassar, Q.; Koch-Dandolo, C.L.; Guillet, J.P.; Roux, M.; Fauquet, F.; Perraud, J.B.; Mounaix, P. Characterization of Varnish Ageing and Its Consequences on Terahertz Imagery: Demonstration on a Painting Presumed of the French Renaissance. J. Infrared Milli. Terahz. Waves 2020, 41, 1556–1566. [Google Scholar] [CrossRef]
  52. Catapano, I.; Ludeno, G.; Cucci, C.; Picollo, M.; Stefani, L.; Fukunaga, K. Noninvasive Analytical and Diagnostic Technologies for Studying Early Renaissance Wall Paintings. Surv. Geophys. 2020, 41, 669–693. [Google Scholar] [CrossRef]
  53. Fukunaga, K.; Hosako, I.; Palazzo, M.; DallAglio, L.; Aramini, F.; Cucci, C.; Picollo, M.; Ikari, T.; Duling, I.N. Terahertz Time-Domain Imaging of “The Last Supper”. In Proceedings of the 2020 45th International Conference on Infrared, Millimeter, and Terahertz Waves (IRMMW-THz), Buffalo, NY, USA, 8 November 2020; pp. 1–2. [Google Scholar]
  54. Lambert, F.E.M.; Reyes-Reyes, E.S.; Hernandez-Cardoso, G.G.; Gomez-Sepulveda, A.M.; Castro-Camus, E. In Situ Determination of the State of Conservation of Paint Coatings on the Kiosk of Guadalajara Using Terahertz Time-Domain Spectroscopy. J. Infrared Milli Terahz Waves 2020, 41, 355–364. [Google Scholar] [CrossRef]
  55. Catapano, I.; Affinito, A.; Guerriero, L.; Bisceglia, B.; Soldovieri, F. Majolica Imaging with THz Waves: Preliminary Results. Appl. Phys. A 2016, 122, 533. [Google Scholar] [CrossRef]
  56. Manca, R.; Tartaglia, E.; Benvenuti, M. Analisi Archeometriche per L’autenticazione di Maioliche Conservate Presso il Museo Nazionale Del Bargello, Relazione Scientifica Finale; Dipartimento di Scienze della Terra Università Degli Studi di Firenze: Florence, Italy, 2019; p. 111. [Google Scholar]
  57. Catapano, I.; Soldovieri, F.; Mazzola, L.; Toscano, C. THz Imaging as a Method to Detect Defects of Aeronautical Coatings. J. Infrared Milli Terahz Waves 2017, 38, 1264–1277. [Google Scholar] [CrossRef]
  58. Catapano, I.; Soldovieri, F. A Data Processing Chain for Terahertz Imaging and Its Use in Artwork Diagnostics. J. Infrared Milli Terahz Waves 2017, 38, 518–530. [Google Scholar] [CrossRef]
Figure 1. Schematic representation of two typical layer structures of Italian maiolica (thickness ranges taken from [4,5]). (a) Blue glaze and golden luster decoration: the earthenware body is covered by a white tin glaze; a blue colorant is fused into the glaze on the left side, while a luster decoration is applied over the white glaze on the right side. (b) Yellow decoration: the earthenware body is covered by a white tin glaze, a pigment layer, and a transparent overglaze (‘coperta’).
Coatings 13 01268 g001
Figure 2. Left: Pictures of the maiolica sherds analyzed in this study; red circles indicate the area from which samples were taken for microscopic analysis. Centre: images of the cross sections seen under the reflected light microscope. Right: SEM-EDS images of the cross sections (backscattered electrons). Numbers on the cross sections indicate the number of the layer as given in Table 1.
Coatings 13 01268 g002
Figure 3. Analyzed sample and THz data: (a) RGB image of the sample; the yellow spot, the red line, and the light blue area are related to the data shown in (bd), respectively; (b) THz waveform collected in a single measurement point over the sample (yellow spot in (a)); (c) THz B-scan or radargram collected from the red dashed line in (a); (d) THz data cube collected from the area in the light blue rectangle in (a).
Coatings 13 01268 g003
Figure 4. The Zomega Fiber-Coupled Terahertz (FiCO) system available at the Institute of Electromagnetic Sensing of the Environment, National Research Council of Italy used in this study.
Coatings 13 01268 g004
Figure 5. Sherd B_aut3. (a) RGB picture of the area analyzed by THz-TDI; (b) THz maximum amplitude image of the raw data, (c) of the FFT filtered data, (d) and of the FFT + SVD filtered data. The gray scale is in arbitrary units.
Coatings 13 01268 g005
Figure 6. Sherd B_aut3. C-scans at different depths showing, at each measurement point, the average of the amplitude of the signal in a time range of 0.6 ps. The time to depth conversion is made by assuming the relative permittivity equal to 22.
Coatings 13 01268 g006
Figure 7. Sherd Baut3. Left panel: Filtered and aligned B-scan along the red dashed line; Right panel: Waveforms from white (black line), blue (blue line), and brown (red dashed line) spots.
Coatings 13 01268 g007
Figure 8. Sherd C_aut2. (a) RGB picture of the area analyzed by THz-TDI; (b) THz maximum amplitude image of the FFT + SVD filtered data; (c) THz minimum amplitude image of the FFT + SVD filtered data. The gray scale is in arbitrary units.
Coatings 13 01268 g008
Figure 9. Sherd C_aut2. C-scans at different depths showing, at each measurement point, the average of the amplitude of the signal in a time range of 0.6 ps. The time to depth conversion is made by assuming the relative permittivity equal to 22.
Coatings 13 01268 g009
Figure 10. Sherd Baut3. Left panel: Filtered and aligned B-scan along the red dashed line; Right panel: mean waveforms from white (black line), blue (blue line), and luster (yellow dashed line) areas.
Coatings 13 01268 g010
Figure 11. Sherd Baut3. (a) RGB picture of the area analyzed by THz-TDI; (b) THz maximum amplitude image of the FFT + SVD filtered data. The gray scale is in arbitrary units.
Coatings 13 01268 g011
Figure 12. Sherd Baut3. C-scans at different depths showing, at each measurement point, the average of the amplitude of the signal in a time range of 0.6 ps. The time to depth conversion is made by assuming the relative permittivity equal to 22.
Coatings 13 01268 g012
Figure 13. Sherd Baut3. Left panel: Filtered and aligned B-scan along the red dashed line; Right panel: waveforms from white (black line), yellow (orange line), and blue (blue line) spots.
Coatings 13 01268 g013
Table 1. List of the analyzed maiolica sherds samples.
SampleDatePlace of ProductionLayer Structure (SEM-EDS)
B_aut315th cent.
(2nd half)
Florence (area of)
  • ceramic body
2.
white tin glaze
} 210 ± 20 μm
3.
colored glaze
C_aut216th cent.Deruta
  • ceramic body
2.
white tin glaze
} 210 ± 20 μm
3.
colored glaze/luster
B_aut415th cent.
(2nd half)
Deruta
  • ceramic body
2.
white tin glaze
→ 150 ± 20 μm
3.
yellow pigment layer
→ 20 ± 10 μm
4.
transparent overglaze
→ 60 ± 20 μm
Disclaimer/Publisher’s Note: The statements, opinions and data contained in all publications are solely those of the individual author(s) and contributor(s) and not of MDPI and/or the editor(s). MDPI and/or the editor(s) disclaim responsibility for any injury to people or property resulting from any ideas, methods, instructions or products referred to in the content.

