Figure 1.
Characterization of Zn powders: (a) SE morphology and magnified view of Zn powders, and (b) particle diameter distribution.
Figure 1.
Characterization of Zn powders: (a) SE morphology and magnified view of Zn powders, and (b) particle diameter distribution.
Figure 2.
Surface morphology after laser alloying with varying amounts of applied Zn powder and laser powers: (a) 20 mg × cm−2 and 250 W, (b) 20 mg × cm−2 and 1000 W, (c) 20 mg × cm−2 and 1250 W with magnified view within the red boxed area revealing the presence of minute cracks, (d) 80 mg × cm−2 and 1000 W; cross-section morphologies of (e) 20 mg × cm−2 and (f) 80 mg × cm−2 applied Zn powder after laser alloying by laser power 1000 W.
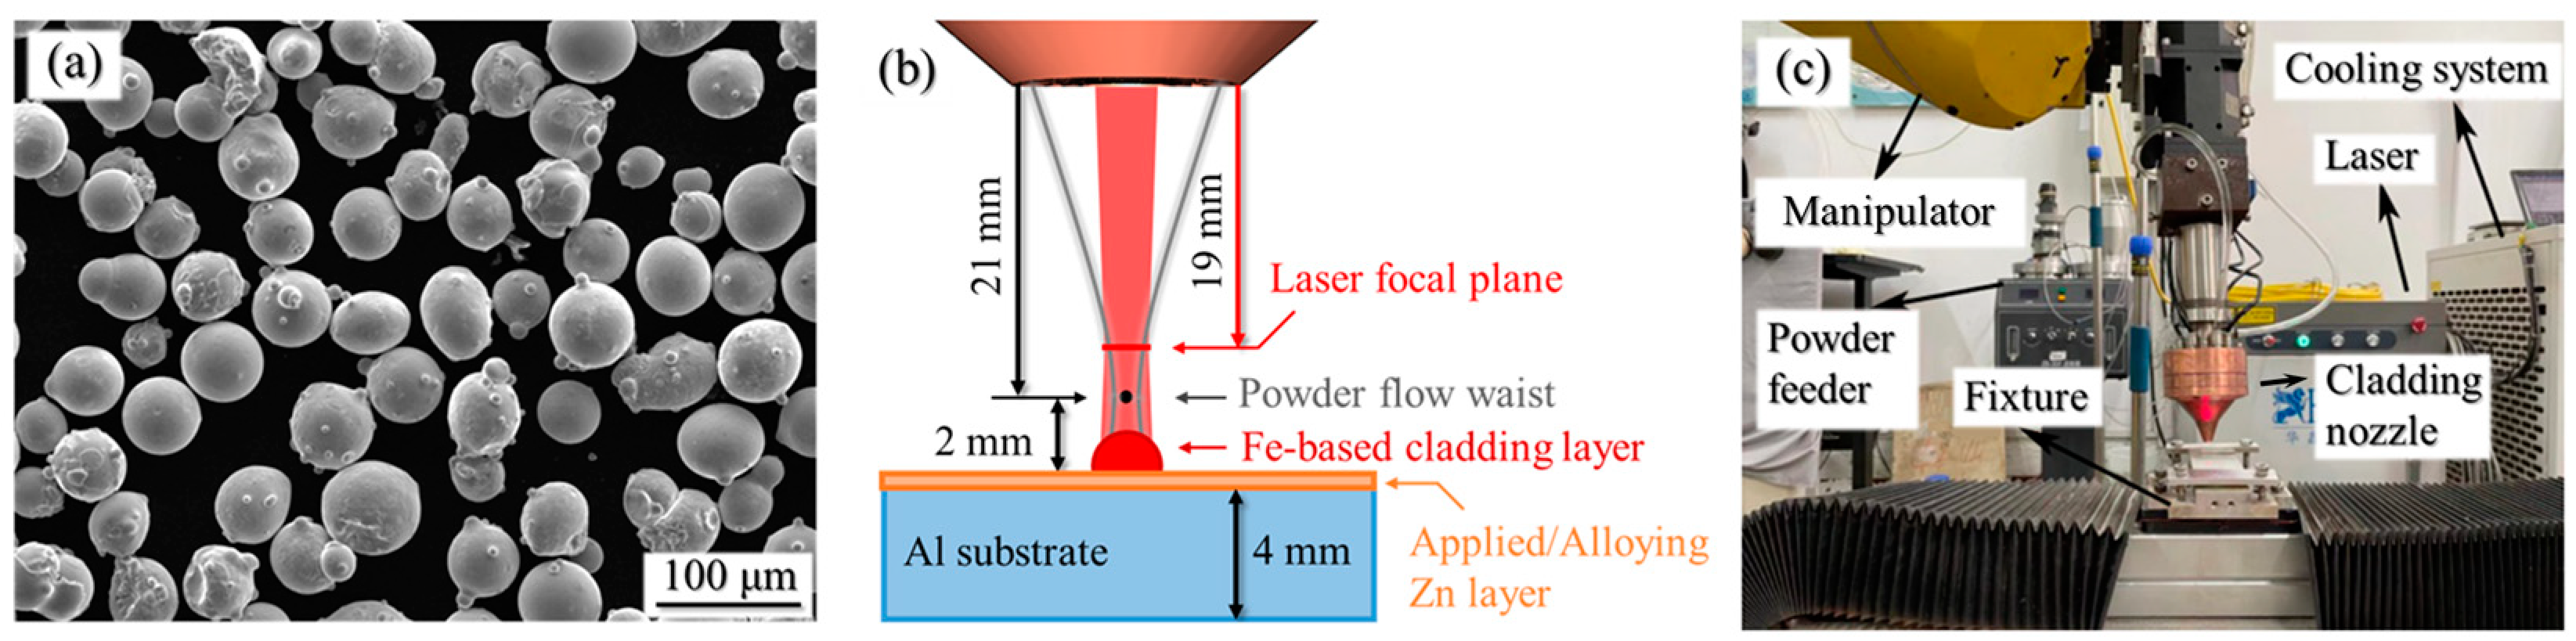
Figure 3.
Laser cladding material and process: (a) SE morphology of 1Cr17Ni2B1Si1 martensitic stainless steel powder, (b) schematic of laser cladding process and (c) laser cladding equipment.
Figure 3.
Laser cladding material and process: (a) SE morphology of 1Cr17Ni2B1Si1 martensitic stainless steel powder, (b) schematic of laser cladding process and (c) laser cladding equipment.
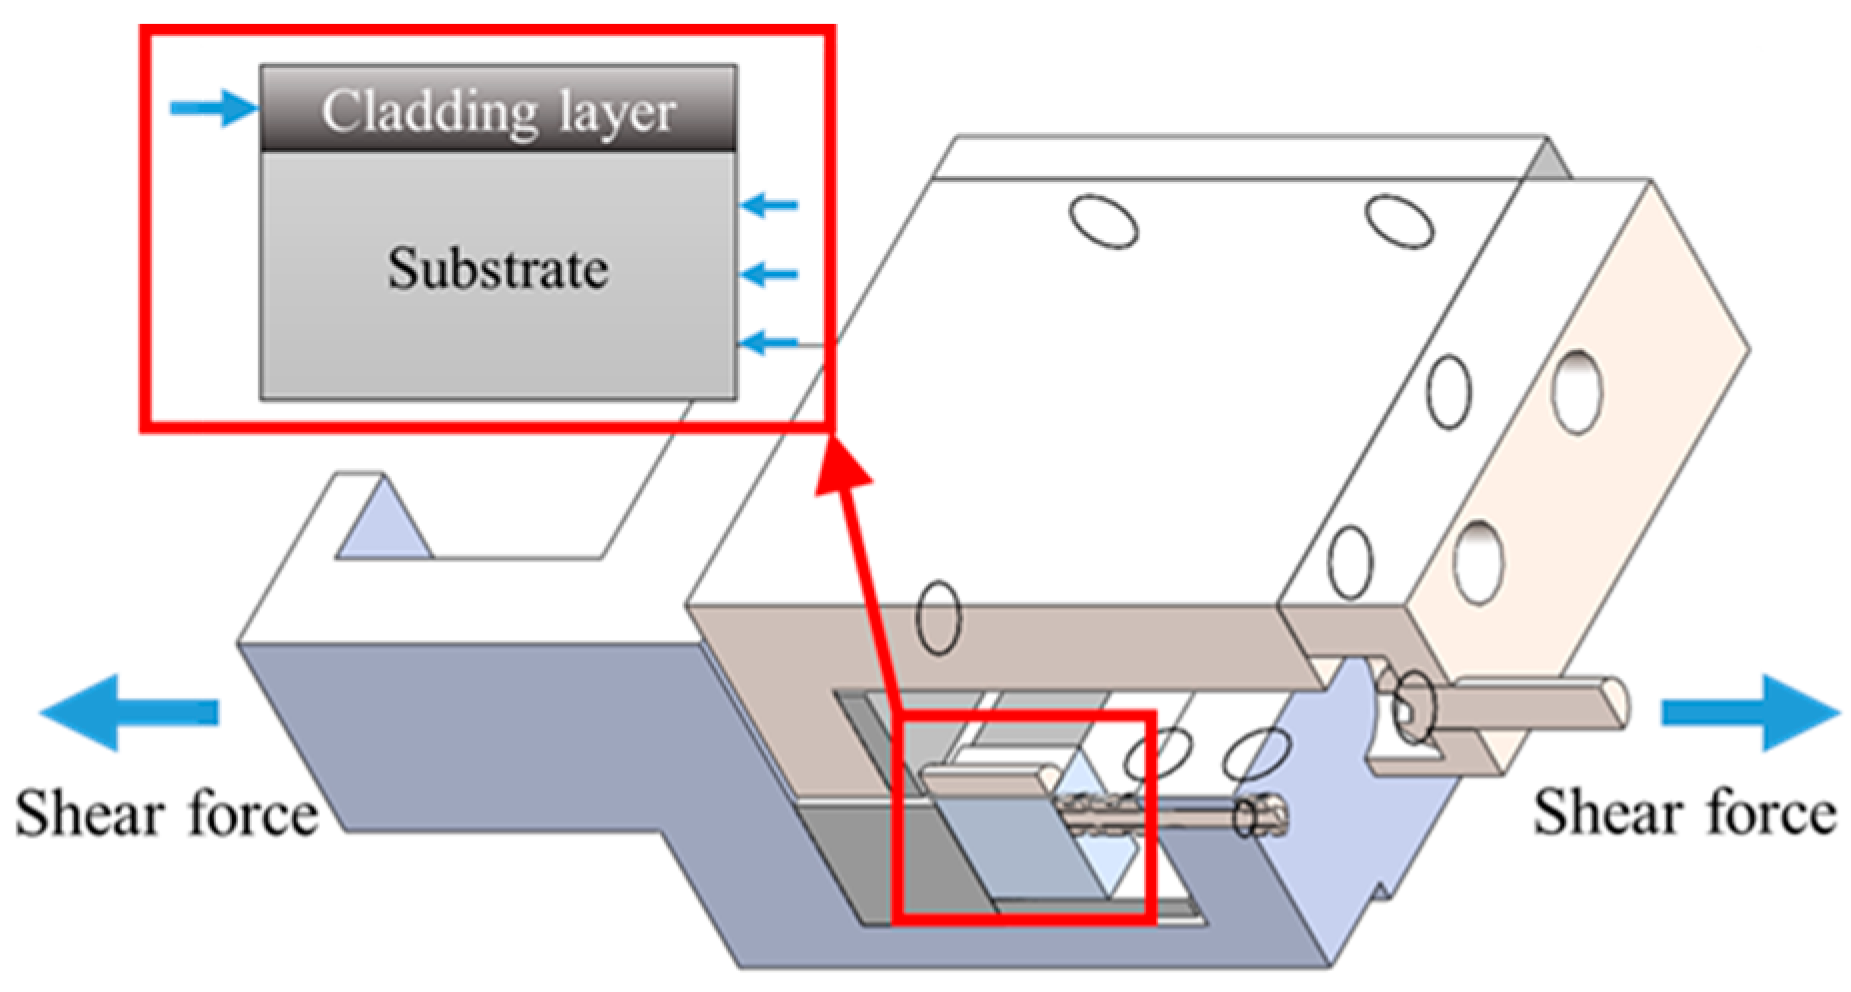
Figure 4.
Shear fixture diagram and test process.
Figure 4.
Shear fixture diagram and test process.
Figure 5.
The (a–h) BSE morphologies, (i) thickness and (j) contact angle of the cross-section of the cladding layer. The red lines and arrows indicate the measurement methods for the thickness of the cladding layer and the contact angle.
Figure 5.
The (a–h) BSE morphologies, (i) thickness and (j) contact angle of the cross-section of the cladding layer. The red lines and arrows indicate the measurement methods for the thickness of the cladding layer and the contact angle.
Figure 6.
BSE morphologies of interface with applied Zn powder (a) 20 mg × cm−2, (b) 40 mg × cm−2, (c) 60 mg × cm−2, (d) 80 mg × cm−2; and magnified segments showing element distribution of specific areas from (a,b,d) corresponding to (e–g), respectively.
Figure 6.
BSE morphologies of interface with applied Zn powder (a) 20 mg × cm−2, (b) 40 mg × cm−2, (c) 60 mg × cm−2, (d) 80 mg × cm−2; and magnified segments showing element distribution of specific areas from (a,b,d) corresponding to (e–g), respectively.
Figure 7.
BSE morphologies of interface with applied Zn powder (a) 20 mg × cm−2, (b) 40 mg × cm−2, (c) 60 mg × cm−2, (d) 80 mg × cm−2; and magnified segments showing element distribution of specific areas from (a,d) corresponding to (e,f), respectively.
Figure 7.
BSE morphologies of interface with applied Zn powder (a) 20 mg × cm−2, (b) 40 mg × cm−2, (c) 60 mg × cm−2, (d) 80 mg × cm−2; and magnified segments showing element distribution of specific areas from (a,d) corresponding to (e,f), respectively.
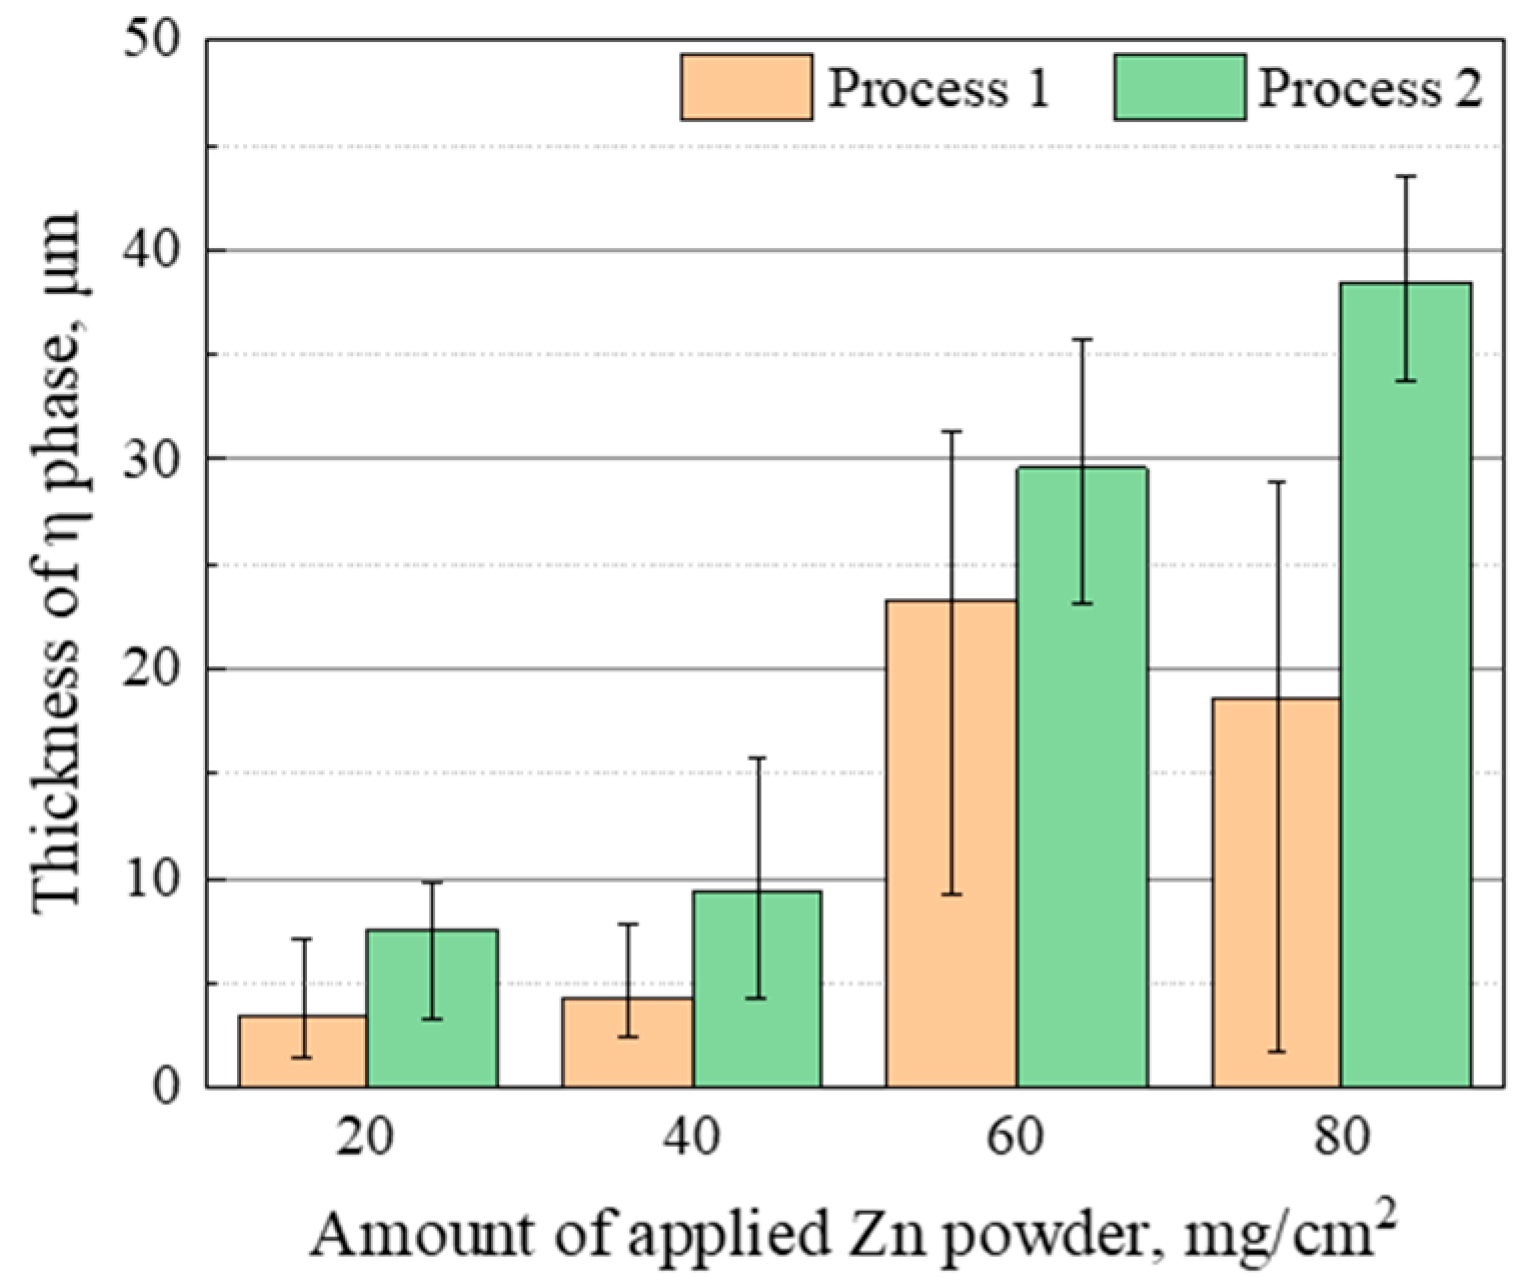
Figure 8.
Comparison of the thickness of the η layer under two different processes at various amounts of applied Zn powder.
Figure 8.
Comparison of the thickness of the η layer under two different processes at various amounts of applied Zn powder.
Figure 9.
Impact of surface energy density and Zn coating on η phase thickness at interface [
10,
28,
29,
30,
31,
32,
33].
Figure 9.
Impact of surface energy density and Zn coating on η phase thickness at interface [
10,
28,
29,
30,
31,
32,
33].
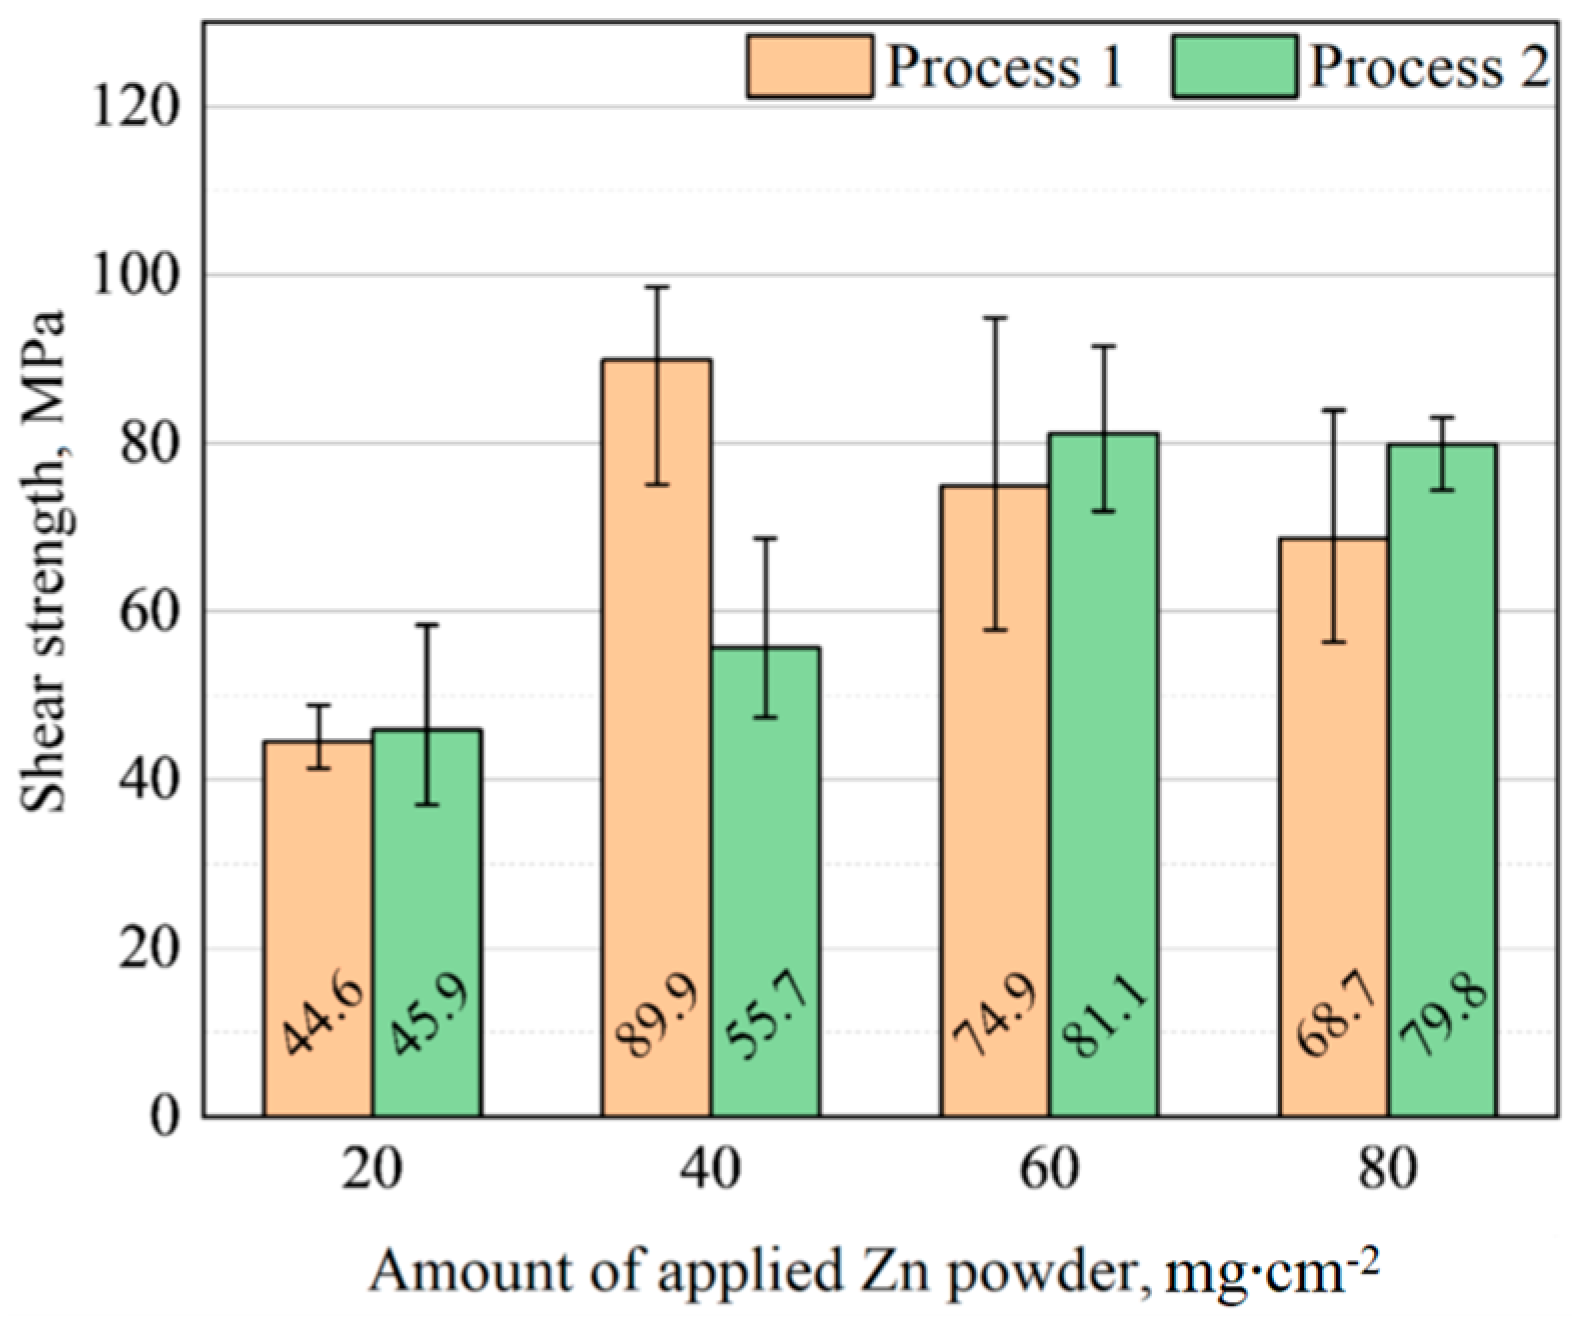
Figure 10.
Shear strength of the interface.
Figure 10.
Shear strength of the interface.
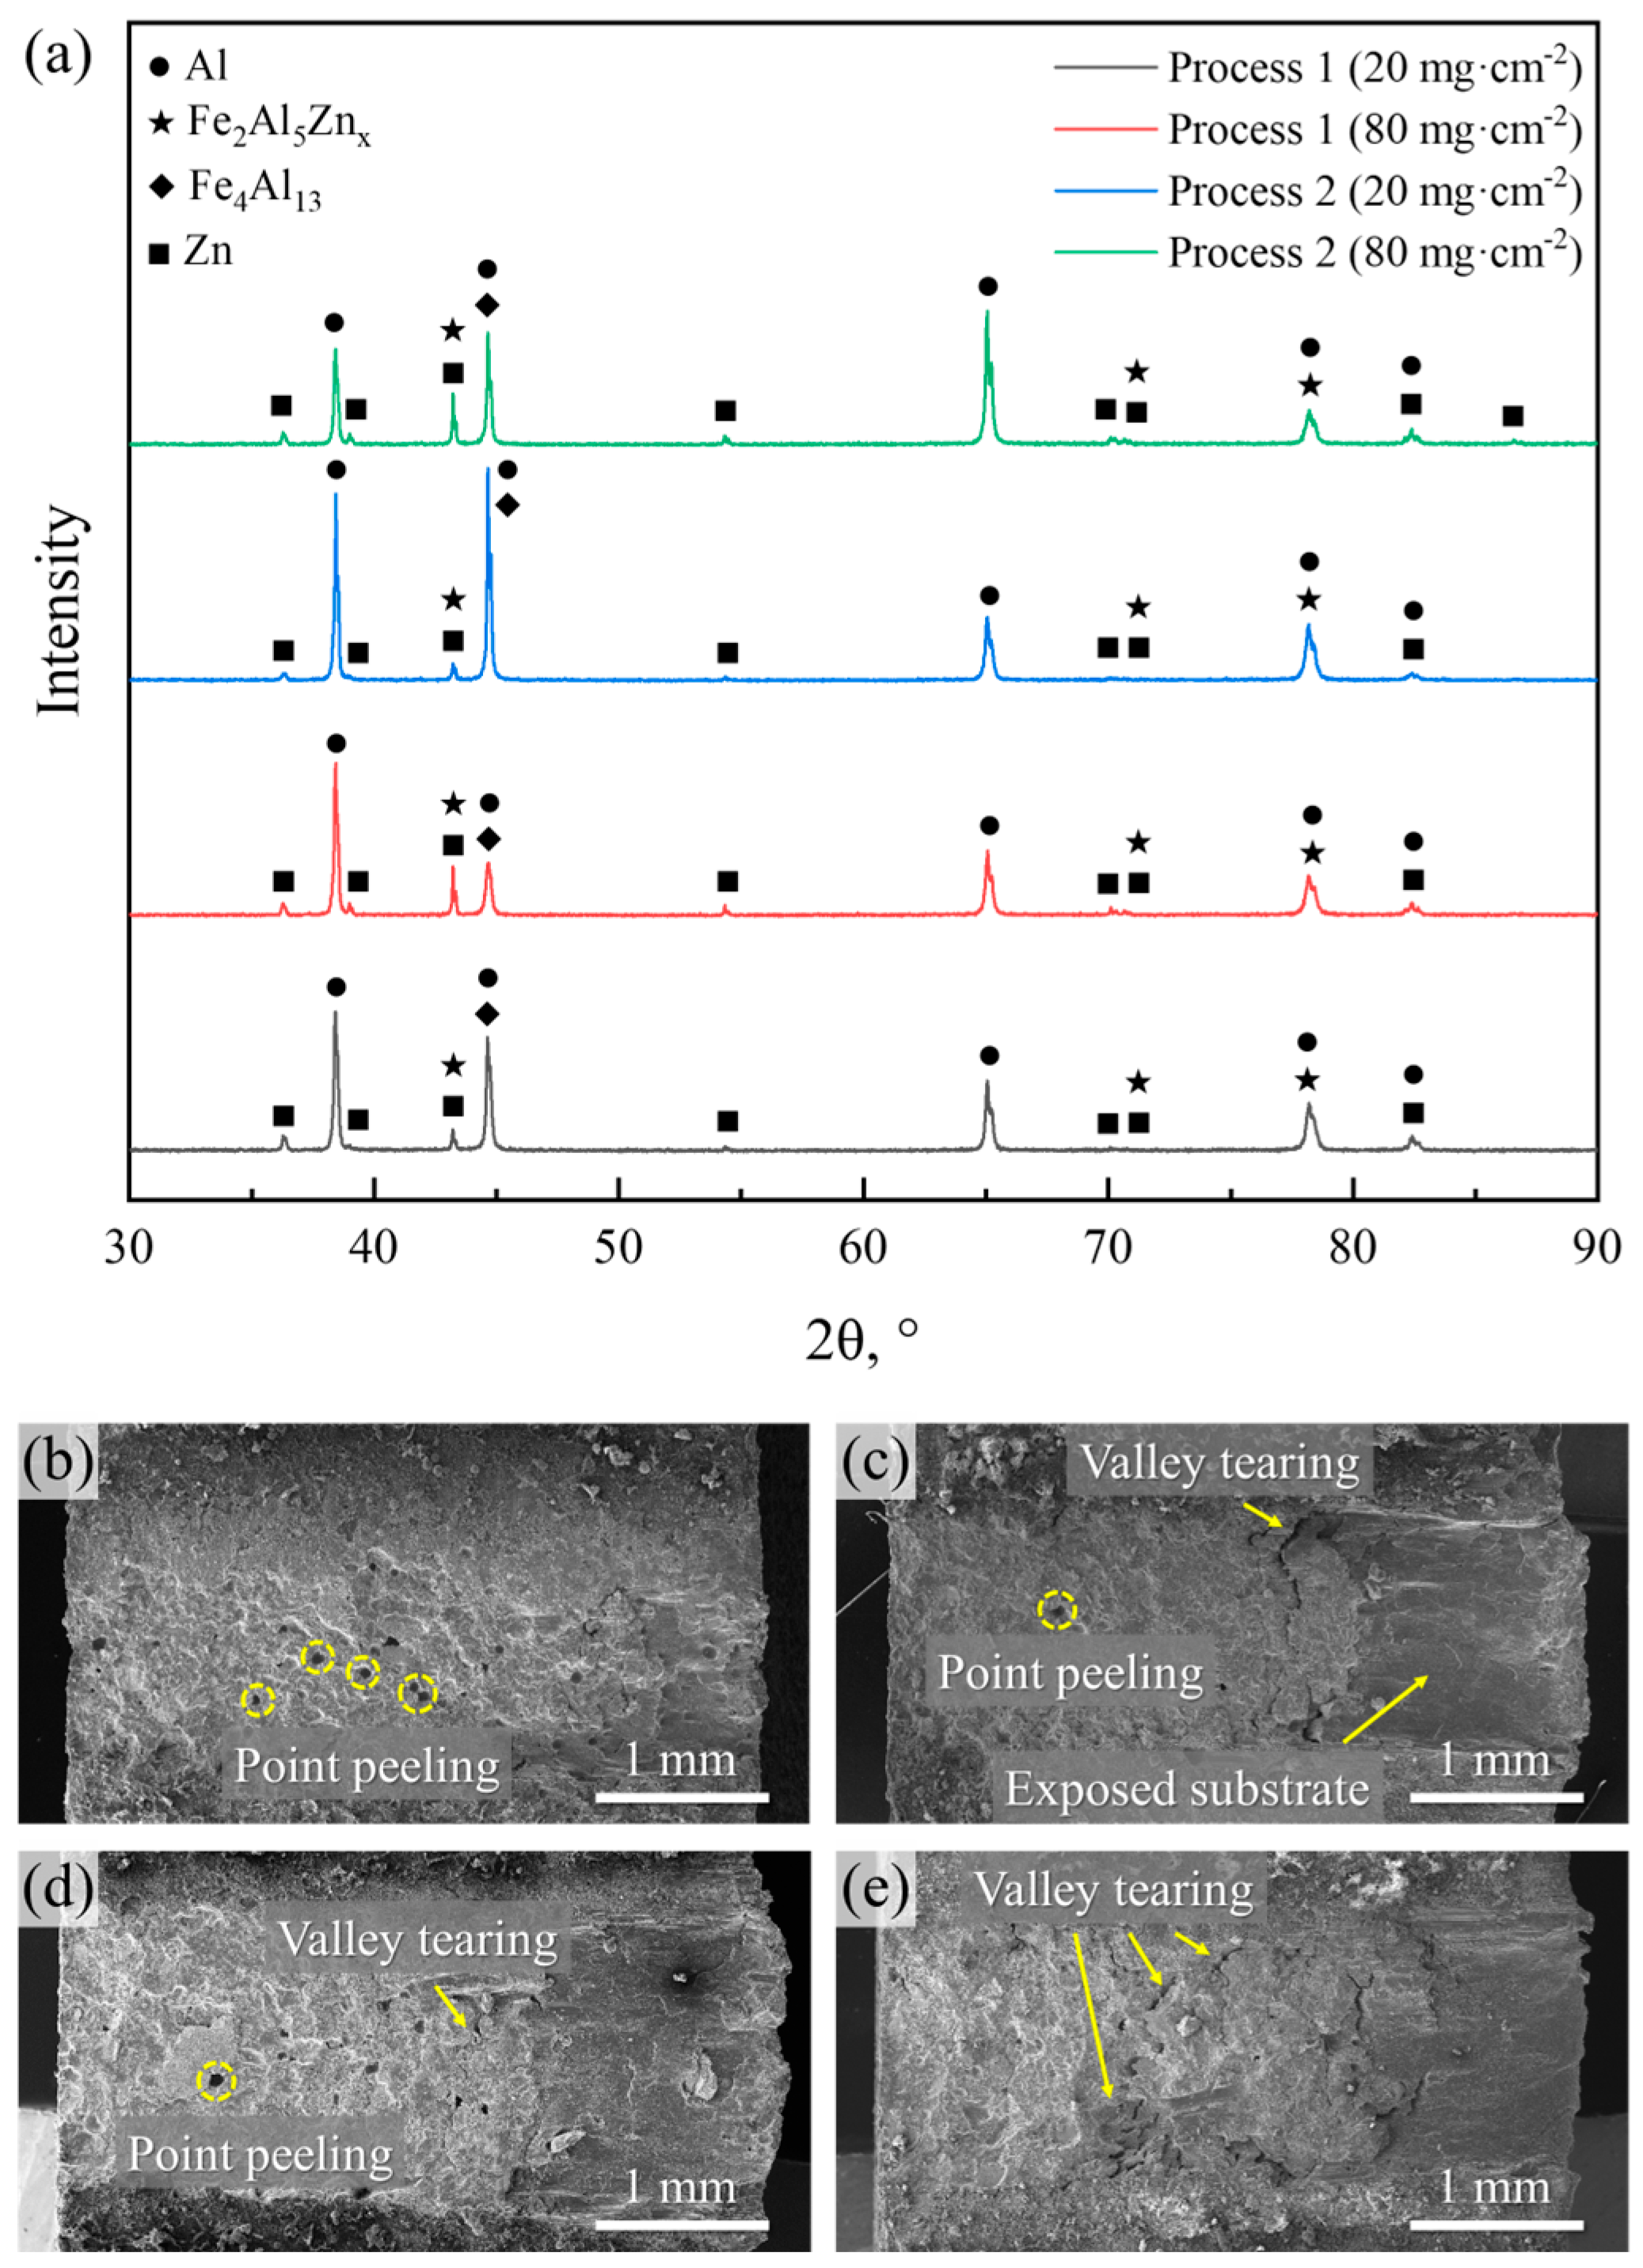
Figure 11.
Shear fracture analysis of samples: (a) XRD results and macroscopic morphology of (b) process 1 with 20 mg × cm−2 applied Zn powder layer; (c) process 1 with 80 mg × cm−2 applied Zn powder layer; (d) process 2 with 20 mg × cm−2 applied Zn powder layer; (e) process 2 with 80 mg × cm−2 applied Zn powder layer.
Figure 12.
Fracture section morphologies of process 1: (a) BSE morphology with 20 mg × cm−2 applied Zn powder; (b) BSE morphology with 40 mg × cm−2 applied Zn powder; (c) SE morphology of coarse dendrites θ phase; (d) SE morphology of tear area.
Figure 12.
Fracture section morphologies of process 1: (a) BSE morphology with 20 mg × cm−2 applied Zn powder; (b) BSE morphology with 40 mg × cm−2 applied Zn powder; (c) SE morphology of coarse dendrites θ phase; (d) SE morphology of tear area.
Figure 13.
Fracture section morphologies of process 2: (a) BSE morphology with 20 mg × cm−2 applied Zn powder; (b) BSE morphology with 80 mg × cm−2 applied Zn powder; (c) SE morphology of brittle fracture; (d) SE morphology of tear area; (e) SE morphology of coarse dendrite θ phase; (f) SE morphology of torn Al substrate area.
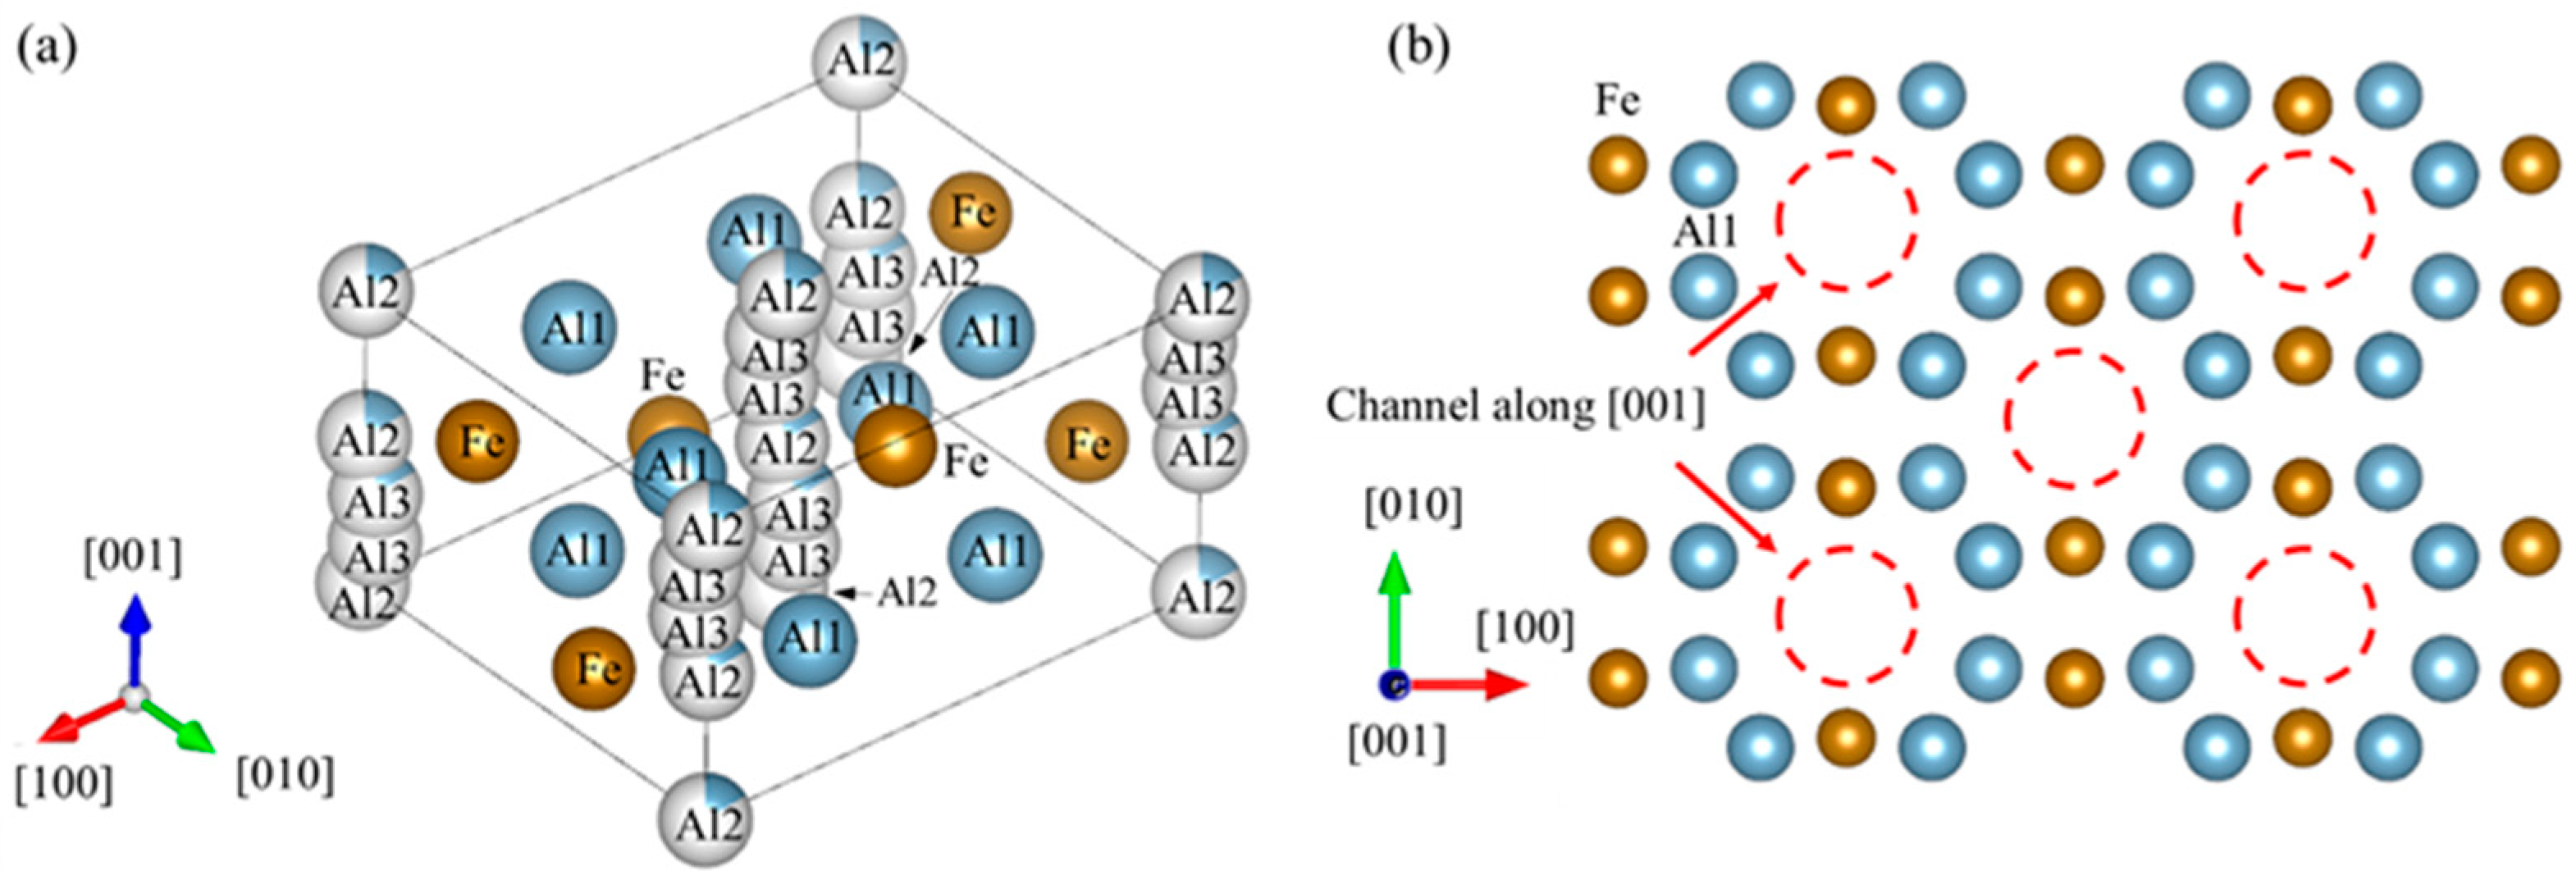
Figure 14.
Crystal structure of η-Fe2Al5: (a) Atom position of Fe, Al1, Al2 and Al3, and (b) channel in direction.
Figure 14.
Crystal structure of η-Fe2Al5: (a) Atom position of Fe, Al1, Al2 and Al3, and (b) channel in direction.
Figure 15.
Calculation model of (a) Fe2Al5 and (b) Fe2Al5Znx.
Figure 15.
Calculation model of (a) Fe2Al5 and (b) Fe2Al5Znx.
Figure 16.
Calculated anisotropic elastic moduli of Fe2Al5 and Fe2Al5Znx: (a) Young’s modulus and (b) shear modulus of Fe2Al5; (c) Young’s modulus and (d) shear modulus of Fe2Al5Znx. (Unit: GPa).
Figure 16.
Calculated anisotropic elastic moduli of Fe2Al5 and Fe2Al5Znx: (a) Young’s modulus and (b) shear modulus of Fe2Al5; (c) Young’s modulus and (d) shear modulus of Fe2Al5Znx. (Unit: GPa).
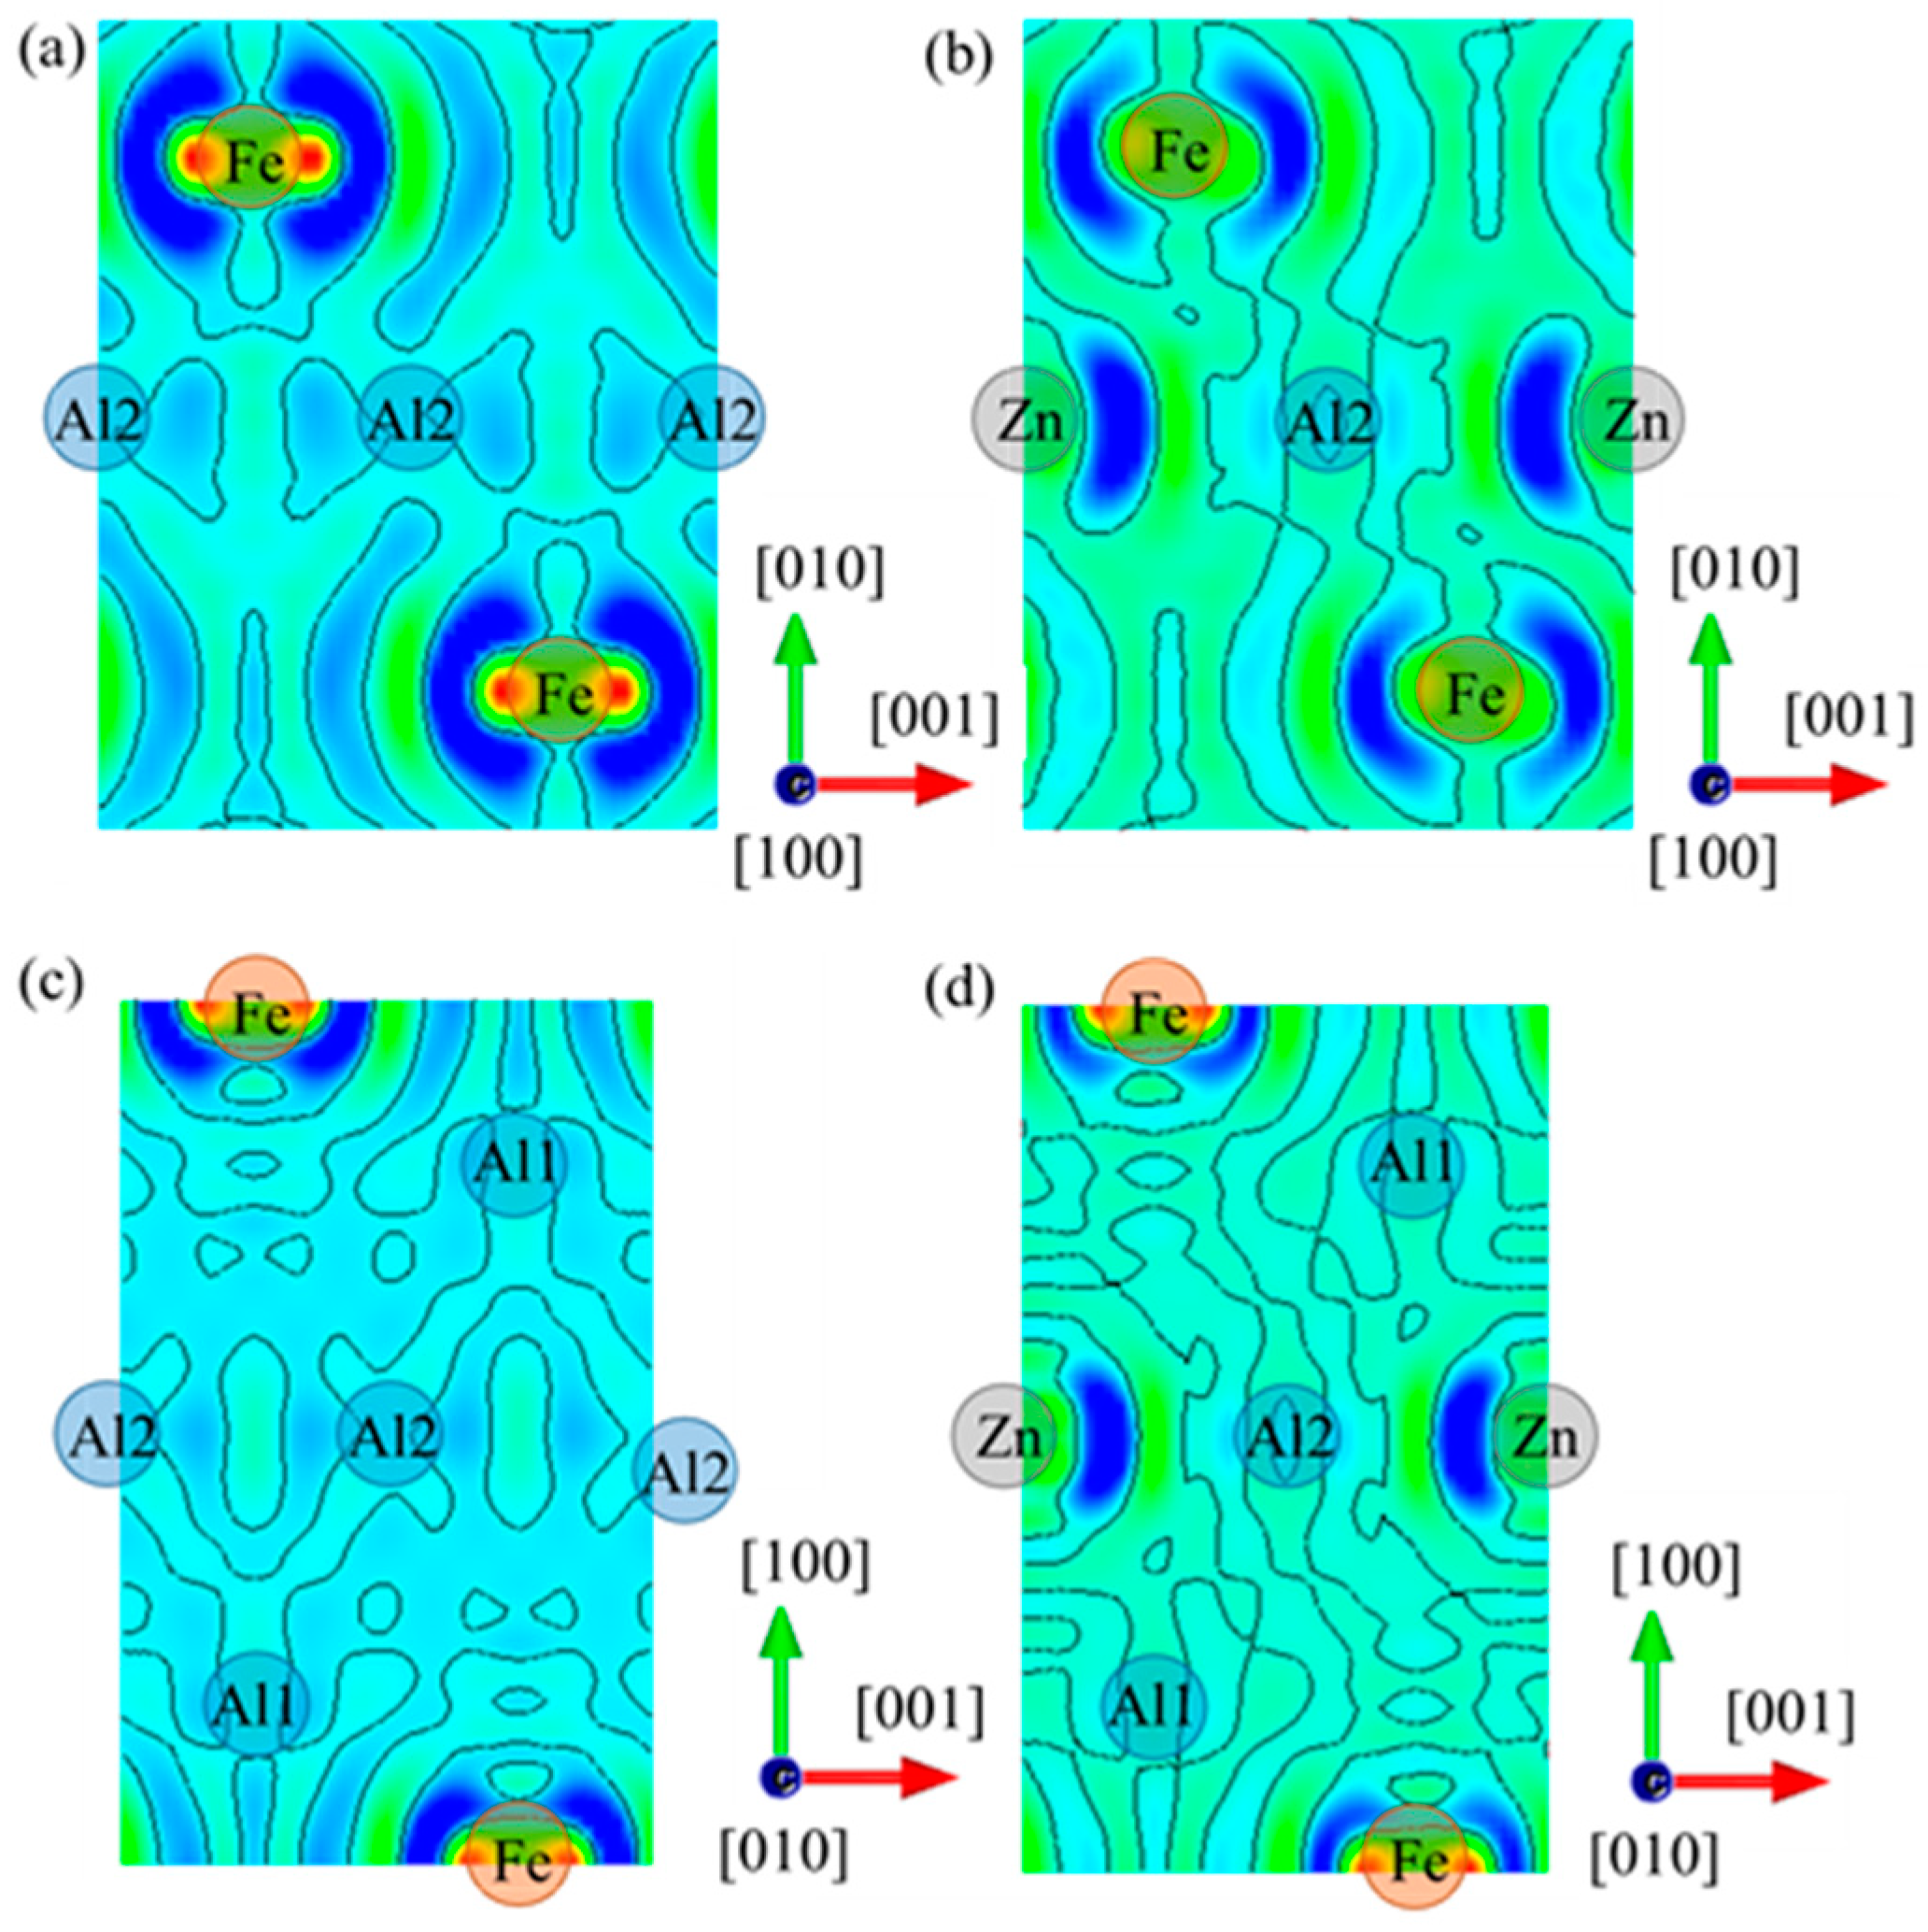
Figure 17.
Differential charge density on crystal planes, (a) plane of Fe2Al5, (b) plane of Fe2Al5Znx, (c) plane of Fe2Al5 and (d) plane of Fe2Al5Znx.
Figure 17.
Differential charge density on crystal planes, (a) plane of Fe2Al5, (b) plane of Fe2Al5Znx, (c) plane of Fe2Al5 and (d) plane of Fe2Al5Znx.
Table 1.
Element content of the test points, at.%.
Table 1.
Element content of the test points, at.%.
| 20 mg × cm−2 | Point | 1 | 2 | 3 | 4 | 5 | 6 | 7 | 8 |
| Al | 95.67 | 6.20 | 55.97 | 42.23 | 24.71 | 96.54 | 99.26 | 99.57 |
| Zn | 4.33 | 93.80 | 44.03 | 57.77 | 75.29 | 3.46 | 0.74 | 0.43 |
| 80 mg × cm−2 | Point | 9 | 10 | 11 | 12 | 13 | 14 | 15 | 16 |
| Al | 3.29 | 57.92 | 60.46 | 10.65 | 27.69 | 97.40 | 98.76 | 98.72 |
| Zn | 96.71 | 42.08 | 39.54 | 89.35 | 72.31 | 2.60 | 1.24 | 1.28 |
Table 2.
Cladding parameters.
Table 2.
Cladding parameters.
| Parameter | Unit | Value |
|---|
| Laser power | W | 2000 |
| Cladding speed | m × min−1 | 1.0 |
| Carrier gas pressure | MPa | 0.1 |
| Carrier gas flow rate | L × min−1 | 8.0 |
| Powder feeding rate | g × min−1 | 28.8 |
| Shielding gas pressure | MPa | 0.2 |
| Shielding gas flow rate | m3 × h−1 | 1.0 |
Table 3.
Element content at the test point of process 1, at.%.
Table 3.
Element content at the test point of process 1, at.%.
| Process | Position | Al | Cr | Fe | Zn | Phase |
|---|
| 20 mg × cm−2 | 1 | 16.30 | 13.32 | 70.39 | 0 | β1-(Fe-Cr)3Al |
| 2 | 70.80 | 3.58 | 25.18 | 0.45 | η-(Fe-Cr)2Al5Znx |
| 3 | 69.13 | 7.78 | 22.49 | 0.61 | η-(Fe-Cr)2Al5Znx |
| 4 | 81.89 | 1.19 | 16.26 | 0.65 | θ-(Fe-Cr)4Al13 |
| 5 | 98.55 | 0.07 | 0.66 | 0.72 | Al-Zn |
| 6 | 97.74 | 0.35 | 1.55 | 0.36 | Al-Zn |
| 40 mg × cm−2 | 7 | 2.46 | 16.10 | 80.41 | 1.03 | M-Fe4Cr |
| 8 | 71.63 | 4.53 | 22.34 | 1.50 | η-(Fe-Cr)2Al5Znx |
| 9 | 71.06 | 4.89 | 22.93 | 1.12 | η-(Fe-Cr)2Al5Znx |
| 10 | 78.95 | 1.40 | 18.37 | 1.29 | θ-(Fe-Cr)4Al13 |
| 11 | 79.69 | 1.95 | 17.32 | 1.05 | θ-(Fe-Cr)4Al13 |
| 12 | 93.50 | 0.11 | 0.65 | 5.74 | Al-Zn |
| 13 | 95.72 | 0.55 | 1.31 | 2.43 | Al-Zn |
| 80 mg × cm−2 | 14 | 10.16 | 19.38 | 70.16 | 0.29 | M-Fe4Cr |
| 15 | 63.78 | 4.85 | 28.60 | 2.77 | η-(Fe-Cr)2Al5Znx |
| 16 | 77.74 | 2.02 | 19.66 | 0.59 | θ-(Fe-Cr)4Al13 |
| 17 | 80.35 | 1.78 | 17.00 | 0.87 | θ-(Fe-Cr)4Al13 |
| 18 | 92.44 | 1.06 | 1.41 | 5.09 | Al-Zn |
Table 4.
Element content at the test point of process 2, at.%.
Table 4.
Element content at the test point of process 2, at.%.
| Process | Position | Al | Cr | Fe | Zn | Phase |
|---|
| 40 mg × cm−2 | 1 | 67.48 | 6.11 | 25.81 | 0.59 | η-(Fe-Cr)2Al5Znx |
| 2 | 69.49 | 4.71 | 24.91 | 0.88 | η-(Fe-Cr)2Al5Znx |
| 3 | 81.66 | 2.96 | 14.79 | 0.59 | θ-(Fe-Cr)4Al13 |
| 4 | 93.90 | 0.92 | 4.29 | 0.89 | Al-Fe |
| 5 | 97.79 | 0.24 | 1.09 | 0.88 | Al-Zn |
| 6 | 97.81 | 0.44 | 1.25 | 0.50 | Al-Zn |
| 80 mg × cm−2 | 7 | 69.10 | 2.97 | 25.37 | 2.56 | η-(Fe4Cr)2Al5Znx |
| 8 | 70.03 | 6.09 | 20.92 | 2.96 | η-(Fe4Cr)2Al5Znx |
| 9 | 80.52 | 2.39 | 15.60 | 1.48 | θ-(Fe4Cr)4Al13 |
| 10 | 94.38 | 0.38 | 1.31 | 3.93 | Al-Zn |
| 11 | 94.51 | 0.14 | 0.20 | 5.15 | Al-Zn |
| 12 | 94.97 | 0.21 | 1.22 | 3.60 | Al-Zn |
Table 5.
Zn layer thickness (TZn), thickness of η phase (Tη), velocity (v), laser power (P), laser spot diameter (d), materials brand of some Fe-Al laser joining technologies.
Table 5.
Zn layer thickness (TZn), thickness of η phase (Tη), velocity (v), laser power (P), laser spot diameter (d), materials brand of some Fe-Al laser joining technologies.
| Initial Surface | TZn, μm | Tη, μm | v, mm×s−1 | P, W | d, mm | Materials Brand | Ref. |
|---|
Without
Zn coating | 0 | 4 | 20 | 3000 | 1 | 6016/DC 04 | [10] |
| 5 | 16.7 |
| 8 | 11.7 |
| 10 | 25 | 1500 | 2.5–3.5 | 5052/low carbon steel | [28] |
| 2 | 40 |
| 5 | 10 | 2200 | 0.85 | 6061/S235-JR | [29] |
| 3 | 10 |
| 1 | 10 |
| Zn coated | 10 | 23 | 10 | 3000 | 1 | 6016/DC 04 | [10] |
| 8 | 20 |
| 4 | 23.3 |
| 7.1 | 30 | 5 | 1500 | 1.5 | A5052/SPCC-GA | [30] |
| 3 | 3.33 |
| 20 | 40 | 10 | 3000 | ~2 | 6016/DC 04 | [31] |
| 5 | 23.3 |
| 10 | 5 | 11.7 | 1000 | 2 × 0.8 | 7075/DP590 | [32] |
| 9 | 11.7 | 1300 |
| 12 | 11.7 | 1600 |
| 20 | 3.5 | 8.3 | 1500 | ~1.5 | GI/A6000 | [33] |
| 1.2 | 10 |
Table 6.
Element content at the corresponding position of process 1, at.%.
Table 6.
Element content at the corresponding position of process 1, at.%.
| Process | 0 | Al | Cr | Fe | Zn | Phase |
|---|
| 20 mg × cm−2 | 1 | 61.75 | 7.31 | 30.11 | 0.84 | η-(Fe-Cr)2Al5Zn0.1 |
| 2 | 77.13 | 3.4 | 19.27 | 0.19 | θ-(Fe-Cr)4Al13 |
| 3 | 84.17 | 3.48 | 11.94 | 0.40 | θ-(Fe-Cr)4Al13 |
| 40 mg × cm−2 | 4 | 43.94 | 8.79 | 45.88 | 0.39 | β2-(Fe-Cr)Al |
| 5 | 66.01 | 5.97 | 25.57 | 2.45 | η-(Fe-Cr)2Al5Zn0.2 |
| 6 | 78.58 | 2.38 | 19.04 | 0 | θ-(Fe-Cr)4Al13 |
Table 7.
Element content at the corresponding position of process 2, at.%.
Table 7.
Element content at the corresponding position of process 2, at.%.
| Process | Point | Al | Cr | Fe | Zn | Phase |
|---|
| 20 mg × cm−2 | 1 | 97.25 | 0.05 | 2.62 | 0.98 | Al-Fe-Zn |
| 2 | 61.67 | 6.17 | 31.48 | 0.68 | η-(Fe-Cr)2Al5 |
| 3 | 12.05 | 16.17 | 71.03 | 0.75 | α-(Fe-Cr) |
| 80 mg × cm−2 | 4 | 5.97 | 18.58 | 75.37 | 0.09 | α-(Fe-Cr) |
| 5 | 97.61 | 0.08 | 0.74 | 1.58 | Al-Fe-Zn |
| 6 | 55.77 | 6.70 | 32.70 | 4.83 | η-(Fe-Cr)2Al5Znx |
| 7 | 0.81 | 20.07 | 78.53 | 0.59 | α-(Fe-Cr) |
| | 8 | 77.09 | 2.85 | 18.97 | 1.08 | θ-(Fe-Cr)4Al13 |
Table 8.
Calculated lattice constant and formation enthalpy of Fe2Al5 and Fe2Al5Znx.
Table 8.
Calculated lattice constant and formation enthalpy of Fe2Al5 and Fe2Al5Znx.
| Phase | Method | a (Å) | b (Å) | c (Å) | Angle | ΔHf (kJ × mol−1) |
|---|
| Fe2Al5 | This work | 7.476 | 6.214 | 4.741 | α = β = γ = 90° | −16.99 |
| EAM | 7.622 | 6.323 | 4.178 | −14.09 [17] |
| Fe2Al5Znx | This work | 7.477 | 6.236 | 4.700 | α = 90.125°
β = γ = 90° | −17.62 |
Table 9.
Elastic constants of Fe2Al5 and Fe2Al5Znx.
Table 9.
Elastic constants of Fe2Al5 and Fe2Al5Znx.
| Fe2Al5 | C11 | C12 | C13 | C22 | C23 | C33 | C44 | C55 | C66 |
| 240.91 | 66.08 | 53.07 | 283.08 | 63.37 | 272.50 | 70.26 | 52.30 | 86.33 |
| Fe2Al5Znx | C11 | C12 | C13 | C22 | C23 | C33 | C44 | C55 | C66 |
| 233.56 | 64.31 | 55.16 | 277.00 | 66.83 | 265.66 | 75.92 | 54.22 | 86.07 |
| C15 | C25 | C35 | C46 | | | | | |
| 4.15 | −1.03 | 2.07 | 1.38 | | | | | |


