Article

Influence of Cr Nanoparticles on Plasma Electrolytic Oxidation Coatings on AM50 Mg Alloy

1
Shenyang National Laboratory for Materials Science, Northeastern University, 3-11 Wenhua Road, Shenyang 110819, China
2
Faculty of Chemistry, Belarusian State University, Nezavisimosti Avenue 4, 220030 Minsk, Belarus
3
State Scientific-Production Association “Scientific and Practical Materials Research Center of National Academy of Science of Belarus”, P. Brovki Str. 19, 220072 Minsk, Belarus
*
Author to whom correspondence should be addressed.
Coatings 2023, 13(7), 1196; https://doi.org/10.3390/coatings13071196
Submission received: 19 May 2023 / Revised: 27 June 2023 / Accepted: 29 June 2023 / Published: 3 July 2023
(This article belongs to the Special Issue Advanced Corrosion Protection through Coatings and Surface Rebuilding)

Abstract

:
The addition of Cr nanoparticles to a plasma electrolytic oxidation (PEO) electrolyte offers the possibility of producing layers with a broader range of coating compositions and improved properties. In this study, the effects of nanoparticles and various voltages on coating formation, microscopic morphology, and phase composition were investigated with in situ incorporation of Cr nanoparticles into PEO-coated Mg alloy. The results show that the corrosion performance of the coating was significantly improved when the final voltage was set to 460 V and the concentration of Cr nanoparticles was 1 g/L. Compared to the particle-free coating, the corrosion current density of the coating with the addition of 1 g/L Cr nanoparticles was reduced by two orders of magnitude. The impedance at the low frequency (0.01 Hz) increased by more than one order of magnitude after one hour of immersion, indicating a considerable improvement in corrosion resistance. Due to the high temperature during the coating-formation process, the Cr nanoparticles were oxidized, resulting in the formation of Cr2O3. The existence of Cr2O3 slightly increased the growth rate of the coating and sealed the open pores of the coating.

1. Introduction

Magnesium (Mg) and its alloys have shown great potential in the fields of transportation, aerospace, and electronic communications as the lightest metal structural material with a high strength-to-weight ratio and biodegradability [1,2,3]. However, their high chemical reactivity and tendency to corrode, even in air, are major obstacles that hinder their widespread use [4,5]. Various surface treatments, such as thermal spraying [6], cold spraying [7], electroplating [8], anodizing [9], and electroless plating [10], have been applied to Mg and its alloys to provide new functionalities and long-term anti-corrosion properties. Plasma electrolytic oxidation (PEO), also called micro-arc oxidation (MAO), is an effective one-step surface-treatment process derived from conventional anodizing [11,12,13]. It can generate discharge sparks on valve metals (Al, Mg, and Ti) [14,15,16], which involves a series of electrochemical and thermochemical reactions [17,18,19]. As a result, the metal surface is covered with ceramic oxide coatings to simultaneously improve the corrosion and wear resistance of the substrate [20,21,22]. Nevertheless, the process accompanies a significant quantity of short-lived micro-discharges due to the dielectric breakdown of the oxide film at relatively high voltages, causing coatings with high porosity and large-sized defects [23,24,25]. When the coating possesses a large number of discharge channels and defects, the corrosive liquid (NaCl) can penetrate through the layer rapidly [26,27,28]. Therefore, sealing the porous film is responsible for improving the corrosion performance of PEO coatings [29,30,31].
There are two main methods to reduce the porosity of PEO coatings and improve their corrosion resistance [32,33]. One method involves depositing an additional layer with a post-treatment process on top of the PEO film to form a composite coating that enhances the anticorrosion ability of the PEO coatings [34]. For instance, Liu et al. [35] found that sol-gel or epoxy resin coatings could effectively penetrate and fill the open pores on the surface of PEO coatings. Similarly, introducing corrosion inhibitors into the open pores before sealing them has also been shown to significantly improve the corrosion resistance of coatings [36]. Alternatively, additives like nano- and micro-sized particles can be directly added to the electrolytes to seal the open pores and improve the properties of the coating [37,38,39]. In situ incorporation of nano- and micro-sized particles into PEO coating has been explored to produce functionalized coatings with a broader range of components [40]. The size and physicochemical properties, such as conductivity and melting point, of the particles influence the coating-formation process. Lu et al. [41] explored the effect of micro- and nano-sized SiO2 particle size on PEO coatings. It was found that micro-size particles entered via the surface, resulting in inert incorporation. In comparison, nano-size particles were mainly absorbed via discharge channels and open pores, resulting in reactive incorporation. Therefore, in situ incorporation with nano-size particles is the preferable option. M. Laleh et al. [42] found that incorporation of CeCl3 increased the conductivity of the base electrolyte and enabled the formation of a compact coating [42]. Similarly, the melting point of particles also influences the incorporation mode [43]. Particles with a high melting point are primarily inertly doped into the coating, whereas the mode changes to entirely reactive incorporation for particles with relatively low melting points. Additionally, the appropriate uptake of the particles varied for different applications and processes. Han et al. [44] demonstrated that adding various contents of La2O3 particles affected the formation of PEO films. The appropriate quantity of doped particles can form a compact coating.
The influence of in situ incorporation of Cr nanoparticles on the microstructure and corrosion resistance of PEO-coated Mg has not been investigated so far. In this study, we aim to investigate the influence of different voltages and concentrations of Cr nanoparticles on the formation, morphology, composition, and corrosion performance of PEO coatings. The objective is to understand the role of Cr nanoparticles in improving the corrosion resistance of silicate-based coatings and to propose a mechanism for their in situ incorporation. This research will contribute to the development of more effective and efficient surface treatments for Mg alloys and broaden their range of applications.

2. Experimental Section

2.1. Preparation of PEO Coatings

Samples of AM50 Mg alloy were selected from a gravity-cast ingot material and cut into dimensions of 20 mm × 20 mm × 5 mm. The composition of the alloy, which contained 4.85 wt.% Al, 0.383 wt.% Mn, 0.055 wt.% Zn, 0.063 wt.% Si, 0.002 wt.% Fe, 0.001 wt.% Cu, and the balance of Mg, was measured using an ICP OES (Inductively Coupled Plasma Optical Emission Spectrometer, PerkinElmer, Waltham, MA, USA). To remove the surface oxide layer, the sample was coarsely ground with 240# emery paper followed by fine grinding with 1000# and 2000# emery paper. Finally, the sample was cleaned with deionized water for 1 min and air-dried prior to PEO treatment to prevent re-oxidation.
The PEO treatment was performed on the AM50 Mg alloy using a pulsed DC power source. Mg alloy and graphite plates were used as the anode and cathode, respectively. The sample was treated at a constant current density mode with a final voltage of 430 V and 460 V. The frequency and duty cycle were set at 500 Hz and 30%, respectively. Different amounts of Cr nanoparticles (Zhuxin Company, Tianjin, China, purity ≥ 99.9%) (1 and 3 g/L) were mixed into a silicate-containing solution (40 g/L Na2SiO3, 4 g/L KF, and 2 g/L NaOH). TEM images (Figure 1) confirmed that the Cr nanoparticles had a relatively uniform size. The corresponding coatings were named as PEO−430, LPEO−430 (L represents 1 g/L Cr nanoparticles), HPEO−430 (H represents the addition of 3 g/L Cr nanoparticles), PEO−460, LPEO−460, and HPEO−460, respectively. To enhance the reliability of the experiment, parallel specimens were prepared for each condition.

2.2. Microstructure and Composition of the Coatings

The thickness of the specimens was measured using a coating thickness measurement gauge (minitest600, Elektrophysik, Cologne, Germany). Six measurements were taken at different locations to ensure accuracy, and the thickness was calculated as the average of these measurements. The morphology of the PEO coatings was analyzed using a scanning electron microscope (SEM, JSM-7001F, JEOL, Tokyo, Japan) in both top-view mode and cross-section mode. An energy dispersive spectrometer (EDS) system was used to determine the elemental distribution of the coatings. The coating porosity was determined using the image analysis software Analysis Pro 6.0 (AnalysisPro, Llanelli, UK) with the average value calculated from five SEM images at 1000 magnification. The phase composition of the coated samples was analyzed using X-Ray diffraction (Smartlab, Rigaku, Tokyo, Japan) with a Cu Kα radiation source at 40 kV and 30 mA. The scanning range was from 10° to 80° in the 2θ range with a step size of 0.02°. X-Ray photoelectron spectroscopy (XPS) was carried out on an ESCALAB—MKII X-Ray photoelectron spectrometer (VG Instruments, East Grinstead, UK) using monochromatized Al Kα radiation (1486.6 eV) as the excitation source to determine the chemical composition. The binding energy of C 1s (284.6 eV) was used as a reference, and the data were analyzed using CaSaXPS software (Casa Software Ltd., Teignmouth, UK) (version 2.3).

2.3. Corrosion Performance of the Coatings

The electrochemical corrosion tests were conducted using an electrochemical workstation (PARSTAT4000A, AMETEK, Berwyn, PA, USA) in a corrosion medium (0.5 wt.% NaCl) at room temperature (25 °C) [45]. A conventional three-electrode system was used with a coated specimen as the working electrode. The exposed area of the working electrode was 1 cm2 at the bottom of an electrolytic cell. A saturated calomel electrode was used as the reference electrode, and a platinum sheet (dimension of 10 mm × 10 mm × 0.1 mm, purity ≥ 99.5%) was used as the counter electrode. Before measuring the potentiodynamic polarization curve, the samples were immersed for 1000 s at open circuit potential. Potentiodynamic polarization (PDP) scans were initiated from −0.2 V vs. reference electrode at a sweep rate of 0.33 mV/s, reaching a terminal current density of 2 mA/cm2. Cathodic Tafel extrapolation was applied to calculate the corrosion potential values and current density values. Electrochemical impedance spectroscopy (EIS) studies were conducted in the frequency range of 105 to 10−2 Hz with an AC amplitude of 10 mV RMS sinusoidal perturbations. EIS was recorded at different immersion intervals (1, 24, 48, 72, and 96 h), and the obtained EIS data were analyzed and fitted using ZSimpWin software (AMETEK, Berwyn, PA, USA) (version 3.6).

3. Results and Discussion

3.1. Voltage–Time Curves during PEO Treatment

The voltage variation curves in Figure 2 depict the relationship between treatment time and voltage for different Cr nanoparticle additions in silicate electrolytes. All three coatings exhibited an initial rapid increase in voltage within the first three minutes followed by a slower rate of voltage increase. The coating with incorporated Cr nanoparticles reached a final voltage of 460 in a shorter treatment time compared to the coating without the nanoparticles. Additionally, increasing the content of Cr nanoparticles slightly enhanced the growth of the coating, but the effect was weak. This suggests that the presence or absence of Cr nanoparticles in the electrolyte has no significant impact on the plasma electrolytic oxidation process.

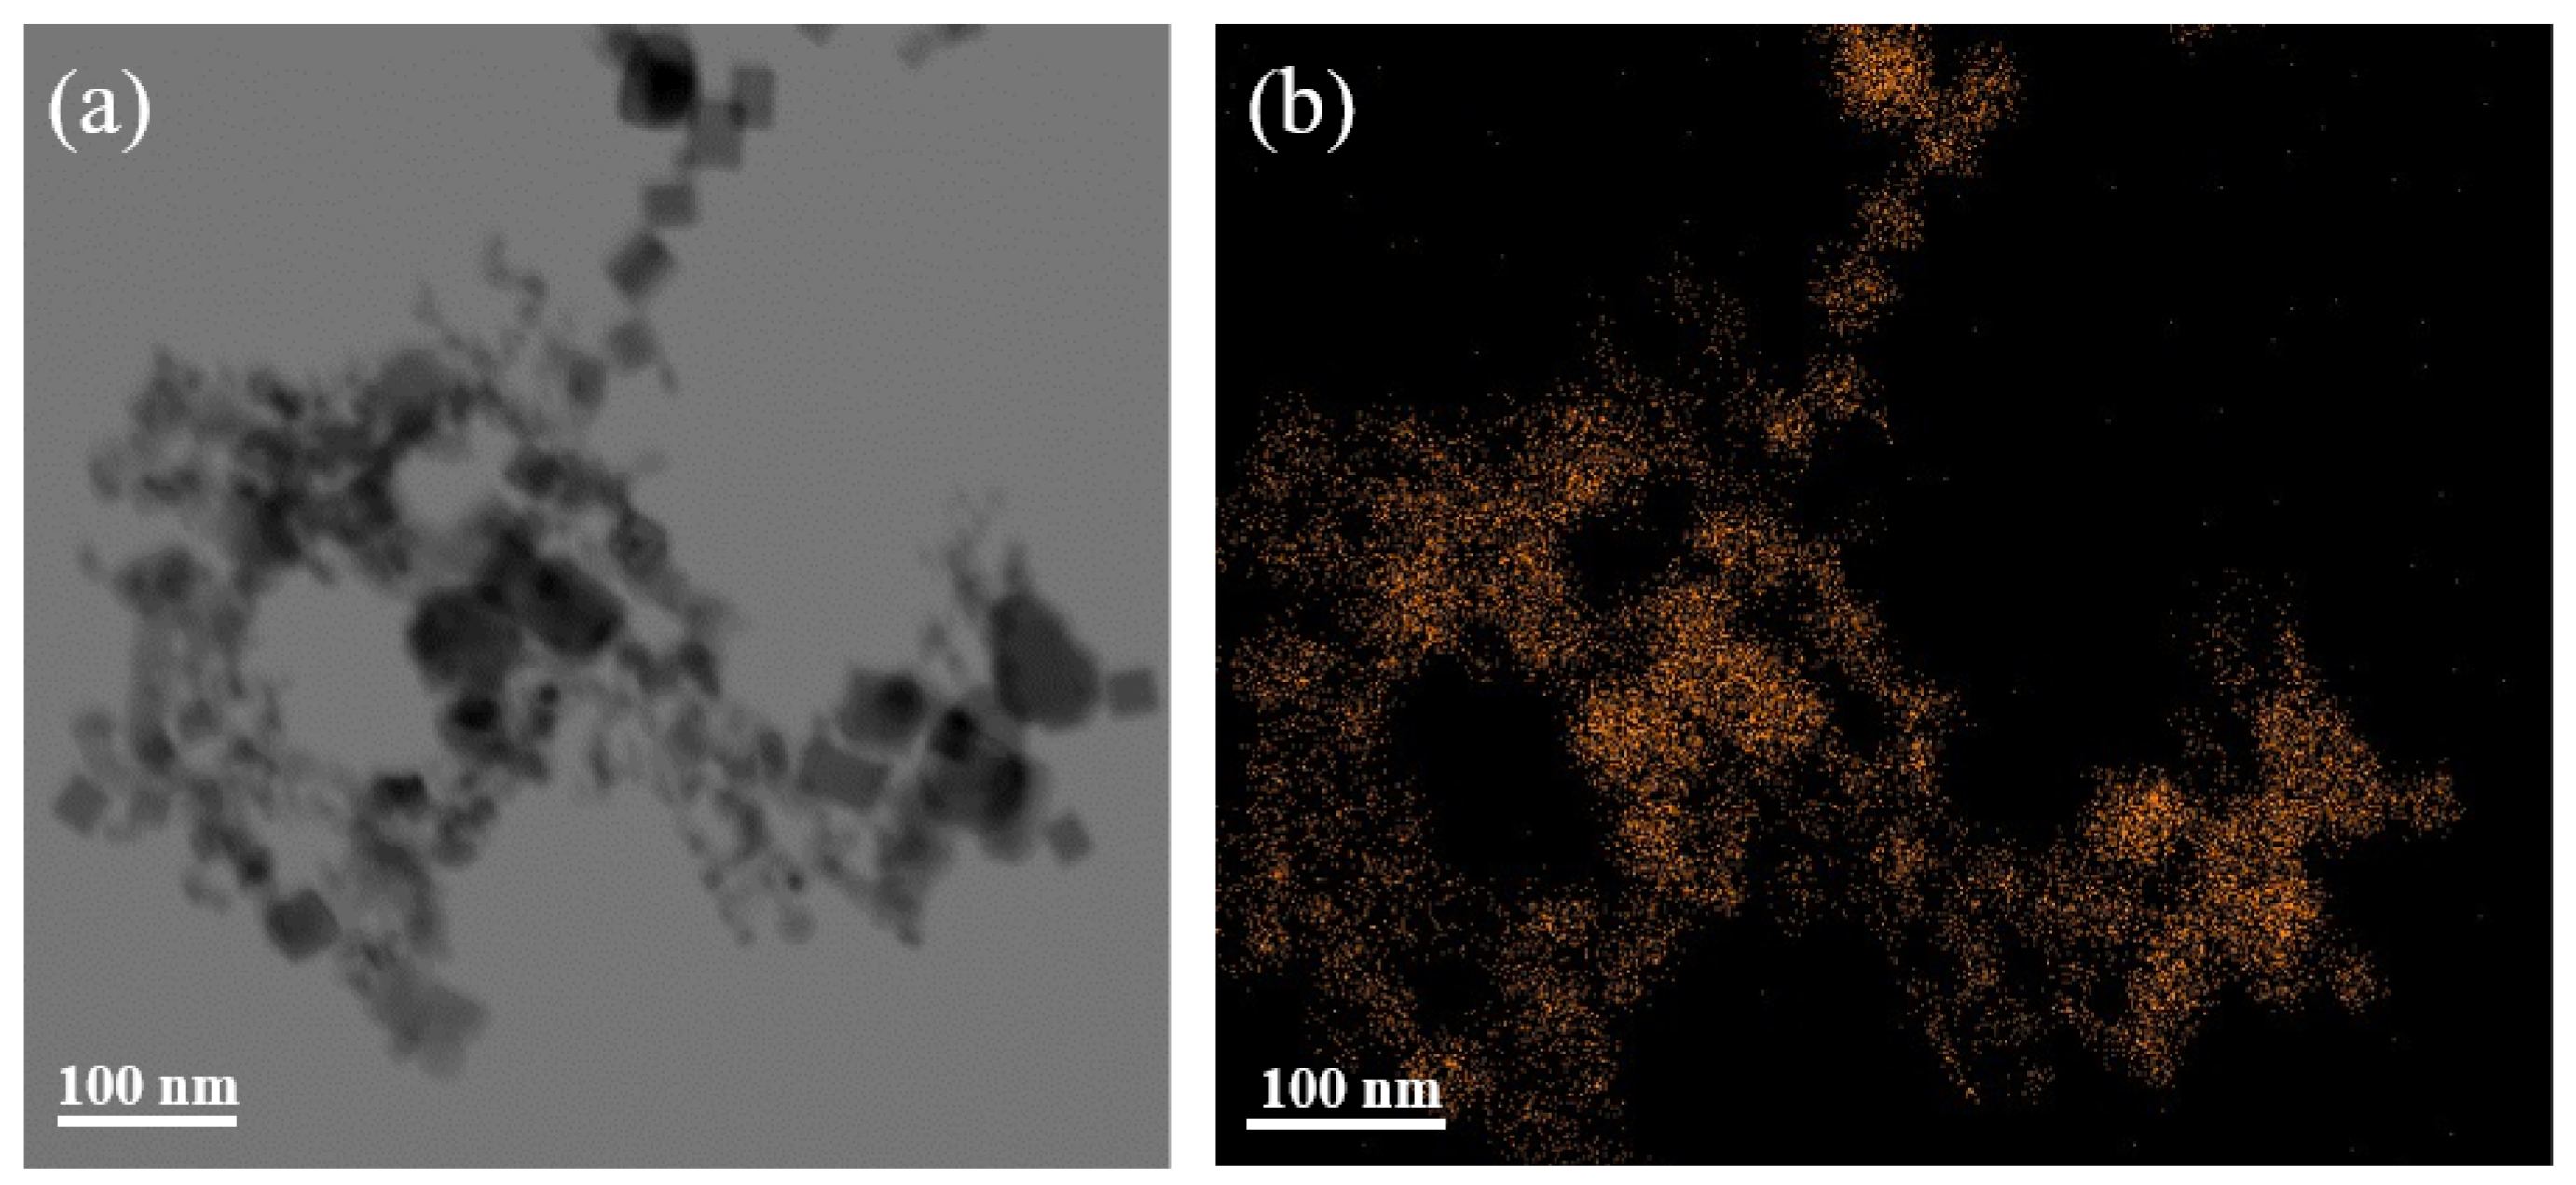
3.2. Morphology Characteristics of PEO Coatings

The results of the surface morphology analysis of the coated samples with different contents of Cr nanoparticles in the electrolyte at 430 V are presented in Figure 3. The porosity of the PEO coating under different conditions was calculated using image-analysis software (Image-Pro-Plus 6.0) (Bioimager Inc., Maple, ON, Canada) to analyze the effect of different voltages and different amounts of Cr nanoparticles on the microstructure of the coating surface, as shown in Table 1. An intensely discharged high voltage resulted in a porous surface for the PEO−460 coating (Figure 3(a1,a2)). The doping of Cr nanoparticles can significantly reduce the porosity of the coating. Specifically, the original PEO coating had a porosity of 16.9%, while the LPEO−430 and HPEO−430 coatings had porosities of 15.9% and 9.5%, respectively (as shown in Table 1). The HPEO−430 coating exhibited a similar pore size to that of the LPEO−430 coating (Figure 3(b1,b2,c1,c2)) but with lower porosity (as shown in Table 1). Moreover, the majority of the pores in the HPEO−430 coating were partially filled. Based on these observations, it can be inferred that the incorporation of Cr nanoparticles inhibits partial discharge and gas diffusion, which consequently affect the pore density and surface morphology of the coating.
The coatings formed at a final voltage of 460 V with various additions of Cr nanoparticles exhibited a similar morphology, as presented in Figure 4. The LPEO−460 coating exhibited a higher number of open pores and defects compared to the HPEO−460 and PEO−460 coatings. However, the pore size of LPEO−460 was smaller than the other two coatings. In all three coatings, a large volume of open pores was partially filled. HPEO−460 and LPEO−460 showed no significant differences in morphology, except for the presence of many white tiny particles adhering to the surface of HPEO−460, as observed in Figure 4(c1,c2).
Figure 5 illustrates the cross-sectional morphology of the coatings treated at 430 V with different additions of Cr nanoparticles. The incorporation of Cr nanoparticles did not have a significant effect on the coating thickness, which remained consistent at 20 ± 1 μm in all three electrolytes. The presence of open pores in the cross-sections of the coatings can be attributed to discharge channels and entrapped gas pores. The incorporation of Cr nanoparticles significantly altered the morphologies of the coatings with the HPEO−430 coating being more uniform and denser than the PEO−430 and LPEO−430 coatings.
The coatings formed at a final voltage of 460 V with various Cr nanoparticle additions exhibited a similar cross-sectional morphology, as displayed in Figure 6. The incorporation of Cr nanoparticles into the PEO coating did not have a noticeable effect on the growth rate of the coating, as the average thickness of the coating remained consistent at 30 ± 2 μm in all three electrolytes. The many open pores in the cross-sections of the coatings can be attributed to discharge channels and entrapped gas pores. Initially, the number of open pores and defects decreased when 1 g of Cr nanoparticles was added. However, with an increase in the Cr nanoparticle amount, the number of open pores increased again. The LPEO−460 coating showed the fewest open pores, indicating a more compact layer.
Table 2 lists the chemical composition of the different PEO coatings as determined with EDS to evaluate the distribution of Cr nanoparticles in the cross-sections of the PEO coatings. The signals of Al, O, Mg, and Si were detected in both the PEO−430 and PEO−460 coatings. The coatings with the incorporation of Cr nanoparticles showed signals of Cr, indicating that the Cr nanoparticles were successfully doped into the PEO coatings. The Cr content in the coatings increased with the Cr content in the PEO electrolytes. The difference in the amount of incorporated Cr particles between the HPEO−430 and HPEO−460 coatings can be explained by the variation in the cross-sectional morphology of the coatings (Figure 5 and Figure 6). If the porosity of the coating is too high with large pores, the Cr nanoparticles can easily enter the coating and then be trapped into the coating defects. EPMA maps (Mg, O, Na, Si, Al, and Cr) of the primary elemental distribution on the cross-section of the LPEO−460 coating are displayed in Figure 7. It is further confirmed that the Cr nanoparticles, which were capable of sealing the defects, were doped into the coatings and thus formed a compact coating.

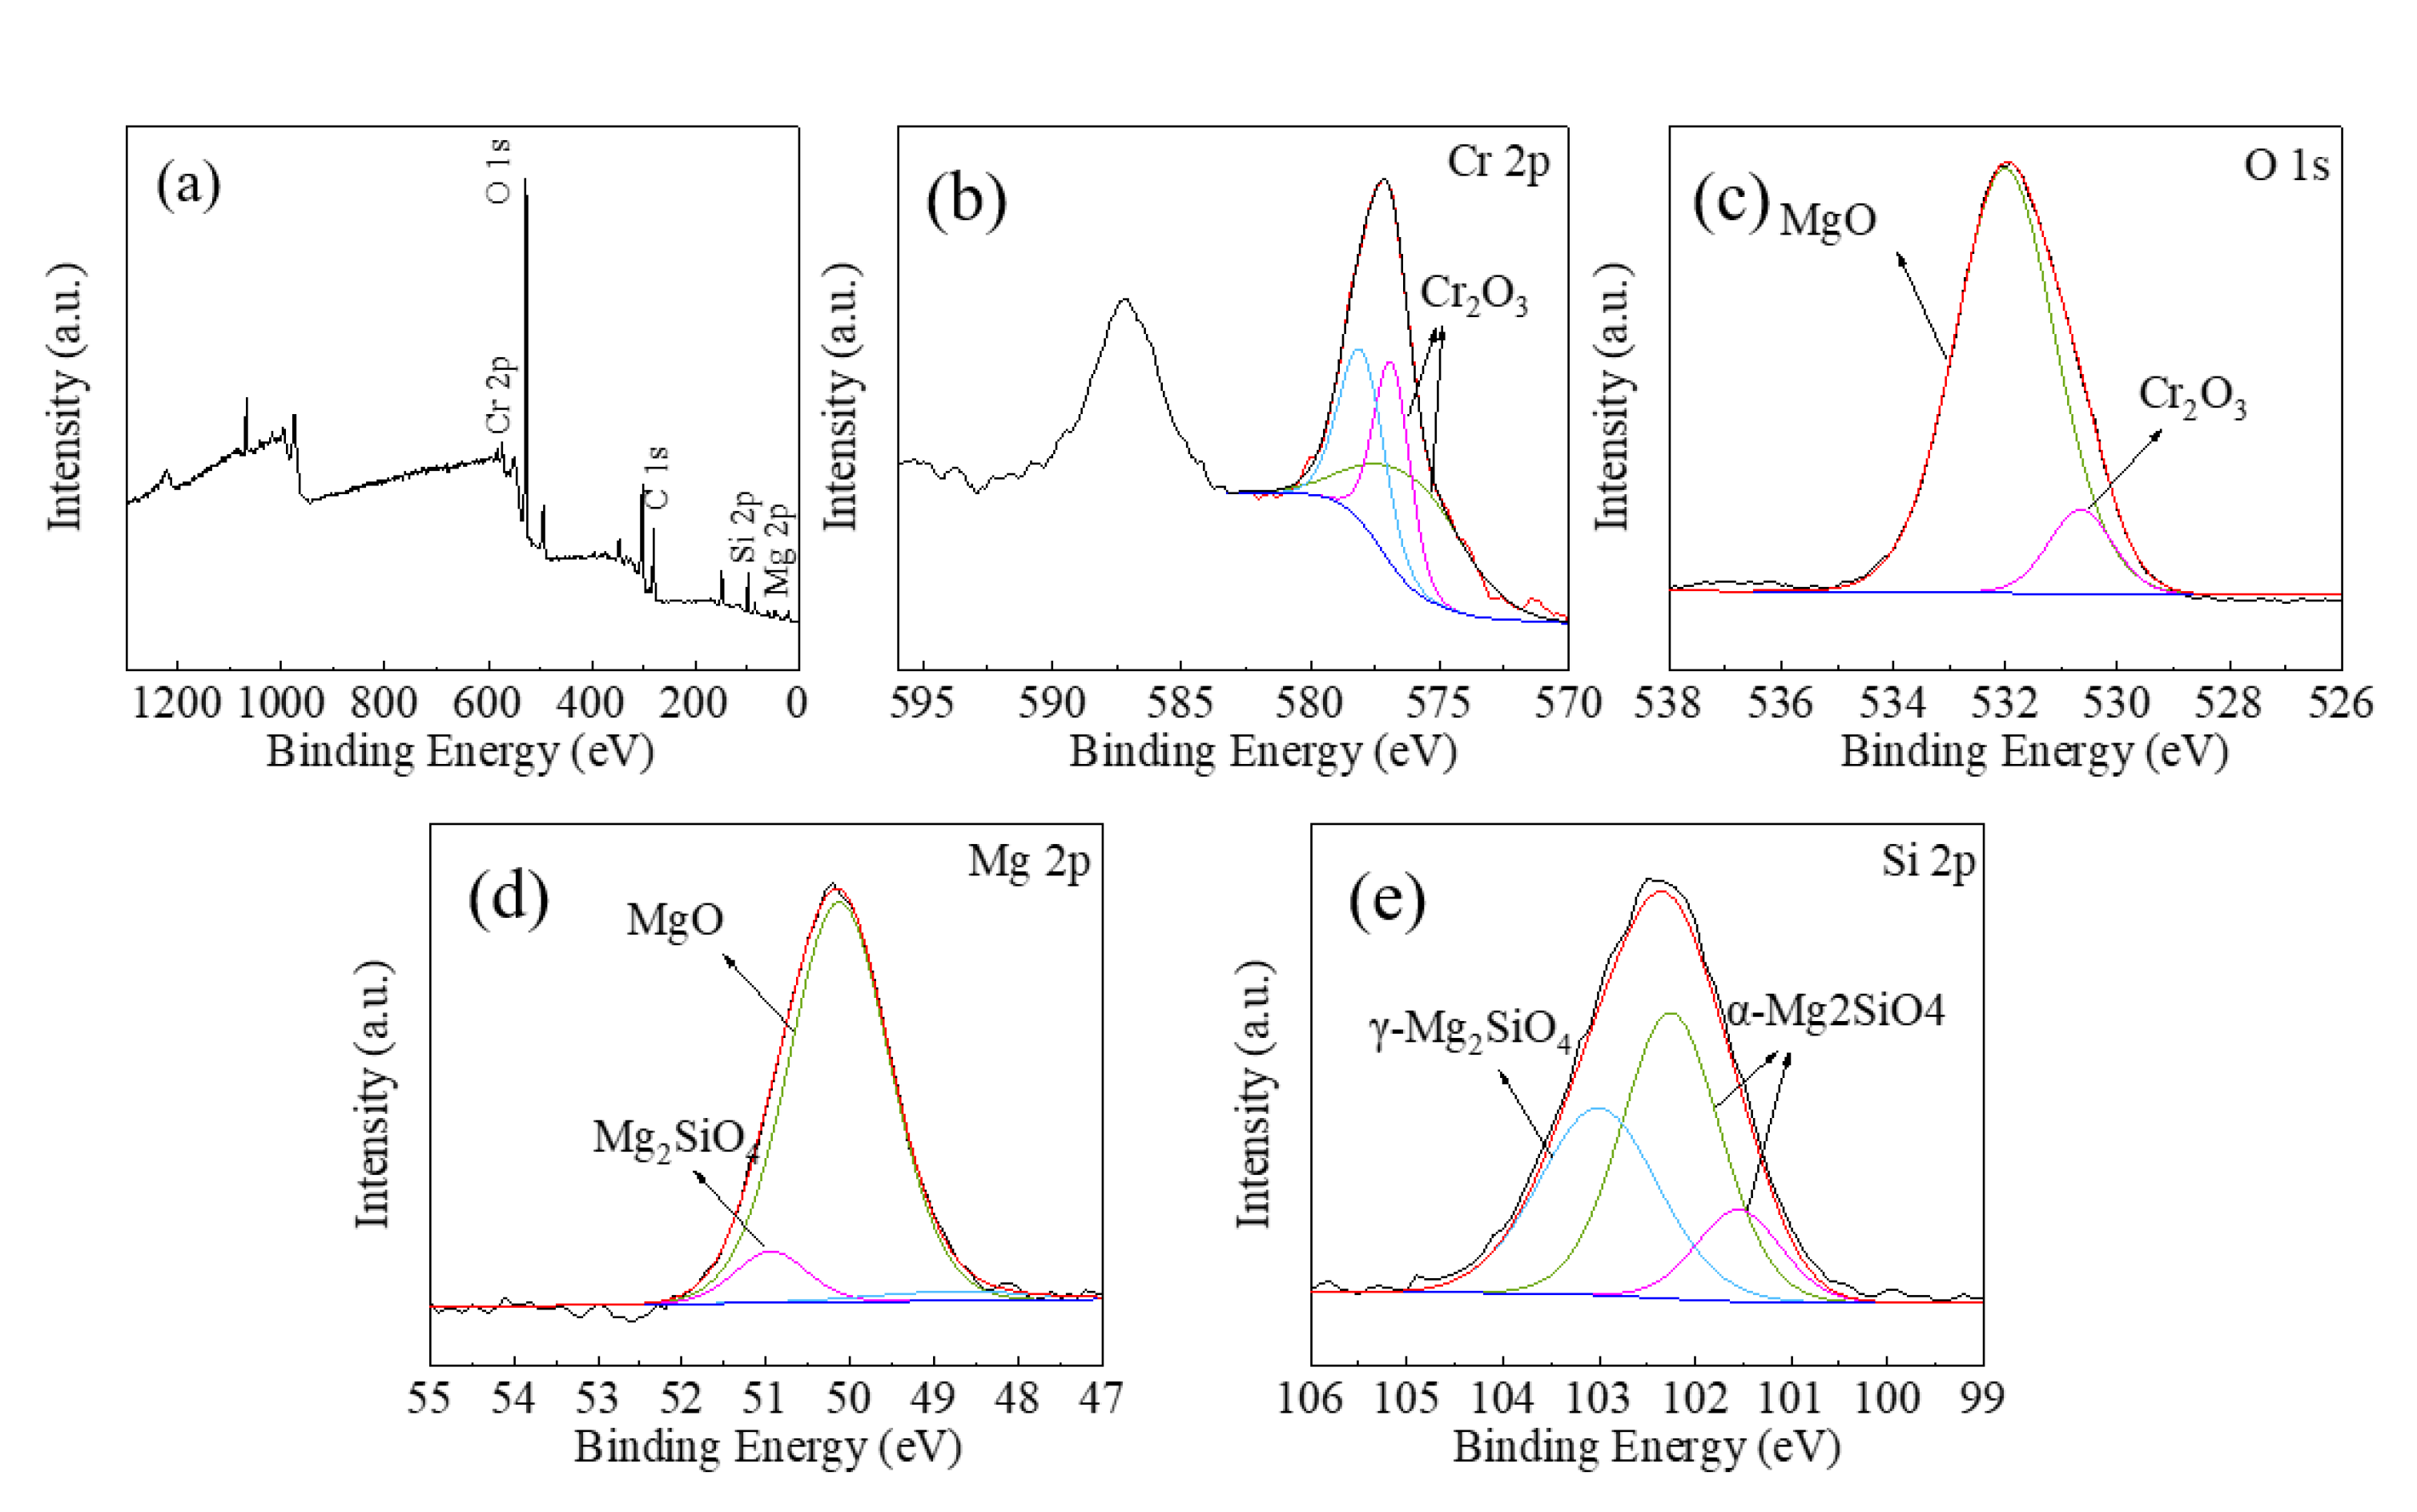
3.3. Chemical and Phase Composition

Figure 8 displays the X-Ray diffraction (XRD) spectra of the PEO coatings obtained under various conditions. The coating is mainly composed of MgO and Mg2SiO4 phases, as reported in [46]. However, due to the thinness of the coating and the presence of micropores, the X-Rays penetrate the entire coating and reach the substrate during testing, resulting in the detection of Mg peaks and a broad bump. Despite the addition of Cr nanoparticles, the XRD pattern of the coating did not show any significant changes, and the coating remained composed of MgO and Mg2SiO4 phases, likely because of the low Cr content. In fact, the addition of Cr nanoparticles did not result in the appearance of any Cr diffraction peaks in the XRD pattern, as noted before.
In order to further investigate the chemical composition, the LPEO−460 coating was analyzed with X-Ray photoelectron spectroscopy (XPS), as exhibited in Figure 9. The Si 2p spectrum was found to consist of α-Mg2SiO4 (102.3 and 101.6 eV) and γ-Mg2SiO4 (103 eV), as reported in [47]. Our findings suggest that the main Cr-containing compound in the coating is Cr2O3, as evidenced by the Cr peaks at 576.8 and 575.9 eV (Figure 9b) [48]. Additionally, the binding energy of O 1s (Figure 9c) at 530.7 eV corresponds to Cr2O3, whereas the peak at 532.0 eV can be assigned to MgO, consistent with the Cr 2p spectrum. Notably, chromic oxide was found to exist in the surface region, although its content was too low to be detected with XRD measurement. Finally, it can be concluded that Cr2O3 was formed by oxidation of the Cr nanoparticles under the high-temperature environment generated during the PEO process.

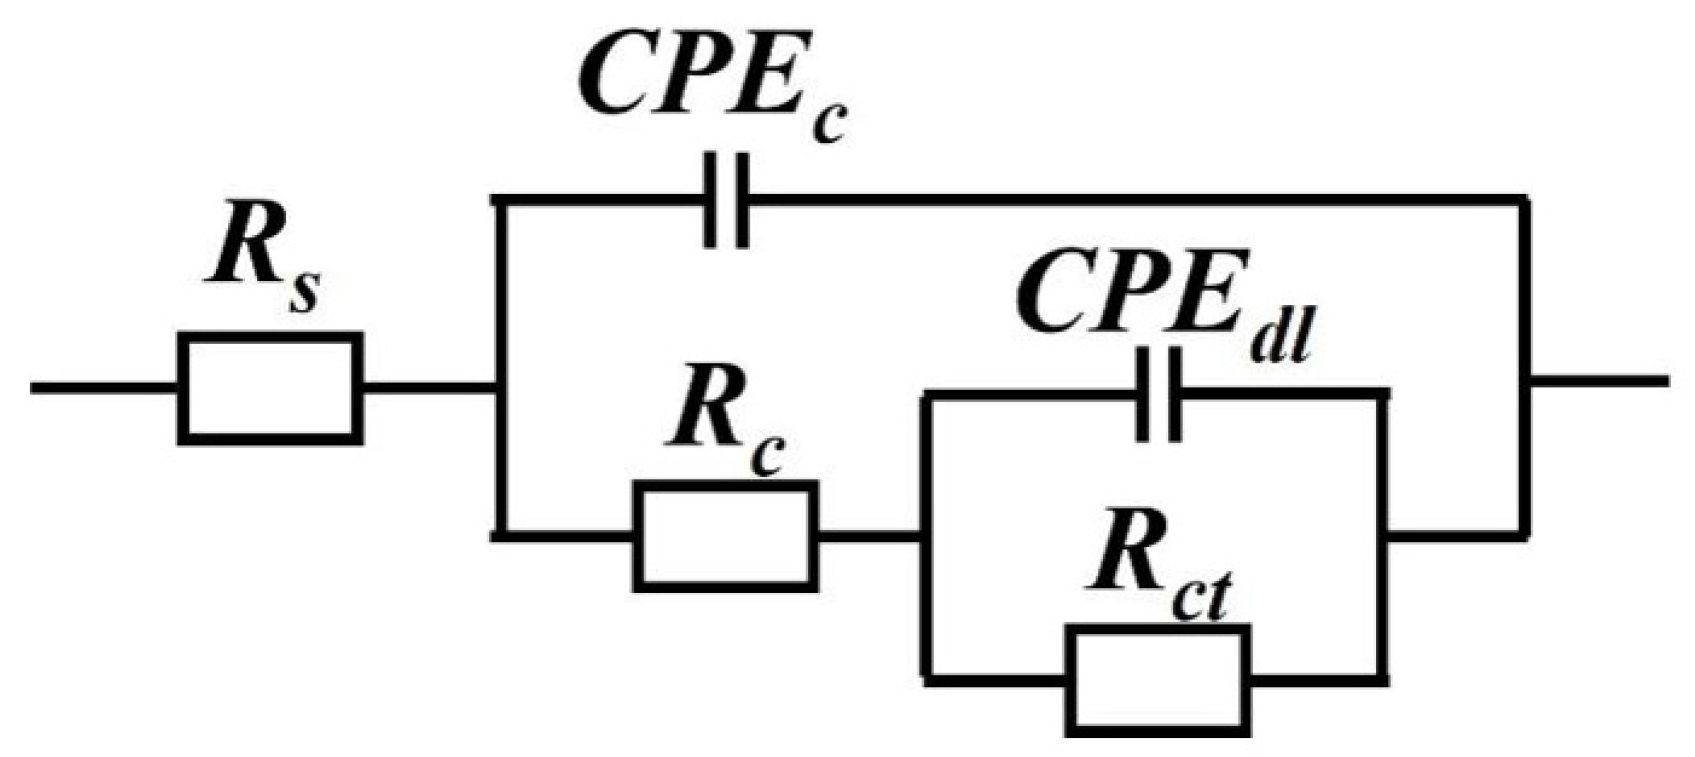
3.4. Corrosion Performance

The polarization test was used to determine the corrosion resistance of the PEO coatings, as displayed in Figure 10. The corrosion potential (Ecorr) and corrosion current density (icorr) of the coatings were determined from the polarization curve and are presented in Table 3. At a voltage of 430 V, the current density of the Cr nanoparticle-added coating was slightly higher than that of the particle-free coating with values of (2.0 ± 0.4) × 10−6 A·cm−2 for PEO, (1.3 ± 0.5) × 10−7 A·cm−2 for LPEO−430, and (2.9 ± 1.1) × 10−7 A·cm−2 for HPEO−430, respectively. The corrosion current density ((7.6 ± 0.9) × 10−8 A·cm−2) of LPEO−460 at 460 V was significantly lower than that of the other coatings. However, increasing the concentration of Cr in the electrolyte to a certain extent can increase the corrosion current density of the coating. The incorporation of Cr particles and changing the voltage had almost no effect on the corrosion potential (Ecorr) of the PEO coating, as the corrosion potential values were almost equal, ranging from −1.45 to −1.51 mV.
The EIS test was used to investigate the long-term corrosion performance of the coating, and the results (Figure 11 and Figure 12) showed that the presence of Cr particles increased the impedance of the coating to a certain extent. However, all coatings degraded as a function of immersion time in 0.5 wt.% NaCl solution. In the initial stage (1 h), the impedance of LPEO−430 at the low frequency range was approximately two orders of magnitude higher than that of HPEO−430. The impedance of HPEO−430 was lower than that of LPEO−430 at 0.01 Hz, indicating that the concentration of Cr nanoparticles above a specific limit reduces coating impedance. The impedance of the coating was improved at 460 V compared to 430 V, but the concentration of Cr particles above a specific limit still reduced the impedance of the coatings.
An equivalent circuit (Figure 13) was used to fit the EIS results, and the fitted data were recorded in Table 4. In the equivalent circuit, Rs is the resistance of the NaCl solution. Rc and CPEc stand for resistance and capacitance of the porous PEO coating, respectively. Rs refers to the corrosion resistance of the solution (NaCl). Rct corresponds to the charge transfer resistance, and CPEdl is responsible for the double-layer capacitance at the electrolyte/metal interface [49]. Moreover, due to the non-uniform distribution of the coating surface, CPE was applied instead of pure capacitance (C) to fit all capacitances [44]. The polarization resistance (RP) was used to characterize the corrosion rate of the PEO coating, and the inverse of the polarization resistance (Rp) is proportional to the corrosion rate of the PEO oxide coating. As exhibited in Figure 14a, it can be found that the values of 1/Rp of all the coatings increased as a function of immersion time. It was found that the presence of Cr nanoparticles enhanced the corrosion resistance of the PEO coating. However, if the particle content exceeded a certain amount, the corrosion resistance of the coating was reduced. The inverse of the polarization resistance (Rp) was the smallest at any immersion time when the addition of Cr nanoparticles was 1 g/L, indicating that the degradation rate of the PEO coating was the lowest. The change in capacitance during immersion in NaCl solution is displayed in Figure 14b. The increased capacitance represents the degradation of the coating. After 4 h of immersion, the capacitance of all the coatings started to increase. The curve of the LPEO−430 coating capacitance rose at the slowest rate. The trends of these parameters indicate that the LPEO−460 coating had a superior barrier ability throughout the entire corrosion test. These results were consistent with the polarization test and EIS measurements.

4. Conclusions

(1) The addition of Cr nanoparticles into the silicate electrolyte resulted in the formation of compact and uniform PEO coatings on AM50 Mg alloy as verified by the lower porosity and higher content of chromium in the coatings. The coating thickness was not significantly affected by the addition of Cr nanoparticles, but a higher voltage promoted growth of the coating.
(2) The coating was mainly composed of MgO and Mg2SiO4 phases. After addition of Cr nanoparticles, Cr2O3 was formed on the surface of the Mg alloy as a result of the high temperature during the coating-formation process.
(3) Based on the electrochemical experiments, it can be concluded that the corrosion performance of the coating was significantly improved when the final voltage was set to 460 V and the concentration of the Cr nanoparticles was 1 g/L. The corrosion current density ((7.6 ± 0.9) × 10−8 A·cm−2) of LPEO−460 was reduced by two orders of magnitude compared to the particle-free coating. These findings suggest that the designed coating has the potential to be used in the field of transportation and aerospace application for Mg alloys.

Author Contributions

Conceptualization, X.L. and F.W.; Methodology, W.L., Q.C. and J.M.; Formal analysis, X.L., S.A.K. and O.V.I.; Investigation, W.L., Q.C., J.M. and S.A.K.; Resources, F.W.; Writing—original draft, W.L. and Q.C.; Writing—review & editing, X.L., J.M., S.A.K. and O.V.I.; Supervision, X.L. and F.W.; Project administration, O.V.I.; Funding acquisition, X.L. and F.W. All authors have read and agreed to the published version of the manuscript.

Funding

The authors would like to acknowledge the financial support from National Natural Science Foundation of China (No. 5211101655), Natural Science Foundation Project of Liaoning Province (2022-YGJC-16), and the Fundamental Research Funds for the Central Universities (N2302017).

Institutional Review Board Statement

Not applicable.

Informed Consent Statement

Not applicable.

Data Availability Statement

Not applicable.

Conflicts of Interest

The authors declare no conflict of interest.

References

  1. Aliasghari, S.; Skeldon, P.; Thompson, G.E. Plasma electrolytic oxidation of titanium in a phosphate/silicate electrolyte and tribological performance of the coatings. Appl. Surf. Sci. 2014, 316, 463–476. [Google Scholar] [CrossRef]
  2. Mozafarnia, H.; Fattah-Alhosseini, A.; Chaharmahali, R.; Nouri, M.; Keshavarz, M.K.K.; Kaseem, M. Corrosion, Wear, and Antibacterial Behaviors of Hydroxyapatite/MgO Composite PEO Coatings on AZ31 Mg Alloy by Incorporation of TiO2 Nanoparticles. Coatings 2022, 12, 1967. [Google Scholar] [CrossRef]
  3. Qin, J.; Shi, X.; Li, H.; Zhao, R.; Li, G.; Zhang, S.; Ding, L.; Cui, X.; Zhao, Y.; Zhang, R. Performance and failure process of green recycling solutions for preparing high degradation resistance coating on biomedical magnesium alloys. Green Chem. 2022, 24, 8113–8130. [Google Scholar] [CrossRef]
  4. Kwon, J.H.; Fatimah, S.; Baek, S.H.; Kim, Y.G.; Yang, H.W.; Ko, Y.G. Electrochemical response of VxOy-Al2O3 composite layer with dark-green color achieved by plasma electrolytic oxidation. J. Alloys Compd. 2020, 827, 154367. [Google Scholar] [CrossRef]
  5. Lee, K.M.; Lee, B.U.; Yoon, S.I.; Lee, E.S.; Yoo, B.; Shin, D.H. Evaluation of plasma temperature during plasma oxidation processing of AZ91 Mg alloy through analysis of the melting behavior of incorporated particles. Electrochim. Acta 2012, 67, 6–11. [Google Scholar] [CrossRef]
  6. Palanisamy, K.; Gangolu, S.; Antony, J.M. Effects of HVOF spray parameters on porosity and hardness of 316L SS coated Mg AZ80 alloy. Surf. Coat. Technol. 2022, 448, 128898. [Google Scholar] [CrossRef]
  7. Mouli, G.C.; Chakradhar, R.P.S.; Srivastava, M.; Barshilia, H.C. Cold-Sprayed Cu-Zn-Al2O3 Coating on Magnesium Alloy: Enhanced Microhardness and Corrosion Behavior. J. Mater. Eng. Perform. 2022. [Google Scholar] [CrossRef]
  8. Miyake, M.; Fujii, H.; Hirato, T. Electroplating of Al on Mg alloy in a dimethyl sulfone-aluminum chloride bath. Surf. Coat. Technol. 2015, 277, 160–164. [Google Scholar] [CrossRef] [Green Version]
  9. Wang, L.S.; Bu, Z.X.; Lu, M.; Geng, Y.; Chen, M.H.; Sun, L. Thick oxide coatings formed by spark anodizing of Mg-Al alloy in alkaline phosphate-silicate electrolytes. J. Alloys Compd. 2017, 710, 121–129. [Google Scholar] [CrossRef] [Green Version]
  10. Wang, Z.C.; Jia, F.; Yu, L.; Qi, Z.B.; Tang, Y.; Song, G.L. Direct electroless nickel-boron plating on AZ91D magnesium alloy. Surf. Coat. Technol. 2012, 206, 3676–3685. [Google Scholar] [CrossRef]
  11. Arrabal, R.; Pardo, A.; Merino, M.C.; Mohedano, M.; Casajus, P.; Matykina, E.; Skeldon, P.; Thompson, G.E. Corrosion behaviour of a magnesium matrix composite with a silicate plasma electrolytic oxidation coating. Corros. Sci. 2010, 52, 3738–3749. [Google Scholar] [CrossRef]
  12. Arun, S.; Hariprasad, S.; Saikiran, A.; Ravisankar, B.; Parfenov, E.V.; Mukaeva, V.R.; Rameshbabu, N. The effect of graphite particle size on the corrosion and wear behaviour of the PEO-EPD coating fabricated on commercially pure zirconium. Surf. Coat. Technol. 2019, 363, 301–313. [Google Scholar] [CrossRef]
  13. Asgari, M.; Aliofkhazraei, M.; Darband, G.B.; Rouhaghdam, A.S. How nanoparticles and submicron particles adsorb inside coating during plasma electrolytic oxidation of magnesium? Surf. Coat. Technol. 2020, 383, 125252. [Google Scholar] [CrossRef]
  14. Bu, A.; Zhang, Y.; Zhang, Y.; Chen, W.; Cheng, H.; Wang, L.; Wang, Y. A Novel Electrolytic Plasma Spraying Preparation SiO2/SiC Coating on Carbon Fiber Fabric. Coatings 2018, 8, 344. [Google Scholar] [CrossRef] [Green Version]
  15. Zhang, Z.-Q.; Wang, L.; Zeng, M.-Q.; Zeng, R.-C.; Lin, C.-G.; Wang, Z.-L.; Chen, D.-C.; Zhang, Q. Corrosion resistance and superhydrophobicity of one-step polypropylene coating on anodized AZ31 Mg alloy. J. Magnes. Alloys 2021, 9, 1443–1457. [Google Scholar] [CrossRef]
  16. Ding, C.; Tai, Y.; Wang, D.; Tan, L.; Fu, J. Superhydrophobic composite coating with active corrosion resistance for AZ31B magnesium alloy protection. Chem. Eng. J. 2019, 357, 518–532. [Google Scholar] [CrossRef]
  17. Hashemzadeh, M.; Simchen, F.; Winter, L.; Lampke, T. Evaluation of Fracture Toughness of Plasma Electrolytic Oxidized Al2O3-ZrO2 Coatings Utilizing Nano-Scratch Technique. Coatings 2023, 13, 799. [Google Scholar] [CrossRef]
  18. Liu, T.; Zhang, D.; Ma, L.; Huang, Y.; Hao, X.; Terryn, H.; Mol, A.; Li, X. Smart protective coatings with self-sensing and active corrosion protection dual functionality from pH-sensitive calcium carbonate microcontainers. Corros. Sci. 2022, 200, 110254. [Google Scholar] [CrossRef]
  19. Yang, J.; Blawert, C.; Lamaka, S.V.; Snihirova, D.; Lu, X.; Di, S.; Zheludkevich, M.L. Corrosion protection properties of inhibitor containing hybrid PEO-epoxy coating on magnesium. Corros. Sci. 2018, 140, 99–110. [Google Scholar] [CrossRef]
  20. Bordbar-Khiabani, A.; Ebrahimi, S.; Yarmand, B. In-Vitro corrosion and bioactivity behavior of tailored calcium phosphate-containing zinc oxide coating prepared by plasma electrolytic oxidation. Corros. Sci. 2020, 173, 108781. [Google Scholar] [CrossRef]
  21. Chang, F.-C.; Wang, C.-J.; Lee, J.-W.; Lou, B.-S. Microstructure and mechanical properties evaluation of molybdenum disulfide-titania nanocomposite coatings grown by plasma electrolytic oxidation. Surf. Coat. Technol. 2016, 303, 68–77. [Google Scholar] [CrossRef]
  22. Chen, Q.; Lu, X.; Serdechnova, M.; Wang, C.; Lamaka, S.; Blawert, C.; Zheludkevich, M.L.; Wang, F. Formation of self-healing PEO coatings on AM50 Mg by in-situ incorporation of zeolite micro-container. Corros. Sci. 2022, 209, 110785. [Google Scholar] [CrossRef]
  23. Chen, Y.; Lu, X.; Blawert, C.; Zheludkevich, M.L.; Zhang, T.; Wang, F. Formation of self-lubricating PEO coating via in-situ incorporation of PTFE particles. Surf. Coat. Technol. 2018, 337, 379–388. [Google Scholar] [CrossRef]
  24. Fadaee, H.; Javidi, M. Investigation on the corrosion behaviour and microstructure of 2024-T3 Al alloy treated via plasma electrolytic oxidation. J. Alloys Compd. 2014, 604, 36–42. [Google Scholar] [CrossRef]
  25. Gnedenkov, S.V.; Sinebryukhov, S.L.; Mashtalyar, D.V.; Egorkin, V.S.; Sidorova, M.V.; Gnedenkov, A.S. Composite polymer-containing protective coatings on magnesium alloy MA8. Corros. Sci. 2014, 85, 52–59. [Google Scholar] [CrossRef]
  26. Grebnevs, V.; Lesniak-Ziolkowska, K.; Wala, M.; Dulski, M.; Altundal, S.; Dutovs, A.; Avotina, L.; Erts, D.; Viter, R.; Viksna, A.; et al. Modification of physicochemical properties and bioactivity of oxide coatings formed on Ti substrates via plasma electrolytic oxidation in crystalline and amorphous calcium phosphate particle suspensions. Appl. Surf. Sci. 2022, 598, 153793. [Google Scholar] [CrossRef]
  27. Guo, X.; Du, K.; Guo, Q.; Wang, Y.; Wang, F. Experimental study of corrosion protection of a three-layer film on AZ31B Mg alloy. Corros. Sci. 2012, 65, 367–375. [Google Scholar] [CrossRef]
  28. Hwang, I.-J.; Choe, H.-C. Hydroxyapatite coatings containing Zn and Si on Ti-6Al-4Valloy by plasma electrolytic oxidation. Appl. Surf. Sci. 2018, 432, 337–346. [Google Scholar] [CrossRef]
  29. Ignjatovic, S.; Blawert, C.; Serdechnova, M.; Karpushenkov, S.; Damjanovic, M.; Karlova, P.; Wieland, D.C.F.; Starykevich, M.; Stojanovic, S.; Damjanovic-Vasilic, L.; et al. Formation of multi-functional TiO2 surfaces on AA2024 alloy using plasma electrolytic oxidation. Appl. Surf. Sci. 2021, 544, 148875. [Google Scholar] [CrossRef]
  30. Jin, X.; Chen, L.; Yu, J.; Liu, R.; Xue, W.; Shang, H. Temperature measurement and OES analysis during CPEO on stainless steel. Surf. Coat. Technol. 2019, 363, 314–321. [Google Scholar] [CrossRef]
  31. Kazek-Kesik, A.; Krok-Borkowicz, M.; Dercz, G.; Donesz-Sikorska, A.; Pamula, Z.; Simka, W. Multilayer coatings formed on titanium alloy surfaces by plasma electrolytic oxidation-electrophoretic deposition methods. Electrochim. Acta 2016, 204, 294–306. [Google Scholar] [CrossRef]
  32. Kim, D.; Sung, D.; Lee, J.; Kim, Y.; Chung, W. Composite plasma electrolytic oxidation to improve the thermal radiation performance and corrosion resistance on an Al substrate. Appl. Surf. Sci. 2015, 357, 1396–1402. [Google Scholar] [CrossRef]
  33. Kim, Y.S.; Yang, H.W.; Shin, K.R.; Ko, Y.G.; Shin, D.H. Heat dissipation properties of oxide layers formed on 7075 Al alloy via plasma electrolytic oxidation. Surf. Coat. Technol. 2015, 269, 114–118. [Google Scholar] [CrossRef]
  34. Lamaka, S.V.; Knoernschild, G.; Snihirova, D.V.; Taryba, M.G.; Zheludkevich, M.L.; Ferreira, M.G.S. Complex anticorrosion coating for ZK30 magnesium alloy. Electrochim. Acta 2009, 55, 131–141. [Google Scholar] [CrossRef]
  35. Liu, C.; Lu, X.; Li, Y.; Chen, Q.; Zhang, T.; Wang, F. Influence of post-treatment process on corrosion and wear properties of PEO coatings on AM50 Mg alloy. J. Alloys Compd. 2021, 870, 159462. [Google Scholar] [CrossRef]
  36. Liu, W.; Pu, Y.; Liao, H.; Lin, Y.; He, W. Corrosion and Wear Behavior of PEO Coatings on D16T Aluminum Alloy with Different Concentrations of Graphene. Coatings 2020, 10, 249. [Google Scholar] [CrossRef] [Green Version]
  37. Lu, X.; Blawert, C.; Kainer, K.U.; Zhang, T.; Wang, F.; Zheludkevich, M.L. Influence of particle additions on corrosion and wear resistance of plasma electrolytic oxidation coatings on Mg alloy. Surf. Coat. Technol. 2018, 352, 1–14. [Google Scholar] [CrossRef]
  38. Li, C.; Guo, X.; Frankel, G.S. Corrosion inhibition of AA2024-T3 by smart polyelectrolyte coacervates responsive to both acidic and alkaline environments. Prog. Org. Coat. 2020, 146, 105719. [Google Scholar] [CrossRef]
  39. Jiang, D.; Xia, X.; Hou, J.; Cai, G.; Zhang, X.; Dong, Z. A novel coating system with self-reparable slippery surface and active corrosion inhibition for reliable protection of Mg alloy. Chem. Eng. J. 2019, 373, 285–297. [Google Scholar] [CrossRef]
  40. Lu, X.; Mohedano, M.; Blawert, C.; Matykina, E.; Arrabal, R.; Kainer, K.U.; Zheludkevich, M.L. Plasma electrolytic oxidation coatings with particle additions—A review. Surf. Coat. Technol. 2016, 307, 1165–1182. [Google Scholar] [CrossRef]
  41. Lu, X.; Blawert, C.; Huang, Y.; Ovri, H.; Zheludkevich, M.L.; Kainer, K.U. Plasma electrolytic oxidation coatings on Mg alloy with addition of SiO2 particles. Electrochim. Acta 2016, 187, 20–33. [Google Scholar] [CrossRef]
  42. Laleh, M.; Kargar, F.; Rouhaghdam, A.S. Formation of a compact oxide layer on AZ91D magnesium alloy by microarc oxidation via addition of cerium chloride into the MAO electrolyte. J. Coat. Technol. Res. 2011, 8, 765–771. [Google Scholar] [CrossRef]
  43. Rahmatia, M.; Raeissia, K.; Toroghinejada, M.R.; Hakimizad, A.; Santamaria, M. Corrosion and wear resistance of coatings produced on AZ31 Mg alloy by plasma electrolytic oxidation in silicate-based K2TiF6 containing solution: Effect of waveform. J. Magnes. Alloys 2022, 10, 2574–2587. [Google Scholar] [CrossRef]
  44. Han, J.; Yu, Y.; Yang, J.; Xiaopeng, L.; Blawert, C.; Zheludkevich, M.L. Corrosion and wear performance of La2O3 doped plasma electrolytic oxidation coating on pure Mg. Surf. Coat. Technol. 2022, 433, 128112. [Google Scholar] [CrossRef]
  45. Hu, J.; Huang, D.; Song, G.-L.; Guo, X. The synergistic inhibition effect of organic silicate and inorganic Zn salt on corrosion of Mg-10Gd-3Y magnesium alloy. Corros. Sci. 2011, 53, 4093–4101. [Google Scholar] [CrossRef]
  46. Wang, X.; Lu, X.; Ju, P.; Chen, Y.; Zhang, T.; Wang, F. Thermal control property and corrosion resistance of PEO coatings on AZ91 Mg alloy. Surf. Coat. Technol. 2020, 393, 125709. [Google Scholar] [CrossRef]
  47. Kang, L.; Gao, J.; Xu, H.R.; Zhao, S.Q.; Chen, H.; Wu, P.H. Epitaxial Mg2SiO4 thin films with a spinel structure grown on Si substrates. J. Cryst. Growth 2006, 297, 100–104. [Google Scholar] [CrossRef]
  48. Wu, J.; Lu, P.; Dong, L.; Zhao, M.; Li, D.; Xue, W. Combination of plasma electrolytic oxidation and pulsed laser deposition for preparation of corrosion-resisting composite film on zirconium alloys. Mater. Lett. 2020, 262, 127080. [Google Scholar] [CrossRef]
  49. Zhang, G.; Jiang, E.; Wu, L.; Tang, A.; Atrens, A.; Pan, F. Active corrosion protection of phosphate loaded PEO/LDHs composite coatings: SIET study. J. Magnes. Alloys 2022, 10, 1351–1357. [Google Scholar] [CrossRef]
Figure 1. TEM micrographs of Cr nanoparticles: (a) morphology and (b) Cr element distribution.
Coatings 13 01196 g001
Figure 2. The variation of voltage with treatment time during the coating-formation process.
Coatings 13 01196 g002
Figure 3. Surface morphology of the coatings with and without Cr nanoparticle incorporation at 430 V: (a1,a2) PEO−430, (b1,b2) LPEO−430, (c1,c2) HPEO−430.
Coatings 13 01196 g003
Figure 4. Surface morphology of the coatings with and without Cr nanoparticle incorporation at 460 V: (a1,a2) PEO−460, (b1,b2) LPEO−460, (c1,c2) HPEO−460.
Coatings 13 01196 g004
Figure 5. Cross-sectional morphology of the coatings produced with and without Cr nanoparticle incorporation at 430 V: (a1,a2,a3) PEO−430, (b1,b2,b3) LPEO−430, (c1,c2,c3) HPEO−430.
Coatings 13 01196 g005
Figure 6. Cross-sectional morphology of the coatings produced with and without Cr nanoparticle incorporation at 460 V: (a1,a2,a3) PEO−460, (b1,b2,b3) LPEO−460, (c1,c2,c3) HPEO−460.
Coatings 13 01196 g006
Figure 7. EPMA maps of the main elemental distribution on the cross-section of LPEO−460.
Coatings 13 01196 g007
Figure 8. XRD patterns of the PEO coatings.
Coatings 13 01196 g008
Figure 9. XPS spectra of the LPEO−460 coating formed in an alkaline silicate electrolyte: (a) the survey spectrum; (be) the specific spectra of Cr 2p, O 1s, Mg 2p, and Si 2p.
Coatings 13 01196 g009
Figure 10. Polarization curves of the coatings in 0.5 wt.% NaCl solution.
Coatings 13 01196 g010
Figure 11. Electrochemical impedance spectroscopy of the coatings at 430 V: (a,d) PEO−430, (b,e) LPEO−430, (c,f) HPEO−430.
Coatings 13 01196 g011
Figure 12. Electrochemical impedance spectroscopy of the coatings at 460 V: (a,d) PEO−460, (b,e) LPEO−460, (c,f) HPEO−460.
Coatings 13 01196 g012
Figure 13. Equivalent circuits used to fit the EIS data.
Coatings 13 01196 g013
Figure 14. Evolution of (a) 1/Rp and (b) Ccoating of the different PEO coatings during the EIS test.
Coatings 13 01196 g014
Table 1. Surface porosity of the PEO coatings with various contents of nanoparticle incorporation and different voltage.
SamplePorosity
PEO−430 (16.9 ± 0.5)%
LPEO−430 (15.9 ± 0.5)%
HPEO−430 (9.5 ± 0.3)%
PEO−460 (12.4 ± 0.4)%
LPEO−460 (18 ± 0.6)%
HPEO−460 (12 ± 0.3)%
Table 2. Cross-sectional composition (at.%) of the PEO coatings determined with EDS analysis.
SamplePEO−
430
LPEO−
430
HPEO−
430
PEO−
460
LPEO−
460
HPEO−
460
Element
O57.8 ± 0.560 ± 0.760 ± 0.960 ± 0.559.4 ± 0.659.8 ± 0.3
Na2 ± 0.22.2 ± 0.12.6 ± 0.22 ± 0.12.2 ± 0.13.5 ± 0.3
Mg23.6 ± 0.322.1 ± 0.219.6 ± 0.323 ± 0.422.1 ± 0.517.6 ± 0.2
Al1 ± 0.10.8 ± 0.11 ± 0.21.1 ± 0.10.9 ± 0.10.8 ± 0.1
Si15.6 ± 0.313.7 ± 0.413.6 ± 0.313.9 ± 0.514.1 ± 0.213.8 ± 0.5
Cr01.2 ± 0.13.2 ± 0.101.3 ± 0.14.5 ± 0.2
Table 3. Corrosion potential and corrosion current density of the coatings.
SampleIcorr (A/cm2)Ecorr (V)
PEO−430(2.0 ± 0.4) × 10−6−1.51 ± 0.01
LPEO−430(1.3 ± 0.5) × 10−7−1.48 ± 0.02
HPEO−430(2.9 ± 1.1) × 10−7−1.45 ± 0.03
PEO−460(1.4 ± 0.4) × 10−6−1.45 ± 0.02
LPEO−460(7.6 ± 0.9) × 10−8−1.49 ± 0.03
HPEO−460(3.7 ± 0.8) × 10−7−1.47 ± 0.02
Table 4. Fitted results of the impedance spectra in Figure 10 and Figure 11.
SampleTimeCPEc
(S s−n cm−2)
n1Rc
(Ω·cm2)
CPEdl
(S s−n cm−2)
n2Rct
(Ω·cm2)
RP
(Ω·cm2)
C
(S s−n cm−2)
PEO−43015.21 × 10−70.78 5.57 × 1042.42 × 10−60.80 2.46 × 1048.03 × 1041.25 × 10−5
241.48 × 10−70.84 2.55 × 1032.79 × 10−70.76 7.51 × 1047.76 × 1041.29 × 10−5
484.85 × 10−70.80 1.37 × 1031.66 × 10−70.89 7.74 × 1047.88 × 1041.27 × 10−5
726.82 × 10−60.90 1.25 × 1041.63 × 10−40.92 8.37 × 1032.08 × 1045.20 × 10−6
961.44 × 10−50.90 9.65 × 1033.48 × 10−40.87 4.21 × 1031.39 × 1041.15 × 10−5
LPEO−43012.18 × 10−70.84 4.49 × 1042.49 × 10−70.68 4.48 × 1064.52 × 1068.77 × 10−8
243.66 × 10−70.84 2.68 × 1053.04 × 10−70.69 3.39 × 1063.65 × 1062.33 × 10−7
487.68 × 10−70.89 2.21 × 1059.40 × 10−60.56 1.85 × 1054.06 × 1056.22 × 10−7
726.68 × 10−60.94 1.12 × 1045.60 × 10−40.78 4.76 × 1031.59 × 1045.63 × 10−6
961.43 × 10−50.94 8.01 × 1038.94 × 10−40.73 3.47 × 1031.15 × 1041.24 × 10−5
HPEO−43017.86 × 10−70.75 3.44 × 1041.47 × 10−70.90 1.87 × 1061.90 × 1062.28 × 10−7
241.26 × 10−60.81 1.81 × 1055.20 × 10−80.91 5.08 × 1056.89 × 1058.88 × 10−7
482.10 × 10−60.89 1.16 × 1058.47 × 10−50.61 5.65 × 1041.73 × 1051.76 × 10−6
724.67 × 10−60.93 2.78 × 1042.28 × 10−40.77 1.35 × 1044.13 × 1044.02 × 10−6
961.44 × 10−50.90 9.65 × 1033.48 × 10−40.87 4.21 × 1031.39 × 1041.15 × 10−5
PEO−46012.15 × 10−70.81 6.93 × 1041.33 × 10−70.79 5.60 × 1056.29 × 1051.59 × 10−6
242.32 × 10−70.80 1.63 × 1041.45 × 10−60.54 6.27 × 1047.90 × 1045.66 × 10−8
483.21 × 10−70.77 1.13 × 1054.16 × 10−60.88 2.90 × 1041.42 × 1057.03 × 10−6
721.10 × 10−60.90 4.41 × 1045.22 × 10−50.74 1.09 × 1045.50 × 1047.78 × 10−7
963.17 × 10−60.93 1.93 × 1042.06 × 10−40.71 7.01 × 1032.64 × 1042.53 × 10−6
LPEO−46011.16 × 10−70.83 3.29 × 1061.20 × 10−70.51 1.12 × 1071.45 × 1079.52 × 10−8
241.79 × 10−70.80 1.10 × 1061.66 × 10−70.69 4.72 × 1065.81 × 1061.20 × 10−7
482.35 × 10−70.82 4.75 × 1066.99 × 10−70.89 4.63 × 1069.38 × 1062.41 × 10−7
725.67 × 10−70.90 5.90 × 1053.58 × 10−50.91 2.33 × 1058.23 × 1055.04 × 10−7
961.50 × 10−60.94 7.78 × 1047.89 × 10−50.76 4.04 × 1041.18 × 1051.29 × 10−6
HPEO−46011.16 × 10−60.77 1.50 × 1062.30 × 10−50.90 2.23 × 1051.72 × 1061.37 × 10−6
241.24 × 10−60.82 1.57 × 1057.02 × 10−70.82 1.40 × 1052.28 × 1058.70 × 10−7
481.62 × 10−60.85 1.47 × 1051.48 × 10−50.87 1.27 × 1041.60 × 1051.26 × 10−6
722.32 × 10−60.89 1.03 × 1058.37 × 10−50.70 2.59 × 1041.29 × 1051.96 × 10−6
961.54 × 10−50.95 1.46 × 1049.39 × 10−50.45 7.34 × 1032.19 × 1041.42 × 10−5
Disclaimer/Publisher’s Note: The statements, opinions and data contained in all publications are solely those of the individual author(s) and contributor(s) and not of MDPI and/or the editor(s). MDPI and/or the editor(s) disclaim responsibility for any injury to people or property resulting from any ideas, methods, instructions or products referred to in the content.

