Article

Effect of HfO2 Particles on Ceramic Coating Fabricated on Ti6Al4V Alloy via Plasma Electrolytic Oxidation

1
School of Mechanical and Engineering, Xihua University, Chengdu 610039, China
2
College of Materials Science and Engineering, Xihua University, Chengdu 610039, China
3
School of New Energy and Materials, Southwest Petroleum University, Chengdu 610500, China
*
Author to whom correspondence should be addressed.
Coatings 2023, 13(5), 967; https://doi.org/10.3390/coatings13050967
Submission received: 7 April 2023 / Revised: 18 May 2023 / Accepted: 19 May 2023 / Published: 22 May 2023
(This article belongs to the Section Corrosion, Wear and Erosion)

Abstract

:
Hafnium dioxide (HfO2) has a wide bandgap and high dielectric constant. We prepared ceramic coatings on Ti6Al4V alloys via plasma electrolytic oxidation (PEO) in an electrolyte with HfO2 particles. The influence of the HfO2 particles on the microstructure, phase composition, elemental distribution, and corrosion resistance of the PEO coatings was systematically investigated. The results showed that the addition of HfO2 increased the oxidation voltage (from 462 to 472 V) and promoted the microarc sintering reaction so that the thickness and hardness of the resulting PEO coating increased. Moreover, the quantity of the micropores on the coating surface caused by the discharge decreased after adding the HfO2 particles. The X-ray diffraction patterns confirmed that the HfO2 particles were incorporated into the coating by remelting and sintering the microarc. Furthermore, the corrosion resistance of the PEO coating was remarkably increased after introducing HfO2, which was attributed to the increase in the electrode potential and the densification of the coating structure.

1. Introduction

The Ti6Al4V titanium alloy is regarded as an important structural material in the petrochemical, aerospace, and deep-sea-ships industries due to its high corrosion resistance, toughness, and weldability [1,2,3,4]. However, with the development of the petrochemical industry, the Ti6Al4V titanium alloy cannot function in some harsh environments. Therefore, using appropriate technology to increase the wear, thermal shock, and corrosion resistance of the Ti6Al4V titanium alloy is necessary [5,6].
Plasma electrolytic oxidation (PEO), also called microarc oxidation (MAO), has been one of the commonly used surface treatment technologies for valve metals (aluminum, magnesium, titanium, and zirconium as well as their alloys) in recent years [7,8,9]. The ceramic coatings, which have the advantages of wear and corrosion resistance, low thermal conductivity, and a high bonding strength with the substrate, can be fabricated via PEO [10,11,12]. In general, the PEO coatings are formed both by substrate oxidation and by other electrolyte substances deposited onto the substrate surface, which allows for a wide range of modifications of the coating’s composition and properties. For specific purposes, fine powders of hard, high-melting-point materials and/or dry lubricants (for enhanced friction and wear) and/or coloring agents (for optical properties and decoration) can be introduced into the electrolytes to integrate the cataphoretic effects into the oxidation process. Many researchers have focused on modifying PEO coatings based on the above theory.
Yang et al. [13] found that AlN-doped PEO coatings had an excellent thermal conductivity and insulation performance due to the AlN properties. Li et al. [11] found that the addition of ZrO2 particles could increase the oxidation and wear resistance of PEO coatings. Chen et al. [14] fabricated graphene and PEO coatings and found an increase in the hardness and corrosion resistance compared with a single PEO coating. Zheng et al. [15] reported that PEO coatings with CeO2 particles exhibited excellent corrosion resistance with a self-sealing ability. Ma et al. [16] revealed that the addition of B4C/C particles during the PEO process resulted in an increase in the thickness and a decrease in the friction coefficient of the as-prepared PEO coating. Liu et al. [17] found that the addition of BiS2 increased the thickness and hardness of the PEO coating, but its thermal shock resistance decreased. In general, researchers are still actively exploring the use of particle or component additives to enhance the properties of PEO coatings.
Hafnium oxide (HfO2) is attracting attention in the ceramic industry due to its wide bandgap, high dielectric constant, excellent corrosion resistance, and thermal and chemical stability [18,19,20], and the high impedance of HfO2 films was confirmed by Esplandiu et al. [21]. Therefore, HfO2 is expected to enhance the properties of PEO coatings fabricated on Ti6Al4V, especially their corrosion resistance.
Herein, HfO2 particles as an additive during the PEO process are first reported, and the influence of HfO2 particles on PEO coatings was systematically investigated. The components and compositions of the PEO coating indicated that the HfO2 was successfully introduced into the coating through remelting caused by the plasma discharge instead of a new compound. With the introduction of HfO2, the insulation property of the PEO coating was increased, which led to an increase in the oxidation voltage and more severe plasma breakdown. Thus, more electrolyte components could be sintered onto the PEO coating, which resulted in an increase in the coating thickness. Moreover, the hardness and corrosion resistance of the HfO2-doped coating were higher than those of the nondoped coating due to the densification of the coating.

2. Experimental Procedure

2.1. Sample Preparation

The Ti6Al4V samples had dimensions of 15 × 15 × 3 mm3. The main elements of the contents (mass percentage) were (5.5~6.8%) Al, (3.5~4.5%) V, (0.3%) Fe, (0.15%) Si, (0.1%) C, (0.05%) N, and (0.2%) O, with Ti balance. Prior to the PEO coating preparation, the Ti6Al4V samples were ground with abrasive papers (400-2000#) and then cleaned with deionized water for use.
The PEO processes were conducted at a peak current density of 10 A/dm2 for 30 min with a fixed frequency of 500 Hz and a duty cycle of 50%. The selected electrolyte formulations were Na2SiO3 (4 g/L), Na3PO4 (6 g/L), NaOH (0.5 g/L), EDTA (0.3 g/L), and C3H8O3 (3 mL/L). In addition, HfO2 was added to the electrolyte as an additive (5 g/L). Both the basic and modified electrolyte were stirred and placed for 24 h before the PEO process to make the ions in the solution more stable. During the PEO process, the electrolyte temperature was maintained at 25 ± 5 °C, and it was continuously and mechanically stirred. Finally, the samples were sealed with 95 ± 5 °C deionized water for 20 min, and then they were naturally cooled in the air.

2.2. Coating Characterization

The morphology of the coatings was investigated by using scanning electron microscopy (SEM, ZEISS EVO MA15, Oberkochen, Germany), and the elemental content and distribution were detected via energy dispersive spectroscopy (EDS, OXFORD 20, Carl Zeiss Microscopy GmbH, Oberkochen, Germany) coupled to the SEM. The compositions of the coatings were determined by using X-ray diffraction (XRD, DX-2700B, Liaoning, China) with a scanning speed of 0.04°/s and a range of 2θ from 10° to 80°. An X-ray photoelectron spectrometer (XPS, ESCALAB 250X, Waltham, MA, USA) was used to detect the target elements. A digital microhardness tester (HXD-2000TM/LCD, Chengdu, China) was used to evaluate the surface hardness of the coating at a load of 1 N for 15 s, five points were measured for each sample, and the average value was recorded. The thickness and roughness of the coatings were measured by using an eddy current thickness gauge (TT230, Beijing, China) and a surface roughness meter (HD350, Beijing, China), respectively. A Tafel plot and electrochemical impedance spectroscopy (EIS) of the PEO coatings were evaluated by using an electrochemical workstation (Reference 3000, Philadelphia, Commonwealth of Pennsylvania, Harrisburg, PA, USA) with a saturated calomel electrode (SCE) as the reference in a 3.5 wt.% NaCl solution.

3. Results and Discussion

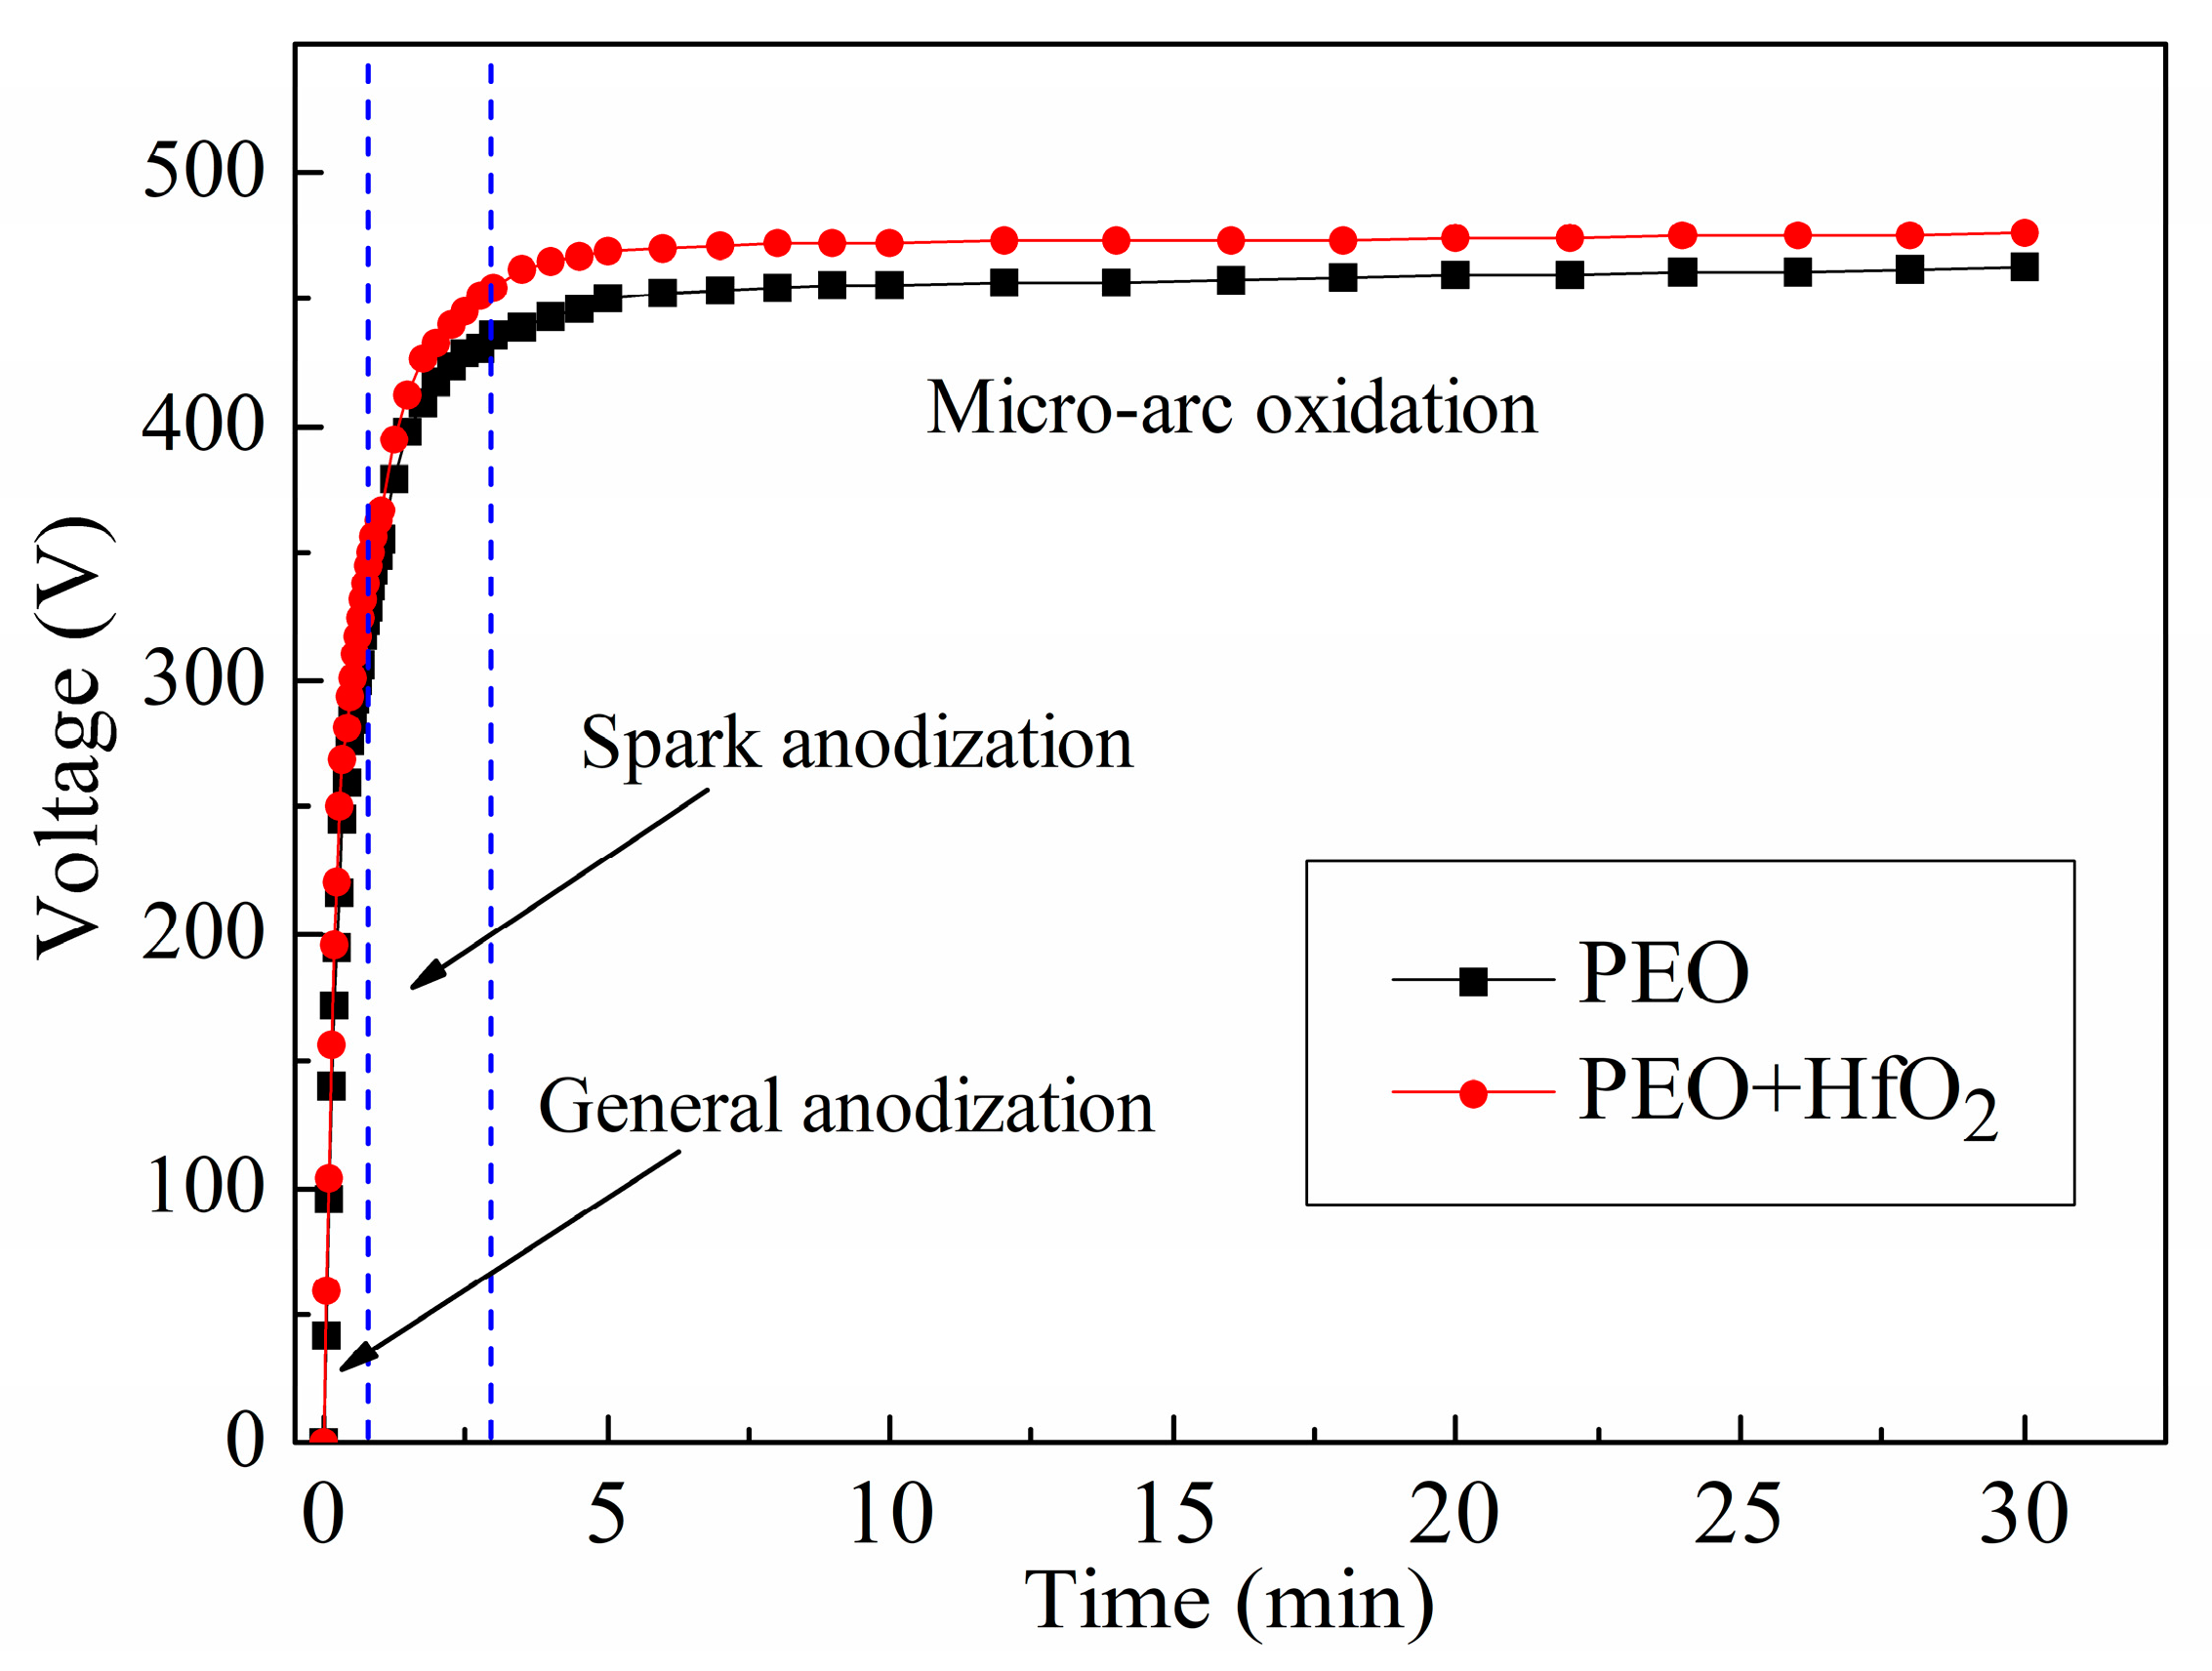
3.1. Voltage–Time Response

Figure 1 shows the voltage–time response curves before and after HfO2 was added during the PEO process. Three stages were clearly observed on the two curves. From 0 to 1 min, a passivation film with a high impedance was rapidly formed on the surface of the Ti6Al4V anode after the circuit was turned on, which resulted in a sharp rise in the voltage, which indicated the general anodization stage [22]. In this stage, the slopes of the two voltage–time curves were roughly the same. Subsequently, when the oxidation voltages increased to the breakdown voltages (355 and 367 V for the PEO and PEO + HfO2 samples, respectively), we observed that a soft spark with low brightness appeared on the anode surface (called the sparking anodization stage). The discontinuous PEO ceramic coating began to form on the surface of the sample, and the weak parts of the coating were constantly broken down by soft sparks [23]. As shown in Figure 1, the PEO + HfO2 sample showed a relatively higher voltage rise rate than the PEO sample in the 1 to 3 min stage. Finally, the two voltage–time response curves reached the plateau voltages (~462 and ~476 V for the PEO and PEO + HfO2 samples, respectively) for the 3 to 30 min stage and then slowly increased. In this stage, we observed that the number of sparks decreased and the intensity considerably increased (also called microarcs), which indicated a higher sintering temperature and pressure around the spark-modification area. The higher plateau voltages of the PEO + HfO2 sample suggest that adding HfO2 can change the discharge characteristics during the PEO process, which facilitates the deposition of HfO2 particles on the coating.

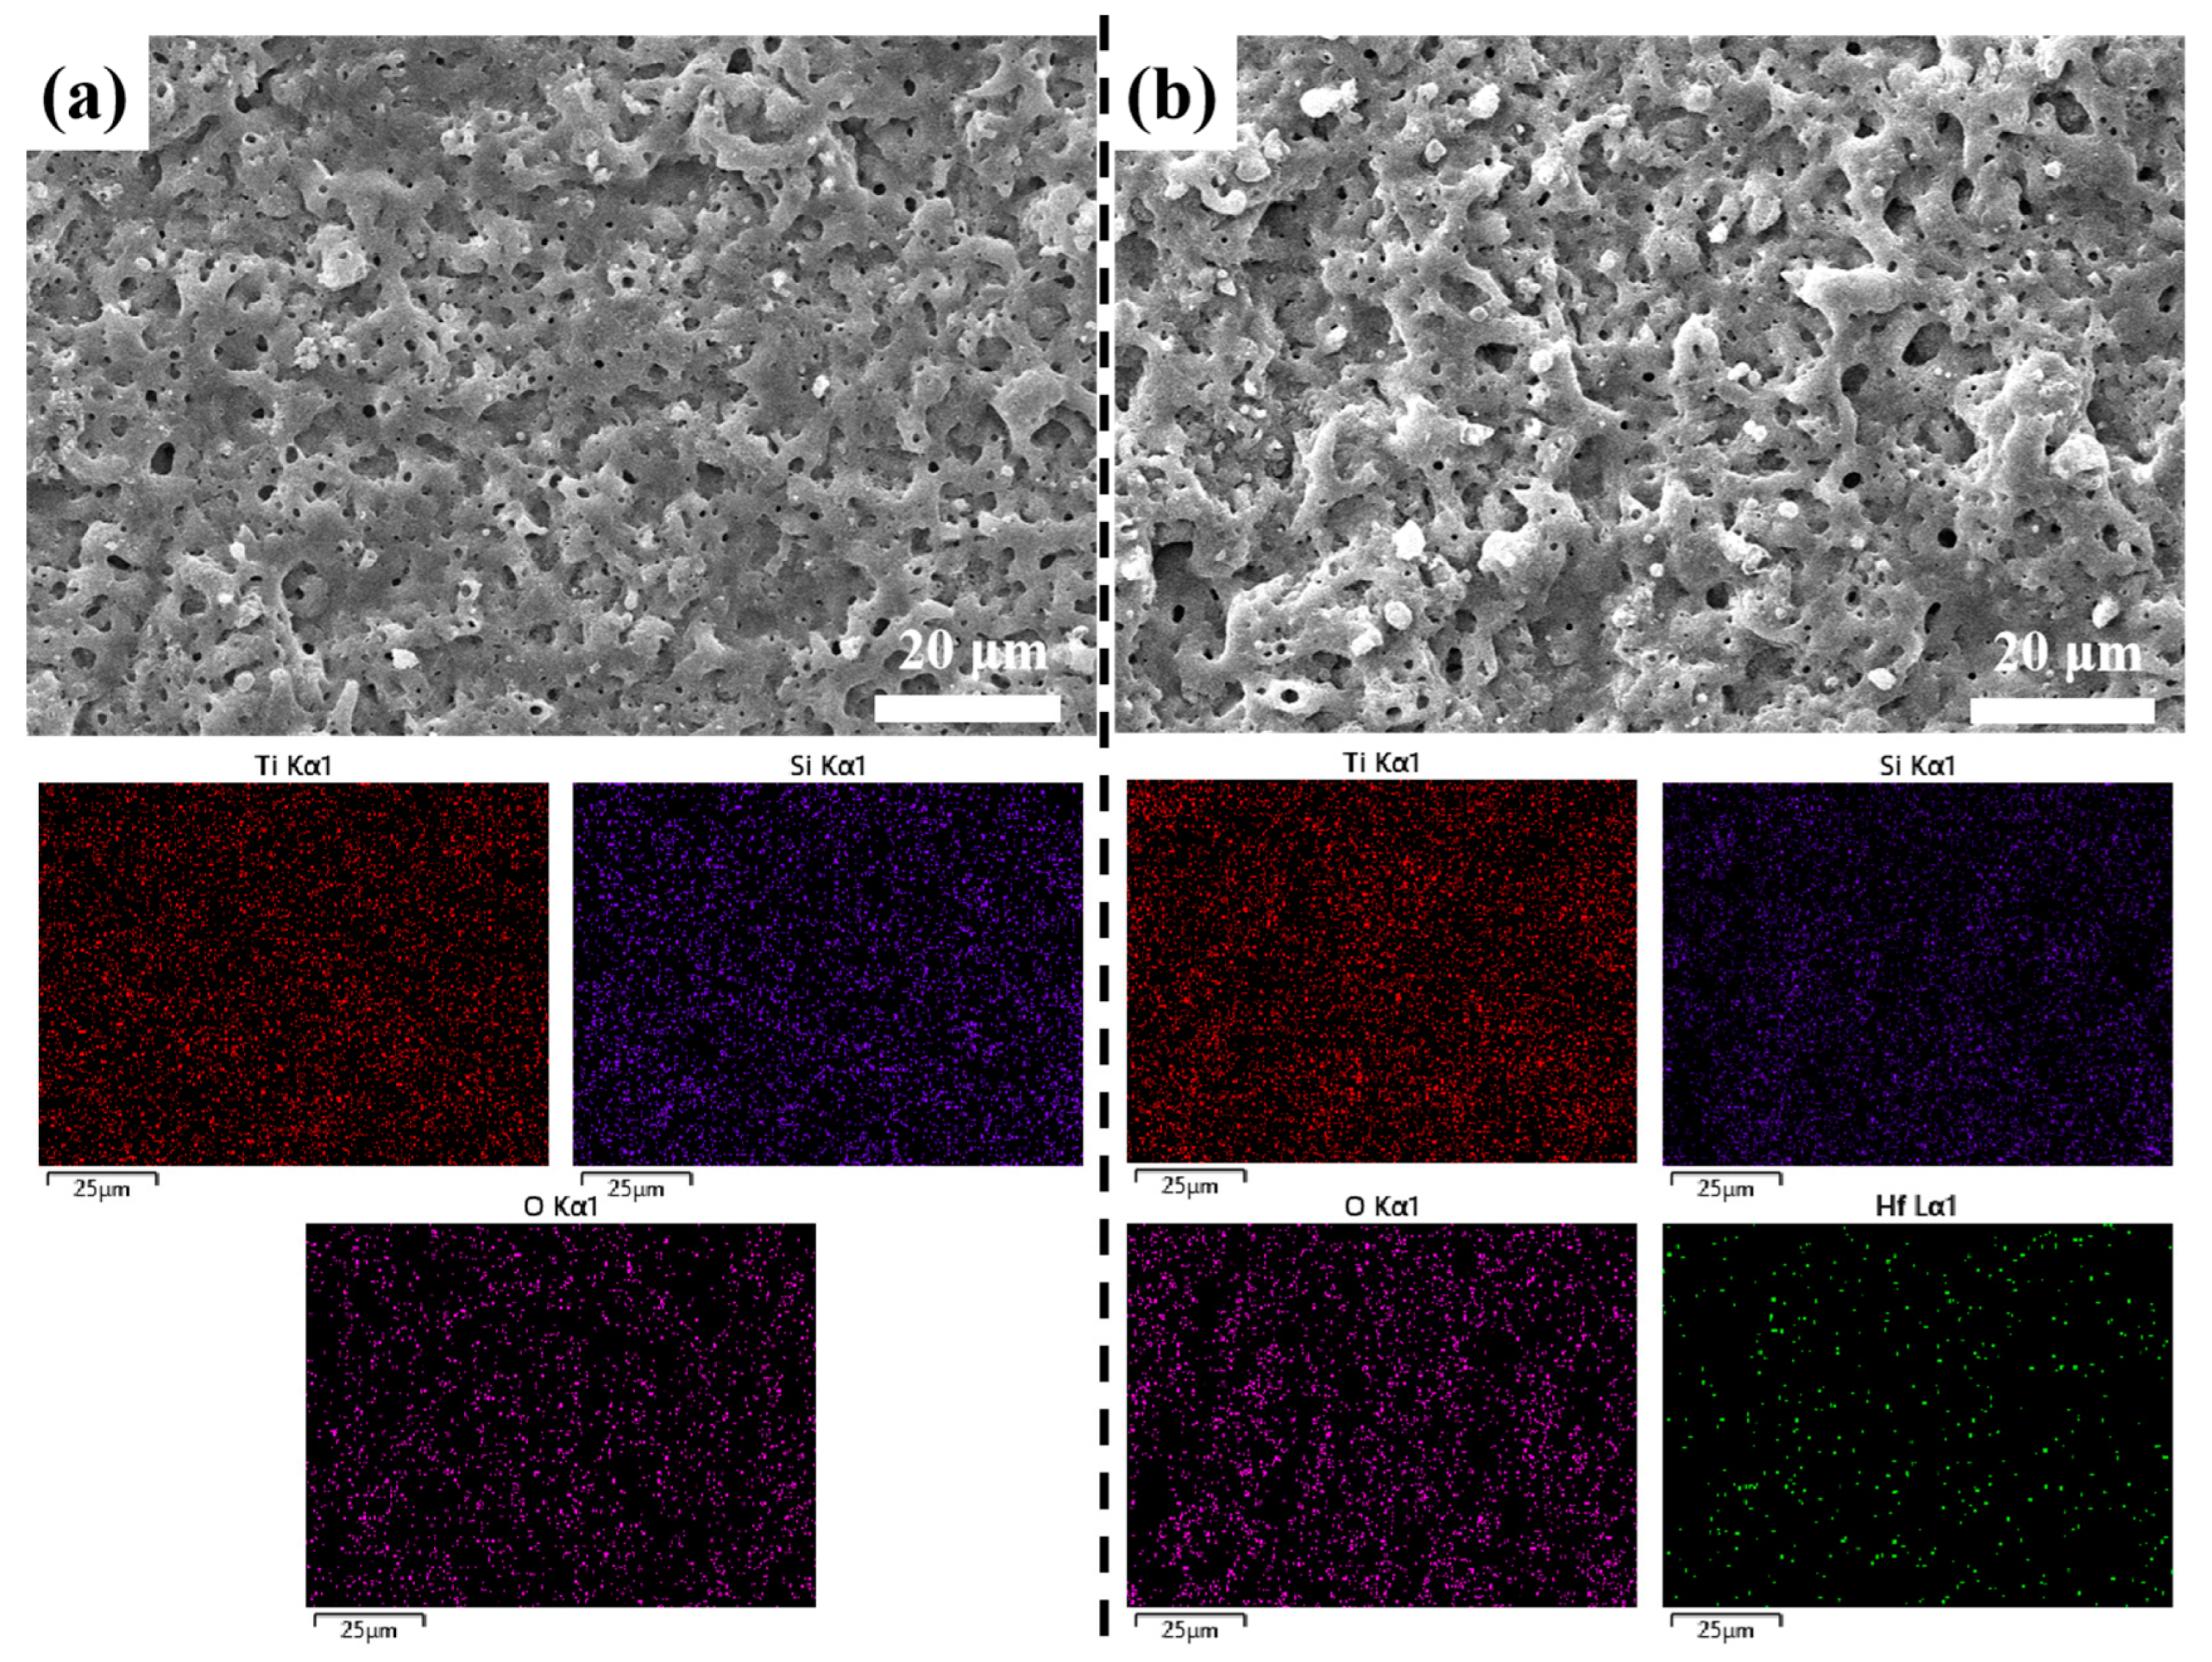
3.2. Morphology of the Coatings

The SEM morphology and the element distribution on the surface of the PEO and PEO + HfO2 samples are presented in Figure 2. Many micropores were present on the surface of the two samples, which were generated by the release of a gas associated with the PEO process, and the micropores were surrounded by volcanic-rock-like stacks [24]. Regarding the surface of the sample without HfO2 (Figure 2a), many small-sized micropores could be observed; by contrast, the quantity of the discharge micropores of the coating decreased and the size increased after the HfO2 particles were added (Figure 2b). With the increase in the oxidation voltage (after adding HfO2), the amount of melt ejected through the discharge micropores increased, and part of the melt solidified around the micropores due to the liquid quenching by the electrolyte. Due to the repeated melting and solidification of the volcanic-rock-like stacks, the various micropores were welded together so that the size of the micropores increased, and thus some small micropores were closed and disappeared. Moreover, the rougher surface of the PEO + HfO2 coating (Ra = 1.268 μm) compared with the PEO coating (Ra = 0.847 μm) could also be attributed to the more violent discharge process under the high voltage (Figure 2b).
The EDS mapping results indicated that the Hf element was successfully introduced into the coating (Figure 2b), and the other major components of the PEO coating fabricated on Ti6Al4V were O, Si, and Ti. Table 1 lists the content of each element component of the PEO coatings, and the Hf content of the PEO + HfO2 coating reached 10 wt.%, which verified that the changes in the microstructure and element content on the surface of the PEO coating were caused by the addition of the HfO2 particles.
Figure 3 reveals the cross-sectional morphologies and the element distribution curves from the coating surface to the interior. We found that the coatings and substrates were well bonded, and no explicit boundary existed between the dense and loose sublayers inside the two coatings. The HfO2-doped coating was denser and thicker (~16 μm) than the nondoped coating (~8 μm). In general, the oxidation voltage directly affected the deposition rate of the PEO coating: the higher the working voltage during the oxidation process, the faster the deposition rate of the coating, and the greater the thickness of the obtained coating. As shown in Figure 1, the high voltage (~476 V) during the PEO process with the HfO2 addition provided the necessary energy for the deposition and sintering of the materials. Therefore, the PEO + HfO2 coating was thicker than the PEO coating prepared under the same conditions.
Regarding the elements’ distribution throughout the coating thickness, Ti gradually increased from outside to inside, whereas O, Si, and Hf gradually decreased (Figure 3). By comparison with the nondoped coating, the HfO2-doped coating (Figure 3b) not only had an obvious Hf diffraction peak (which indicated the successful introduction of Hf into the coating), but it also had a stronger Si diffraction peak. This could be attributed to the more violent plasma electrochemical reaction at a high temperature and pressure.

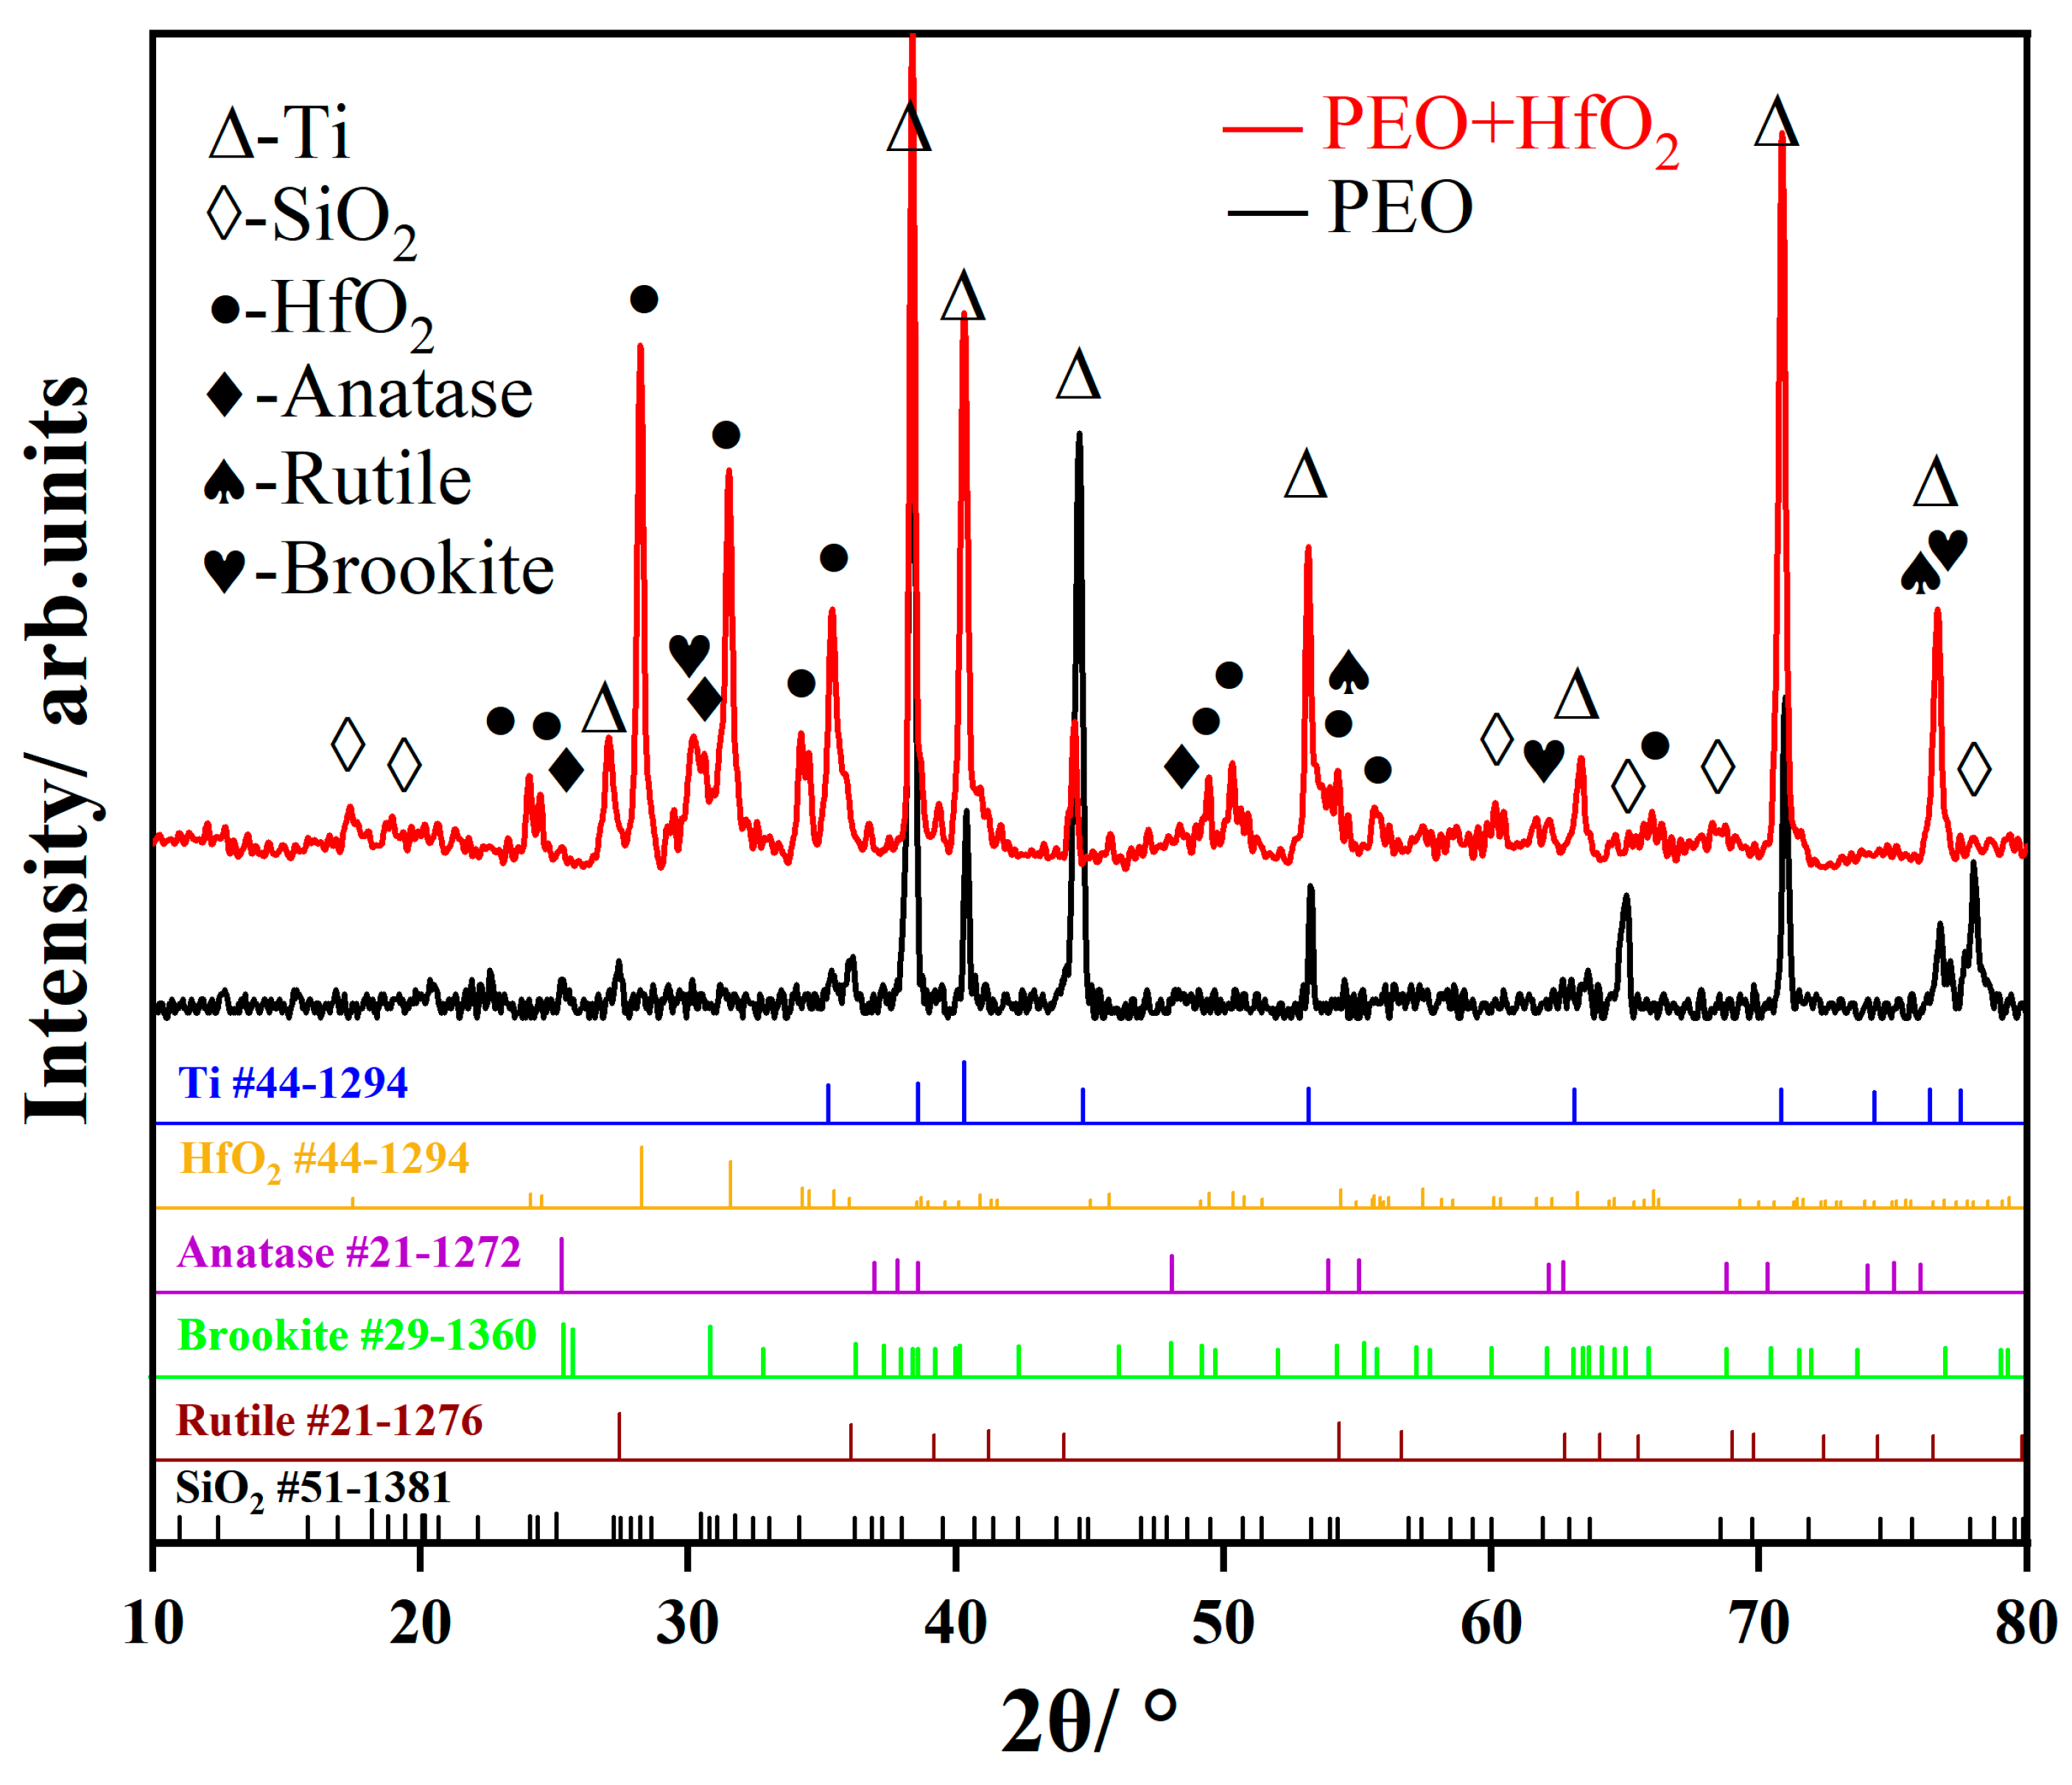
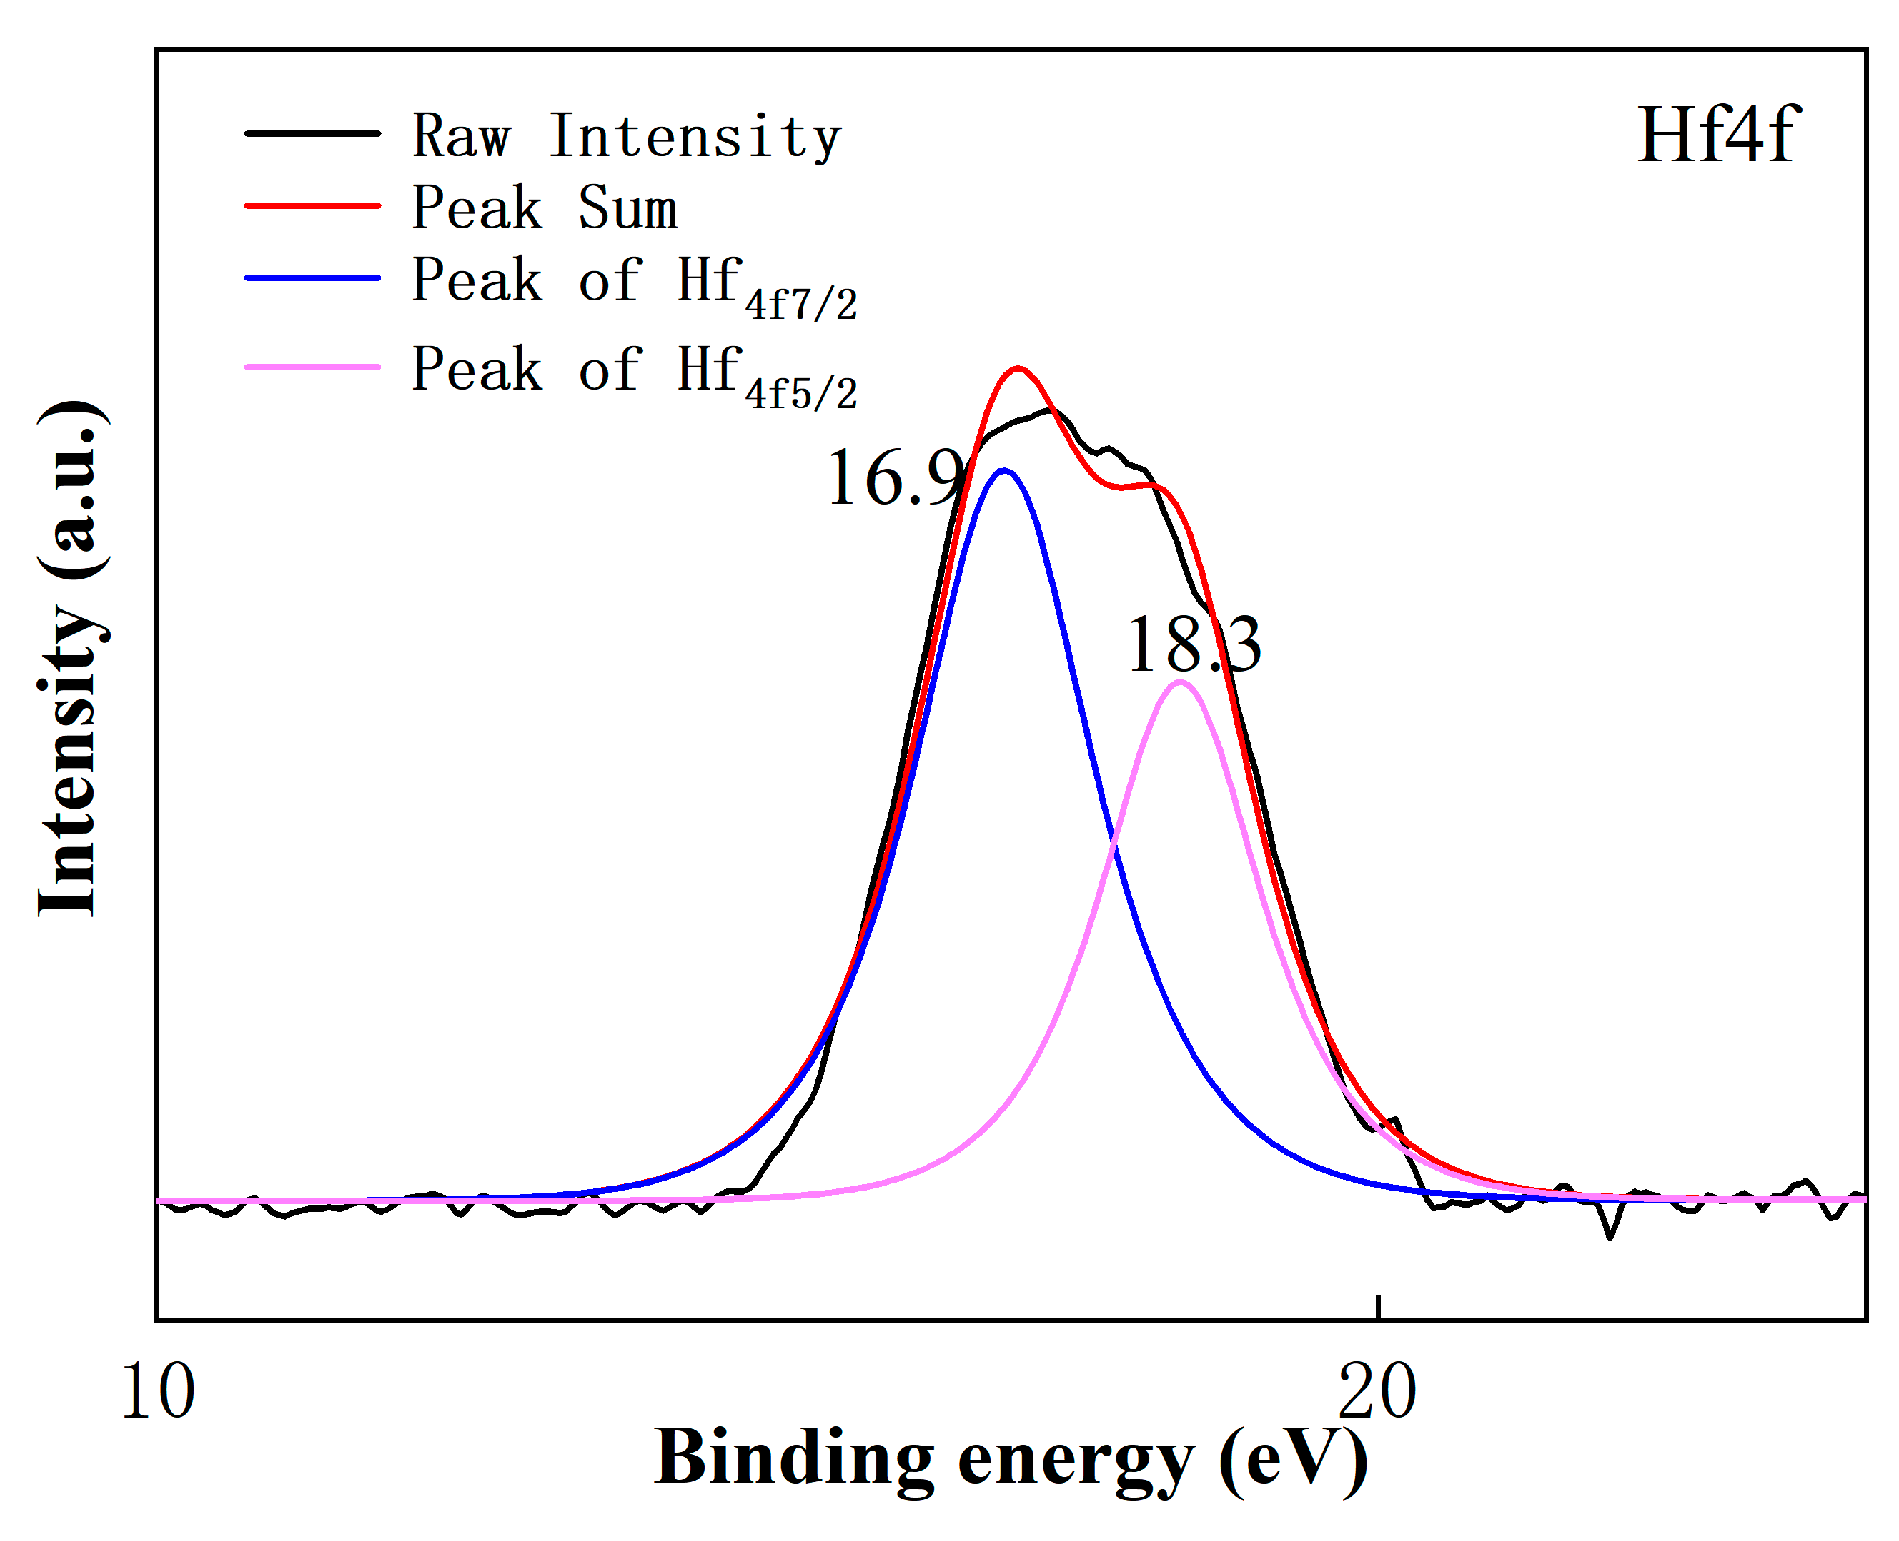
3.3. Phase Compositions of Coatings

The phase compositions of the PEO coatings are presented in Figure 4. Ti, SiO2, anatase, rutile, and brookite were the main components. The characteristic peak of Ti appeared in the spectrum because the X-ray could penetrate the coating with micropores to detect the Ti6Al4V substrate. During the PEO process, the inward immigrant O2− could move through the thinner oxidation coating and react with the outward immigrant Ti4+ from the substrate to produce the titania ceramics (anatase, rutile, and brookite). The characteristic peak intensity of SiO2 increased with the addition of HfO2 particles, which was consistent with the EDS results in Table 1 and Figure 3. This could be explained by the following phenomena: i. the addition of HfO2 increased the oxidation voltage; ii. more SiO32− was electrophoresed to the anode due to the high electric field strength; and iii. the SiO32− was sintered by intense plasma discharge and was deposited on the surface of the anode in the form of SiO2. Therefore, the amount of SiO2 precipitation into the oxide layer increased.
In addition, we found that the Hf introduced into the coating via HfO2 particles still existed in the form of HfO2 (Figure 4); specifically, no new phase containing Hf was detected. The temperature of the plasma discharge area was sufficient to melt the HfO2 particles (melting point of 2758 °C), and therefore the HfO2 should be metallurgically combined in the PEO coating instead of being mechanically mixed in it in the form of particles. Figure 5 shows the XPS spectrum of the PEO + HfO2 coating; two fundamental peaks in the Hf4f spectra were clearly observed, which were located at a binding energy of 16.9 and 18.3 eV, which corresponded to Hf4f7/2 and Hf4f5/2, respectively. The analysis results showed that the Hf element mainly existed in the form of HfO2 during the microarc oxidation process, and no change in the valence state occurred [25]. According to the results of the EDS, XRD, and XPS analysis above, the following reactions may have occurred during the PEO process:
T i 4 e T i 4 +
4 O H 4 e O 2 + 2 H 2 O
2 S i O 3 2 4 e 2 S i O 2 + O 2
T i 4 + + 4 O H T i O 2 + 2 H 2 O
T i + 2 >[ O ] 610   ° C T i O 2 ( A n a t a s e ) 730   ° C T i O 2 R u t i l e
H f O 2 p a r t i c l e m i c r o a r c H f O 2 m e l t c o o l i n g H f O 2 c o a t i n g

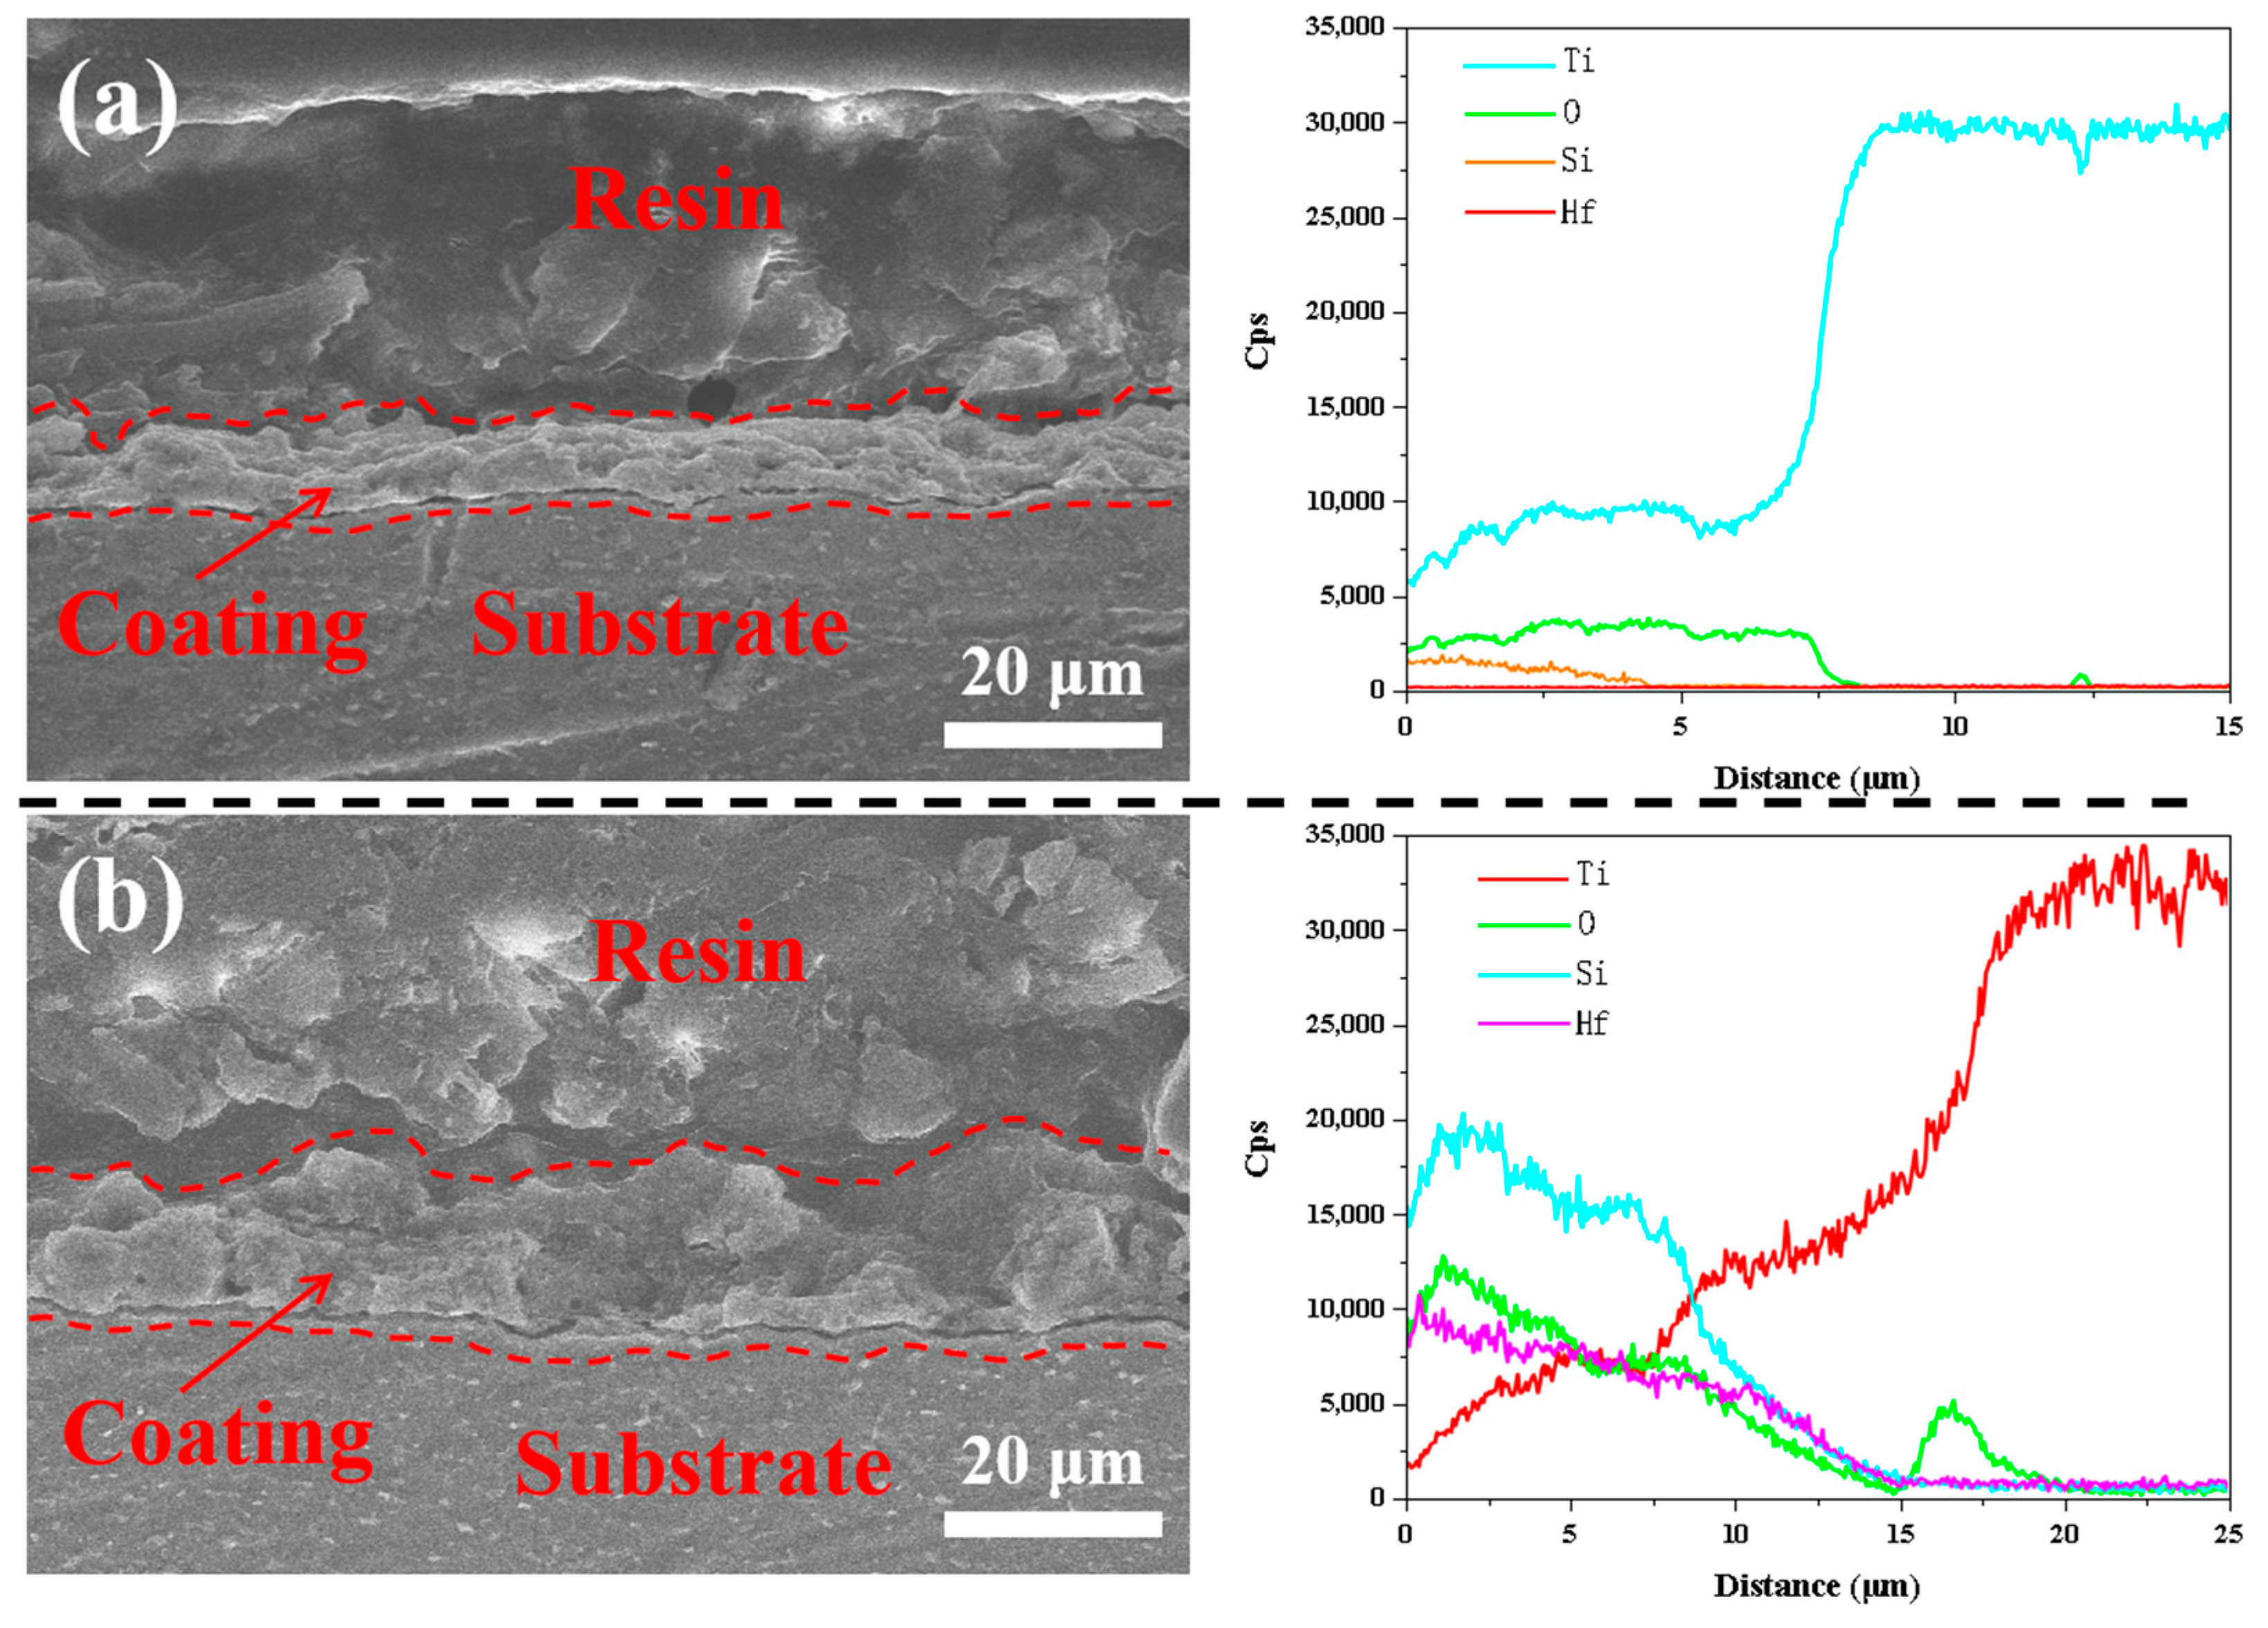
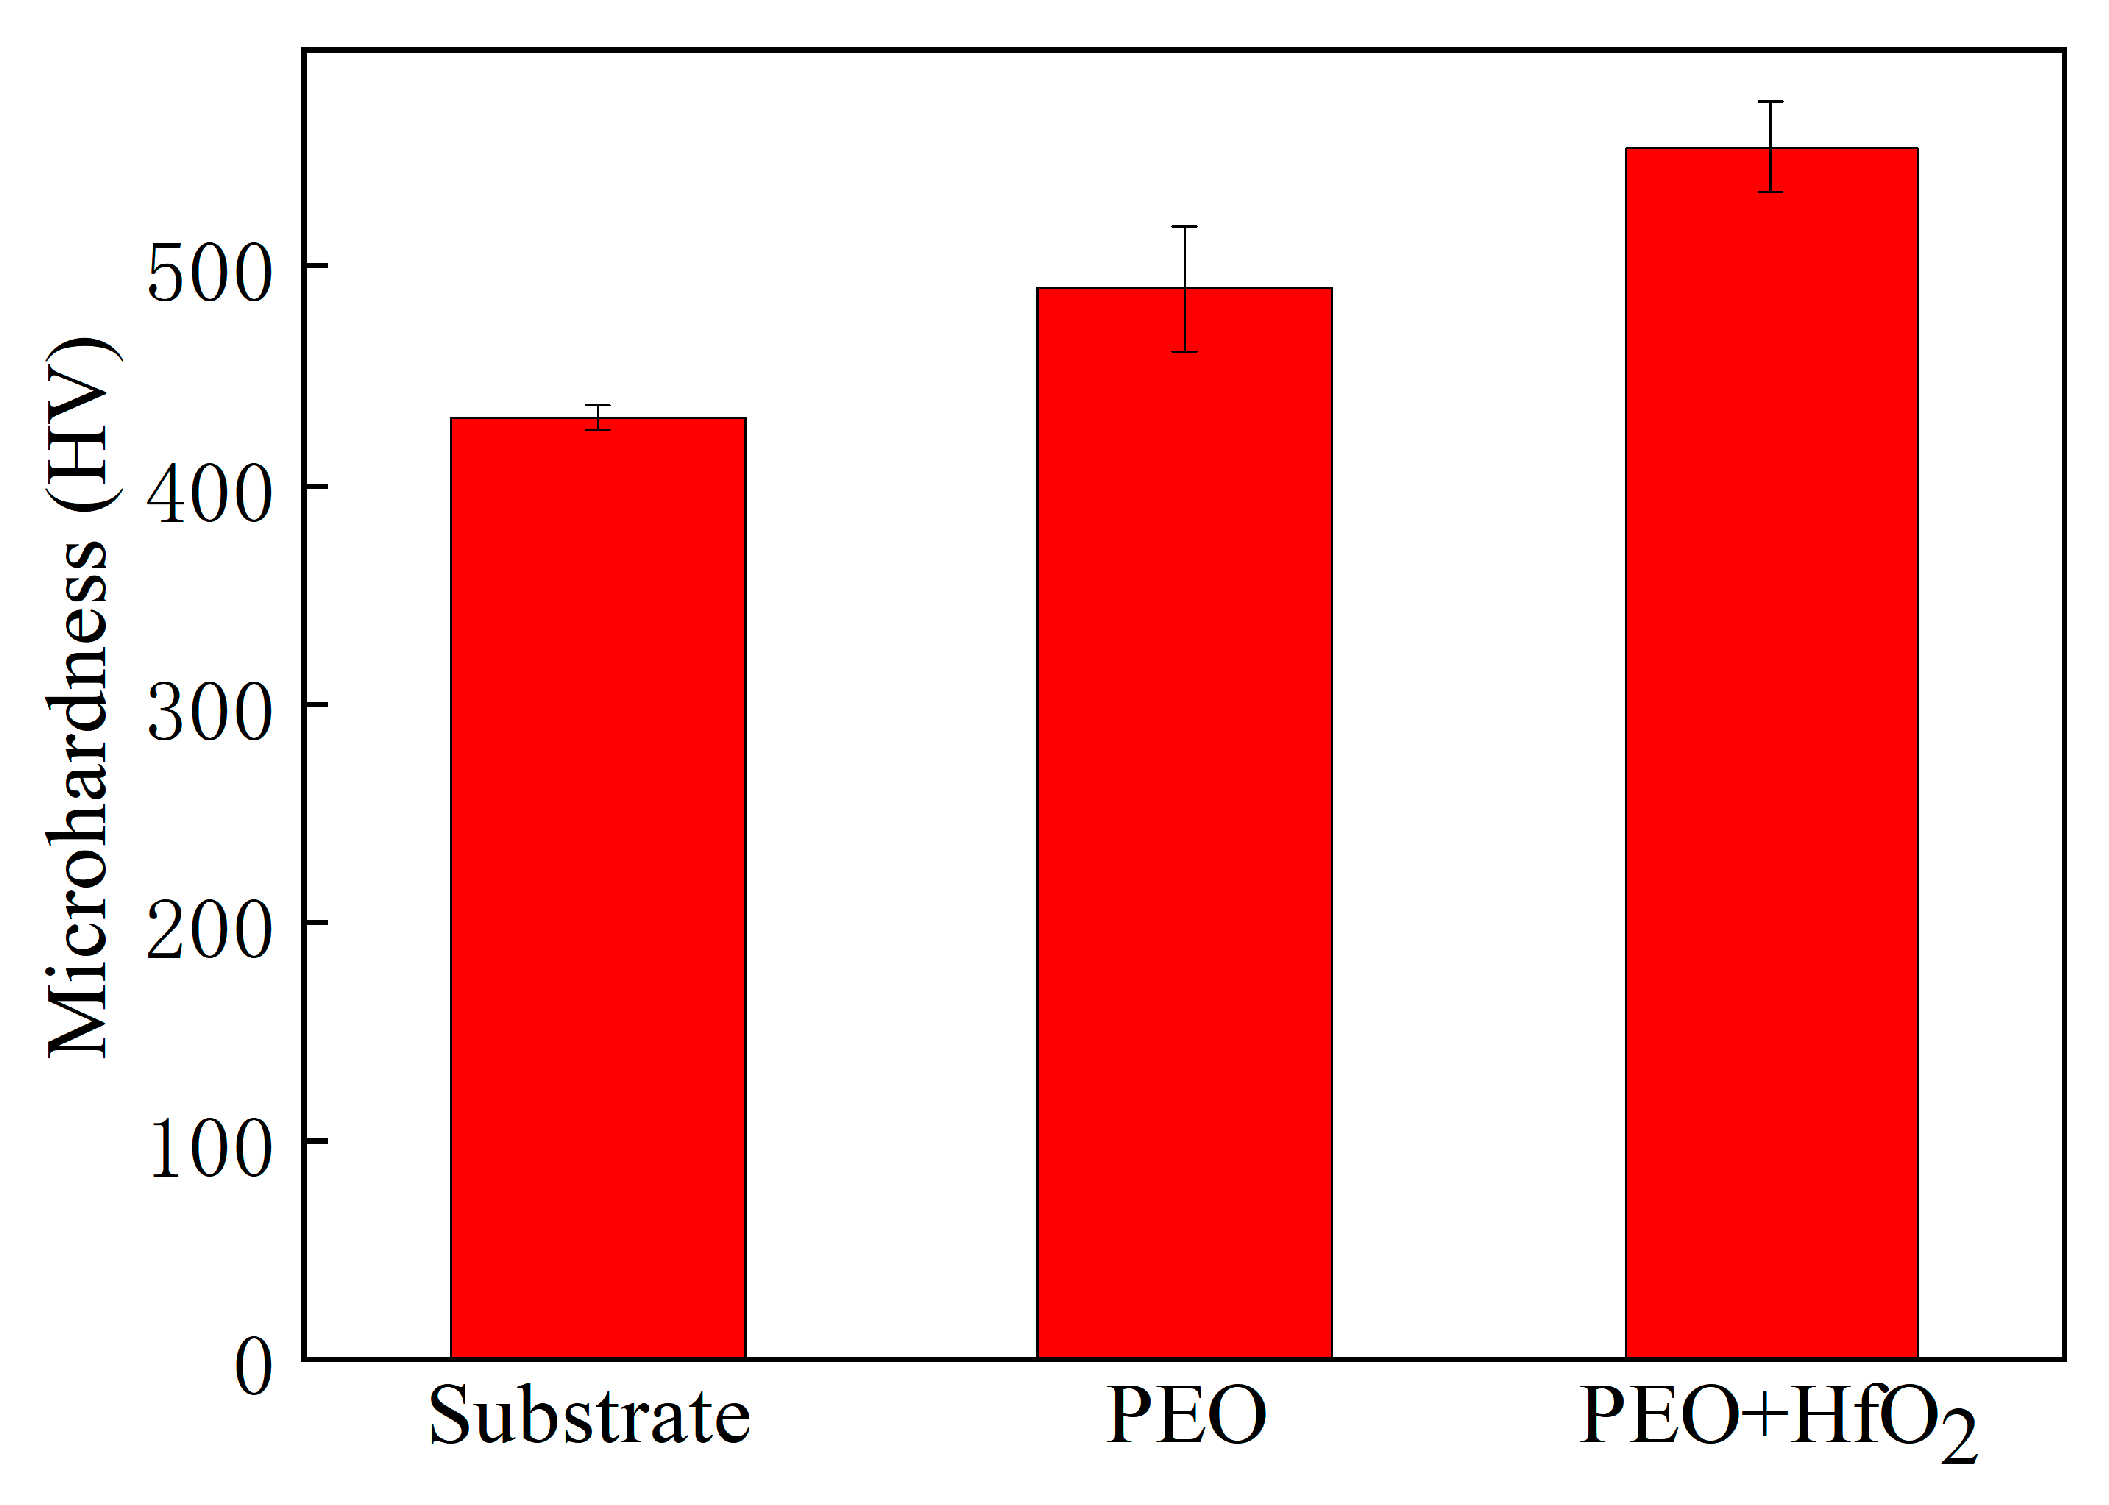
3.4. Thicknesses and Microhardnesses of Coatings

The coating microhardness values are provided in Figure 6. With the addition of HfO2, the hardness of the coating significantly increased, which illustrates that the addition of HfO2 can increase the deposition rate of the coating during the PEO process (Figure 3). Additionally, the microhardness is generally related to the thickness and grain size [26]. The hardness of the PEO + HfO2 coating reached ~530 Hv, which contrasts with the ~480 Hv of the PEO coating. The addition of HfO2 not only refined the grain but also distorted the crystal lattice, which increased the resistance to the dislocation motion and made slip difficult to conduct; thus, the microhardness of the coating was increased.

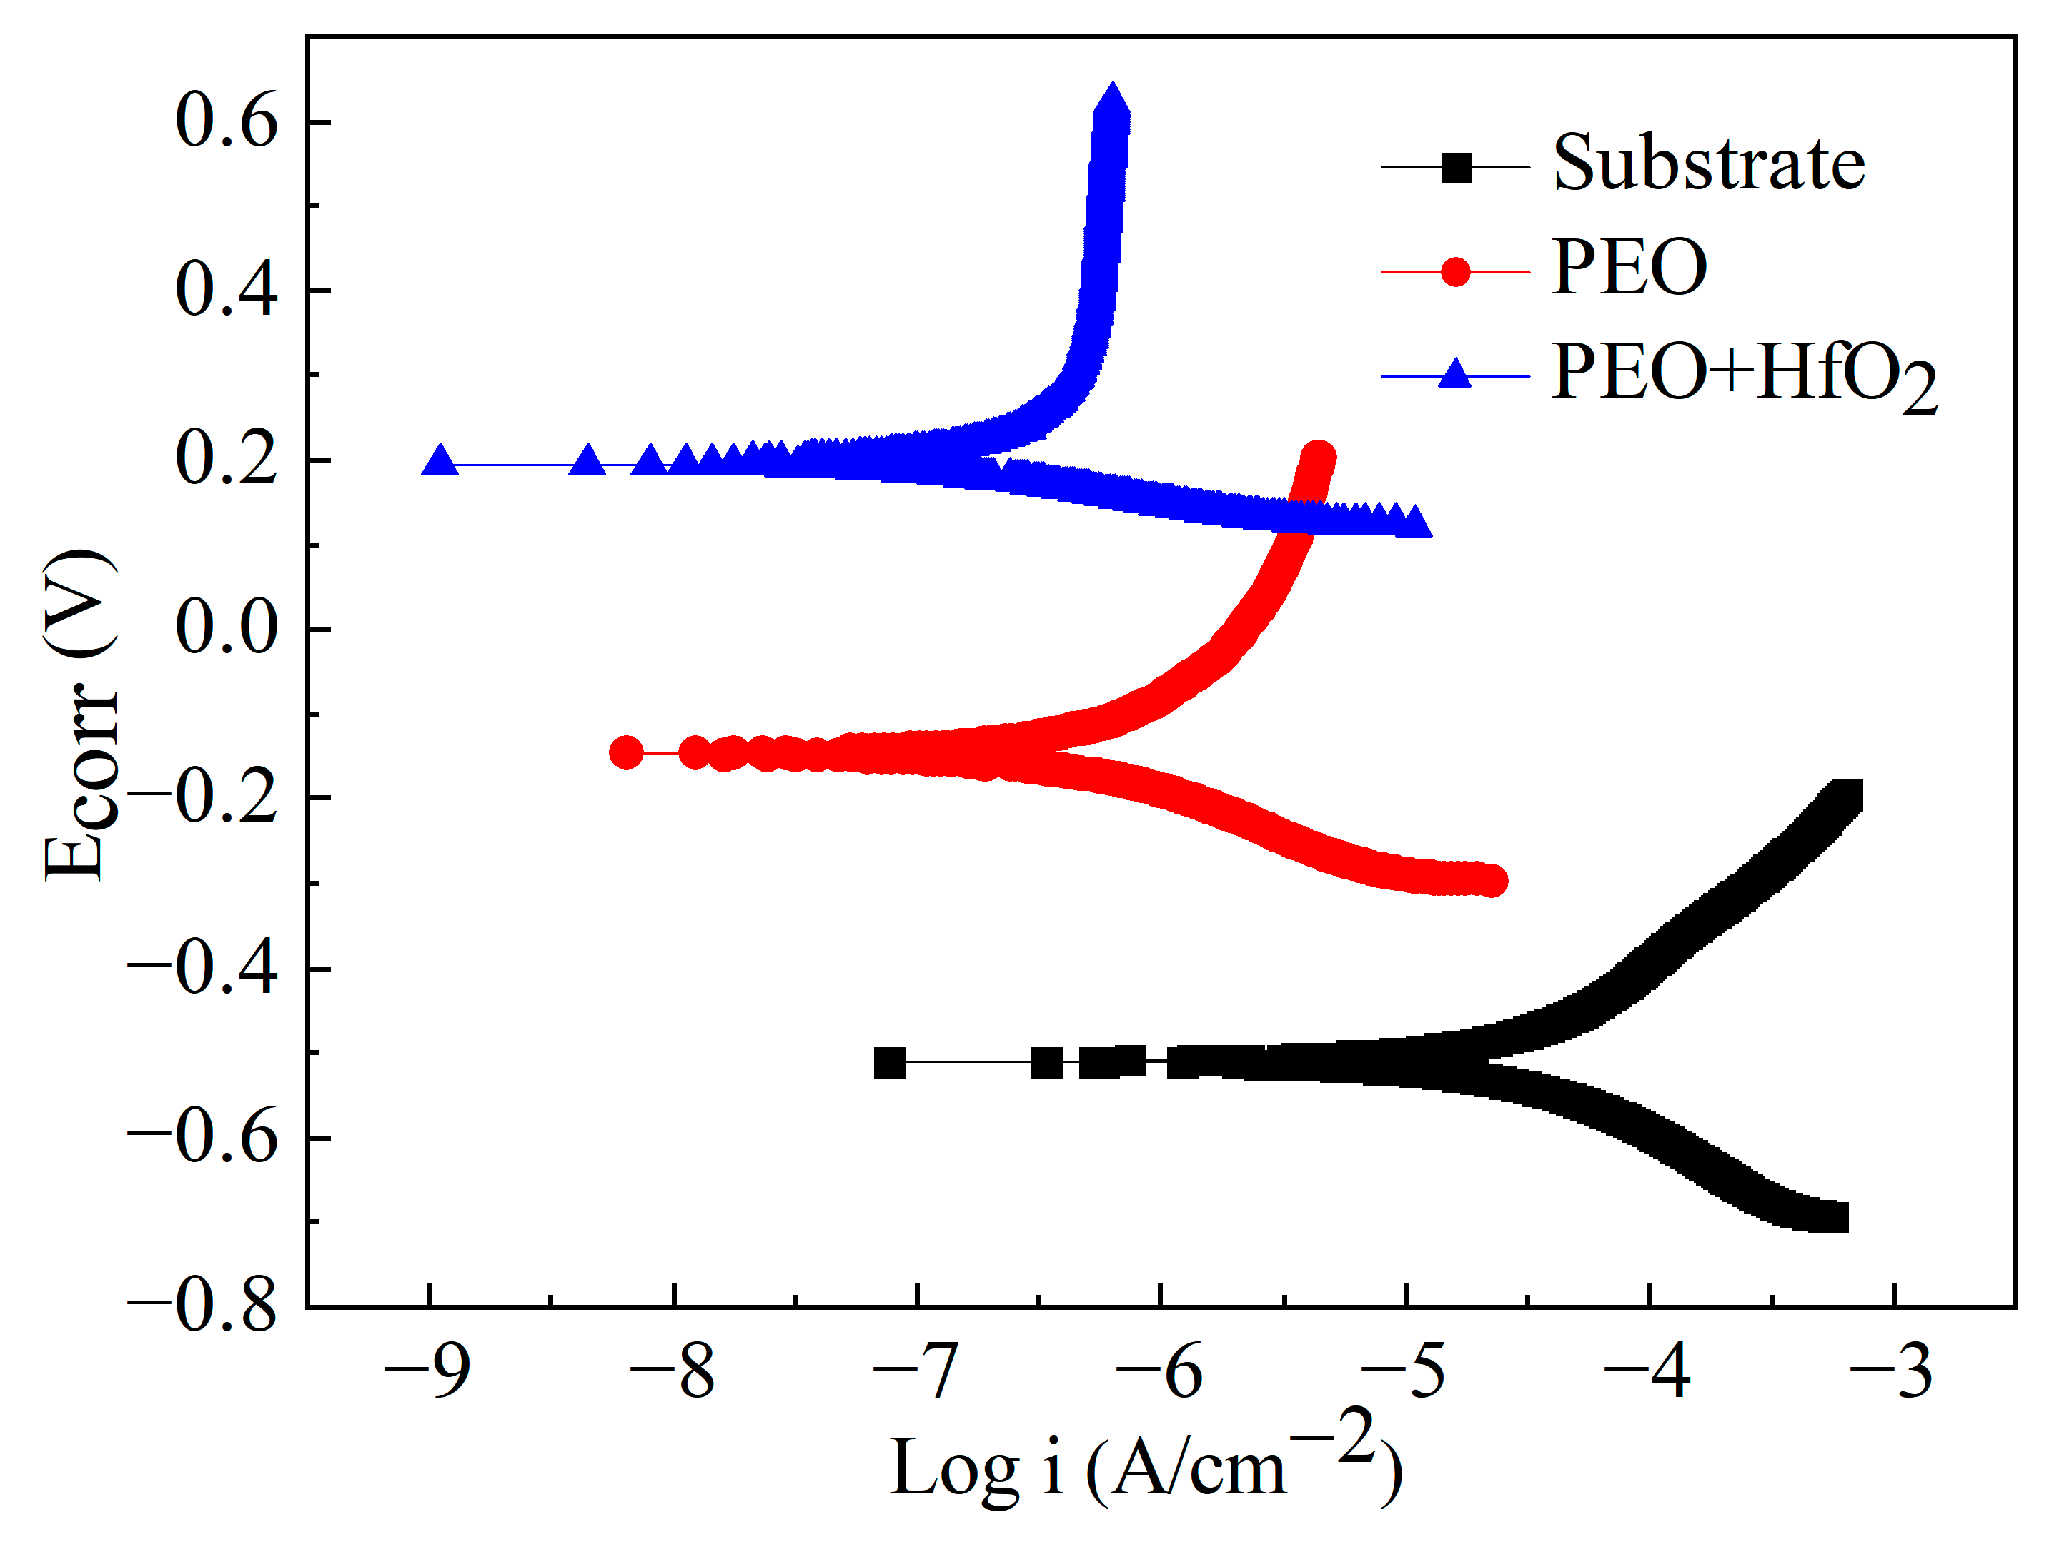
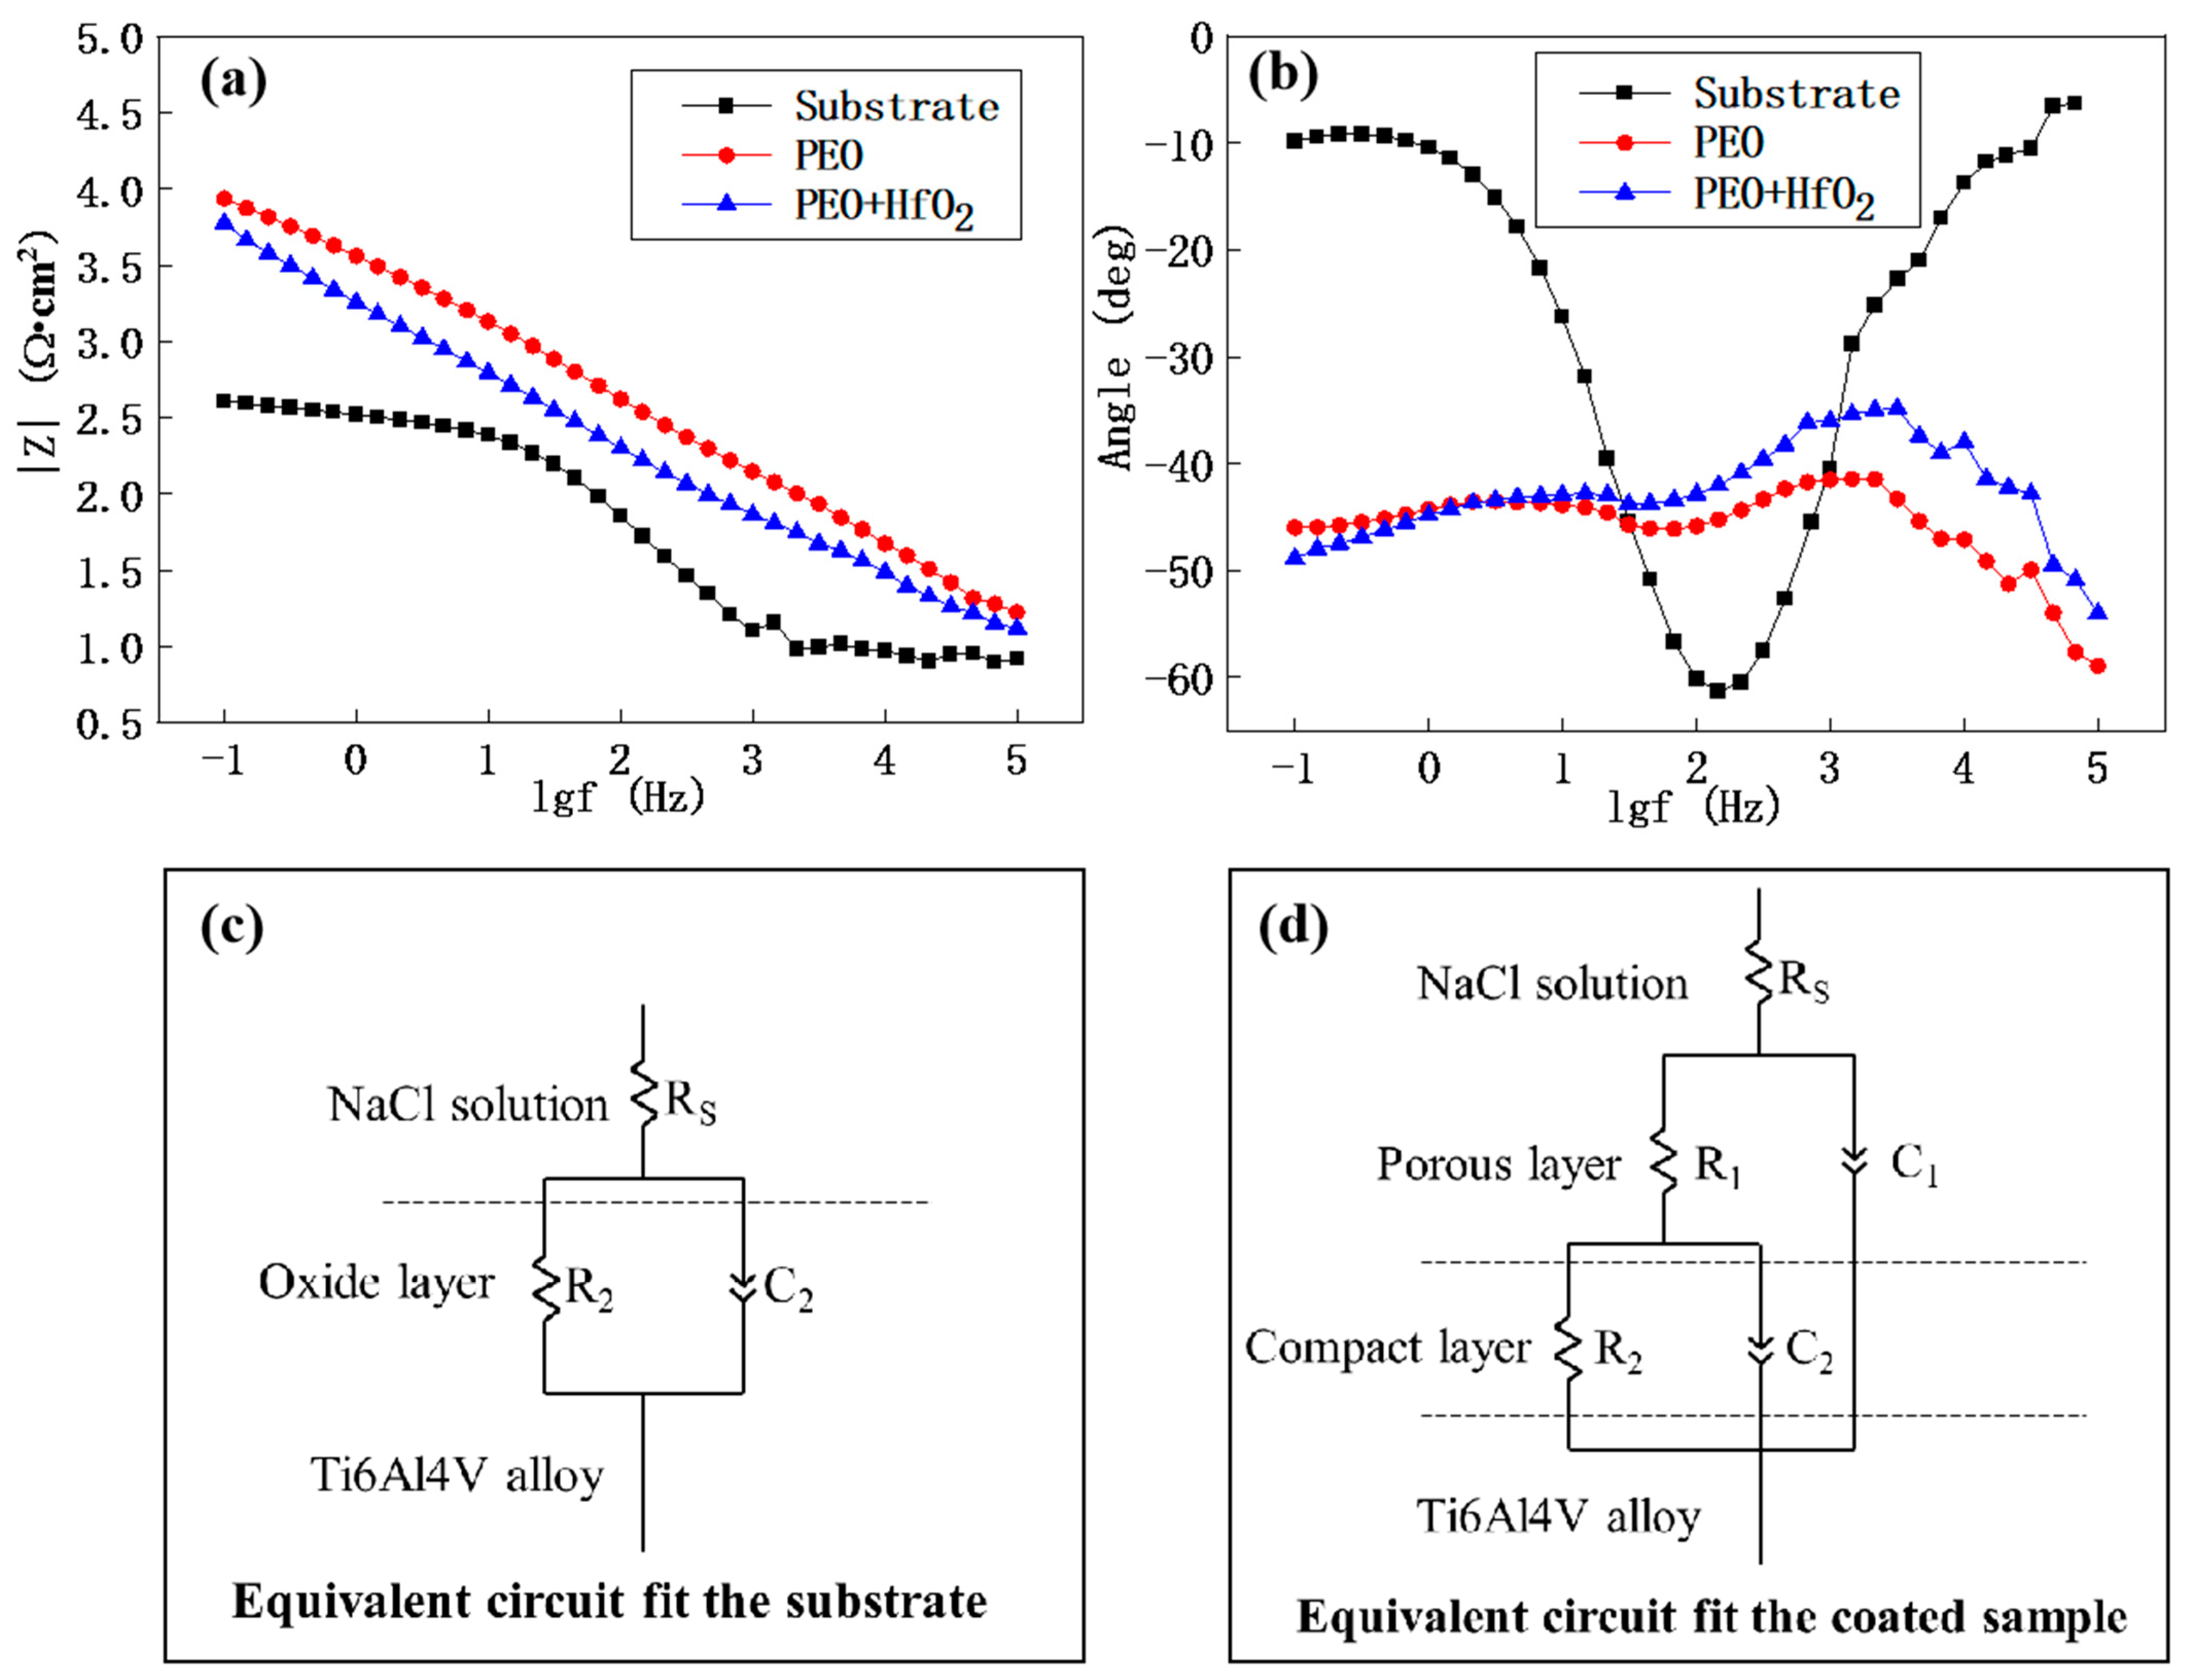
3.5. Corrosion Resistances of the Coatings

Figure 7 shows the polarization curve of the substrate and the two coated samples. The corrosion current density (Icorr) and rate (Vcorr) were obtained via Tafel fitting according to the Stern-Geary equation (Equation (7), where βa is the anodic Tafel slope and βc is the cathodic slope), and Faraday’s Law (Equation (8), where N is the equivalent weight and ρ is the density), respectively [7,27]. The results of the Tafel-fitted polarization curves are listed in Table 2. In general, the low Ecorr and/or high Icorr led to a bad corrosion resistance [27,28]. Compared with the coated samples, the substrate’s Ecorr value was the lowest and Icorr value was the highest, which implied that the PEO technology can increase the corrosion resistance. Compared with the PEO-coated sample, the Ecorr value increased from −0.147 to 0.194 V, and the Icorr value of the sample treated with the doped HfO2 decreased from 1.210 × 10⁻⁶ to 2.420 × 10⁻⁷ A/cm2. Moreover, the corrosion rate of the PEO-coated sample was two orders higher than that of the sample with HfO2, which implied that the addition of HfO2 into the electrolytes was considerably beneficial at preventing the Ti6Al4V alloy from permeating Cl ions, which mainly comprise the corrosive medium in the following solution:
I c o r r = β a × β c β a + β c × 1 R p
V c o r r m i l · y e a r 1 = I c o r r A · c m 2 × N g × 393.7 m i l · c m 2 ρ g · c m 3 × 365 × 24 × 3600 m · y e a r 1 96500 C · m o l 1
EIS is widely used to evaluate the corrosion mechanism of coatings [28]. Figure 8 shows the EIS Bode plots of the substrate and the two coated samples. In these equivalent circuits, RS, R1, and R2 represent the solution, external layer, and internal layer resistance, respectively. C1 is the constant phase element of the external layer, and C2 refers to the constant phase element of the internal layer. The electrochemical parameters of the PEO coatings obtained by using EIS are shown in Table 3. From Table 2, the values of R1 and R2 of the sample with HfO2 were higher, which indicated that adding HfO2 can remarkably increase the corrosion resistance of the coating, and this was consistent with the results of the Tafel-fitted polarization curves. This result can be attributed to the formation of a relatively thick and less porous coating on the surface of the Ti6Al4V alloy substrate due to the addition of HfO2 starch into the electrolyte during PEO (Figure 2). Moreover, the presence of more SiO2 can further enhance the corrosion resistance because this compound has a higher chemical stability in chloride environments.
In general, the HfO2-doped PEO coating showed potential applications for the surface protection of the Ti6Al4V alloy. Researchers should focus on optimizing the PEO process, such as by adding different amounts of HfO2 particles and electrical parameters.

4. Conclusions

A PEO coating was prepared on a Ti6Al4V alloy via plasma electrolytic oxidation with and without HfO2 in the electrolyte, and the following conclusions may be drawn:
  • With the addition of HfO2, the breakdown voltage increased from 355 to 367 V, and the plateau voltage increased from 462 to 476 V. The higher oxidation voltage led to more severe discharge and accelerated the coating formation.
  • The HfO2 could be introduced into the PEO coating through remelting caused by the plasma discharge.
  • The HfO2-doped PEO coating had fewer discharge micropores with larger sizes. The HfO2 refined the grain and increased the microhardness of the coating because of the TiO2 and SiO2.
  • The HfO2 implanted into the PEO coating formed on the Ti6Al4V alloy could effectively increase its corrosion resistance.

Author Contributions

Conceptualization, M.S. and H.H.; methodology, M.S. and H.H.; software, M.J.; validation, M.S. and H.H.; formal analysis, M.S.; investigation, B.Y. and Y.L.; resources, M.S. and Y.L.; data curation, M.J.; writing—original draft preparation, M.S. and H.H.; writing—review and editing, H.H.; visualization, M.S.; supervision, P.W. and B.Y.; project administration, M.S.; funding acquisition, M.S. All authors have read and agreed to the published version of the manuscript.

Funding

This work was supported by the Research Foundation for Talented Scholars of Xihua University (No. Z211043 and No. Z212051). And The APC was funded by [No. Z212051].

Data Availability Statement

Not applicable.

Conflicts of Interest

The authors declare no conflict of interest.

References

  1. Boyer, R.R. An overview on the use of titanium in the aerospace industry. Mater. Sci. Eng. A 1996, 213, 103–114. [Google Scholar] [CrossRef]
  2. Diamanti, M.; Sebastiani, M.; Mangione, V.; Del Curto, B.; Pedeferri, M.; Bemporad, E.; Cigada, A.; Carassiti, F. Multi-step anodizing on Ti6Al4V components to improve tribomechanical performances. Surf. Coatings Technol. 2013, 227, 19–27. [Google Scholar] [CrossRef]
  3. Williams, J.C.; Starke, E.A., Jr. Progress in structural materials for aerospace systems. Acta Mater. 2003, 51, 5775. [Google Scholar] [CrossRef]
  4. Chen, L.; Jin, X.; Qu, Y.; Wei, K.; Zhang, Y.; Liao, B.; Xue, W. High temperature tribological behavior of microarc oxidation film on Ti-39Nb-6Zr alloy. Surf. Coatings Technol. 2018, 347, 29–37. [Google Scholar] [CrossRef]
  5. Critchlow, G.; Brewis, D. Review of surface pretreatments for titanium alloys. Int. J. Adhes. Adhes. 1995, 15, 161–172. [Google Scholar] [CrossRef]
  6. Wang, P.; Wu, T.; Hao, P.; Guo, X.Y. Effect of NaAlO2 concentrations on the properties of micro-arc oxidation coatings on pure titanium. Mater. Lett. 2016, 170, 171–174. [Google Scholar]
  7. Liu, S.; Chen, J.; Zhang, D.; Wang, Y.; He, Z.; Guo, P. Properties of Micro-Arc Oxidation Coatings on 5052 Al Alloy Sealed by SiO2 Nanoparticles. Coatings 2022, 12, 373. [Google Scholar] [CrossRef]
  8. Rodriguez, L.; Paris, J.; Denape, J.; Delbé, K. Micro-arcs oxidation layer formation on aluminium and coatings tribological properties—A Review. Coatings 2023, 13, 373. [Google Scholar] [CrossRef]
  9. Wang, P.; Gong, Z.Y.; Li, H.L.; Yang, Q.G.; Cao, W.J.; Hu, J.; Pu, J.; Guo, X.Y.; Xiang, D. Effect of CoSO4 on the characteristics of micro-arc oxidation coatings. Surf. Eng. 2020, 36, 216–224. [Google Scholar] [CrossRef]
  10. Bai, Y.; Park, I.S.; Lee, S.J.; Bae, T.S.; Duncan, W.; Swain, M.; Lee, M.H. One-step approach for hydroxyapatite-incorporated TiO2 coating on titanium via a combined technique of micro-arc oxidation and electrophoretic deposition. Appl. Surf. Sci. 2011, 257, 7010–7018. [Google Scholar] [CrossRef]
  11. Li, H.; Sun, Y.; Zhang, J. Effect of ZrO2 particle on the performance of micro-arc oxidation coatings on Ti6Al4V. Appl. Surf. Sci. 2015, 342, 183–190. [Google Scholar] [CrossRef]
  12. Guo, Q.; Xu, D.; Yang, W.; Guo, Y.; Yang, Z.; Li, J.; Gao, P. Synthesis, corrosion, and wear resistance of a black microarc oxidation coating on pure titanium. Surf. Coatings Technol. 2020, 386, 125454. [Google Scholar] [CrossRef]
  13. Yang, W.; Wu, S.; Xu, D.; Gao, W.; Yao, Y.; Guo, Q.; Chen, J. Preparation and performance of alumina ceramic coating doped with aluminum nitride by micro arc oxidation. Ceram. Int. 2020, 46, 17112–17116. [Google Scholar] [CrossRef]
  14. Chen, Q.; Jiang, Z.; Tang, S.; Dong, W.; Tong, Q.; Li, W. Influence of graphene particles on the micro-arc oxidation behaviors of 6063 aluminum alloy and the coating properties. Appl. Surf. Sci. 2017, 423, 939–950. [Google Scholar] [CrossRef]
  15. Zheng, Z.; Zhao, M.-C.; Tan, L.; Zhao, Y.-C.; Xie, B.; Yin, D.; Yang, K.; Atrens, A. Corrosion behavior of a self-sealing coating containing CeO2 particles on pure Mg produced by micro-arc oxidation. Surf. Coatings Technol. 2020, 386, 125456. [Google Scholar] [CrossRef]
  16. Ma, X.; Jin, S.; Wu, R.; Zhang, S.; Hou, L.; Krit, B.; Betsofen, S.; Liu, B. Influence of combined B4C/C particles on the properties of microarc oxidation coatings on Mg-Li alloy. Surf. Coatings Technol. 2022, 438, 128399. [Google Scholar] [CrossRef]
  17. Liu, J.W.; Wang, P.; Tang, Y.T.; Xiong, D.; Sun, X.Y.; Hu, J.; Gong, Z.Y.; Yang, B.; Gong, Y.B.; Xiang, D. Effect of Bi2S3 on Characteristics of Micro-arc Oxidation Coating formed on TC4 Alloy. Int. J. Electrochem. Sci. 2021, 16, 150919. [Google Scholar] [CrossRef]
  18. Mueller, M.; Hilpert, K.; Singheiser, L. High temperature corrosion of MoSi2–HfO2 composites in coal slag. J. Phys. Chem. Solids 2005, 66, 509–512. [Google Scholar] [CrossRef]
  19. Badawy, W.A.; Al-Kharafi, F.M. The electrochemical behaviour of naturally passivated hafnium in aqueous solutions of different pH. J. Mater. Sci. 1999, 34, 2483–2491. [Google Scholar] [CrossRef]
  20. Daubert, J.S.; Hill, G.T.; Gotsch, H.N.; Gremaud, A.P.; Ovental, J.S.; Williams, P.S.; Oldham, C.J.; Parsons, G.N. Corrosion Protection of Copper Using Al2O3, TiO2, ZnO, HfO2, and ZrO2 Atomic Layer Deposition. ACS Appl. Mater. Interfaces 2017, 9, 4192–4201. [Google Scholar] [CrossRef]
  21. Esplandiu, M.J.; Patrito, E.M.; Macagno, V.A. Characterization of hafnium anodic oxide films: An AC impedance investigation. Electrochim. Acta 1995, 40, 809–815. [Google Scholar] [CrossRef]
  22. Xiong, D.; Wang, P.; Shen, X.W.; Liu, J.W.; Yang, B.; Gong, Y.B.; Gong, Z.Y.; Hu, J.; Xiang, D. Addition of LuCl3 for Improving Micro-structure and Corrosion Resistance of Micro-arc Oxidation Coating Formed on 6061. Int. J. Electrochem. Sci. 2021, 16, 210460. [Google Scholar] [CrossRef]
  23. Huang, H.; Qiu, J.; Sun, M.; Liu, W.; Wei, X. Morphological evolution and burning behavior of oxide coating fabricated on aluminum immersed in etidronic acid at high current density. Surf. Coatings Technol. 2019, 374, 83–94. [Google Scholar] [CrossRef]
  24. Huang, H.; Wei, X.; Yang, J.; Wang, J. Influence of surface micro grooving pretreatment on MAO process of aluminum alloy. Appl. Surf. Sci. 2016, 389, 1175–1181. [Google Scholar] [CrossRef]
  25. Li, M.; Jin, Z.-X.; Zhang, W.; Bai, Y.-H.; Cao, Y.-Q.; Li, W.-M.; Wu, D.; Li, A.-D. Comparison of chemical stability and corrosion resistance of group IV metal oxide films formed by thermal and plasma-enhanced atomic layer deposition. Sci. Rep. 2019, 9, 10438. [Google Scholar] [CrossRef]
  26. Murr, L.; Inal, O. Crystal defects in coatings and their influence on coating properties. Thin Solid Films 1979, 64, 77–90. [Google Scholar] [CrossRef]
  27. Mareci, D.; Chelariu, R.; Iacoban, S.; Munteanu, C.; Bolat, G.; Sutiman, D. The Estimation of Localized Corrosion Behavior of Ni-Based Dental Alloys Using Electrochemical Techniques. J. Mater. Eng. Perform. 2011, 21, 1431–1439. [Google Scholar] [CrossRef]
  28. Mareci, D.; Bolat, G.; Istrate, B.; Munteanu, C.; Cailean, A. Effect of thermal oxidation on electrochemical corrosion behaviour of ZrTi alloys for dental applications. Mater. Corros. 2015, 66, 1529–1535. [Google Scholar] [CrossRef]
Figure 1. Voltage–time response curves of PEO and PEO + HfO2 coating.
Coatings 13 00967 g001
Figure 2. Surface morphology and elements distribution of the (a) PEO and (b) PEO + HfO2 coatings.
Coatings 13 00967 g002
Figure 3. Cross-sectional morphology and elements distribution of the (a) PEO and (b) PEO + HfO2 coating.
Coatings 13 00967 g003
Figure 4. XRD spectra of the PEO and PEO + HfO2 coatings.
Coatings 13 00967 g004
Figure 5. XPS spectrum of the PEO + HfO2 coating.
Coatings 13 00967 g005
Figure 6. The microhardness of the substrate and the two coated samples.
Coatings 13 00967 g006
Figure 7. Polarization curves of the substrate and the two coated samples.
Coatings 13 00967 g007
Figure 8. EIS Bode plots and equivalent circuits of the substrate and the two coated samples: (a) impedance modulus; (b) phase angle; (c,d) equivalent circuits.
Coatings 13 00967 g008
Table 1. The contents of O, Si, Ti, and Hf of the PEO and PEO + HfO2 coatings.
Element (wt/%)OSiTiHf
PEO49.416.733.9——
PEO + HfO241.628.619.610.2
Table 2. Results of polarization curve analysis of different samples.
SampleEcoor (V)Icoor (A/cm2)Corrosion Rate (mpy)
Substrate−0.5104.40 × 10−520.10
PEO−0.1471.210 × 10−61.756 × 10⁻¹
PEO + HfO20.1942.420 × 10−71.148 × 10⁻³
Table 3. Electrochemical parameters of the substrate and the two coated samples.
SampleRS
(Ω·cm2)
C1
−1·cm−2 Sn)
n1R1
(Ω·cm2)
C2
−1·cm−2 Sn)
n2R2
(Ω·cm2)
Substrate9.632.146 × 10−50.8276313.5
PEO20.54.134 × 10−61302.29.454 × 10−60.47396468
PEO + HfO241.694.145 × 10−60.44984426.13 × 10−50.779313,730
Disclaimer/Publisher’s Note: The statements, opinions and data contained in all publications are solely those of the individual author(s) and contributor(s) and not of MDPI and/or the editor(s). MDPI and/or the editor(s) disclaim responsibility for any injury to people or property resulting from any ideas, methods, instructions or products referred to in the content.

