Article

Mechanical Characterization of Asphalt Mixtures Based on Polymeric Resin and Thixotropic Filler as a Substitute for Bitumen

Johannes Kepler University Linz, Institute of Polymer Product Engineering, Altenbergerstrasse 69, 4040 Linz, Austria
*
Author to whom correspondence should be addressed.
Coatings 2023, 13(5), 932; https://doi.org/10.3390/coatings13050932
Submission received: 31 March 2023 / Revised: 27 April 2023 / Accepted: 10 May 2023 / Published: 16 May 2023
(This article belongs to the Special Issue Asphalt Pavement: Materials, Design and Characterization)

Abstract

:
Transportation infrastructure relies heavily on asphalt pavement, but conventional bitumen-based mixtures present several drawbacks. This study assesses the potential of poly(methyl methacrylate) resins and thixotropic fillers as substitutes for bitumen to improve pavement performance. The research concentrates on enhancing current formulations that incorporate a thermosetting polymer and mineral (stiffening) fillers, with the objective of increasing durability, extending the product life cycle, and optimizing raw material usage. Utilizing dynamic thermomechanical analyses, the viscoelastic characteristics of resins are examined, with a focus on their mechanical properties’ dependence on load frequency and temperature. The investigation also evaluates the impact of different fillers, including silica sand, silica dust, and basalt sand, on viscoelastic behavior and load-bearing capacity, offering valuable insights into the relationships between material structure and properties. The findings reveal that stiffness is predominantly affected by the quantity of silica dust, whereas the force plateau depends on the amount of sand. This study contributes crucial information for the development of more sustainable and robust pavement materials for future applications.

1. Introduction

Asphalt pavement serves as a vital element of transportation infrastructure by providing a smooth and secure driving surface for countless vehicles every day. However, traditional asphalt mixtures based on bitumen present several limitations, such as susceptibility to deformation and cracking [1,2], a high environmental footprint [3,4,5], and a relatively short lifespan. To overcome these challenges, researchers are investigating alternative materials to replace bitumen in asphalt pavement, with polymeric resins and thixotropic fillers emerging as promising solutions [1].
Polymeric resins, such as styrene-butadiene-styrene (SBS) and ethylene vinyl acetate (EVA), have been shown to improve the durability and resistance to deformation and cracking of asphalt mixtures [6,7,8], while also reducing their environmental impact [3,4,5]. Thixotropic fillers can improve the rheological properties of the asphalt mixture, reducing the occurrence of separation and flow [9,10].
However, the use of polymeric resins and thixotropic fillers for asphalt pavement necessitates a comprehensive understanding of their properties and behaviors in pavement design and construction [11,12]. Surface pavement in roadways and industrial flooring constructions must meet stringent quality requirements, demanding diverse and sometimes conflicting properties across a wide range of temperatures, humidity, and loads [2]. Ideally, pavement should be elastic, firm, and permeable to water and air while exhibiting minimal creep behavior to prevent permanent deformation, such as grooves and ruts [1]. Resin-based pavements provide an excellent foundation for adjusting properties based on specific requirements. For instance, static friction properties can be tailored to enhance slip resistance in industrial settings. Reinforcing agents and other additives are employed to modify the pavement’s elastic and thermoelastic properties, ensuring it meets the necessary performance criteria across various applications [11].
In this research, existing formulations based on thermosetting polymers with mineral stiffening fillers are to be improved according to their robustness. In this way, the product lifetime can be increased, and thus the efficiency of the raw materials used can be improved. The polymer product development tasks lie in the characterization and description of the viscoelastic properties of the resins [13,14,15,16]. In particular, load-frequency and temperature-dependent mechanical properties are investigated in dynamic thermomechanical analyses [13]. This characterization method is generally recommended for non-standard asphalt materials [17]. Compressive loads are applied and compared with existing formulations in a benchmarking analysis. Constitutive laws governing property changes are to be derived and used for the development of new formulations. The influence of additives (cf. [15]) on the adaptation of material properties is of particular interest in designing formulations that are more sustainable for future surface pavement in road construction. This is particularly important for numerical pavement analyses, which rely on the correct assumptions of the material’s behavior [18,19]. The inherent viscoelastic response of the pavement material must be considered in addition to the elastic mechanical behavior. Otherwise, the predicted critical strains are not valid, and, hence, the evaluation is uncertain, especially for long-term behavior. Several research studies have been conducted to investigate the viscoelasticity of asphalt mixtures, and guidelines such as the AASHTO, MEPDG, or ASTM specifications define the dynamic mechanical complex modulus tests at selected temperatures and loading frequencies [20]. It is important to point out that the viscoelasticity characterization is not only relevant in the processing but is crucial for the long-term behavior of the cured solid asphalt mixture [21,22,23,24]. Moreover, dynamic mechanical analyses must ideally be performed under tensile, compressive, and shear loading.
Various simulation software (e.g., Viscoroute [19]) offer the capability to capture the viscoelasticity of pavement materials with phenomenological models. They all require the time–temperature-dependent dynamic mechanical material properties (storage modulus E′, loss modulus E″, and loss factor tanδ) as input parameters. In addition, it is beneficial to examine the load-carrying capacity of the material under compressive loading to gain insight into the mechanical behavior up to (steady) material flow and ultimate failure.
The objective of this study is to determine the viscoelastic behavior of bitumen-free pavement materials at application-relevant temperatures. With monotonic compression loading, the load-carrying capacity of the various material formulations is determined. The emphasis is given on gaining insight into the solid mechanical characteristics and their relationship to mineral fillers, rather than the processing of these types of formulations. All materials are formulated to be processable by manual mixing and casting. The influence of three different fillers (i.e., silica sand, silica dust, and basalt sand) on the viscoelastic as well as load-carrying capacity is analyzed, and insights on the structure–property relationship are gained.

2. Materials and Methods

2.1. Materials

In this study, eight material formulations were selected to investigate the influence of three different mineral fillers on the viscoelastic behavior of a bitumen-free asphalt mixture in its solid state (cured) under application-relevant loadings. The processing of polymer-based bitumen-free asphalt mixtures is also a field of active research, and findings are found in the literature [3,4,5,7,9,10,22,23,24]. A poly(methyl methacrylate) (PMMA)-based resin was used instead of bitumen, mixed with a thixotropy agent (hydrophilic fumed silica with a specific surface area of 200 m²/g), a binder, a catalysator, and a color pigment to improve processability. The investigated mineral fillers are silica dust (SD), silica sand (SS), and basalt sand (BS). To enhance the adaptability of the material properties, two different types of sand were used with different stiffnesses (the elastic modulus of SS is approximately 80% of the modulus of BS). The total amount of mineral filler in each formulation was 80 wt%, and in a preliminary study with the material supplier (RoadPlast Mohr GmbH (Vorarlberg, Austria)), the minimum amount of BS was determined to achieve the practical viscosity for casting along with manual processability on-site prior to paving. It was found that 50 wt% BS is the minimum needed filler amount, and 60 wt% BS reveals the best viscosity for manual processing. According to this application window, the formulations were selected for this research work to derive the structure–property relationship of mineral fillers with different properties mixed in PMMA resin. For each filler, a minimum and a maximum level were set. In between these levels, two additional levels of filler content were defined for better interpretation of the experimental findings.
The exact material formulations and their acronyms are listed in Table 1. Formulation 0 (F0) is the polymer with all the processing agents mentioned above, but without mineral fillers. The bulk density of each filler and processing agent is given in Table 2.

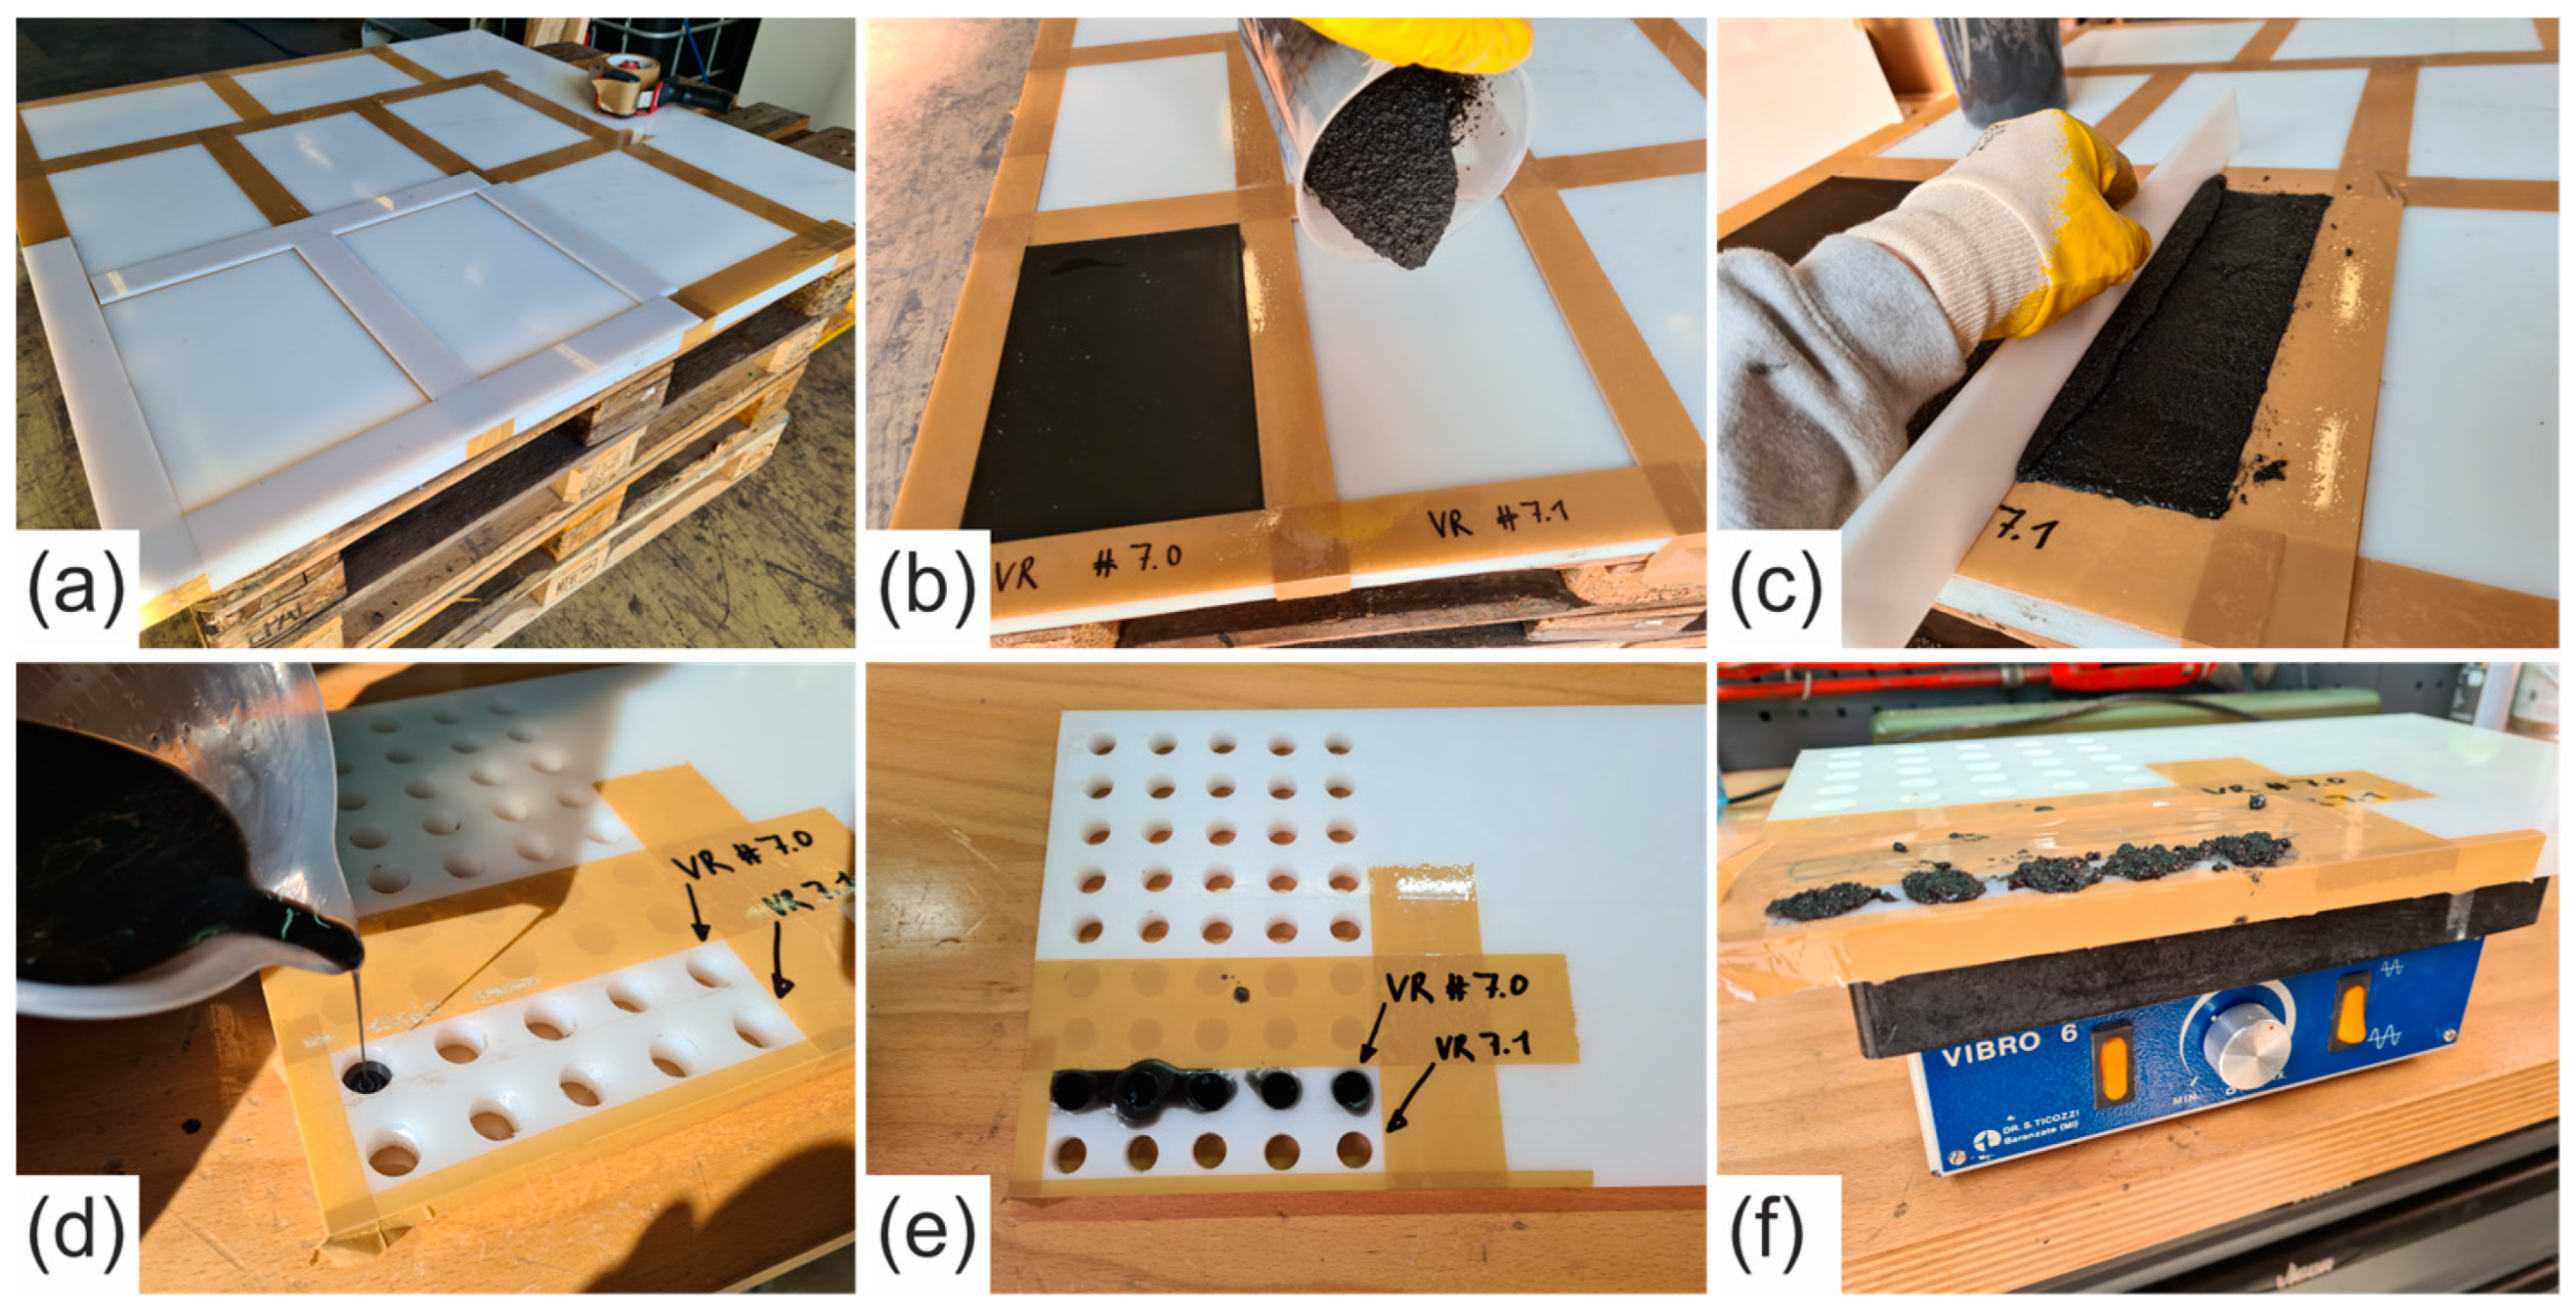
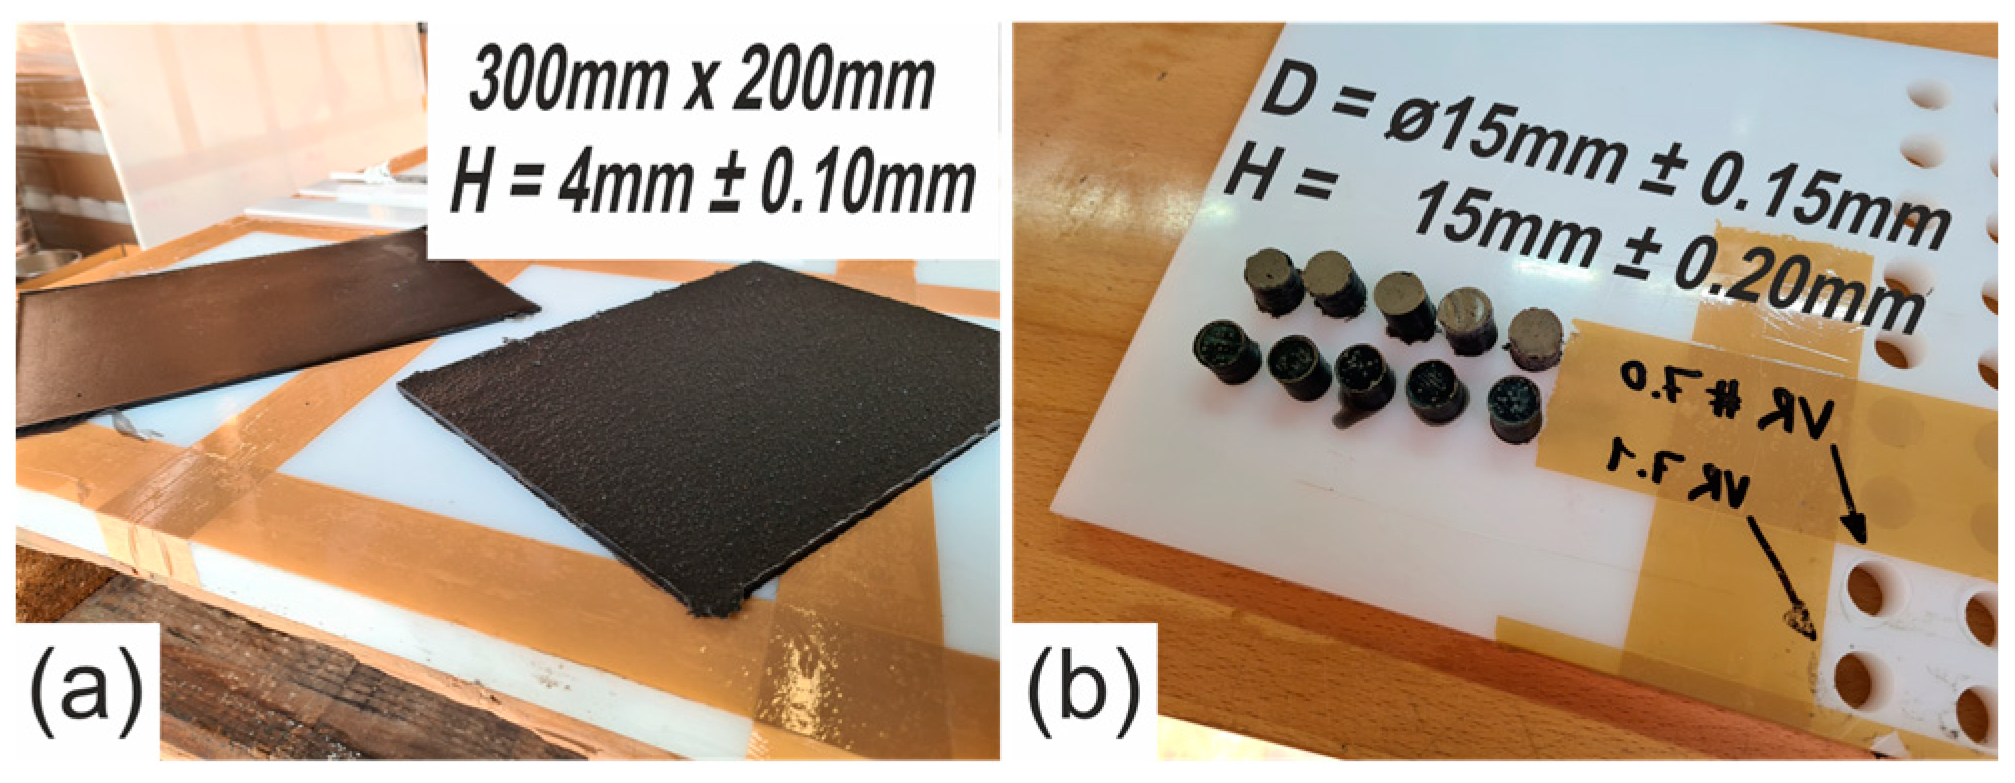
2.2. Specimen Production

The material formulations were prepared and provided by the company RoadPlast Mohr GmbH (Vorarlberg, Austria). Figure 1a–c shows the casting process of rectangular plates with a width of 200 mm, a height of 300 mm, and a thickness of 4 mm. The finished plates are shown in Figure 2a. These plates were used to cut out the specimens for dynamic thermomechanical analysis. In Figure 1d–f, the casting process of the compression specimens is shown. After molding, the mold was put on a vibration board (Figure 1f) to ensure ideal distribution and packing in the mold. The cured cylinders with dimensions of Ø15 mm × 15 mm are depicted in Figure 2b.

2.3. Methods

For the viscoelastic characterization, dynamic thermomechanical analyses (DTMA) were performed to examine the temperature- and frequency-dependent storage modulus E′, loss modulus E″, and loss factor tanδ = E″/E′. Moreover, the thermorheological behavior was examined in a Wicket plot (tanδ– vs. E′ plot) (cf. [23]). According to DIN 53513:1990-03, the moduli were retrieved by multiplying the measured specimen stiffness (dynamic force/dynamic displacement) with the shape factor (Lm2/(L0 A0)), where Lm is the mean length under static loading, L0 is the initial length, and A0 is the initial cross-section. The specimens had a rectangular cross-section with a width of 10 mm, a height of 35 mm, and a thickness of 4 mm.
DTMA was performed with the Eplexor 500 N (Netzsch-Gerätebau GmbH, Selb, Germany) under uniaxial loading from −30 °C up to +80 °C and with a frequency range from 5 Hz to 50 Hz in six logarithmic steps within the measured decade of frequency. The measurement started at the lowest temperature and was increased linearly in steps of 5 K. A sinusoidal loading with a mean force level of 40 N and a dynamic (peak-to-peak) amplitude of 5 N was applied. To compensate for thermal elongation, a holding force of 0.5 N was set, and the initial length was measured under isothermal conditions. To avoid stress-softening effects, pre-cycles were performed for 1 s under the same conditions as previously described.
The monotonic compression tests were performed with the hydraulic MTS 852 damper test system (MTS Systems Corporation, Eden Prairie, MN, USA) under isothermal conditions at room temperature. The measurement was displacement controlled with a loading rate of 1 mm/s, and the load was recorded with a 10 kN load cell (661.19F-02 Force Tranducer-10 kN, MTS System Corporation, Eden Prairie, MN, USA). The specimens were cast cylinders (Ø15 mm × 15 mm). The compression was performed either until a load of 9 kN or a displacement of 12 mm was reached, which is considered the ultimate failure. The measurement was repeated five times for each material formulation, and the calculated means and standard deviations are presented in Section 3.

3. Results

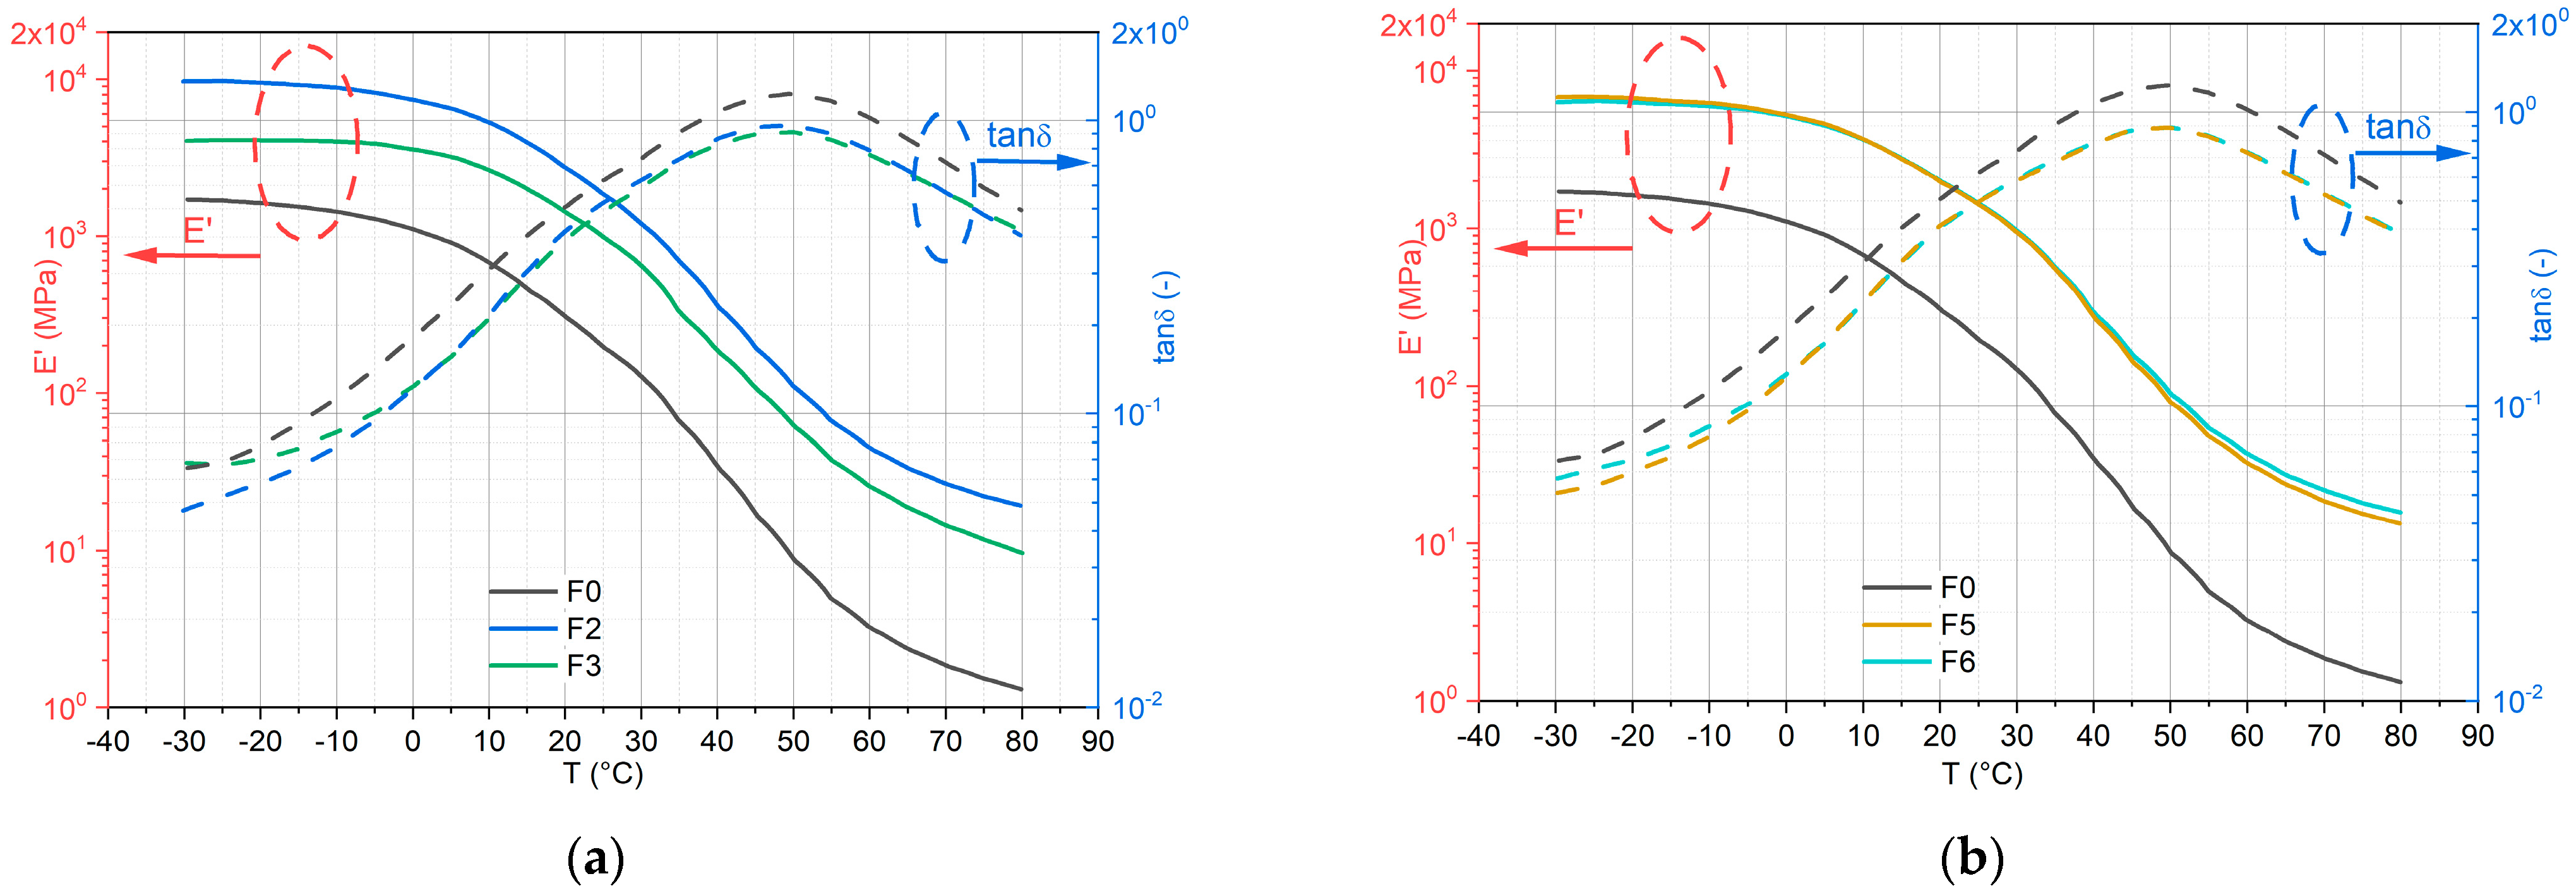
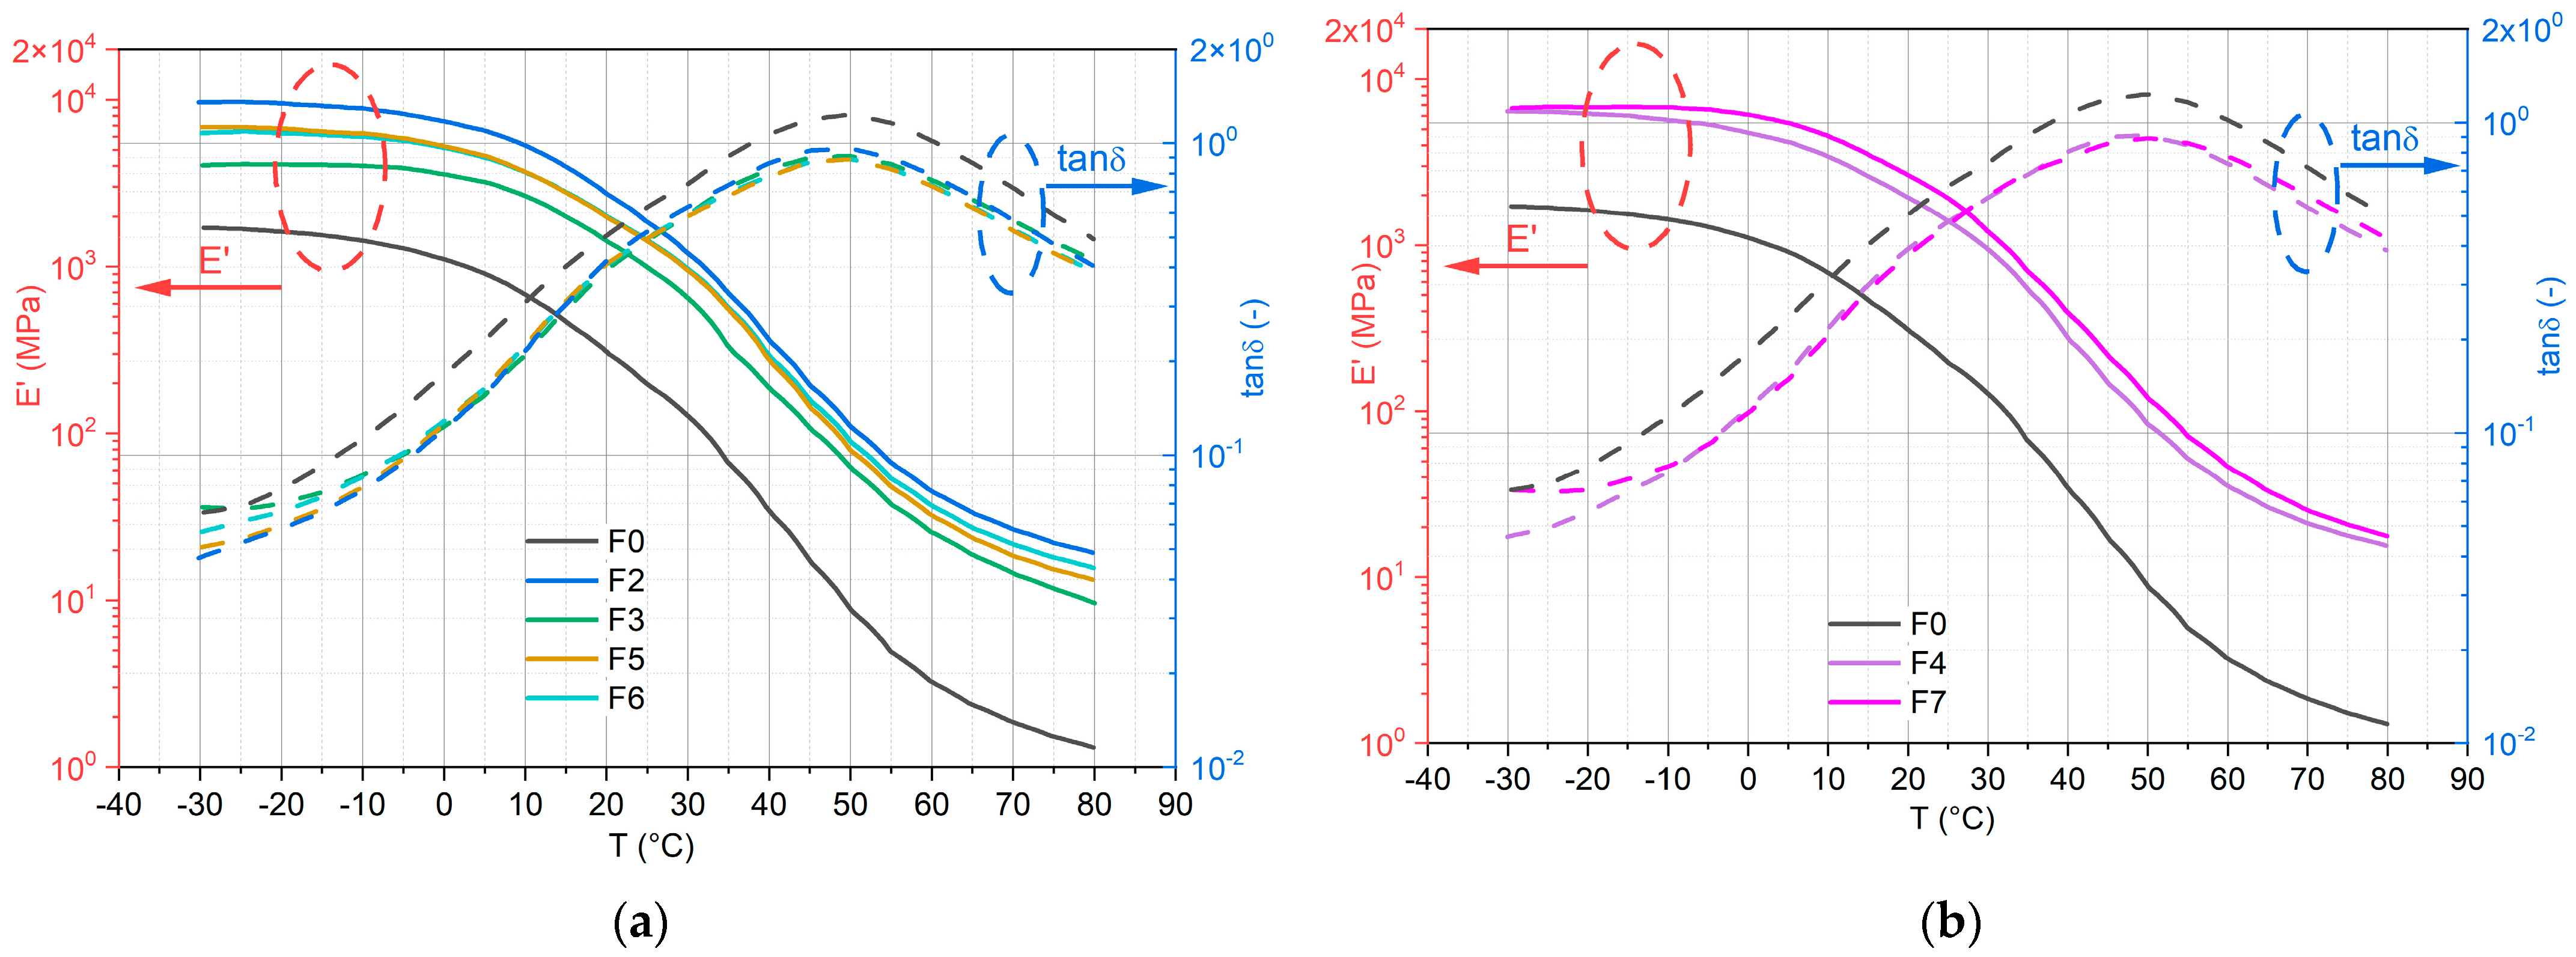
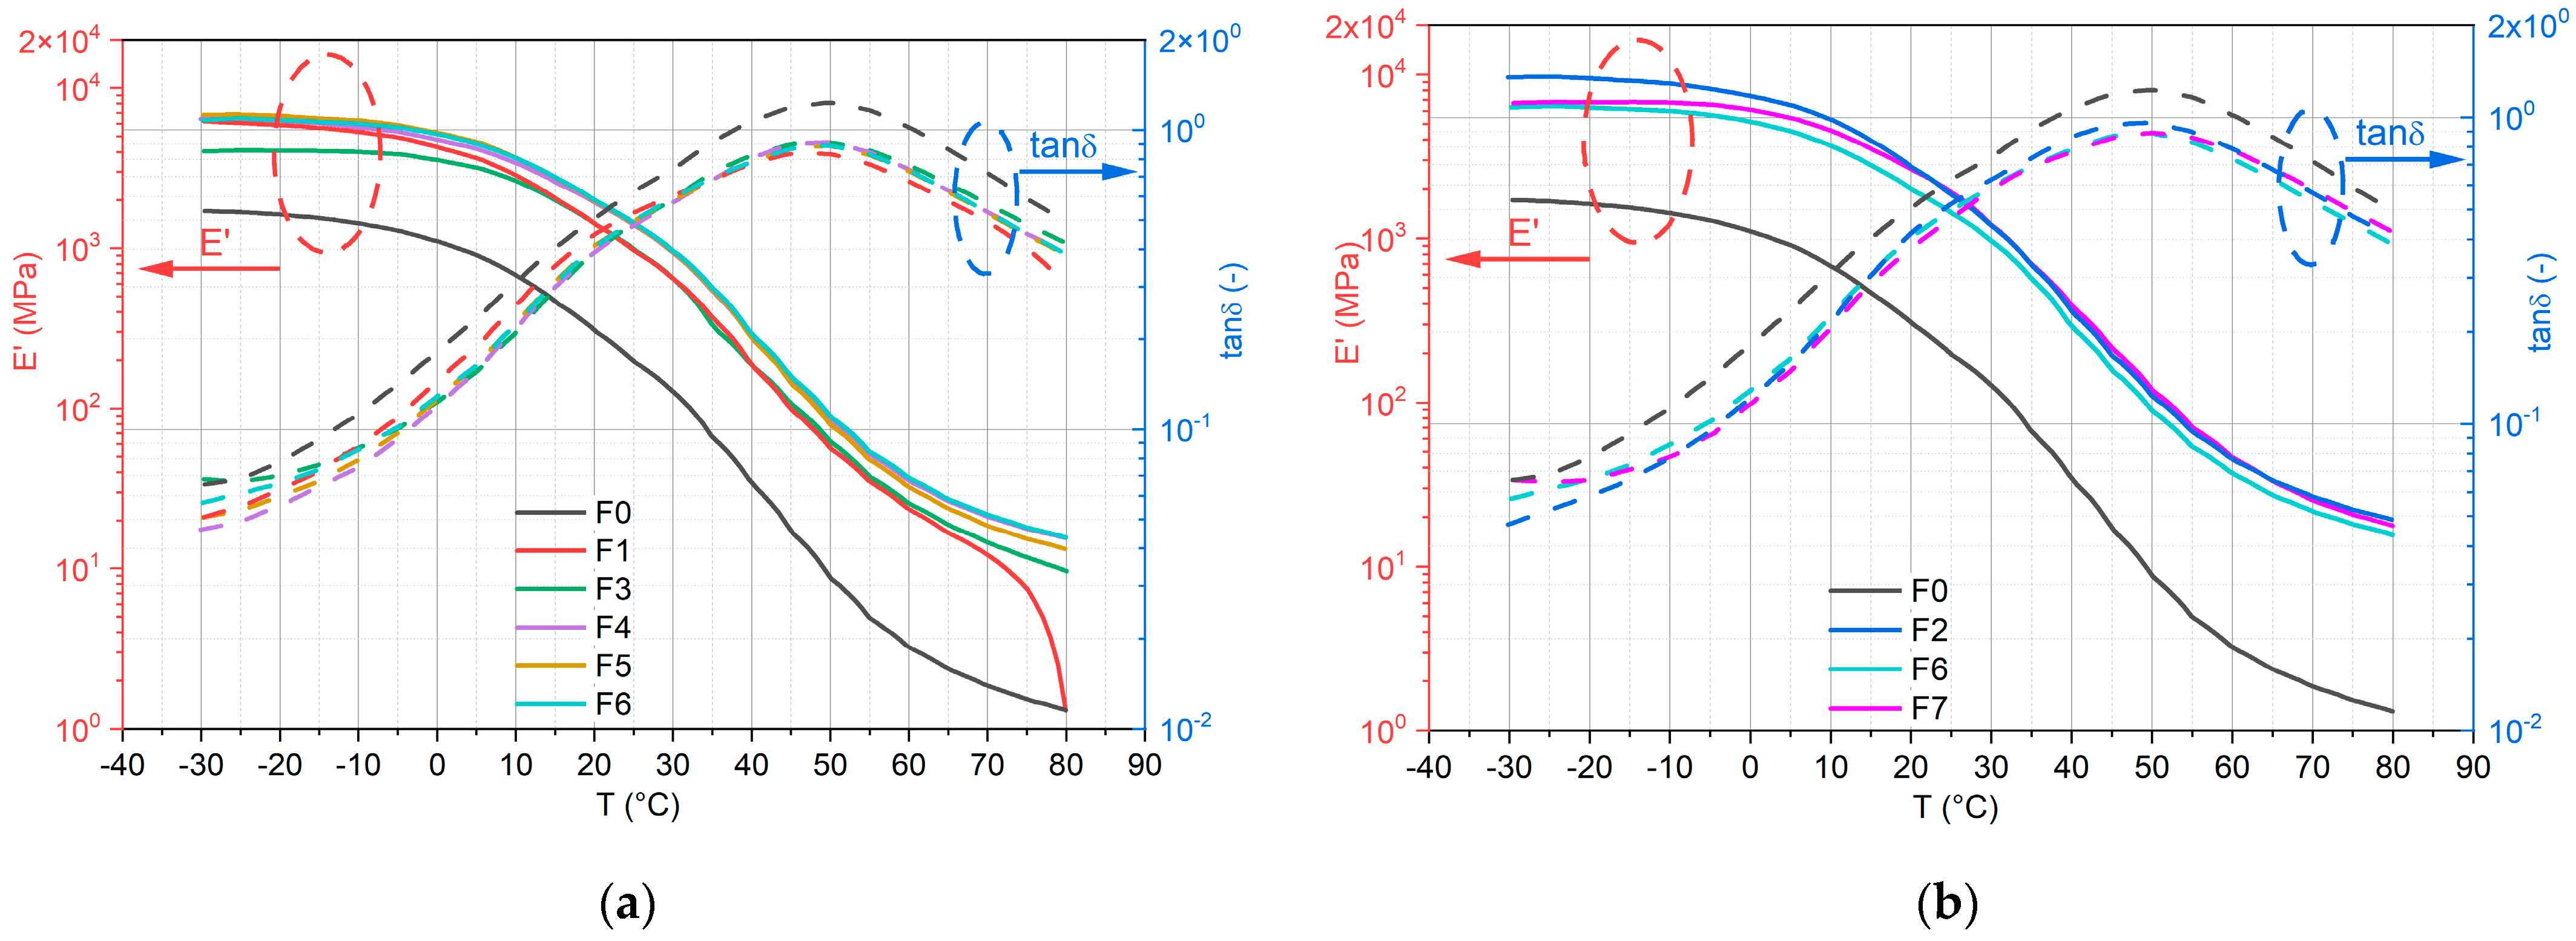
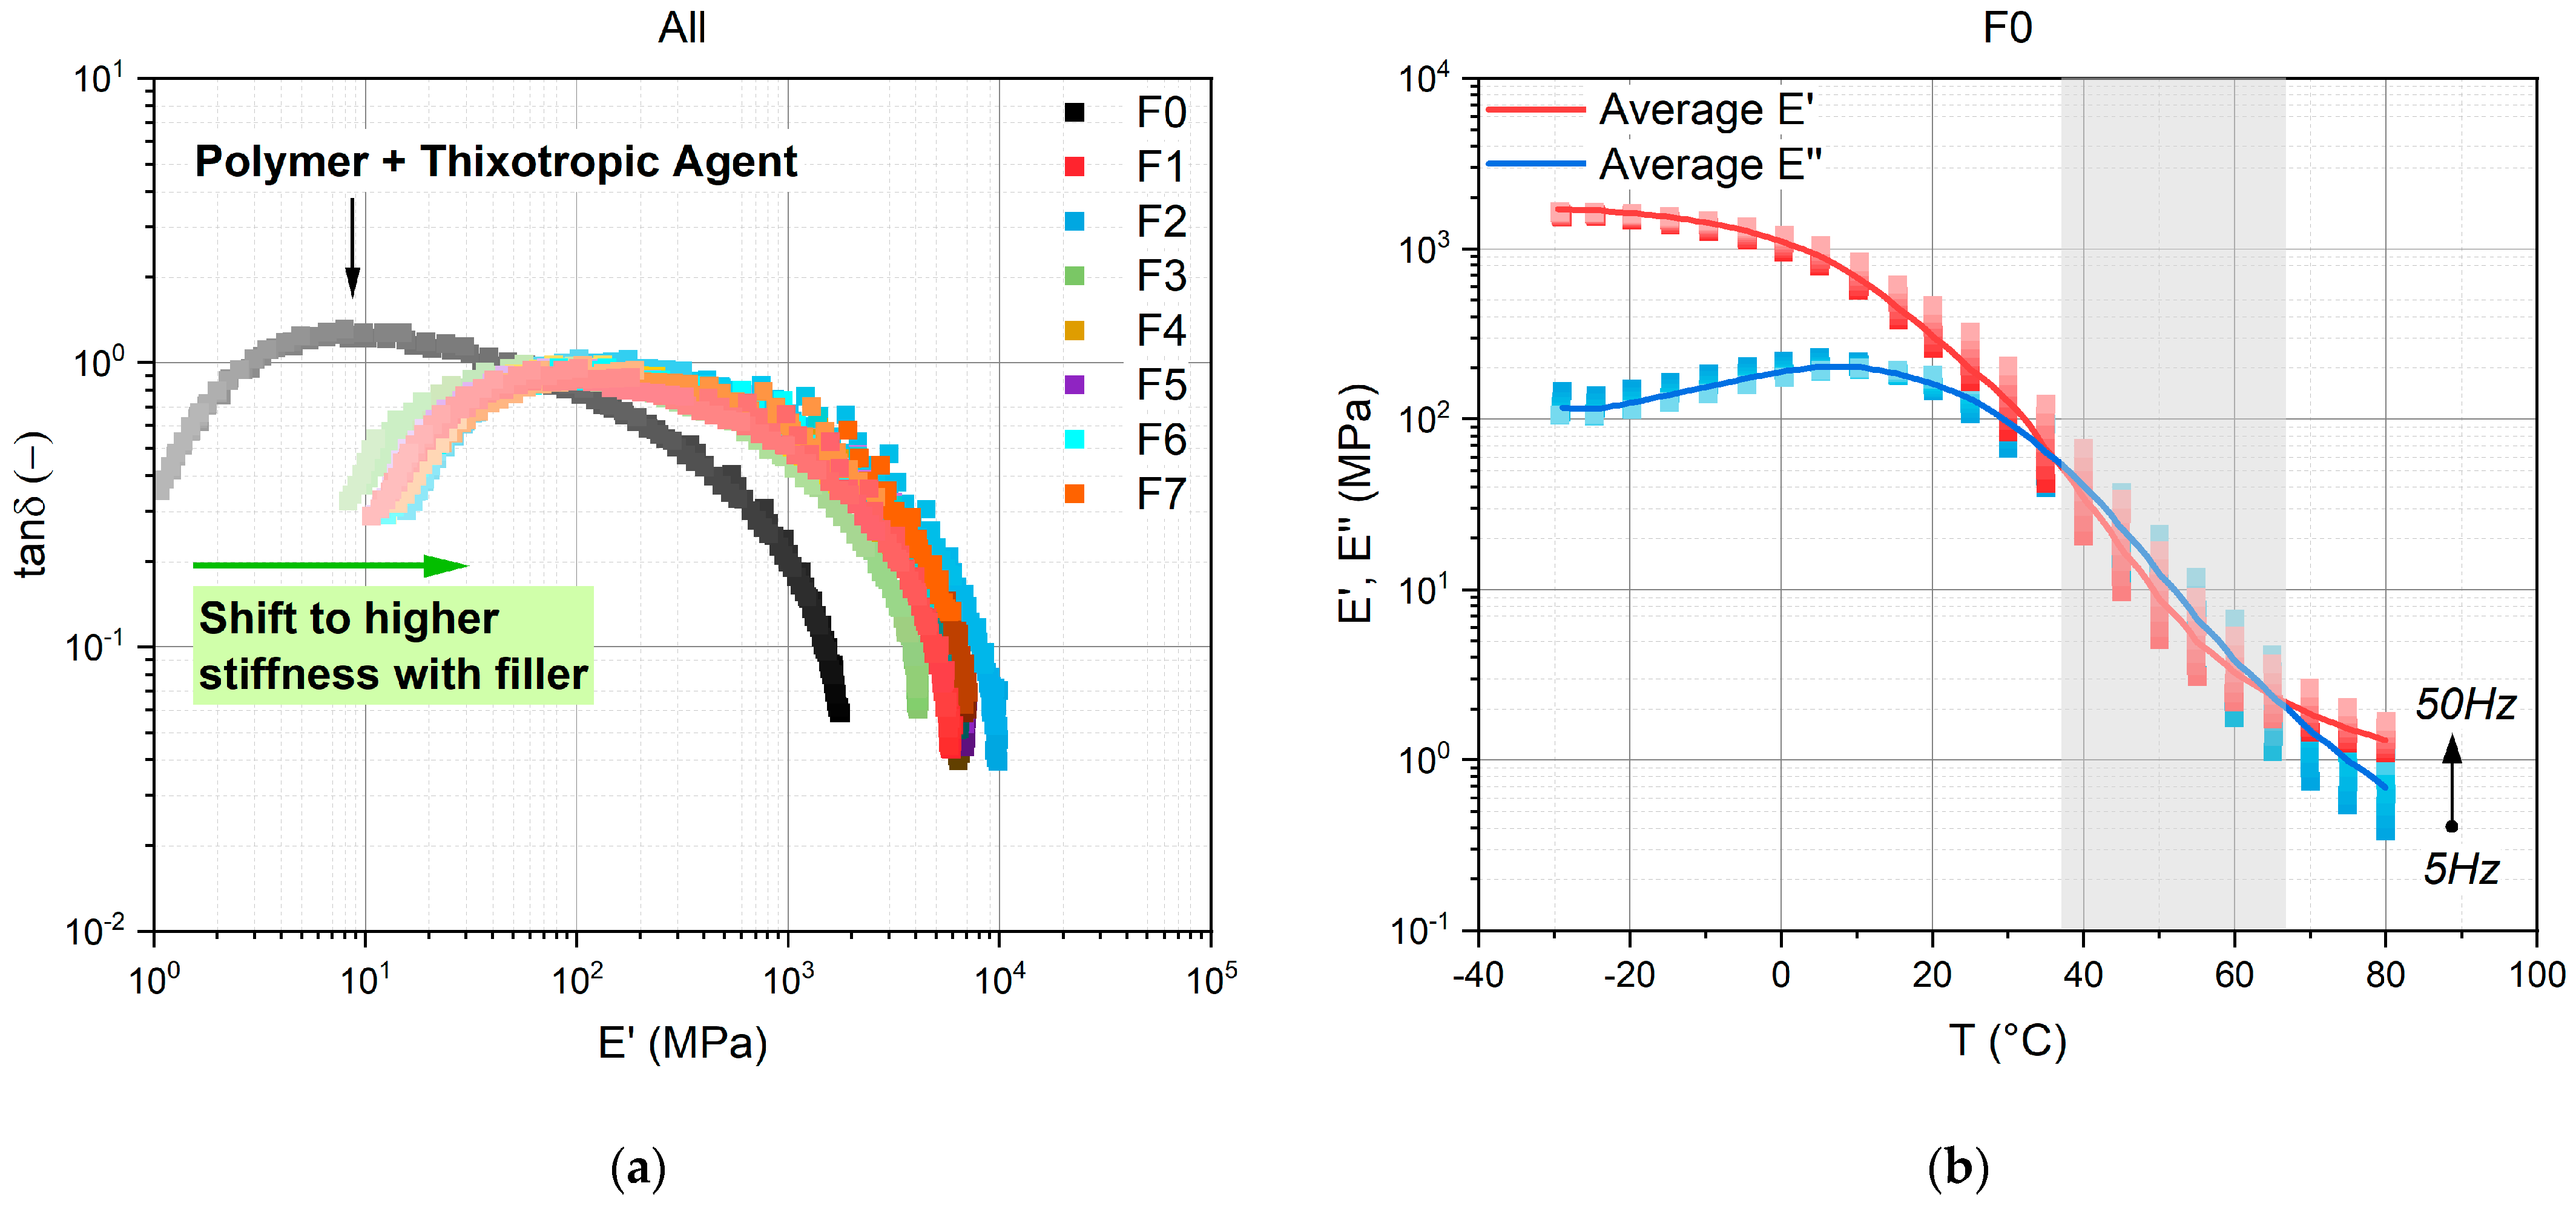
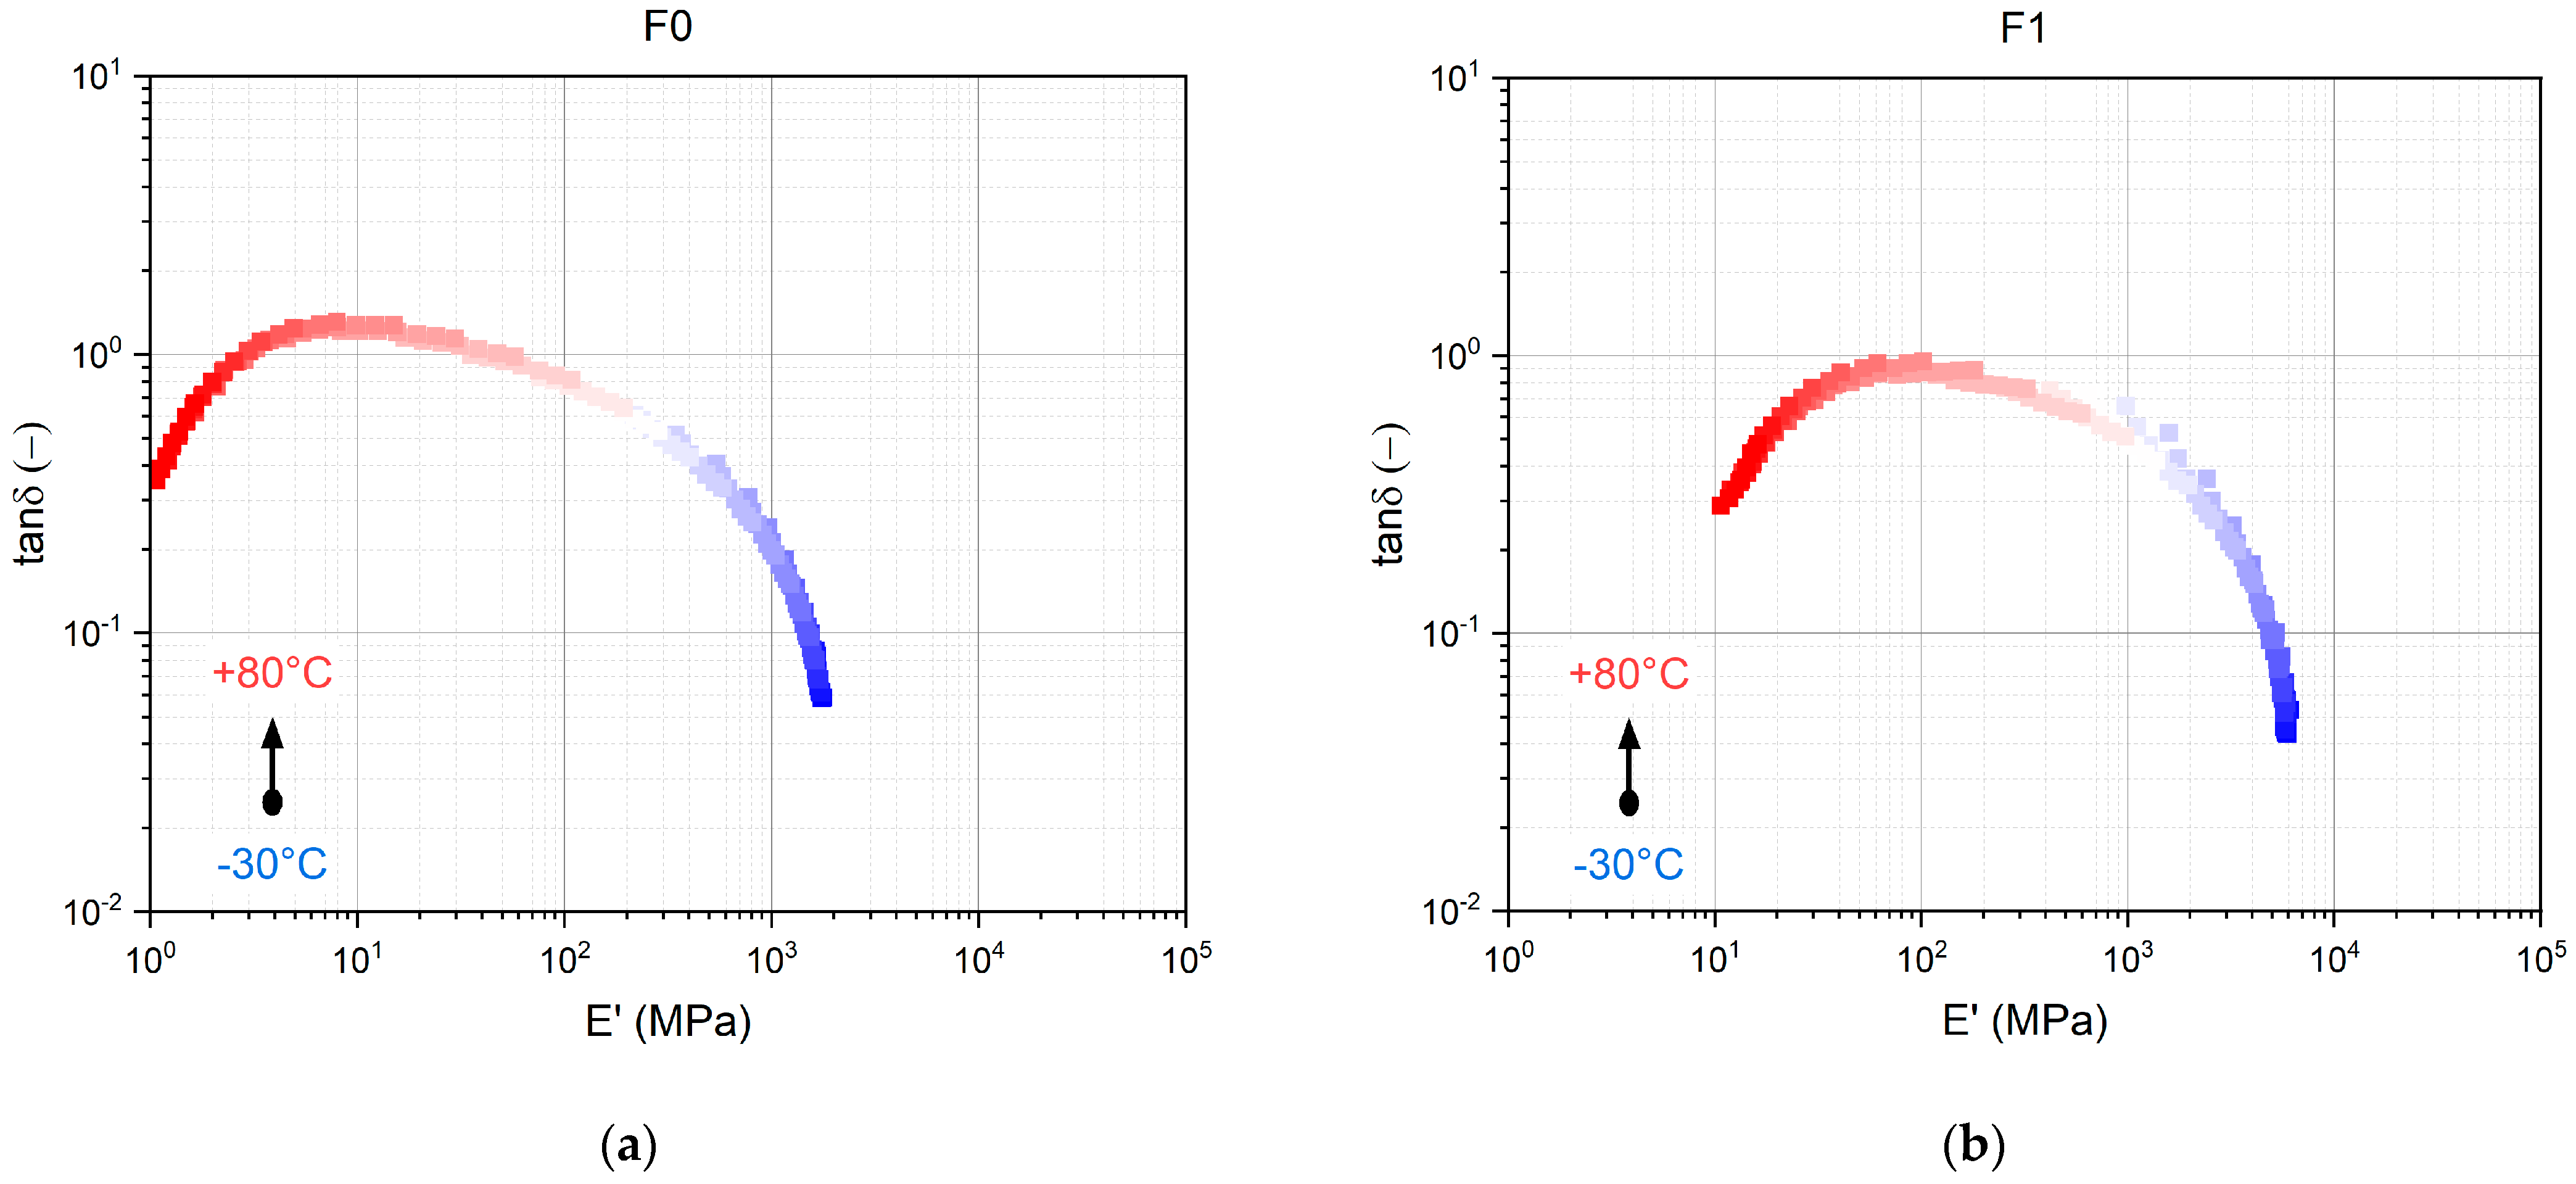
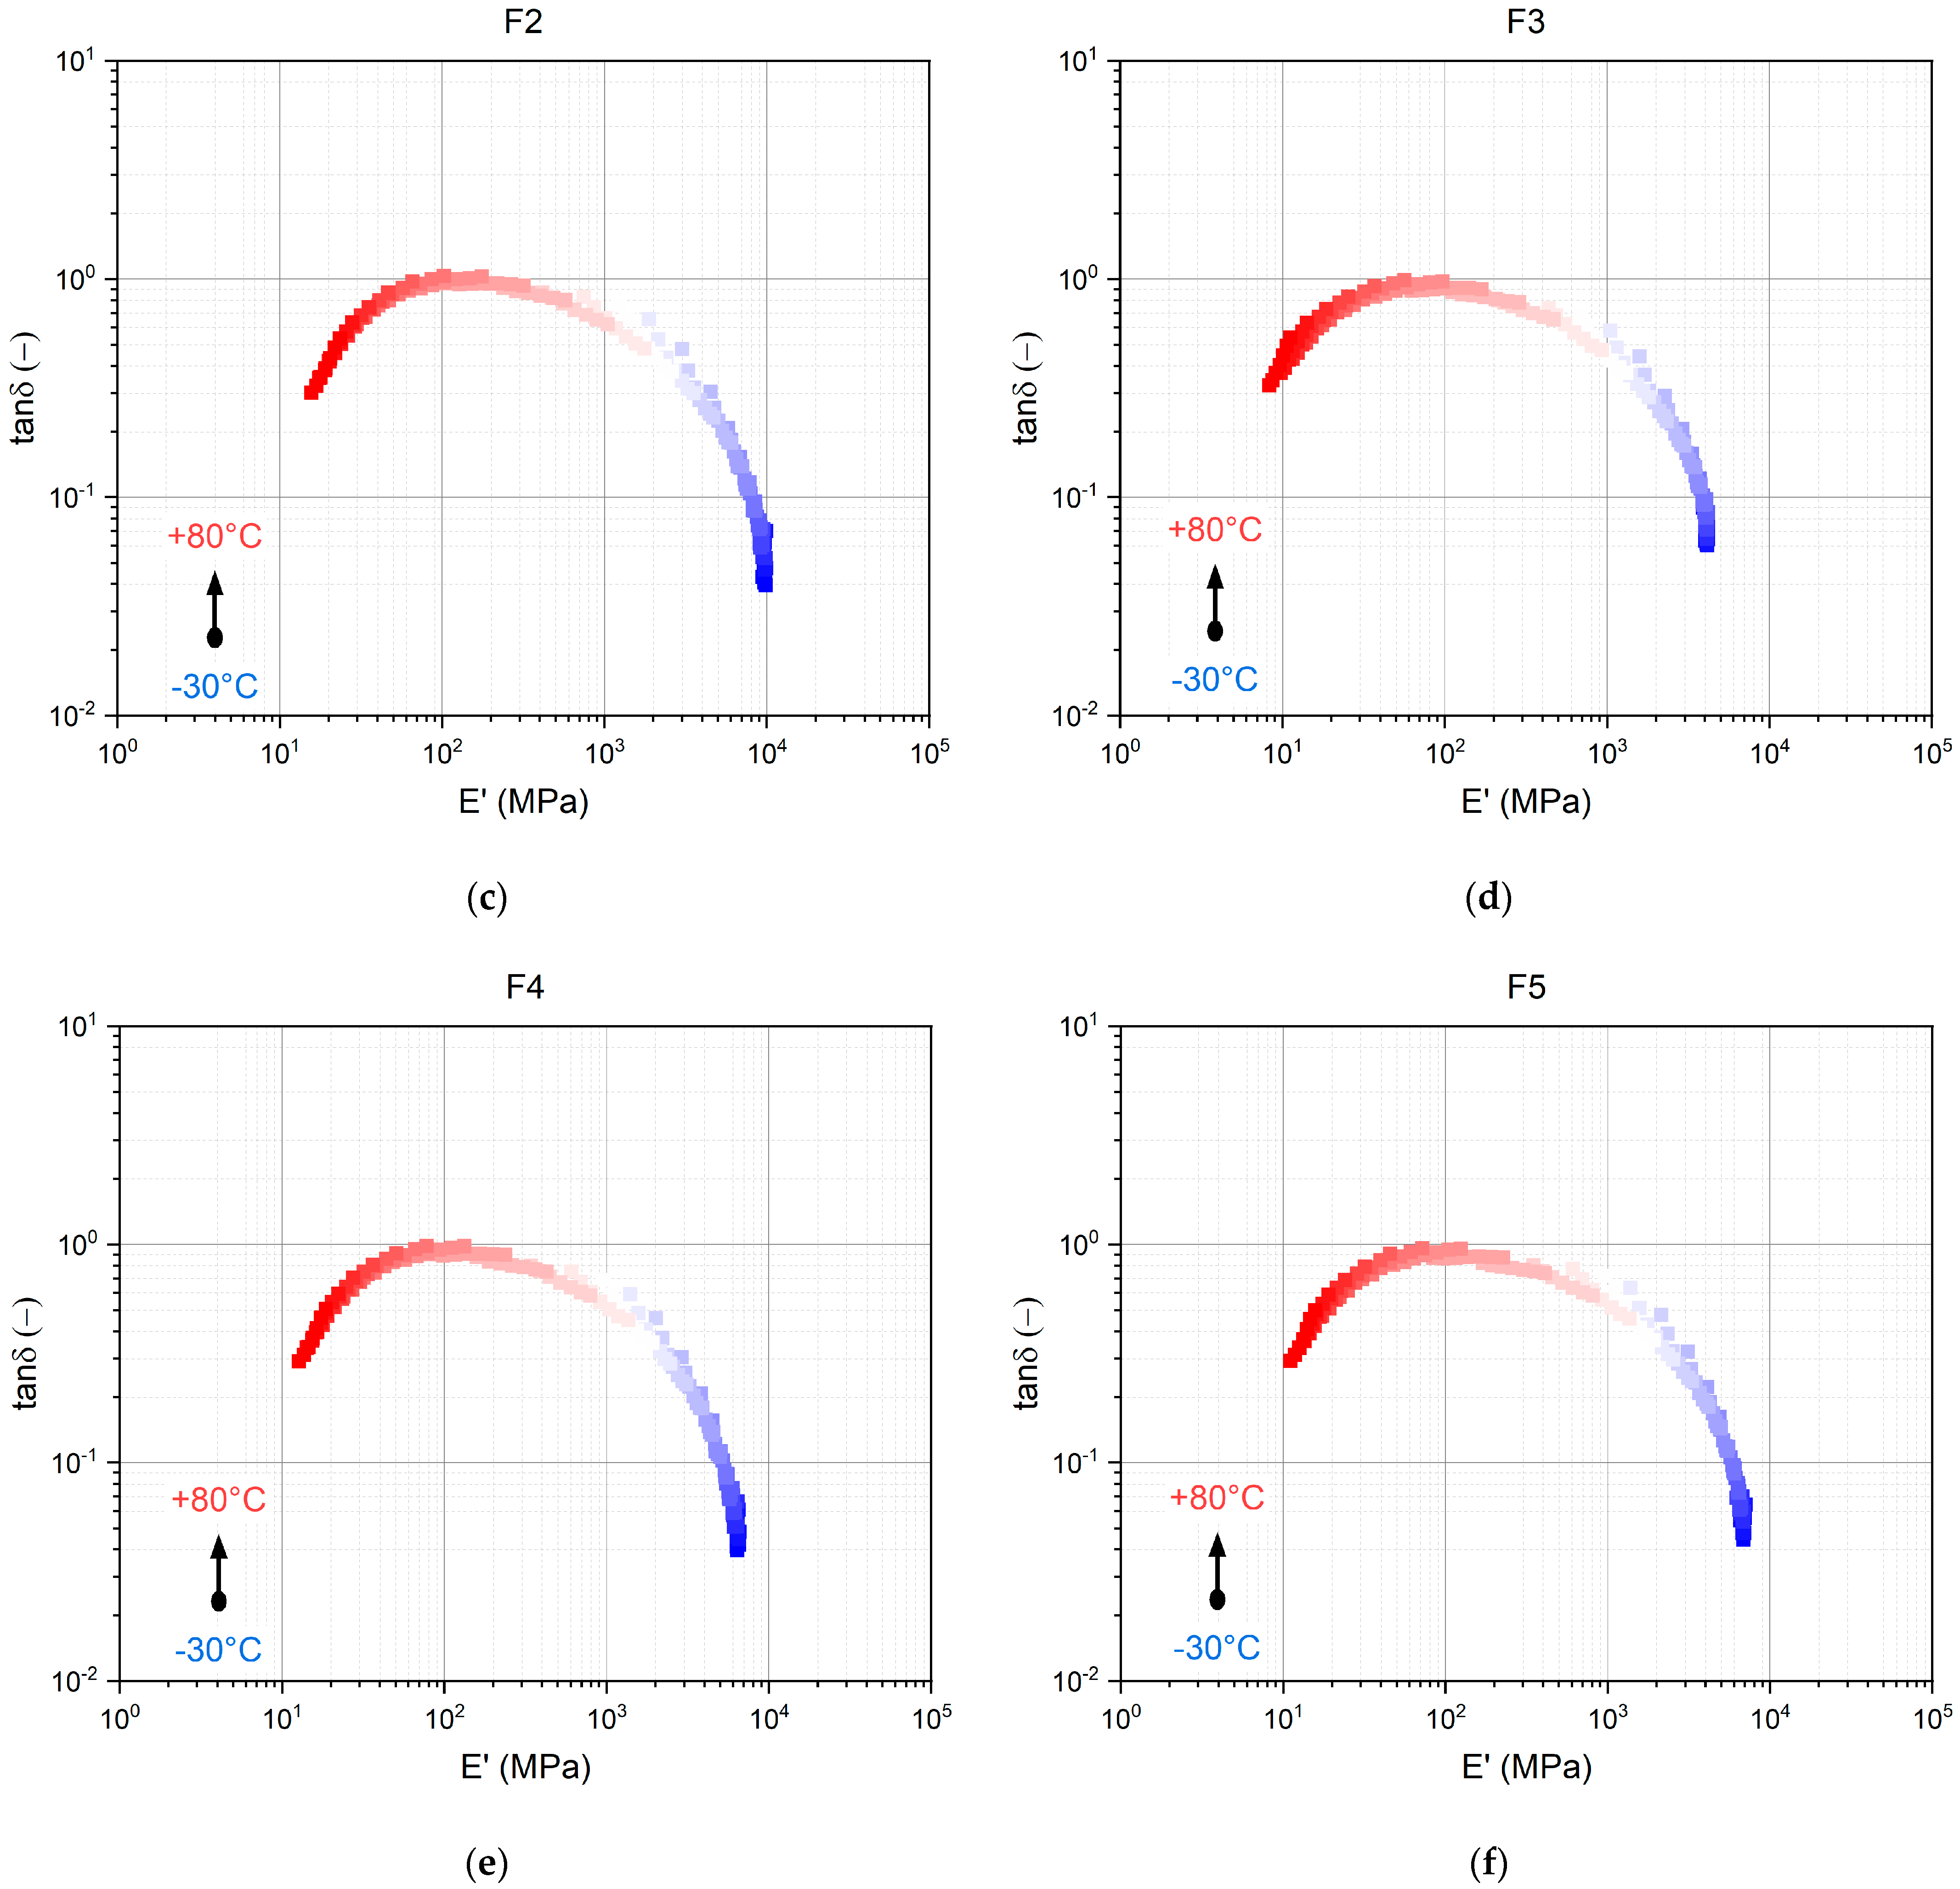
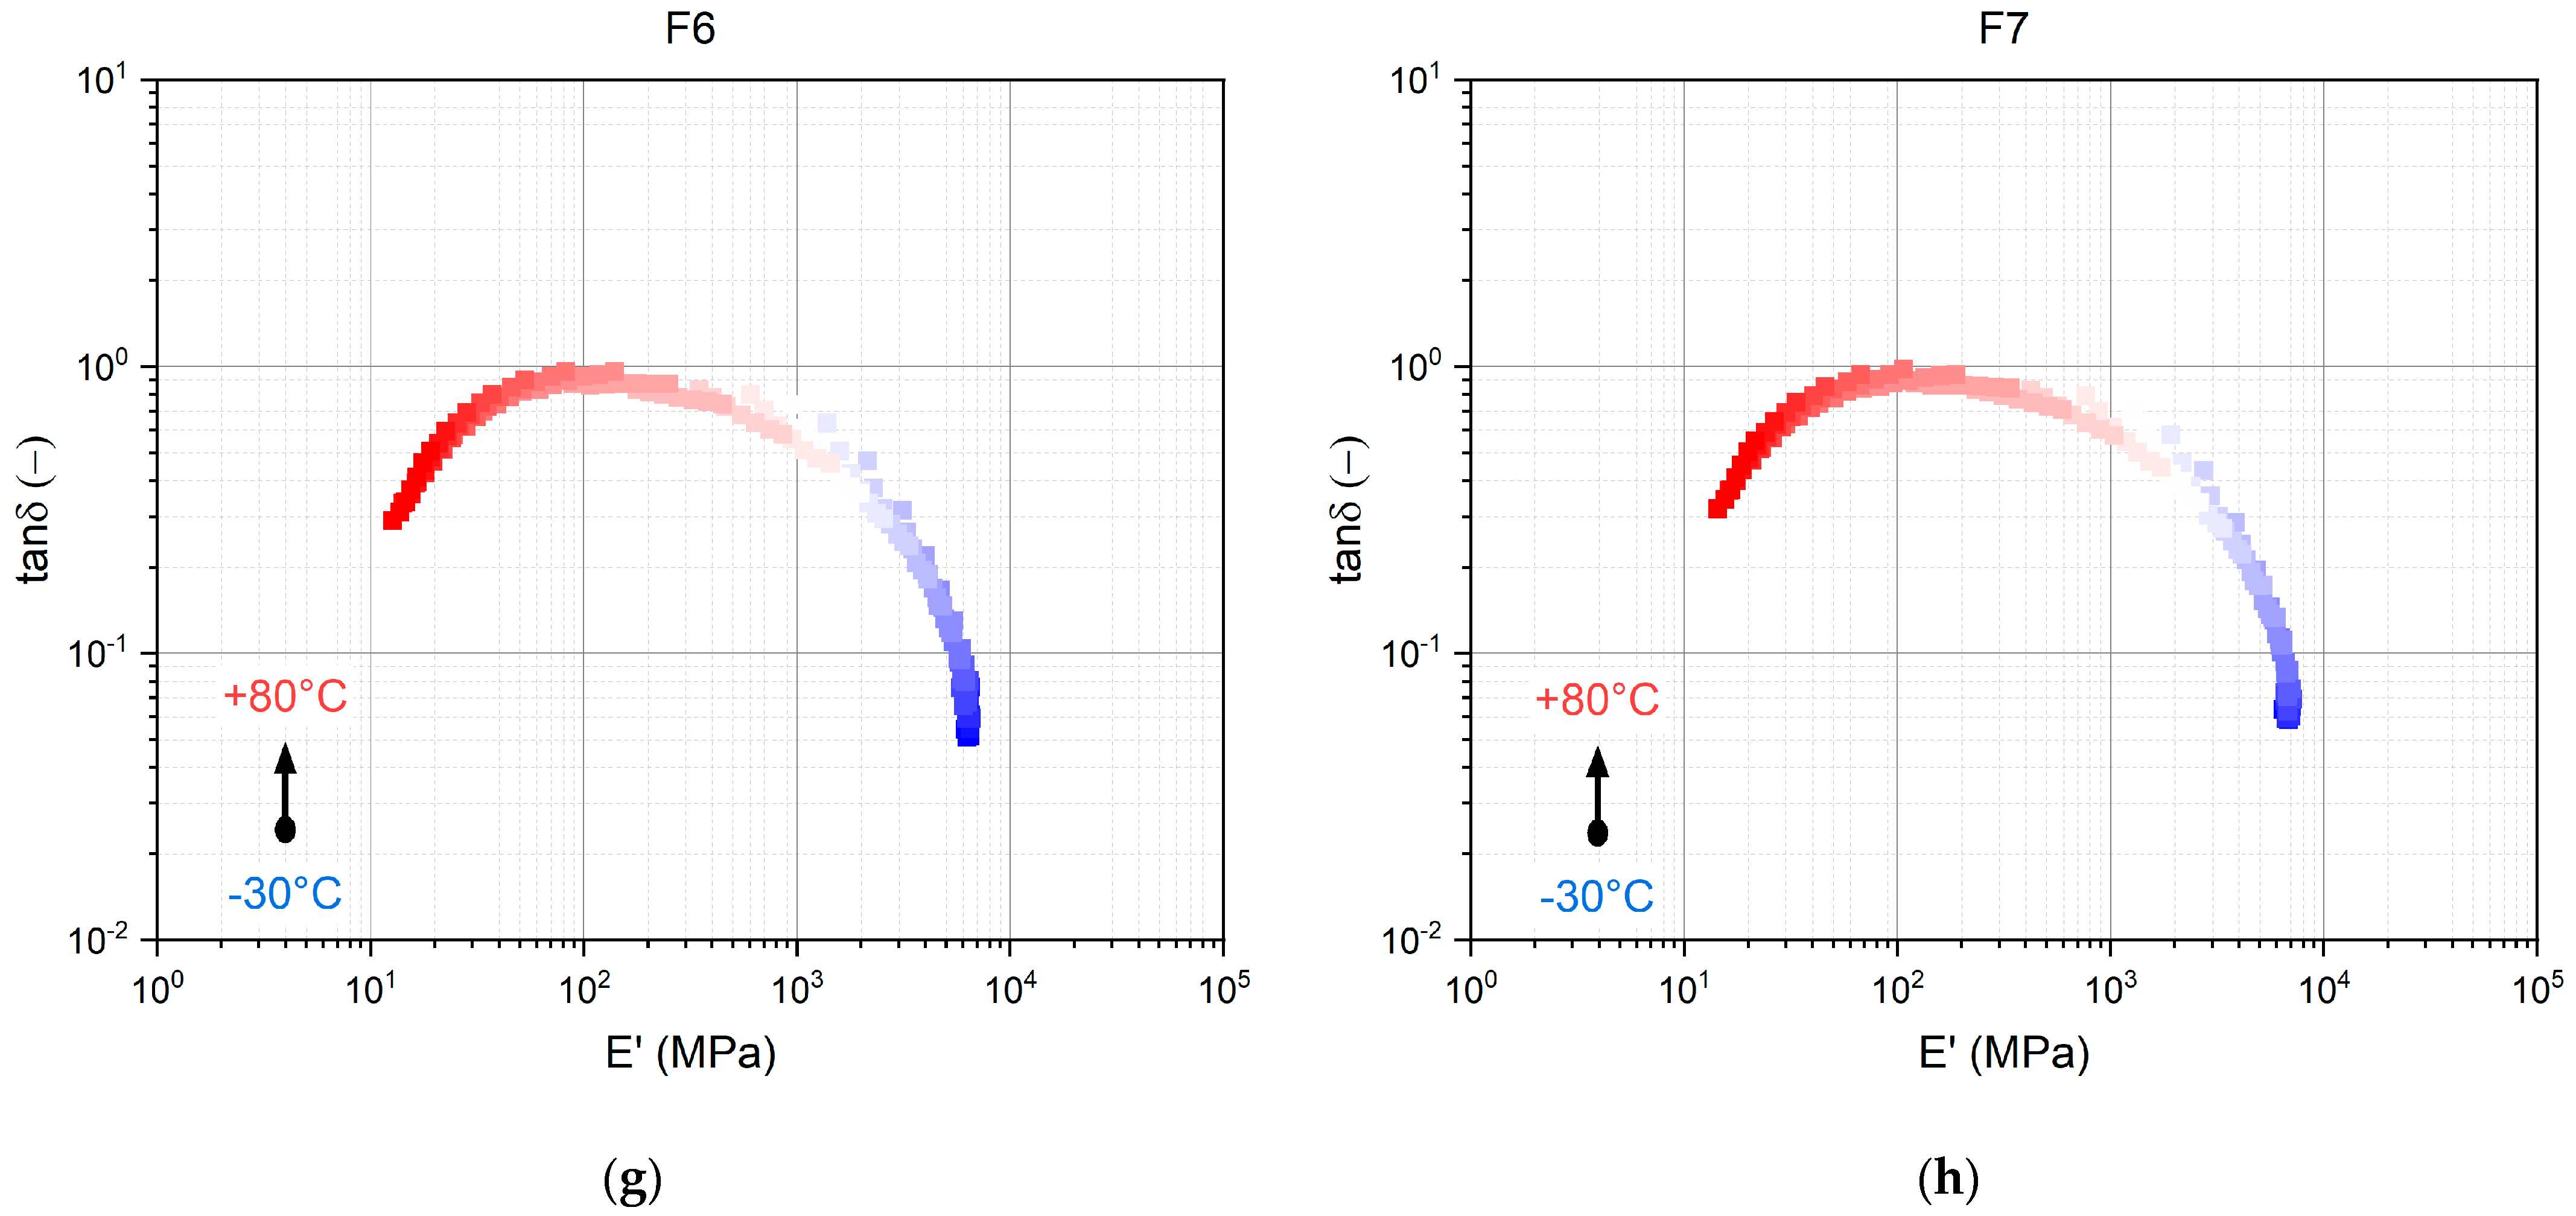
3.1. Results of the Dynamic Thermomechanical Analyses

The results of the DTMA are shown in Figure 3, Figure 4 and Figure 5. Each diagram includes the formulation 0 (F0, the polymer with thixotropy agents) and a group of formulations for better interpretation of the results in a comparative analysis. Figure 3a illustrates the formulations with 20 wt% silica filler (dust or sand) and 60 wt% basalt sand, and Figure 3b shows the formulations with 10 wt% silica filler and 70 wt% basalt sand.
The comparison of the 20 wt%:60 wt% and 10 wt%:70 wt% (silica filler/basalt sand) formulations is illustrated in Figure 4a. Figure 4b demonstrates the results of F4 (5 wt% SD, 5 wt% SS, 70 wt% BS) and F7 (15 wt% SD, 15 wt% SS, 50 wt% BS); each set has the same amount of SD and SS.
For a better overview of the formulations, all sand-dominant blends are plotted in Figure 5a, and all dust-dominant blends are plotted in Figure 5b. F6 is shown in both figures for comparative analyses of the influence of silica dust.
From the figures above, it can be concluded that the fillers stiffen the material as expected, with storage moduli E’ decreasing with increasing temperature. The loss factor tanδ also increases with the increase in temperature, reveals a maximum at 50 °C, and decreases afterwards. The same behavior is also shown in Figure 6a, which shows the Wicket plot (tanδ over E′) of all material formulations. With this plot, the thermorheological behavior (simple or complex) of the viscoelastic material formulations under temperature- and loading frequency-dependent mechanical loading is assessed [13,14,15,16].
If the inherent material response times (relaxation or retardation times) are equally dependent on temperature, then the loss factor tanδ (loss modulus E″) is a unique function of the storage modulus E′ [13,14]. The Wicket plots of each formulation are presented in Appendix A. Figure 6b compares the storage modulus E′ and the loss modulus E″ over measured temperatures and loading frequencies of the polymer matrix with the thixotropic agent (binder). With increasing temperature, the moduli decrease, and with increasing loading frequency, the moduli increase. In the range from 35 °C to 65 °C, E″ is higher than E′, which is also seen in Figure 3, Figure 4 and Figure 5 as tanδ > 1.

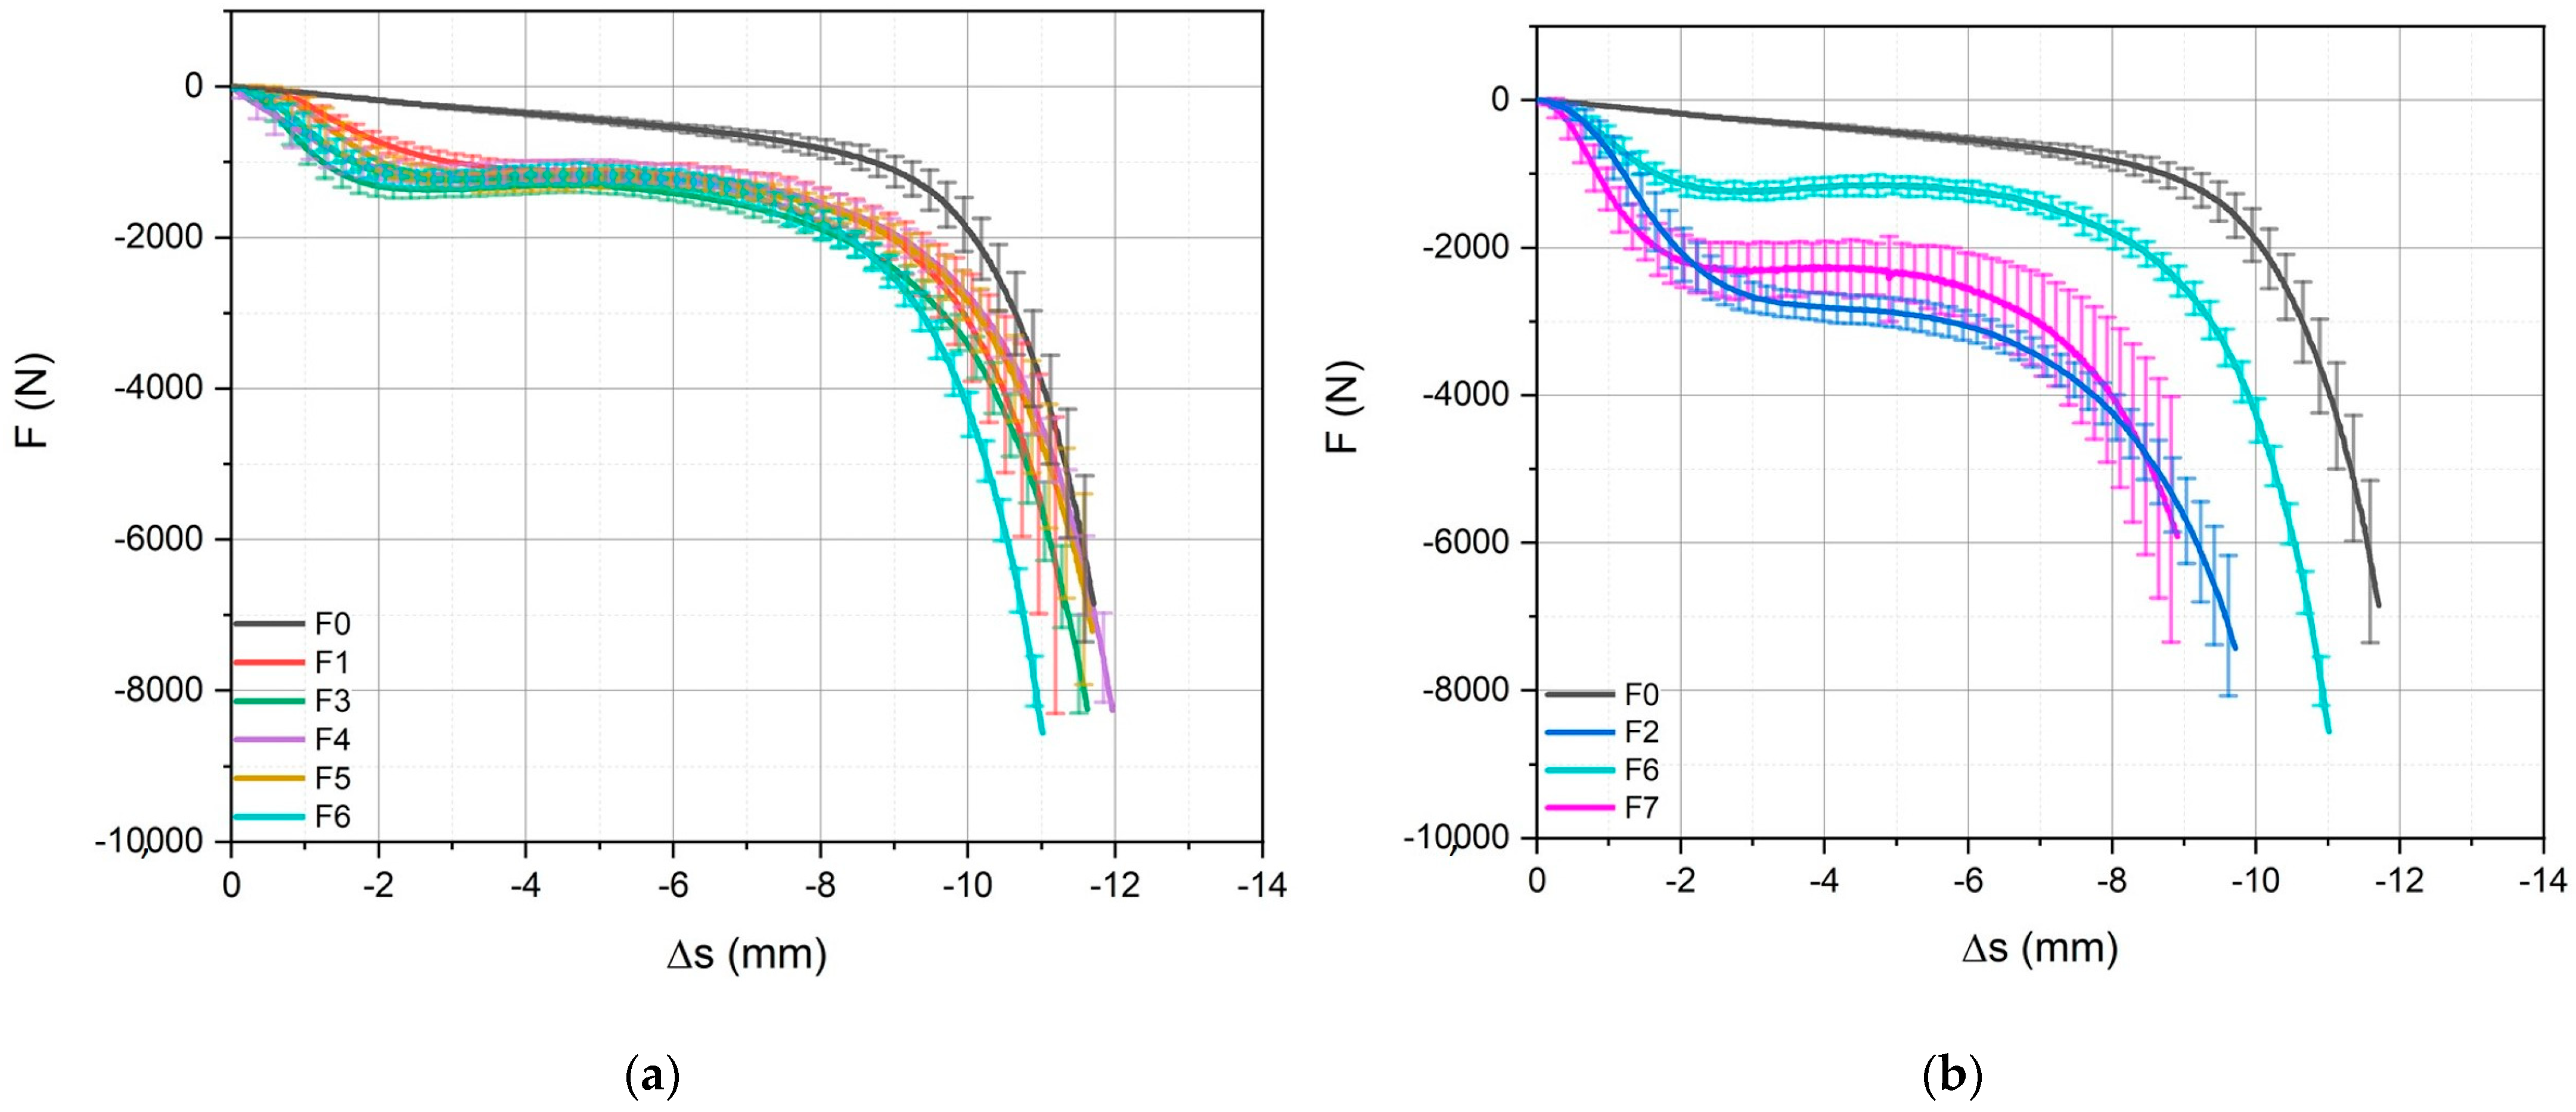
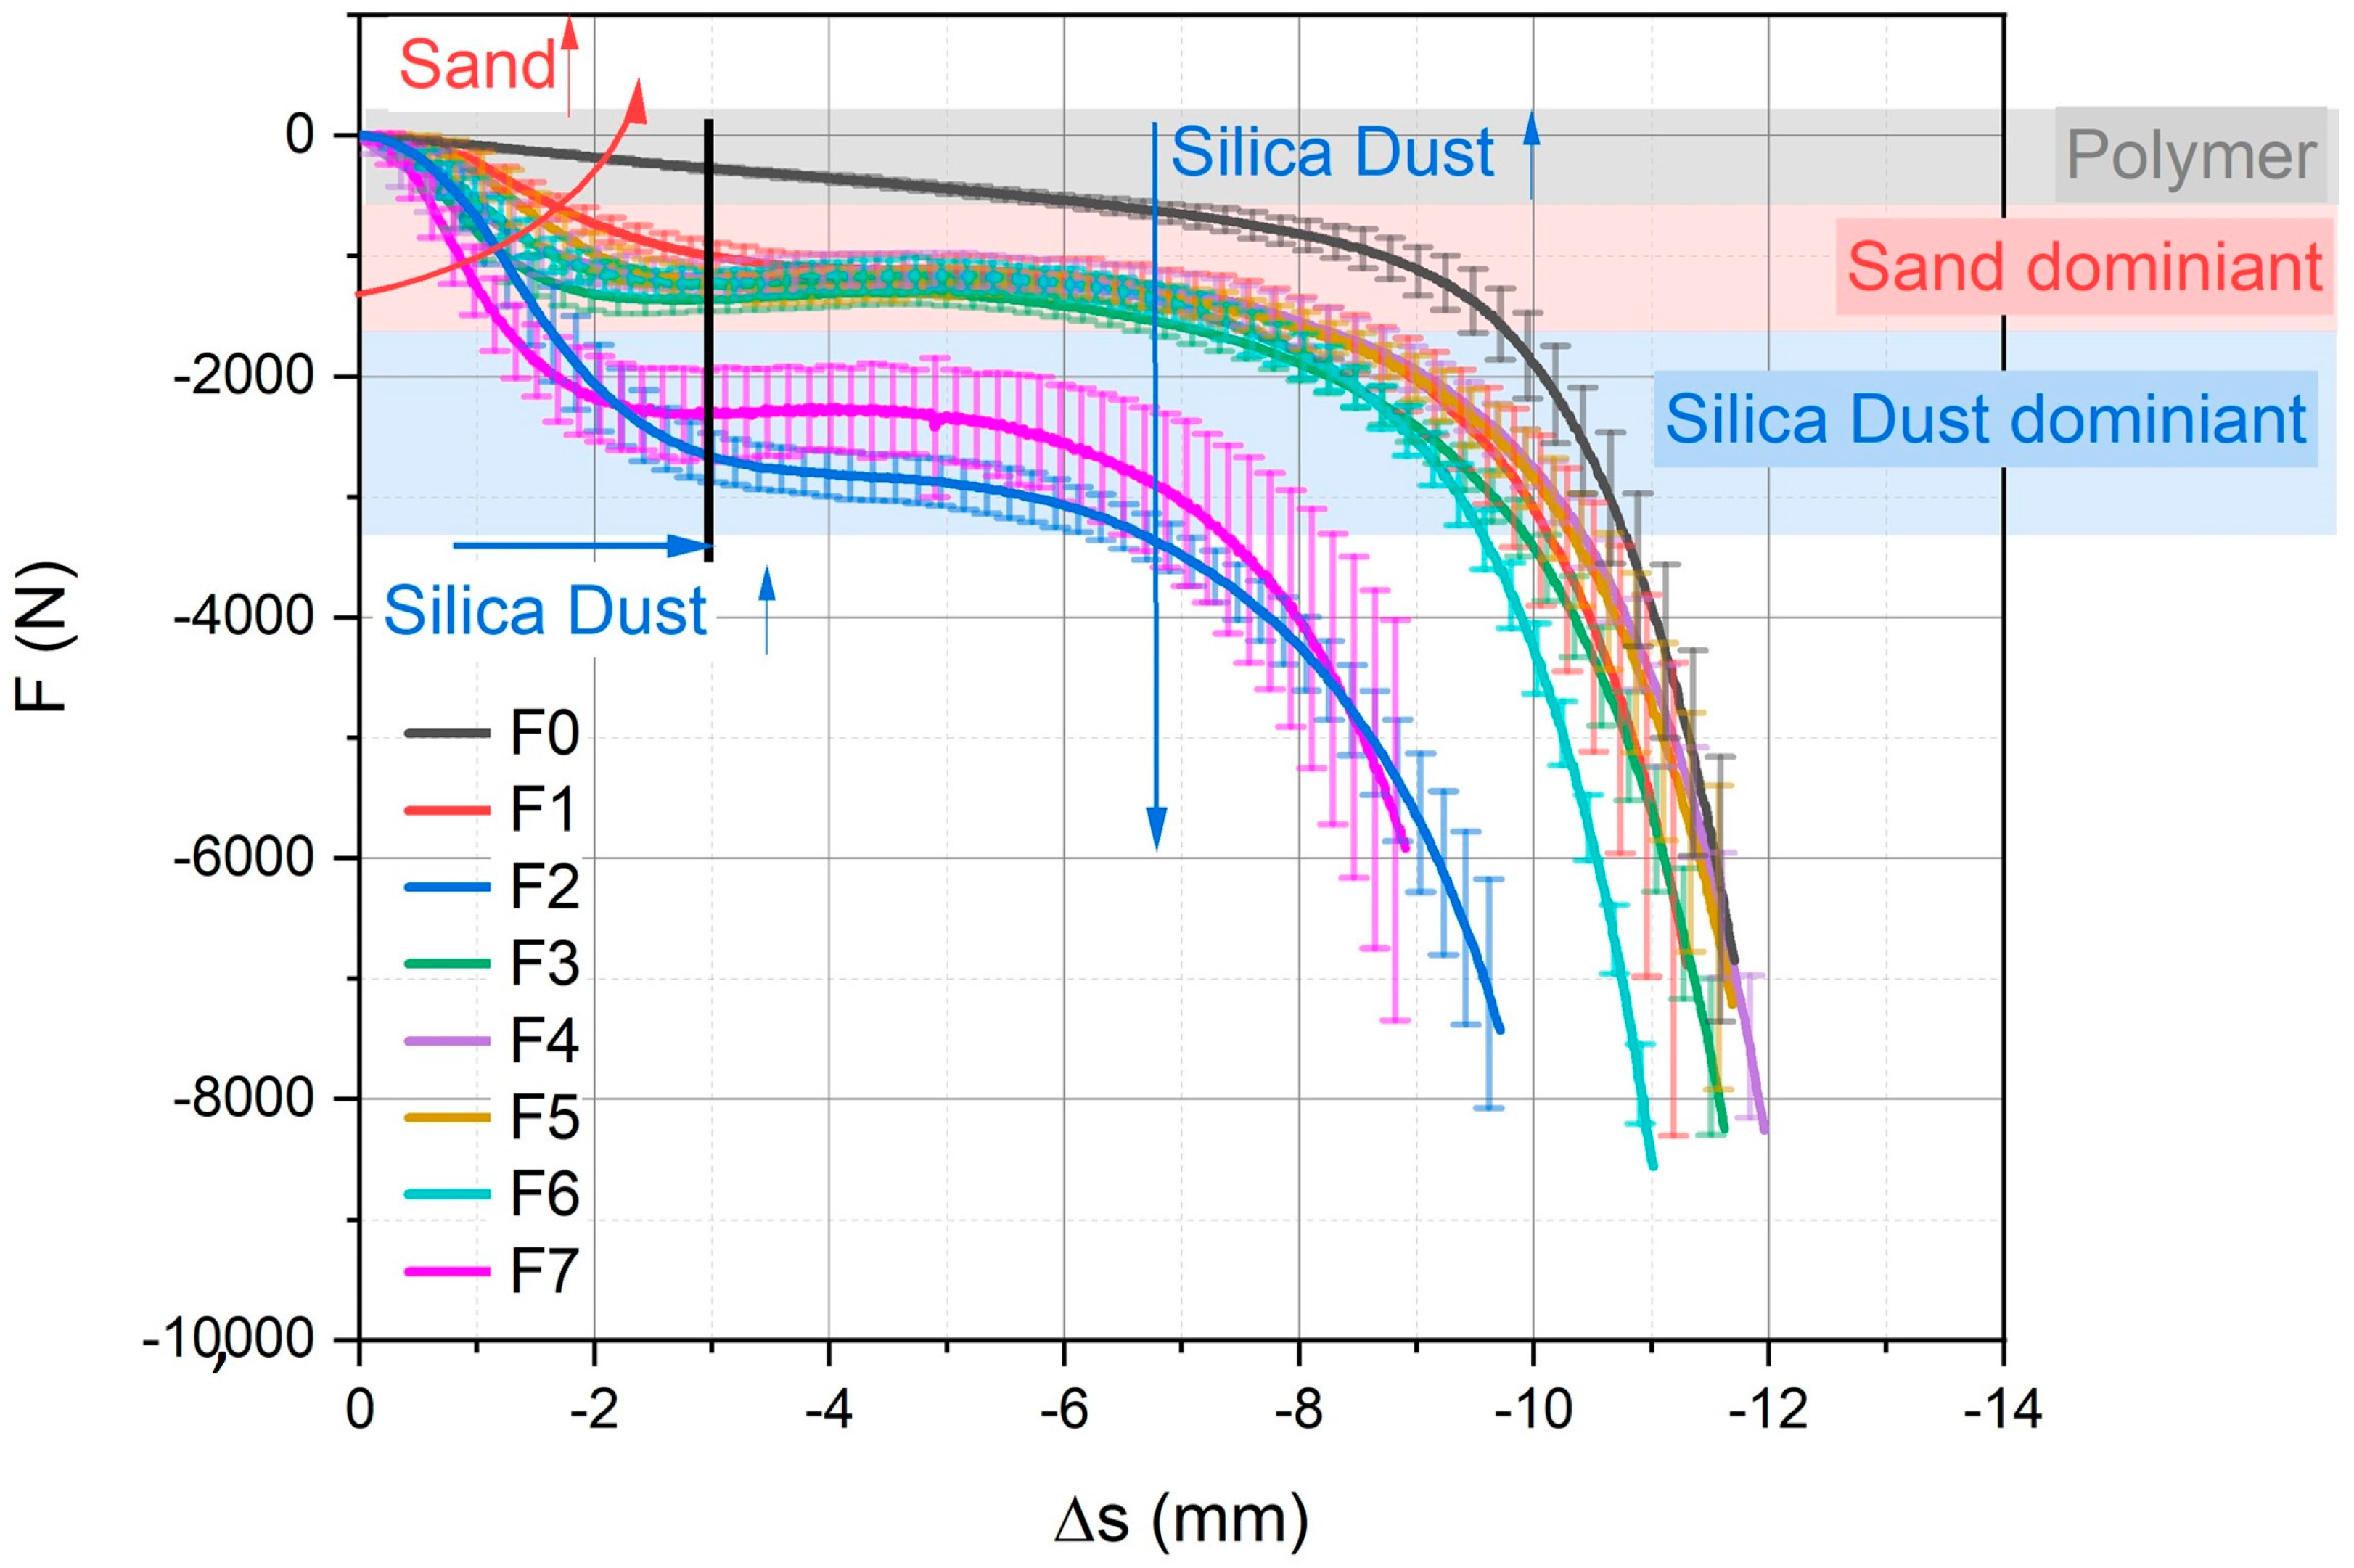
3.2. Results of the Compression Test

The results of the compression tests are plotted as force–displacement (F–Δs) diagrams, where Δs is the relative compressive displacement with respect to the initial height of the specimen. Figure 7a shows the sand-dominant formulations, and Figure 7b shows the dust-dominant formulations. The derived structure–property relations of SD, SS, and BS are presented in Figure 8. The polymer, sand, and flour-dominant areas are highlighted, respectively.

4. Discussion

As indicated in Figure 3a, F2 (20 wt% SD, 60 wt% BS) exhibits greater stiffness compared to F3 (20 wt% SS, 60 wt% BS). Notably, no difference in stiffness is observed between F5 (10 wt% SS, 70 wt% BS) and F6 (10 wt% SD, 70 wt% BS), as shown in Figure 3b. This suggests that the basalt content is the dominant factor, while the silica content is too low to influence the material behavior. For a more effective comparison, these four formulations are combined in Figure 4a. As previously mentioned, F2 exhibits the greatest stiffness, leading to the assumption that smaller particles (silica dust) contribute to increased stiffness due to better distribution and a higher surface-to-volume ratio of the particles for a specific content compared to larger particles. F5 and F6 display greater stiffness than F3, supporting the hypothesis that a 10 wt%:70 wt% (silica/basalt) filler ratio renders the silica content inconsequential to material properties. Even though F3 and F5 both have 80 wt% sand, F5 demonstrates stiffer behavior. This occurs due to the higher modulus of basalt sand compared to silica sand. This effect is also more pronounced at low temperatures as a consequence of the stiffer behavior of the polymer matrix. Figure 4b reveals that F7 (15 wt% SD, 15 wt% SS, 50 wt% BS) displays slightly greater stiffness compared to F4 (5 wt% SD, 5 wt% SS, 70 wt% BS) due to the higher amount of silica dust. In Figure 5a, from 10 °C upwards, sand-dominant formulations F1 (80 wt% BS) and F3 (20 wt% SS, 60 wt% BS) exhibit softer properties than the others. However, F1 has an upper temperature limit of 70 °C. Above that temperature, the material formulation loses mechanical stability. Below 10 °C, F3 is also softer than F1, which again shows the influence of the lower modulus of the silica sand compared to the basalt sand. Figure 5b illustrates the dust-dominant formulations. In the temperature range of −30 °C to +15 °C, the silica dust-dominant blends show a distinct content-dependent behavior, with stiffness increasing as the silica dust content increases (E′F6 (10 wt%) < E′F7 (15 wt%) < E′F2 (20 wt%)). Above 20 °C, F2 and F7 exhibit similar behavior, while F6 is softer than F2 and F7 across the entire temperature range.
In summary, the fillers induce a stiffening effect on the polymer and reduce damping capacity (lower tanδ), as observed in Figure 6a (Wicket plot). Generally, the storage modulus is in the range of similar basalt-reinforced asphalt mixtures reported (e.g., [21]) and is in the range of 1 GPa to 2 GPa at room temperature. The amount of silica dust has the most significant effect on stiffness. Interestingly, tanδ displays similar behavior for all blends, regardless of stiffness, which is only related to the polymer matrix. In Figure 3 to Figure 5, the polymer matrix with thixotropic agents (F0) exhibits a tanδ > 1 in the temperature range of 35 °C to 65 °C. Figure 6b illustrates E′ and E″ over temperature, with the gray-marked region indicating that E″ is greater than E′, which corresponds to the previously plotted results. Physically, a loss factor greater than one is not possible, as the material would absorb more energy than applied. This outcome indicates a superposition of the viscoelastic properties of the polymer and the thixotropic properties of the thixotropy agent. Due to the high percentage of mineral fillers, the effect of the thixotropy agent is reduced for formulations F1 to F7, and other filler-dominant effects are more pronounced. Moreover, the reduction of thixotropy in asphalt pavements was also shown in [25,26].
The results of the compression test are shown in Figure 7. In comparison to the polymer blend F0, the blends dominated by sand (Figure 7a) exhibit a stiffer behavior within the range of 0 mm to −2 mm displacement and sustain a load plateau until a displacement of −8 mm. Beyond this point, the material response of these blends is analogous to that of the polymer. In comparison, the dust-dominant formulations (Figure 7b) show a stiffer behavior within the first displacement range. In both diagrams, F6 (10 wt% SD, 70 wt% BS) is shown, which highlights the stiffening effect of silica dust. Furthermore, F2 exhibits a less-developed load plateau when compared to F6 or F7. Thus, the stiffness of the blends is influenced by the amount of dust, while the force plateau is influenced by the amount of sand. These insights and the derived structure–property relationship are described in Figure 8, which highlights the areas dominated by the polymer, sand, and silica dust. Within the initial displacement range (0 mm to −3 mm), an increase in the amount of silica dust leads to a stiffer material response. In the further displacement range (−3 mm to −8 mm), the sand-dominant blends exhibit a load plateau that reduces with a decrease in the volume of sand fillers.

5. Conclusions

To conclude, the presented insights gained by the viscoelastic characterization and compression testing show that the poly(methyl methacrylate) matrix, including the thixotropic agent and color pigments, regardless of the filler content and specific constituent, is thermorheologically simple. This means that the loss properties (loss modulus, E″, and loss factor, tanδ) are coherent with the storage modulus over the application temperature and loading frequency range. Thus, these types of polymeric asphalt mixtures are easily modeled by linear-viscoelastic material models, and numerical predictions of creep, as well as relaxation of the material are consistent. Furthermore, the structure–property relationship of mineral fillers is derived and summarized as follows:
  • The silica dust influences the stiffness most and shows a distinct content-dependent behavior, with stiffness increasing as the silica dust content increases.
  • The silica sand has a lower modulus compared to the basalt sand. This property leads to softer material behavior in the SS-dominant formulations compared to the BS-dominant formulations.
  • The compression test shows that the stiffness of the blends is influenced by the amount of dust, while the force plateau is influenced by the amount of sand.
  • The DTMA results show a superposition of the behavior of the thixotropy agent and the viscoelastic behavior of the polymer. This effect is negligible as soon as mineral fillers are added.
These findings are particularly important for optimizing polymeric asphalt mixtures over wide temperature and loading frequency ranges. Moreover, the material data presented here are significant for numerical analyses of pavement structures in order to predict critical loadings.

Author Contributions

Conceptualization, U.D.C. and C.E.; methodology, U.D.C.; formal analysis, C.E., U.D.C. and M.L.; investigation, C.E., U.D.C. and M.L.; resources, Z.M.; data curation, M.L.; writing—original draft preparation, C.E. and U.D.C.; writing—review and editing, C.E., U.D.C., M.L. and Z.M.; visualization, C.E. and U.D.C.; supervision, U.D.C. and Z.M.; project administration, U.D.C., C.E. and Z.M.; funding acquisition, U.D.C. All authors have read and agreed to the published version of the manuscript.

Funding

This research was funded by the Austrian Research Promotion Agency (FFG), “Basisprogramm Kleinprojekt,” grant number 892811; and the APC was funded by the Open Access Funding of Johannes Kepler University Linz. Zoltan Major and Umut D. Cakmak were supported by the National Research, Development and Innovation Fund of Hungary, financed under the 2020-4.1.1-TKP2020 funding scheme (Project no. TKP2020-NKA-04).

Institutional Review Board Statement

Not applicable.

Informed Consent Statement

Not applicable.

Data Availability Statement

Not applicable.

Acknowledgments

The authors acknowledge Emanuel Mohr (RoadPlast Mohr GmbH, Vorarlberg, Austria) for the preparation of the material formulations. Benjamin Brown (bhm consulting e.U.) supported the application for funding and the reporting of the research project. Open Access Funding by the Johannes Kepler University Linz.

Conflicts of Interest

The authors declare no conflict of interest.

Appendix A

In the following diagrams (Figure A1a–h), the Wicket plots of all material formulations are presented, separately. The diagrams reveal that the thermorheological behavior of all solid (cured) materials is simple (i.e., that the loss factor tanδ is a unique function of the storage modulus E′). This indicated that the applicability of linear-viscoelastic material models (e.g., generalized Maxwell or Kelvin–Voight models) is valid.
Figure A1. (ah) Wicket plots of all formulations revealing that the thermorheological behavior under dynamic thermomechanical loading of the solid (cured) material is simple.
Coatings 13 00932 g0a1aCoatings 13 00932 g0a1bCoatings 13 00932 g0a1c

References

  1. Mallick, R.B.; El-Korchi, T. (Eds.) Pavement Engineering: Principles and Practice; CRC Press: Boca Raton, FL, USA, 2022. [Google Scholar] [CrossRef]
  2. Omar, H.A.; Yusoff, N.I.M.; Mubaraki, M.; Ceylan, H. Effects of moisture damage on asphalt mixtures. J. Traffic Transp. Eng. 2020, 7, 600–628. [Google Scholar] [CrossRef]
  3. Saberi, F.; Fakhri, M.; Azami, A. Evaluation of warm mix asphalt mixtures containing reclaimed asphalt pavement and crumb rubber. J. Clean. Prod. 2017, 165, 1125–1132. [Google Scholar] [CrossRef]
  4. Mączka, E.; Mackiewicz, P. Asphalt Mixtures Fatigue Life Considering Various Environmental Impacts. Materials 2023, 16, 966. [Google Scholar] [CrossRef]
  5. Bressi, S.; Santos, J.; Orešković, M.; Losa, M. A comparative environmental impact analysis of asphalt mixtures containing crumb rubber and reclaimed asphalt pavement using life cycle assessment. Int. J. Pavement Eng. 2021, 22, 524–538. [Google Scholar] [CrossRef]
  6. Dehouche, N.; Kaci, M.; Mokhtar, K.A. Influence of thermo-oxidative aging on chemical composition and physical properties of polymer modified bitumens. Constr. Build. Mater. 2012, 26, 350–356. [Google Scholar] [CrossRef]
  7. Bao, B.; Liu, J.; Li, S.; Si, C.; Zhang, Q. Laboratory Evaluation of the Relationship of Asphalt Binder and Asphalt Mastic via a Modified MSCR Test. Coatings 2023, 13, 304. [Google Scholar] [CrossRef]
  8. Fan, S.; Zhu, H.; Lu, Z. Fatigue behavior and healing properties of aged asphalt binders. J. Mater. Civ. Eng. 2022, 34, 04022117. [Google Scholar] [CrossRef]
  9. Miglietta, F.; Tsantilis, L.; Baglieri, O.; Santagata, E. A new approach for the evaluation of time–temperature superposition effects on the self-healing of bituminous binders. Constr. Build. Mater. 2021, 287, 122987. [Google Scholar] [CrossRef]
  10. Lv, H.; Liu, H.; Zhang, C.; Wang, Y.; Han, M.; Tan, Y. Characterization of the healing potential of asphalt binders with separation of thixotropy after cyclic loading. Constr. Build. Mater. 2023, 370, 130686. [Google Scholar] [CrossRef]
  11. Partl, M.N. Towards improved testing of modern asphalt pavements. Mater. Struct. 2018, 51, 166. [Google Scholar] [CrossRef]
  12. Micaelo, R.; Jiménez, F.P.; Botella, R.; Miró, R.; Martínez, A.; da Costa, M.S. On the analysis of uniaxial cyclic strain sweep test results to bituminous binders: Stiffness-phase angle curve. Mater. Struct. 2022, 55, 90. [Google Scholar] [CrossRef]
  13. Çakmak, U.D.; Major, Z. Experimental Thermomechanical Analysis of Elastomers Under Uni- and Biaxial Tensile Stress State. Exp. Mech. 2014, 54, 653–663. [Google Scholar] [CrossRef]
  14. Çakmak, U.D.; Hiptmair, F.; Major, Z. Applicability of elastomer time-dependent behavior in dynamic mechanical damping systems. Mech. Time-Depend. Mater. 2014, 18, 139–151. [Google Scholar] [CrossRef]
  15. Çakmak, U.D.; Graz, I.; Moser, R.; Fischlschweiger, M.; Major, Z. Embedded NiTi Wires for Improved Dynamic Thermomechanical Performance of Silicone Elastomers. Materials 2020, 13, 5076. [Google Scholar] [CrossRef]
  16. Emminger, C.; Çakmak, U.D.; Preuer, R.; Graz, I.; Major, Z. Hyperelastic Material Parameter Determination and Numerical Study of TPU and PDMS Dampers. Materials 2021, 14, 7639. [Google Scholar] [CrossRef]
  17. Caro, S.; Sanches Diana, B.; Caicedo, B. Methodology to characterize non-standard asphalt materials using DMA testing: Application to natural asphalt mixtures. Int. J. Pavement Eng. 2015, 16, 1–10. [Google Scholar] [CrossRef]
  18. Gkyrtis, K.; Loizos, A.; Plati, C. A mechanistic framework for field response assessment of asphalt pavements. Int. J. Pavement Res. Technol. 2020, 14, 174–185. [Google Scholar] [CrossRef]
  19. Chabot, A.; Chupin, O.; Deloffre, L.; Duhamel, D. Viscoroute 2.0 A: Tool for the simulation of moving load effects on asphalt pavement. Road Mater. Pavement Des. 2010, 11, 227–250. [Google Scholar] [CrossRef]
  20. Liu, H.; Zeiada, W.; Al-Khateeb, G.G.; Shanableh, A.; Samarai, M. A framework for linear viscoelastic characterization of asphalt mixtures. Mater. Struct. 2020, 53, 32. [Google Scholar] [CrossRef]
  21. Tan, G.; Wang, W.; Cheng, Y.; Wang, Y.; Zhu, Z. Master Curve Establishment and Complex Modulus Evaluation of SBS-Modified Asphalt Mixture Reinforced with Basalt Fiber Based on Generalized Sigmoidal Model. Polymers 2020, 12, 1586. [Google Scholar] [CrossRef]
  22. Zhao, R.; Jing, F.; Wang, R.; Cai, J.; Zhang, J.; Wang, Q.; Xie, H. Influence of oligomer content on viscosity and dynamic mechanical properties of epoxy asphalt binders. Constr. Build. Mater. 2022, 338, 127524. [Google Scholar] [CrossRef]
  23. Clara, E.; Barra, B.S.; Teixeira, L.H.; Mikowski, A.; Hughes, G.B.; Nguyen, M.L. Influence of polymeric molecular chain structure on the rheological-mechanical behavior of asphalt binders and porous asphalt mixes. Constr. Build. Mater. 2023, 369, 130575. [Google Scholar] [CrossRef]
  24. Jing, F.; Wang, R.; Zhao, R.; Li, C.; Cai, J.; Ding, G.; Wang, Q.; Xie, H. Enhancement of Bonding and Mechanical Performance of Epoxy Asphalt Bond Coats with Graphene Nanoplatelets. Polymers 2023, 15, 412. [Google Scholar] [CrossRef] [PubMed]
  25. Ma, X.; Wang, Y.; Hou, J.; Sheng, Y.; Zheng, W.; Wu, S. Study on Thixotropic Properties of Asphalt Mastics Based on Energy Viewpoint. Coatings 2023, 13, 650. [Google Scholar] [CrossRef]
  26. Mewis, J.; Wagner, N.J. Thixotropy. Adv. Colloid Interface Sci. 2009, 147, 214–227. [Google Scholar] [CrossRef]
Figure 1. (ac) Production of the plates from which the specimens for dynamic mechanical analyses are cut out. (df) Production of the cylindrical specimens for compression testing.
Coatings 13 00932 g001
Figure 2. (a) Cured plates, including the dimensions from which the specimens for dynamic mechanical analyses are cut out. (b) Cured cylindrical specimens, including the dimensions for compression testing.
Coatings 13 00932 g002
Figure 3. (a) Compounds with 20 wt% of silica filler and 60 wt% basalt sand compared to the polymer; (b) compounds with 10 wt% of silica filler and 70 wt% basalt sand compared to the polymer. The full lines show the storage modulus E’ and the dotted lines show the tanδ results of each formulation.
Coatings 13 00932 g003
Figure 4. (a) Comparison of 20 wt%:60 wt% and 10 wt%:70 wt% (silica filler/basalt sand); (b) influence of equal amounts of silica dust and silica sand. The full lines show the storage modulus E’ and the dotted lines show the tanδ results of each formulation.
Coatings 13 00932 g004
Figure 5. (a) Shows the sand-dominant material formulations, and (b) the silica dust-dominant formulations. The full lines show the storage modulus E’ and the dotted lines show the tanδ results of each formulation.
Coatings 13 00932 g005
Figure 6. (a) Wicket plot of all material formulations over the tested temperature and loading frequency ranges. (b) Comparison of the storage and loss modulus (E′ and E″) over temperature of the polymer matrix filled with thixotropy agents. Rectangular points represent the range of loading frequency results. Lines represent the averaged moduli over all loading frequencies. The gray area indicates the temperature range where E″ is higher as E′.
Coatings 13 00932 g006
Figure 7. Force–compressive displacement curves with the averaged results of the compression tests, including the standard deviation bars: (a) sand-dominant formulations and (b) silica dust-dominant formulations.
Coatings 13 00932 g007
Figure 8. Derived structure–property relationships of the investigated mineral fillers.
Coatings 13 00932 g008
Table 1. Material formulations with varying contents of mineral fillers. The total mineral filler content is 80 wt%, except for Formulation 0 (F0), which is the matrix polymer (binder).
Material FormulationSilica Dust (SD) in wt%Silica Sand (SS) in wt%Basalt Sand (BS) in wt%
F0000
F10080
F220060
F302060
F45570
F501070
F610070
F7151550
Table 2. Fillers and processing agents and their bulk density.
Filler/Processing AgentBulk Density [g/cm3]
Thixotropy Agent2.2
Pigment4.6
Catalysator0.62
Binder0.98
Silica dust2.65
Silica Sand2.65
Basalt Sand2.71
Disclaimer/Publisher’s Note: The statements, opinions and data contained in all publications are solely those of the individual author(s) and contributor(s) and not of MDPI and/or the editor(s). MDPI and/or the editor(s) disclaim responsibility for any injury to people or property resulting from any ideas, methods, instructions or products referred to in the content.

