Article

Mechanical Properties and Wear Resistance of CrSiN Coating Fabricated by Magnetron Sputtering on W18Cr4V Steel

1
College of Mechanical Engineering, Baicheng Normal University, Baicheng 137000, China
2
College of Computer Science, Baicheng Normal University, Baicheng 137000, China
*
Author to whom correspondence should be addressed.
Coatings 2023, 13(5), 889; https://doi.org/10.3390/coatings13050889
Submission received: 17 April 2023 / Revised: 30 April 2023 / Accepted: 6 May 2023 / Published: 9 May 2023
(This article belongs to the Special Issue Ceramic Films and Coatings: Properties and Applications)

Abstract

:
To increase the service life of tool materials and further meet the demands of modern high-speed machining, a Si-doping CrN coating consisting of Si3N4 amorphous and CrN nanocrystalline was fabricated on top of W18Cr4V high-speed steel. The effect of coating thickness on its structure and properties was investigated by means of X-ray diffraction (XRD), scanning electron microscope (SEM), transmission electron microscope (TEM), scratch test, nano-indenter, and friction–abrasion tester. The thickness of the coating was modulated by the deposition time. The results show that the coating consists of a CrN phase distributed into an amorphous Si3N4 matrix. As the thickness increased, the surface defects decreased, and the residual compressive stress, hardness, and elastic modulus as well as the H/E and H3/E2 factors increased, improving the wear resistance significantly. The adhesion between coating and substrate increased first and then decreased, and it reached the maximum when the coating thickness was 1.9 μm (deposition 60 min). Moreover, the effect of toughness on wear resistance and the wear mechanisms is discussed.

1. Introduction

At present, the development of high-speed cutting and dry cutting technology puts forward higher requirements for tool materials and cutting performance, and the cutting tools which are covered by coatings exhibit an important way to improve their surface properties by endowing them with higher hardness and wear resistance [1,2,3,4]. In addition to fabrication techniques and methods, the type and structure of the coating is a significant factor in the lifetime of the cutting tools. In the past decades, the tools coated with a transition metal nitride coating, such as TiN [2,5,6], CrN [5], NbN [6], and ZrN [4], demonstrated that they were well resistant to wear. They combine the advantages of high strength and toughness of the steel matrix and high hardness and wear resistance of the coating not only to enable high-speed cutting of tools but also to enhance machining accuracy and quality of the workpiece. Particularly, CrN coatings are expected to be technologically important in many tribocorrosion-resistant applications due to their good wear resistance, corrosion resistance, and oxidation resistance [7].
However, the binary CrN film applied to machining tools, cutting tools, and molds exposed problems with low oxidation temperatures, poor wear resistance, and low thermal hardness [8,9]. Previous reports [1,3,7,10,11,12,13] have shown that the Si-doped CrN coatings had better performance than CrN. The addition of Si can refine the grain and improve the hardness, and Si is likely to form the Si3N4 amorphous phase with N atoms, which can reduce the columnar crystals of film, obtain more grain boundaries, and prolong the diffusion path of oxygen, thus improving the hardness and high-temperature stability of the coating and inhibiting the formation of cracks in the layers. In addition, Cr and Si in the CrSiN coating can form oxide films of SiO2 and Cr2O3 that are resistant to high-temperature corrosion [10,13]. As a result, CrSiN coatings, with their high hardness and strength, low friction coefficient, better oxidation resistance, and high thermal shock resistance, have attracted increasing attention in the area of cutting tools and have become one of the important research directions in hard coatings. Scholars at home and abroad have studied the effect of deposition temperature [14,15], matrix bias [15], periodic layers [1], nitrogen flow rate [14], and other process parameters on the performance of CrSiN coating, but the effects of coating thickness on structure and properties have been less reported. In this work, a CrSiN coating with a composite structure is fabricated at various deposition times to obtain different thicknesses, and the influence of the coating thickness on the structure and properties is systematically investigated.

2. Experimental Details

W18Cr4V (commercial high-speed steel) with a dimension of 15 mm × 15 mm × 2 mm was used as the substrate. After grinding, polishing, and ultrasonic cleaning in acetone, anhydrous ethanol, and deionized water rinsing, the steel was loaded into a vacuum chamber. Under a united action of a DC and a bias voltage supply, a pure Cr target and a Si target were first pre-sputtered to ensure the purity of the coating and to produce a micro-convex structure on the W18Cr4V surface to enhance the adhesion between the coating and the steel substrate. A thin bottom Cr layer was then prepared by DC magnetron sputtering in an argon atmosphere. Next, a mixture of Ar and N2 was introduced into the chamber, and a CrN layer was prepared by DC-sputtering the Cr target. Finally, a CrSiN top layer was deposited in a mixture of Ar and N2 by co-sputtering Cr and Si targets with DC and Rf power supplies. Table 1 summarizes the deposition parameters used in this study.
The background vacuum was lower than 1 × 10⁻³ Pa.
The working pressure was 0.5 Pa.
The deposition temperature was 300 °C.
The distance between the target and the substrate was 60 mm.
The deposition times were set to 15 min, 30 min, 60 min, and 120 min. For the sake of illustration, we refer to them T1, T2, T3, and T4, respectively.
A D8 Advance X-ray diffractometer (XRD; Bruker, Billerica, MA, USA) was used to analyze phase structure with a 3-degree grazing incidence, the scanning speed was 8°/min, and the step was 0.05 degree. The Debye–Scherrer equation, shown in Equation (1), is employed to calculate the grain size. The surface morphology was observed by means of JSM-6700 scanning electron microscopy (SEM, FEI, Hillsboro, OR, USA) and Tecnai F20 transmission electron microscopy (TEM, FEI, Hillsboro, OR, USA). A WS-2005 scratch tester (Zhongke Kaihua Co., Ltd., Lanzhou, China) was used to evaluate the adhesion, with a load of 20 N, a scratch length of 3 mm, and a loading rate of 20 N/min, and the scratch morphology was observed by an optical microscope (OM, CR 30-T1000, Suzhou, China) [16,17].
D = k λ β cos θ
where k is a constant equal to 0.89, β is half-width of the diffraction peak (in radian), λ is the wavelength of 0.154 nm (Cu kα), θ is the Bragg Angle (°), and D is the grain size (nm).
The surface mechanical properties were carried out with 3 mN load (kept for 10 s) via a nano-indenter (KLA-Tencor, Milpitas, CA, USA). The loading and unloading speed were 5 mN/min, the indentation depth to eliminate the influence of the W18Cr4V steel [18,19,20], and it was necessary to measure at least 5 points to avoid error [18]. The error bar was calculated as a standard deviation of the average tested data, which was a result of the variation in the local mechanical properties of the coating [21]. An SFT-2M model pin-on-disk tester (Zhongke Kaihua Co., Ltd., Lanzhou, China) was employed to measure the coefficient of friction (COF) and wear loss rate in a dry environment against a ϕ 6 mm Al2O3 ball rotating at 300 rpm (30 °C, relative humidity of 60%). A 200 g normal load was applied for 15 min, and the wear track was observed by using an optical microscope (OM, CR 30-T1000, LTD, Suzhou, China). Residual stress was evaluated by using FST1000 film stress tester (Supro Instruments Co., Ltd., Shenzen, China), measuring the curvature radius (W18Cr4V steel). The value was calculated by Stoney’s equation (Equation (2)) [22].
σ = E s 1 ν s t s 2 6 t f 1 R 1 1 R 2
where Es and νs are the elasticity modulus and the Poisson’s ratio of the substrate, R1 and R2 are the curvature radii of the substrate before and after deposition, and ts and tf represent the thicknesses of substrate and coating, respectively. The Es and νs in this investigation are 0.22 and 180 GPa, respectively.

3. Results and Discussion
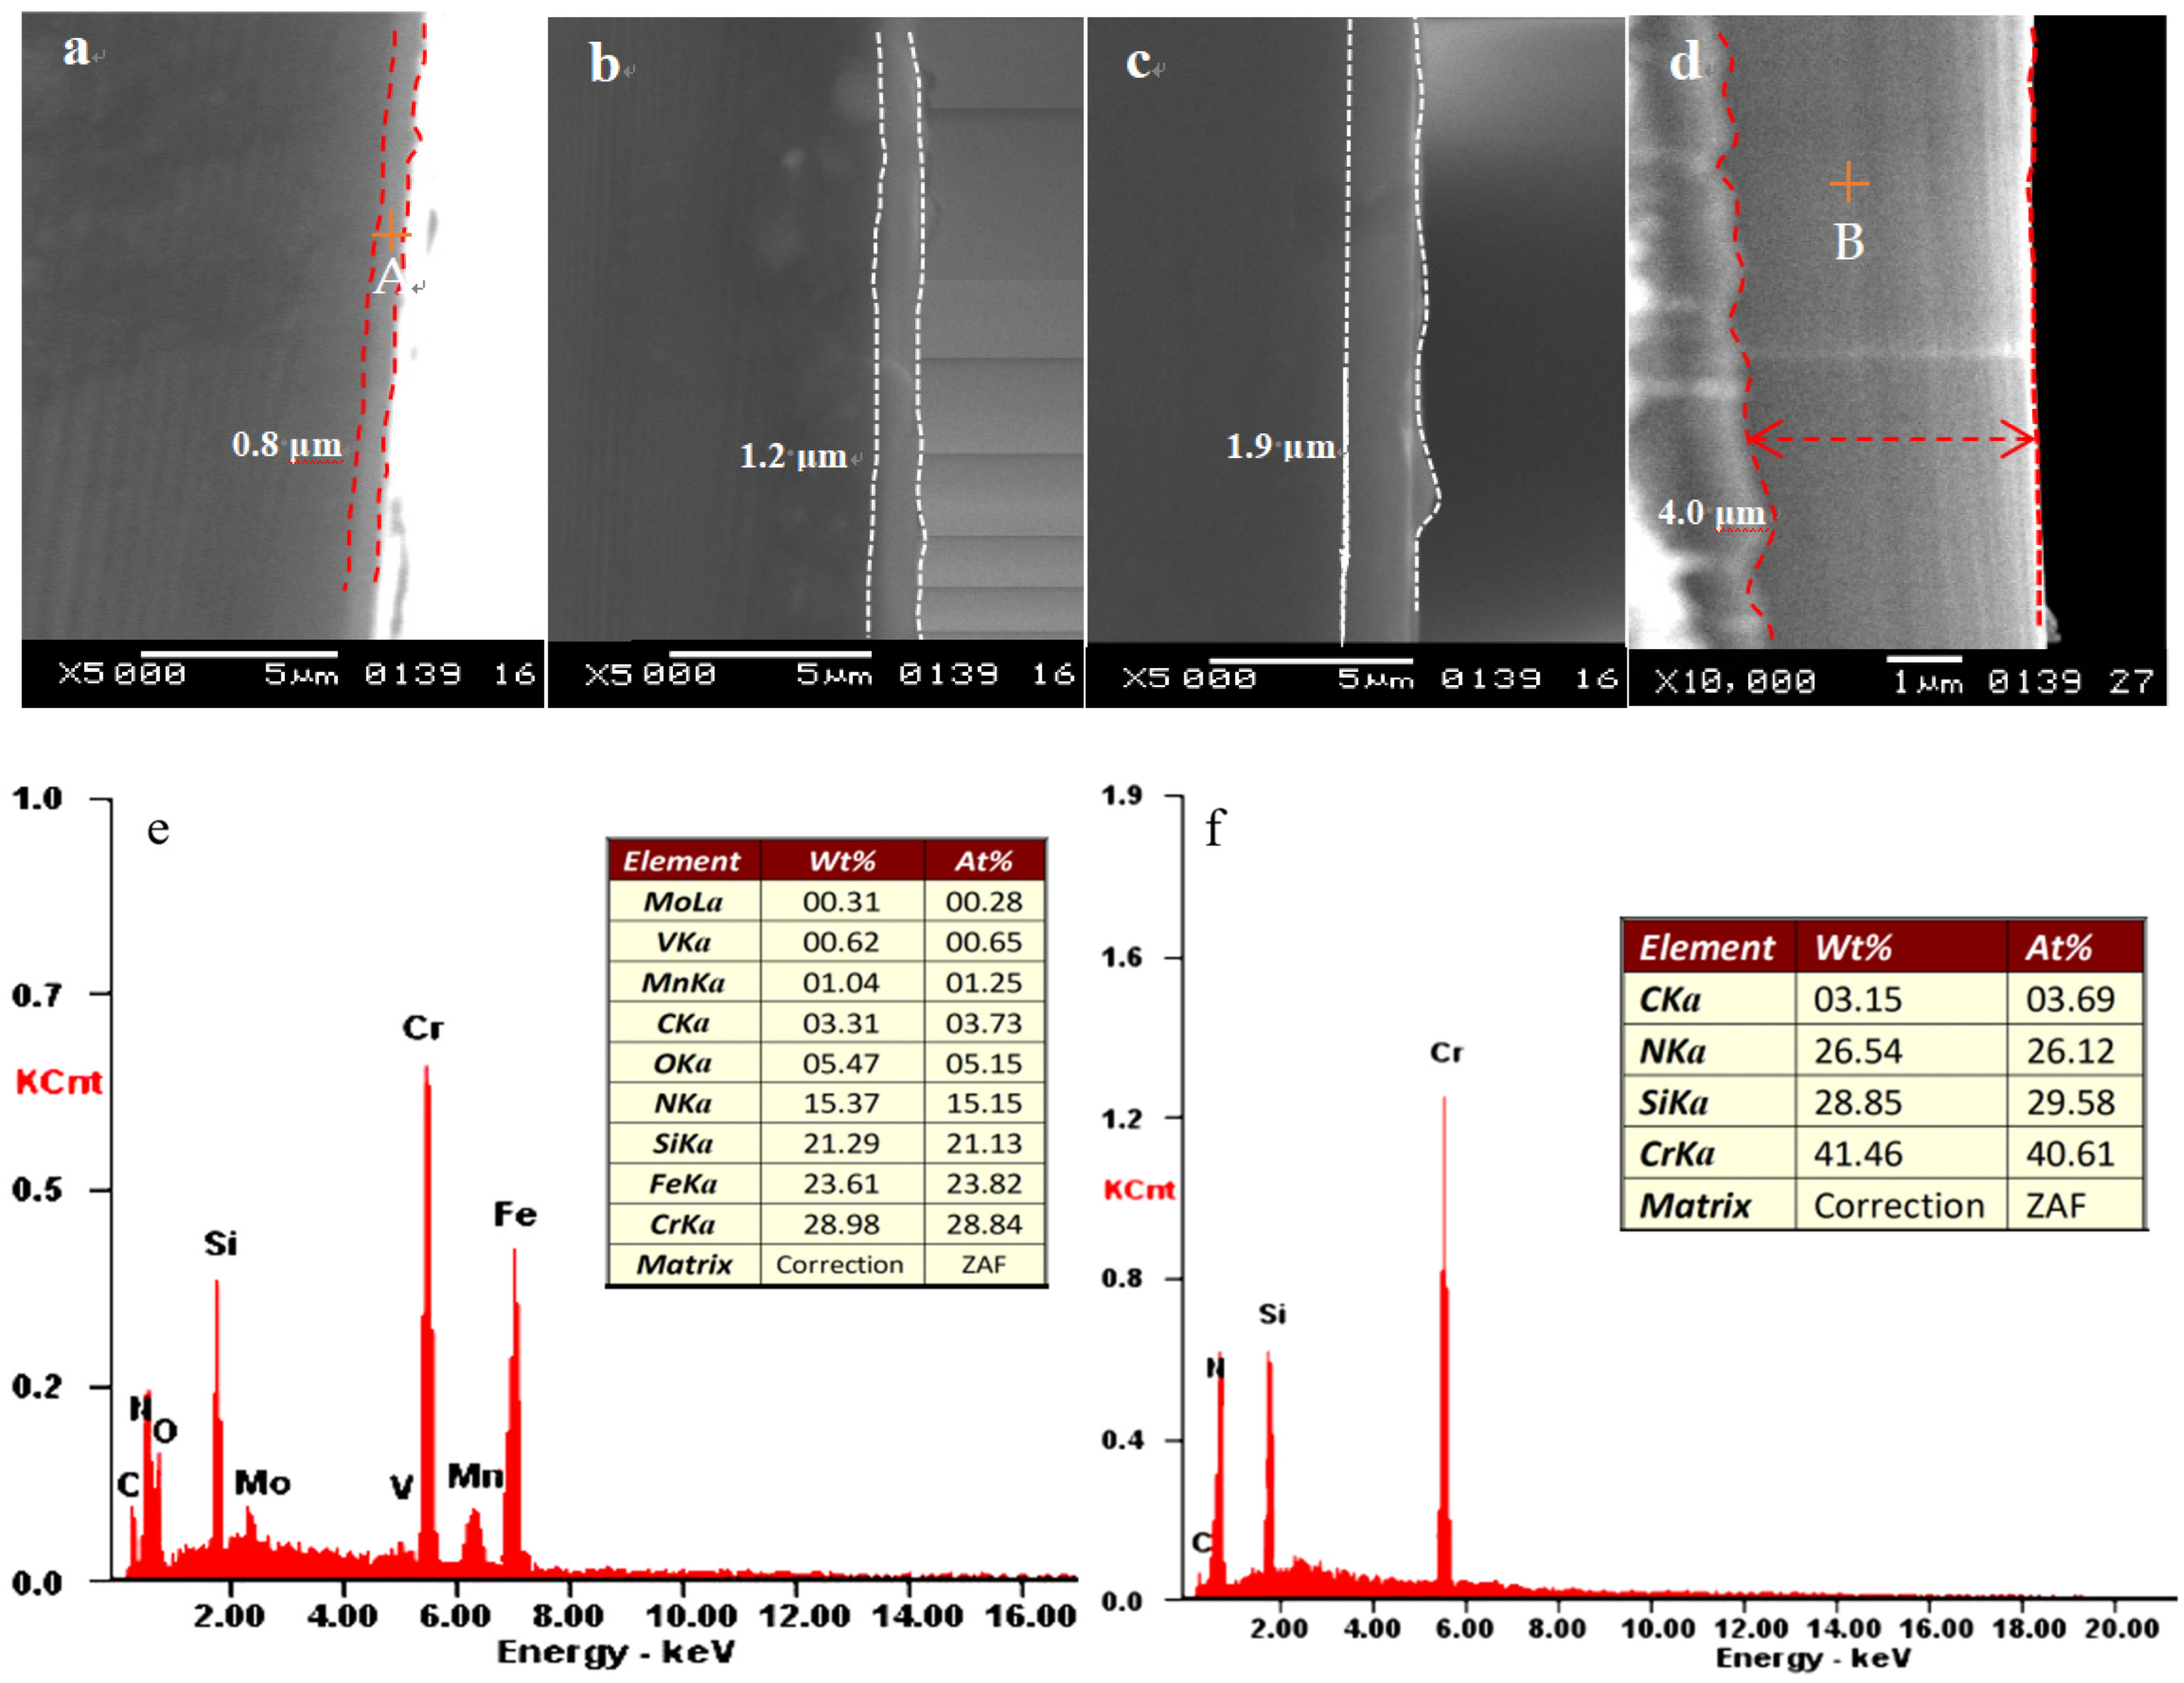
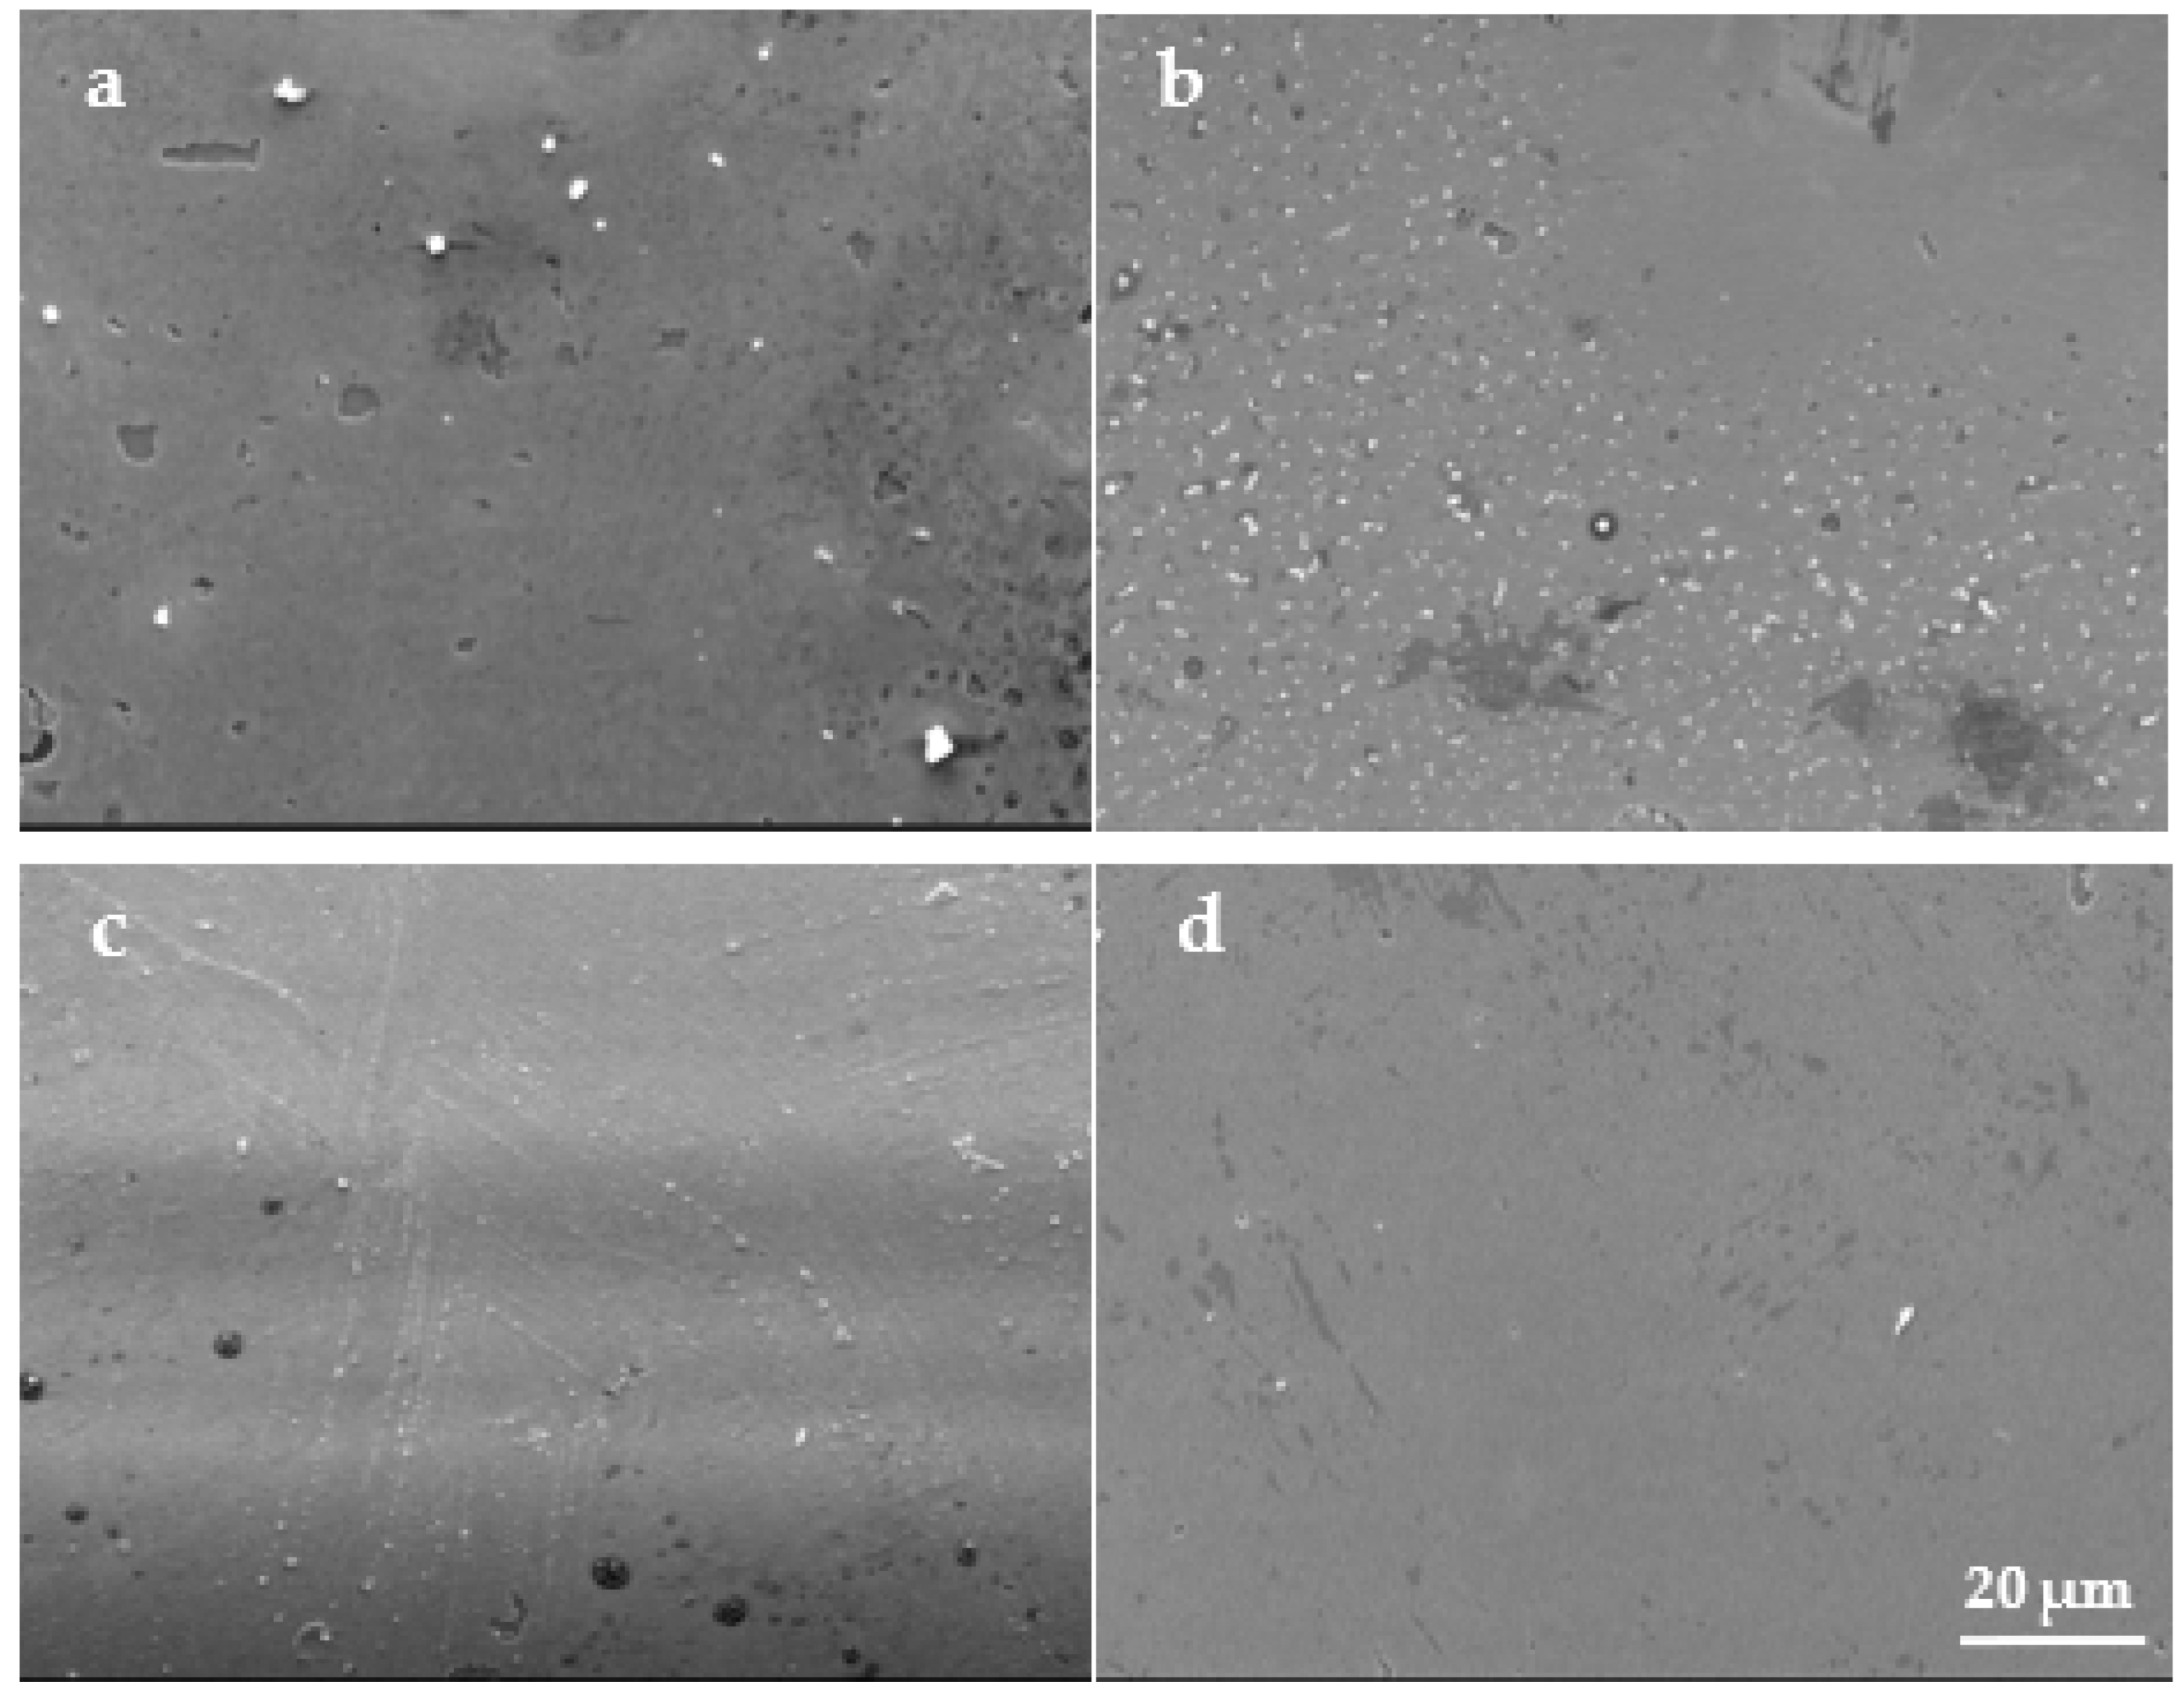
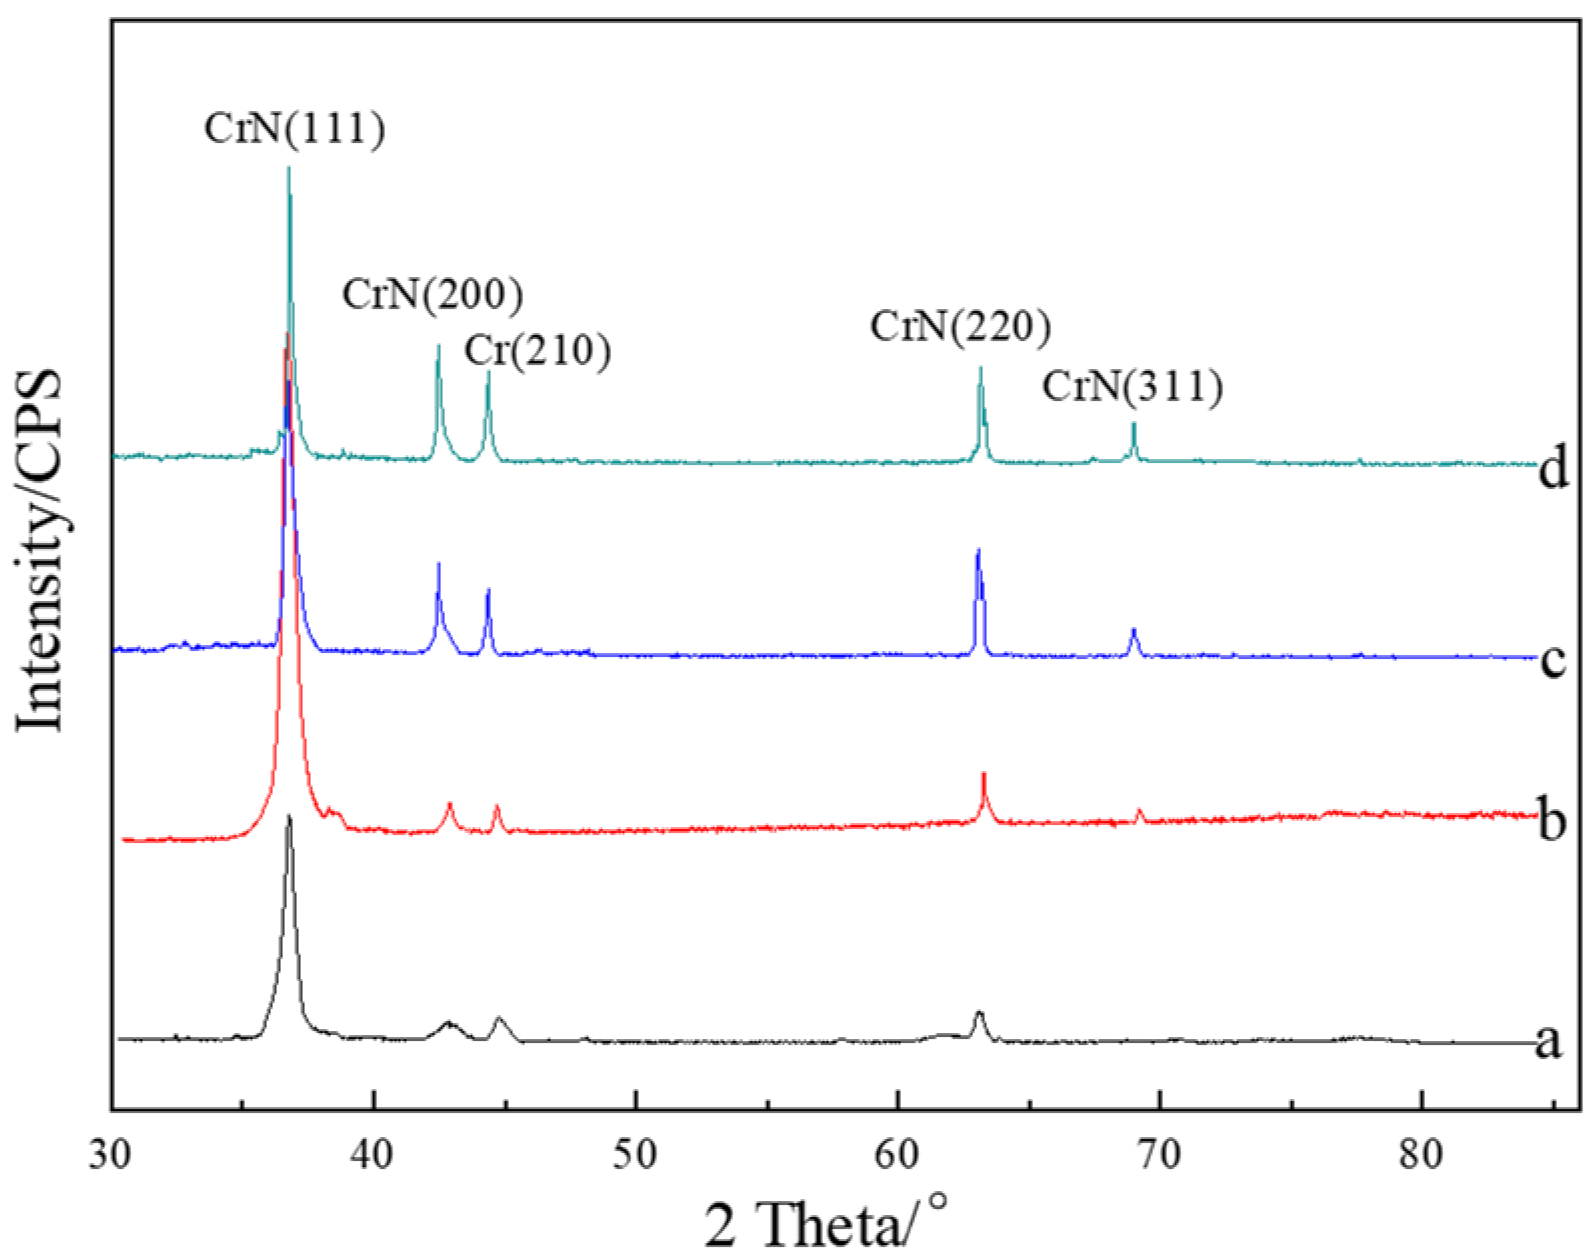
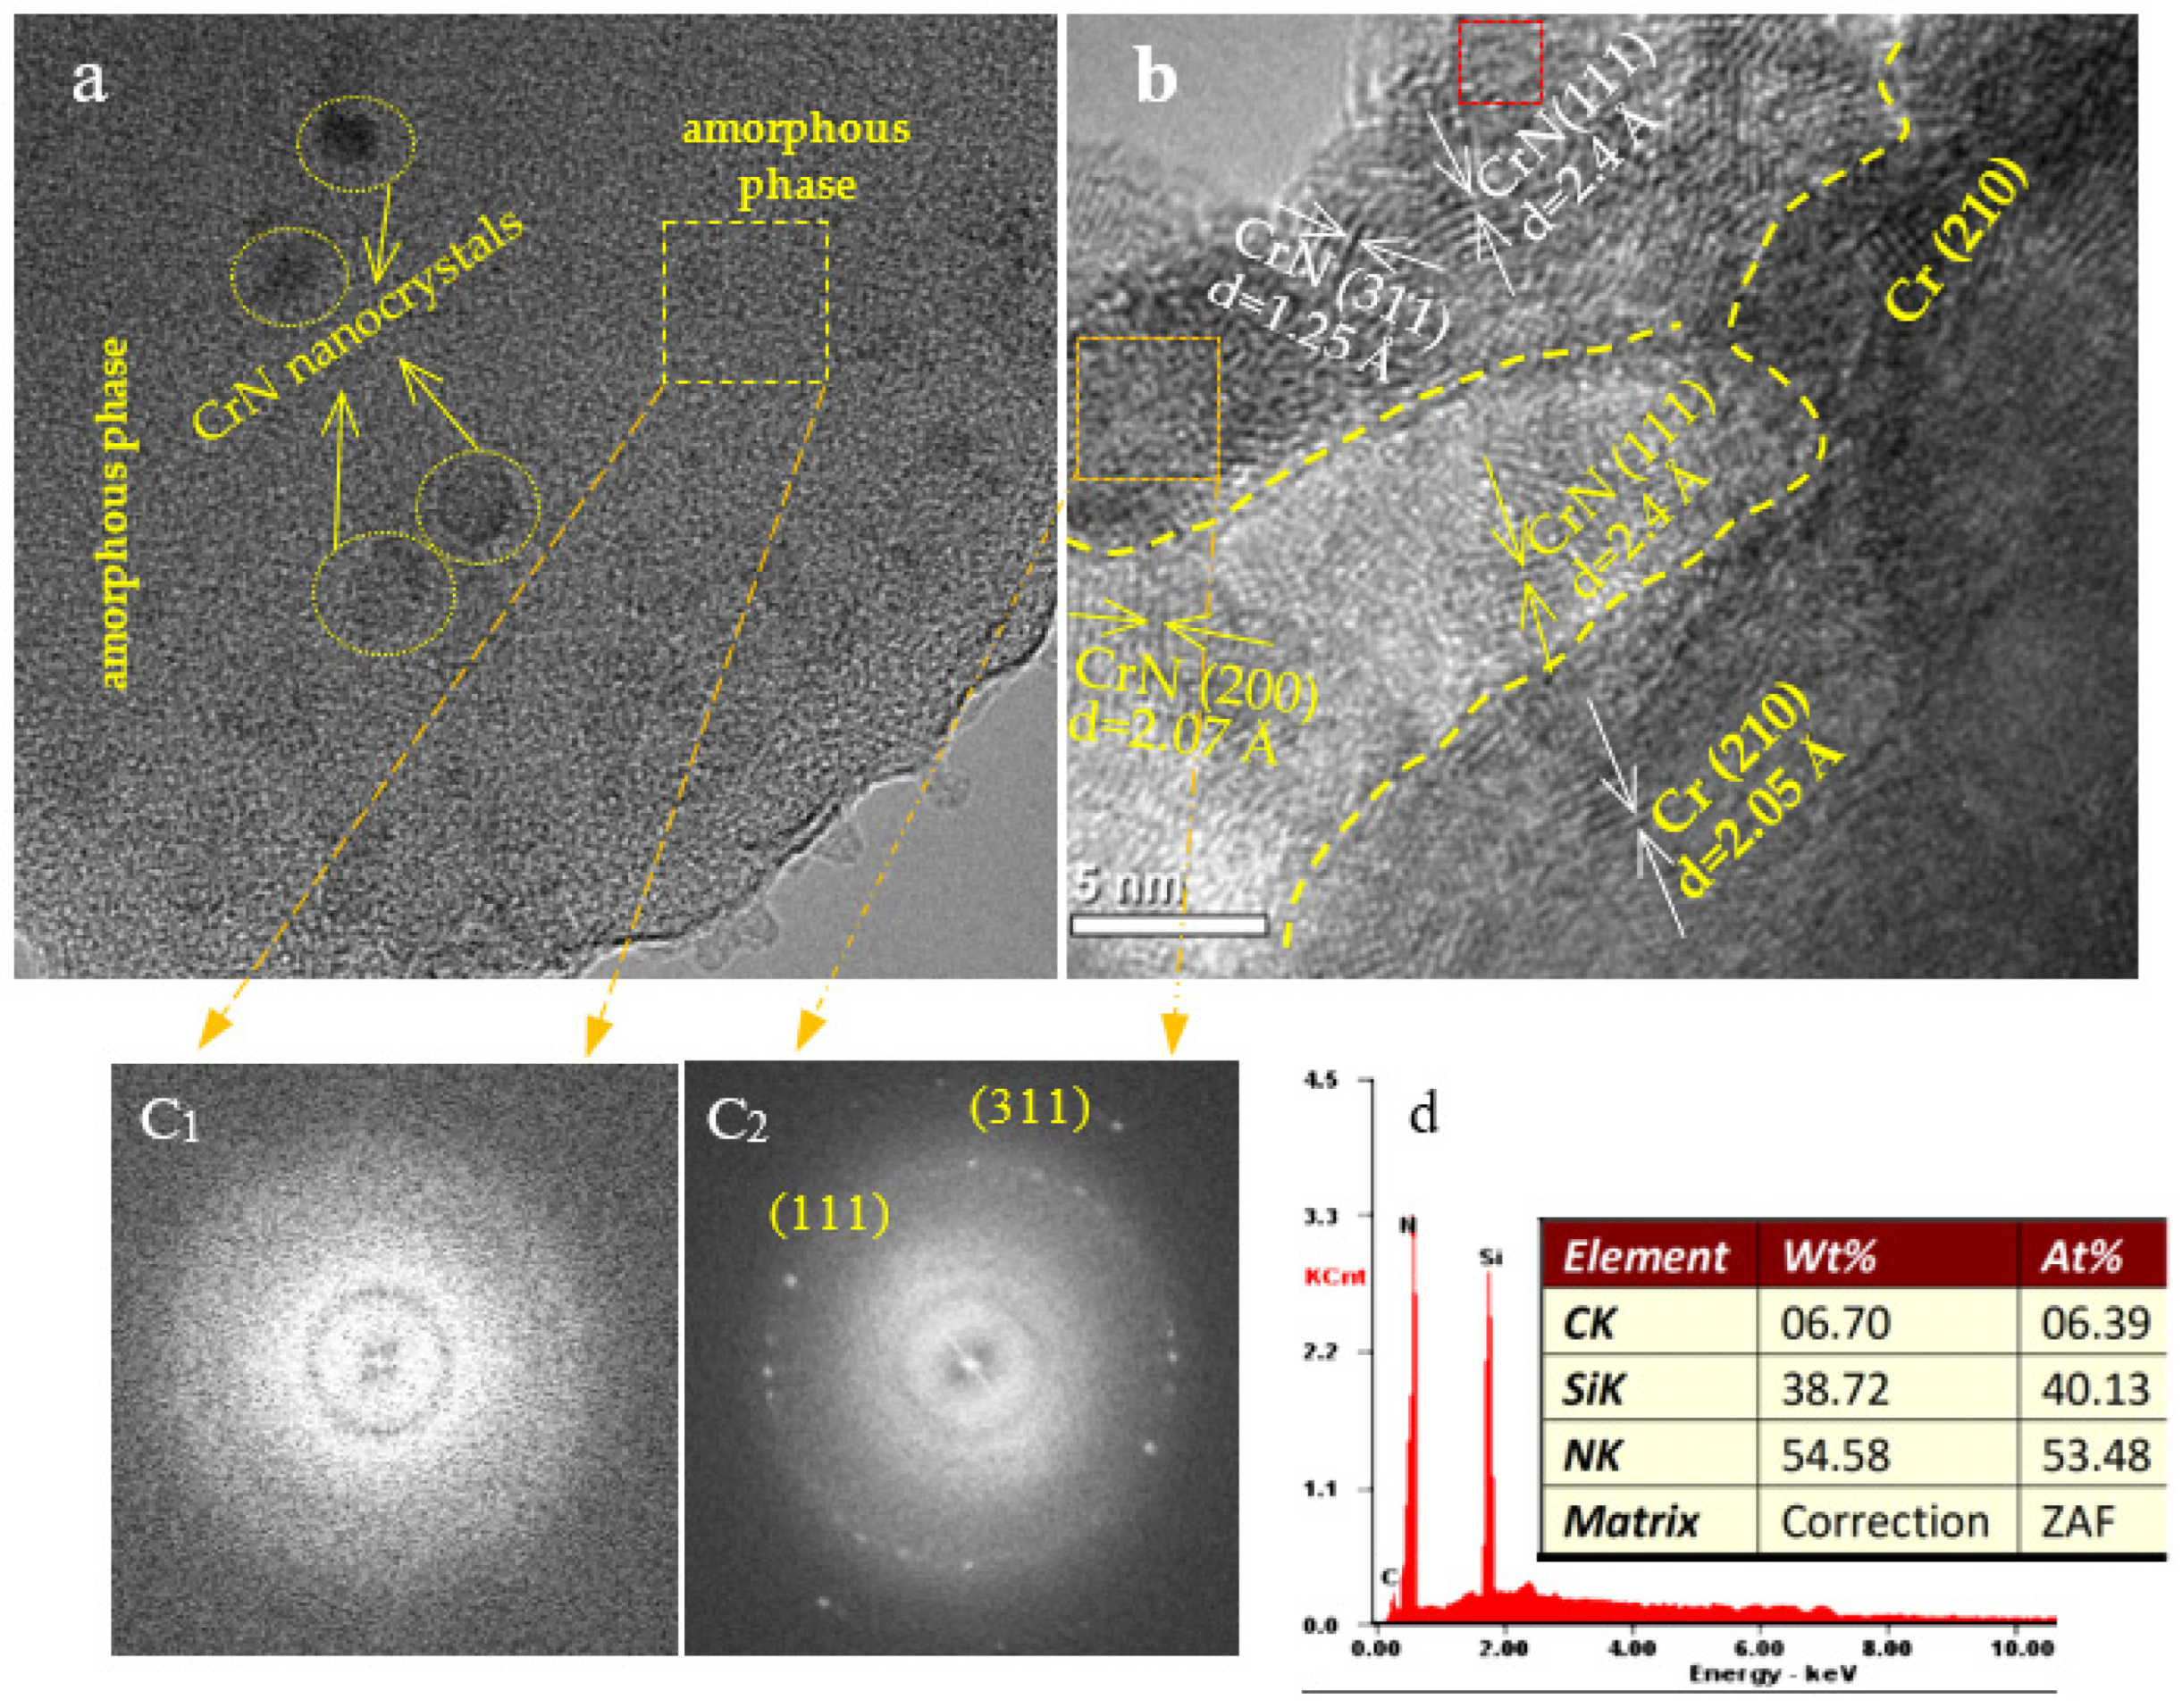
Figure 1a–d show the cross sections of the coatings. It is clearly observed that the thickness of the CrSiN coating increases significantly from 0.8 to 4.0 μm. The thicknesses are 0.8 μm (T1), 1.2 μm (T2), 1.9 μm (T3), and 4.0 μm (T4), respectively. Each interface is well bonded and uniform in thickness, without obvious defects. Moreover, Figure 1a–d show that the CrSiN coating is well-compact, with a relatively flat cross section, no columnar crystal structure, and that each deposited layer is well-bonded to the other without significant pores, leading to its strong resistance to crack expansion. The addition of Si can refine the columnar crystal structure of the coating and improve the compactness of the coating. Figure 1a–d demonstrate that the coating structure becomes compact as the thickness increases. The compact structure is able to avoid the abrupt sinking of the tip during indentation testing, resulting in high hardness. In addition, elemental analysis of point A on the surface of the T1 coating reveals the presence of Fe, Mo, and V, originating from the W18Cr4V substrate, due to the thin thickness of the T1 sample. In addition, C and O are detected on the surface of the T4 coating due to surface contamination. Excluding the effects of surface contamination and matrix elements, we can say that the thickness has little influence on the element content in the coating, and the main components of the coating are Cr, Si, and N.
Figure 2 presents the surface morphology of the four group samples. Figure 2a exhibits some pits and white particles on the film surface, where pits and particles of various sizes and shapes are clearly visible. The broad pits are clearly visible, and the coating is not completely covered or continuous, which leads to a poor surface density. Figure 2b shows the distribution of a large number of small-sized irregular white particles and some pits and pinholes on the surface of the T2 sample. The number of white particles increases but is significantly reduced in size compared with the T1 sample, resulting in a reduction in surface roughness. In addition, the white particles are concentrated mostly in the lower left, while the upper right is smooth and flat, with no visible particles and a reduced number of pits, indicating an improved surface quality for the T2 coating. Figure 2c illustrates that the T3 coating has only a few white particles on its surface, no pits or pores are observed, and it is smooth and flat. Figure 2d shows that the surface of the T4 coating has few shallow pits and white particles, the number of white particles further decreases, and the coating has a smoother surface. The surface morphology in Figure 2 illustrates that the coating roughness decreases and the surface density improves with the increase in coating thickness.

3.1. Microstructure

Figure 3 presents the coating XRD pattern. It is clear that coatings of different thickness have the same shape and crystal plane index of the diffraction peak. There are two types of phase consisting of FCC-CrN phase and Cr phase; the CrN phase corresponds to the (111), (200), (220), and (311) planes (PDF#06-0694), and the Cr phase located at 44.2° corresponds to the (210) index (PDF#19-0323). The CrN phase is formed from the top CrSiN layer, and the Cr phase is formed from the bottom Cr layer. Figure 3 shows that the peak intensity decreases with increasing coating thickness, and the half-width of the diffraction peak increases with an increase of coating thickness, indicating that the grain size of the coating was reduced and more amorphous phases formed. According to Debye–Scherrer, as shown in Equation (1), the grain size reduces a little with an increase in coating thickness—the values are 13.5 nm, 11.8 nm, 10.2 nm, and 8.9 nm, respectively. The reason for the decrease in the grain size with thickness is attributed mainly to thermodynamics. When the coating is deposited for 15 min, the coating thickness is only 0.8 μm, and it tends to grow in a linear fashion, which leads to a relatively high crystallinity in some crystal orientations. On the contrary, the T4 coating with a thickness of 4.0 μm possesses a long time to diffusion and growth. It tends to grow in several orientations; thus, the film is uniform and dense. In addition, no diffraction peaks are detected in Figure 3 for the Si or Si3N4 phases, which is most likely due to the amorphous structure generated by Si with N2 atoms. Therefore, the Si-contained phases are not observed in Figure 3. This is consistent with other studies [10,23].
Figure 4 shows the TEM images of the T4 and T1 coatings. It is clearly observed that the structure of the T4 coating is a mixed structure consisting of tiny CrN nanocrystalline and amorphous phases, combining with the XRD pattern, and we know that the CrN nanocrystal is mainly in the (111) index. The selected area electronic diffraction (SAED) in Figure 4c1 (yellow box area in Figure 4a) demonstrates that the T4 sample formed a large mount of amorphous phases. In contrast, the T1 coating shows a distinct interface consisting of a Cr base layer, a CrN interlayer, and a CrSiN top layer. The Cr layer has the (210) crystal plane with a d-spacing of 2.05 Å, the CrN interlayer shows two indexes of (111) and (200) with d-spacing of 2.4 Å and 2.07 Å, and the CrSiN top layer exhibits d-spaces of 1.25 Å and 2.4 Å, corresponding to the (311) and (111) plane indexes. The SAED image in Figure 4c2 demonstrates the formation of a CrN polycrystalline phase. Following the EDS analysis in the red box region in Figure 4b, we know that this region is dominated by Si and N elements, 40.13 at% and 53.48 at%, respectively, close to 3:4. From this, we deduce that the amorphous phase is Si3N4 and that the structure of the T1 coating is a mixture of CrN polycrystalline and Si3N4 amorphous phases. Figure 4 demonstrates that as the coating thickness increases, the crystallinity of the coating and the size of the grains decrease significantly, which is in strong agreement with the XRD results.

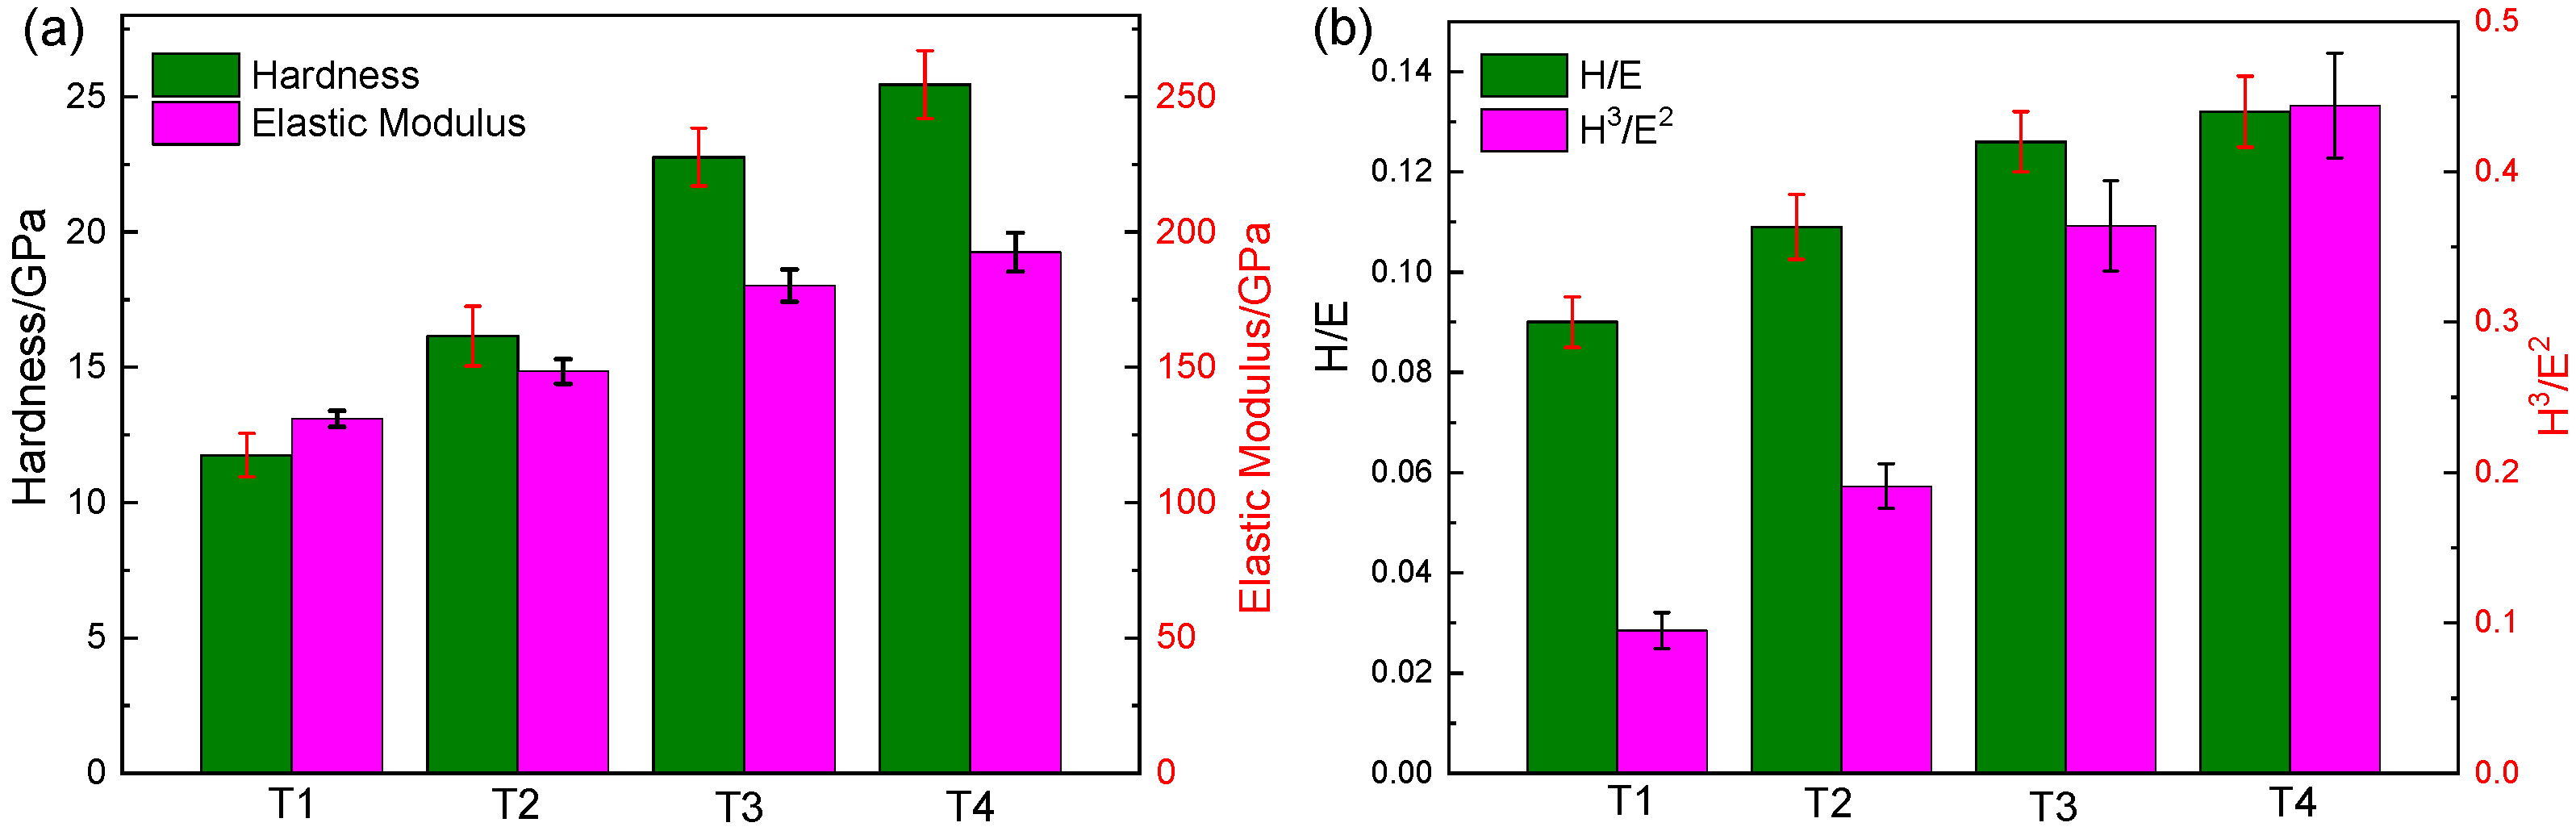
3.2. Mechanical Properties

Table 2 shows the specific parameters of the nano-indentation, and the corresponding plots can be seen in Figure 5. It is visible that the hardness (H) is approximately 11.75 GPa, 16.15 GPa, 22.77 GPa, and 25.45 GPa, respectively, and the elastic modulus (E) is approximately 130.9 GPa, 148.5 GPa, 180.2 GPa, and 192.6 GPa, respectively. Figure 5 illustrates that the values of H and E increase with the deposition thickness, suggesting that the mechanical properties of the coating improve. The results demonstrate the good mechanical properties of the composite structure consisting of the nanocrystalline CrN and the amorphous phase, and the tiny CrN grains help to further enhance the mechanical properties of the coating. This is because the strong interfaces between amorphous phase and CrN nanocrystalline effectively prevented dislocation proliferation and grain boundary sliding, which increased the coating hardness [24].
In addition, the ratios H/E and H3/E2 are two important factors to assess the mechanical properties of the sample, as shown in Table 2 and Figure 5b. The T4 coating exhibits the highest H/E and H3/E2 ratio of all the coatings, and the corresponding values are 0.132 and 0.444, respectively. However, the T1 coating exhibits the lowest H/E and H3/E2 ratios among all the coatings, namely 0.09 and 0.095. Table 2 and Figure 5 suggest that the H/E and H3/E2 values increase with increasing coating thickness. Therefore, it also indicates that an increased coating thickness results in better mechanical properties.
Figure 6 exhibits the relationship between the residual stress and the thickness, according to Equation (2). It is clearly observed that the residual compressive stress of the coating increases with an increasing thickness. When the thickness ranges from 0.8 to 1.9 μm, the increase in residual stress is relatively flat with the thickness. When the coating thickness is in the range of 1.9 to 4.0 μm, the residual stress increases rapidly, and the maximum is −1287 ± 39 MPa when the thickness is approximately 4.0 μm. This demonstrates that the residual stress increases as the thickness increases, especially when the thickness excesses 2.0 μm, which increases the risk of the film peeling off from the matrix due to the high residual stress.
The total stress of the film consists of two parts, an internal stress due to imperfections, defects, and lattice deformations in the crystal, and an external stress due to the lattice mismatch between the film and the substrate and different expansion coefficients. During the film growth process, a fraction of the sputtered particles from the target are inserted into the film. At the same time, as the film grows, surface atoms are moved deeper into the growing film by the bombardment of sputtered particles. The interstitial particles and surface atoms of the sputtered particles result in a reduction of the lattice constant and, hence, of the compressive stress. As a result, the compressive stress increases as the film thickness increases. In addition, as the film grows, the diffraction peak widens, the grain size decreases, the grain strengthening effect increases, and the compressive stress gradually increases due to the impact pinning effect of high-velocity particles. As the film thickness increases, the film hardness gradually increases. When the film thickness is sufficiently large, the composite hardness of the film substrate is essentially the same as that of the film, and the effect of the matrix vanishes.
Figure 7 shows the OM morphology during the scratch test. The adhesion properties of the coatings illustrated in Figure 7 are quite different due to the different mechanical properties and surface densities, as well as the coating thickness. As the coating thickness increases, the adhesion first increases and then decreases. The T1 coating presents an adhesion of 4.8 N, the T2 sample shows an adhesion of 7.2 N, and the T3 coating shows that it does not detach continuously from the substrate throughout the scraping process, indicating its highly bonded nature. In the case of the T4 sample, Figure 7d shows that the decrease in adhesion is due mainly to the larger residual stress, and that the T4 coating undergoes continuous peeling when the dynamic load exceeds 9.9 N, so that the adhesion is defined as 9.9 N, which is lower than that of the T3 coating.
The lowest adhesion that the T1 sample shows is dominated by the surface defects (pits, pinholes, and white particles), and the defects breaks the continuity of the coated surface and leads to an increase in the roughness of the coated surface, which is the main factor responsible for the decrease in the binding force, which leads to the critical load of the T1 coating of approximately 4.8 N. As shown in Figure 7a, a very long white linear scratch is clearly visible, and it is clear that the matrix was exposed continuously at a load of 4.8 N. In summary, Figure 7 illustrates that the adhesion of the coating increases first with an increase in the thickness, then begins to decrease. The complete and smooth surface with few defects, as well as its highest mechanical properties resulted in its highest adhesion among the four groups.

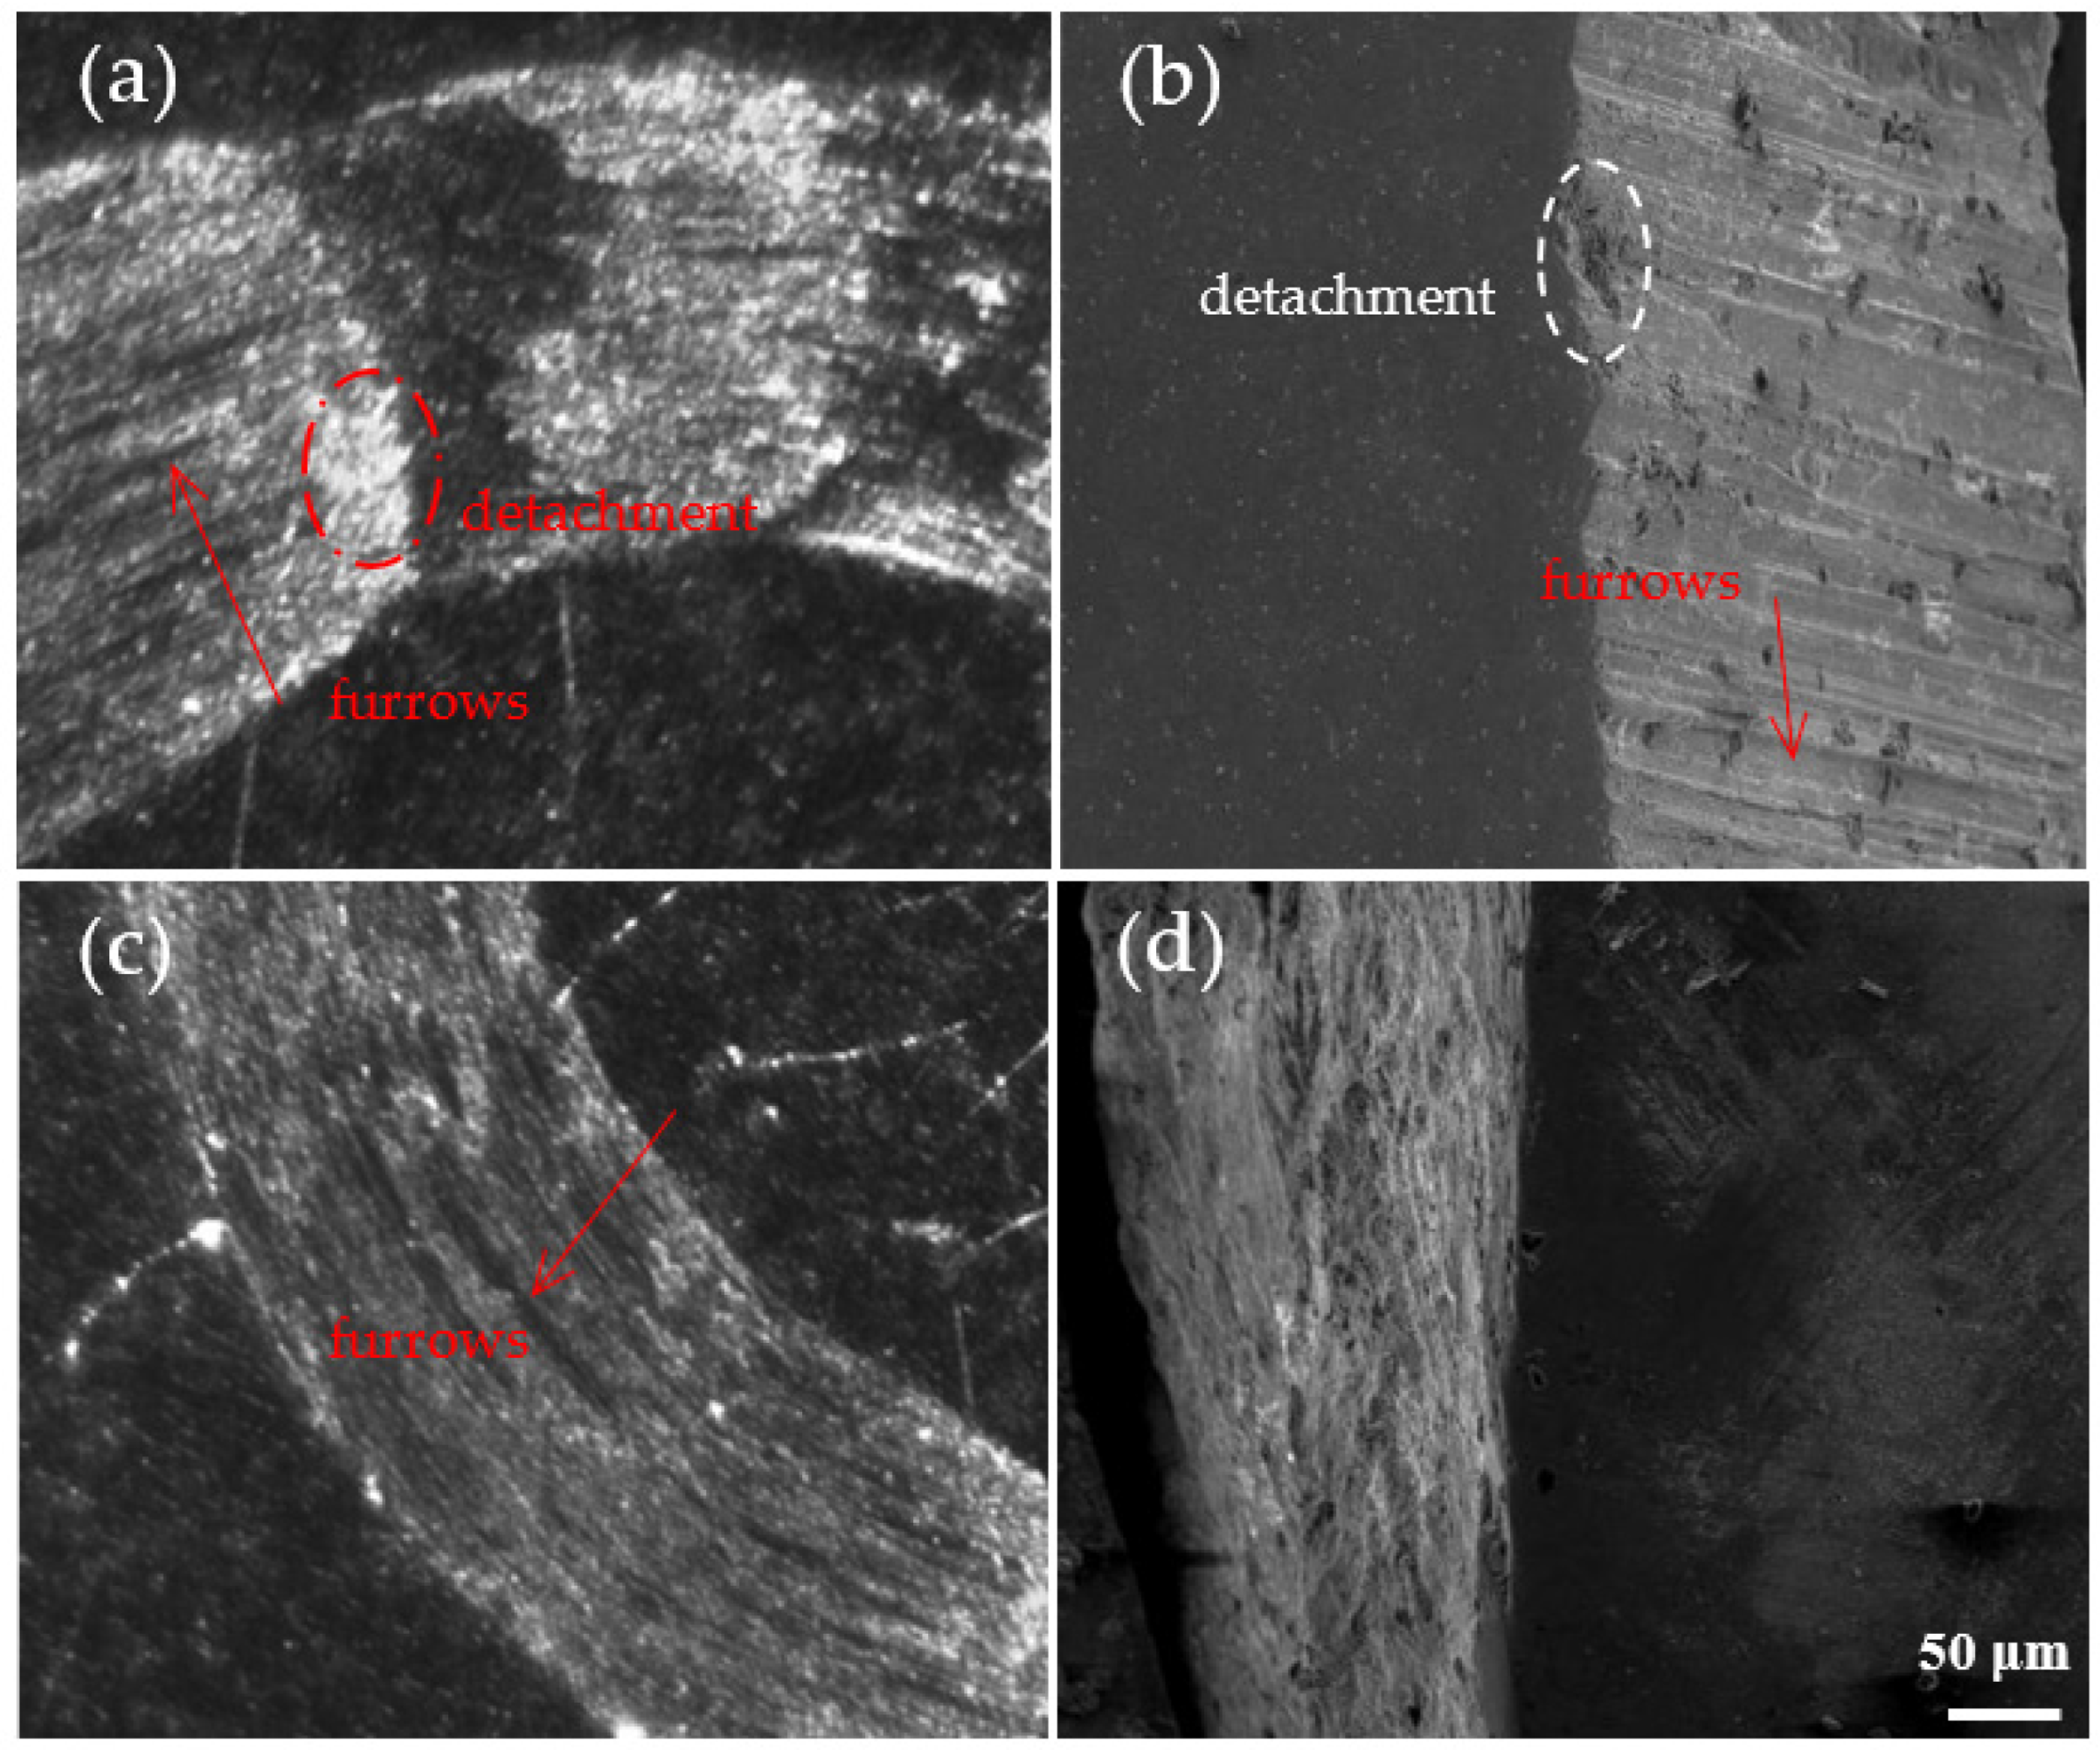
3.3. Wear Resistance

Figure 8 shows the coefficient of friction (COF) and wear loss rate (WLR) of all coatings. Figure 8a illustrates that the COFs of all test samples exhibit an abrupt fluctuation at the very beginning stage. All the CrSiN films exhibit COFs of 0.2~0.5 and WLRs of (5.83~9.05) × 10−7 mm3/N·m. It can be observed that the COF of the T1 coating includes three distinct stages: a run-in period, a continuous decreasing period, and a stable period. During the run-in period, the COF is very high, with a value of approximately 0.88, due to the large actual contact of its defective surface. However, it soon reaches a decreasing stage that exhibits effective protection from the substrate, and this decreasing phase persists for approximately 780 s of the test. The COF then enters a stable period, with a stable value of approximately 0.43. In contrast, the T2 coating is composed of only two phases, including a run-in period and a continuous fluctuation period. During the run-in phase, the COF is approximately 0.5, it soon decreases and increases against at 140 s duration, after which it reaches a stable fluctuation stage with an average value of approximately 0.42. This may be attributed to a mount of white particles which acts as isolation and load-bearing sites, leading to large and persistent fluctuations, in which the wear process is not stable. In the case of T3 and T4 coatings, they exhibit a very smooth friction process with very little fluctuation during the entire friction process, the COFs of them are approximately 0.27 and 0.34, respectively, which is related to grain orientation [25].
Figure 8b displays the WLRs of the samples. It is clear that the T1 coating shows the maximum of 9.05 × 10⁻⁷ mm3/N·m, and the T3 coating has the minimum of 5.83 × 10⁻⁷ mm3/N·m. The WLRs are consistent with COFs, namely, the T1 sample has the worst wear resistance, whereas the T3 sample has the best wear resistance.
Figure 9 shows the wear tracks for the tested samples. Severe scratches and furrows as well as detachments along the wear scar were observed in Figure 9a,b, and several ploughs and some white wear particles appeared, as well as a little black debris distributed around the edges of the wear track, which indicates that the T1 and T2 coatings belong to abrasive wear and adhesive wear [26]. In addition, the track widths of the T1 and T2 coatings are relatively broad, suggesting their relatively poor wear resistance among the four groups. In contrast, Figure 9c,d only show a number of furrows; the appearance of the furrows indicates the coating belongs to abrasive wear [26]. In addition, the track widths of the T3 and T4 coatings are greatly decreased in comparison with the T1 and T2 coatings, especially for the T3 sample, which has the smallest abrasion mark width. From this, we know that the wear mechanisms of coatings are severe abrasive wear and mild adhesive wear. Moreover, as the coating thickness increases from 0.8 to 4.0 μm, the width and depth of the wear track decrease, implying that the wear resistance improves with an increase of coating thickness. The wear resistance of the T4 sample degrades, which is not a result of its surface density and inter-structure, but rather due to the large residual stress resulting from the large thickness.
To further investigate the wear resistance of the coating, the coating toughness was used to illustrate the wear resistance. The H, E, H/E, and H3/E2 values of the hard coatings suggested alternating fracture toughness for evaluating wear resistance, and the coatings with H/E>0.1 possessed high elasticity and wear resistance [15,27,28]. In addition, the high H/E ratio is helpful in decreasing the ploughing effect and obtaining a low COF [26]. In the case of the T4 coating, the values of H, E, H/E, and H3/E2 exhibit maximum values of 25.45, 192.6 0.132, and 0.444 GPa (Table 2), respectively. That is to say, the T4 coating has the best toughness to resist deformation and wear failure. Thus, the COF and WLR of the coating are the lowest, but this does not take into account the effect of the variation of the coating thickness on the residual stress. In fact, Figure 7 demonstrates that the compress residual stress of the T4 sample is much larger than that of the T3 coating, resulting in wear resistance of the T4 coating being lower than that of the T3.
Moreover, for a hard coating, the factors of H/E and H3/E2 are closely related to cracking resistance and plastic deformation, which is often used to assess wear resistance [26,27,28]. From Table 2, it is seen that the T1 coating shows the lowest toughness (H/E = 0.09), and the T3 coating exhibits the highest toughness (H/E = 0.126) and excellent resistance to plastic deformation (H3/E2 = 0.364 GPa). This is also evidence that the T3 coating has good wear resistance. In addition, according to a report [26], higher hardness of the hard coating means higher load-carrying capacity, which is very helpful in reducing plastic yielding and actual contact area with the counterpart, resulting in the amount of wear reduced. However, reports [26,29] tell us that satisfying H/E (>0.1) and H3/E2 (0.15~0.3 GPa) are important conditions for good lubrication and good wear resistance, but the T4 coating in this work has the highest H3/E2 ratio beyond the range of 0.15~0.3 GPa. Therefore, according to all the results in this paper and reports [26,29], the optimal deposition time is 60 min (thickness of 1.9 μm).

4. Conclusions

The effect of thickness on the structure, mechanical properties, and wear resistance of CrSiN films deposited on the surface of W18Cr4V by DC and RF magnetron sputtering is investigated in this work. The details are summarized as follows:
(1)
The crystal phase of coating is a mixture of nano-sized CrN and amorphous Si3N4 phase, and the size of CrN phase reduces as the coating thickness increases.
(2)
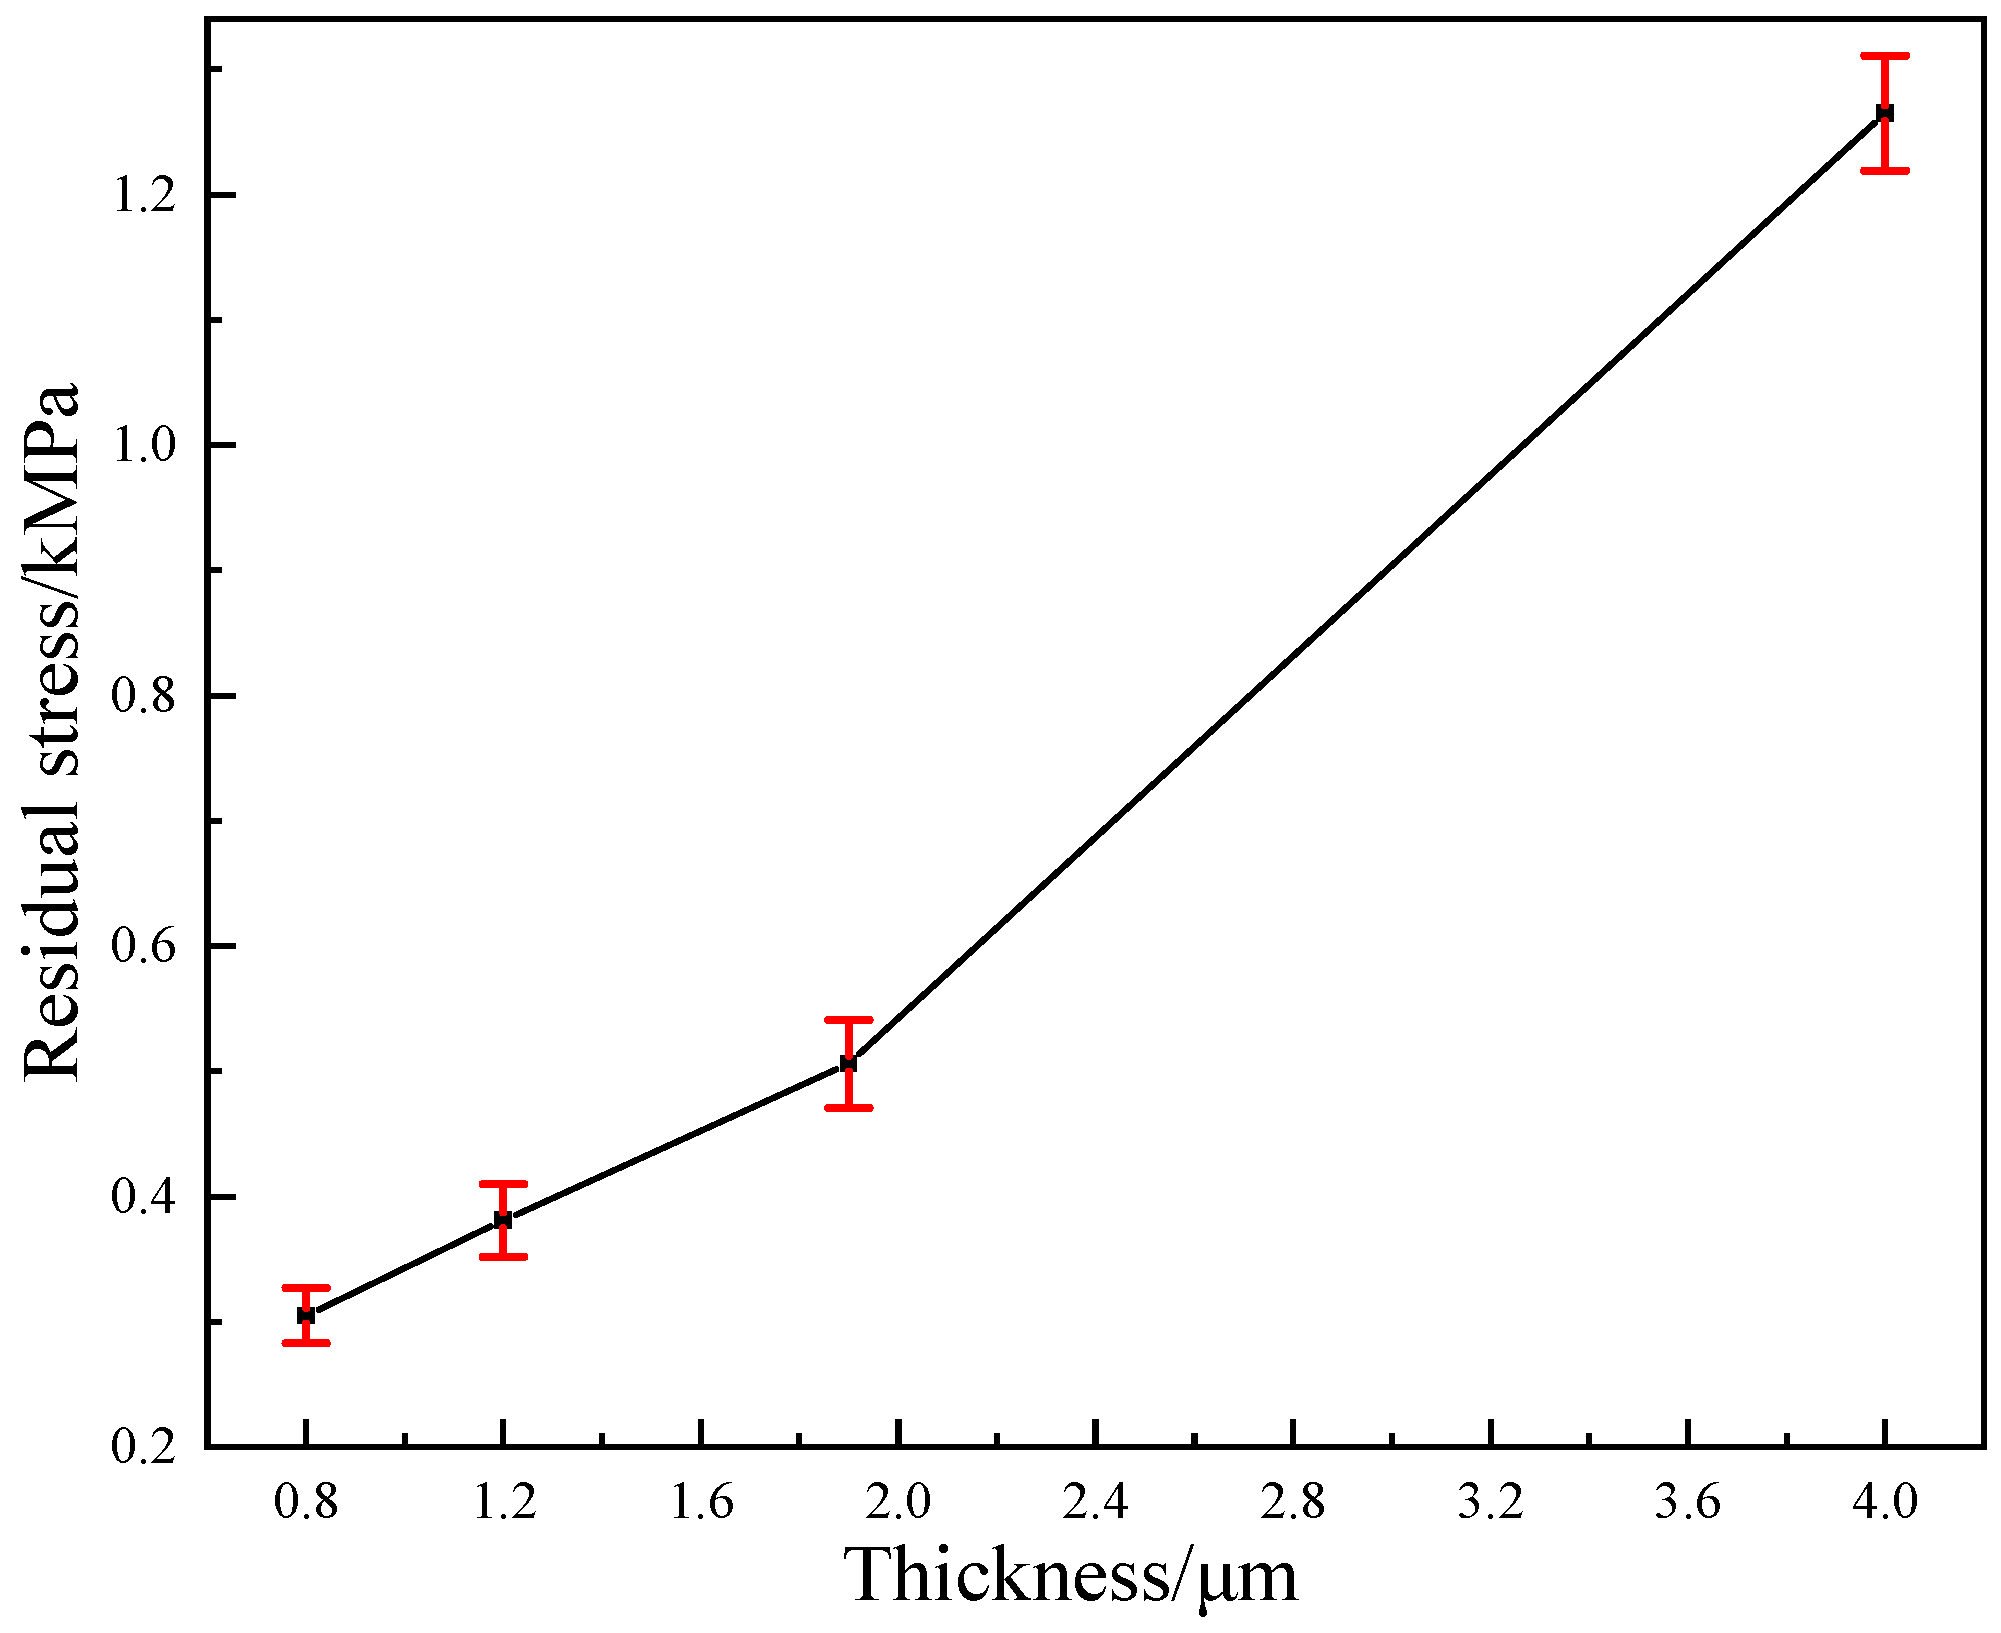
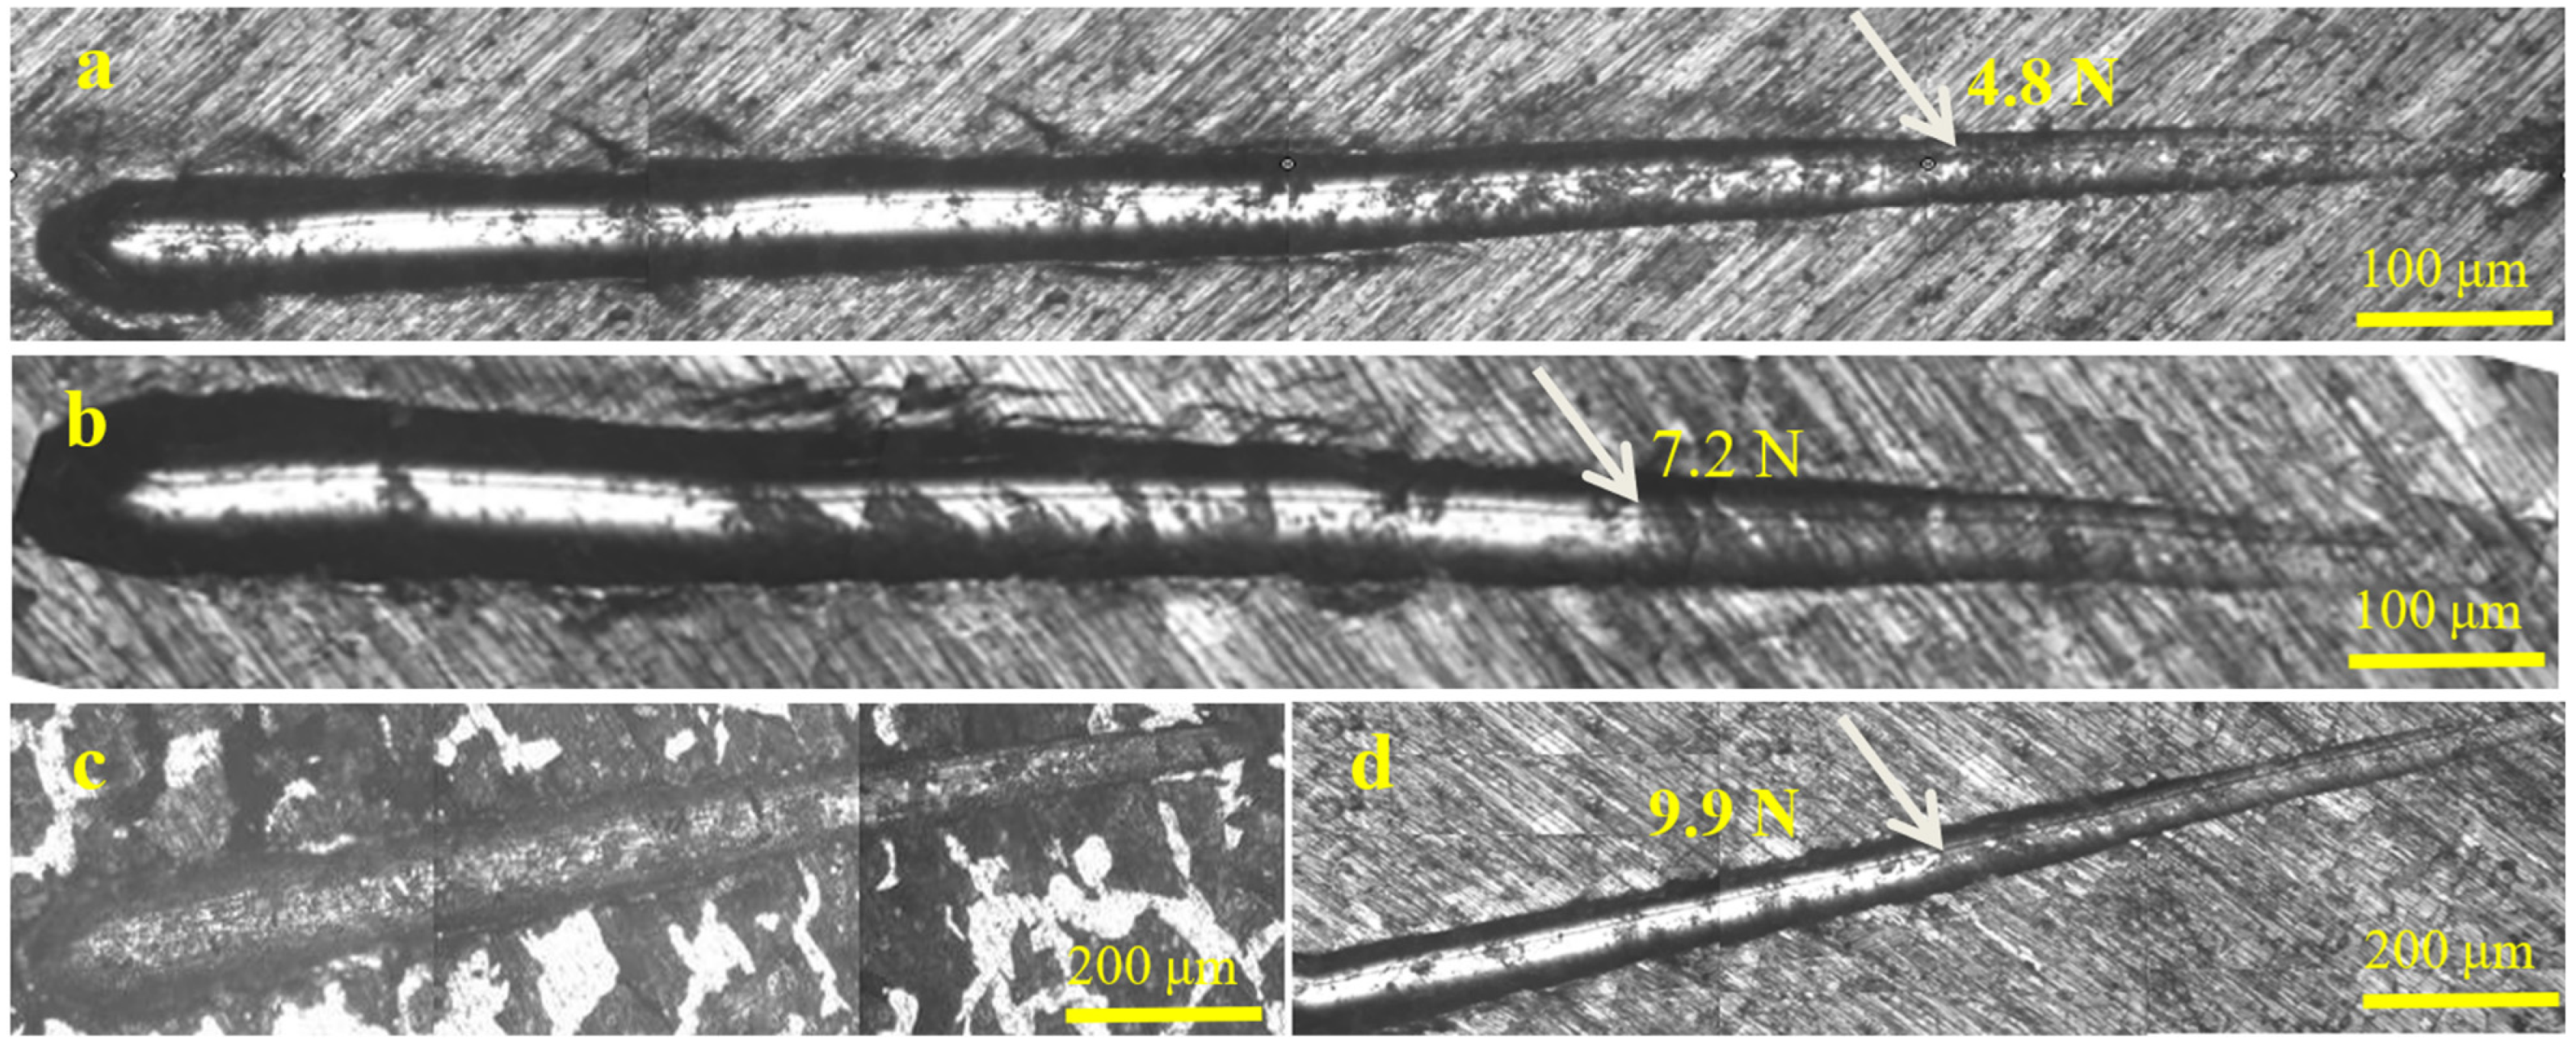
With the increase in coating thickness, the surface roughness, grain size, and the number of defects decrease, whereas the toughness, wear resistance, and mechanical properties significantly improved. The coating is well bonded with the substrate. When the coating thickness increases, the adhesion first increases and then decreases, and the residual stress increases. The T3 sample with a thickness of 1.9 μm has the largest adhesion, and the T4 sample with a thickness of 4.0 μm has the largest compress residual stress.
(3)
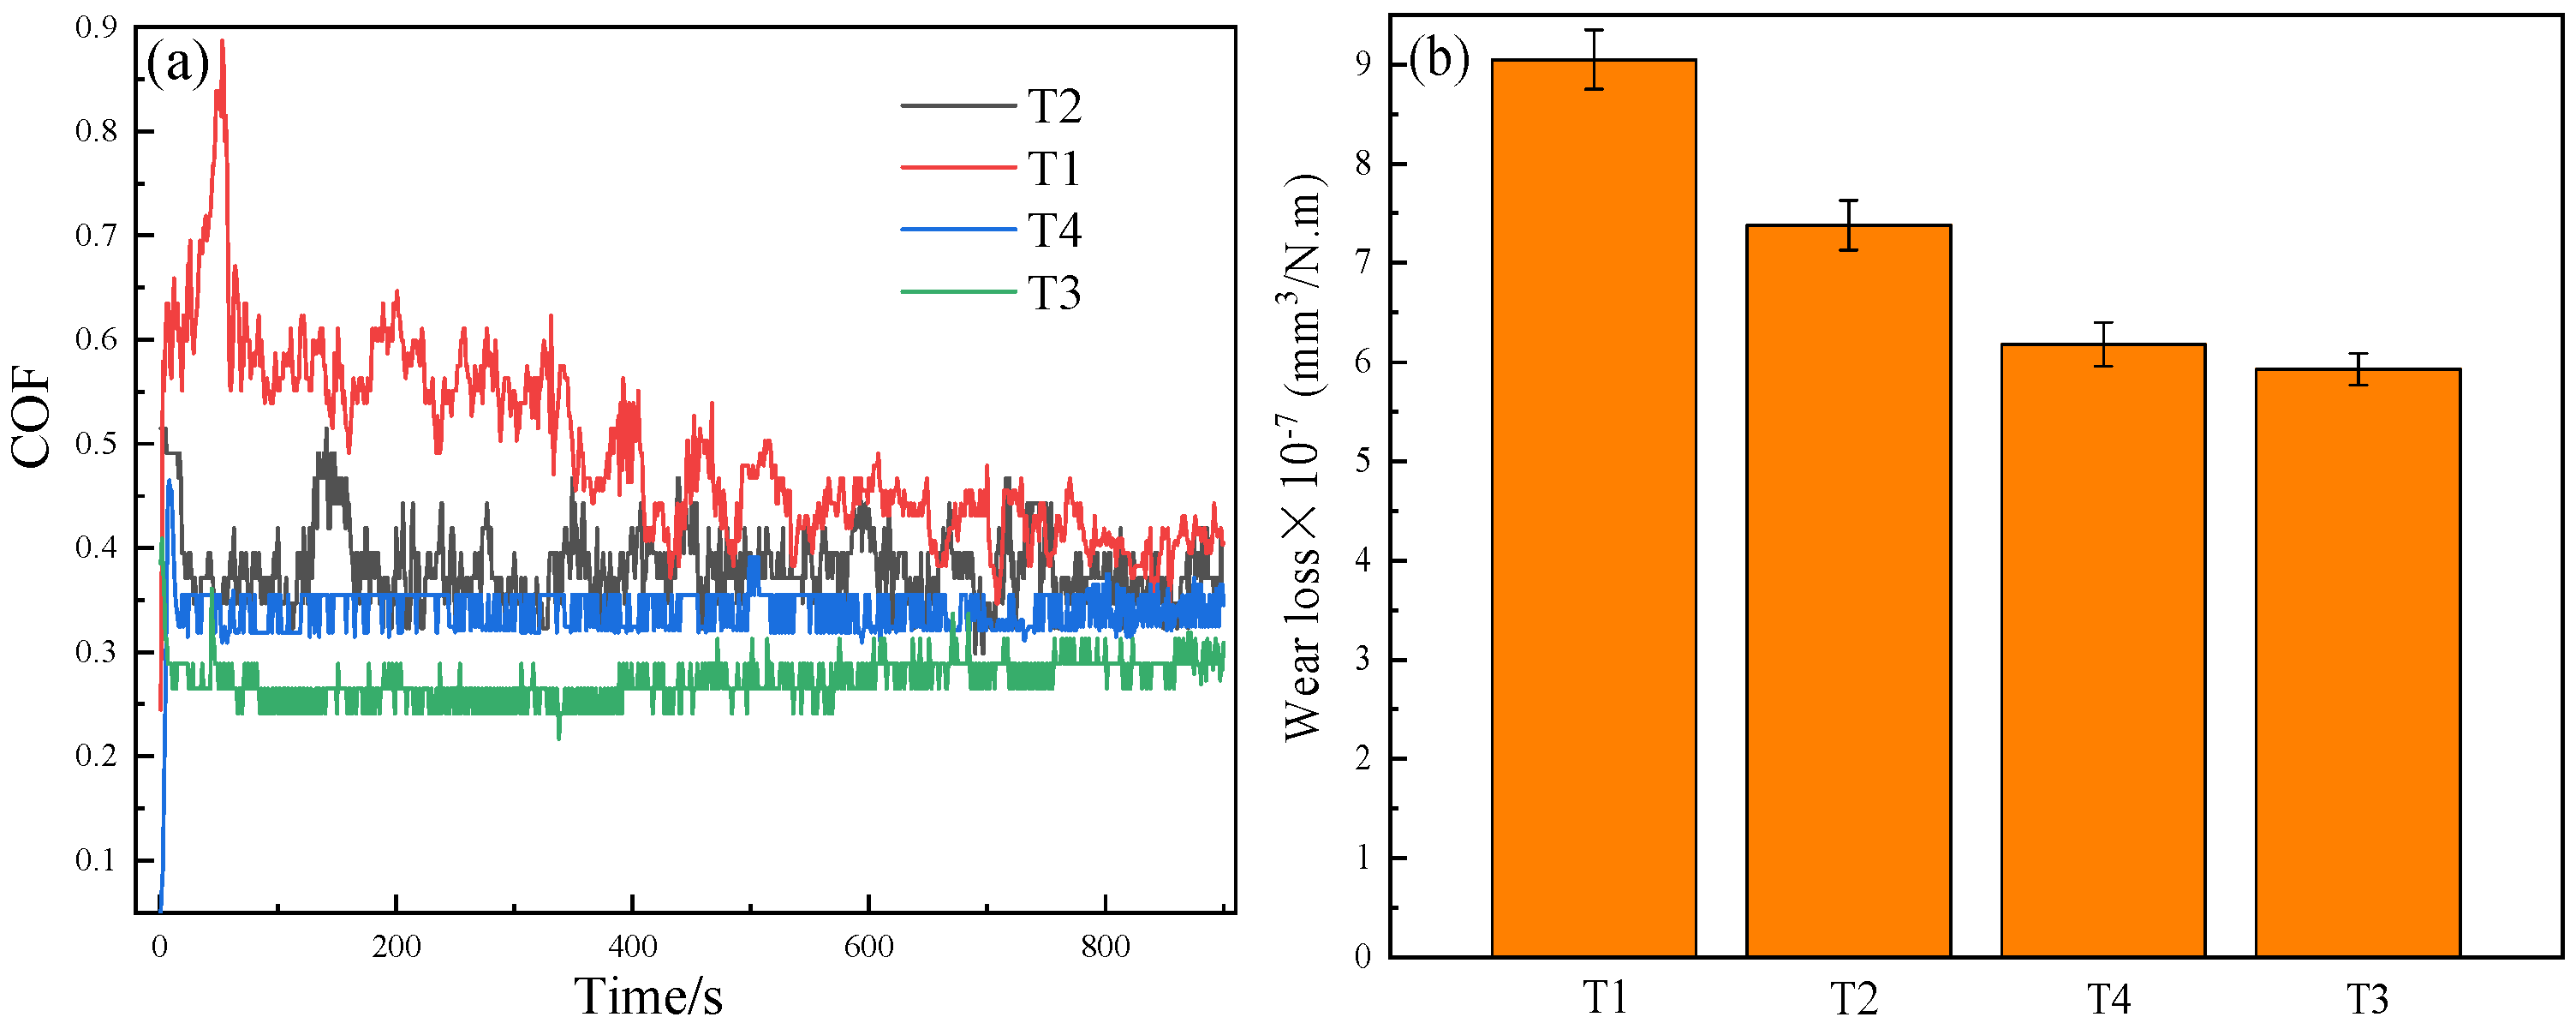
The T4 coating with a thickness of 4.0 μm possesses the highest hardness, elasticity modulus, H/E, and H3/E2 ratios. The T3 coating with a thickness of 1.9 μm possesses the lowest COF and WLR, whereas the T1 coating with a thickness of 0.8 μm possesses the lowest hardness, elasticity modulus, and the highest COF and WLR.
(4)
The toughness and residual stress, which have a close relationship with thickness, are the important factors affecting the wear resistance of the CrSiN coating, but the excessive ratio of H/E and H3/E2 and high residual stress are not helpful in enhancing wear resistance, Thus, in this work, the T3 coating with a thickness of 1.9 μm is preferred for wear resistance application.

Author Contributions

C.C., conceptualization, supervision, writing—original draft, and data curation; C.Y., methodology, investigation, formal analysis, and writing—review and editing. All authors have read and agreed to the published version of the manuscript.

Funding

This research received no external funding.

Institutional Review Board Statement

Not applicable.

Informed Consent Statement

Not applicable.

Data Availability Statement

Not applicable.

Conflicts of Interest

There are no conflict of interest in this work, including financial interests, personal relationships, or other aspects that influence the work published.

References

  1. Cai, F.; Zhang, J.; Wang, J.; Zheng, J.; Wang, Q.; Zhang, S. Improved adhesion and erosion wear performance of CrSiN/Cr multi-layer coatings on Ti alloy by inserting ductile Cr layers. Tribol. Int. 2021, 153, 106657. [Google Scholar] [CrossRef]
  2. Li, H.T.; Sun, P.F.; Cheng, D.H.; Liu, Z.M. Effects of deposition temperature on structure, residual stress and corrosion behavior of Cr/TiN/Ti/TiN films. Ceram. Int. 2021, 47, 34909–34917. [Google Scholar] [CrossRef]
  3. Li, W.; Liu, P.; Meng, J.; Zhang, K.; Ma, F.; Liu, X.; Chen, X.; He, D. Microstructure and mechanical property of TiSiN nanocomposite film with inserted CrAlN nanomultilayers. Surf. Coat. Technol. 2016, 286, 313–318. [Google Scholar] [CrossRef]
  4. Deng, J.X.; Liu, J.H.; Ding, Z.L.; Niu, M. Unlubricated friction and wear behaviors of ZrN coatings against hardened steel. Mater. Des. 2008, 29, 1828–1834. [Google Scholar] [CrossRef]
  5. Leonov, A.A.; Denisova, Y.A.; Denisov, V.V.; Syrtanov, M.S.; Shmakov, A.N.; Savostikov, V.M.; Teresov, A.D. Structure and properties of CrN/TiN multi-layer coatings obtained by vacuum-arc plasma-assisted deposition method. Coatings 2023, 13, 351. [Google Scholar] [CrossRef]
  6. Sugumaran, A.A.; Purandare, Y.; Shukla, K.; Khan, I.; Ehiasarian, A.; Hovsepian, P. TiN/NbN nanoscale multilayer coatings deposited by high power impulse magnetron sputtering to protect medical-grade CoCrMo alloys. Coatings 2021, 11, 867. [Google Scholar] [CrossRef]
  7. Shao, T.; Ge, F.F.; Dong, Y.; Li, K.; Li, P.; Sun, D.E.; Huang, F. Microstructural effect on the tribo-corrosion behaviors of magnetron sputtered CrSiN coatings. Wear 2018, 416–417, 44–53. [Google Scholar] [CrossRef]
  8. Aissani, L.; Alhussein, A.; Zia, A.W.; Mamba, G.; Rtimi, S. Magnetron sputtering of transition metal nitride thin films for environmental remediation. Coatings 2022, 12, 1746. [Google Scholar] [CrossRef]
  9. Tranca, D.E.; Sobetkii, A.; Hristu, R.; Anton, S.R.; Vasile, E.; Stanciu, S.G.; Banica, C.K.; Fiorentis, E.; Constantinescu, D.; Stanciu, G.A. Structural and mechanical properties of CrN thin films deposited on Si substrate by using magnetron techniques. Coatings 2023, 13, 219. [Google Scholar] [CrossRef]
  10. Zhou, Z.C.; Zhang, H.; Zhang, X.; Chang, W.J.; Song, L.L.; Huang, C.; Duo, S.W. Friction and wear behavior of CrSiN coatings deposited by plasma enhanced magnetron sputtering. Surf. Technol. 2020, 8, 185–191. (In Chinese) [Google Scholar]
  11. Wang, Q.M.; Kim, K.H. Microstructure control of Cr-Si-N films by a hybrid arc ion plating and magnetron sputtering process. Acta Mater. 2009, 57, 4974–4987. [Google Scholar] [CrossRef]
  12. Chang, W.J.; Zhang, H.; Chen, Y.Y.; Li, J.; Zhang, X.; Jiang, P.Z.; Fan, X.W.; Duo, S.W. Tribological performances of CrSiN coatings deposited by high power pulse magnetron sputtering. Solid State Phenom. 2018, 281, 540–545. [Google Scholar] [CrossRef]
  13. Chen, H.; Ye, Y.; Wang, C.; Ma, X.; Wang, H.; Liu, W. Understanding the corrosion and tribological behaviors of CrSiN coatings with various Si contents in HCl solution. Tribol. Int. 2019, 131, 530–540. [Google Scholar] [CrossRef]
  14. Shah, H.N.; Jayaganthana, R.; Kaur, D. Influence of reactive gas and temperature on structural properties of magnetron sputtered CrSiN coatings. Appl. Surf. Sci. 2011, 257, 5535–5543. [Google Scholar] [CrossRef]
  15. Chang, L.C.; Sung, M.C.; Chen, Y.I. Effects of bias voltage and substrate temperature on the mechanical properties and oxidation behavior of CrSiN films. Vacuum 2021, 194, 110580. [Google Scholar] [CrossRef]
  16. Sveen, S.; Andersson, J.; M’saoubi, R.; Olsson, M. Scratch adhesion characteristics of PVD TiAlN deposited on high speed steel, cemented carbide and PCBN substrates. Wear 2013, 308, 133–141. [Google Scholar] [CrossRef]
  17. Capote, G.; Silva, G.F.; Trava-Airoldi, V.J. Effect of hexane precursor diluted with argon on the adherent diamond-like properties of carbon films on steel surfaces. Thin Solid Film. 2015, 589, 286–291. [Google Scholar] [CrossRef]
  18. Wang, W.L.; Yu, L.H.; Xu, J.H. Preparation of CrSiN-Ag films and evaluation of their properties. Mater. Prot. 2018, 51, 12–17. (In Chinese) [Google Scholar]
  19. Li, H.T.; Sun, P.F.; Cheng, D.H. Structure and properties of a-C:H:Si:O films deposited by cage-like hollow cathode discharge on AZ31 alloy. Tribol. Int. 2022, 175, 107848. [Google Scholar] [CrossRef]
  20. Li, H.T.; Sun, P.F.; Cheng, D.H. Structure and properties of DLC films deposited on Mg alloy at different C2H2 flows of magnetron sputtering process. Coatings 2021, 11, 815. [Google Scholar] [CrossRef]
  21. Daghbouj, N.; Sen, H.; Čížek, J.; Lorinčík, J.; Karlík, M.; Callisti, M.; Čech, J.; Havránek, V.; Li, B.; Krsjak, V.; et al. Characterizing heavy ions-irradiated Zr/Nb: Structure and mechanical properties. Mater. Des. 2022, 219, 110732. [Google Scholar] [CrossRef]
  22. Bouabibsa, I.; Lamri, S.; Sanchette, F. Structure, mechanical and tribological properties of Me-doped diamond-like carbon (DLC) (Me=Al, Ti or Nb) hydrogenated amorphous carbon coatings. Coatings 2018, 8, 370. [Google Scholar] [CrossRef]
  23. Zhu, L.-H.; Song, C.; NI, W.-Y.; Liu, Y.-X. Effect of 10% Si addition on cathodic arc evaporated TiAlSiN coatings. Trans. Nonferrous Met. Soc. China 2016, 26, 1638–1646. [Google Scholar] [CrossRef]
  24. Su, K.; Liu, D.M.; Shao, T.M. Microstructure and mechanical properties of TiAlSiN nano-composite coatings deposited by ion beam assisted deposition. Sci. China (Technol. Sci.) 2015, 58, 1682–1688. [Google Scholar] [CrossRef]
  25. AlMotasem, A.T.; Daghbouj, N.; Sen, H.S.; Mirzaei, S.; Callisti, M.; Polcar, T. Influence of HCP/BCC interface orientation on the tribological behavior of Zr/Nb multilayer during nanoscratch: A combined experimental and atomistic study. Acta Mater. 2020, 249, 118832. [Google Scholar] [CrossRef]
  26. Cao, H.S.; Liu, F.J.; Li, H.; Luo, W.Z.; Qi, F.G.; Lu, L.W.; Zhao, N.; Ouyang, X.P. Effect of bias voltage on microstructure, mechanical and tribological properties of TiAlN coatings. Trans. Nonferrous Met. Soc. China 2022, 32, 3596–3609. [Google Scholar] [CrossRef]
  27. Chen, X.; Du, Y.; Chung, Y.W. Commentary on using H/E and H3/E2 as proxies for fracture toughness of hard coatings. Thin Solid Film. 2019, 688, 137265. [Google Scholar] [CrossRef]
  28. Li, H.; Liu, Z.; Li, J.; Huang, J.; Kong, J.; Wu, Q.; Xiong, D. Effects of Hf addition on the structure, mechanical and tribological properties of CrN film. Surf. Coat. Technol. 2020, 397, 126067. [Google Scholar] [CrossRef]
  29. Musil, J.; Novák, P.; Čerstvý, R.; Soukup, Z. Tribological and mechanical properties of nanocrystallineTiC/a-C nanocomposite thin films. J. Vac. Sci. Technol. A 2010, 28, 244–249. [Google Scholar] [CrossRef]
Figure 1. Cross section of the samples, (a) T1; (b) T2; (c) T3; (d) T4; (e) EDS analysis of the point A; and (f) EDS analysis of the point B.
Coatings 13 00889 g001
Figure 2. Surface morphology of the coatings: (a) T1; (b) T2; (c) T3; and (d) T4.
Coatings 13 00889 g002
Figure 3. XRD patterns of the coating: a—T4; b—T3; c—T2; and d—T1.
Coatings 13 00889 g003
Figure 4. TEM images of the samples: (a) T4; (b) T1; (c1) SAED image of the T4, (c2) SAED image of the T1 and (d) EDS analysis of the red box area in (b).
Coatings 13 00889 g004
Figure 5. Mechanical property index of the nano-indentation test: (a) H and E; (b) Elasticity factor (H/E) and shaping factor (H3/E2).
Coatings 13 00889 g005
Figure 6. Relationship between residual stress and coating thickness.
Coatings 13 00889 g006
Figure 7. Scratch morphology of the coatings taken by OM: (a) T1; (b) T2; (c) T3; and (d) T4.
Coatings 13 00889 g007
Figure 8. Results of friction–wear test: (a) Friction coefficient and (b) Wear loss rate.
Coatings 13 00889 g008
Figure 9. Wear tracks of the coatings: (a) T1; (b) T2; (c) T4; and (d) T3.
Coatings 13 00889 g009
Table 1. Processing parameters for coating deposition.
LayerBias Voltage
(V)
Ar Flow
(sccm)
N2 Flow
(sccm)
Power
DC(A)/RF(W)
Time
(min)
Cr−503000.5/05
CrN−5030100.5/010
CrSiN−5030100.5/18015, 30, 60, 120
Table 2. The specific parameters of the nano-indentation test.
ParametersT1T2T3T4
H/GPa11.75 ± 0.8016.15 ± 1.1022.77 ± 1.0725.45 ± 1.25
E/GPa130.9 ± 3.0148.5 ± 4.5180.2 ± 6.0192.6 ± 7.2
H/E0.090 ± 0.0050.109 ± 0.00650.126 ± 0.0060.132 ± 0.0071
H3/E2(GPa)0.095 ± 0.0120.191 ± 0.0150.364 ± 0.0300.444 ± 0.035
Disclaimer/Publisher’s Note: The statements, opinions and data contained in all publications are solely those of the individual author(s) and contributor(s) and not of MDPI and/or the editor(s). MDPI and/or the editor(s) disclaim responsibility for any injury to people or property resulting from any ideas, methods, instructions or products referred to in the content.

