
Study of Structural, Mechanical, and Corrosion Resistance of a Nanocomposite CrSiN/CrN/Cr Coating Deposited on AZ31: Effects of Deposition Time
1
College of Mechanical Engineering, Baicheng Normal University, Baicheng 137000, China
2
College of Computer Science, Baicheng Normal University, Baicheng 137000, China
*
Author to whom correspondence should be addressed.
Coatings 2023, 13(4), 678; https://doi.org/10.3390/coatings13040678
Submission received: 5 March 2023
/
Revised: 18 March 2023
/
Accepted: 23 March 2023
/
Published: 26 March 2023
(This article belongs to the Special Issue Advances in Corrosion Resistant Coatings)
Abstract
:To improve the surface properties of Mg alloys and expand the applications of CrN-based materials, composite CrSiN coatings consisting of amorphous Si3N4 and nano CrN phases have been prepared on AZ31 based on the theory of fine grain strengthening and multigrain boundaries. The effect of the thickness of the coating on the structure and properties was investigated. The microstructure was studied by means of X-ray diffraction (XRD), scanning electron microscope (SEM) and transmission electron microscope (TEM). The mechanical properties, adhesion properties, and corrosion resistance were investigated using a nanoindentater, scratch testers, and electrochemical workstations. The results show that the coating consists of a face-centered cubic CrN phase, that Si3N4 is not found in the diffraction pattern, and that the HRTEM images show a composite structure of amorphous and nanocrystalline phases. With the increase in deposition time (thickness), the surface roughness decreases, the defects disappear, and the interface has no visible defects. Moreover, the hardness and elastic modulus of the coating increase, corrosion resistance improves, adhesion performance first increases and then decreases. The adhesion between coating and substrate reaches the maximum when sputtering time is 50 min, which corresponds to the CrSiN thickness of 0.79 μm.
1. Introduction
Magnesium alloys have attracted much attention in the aerospace, automotive, biomedical, electronics, and military industries due to their very low density, high strength-to-weight ratio, good ductility, good vibration and shock absorption, and great recovery potential. However, their disadvantages such as low hardness, poor wear and corrosion resistance have limited their further applications. Therefore, the surface properties of magnesium alloys need to be improved. Hard coatings which can endow Mg alloys with higher hardness, anti-corrosion, and wear resistance have been widely used to improve the surface properties of Mg alloys [1,2,3,4]. For instance, CrSiN coatings, especially nanocomposite CrSiN coatings have been used extensively in recent years. It is a kind of coating with high performance that is achieved by adding Si element to the traditional nitride hard coating to form an amorphous atomic layer (a-Si3N4) covering the nano microstructure of the nitride hard phase [5,6,7]. This kind of coating has the effect of fine crystal strengthening of the micro-nano structure and nailing of dislocation by grain boundaries, resulting in a high hardness of the coating [5,6,7]. In addition, amorphous atomic layers have attracted a lot of attention from researchers due to their ability to effectively suppress the infiltration of oxygen atoms into the coating along grain boundary defects under high temperature conditions and their excellent high-temperature oxidation resistance.
Nanocomposite CrSiN coatings are currently a hot topic. Shao et al. [6] studied the influence of microstructure on the tribo-corrosion behavior of CrSiN coatings by magnetron sputtering. Ge et al. [7] studied the tribological behavior of magnetron sputtering CrSiN coating with a Si content of 12.5% in three environments. Wang et al. [8] deposited Ni-CrSiN and Cu-CrSiN coatings on Ti6Al4V alloy wafers; they investigated and compared the mechanical and tribological properties of Ni-CrSiN and Cu-CrSiN coatings before and after thermal-cold cycling treatment. Fu et al. [9] prepared a series of CrSiN coating with various Mo contents on Ti6Al4V alloys and studied the tribological and electrochemical behaviors of the coatings. The results suggested that Mo element promoted the wear mechanism transforming to tribochemical wear, and the more Mo doping enhanced the tribological performance and presented the lowest wear rates of 2.27 × 10⁻⁷ mm3/N·m and 8.12 × 10⁻⁸ mm3/N·m for tribopairs of Cr(Mo)SiN/Al2O3 and Cr(Mo)SiN/Si3N4, respectively. Furthermore, the CrMoSiN coating showed a low corrosion rate of 0.58 × 10⁻³ mm/year.
However, throughout the numerous reports, very few studies have been performed on the thickness of nanocomposite CrSiN coatings, which has a large impact on the properties of hard coatings such as adhesion, mechanical, and physical properties. Moreover, most of the investigations involved have focused on the friction and wear properties, that are the mechanical properties of coatings, and there has not been much research on corrosion resistance. In particular, the study of nanocomposite CrSiN coatings is more important for the protection of Mg alloys due to having more grain boundaries, which can greatly prevent the diffusion of caustic ions into the Mg alloy matrix and extend the diffusion path of caustic ions. Therefore, in this work, nanocomposite Cr/CrN/CrSiN coatings were fabricated by magnetron sputtering on the surface of AZ31 alloy. The effect of the coating thickness (adjusting via deposition time) on the structural, mechanical, binding and corrosion resistance of the coatings has been investigated. This has practical implications for expanding the applications of lightweight alloys and developing high-performance hard coatings.
2. Materials and Methods
AZ31 was cut into 20 mm × 15 mm × 5 mm thin slices using DK7735 CNC (Xiongfeng Co., Ltd., Shenzhen, China) wire cutting machine. After mechanical grinding, polishing, ultrasonic cleaning in acetone and anhydrous ethanol solutions, the AZ31 slices were loaded into a magnetron sputtering vacuum chamber. The slices and Cr target are respectively pre-sputtered under the joint action of DC (0.5 A) and bias (−500 V) power supply, to ensure the purity of the coating and produce a micro-convex structure on the surface of the substrate to enhance the adhesion. First, a pure Cr target was prepared by DC magnetron sputtering in an argon atmosphere. Then, nitrogen was introduced to prepare intermediate CrN layer, and finally tetramethylsilane (TMS) was introduced to prepare a nano-composite CrSiN layer. The specific parameters are listed in Table 1. The distance between the target and the substrate is 80 mm, the background vacuum is 1 × 10⁻³ Pa, the working pressure is 0.5 Pa, and the deposition temperature is 200 ℃ (measured by thermocouple). Generally speaking, the residual stress of coating increases with the increase in thickness, so the prepared coating should not be too thick, controlled within 1.2–2.2 μm.
The phase structure was analyzed using a D8 Advance X-ray diffractometer (XRD; Bruker, Billerica, MA, USA), which employed a diffraction geometry with a small incidence angle. An incidence angle of 1°, tube voltage of 40 kV, tube current of 40 mA, step size of 0.1°, and the scanning speed of 4°/min was used. The surface, cross section and corrosion morphology of the coating were observed by JSM-6700 scanning electron microscopy (SEM, FEI, Hillsboro, OR, USA). Then, the coated surface after ion thinning was performed to observe high-resolution images (HRTEM) using Tecnai F20 transmission electron microscopy (HRTEM, FEI, Hillsboro, OR, USA). The WS-2005 adhesion scratch tester (Zhongke Kaihua Co., Ltd., Lanzhou, China) was used to evaluate the binding properties between the coating and the substrate. A diamond scratch needle was used with a load of 20 N, a scratch of 3 mm, and a loading rate of 20 N/min. The intensity of the acoustic emission (AE) signal was continuously recorded during scratching, with the critical load for sustained cracking of the coating specified as L1 and the critical load for substrate exposure as L2. The L2 is often used to determine the final adhesive properties of coatings [10,11,12]. The surface mechanical properties (including nano hardness and elastic modulus) were measured with 5 mN load, using a nanoindentation apparatus (Agilent Technologies, Palo Alto, CA, USA). A diamond tip with Φ100 μm, the loading and unloading speed was 6 mN/min, and the load kept for 10 s. During the test, the indentation depth was less than 1/10 of the coating thickness, and the average value of 5 points was measured [13,14]. A CHI760e electrochemical workstation (Chenhua Co., Ltd., Shanghai, China) was used to test the corrosion resistance of the coating in a 3.5 wt.% NaCl solution. The Pt plate was used as the auxiliary electrode, the saturated calomel electrode (SCE) was used as the reference electrode, the test sample was used as the working electrode, and the contact area between the coating and the solution was 1 cm2. Before testing, the open circuit potential (OCP) was immersed for 30 min, after which the potentiodynamic polarization curve was tested [15]. The polarization curve was scanned at a speed of 1 mV/s and the alternating current impedance was perturbed at a frequency of 10 mV in the range from 0.01 to 104 Hz.
3. Results and Discussion
3.1. Microstructure
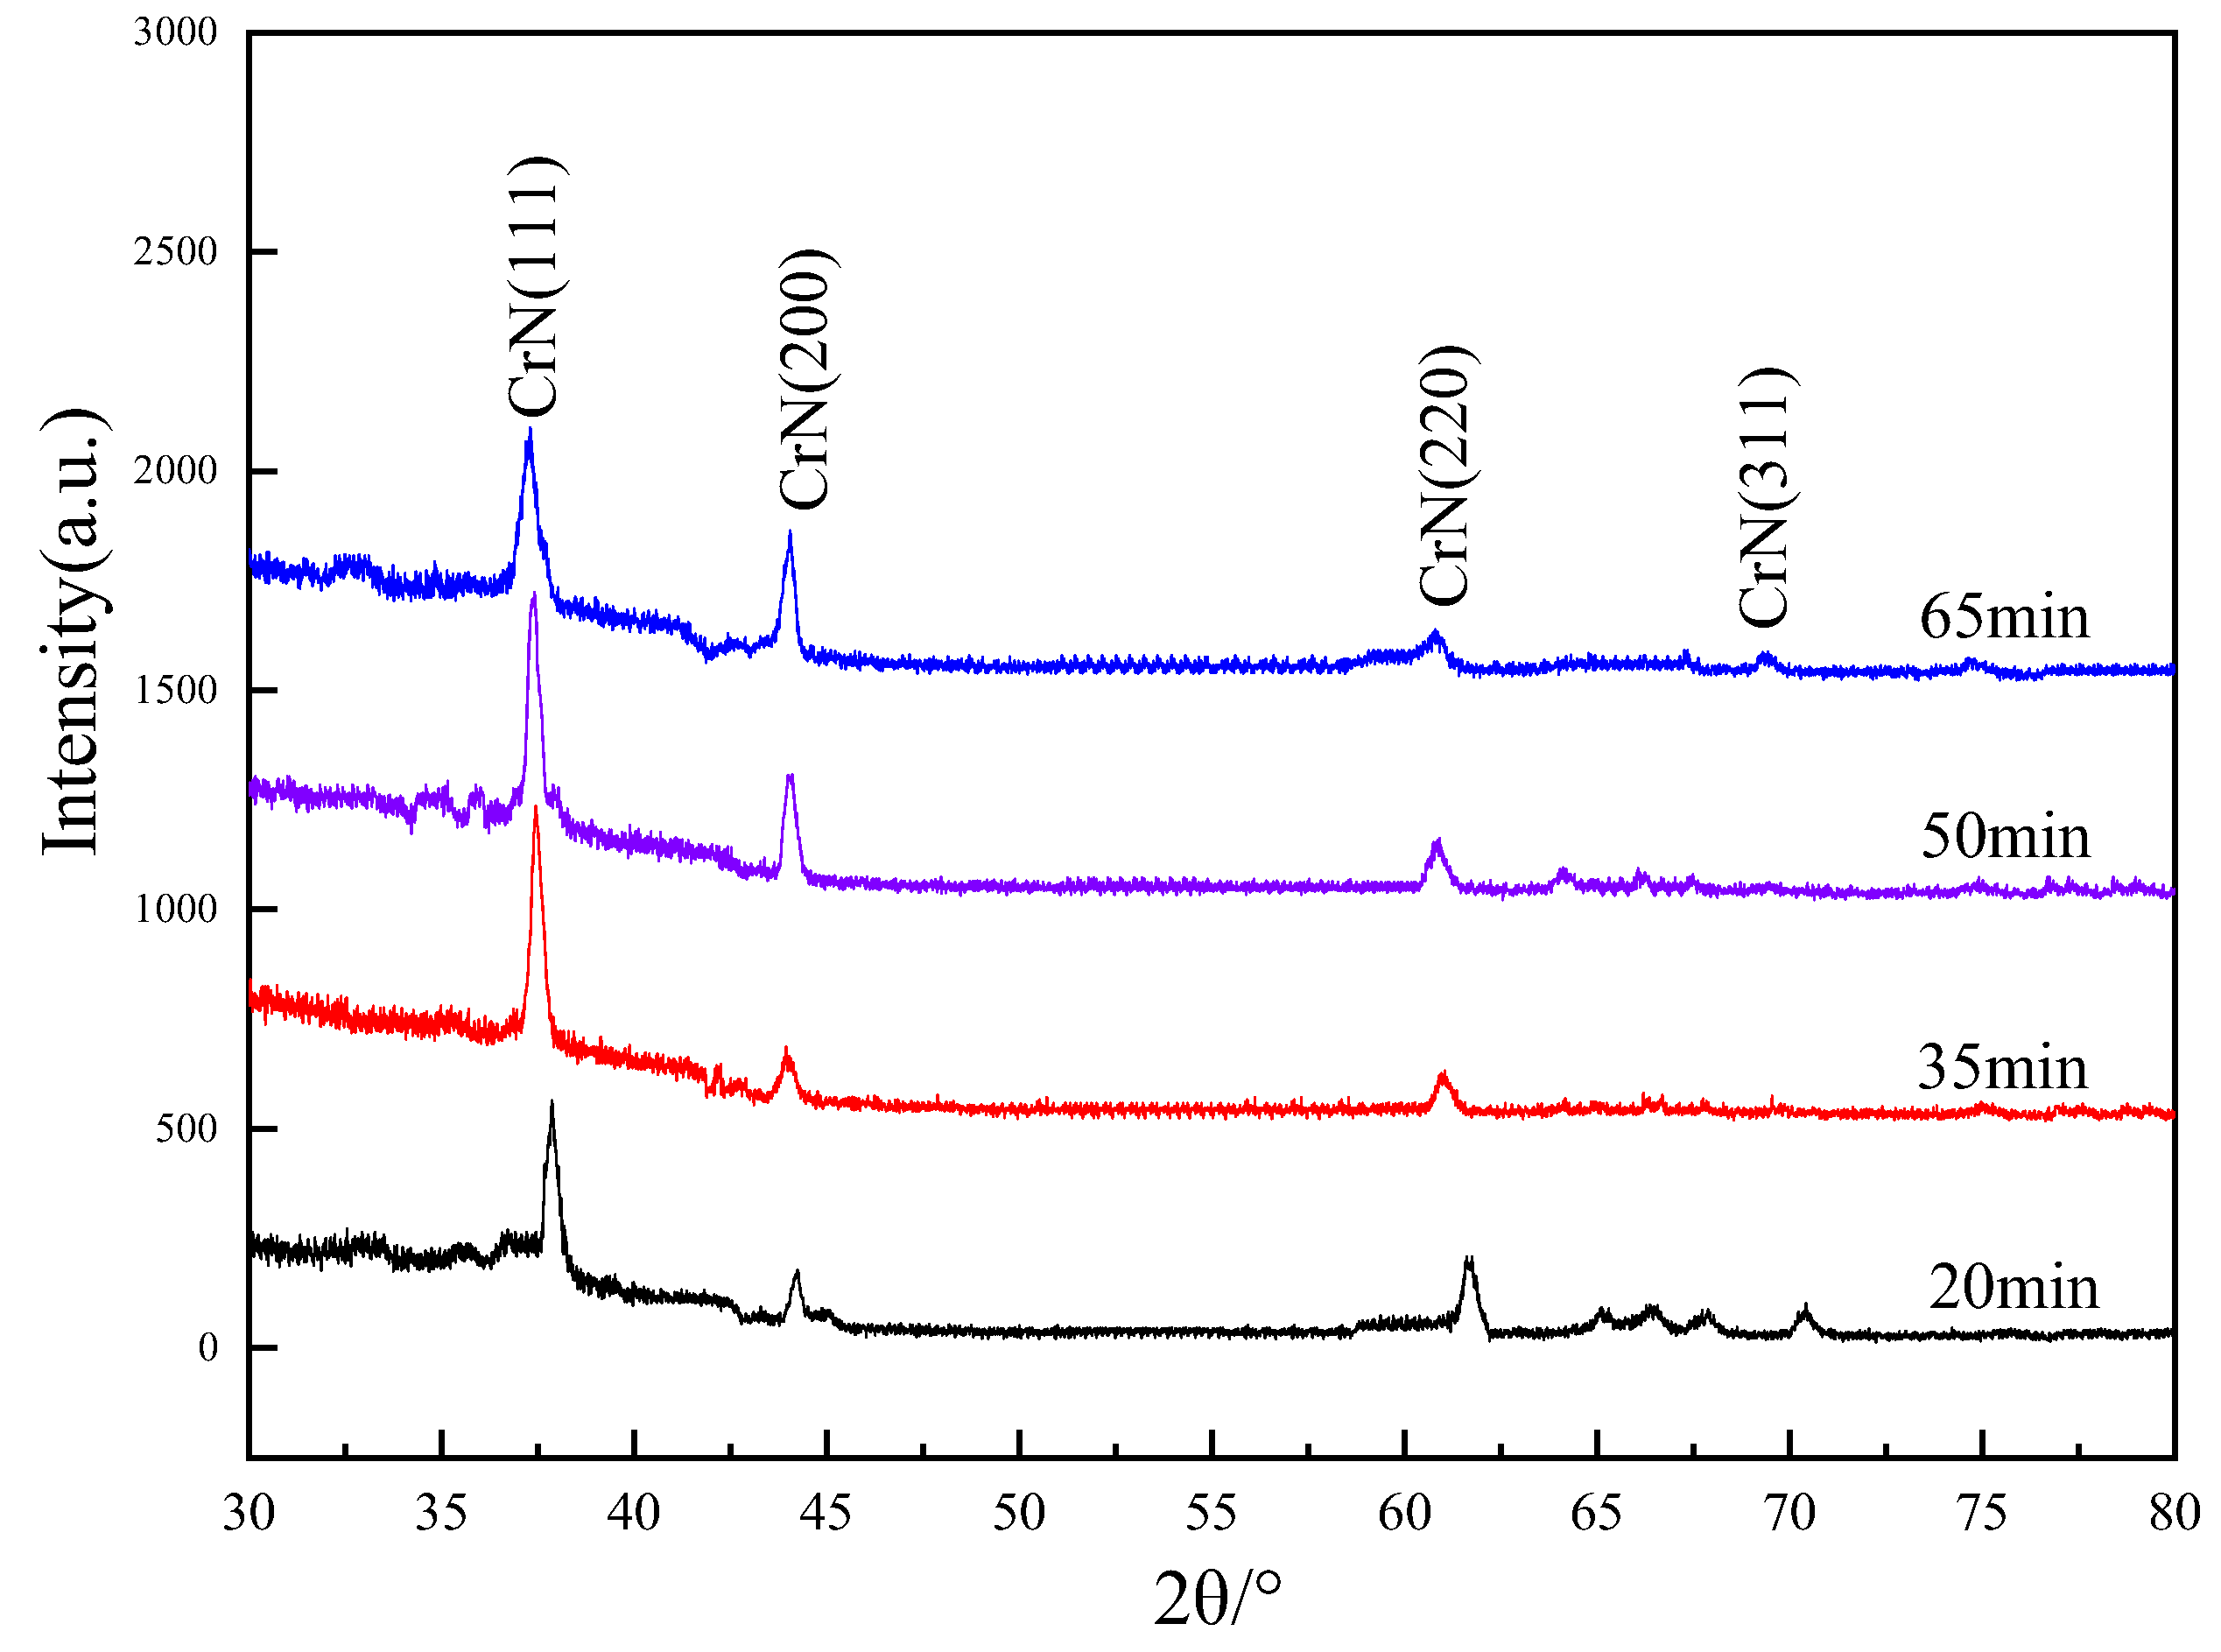
Figure 1 shows the XRD pattern of the composite coating. It is clearly observed that the coatings with different deposition time (thickness) have the same diffraction peak shape, the crystal plane index is unchanged, the diffraction peak intensity is low, and the full width at half maximum (FWHM) is large, indicating that the grain size is small. Here, the Debyes-Scherrer equation was used to calculate the grain size of the coating, as shown in Equation (1). According to Equation (1), there is little change in the grain size with an increase in thickness, the calculated values are 13.25 nm, 12.57 nm, 11.61 nm and 11.43 nm, respectively. There is only CrN phase with FCC structure in the diffraction pattern, corresponding to (111), (200), (220) and (311) crystal planes, respectively. No diffraction peaks of the Si or Si3N4 phases are detected in the diffraction pattern. It has been inferred that the reaction of Si with N2 atoms generates an amorphous structure, hence it is not detected in Figure 1. This result is consistent with other studies containing Si and N elements [16,17]. It can be determined that the coating is a composite structure in which the CrN nanocrystal coexists with the Si3N4 amorphous phase. This composite structure, consisting of a crystalline phase and an amorphous phase, helps to suppress the growth of CrN columnar crystals, thus improving the corrosion resistance of the coating. In addition, with the increase in deposition time (thickness), the diffraction peak shifts to a lower angle, indicating that the residual tensile stress increases with an increase in coating thickness.
where k is 0.89, β is the half-height and width of the diffraction peak (in radian), λ is the incident X-ray wavelength (0.154 nm), θ is Bragg Angle (°), D is the grain size (nm).
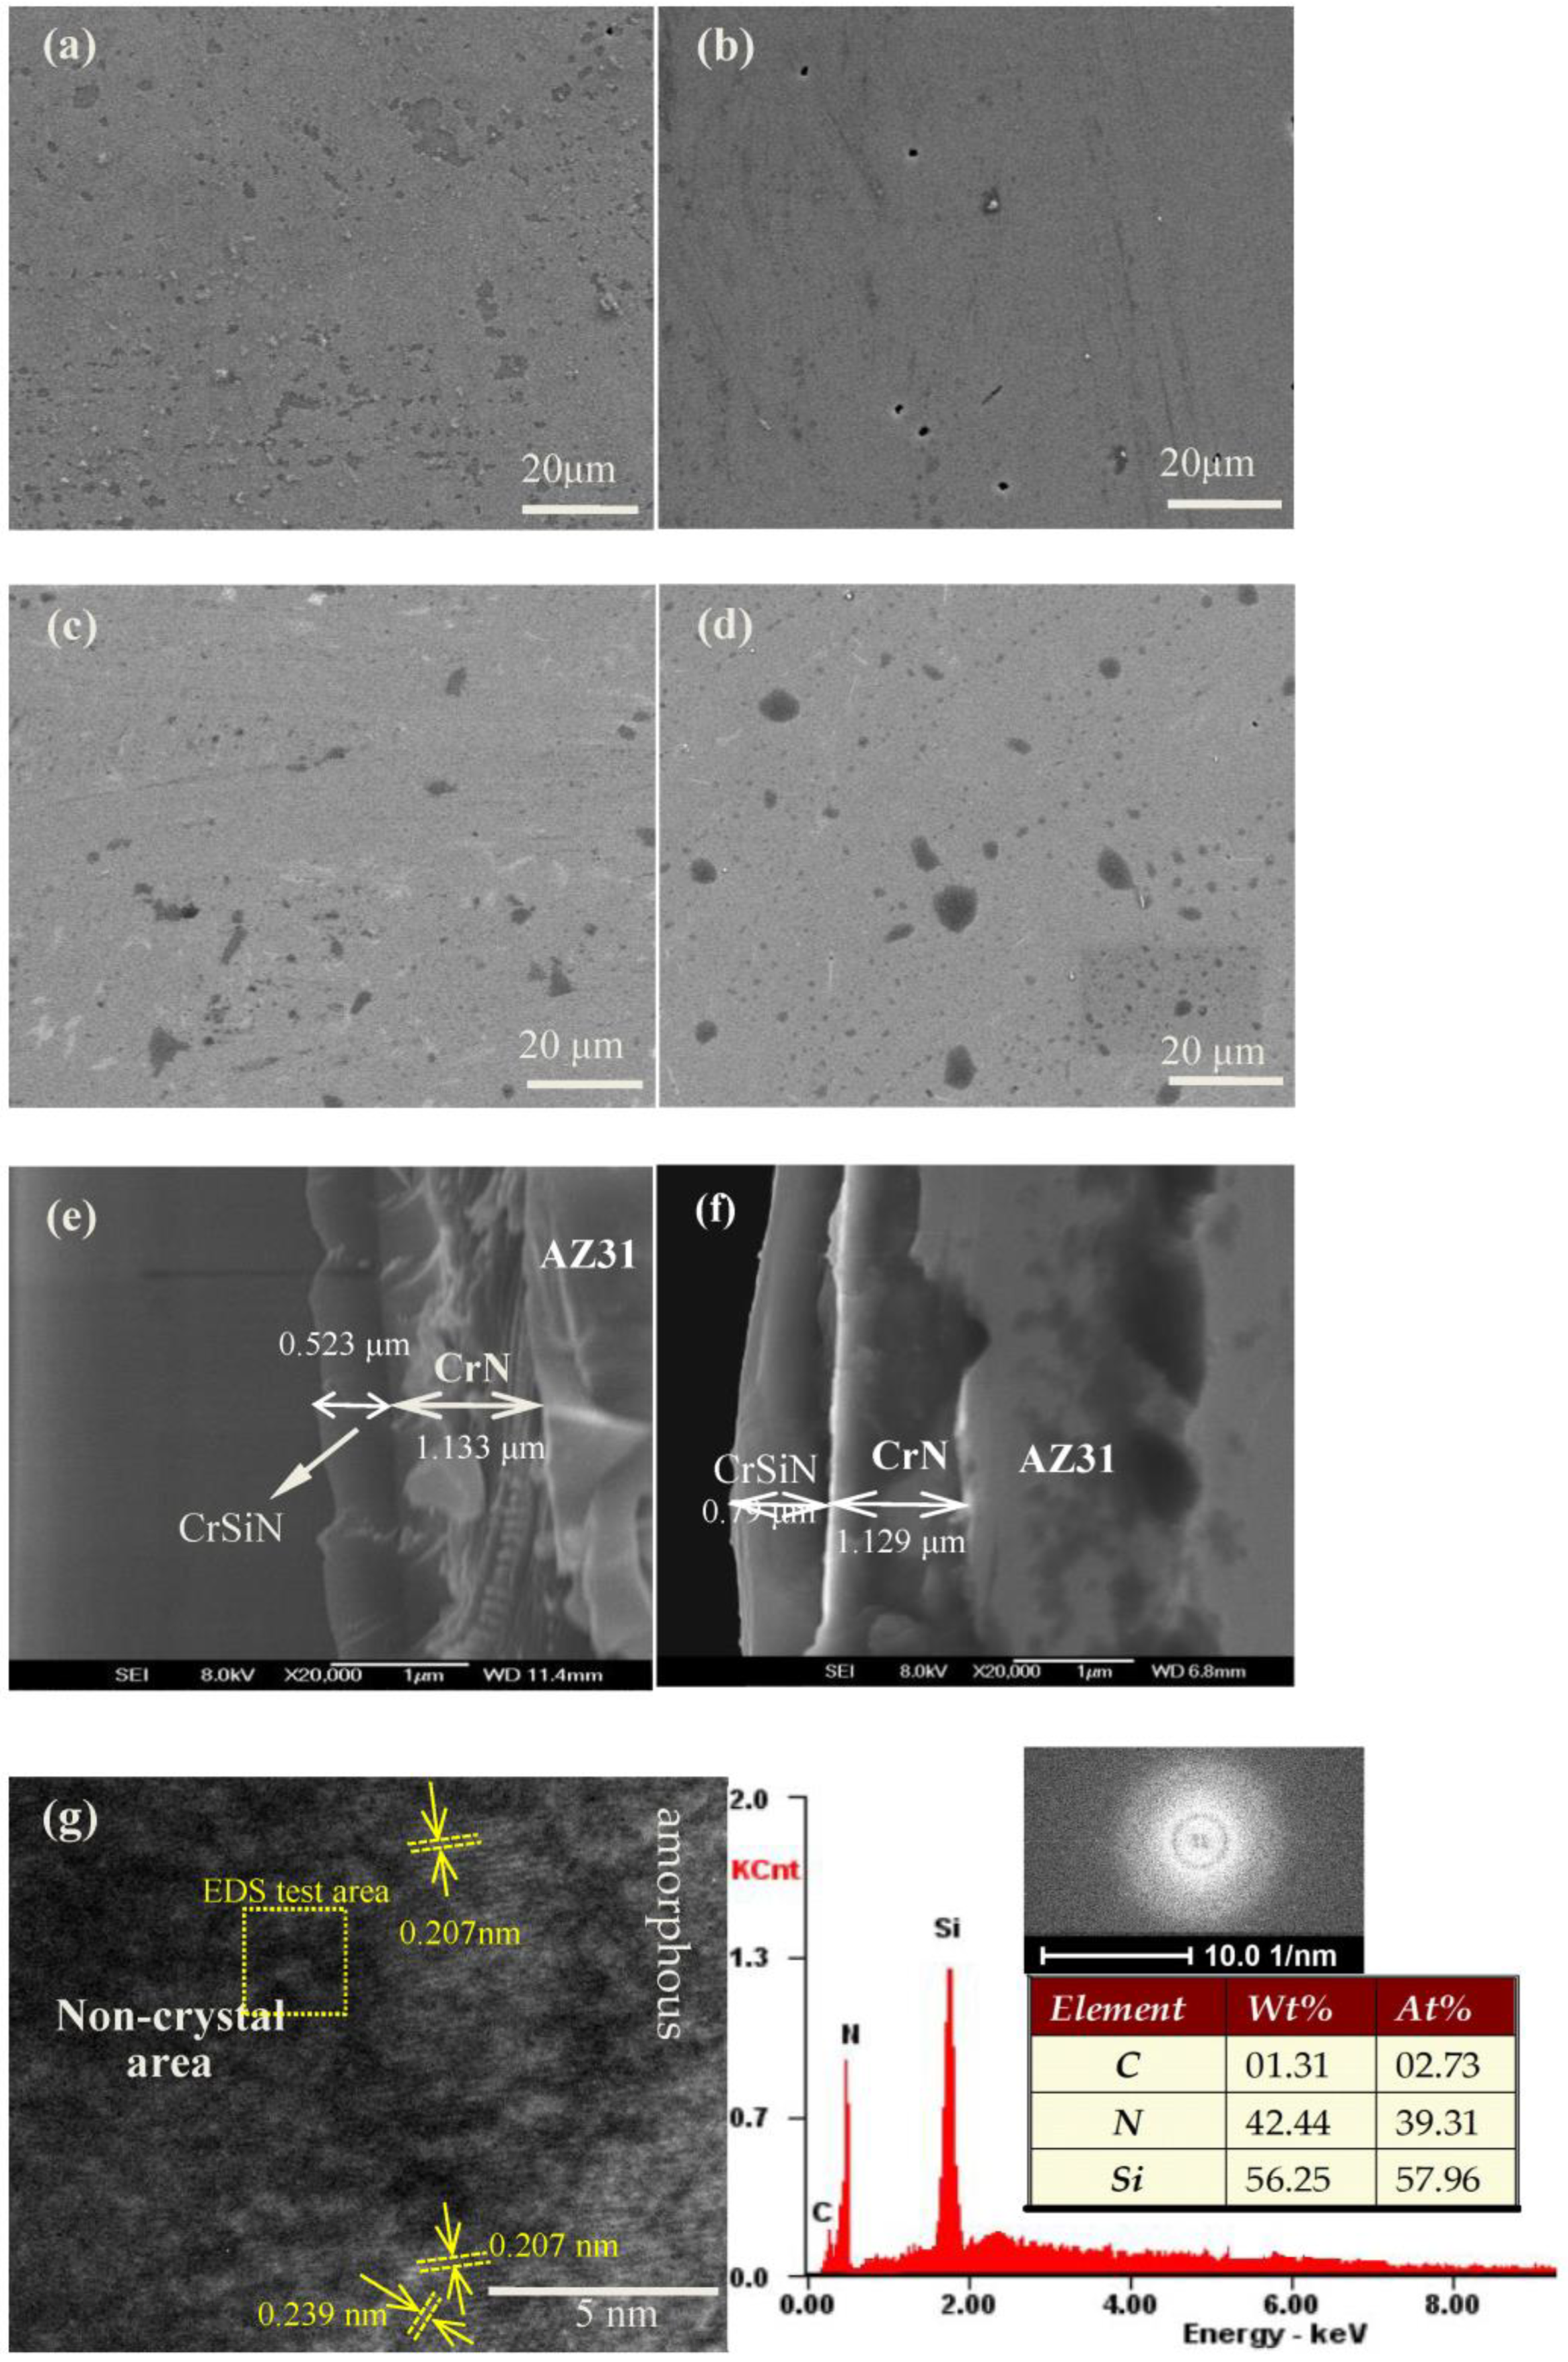
Figure 2 shows the morphology of the coatings for different sputtering times. Figure 2a demonstrates that the surface roughness of the coating is large, and the surface is distributed with pits of different sizes and shapes. The pits are not very deep, and the coating is not complete and continuous, resulting in poor density. After 35 min of sputtering, Figure 2b shows there are no pits on the coating surface and only a few pinhole defects. The pinholes are small in size and the coated surface is smooth and continuous. Figure 2c shows, after sputtering for 50 min the surface of the coating is still smooth, the number of surface defects decreases further, and the coating is complete and continuous. After sputtering for 75 min, Figure 2d exhibits that the coating is very smooth, complete and continuous, and the surface shows black contaminants of irregular size and shape, mainly from the Cr target, or from residual organic solutions from the preprocessing of the AZ31. The TR210 handheld roughness tester (accuracy: 10 nm) shows that the average roughness of the coating is 23.5 nm, 25.7 nm, 27.9 nm, and 29.1 nm, respectively, indicating that the surface roughness reduces with an increase in coating thickness.
Figure 2e,f show the FESEM morphology of the cross section of the 35 min and 50 min coatings. As the base Cr layer has a deposition time of only 5 min, the Cr layer is very thin and is not clearly observed in Figure 2e,f. The total thickness of the Cr bottom layer and CrN intermediate layer is about 1.13 μm, the thickness of 35 min coating and 50 min coating is about 1.133 μm and 1.129 μm, respectively. The coating interface is well bonded and relatively uniform in thickness, with no significant defects. Figure 2g shows the high-resolution TEM image (HRTEM) of the 50 min coating. It is clearly visible that the coating structure is a mixture of nanocrystalline and amorphous structures. The EDS test results in Figure 2g show that the coating mainly contains Si and N elements, they form Si non-crystal phase or Si3N4 amorphous phase. After confirmation, the interplanar spacing of 0.239 nm corresponding to CrN (111) crystal plane, and the d-spacing of 0.207 nm corresponding to CrN (200), confirming that the coating is a composite microstructure of amorphous phase coated nanocrystal CrN phases, in high agreement with the XRD patterns presented in Figure 1.
3.2. Mechanical Properties
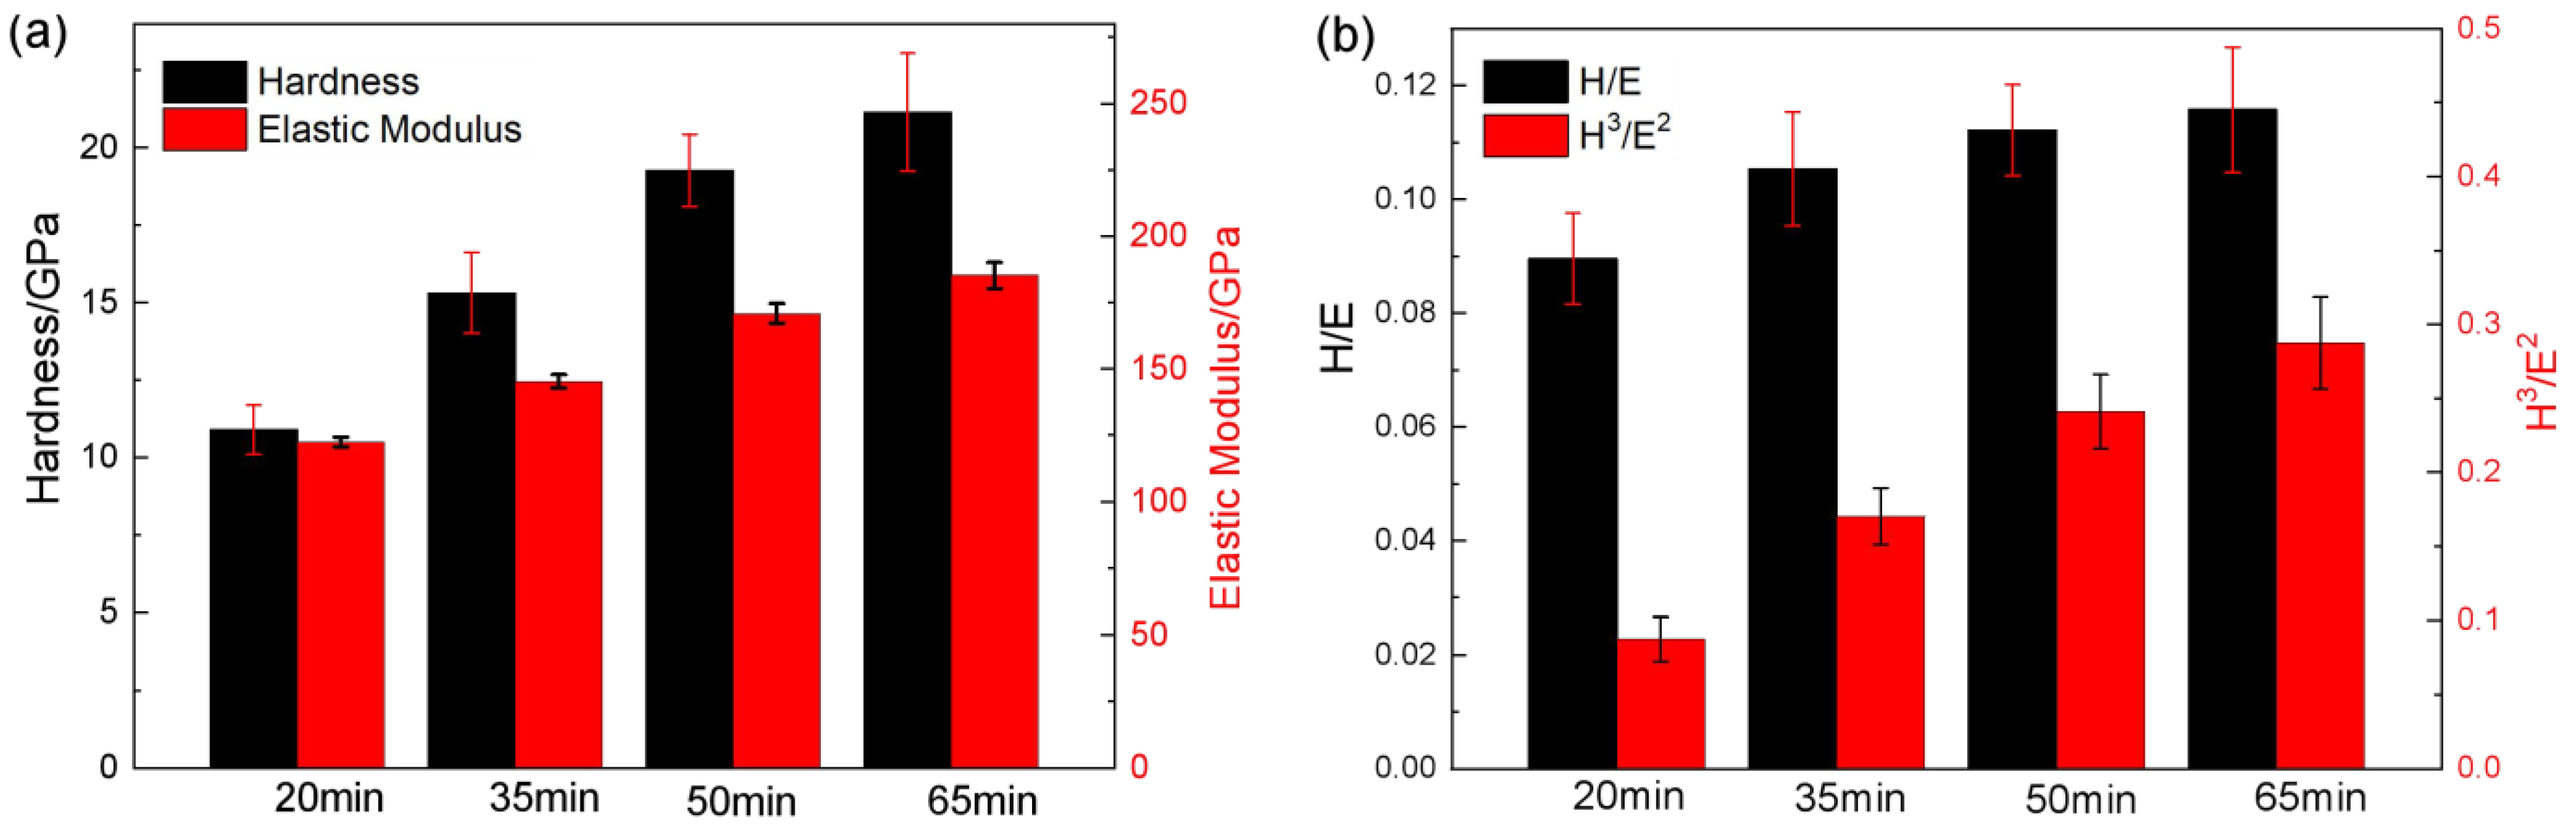
Table 2 shows the test results for nanoindentation of the composite coatings at different deposition times, with the corresponding bar plots shown in Figure 3. Table 2 and Figure 3 show that the mechanical properties of the coating are enhanced as the coating thickness increases. The hardness (H) of the films is 10.89 GPa, 15.31 GPa, 19.17 GPa, and 21.45 GPa, respectively. The elastic modulus (E) values are 121.5 GPa, 145.2 GPa, 170.9 GPa, and 185.2 GPa, respectively. As the thickness of the coating increases, the values of H and E increase. From the XRD pattern (Figure 1), the diffraction peak gradually widens, the grain size of the coating decreases, and the fine grain strengthening of the micro-nano structure play a good role in grain boundary strengthening. Moreover, the HRTEM images in Figure 2g show that the coating is a composite microstructure of amorphous and nanocrystalline, that is, the amorphous phases enclose the CrN nanocrystals, which hinders the growth of CrN grains. According to the Hall-Petch theory [18], the hardness of a material is inversely proportional to the grain size, so the hardness of the coating gradually increases. On the other hand, the strong interface between the amorphous phase and nanocrystalline CrN can prevent dislocation proliferation and grain boundary sliding, which also increases the hardness of the coating [19,20]. Moreover, as the sputtering time increases, the thickness of the coating increases, and the increase in mechanical properties is also related to the increase in the stress level due to the increase in thickness.
Moreover, the values of H/E and H3/E2 are often used to evaluate the mechanical properties of samples [5,19], and they are typically used to characterize the resistance to elastic strain [21,22,23], as shown in Table 2 and Figure 3. As the deposition time increases, the coating becomes more elastic, which could be due to decreased grain size and increased interface area, thereby limiting dislocation gliding [21,22,23]. Therefore, the thickest coating (65 min) exhibits the highest H/E and H3/E2 ratio of all the coatings, and the thinnest coating (20 min) exhibits the lowest H/E and H3/E2 ratio of all the coatings, suggesting the H/E and H3/E2 ratios increase with an increase in coating thickness. Moreover, it also indicates that the coating has better mechanical properties with increasing thickness.
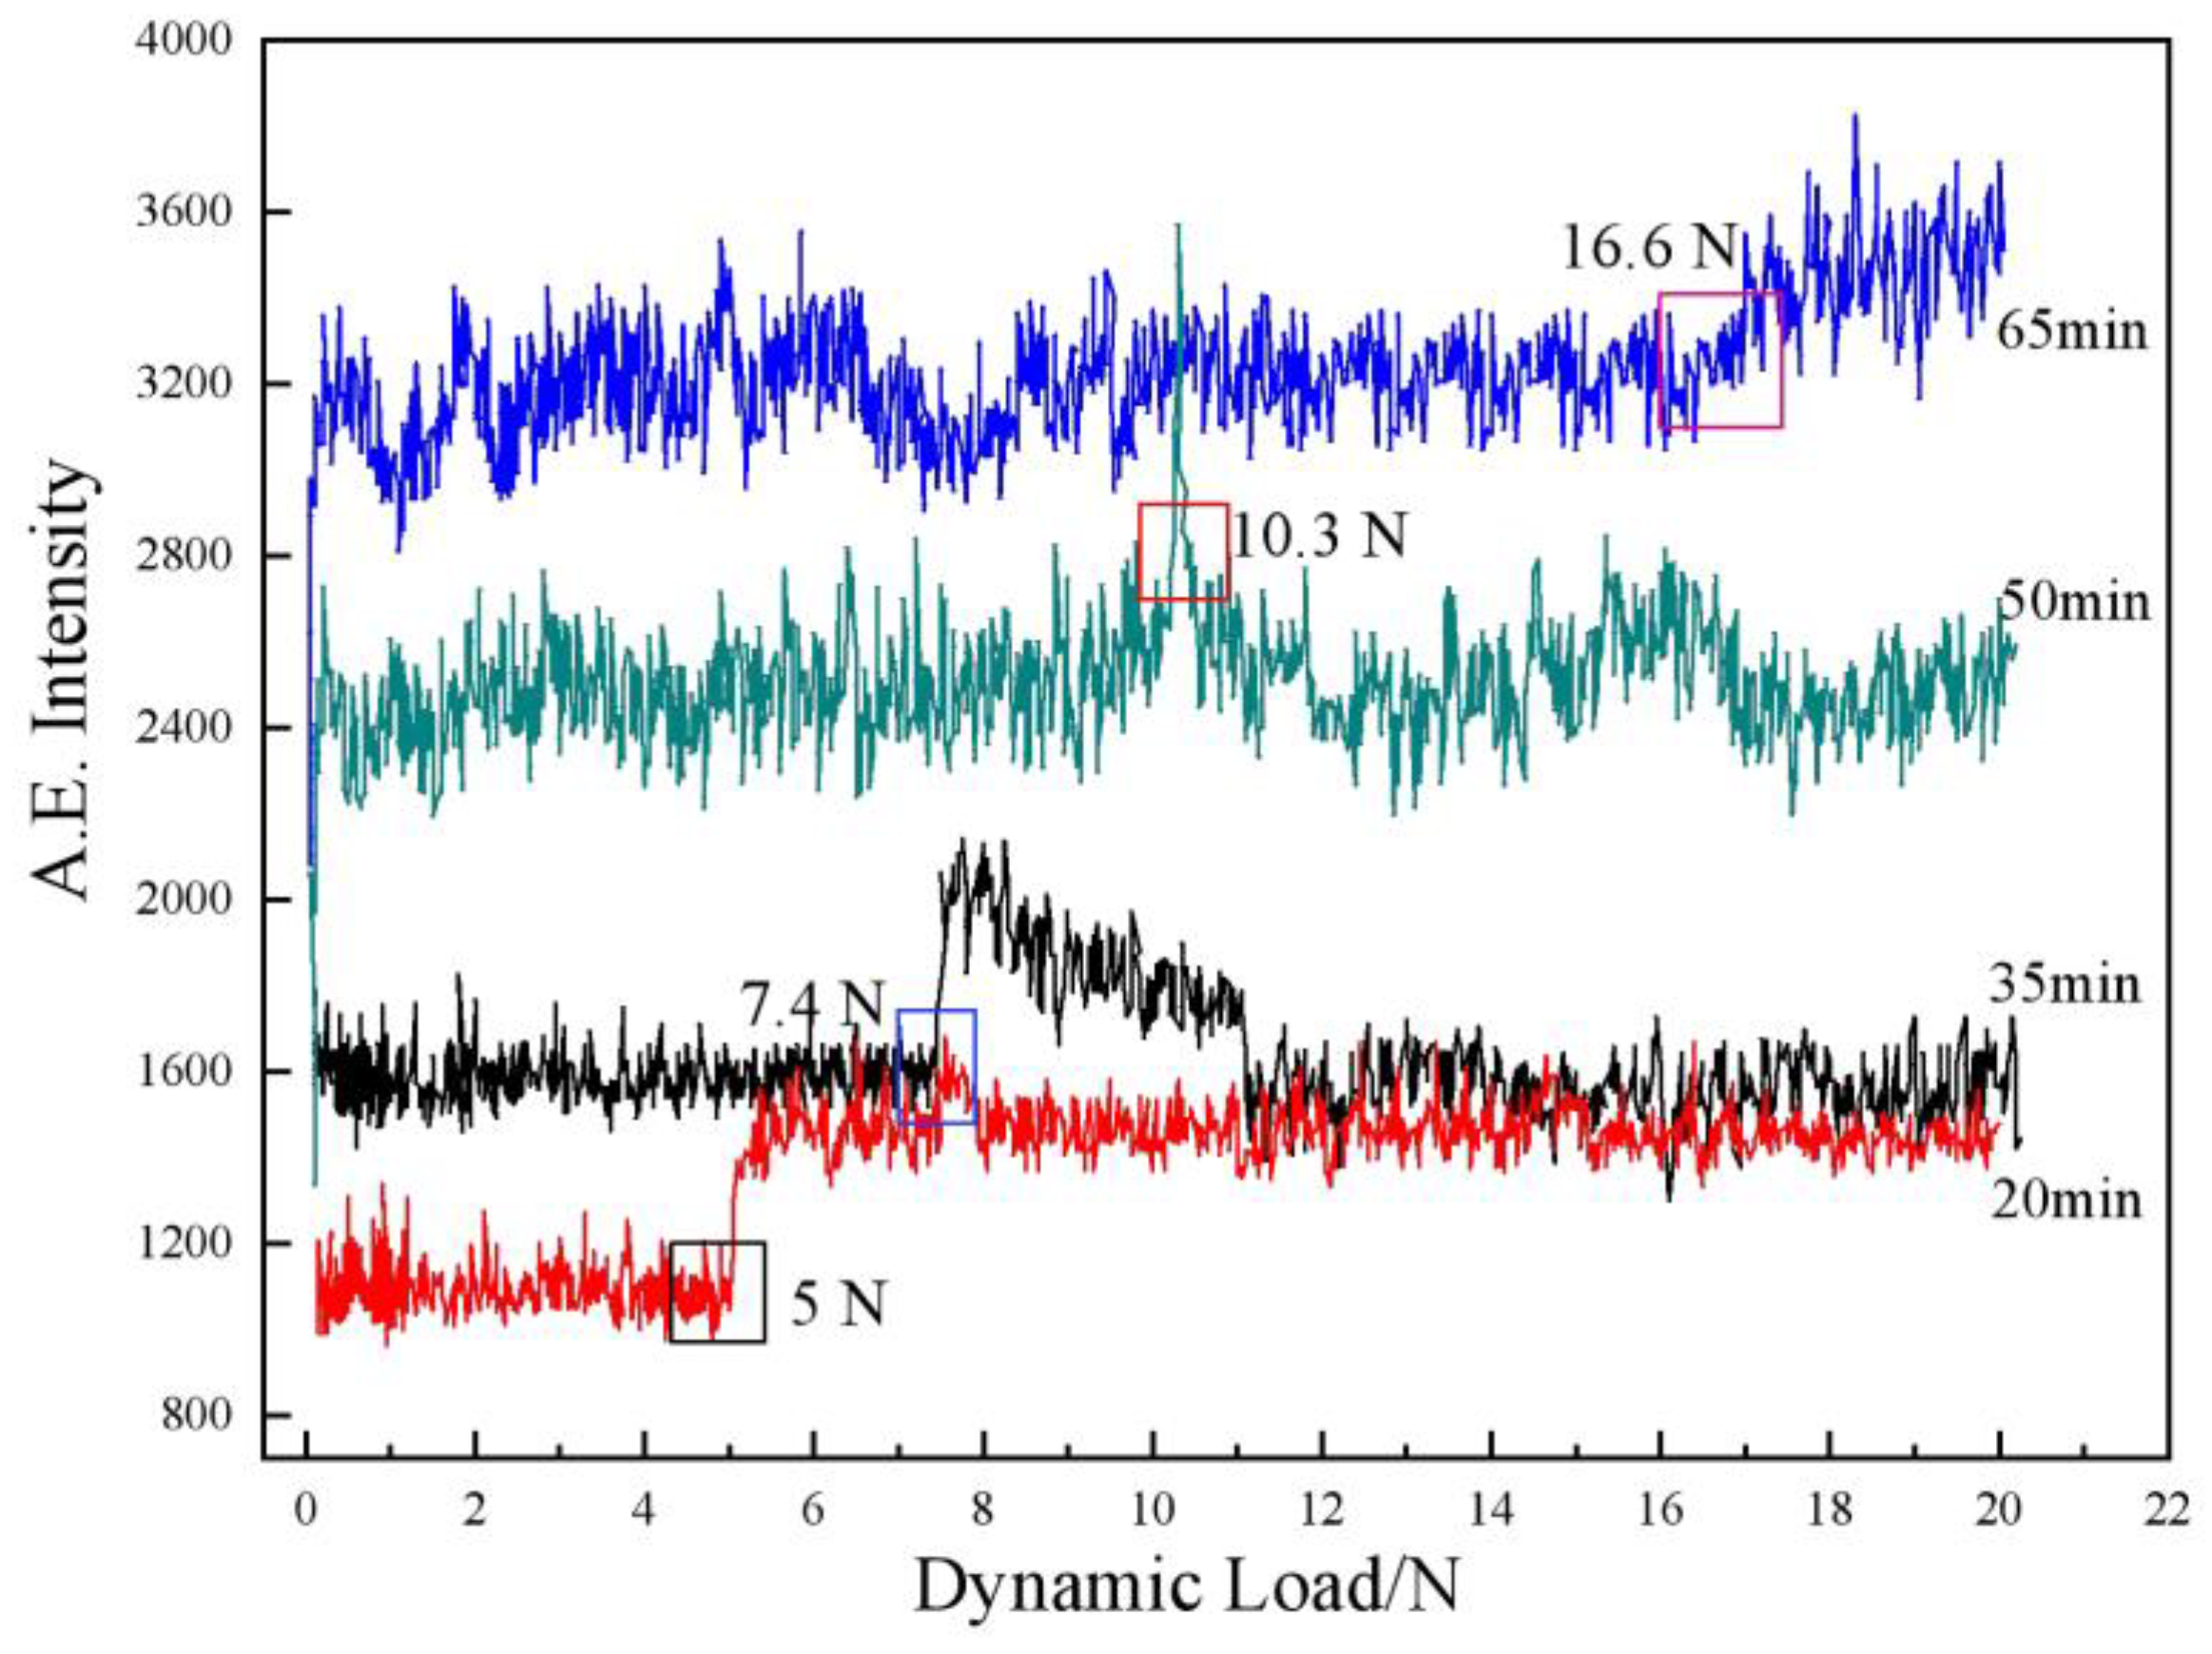
Figure 4 shows the AE signal of the coating during the scratch test. Due to the hard coating deposited on the soft substrate, the deformation of the hard coating and the soft substrate is inconsistent under the action of external forces. The physical parameters of the AZ31 substrate and the coating are quite different, so that the binding force of the coating is not too high on the whole. As the sputtering time is extended, that is, as the thickness of the coating increases, the binding force between the coating and the substrate increases. Due to the large number of pits on the coating surface, the 30 min coating is not dense and continuous, and therefore the adhesion to the substrate is poor. The coating starts to detach from the substrate with a corresponding load of 5 N. However, the bonding properties improved significantly at a sputtering time of 35 min, and the coating started to detach from the substrate at a dynamic loading of 7.4 N. In the case of the 50 min coating, due to the improved surface quality, the bonding properties are further improved, and the corresponding critical load is 10.3 N. For a coating with a sputtering time of 65 min, we do not see a significant spike position on the AE curve (in the range of 20 N), but a significant fluctuation can be observed when the dynamic load exceeds 16.6 N. Although the internal stress of the coating increases with the thickness (confirmed by the XRD pattern), this decreases the adhesion of the coating to the substrate. However, Figure 4 illustrates that the adhesion of the coating increases as the thickness of the coating increases, indicating that the internal stress of the coating does not affect the bonding properties of the coatings, which is in the range within 2 μm.
3.3. Corrosion Behavior
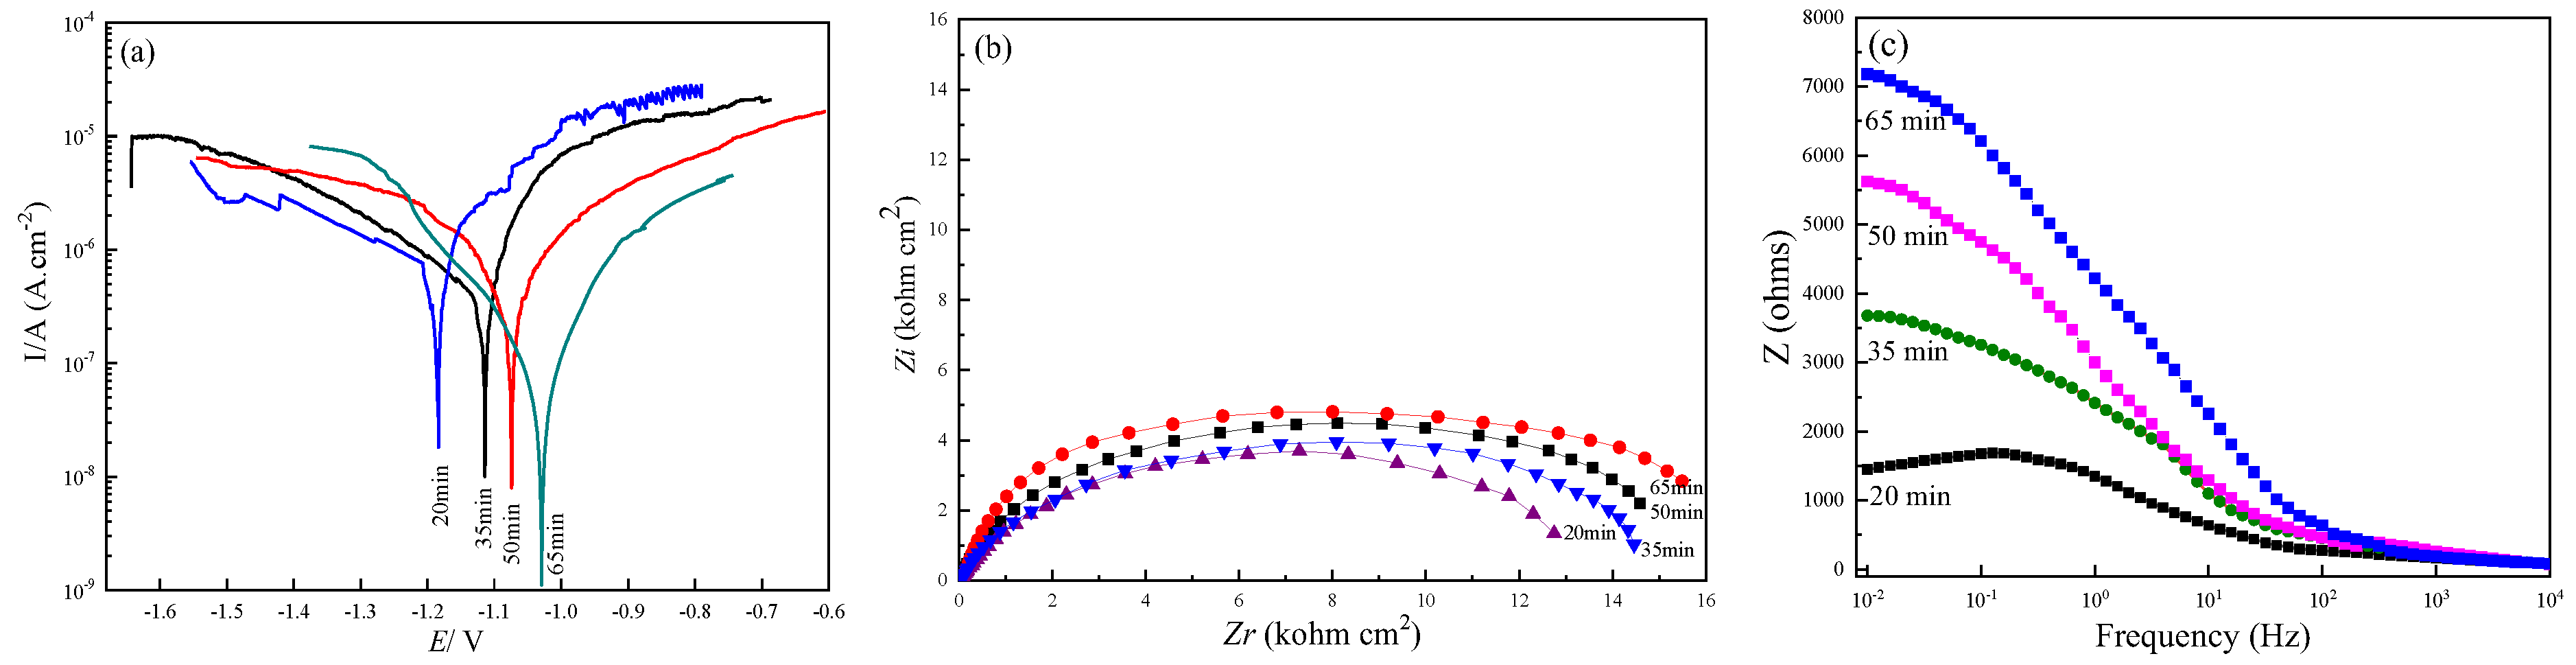
Figure 5a shows the electrochemical polarization curve, and Table 3 shows the polarization parameters obtained from Figure 5a using the Tafel extrapolation method. It can be seen from Figure 5a that the corrosion potential (E) of the coating increases significantly in the positive direction compared with AZ31, and the corrosion current density (Icorr) decreases by two orders of magnitude compared with AZ31 (AZ31 tested under the same conditions: E = −1.545 V, Icorr = 7.78 × 10⁻⁴ A·cm−2), indicating that the coating has good protection. However, when E is increased beyond −1 V, the anodic reaction zone of the 20 min coating fluctuates, indicating that the coating is damaged by pitting, which occurs at pits on the surface of the coating. Figure 5a also presents that the 35 min coating has a higher E value than that of the 20 min coating, and the corresponding Icorr value is lower than that of the 20 min coating, indicating that it is more resistant to corrosion than the 20 min coating. In addition, the current density in the reaction zone of the anode increases slowly without significant fluctuations, indicating its better corrosion resistance. In case of the 50 min coating, the corrosion potential of the coating continues to increase, the corrosion current density is slightly reduced, and the corrosion resistance of the coating is further improved, owing to the number of defects in the coating is further reduced, and the density and continuity of the coating is enhanced. When the sputtering time reaches 65 min, the thickness of the coating is at a maximum and there are no significant defects on the surface of the coating, so the corrosion potential is highest and the corrosion current density is lowest.
Figure 5b shows the Nyquist plots from EIS. It shows that, over the whole frequency range, the coatings of different thickness consist of only a high-frequency capacitive reactance arc, suggesting a strong capacitance resistance [24,25,26], and the radius of the capacitive reactance arc is significantly different. This meant the CrSiN coating acted as an insulated barrier preventing the electrolyte from invasion. It is well known that the larger the radius of the capacitive reactance arc, the weaker the charge transfer capability [25,26], the larger the corresponding Faraday impedance, and the better the corrosion resistance of the coating. As can be seen from Figure 5b, the 65 min coating has the largest radius of capacitive loop, while the 20 min coating has the minimum, indicating that the coating with 65 min sputtering has the best corrosion resistance, while the coating with 20 min sputtering time has the worst corrosion resistance. Figure 5b also demonstrates that the physical isolation effect of the coating was enhanced, and the corrosion resistance of the coating was improved by increasing the thickness. It was because of this, the more nanocrystalline CrN formed in coating lead to interruption of the column-like microstructure, and the coating became more complete and denser as the deposition time increased. For the same reason, the charge transfers resistance of the composite coating kept increasing with the increase in the thickness, and 65 min coating showed the highest resistance due to its mixed structure.
Figure 5c shows the Bode-|Z| plots of the samples. Generally speaking, the |Z| value at low frequency indicates the coating barrier characteristics; hence, a higher |Z| at 0.01 Hz in the impedance curve indicates more substantial anticorrosion properties [24,25,26]. As seen in Figure 5c, we find that the resistance of CrSiN-20min coating is around 1680 Ω, while those of CrSiN-35 min, CrSiN-50 min and CrSiN-65 min coatings increase to 3680 Ω, 5630 Ω and 7200 Ω, indicating that the coatings present high impedance, and the value increases with the increasing deposition time. This demonstrates that the coating thickness effectively enhanced the anticorrosion and blocked the penetration of corrosive ions. The EIS data revealed the corrosion resistance of coated AZ31 had increased significantly, and the CrSiN coating has good protection for AZ31.
In order to further study the corrosion resistance of the coating, the corrosion rate Rcorr of the coating was calculated according to Faraday’s Law, as shown in Equation (2) [15], and the corrosion protection rate Pe of the coating was calculated by Equation (3) [27]. The results of the calculations are given in Table 3. As can be seen from Table 3, the 65 min coating has the lowest Icorr value with a corrosion rate of 0.048 mm/year and the highest protection rate of 99.72%, showing good corrosion resistance. In contrast, the 20 min coating behaves with the opposite trend. Table 3 shows that the corrosion resistance of the coating increases with thickness, which is in the range of thicknesses studied in this paper.
Here, M is the relative atomic mass of the substrate; n is valence; ρ represents density of the substrate; F denotes the Faraday’s constant of 26.8 A·h/mol. Pe is corrosion protection rate; Icorr is the corrosion current density of the coating; is the corrosion current density of the matrix.
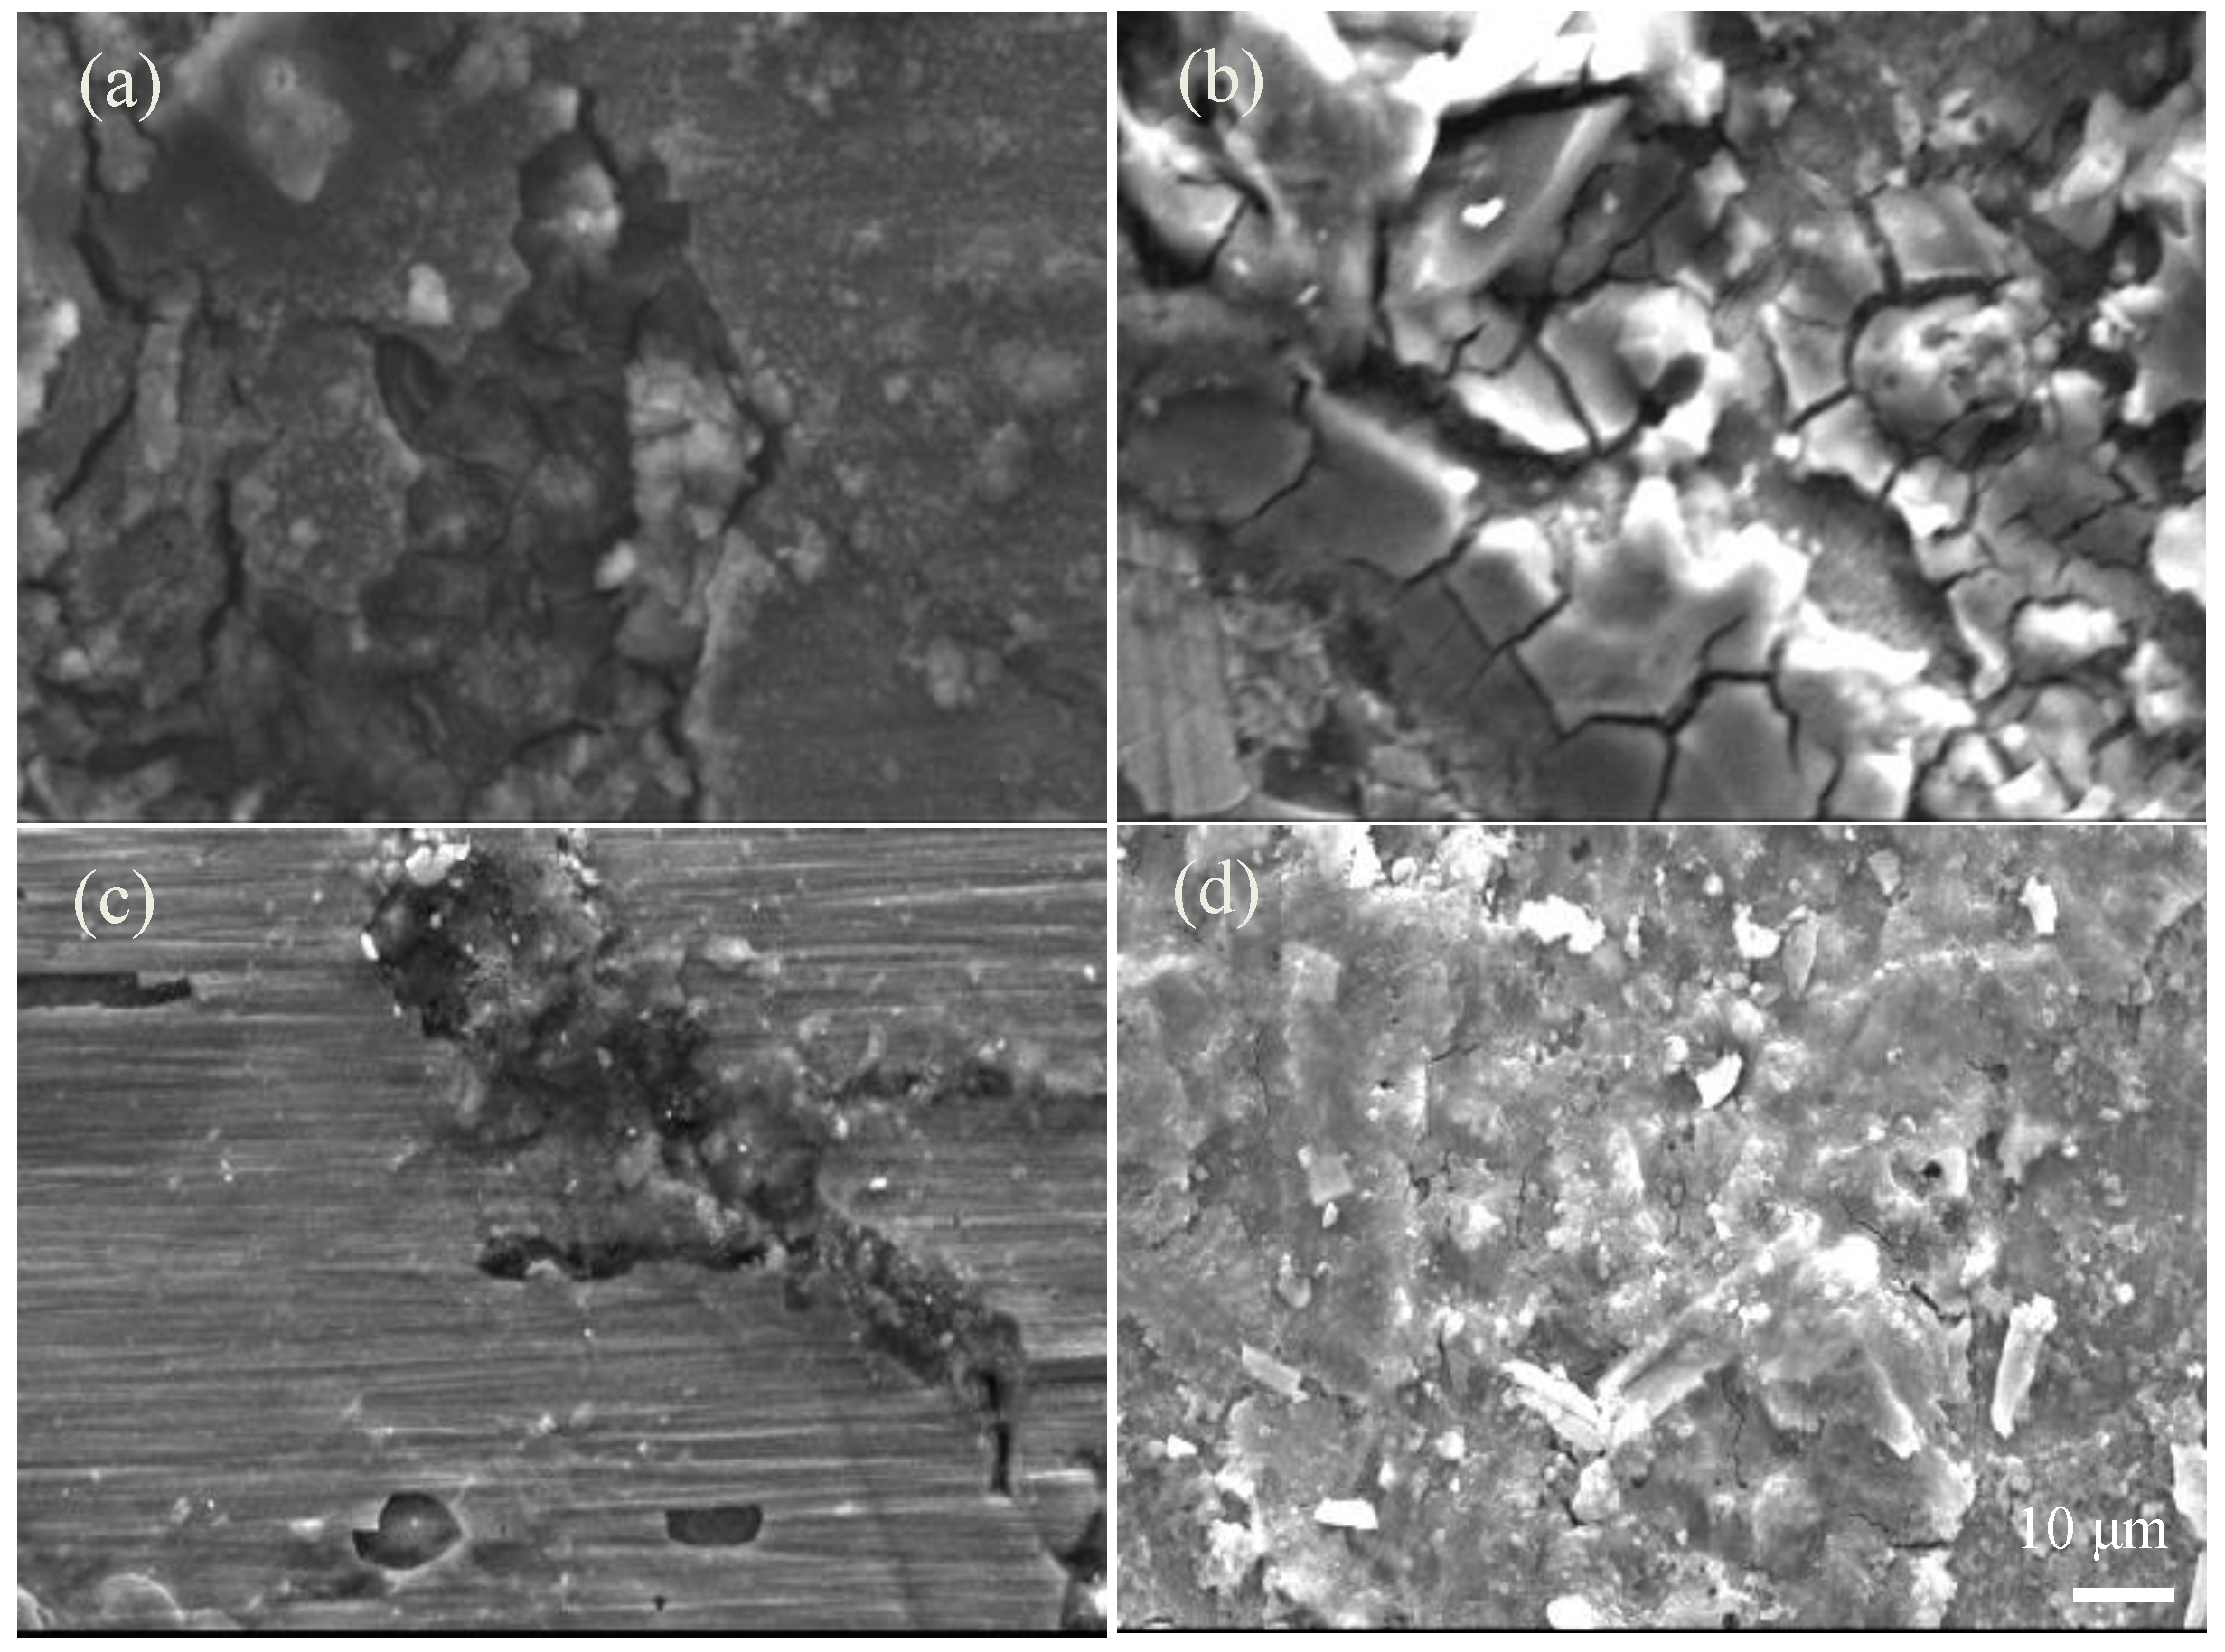
Figure 6 shows the corrosive morphology of a coating immersed in a 3.5 wt.% NaCl solution for 7 days. Figure 6a shows that the corrosion cracks in the left half of the corrosion surface of the 20 min coating are deep and wide, and the crack propagation is long. There is no visible corrosion damage on the right half. As can be seen from Figure 6b, after 35 min of deposition, serious corrosion cracking occurred on the surface of the coating after corrosion. The crack expands at the center of the pinhole, and the crack is relatively broad. Figure 6c shows that no cracks appear on the surface of the 50 min coating under the same conditions, and there are only pits and gullies left by corrosion failure. Corrosion occurs at the grain boundaries of the CrN phase at large grain sizes. Figure 6d shows that the surface cracks of the coating deposited for 65 min are narrow, the number of cracks is small, and the corrosion surface roughness is large, but the corrosion is relatively not serious, showing relatively good corrosion resistance of the 65 min coating.
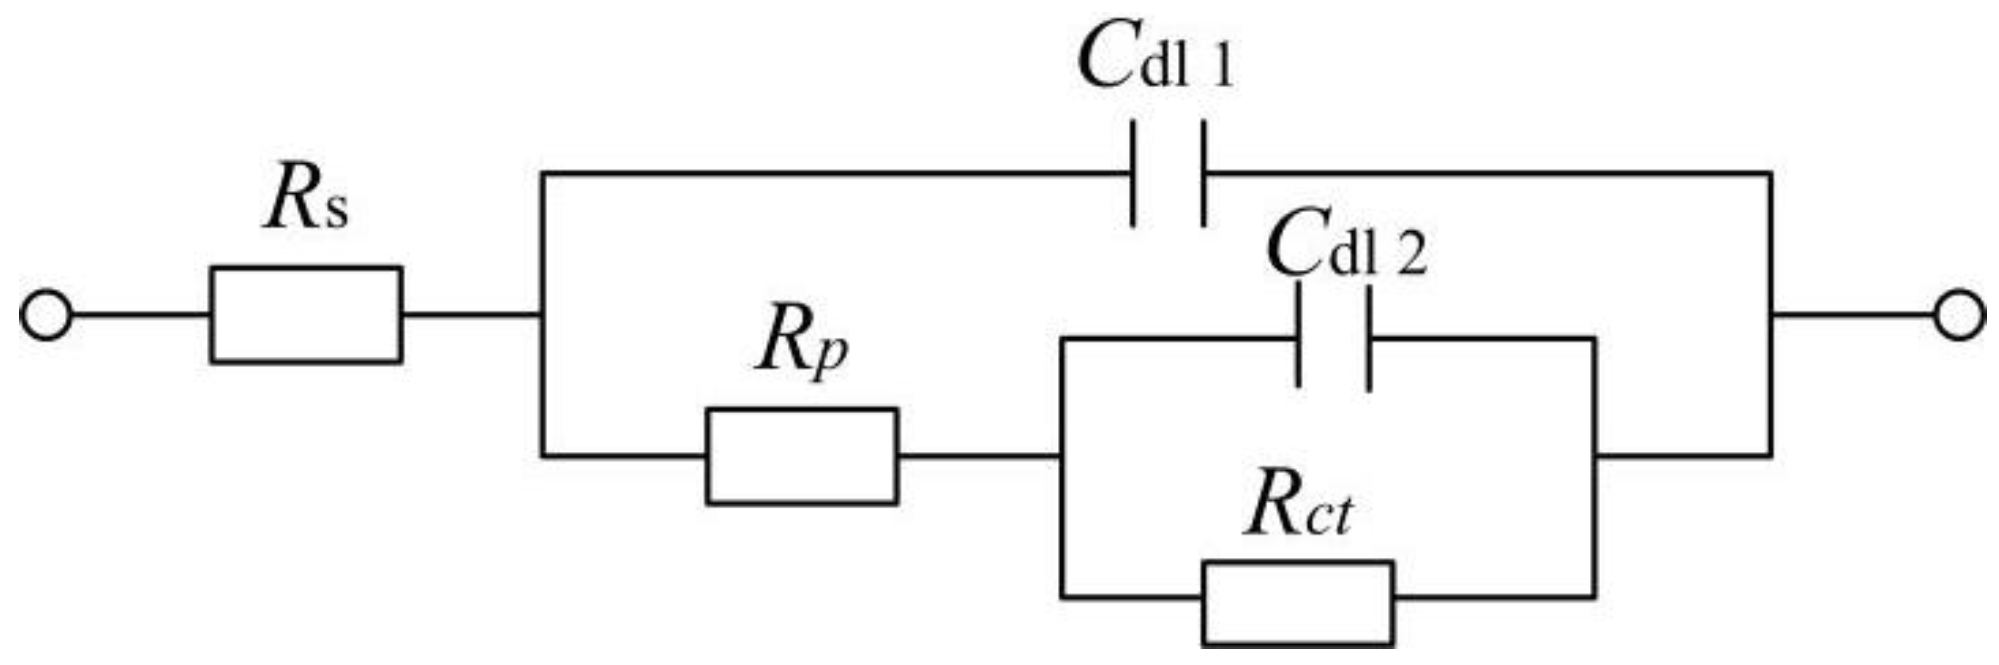
In order to understand the electrochemical construction of coatings system, the equivalent circuit (EC) was used to fit EIS data, using ZsimpWin software, as shown in Figure 7. In Figure 7, the Rs is solution resistance from the end of the salt bridge of the reference electrode to the electrode surface, CPEdl1 and CPEdl2 are the double layer capacitance, Rct is the charge transfer resistance of the electrode reaction due to the double layer of charge at the interface of AZ31/electrolyte, and the Rp is the pore resistance of the solution. Generally, the coating acted as a capacitive layer isolating the substrate from the corrosive solution. Furthermore, the chemical reaction occurred on the interface of the solution/coating or solution/substrate, leading to the double layer generating on the interface between the two phases [9]. The fitting parameters are shown in Table 4. Here, the constant phase element (CPE) is used to represent a non-ideal capacitor that describes the difference from an ideal capacitive behavior [9,24,28]. Its impedance was expressed as:
where Y0 is the capacitance (Ω−1 sn cm−2), ω is the angular frequency (rad/s), and n is the CPE power that represents the deviation degree from an ideal capacitor.
The charge transfer resistance Rct can be used to evaluate the corrosion resistance of the coatings. Obviously, with an increase in coating thickness, the Rct and Rp increase from 7.84 × 10⁵ to 2.16 × 10⁶ Ω·cm2 and from 1857 to 8330 Ω·cm2, respectively. While the CPEdl1 and CPEdl2 decrease with the deposition time. Thus, Table 4 shows that the coating is more resistant to corrosion with the coating thickness. As compared with the four groups, it demonstrates that the block effect of CrSiN-65 min coating is the highest, and it is more resistant and more protective than the other group. In general, metallic nitride coatings are chemically stable and are not susceptible to corrosion by chemical media. However, the corrosion resistance of these coatings by physical vapor deposition is lower than the theoretical corrosion resistance due to defects in the coating that create corrosive dielectric channels, resulting in gaps and galvanic corrosion between the coating and the substrate along the defects. Fortunately, the increased thickness of the coating happens to fill in the holes and pits on the coating surface, similar to patching, so that the coating becomes better resistant to corrosion as the deposition time increases.
4. Conclusions
The details of the conclusion are summed up as follows:
- (1)
- The CrSiN coating is a composite structure consisting of amorphous and nanocrystalline CrN. The thickness has little effect on phase structure, grain size, and plane index, but the internal stress of the coating increases with increasing thickness.
- (2)
- With the increase in deposition time, the surface becomes smooth, the defects decrease, and the coating is well combined with the substrate.
- (3)
- With the increase in deposition time, the hardness and elastic modulus of the coating increase, and the coating has good mechanical properties. The adhesion between the coating and the substrate increases. When the deposition time is 65 min, the binding force between the coating and the substrate reaches the maximum, and the corresponding thickness of the CrSiN layer is 0.85 μm.
- (4)
- With the increase in deposition time, the corrosion potential increases, the corrosion current density, and the corrosion rate decrease, the protection rate increases, and the corrosion resistance of the coating improve. The corrosion resistance of the coating is best with a sputtering time of 65 min. In summary, the optimal sputtering time for the composite Cr/CrN/CrSiN coating in this work is 65 min; however, due to the limited time, only the coatings with a deposition time of 65 min (thickness about 2.2 μm) are represented in this work. The microstructure, corrosion, and wear resistance of the coatings with a thickness of 2~5 μm will be the main work of our next research.
Author Contributions
C.C.: Conceptualization, Resources, Writing-original draft, Methodology; C.Y.: Writing-review and editing, Investigation, Formal analysis, Supervision. All authors have read and agreed to the published version of the manuscript.
Funding
This research received no external funding.
Institutional Review Board Statement
Not applicable.
Informed Consent Statement
Not applicable.
Data Availability Statement
Data sharing is not applicable to this article.
Acknowledgments
The authors acknowledge Zhang and Li, for providing assistance of microstuctural characterization.
Conflicts of Interest
The work has no conflict of interest, the authors have no competing financial interests or personal relationships that could have appeared to influence the work reported.
References
- Li, H.T.; Wang, Q.; Zhuang, M.H.; Wu, J.J. Characterization and residual stress analysis of TiN/TiCN films on AZ31 magnesium alloy by PVD. Vacuum 2015, 112, 66–69. [Google Scholar] [CrossRef]
- Li, H.T.; Sun, P.F.; Zhu, Y.C.; Zhu, M.Z.; Wang, Q. Influence of C2H2 flows on microstructure and corrosion resistance of TiCN films doped with carbon atoms. Coatings 2018, 8, 458. [Google Scholar] [CrossRef] [Green Version]
- Li, H.T.; Sun, P.F.; Cheng, D.H.; Liu, Z.M. Effects of deposition temperature on structure, residual stress and corrosion behavior of Cr/TiN/Ti/TiN films. Ceram. Int. 2021, 47, 34909–34917. [Google Scholar] [CrossRef]
- Wu, G.S.; Wang, X.M.; Ding, K.J.; Zhou, Y.Y.; Zeng, X.Q. Corrosion behavior of Ti-Al-N/Ti-Al duplex coating on AZ31 magnesium alloy in NaCl aqueous solution. Mater. Charact. 2009, 60, 803–807. [Google Scholar] [CrossRef]
- Cai, F.; Zhang, J.; Wang, J.; Zheng, J.; Wang, Q.; Zhang, S. Improved adhesion and erosion wear performance of CrSiN/Cr multi-layer coatings on Ti alloy by inserting ductile Cr layers. Tribol. Int. 2021, 153, 106657. [Google Scholar] [CrossRef]
- Shao, T.; Ge, F.; Dong, Y.; Li, K.; Li, P.; Sun, D.; Huang, F. Microstructural effect on the tribo-corrosion behaviors of magnetron sputtered CrSiN coatings. Wear 2018, 416, 44–53. [Google Scholar] [CrossRef]
- Ge, F.; Shao, T.; Jia, C.; Li, P.; Huang, F. Tribological behaviors of a magnetron sputtered CrSiN coatings under ambient air and wet environments. Surf. Technol. 2017, 332, 304–311. [Google Scholar] [CrossRef]
- Wang, Q.Z.; Ding, Y.S.; Zhou, F.; Kong, J.Z. Comparison of mechanical and tribological properties of Ni-CrSiN and Cu-CrSiN coatings via thermal-cold cycling treatment. Surf. Coat. Technol. 2020, 400, 126232. [Google Scholar] [CrossRef]
- Fu, Y.Q.; Zhou, F.; Zhang, M.D. The enhancement of individual friction and corrosion properties of CrSiN coatings by Mo doping in seawater. Surf. Coat. Technol. 2022, 432, 128069. [Google Scholar] [CrossRef]
- Sveen, S.; Andersson, J.; M’Saoubi, R.; Olsson, M. Scratch adhesion characteristics of PVD TiAlN deposited on high speed steel, cemented carbide and PCBN substrates. Wear 2013, 308, 133–141. [Google Scholar] [CrossRef]
- Capote, G.; Silva, G.F.; Trava-Airoldi, V.J. Effect of hexane precursor diluted with argon on the adherent diamond-like properties of carbon films on steel surfaces. Thin Solid Film. 2015, 589, 286–291. [Google Scholar] [CrossRef]
- Li, H.T.; Sun, P.F.; Cheng, D.H. Structure and properties of a-C:H:Si:O films deposited by cage-like hollow cathode discharge on AZ31 alloy. Tribol. Int. 2022, 175, 107848. [Google Scholar] [CrossRef]
- Wang, W.L.; Yu, L.H.; Xu, J.H. Preparation of CrSiN-Ag films and evaluation of their properties. Mater. Prot. 2018, 51, 12–17. (In Chinese) [Google Scholar]
- Li, H.T.; Sun, P.F.; Cheng, D.H. Structure and properties of DLC films deposited on Mg alloy at different C2H2 flows of magnetron sputtering process. Coatings 2021, 11, 815. [Google Scholar] [CrossRef]
- Xu, F.M.; Luo, L.; Xiong, L.; Liu, Y. Microstructure and corrosion behavior of ALD Al2O3 film on AZ31 magnesium alloy with different surface roughness. J. Magnes. Alloy. 2020, 8, 480–492. [Google Scholar] [CrossRef]
- Zhu, L.-H.; Song, C.; NI, W.-Y.; Liu, Y.-X. Effect of 10% Si addition on cathodic arc evaporated TiAlSiN coatings. Trans. Nonferrous Met. Soc. China 2016, 26, 1638–1646. [Google Scholar] [CrossRef]
- Zhou, Z.C.; Zhang, H.; Zhang, X. Friction and wear behavior of CrSiN coatings deposited by plasma enhanced magnetron sputtering. Surf. Technol. 2020, 49, 185–191. (In Chinese) [Google Scholar]
- Chinh, N.Q.; Olasz, D.; Ahmed, A.Q.; Sáfrán, G.; Lendvai, J.; Langdon, T.G. Modification of the Hall-Petch relationship for submicron-grained fcc metals. Mater. Sci. Eng. A 2023, 862, 144419. [Google Scholar] [CrossRef]
- Su, K.; Liu, D.M.; Shao, T.M. Microstructure and mechanical properties of TiAlSiN nano-composite coatings deposited by ion beam assisted deposition. Sci. China 2015, 58, 1682–1688. [Google Scholar] [CrossRef]
- Wu, Y.; Wang, L.; Chen, Q.; Huang, B.; Zhang, E.; Zhou, Q.; Zheng, G. Properties and milling performance of AlTiN and TiAlSiN coatings prepared by cathodic arc. China Ceram. 2019, 55, 29–35. (In Chinese) [Google Scholar]
- Daghbouj, N.; Sen, H.; Callisti, M.; Vronka, M.; Karlik, M.; Duchoň, J.; Čech, J.; Havránek, V.; Polcar, T. Revealing nanoscale strain mechanisms in ion-irradiated multilayers. Acta Mater. 2022, 229, 117807. [Google Scholar] [CrossRef]
- Daghbouj, N.; Li, B.S.; Callisti, M.; Sen, H.S.; Karlik, M.; Polcar, T. Microstructural evolution of helium-irradiated 6H–SiC subjected to different irradiation conditions and annealing temperatures: A multiple characterization study. Acta Mater. 2019, 181, 160–172. [Google Scholar] [CrossRef]
- Daghbouj, N.; Sen, H.S.; Čížek, J.; Lorinčík, J.; Karlik, M.; Callisti, M.; Čech, J.; Havránek, V.; Li, B.; Krsjak, V.; et al. Characterizing heavy ions-irradiated Zr/Nb: Structure and mechanical properties. Mater. Des. 2022, 219, 110732. [Google Scholar] [CrossRef]
- Kaseem, M.; Kamil, M.P.; Ko, Y.G. Electrochemical response of MoO2-Al2O3 oxide films via plasma electrolytic oxidation. Surf. Coat. Technol. 2017, 322, 163–173. [Google Scholar] [CrossRef]
- Kaseem, M.; Hussain, T.; Baek, S.H.; Ko, Y.G. Formation of stable coral reef-like structures via self-assembly of functionalized polyvinyl alcohol for superior corrosion performance of AZ31 Mg alloy. Mater. Des. 2020, 193, 108823. [Google Scholar] [CrossRef]
- Hussain, T.; Kaseem, M.; Ko, Y.G. Hard acid–hard base interactions responsible for densification of alumina layer for superior electrochemical performance. Corros. Sci. 2020, 170, 108663. [Google Scholar] [CrossRef]
- Zhang, X.; Xiao, G.-Y.; Jiang, C.-C.; Liu, B.; Li, N.-B.; Zhu, R.-F.; Lu, Y.-P. Influence of process parameters on microstructure and corrosion properties of hopeite coating on stainless steel. Corros. Sci. 2015, 94, 428–437. [Google Scholar] [CrossRef]
- Wang, Q.Z.; Lin, Y.G.; Zhou, F.; Kong, J.Z. Electrochemical properties promotion of CrSiN coatings in seawater via Ni incorporation. J. Alloys Compd. 2021, 856, 157450. [Google Scholar] [CrossRef]
Figure 1.
XRD patterns of the composite coating.

Figure 2.
Morphology observation of the composite coatings (a) 20 min; (b) 35 min; (c) 50 min; (d) 65 min; (e,f) cross-section of 35 min and 50 min; (g) HRTEM of 50 min.
Figure 2.
Morphology observation of the composite coatings (a) 20 min; (b) 35 min; (c) 50 min; (d) 65 min; (e,f) cross-section of 35 min and 50 min; (g) HRTEM of 50 min.

Figure 3.
Mechanical property index of the Nano-indentation test. (a) H and E; (b) Elasticity factor (H/E) and shaping factor (H3/E2).
Figure 3.
Mechanical property index of the Nano-indentation test. (a) H and E; (b) Elasticity factor (H/E) and shaping factor (H3/E2).

Figure 4.
A.E curves of the coatings during the scratch test.

Figure 5.
(a) Polarization curves; (b) Nyquist plots; (c) Bode-Z plots. 20 min−1.4 μm; 35 min−1.66 μm; 50 min−1.92 μm; 65 min−2.26 μm.
Figure 5.
(a) Polarization curves; (b) Nyquist plots; (c) Bode-Z plots. 20 min−1.4 μm; 35 min−1.66 μm; 50 min−1.92 μm; 65 min−2.26 μm.

Figure 6.
SEM morphology of corrosive coatings (a) 20 min; (b) 35 min; (c) 50 min; (d) 65 min.

Figure 7.
Equivalent circuits to fit.


Table 1.
The specific deposition parameters of the coating.
| Layer | Bias Voltage (V) | DC (A) | Ar Flow (sccm) | N2 Flow (sccm) | TMS Flow (sccm) | Time (min) |
|---|---|---|---|---|---|---|
| Cr | −30 | 0.5 | 30 | 0 | 0 | 5 |
| CrN | −30 | 0.5 | 30 | 10 | 0 | 50 |
| CrSiN | −30 | 0.5 | 30 | 10 | 5 | 20, 35, 50, 65 |
Table 2.
Experimental results of nano-indentation test.
| Indexes | 20 min | 35 min | 50 min | 65 min |
|---|---|---|---|---|
| H/GPa | 10.89 | 15.31 | 19.17 | 21.45 |
| E/GPa | 121.5 | 145.2 | 170.9 | 185.2 |
| H/E | 0.0896 | 0.1054 | 0.1122 | 0.1158 |
| H3/E2 GPa | 0.0875 | 0.1702 | 0.2412 | 0.2877 |
Table 3.
Potentio-dynamic polarization parameters of the coatings.
| Samples | Ecorr (V) | Icorr (A·cm−2) | Rcorr (mm/year) | Pe (%) |
|---|---|---|---|---|
| 20 min | −1.184 | 6.64 × 10⁻⁶ | 0.147 | 99.15 |
| 35 min | −1.129 | 5.09 × 10⁻⁶ | 0.125 | 99.32 |
| 50 min | −1.074 | 4.38 × 10⁻⁶ | 0.075 | 99.56 |
| 65 min | −1.039 | 2.35 × 10⁻⁶ | 0.048 | 99.72 |
Table 4.
Characteristic of the equivalent circuit derived from the EIS spectra.
| Coatings | Rs (Ω cm2) | CPEdl1 (Ω−1sn cm−2) | CPEdl2 (Ω−1sn cm−2) | Rct (Ω cm2) | Rp (Ω cm2) |
|---|---|---|---|---|---|
| 20 min | 35 | 8.15 × 10⁻⁶ | 7.58 × 10⁻⁶ | 7.84 × 10⁵ | 1850 |
| 35 min | 37 | 7.76 × 10⁻⁶ | 7.06 × 10⁻⁶ | 9.75 × 10⁵ | 3850 |
| 50 min | 38 | 7.03 × 10⁻⁶ | 6.35 × 10⁻⁶ | 1.38 × 10⁶ | 6050 |
| 65 min | 41 | 5.95 × 10⁻⁶ | 5.88 × 10⁻⁶ | 2.16 × 10⁶ | 8330 |
Disclaimer/Publisher’s Note: The statements, opinions and data contained in all publications are solely those of the individual author(s) and contributor(s) and not of MDPI and/or the editor(s). MDPI and/or the editor(s) disclaim responsibility for any injury to people or property resulting from any ideas, methods, instructions or products referred to in the content. |
© 2023 by the authors. Licensee MDPI, Basel, Switzerland. This article is an open access article distributed under the terms and conditions of the Creative Commons Attribution (CC BY) license (https://creativecommons.org/licenses/by/4.0/).
Share and Cite
MDPI and ACS Style
Cui, C.; Yang, C. Study of Structural, Mechanical, and Corrosion Resistance of a Nanocomposite CrSiN/CrN/Cr Coating Deposited on AZ31: Effects of Deposition Time. Coatings 2023, 13, 678. https://doi.org/10.3390/coatings13040678
AMA Style
Cui C, Yang C. Study of Structural, Mechanical, and Corrosion Resistance of a Nanocomposite CrSiN/CrN/Cr Coating Deposited on AZ31: Effects of Deposition Time. Coatings. 2023; 13(4):678. https://doi.org/10.3390/coatings13040678
Chicago/Turabian StyleCui, Changqing, and Chunyan Yang. 2023. "Study of Structural, Mechanical, and Corrosion Resistance of a Nanocomposite CrSiN/CrN/Cr Coating Deposited on AZ31: Effects of Deposition Time" Coatings 13, no. 4: 678. https://doi.org/10.3390/coatings13040678
Note that from the first issue of 2016, this journal uses article numbers instead of page numbers. See further details here.