Review

Investigation of the Change in Roughness and Microhardness during Laser Surface Texturing of Copper Samples by Changing the Process Parameters

1
Faculty of Engineering, Rezekne Academy of Technology, LV-4601 Rēzekne, Latvia
2
Materials Science and Technology, University of Ruse “Angel Kanchev”, 7017 Ruse, Bulgaria
3
Department of Physics, Chemical and Ecology, Technical University of Gabrovo, 5300 Gabrovo, Bulgaria
*
Authors to whom correspondence should be addressed.
Coatings 2023, 13(11), 1970; https://doi.org/10.3390/coatings13111970
Submission received: 23 August 2023 / Revised: 2 November 2023 / Accepted: 8 November 2023 / Published: 20 November 2023

Abstract

:
The aim of this research is to achieve a high-quality and long-lasting laser marking of ammunition, which is of interest to the defense industry. The study is about the effects of speed, raster pitch and power on the roughness and microhardness of the marked areas of copper samples. The experiments were carried out with a fiber laser and a copper bromide laser—modern lasers widely used in industrial production. Laser power, scan speed and raster step were varied to determine their effects on the resulting microhardness and surface roughness. The lasers operate in different wavelength ranges, with the optical laser operating at 1064 nm in the near-infrared region and the copper bromide laser at 511 nm and 578 nm in the visible region, allowing the influence of wavelengths on the process to be investigated. The roughness and microhardness velocity dependence for three powers and two pulse durations for the fiber laser were obtained from the experimental data. The dependence of roughness and microhardness on the raster step for both types of lasers was also demonstrated.

1. Introduction

Copper and its alloys are some of the most widely used materials in industry, with applications in the production of ammunition, non-magnetic tools and equipment, architectural elements, sculptures, products requiring high thermal conductivity, electrical and electronic products, etc. [1,2,3].
Laser surface texturing is one of the most innovative material processing technologies nowadays, where new surface properties are obtained, and with significant applications in tribology, medicine, aeronautics, etc. [4,5,6,7,8]. Laser texturing technology has a number of advantages, such as non-contact processing, precision, reproducibility, high productivity and environmental friendliness [9,10,11].
Among several techniques for laser-induced texturing of metal surfaces, the attention of researchers has recently focused on the laser surface melting (LSM) technique, inducing significant changes in the microstructure [12,13,14,15,16,17].
In a number of articles, the authors research the influence of a number of technological parameters (average power, pulse sequence frequency, scan speed, defocus, step between lines, etc.) on the laser texturing process [18,19,20,21,22].
In their publication, M. Naumova and I. Morozova [18] studied the influence of technological parameters during laser texturing on the surface of brass samples for the purpose of forming an oxide layer and color marking. The influence of technological parameters, such as average power, pulse frequency and scan speed, on the depth of roughness during the technological process of titanium samples was studied by C. Velotti et al. [19]. They used a Yb: YAG fiber laser to conduct their experiments. The depth of roughness was also investigated by D. Gogoi in his master’s thesis, where he uses a CO2 laser, varying the power and scan speed. In publication [20], the author investigated the influence of speed, the number of repetitions and the volumetric density of absorbed energy on the process of laser marking of stainless-steel samples. In article [21], the researcher analyzed laser texturing of the surface of copper samples by achieving super hydrophobicity based on certain surface modifications and roughness. The author of a master’s thesis, [22], performed laser engraving with a CO2 laser and concluded that the laser power, scanning speed and number of dots per inch have convincing effects on the samples. In the experiments, it was observed that, as the laser power increased, the surface roughness increased, while lower and mid-range laser power resulted in better surface quality with lower roughness.
In [23], the authors used a dual-frequency Nd: YAG green laser for laser texturing while considering the crucial influence of the scanning speed on the surface roughness. The authors of [24] performed laser texturing of several materials to study the dependence of the process on the absorption of laser radiation and the thermal properties of the material. It was unequivocally shown that the processing of materials strongly depends on the absorption of laser radiation and the thermal properties of the materials. Of all the laser machined materials (copper, aluminum, steel and titanium), copper is the most difficult to machine due to its high reflectivity. This imposes and requires the highest laser power in the processing area (from 1 kW at a processing speed of 0.1 m/min).
A number of studies also consider issues related to the change in microhardness in the processing area after laser impact. The authors of [25] investigated the increase in hardness of a 6 mm thick mild steel substrate after laser processing with 30 W and a fiber laser (1060 nm) with a beam diameter of 0.4 mm. By laser processing the substrate with a laser power of 21 W, a 100 µm raster step, 200 kHz frequency and a scan speed of 40 mm/s and analyzing it with a load of 0.5 kg and hold of 10 s, the highest microhardness achieved for mild steel was 281.72 HV. The marked zone of greater microhardness has a martensitic grain structure, which gives an increase of 86% in the surface microhardness of the substrate. In the analysis in [26], the researchers found that the laser beam treatment introduces a self-hardening effect on the copper surface, due to which the microstructure of the copper surface changes and an increase in hardness occurs. In addition, laser processing caused rapid surface melting and recrystallization of the surface of the copper specimen, resulting in lower roughness and higher microhardness and corrosion resistance effects in the nature of the material. The results obtained in [27] show that the change in the overlap of the laser beam leads to an increased hardness of the copper surface.
As a result of this analysis, we can state that the publications on laser texturing and marking of copper products are extremely few in number.
For this reason, the aim of our research was to contribute to a more in-depth study of the process of laser texturing of copper samples by analyzing the influence of some basic parameters, such as laser radiation power, processing speed, raster step and the influence of wavelengths for two types of lasers (a fiber laser and a copper bromide laser) on roughness and microhardness.

2. Materials and Methods

The methodology used here makes it possible to analyze the relationship between the contrast, roughness and microhardness of some parameters, such as scanning speed (v), raster step (Δx), power (P) and pulse duration (τ). The sequence for planning and performing the experiments is as follows:
(a)
Setting tasks to be performed in the present experiments:
  • Determination of roughness dependence on velocity—Ra = Ra (v)—for a fiber laser for two pulse durations.
  • Determining the dependence of microhardness on speed—HV = HV(v)—for a fiber laser for two pulse durations.
  • Determining the dependence of roughness on the raster step—Ra = Rax)—for a fiber laser and a copper bromide laser.
  • Determining the dependence of microhardness on the raster step—HV = HVx)—for a fiber laser and a copper bromide laser.
(b)
Designing matrices for performing the experiments:
For each task, a separate matrix is made with changes to the various technological parameters. An example matrix is shown in Figure 1. It is suitable for the implementation of tasks 1 and 2. The rows provide different velocity values for each square. Different power values are provided along the columns. Matrixes of similar structure are made for tasks 1–4 (see Figure 1, Figure 2 and Figure 3).
(c)
Performing experiments and marking of samples:
The marked areas are square shaped with dimensions of 10 mm × 10 mm with 2 mm distance between them. The copper plates are marked with a Rofin F20 fiber laser (1064 nm) and a CuBr laser (511 and 578 nm). During maceration with a Rofin F20 fiber laser on 3 copper plates (Figure 1), 24 planned experiments were carried out with a changing speed from 10 to 80 mm/s in a step of 10 mm/s and an average power of 4.72 W, 6.61 W and 9.31 W, with constant parameters being the raster pitch, focal length 184 mm, frequency 20 kHz and pulse duration 100 ns, with a pulse duration of 200 ns for the repeated experiment. When marking the experimental matrix (Figure 2) with a Rofin F20 fiber laser on the copper plate, 24 planned experiments were carried out with a changing marking speed of 15 mm/s, 45 mm/s and 90 mm/s and a raster step of 3 µm, 5 µm, 7 µm, 10 µm, 12 µm, 15 µm, 17 µm and 20 µm, with the constant parameters being average power, focal length 183 mm, frequency 20 kHz and pulse duration 100 ns. For the laser marking of 3 copper sheets with a CuBr laser, the experimental matrix consisted of 18 experiments with memorized parameters of marking speeds of 30 mm/s, 45 mm/s and 90 mm/s and a raster step of 3 µm, 7 µm, 12 µm, 17 µm, 22 µm and 27 µm, with constant parameters being an average power of 10 W, a focal length of 300 mm, frequency of 20 kHz and pulse duration of 30 ns.
(d)
Roughness measurement (for each square):
Roughness measurements and the resulting microstructure were examined with an Olympus model “OLS5100-EAF” laser microscope. The obtained microstructural images were carried out using a 20× objective, with a magnification of 451×, as the examined area for each measurement was 644 × 644 µm, with a measurement accuracy of ±0.03 µm.
From the obtained 3D images with the laser system of the microscope, the roughness Ra and Rz perpendicular to the marking lines with a length of 644 µm and the roughness Rq for the entire examined area, 644 × 644 µm, were measured. The obtained values are plotted in tables and graphical dependencies of changes in roughness depending on speed and raster step during surface laser processing are shown. The built dependencies are presented in the results.
(e)
Microhardness measurement (for each square):
The hardness measurement was carried out according to the Vikes method with Inovatest “Nexus 4000-4302”; its capabilities are presented. The choice of load was established according to microscopic analysis and surface roughness. The maximum load is 1.961 N, with 5 consecutive measurements performed in a 200 µm step in the marked area. Measurements took place at a microscopic zoom of 40×. The measured values are tabulated and averaged over the five measurements of each mark. With the obtained data, graphical dependencies were built for the influence of speed, pitch and mass on the roughness and hardness. Comparison charts were also constructed and are presented in Section 3 results.

3. Results

The marked substrates of Cu by fiber and copper-bromide laser were analyzed under a laser microscope and hardness tester for average roughness and micro-hardness, respectively. To determine the change in roughness (Ra) and hardness (HV) after laser marking, they were measured in the delivery condition (Figure 4). The initial roughness in the condition of delivery of the copper plates is in the range of 0.22 µm to 0.64 µm. The measured hardness as delivered (before laser treatment) for the copper plates is in the range of 61.2 HV to 67.1 HV.

3.1. Determination of Roughness Dependence on Velocity—Ra = Ra(v)—For a Fiber Laser for Two Pulse Durations

During the experiments, the speed v varied from 10 mm/s to 80 mm/s. The studies were at two pulse durations, 100 ns and 200 ns. The following parameters were kept constant: frequency 20 kHz and raster step 10 μm. A comparison of the marked surfaces (highest and lowest roughness) can be observed in Figure 5 and Figure 6. The graphical images in Figure 7 depict the obtained analytical values of the average roughness of the Cu after the laser treatment for a pulse duration τ of 100 ns (Figure 7a) and 200 ns (Figure 7b). The graphical analysis is as follows:
  • For the three average powers P, with the increasing laser marking speed, a decrease in the roughness can be observed for τ = 100 ns and τ = 200 ns.
  • For the pulse duration of τ = 100 ns: At the power P of 4.72 W with a change in speed from 10 mm/s to 80 mm/s, the roughness changes from 5.5 μm to 0.38 μm. At the power of 6.61 W with a change in speed from 10 mm/s to 80 mm/s, the roughness Ra changes from 5.99 μm to 0.38 μm. At the power of 9.31 W with a change in speed v from 10 mm/s to 80 mm/s, the roughness Ra changes from 7.65 μm to 0.38 μm.
  • For the pulse duration of τ = 200 ns: At the power P of 10 W with a change in speed v from 10 mm/s to 80 mm/s, the roughness Ra decreases from 6.33 μm to 4.87 μm. At the power P of 14 W with a change in speed v from 10 mm/s to 80 mm/s, the roughness Ra increases from 9.5 μm to 6.33 μm. At the power P of 19.4 W with a change in speed v from 10 mm/s to 50 mm/s, the roughness Ra increases from 14.5 μm to 10.2 μm.
  • When compared with the results of τ = 100 ns pulse duration, it was noticed that the roughness Ra obtained at 200 ns is more stable, rather than the downfall of the achieved graph at 100 ns. The reason is the larger pulse energy at a τ = 200 ns pulse duration than that at τ = 100 ns. At high speeds v of 70–80 mm/s, the roughness Ra of the marked surface approaches that of the background for τ = 100 ns.

3.2. Determining the Dependence of Microhardness on Speed—HV = HV(v)—For a Fiber Laser for Two Pulse Durations

The graphical representations in Figure 8 depict the obtained analysis values of the microhardness of Cu after laser processing for a pulse duration of τ = 100 ns (Figure 8a) and τ = 200 ns (Figure 8b). The graphical analysis is as follows:
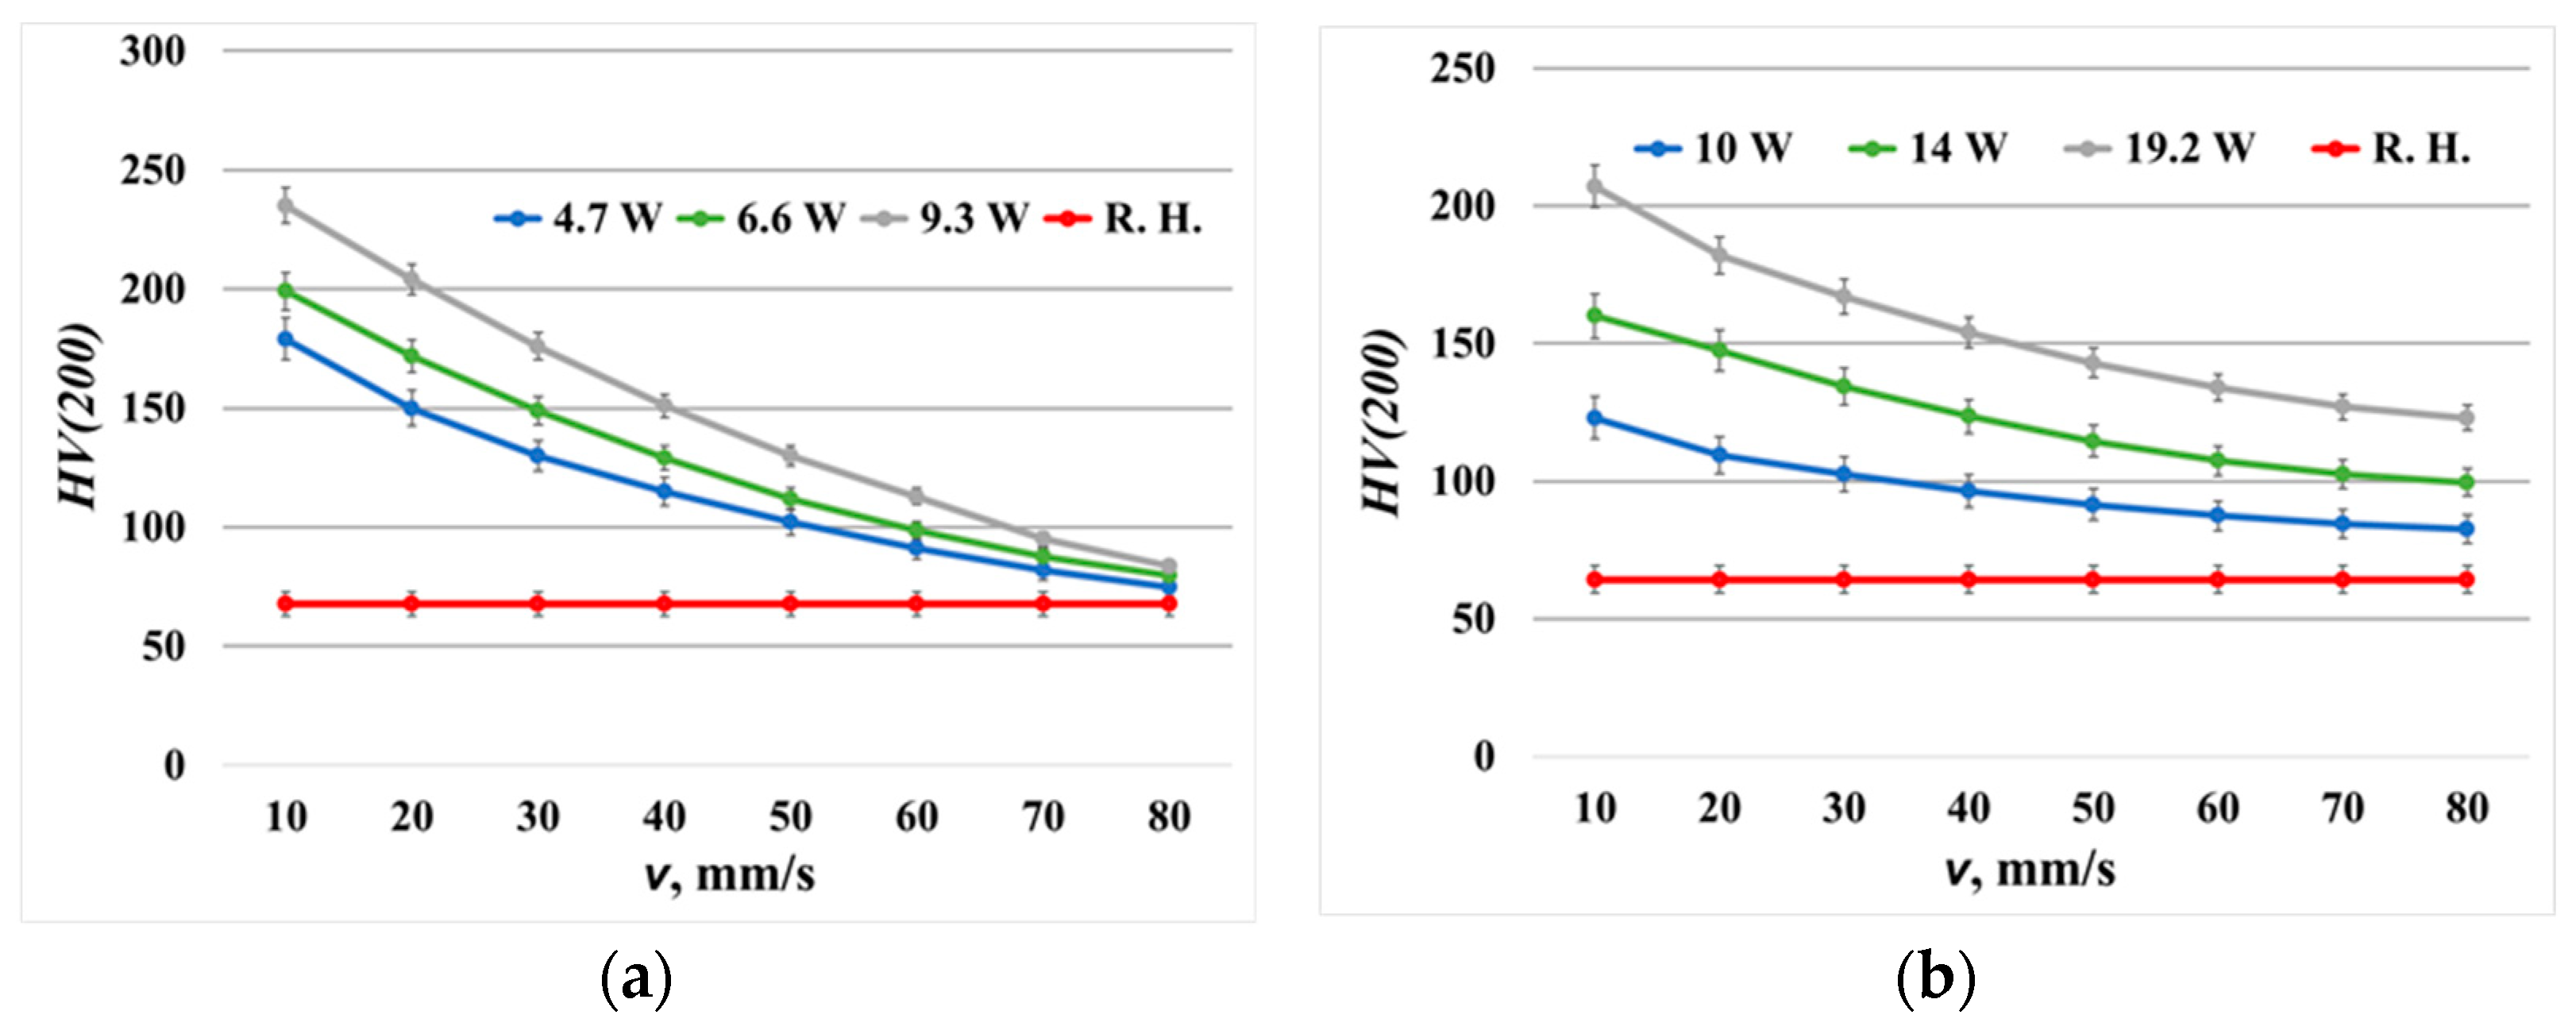
  • For the three powers, with the increasing laser marking speed, a decrease in the microhardness can be observed for τ = 100 ns and τ = 200 ns.
  • For the pulse duration of 100 ns: At the power P = 4.72 W with a change in speed v from 10 mm/s to 80 mm/s, the microhardness HV changes from 179 to 75. At the power P = 6.61 W with a change in speed v from 10 mm/s to 80 mm/s, the microhardness HV changes from 199 to 80. At the power P = 9.31 W with a change in speed v from 10 mm/s to 80 mm/s, the microhardness HV changes from 235 to 84.
  • For the pulse duration of 200 ns: At the power P = 10 W with a change in speed v from 10 mm/s to 80 mm/s, the microhardness changes HV from 123 to 82. At the power P of 14 W with a change in speed v from 10 mm/s to 80 mm/s, the microhardness HV changes from 160 to 100. At the power P = 19.4 W with a change in speed v from 10 mm/s to 80 mm/s, the microhardness HV changes from 207 to 123.
  • When compared with the results of τ = 100 ns pulse duration, it was noticed that the enhanced microhardness obtained at τ = 200 ns is more stable than that at τ = 100 ns.

3.3. Determining the Dependence of Roughness on Raster Step—Ra = Ra(Δx)—For a Fiber Laser and a CuBr Laser

During the experiments, the raster step Δx had values of 3 μm, 5 μm, 7 μm, 10 μm, 12 μm, 15 μm, 17 μm and 20 μm for the fiber laser. For the copper bromide laser, the raster step Δx values were 3 μm, 7 μm, 12 μm, 17 μm, 22 μm and 27 μm.
The following parameters were kept constant: for the fiber laser—frequency v = 20 kHz, pulse duration 100 ns and power P = 9.3 W; for the CuBr laser—frequency v = 20 kHz, pulse duration τ = 30 ns and power P = 5.5 W. A comparison of the marked surfaces (highest and lowest roughness) can be observed in Figure 9 and Figure 10. The graphical images in Figure 11 depict the obtained analytical values of the average roughness of the Cu after the laser treatment for the fiber laser (Figure 11a) and the CuBr laser (Figure 11b). The graphical analysis is as follows:
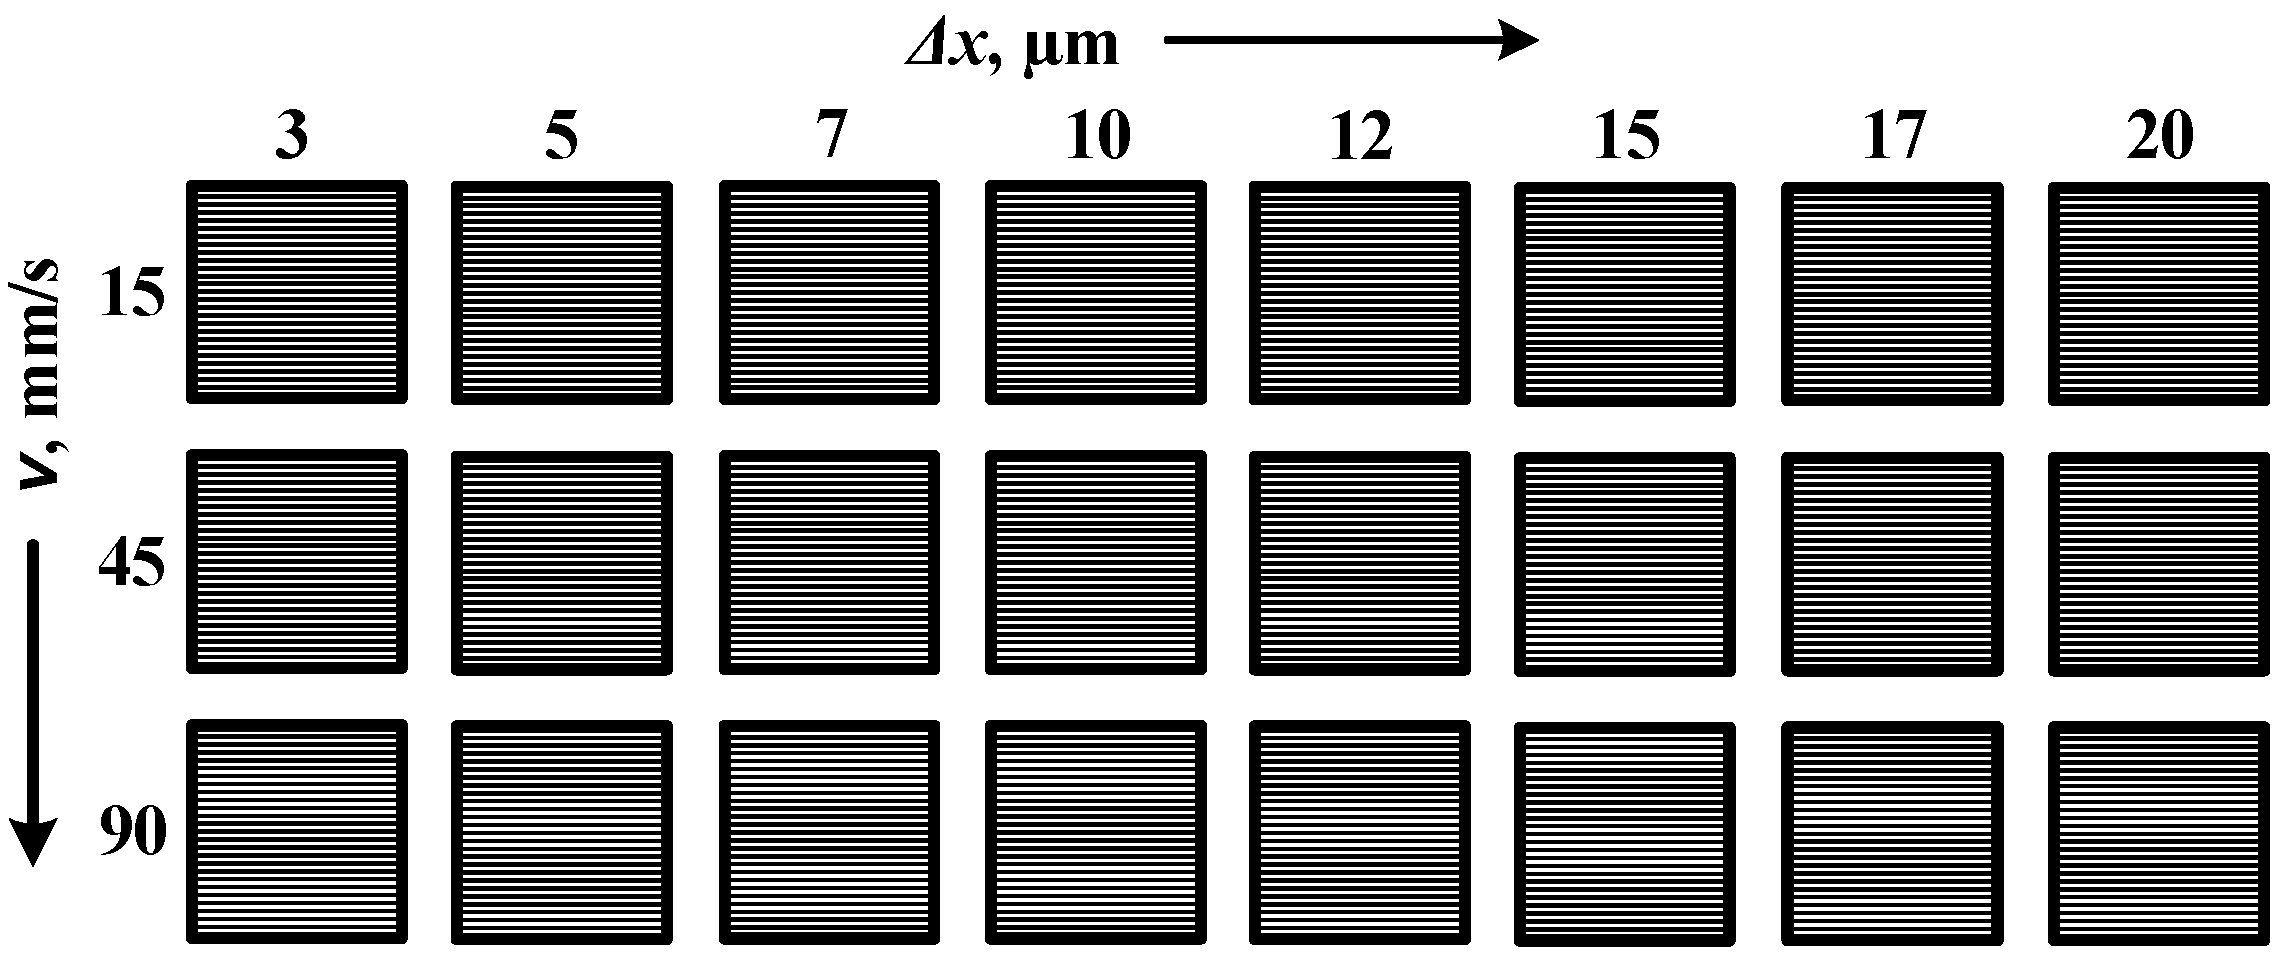
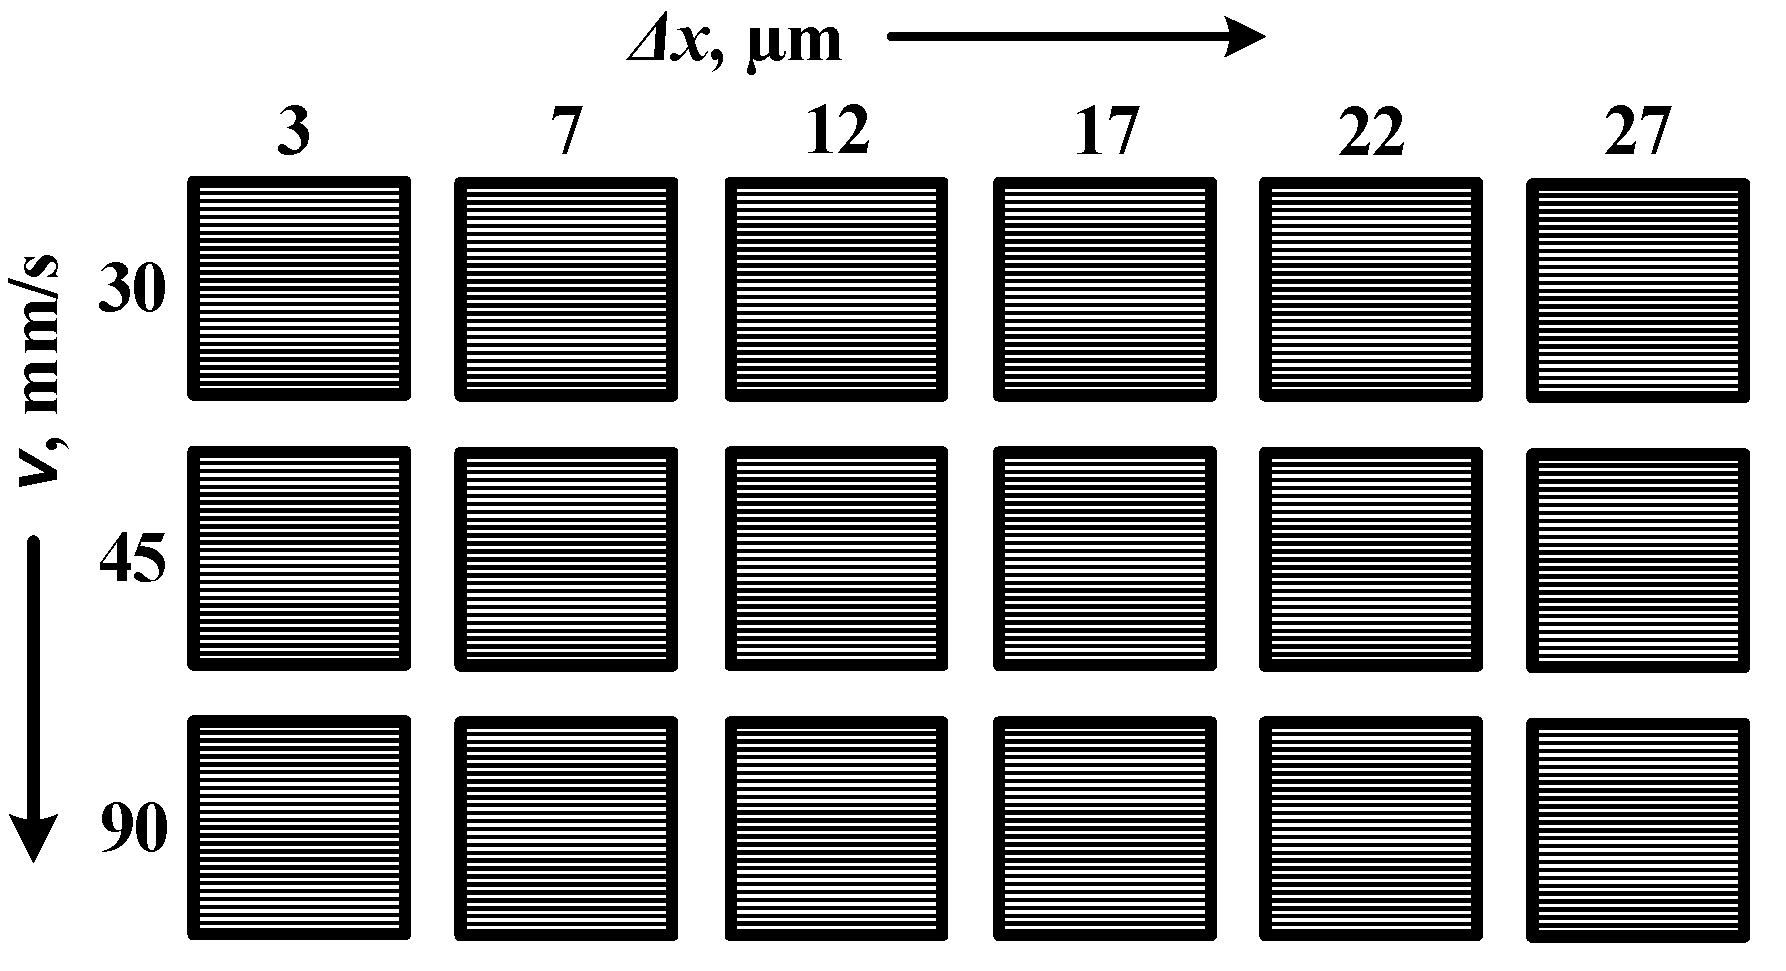
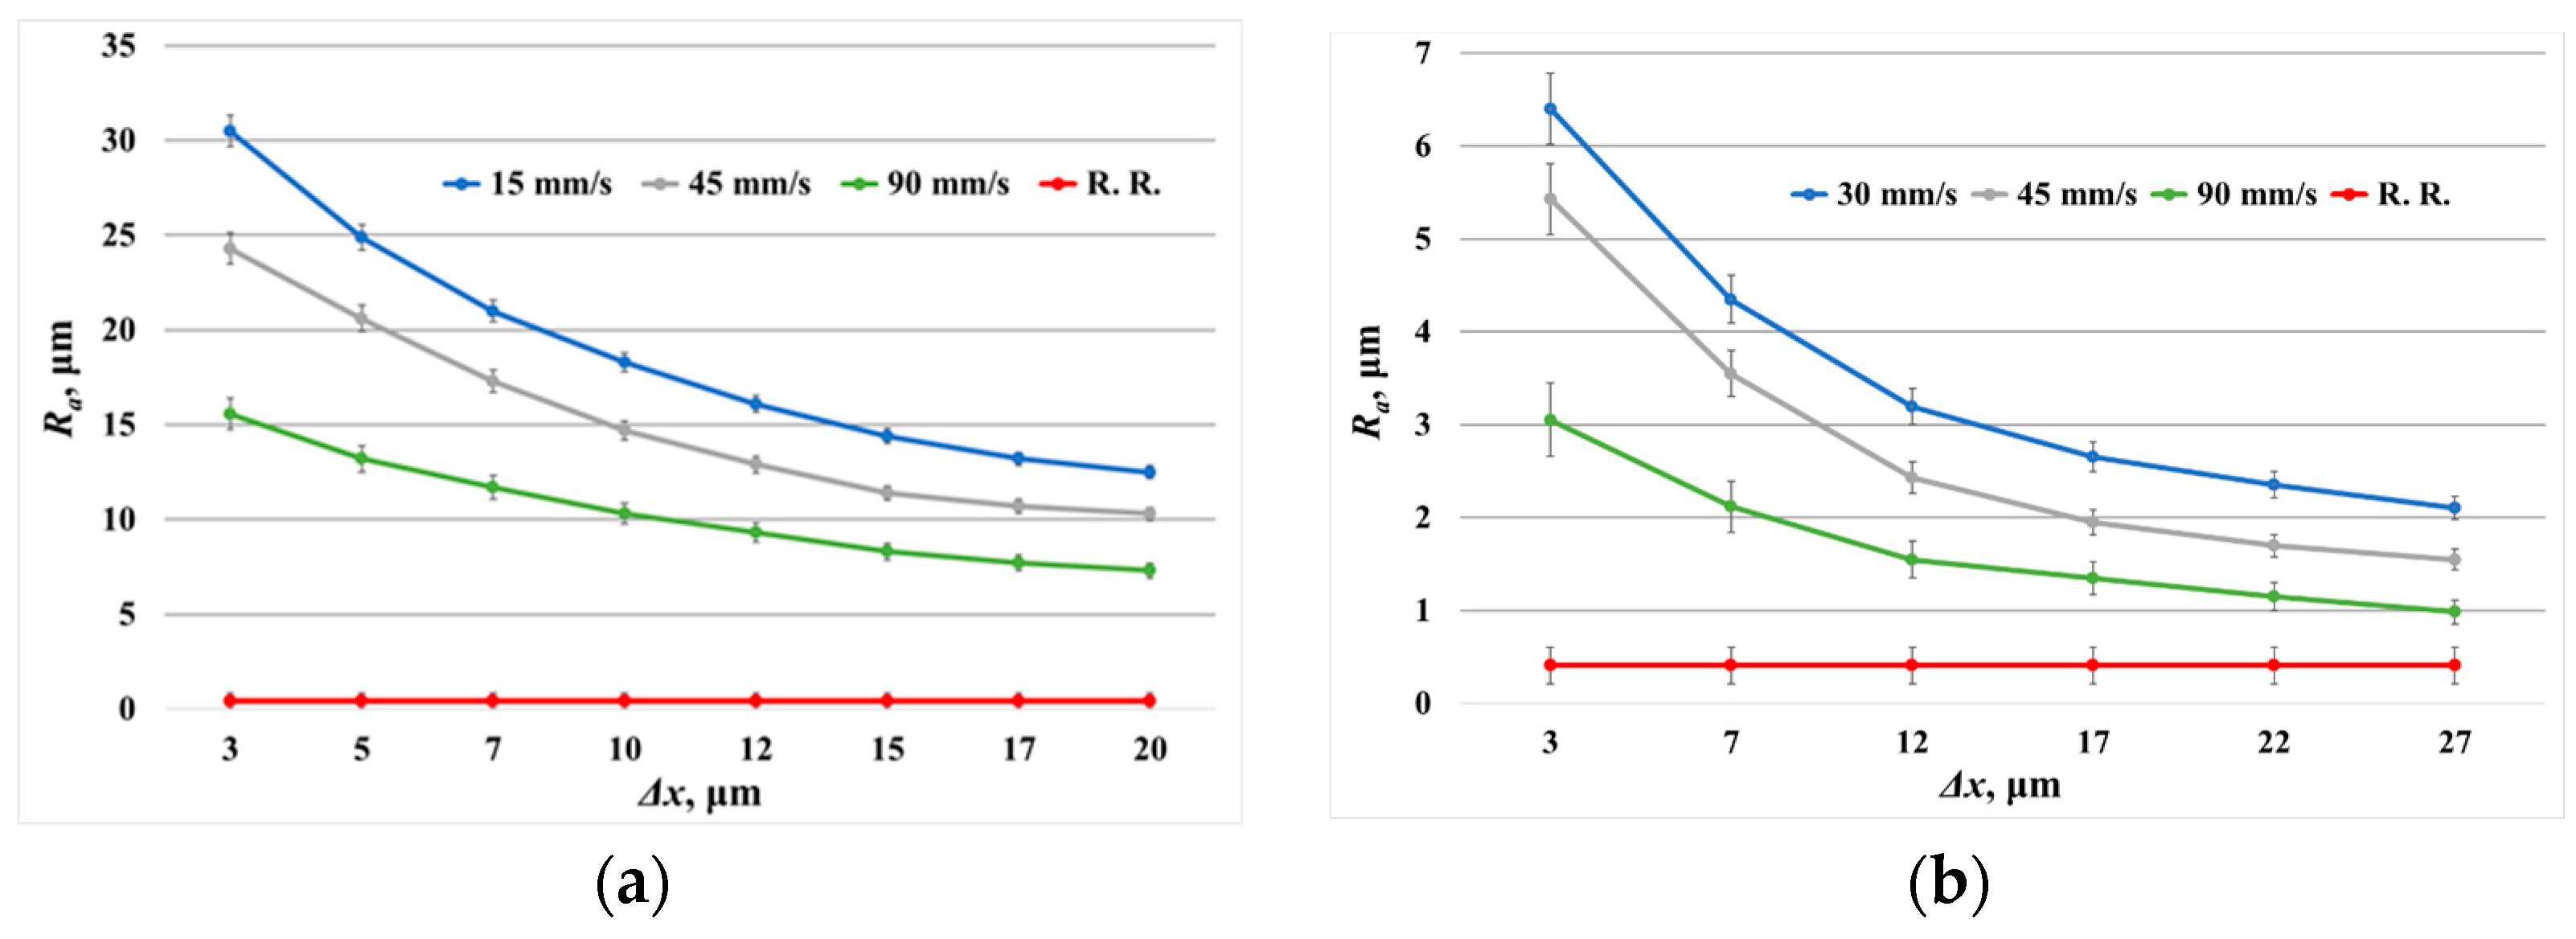
  • For the three speeds v, with the increasing raster step Δx, a decrease in the roughness Ra can be observed for the two lasers.
  • For the fiber laser: At the speed v of 15 mm/s with a change in raster step Δx from 3 μm to 20 μm, the roughness Ra decreases from 30.5 μm to 12.5 μm. At the speed v of 45 mm/s with a change in raster step Δx from 3 μm to 20 μm, the roughness Ra decreases from 24.3 μm to 10.3 μm. At the speed v of 90 mm/s with a change in raster step Δx from 3 μm to 20 μm, the roughness Ra decreases from 15.6 μm to 7.3 μm.
  • For the CuBr laser: At the speed v of 30 mm/s with a change in raster step Δx from 3 μm to 27 μm, the roughness Ra changes from 6.4 μm to 2.1 μm. At the speed v of 45 mm/s with a change in raster step Δx from 3 μm to 27 μm, the roughness Ra decreases from 5.4 μm to 1.6 μm. At the speed v of 90 mm/s with a change in raster step Δx from 3 μm to 27 μm, the roughness Ra decreases from 3.1 μm to 1.0 μm.

3.4. Determining the Dependence of Microhardness on Raster Step—HV = HV(Δx)—For a Fiber Laser and a Copper Bromide Laser

The graphical images in Figure 12 depict the obtained analytical values of the microhardness of the Cu after the laser treatment for the fiber laser (Figure 12a) and the copper bromide laser (Figure 12b). The graphical analysis is as follows:
  • For the three speeds v, with the increasing raster step Δx, a decrease in the microhardness can be observed for the two lasers.
    -
    For the fiber laser: At the speed v of 15 mm/s with a change in raster step Δx from 3 μm to 20 μm, the microhardness HV decreases from 126 to 95. At the speed v of 45 mm/s with a change in raster step Δx from 3 μm to 20 μm, the microhardness HV changes from 143 to 137. At the speed v of 90 mm/s with a change in raster step Δx from 3 μm to 20 μm, the microhardness HV increases from 157 to 293.
    -
    For the CuBr laser: At the speed v of 30 mm/s with a change in raster step Δx from 3 μm to 27 μm, the microhardness HV decreases from 320 to 165. At the speed v of 45 mm/s with a change in raster step Δx from 3 μm to 27 μm, the microhardness HV changes from 273 to 130. At the speed v of 90 mm/s with a change in raster step Δx from 3 μm to 20 μm, the microhardness HV increases from 216 to 112.
  • Microhardness when marking with a CuBr laser is about 20% greater than when using a fiber laser. The reason is that the pulse power Pp for a copper bromide laser is 9.17 kW, while for a fiber laser it is only Pp = 4.65 kW.
  • For both lasers, microhardness HV gradually decreases with increasing speed v and raster step Δx.

4. Conclusions

The results show that the surface roughness Ra and microhardness HV for laser marking are dependent on laser parameters, like power P, pulse duration τ, scanning speed v and raster step Δx. It was noticed that with the increase in the power P and pulse duration τ, the roughness Ra and microhardness HV increased too, whereas, with the increase in the scanning speed v and raster step Δx, a decrease in the values of roughness Ra and microhardness HV were obtained.
Also, results were obtained for the impact of basic technological parameters, such as scanning speed v and raster step Δx, to optimize the process of laser marking of copper specimens with various lasers—a fiber laser and a CuBr laser. Specific values for the change in roughness and microhardness in the studied ranges of variation in the technological parameters were also obtained from the dependency graphs and analyses:
  • The surface roughness Ra and microhardness HV from speed v for three powers of laser radiation at pulse duration τ = 100 ns for the fiber laser. For the studied speed interval from 10 mm/s to 80 mm/s, it was found that with increasing speed, the roughness sharply decreases for all three powers, as the roughness changes from 5.50–7.65 μm to 0.38 μm, i.e., decreases 15–20 times. The microhardness decreases about 2.5 times in the studied speed interval.
  • The surface roughness Ra and microhardness HV from speed v for three powers of laser radiation at pulse duration τ = 200 ns for the fiber laser. Again, as the speed increases, the roughness decreases, but the reduction is about 30% for the whole range of speeds, i.e., significantly slower compared to the pulse duration τ = 100 ns. It is found that the microhardness at pulse duration τ = 100 ns is about two times greater than that at pulse duration τ = 200 ns.
  • The surface roughness Ra and microhardness HV from the raster step Δx for three speeds v for the fiber laser. When changing the raster step from 3 μm to 20 μm, the roughness decreases by 2.5 times, and the microhardness decreases by nearly two times.
  • The surface roughness Ra and microhardness HV from the raster step for three speeds v for the CuBr laser at τ = 30 ns. When changing the raster step from 3 μm to 27 μm, the roughness decreases by three times, and the microhardness decreases by about 1.9 W times.
The results are suitable for obtaining a complete picture of the laser marking process and can be applied to the analysis of other technological processes related to laser surface treatment. The results are suitable for the field of mechanical engineering and the military industry, where surface treatments and tribological characteristics are of utmost importance.

Author Contributions

Conceptualization—L.L. and E.Y.; methodology—E.Y. and R.S.G.; validation—L.L., E.Y. and R.S.G.; formal analysis—L.L., N.A., E.Y. and R.S.G.; investigation—R.S.G. and E.Y.; data curation—N.A., R.S.G., E.Y. and L.L.; writing—original draft preparation—R.S.G., E.Y., N.A. and L.L.; writing—review and editing—L.L., E.Y. and N.A.; visu-alization—E.Y., N.A. and R.S.G.; supervision—L.L.; project administration—E.Y. and L.L.; funding acquisition—E.Y. All authors have read and agreed to the published version of the manuscript.

Funding

The authors gratefully acknowledge the financial support of the European Regional Development Fund, Postdoctoral research aid Nr. 1.1.1.2/16/I/001 research application “Analysis of the parameters of the process of laser marking of new industrial materials for high-tech applications, Nr. 1.1.1.2/VIAA/3/19/474”.

Institutional Review Board Statement

Not applicable.

Informed Consent Statement

Not applicable.

Data Availability Statement

Additional data from our research can be found in “Proceedings of the International Scientific and Practical Conference”, http://journals.rta.lv/index.php/index.

Conflicts of Interest

The authors declare no conflict of interest.

References

  1. Elshkaki, A.; Graedel, T.; Ciacci, L.; Reck, B.K. Copper demand, supply, and associated energy use to 2050. Glob. Environ. Chang. 2016, 39, 305–315. [Google Scholar] [CrossRef]
  2. Crisan, M.C.; Teodora, M.; Lucian, M. Copper Nanoparticles: Synthesis and Characterization, Physiology, Toxicity and Antimicrobial Applications. Appl. Sci. 2022, 12, 141. [Google Scholar] [CrossRef]
  3. Zeng-de, L.; Chen-Guang, L.; Shun, C. Development of Research and Application of Copper Alloys with High Strength and High Conductivity. Adv. Mater. Res. 2014, 1053, 61–68. [Google Scholar]
  4. Al-Mahdy, A.; Kotadia, H.R.; Sharp, M.C.; Opoz, T.T.; Mullett, J.; Ahuir-Torres, J.I. Effect of Surface Roughness on the Surface Texturing of 316 l Stainless Steel by Nanosecond Pulsed Laser. Lasers Manuf. Mater. Process. 2023, 10, 141–164. [Google Scholar] [CrossRef]
  5. Kouediatouka, A.N.; Ma, Q.; Liu, Q. Design Methodology and Application of Surface Texture: A Review. Coatings 2022, 112, 10–15. [Google Scholar]
  6. Kim, J.S.; Chung, C.-M.; Baik, S.H.; Lee, S.B. Study on laser-surface melting to enhance intergranular corrosion resistance of SUS 304 weld. Met. Mater. Int. 2011, 17, 77–82. [Google Scholar] [CrossRef]
  7. Mudali, U.K.; Dayal, R.K. Improving intergranular corrosion resistance of sensitized type 316 austenitic stainless steel by laser surface melting. J. Mater. Eng. Perform. 1992, 1, 341–345. [Google Scholar] [CrossRef]
  8. Zhang, Q.; Wang, Q.; Zhang, Z.; Su, H.; Fu, Y.; Xu, J. Surface micro-structuring of Sapphire by a Q-switched DPSS nanosecond pulsed laser. Mater. Sci. Semicond. Process 2020, 107, 104864. [Google Scholar] [CrossRef]
  9. Mao, B.; Siddaiah, A.; Liao, Y.; Menezes, P.L. Laser surface texturing is one of the used material processing techniques due to its precise, inexpensive, and environmentally friendly results and methods. J. Manuf. Process. 2020, 53, 153–173. [Google Scholar] [CrossRef]
  10. Lawrence, J.; Waugh, D.G. Laser Surface Engineering. In Woodhead Publishing Series in Electronic and Optical Materials; Woodhead Publishing: Sawston, UK, 2015; ISBN 9781782420743. [Google Scholar]
  11. Jeyaprakash, N.; Yang, C.H.; Kumar, D.R. Laser Surface Modification of Materials; Practical Applications of Laser Ablation IntechOpen: Rijeka, Chorvatsko, 2020. [Google Scholar] [CrossRef]
  12. Yan, X.; Chen, C.; Chang, C.; Dong, D.; Zhao, R.; Jenkins, R.; Wang, J.; Ren, Z.; Liu, M.; Liao, H.; et al. Study of the microstructure and mechanical performance of C-X stainless steel processed by selective laser melting (SLM). Mater. Sci. Eng. A 2020, 781, 139227. [Google Scholar] [CrossRef]
  13. Majumdar, J.D.; Galun, R.; Mordike, B.L.; Manna, I. Effect of laser surface melting on corrosion and wear resistance of a commercial magnesium alloy. Mater. Sci. Eng. A 2003, 361, 119–129. [Google Scholar] [CrossRef]
  14. Conde, A.; Colaço, R.; Vilar, R.; De Damborenea, J. Corrosion behavior of steels after laser surface melting. Matter. Des. 2000, 21, 441–445. [Google Scholar]
  15. Yang, S.; Wang, Z.; Kokawa, H.; Sato, Y.S. Reassessment of the effects of laser surface melting on IGC of SUS 304. Mater. Sci. Eng. A. 2008, 474, 112–119. [Google Scholar] [CrossRef]
  16. Chan, W.K. Laser Surface Melting (LSM) of Stainless Steels for Mitigating Intergranular Corrosion (IGC). In Woodhead Publishing Series in Metals and Surface Engineering; Elsevier: Amsterdam, The Netherlands, 2012. [Google Scholar]
  17. Hou, J.; Chen, W.; Chen, Z.; Zhang, K.; Huang, A. Microstructure, tensile properties and mechanical anisotropy of selective laser melted 304L stainless steel. J. Mater. Sci. Technol. 2020, 48, 63–71. [Google Scholar] [CrossRef]
  18. Naumova, M.G.; Morozova, I.G.; Zarapin, A.Y.; Borisov, P.V. Copper Alloy Marking by Altering its Surface Topology Using Laser Heat Treatment. Metallurgist. 2018, 62, 464–469. [Google Scholar] [CrossRef]
  19. Velotti, C.; Astarita, A.; Leone, C.; Genna, S.; Minutolo FM, C.; Squillace, A. Laser marking of titanium coating for aerospace applications. CIRP Conf. Manuf. Syst.-CIRP CMS 2015 Procedia CIRP 2016, 41, 975–980. [Google Scholar] [CrossRef]
  20. Angelov, N. Investigation the Influence of the Number of Repetition and Volumetric Energy Density on Laser Marking of Products. Contemp. Mater. 2014, 2, 250–253. [Google Scholar]
  21. Ma, L.; Wang, L.; Li, C.; Guo, J.; Shrotriya, P.; Deng, C.; Zhao, J. Hybrid Nanosecond Laser Processing and Heat Treatment for Rapid Preparation of Super-Hydrophobic Copper Surface. Metals 2019, 9, 668. [Google Scholar] [CrossRef]
  22. Gogoi, D. Optimization of Operating Parameters of Laser Engraving for Surface Roughness; Catalog Number V1144641; 2020; 57p, ISBN 9783346524065. Available online: https://www.grin.com/document/1144641 (accessed on 22 August 2023).
  23. Hamadi, F.; Amara, E.-H.; Kellou, H. Optimization of Laser Marking Process Parameters for Surface Roughness and Surface Reflectance. Conf. Conf. Laser Ablation COLA 2017. Available online: https://www.researchgate.net/publication/320286953_Optimization_of_laser_marking_process_parameters_for_surface_roughness_and_surface_reflectance (accessed on 22 August 2023).
  24. Prasad, H.S.; Brueckner, F.; Volpp, J.; Kaplan, A.F.H. Laser metal deposition of copper on diverse metals using green laser sources. Int. J. Adv. Manuf. Technol. 2020, 107, 1559–1568. [Google Scholar] [CrossRef]
  25. Salleh, M.N.M.; Ishak, M.; Aiman, M.H.; Zaifuddin, Q.; Quazi, M.M. The effect of laser surface hardening on the surface hardness of mild steel. IOP Conf. Ser. Mater. Sci. Eng. 2020, 788, 012014. [Google Scholar] [CrossRef]
  26. Mosleh, L.A.R.; Qasim, A. Enhancement of the corrosion resistance of copper metal by laser surface treatment. Iraqi J. Phys. 2020, 18, 13–19. [Google Scholar] [CrossRef]
  27. Chukwuike, V.I.; Echem, O.G.; Prabhakaran, S.; AnandKumar, S.; Barik, R.C. Laser shock peening (LSP): Electrochemical and hydrodynamic investigation of corrosion protection pre-treatment for a copper surface in 3.5% NaCl medium. Corros. Sci. 2021, 179, 109156. [Google Scholar] [CrossRef]
Figure 1. Matrix for performing experiments with a fiber laser for τ = 100 ns and τ = 200 ns at varying marking speed and average power.
Coatings 13 01970 g001
Figure 2. Matrix for performing experiments with a fiber laser for τ = 100 ns at varying marking speed and raster step.
Coatings 13 01970 g002
Figure 3. Matrix for performing experiments with a CuBr laser for τ = 30 ns at varying marking speed and raster step.
Coatings 13 01970 g003
Figure 4. Images at 451× magnification of (a) microstructure of the measured hardness of an untreated surface, (b) measured hardness on a laser-marked surface with an overlap factor, and (c) measured hardness on a laser-marked surface without overlap.
Coatings 13 01970 g004
Figure 5. Images of the comparison of the highest and lowest roughness Ra of copper sample at τ = 100 ns. (a) P = 9.3 W at v = 10 mm/s, and (b) P = 9.3 W at v = 80 mm/s, respectively.
Coatings 13 01970 g005
Figure 6. Images of the comparison of the highest and lowest roughness of copper sample at τ = 200 ns. (a) P = 19.4 W at v = 10 mm/s, and (b) P = 19.4 W at v = 80 mm/s, respectively.
Coatings 13 01970 g006
Figure 7. Graphical representation of the average roughness measurements of the copper sample, marked with a fiber laser for (a) τ = 100 ns; (b) τ = 200 ns.
Coatings 13 01970 g007
Figure 8. Graphical representation of the microhardness measurements of the copper plate, marked with a fiber laser for (a) τ = 100 ns; (b) τ = 200 ns.
Coatings 13 01970 g008
Figure 9. Images of the comparison of the highest and lowest roughness Ra of the fiber-marked sample at τ = 100 ns, (a) v = 90 mm/s, Δx = 3 μm, and (b) v = 90 mm/s, Δx = 20 μm, respectively.
Coatings 13 01970 g009
Figure 10. Images of the comparison of the highest and lowest roughness Ra of the CuBr marked sample at τ = 30 ns, (a) v = 90 mm/s, Δx = 3 μm, and (b) v = 90 mm/s, Δx = 27 μm, respectively.
Coatings 13 01970 g010
Figure 11. Graphical representation of the roughness Ra measurements of the marked sample with (a) fiber laser, (b) CuBr laser.
Coatings 13 01970 g011
Figure 12. Graphical representation of the microhardness HV measurements of the marked sample with (a) fiber laser, (b) CuBr laser.
Coatings 13 01970 g012
Disclaimer/Publisher’s Note: The statements, opinions and data contained in all publications are solely those of the individual author(s) and contributor(s) and not of MDPI and/or the editor(s). MDPI and/or the editor(s) disclaim responsibility for any injury to people or property resulting from any ideas, methods, instructions or products referred to in the content.

