Article

Graded Minimal Surface Structures with High Specific Strength for Broadband Sound Absorption Produced by Laser Powder Bed Fusion

1
School of Mechanical and Energy Engineering, Guangdong Ocean University, Yangjiang 529500, China
2
School of Mechanical and Automotive Engineering, South China University of Technology, Guangzhou 510641, China
*
Author to whom correspondence should be addressed.
Coatings 2023, 13(11), 1950; https://doi.org/10.3390/coatings13111950
Submission received: 21 September 2023 / Revised: 13 November 2023 / Accepted: 13 November 2023 / Published: 15 November 2023
(This article belongs to the Special Issue Recent Development in Post-processing for Additive Manufacturing)

Abstract

:
In this research, a design method for triply periodic minimal surface (TPMS) structures with a high specific strength for broadband sound absorption is proposed. The graded TPMS structures are controlled by linear, quadratic, and sine functions. Homogeneous TPMSs and graded TPMSs were manufactured by laser powder bed fusion (LPBF) with AlSi7Mg powder, and acoustic impedance tube, compression, and digital image correlation (DIC) tests were applied to obtain the sound absorption and compression properties. The sound absorption coefficient of a homogeneous gyroid increases as the height and offset thickness of the surface increase, and it increases as element size decreases. The sound absorption peak shifts to low frequencies as the height of the structure increases. The average sound absorption coefficient at 1/3 octave from 500 to 6300 Hz of the graded TPMS with a porosity from 60.51 to 77.59% (surface of incident sound wave to rigid backing) is superior to that of the graded TPMS with a porosity from 77.59 to 60.51%, but the latter has a broadband sound absorption coefficient. The compression and DIC results of graded TPMS also show excellent mechanical properties and energy absorption characteristics.

1. Introduction

Porous material is generally used in sound absorption for its excellent sound absorption, low density and high specific strength [1,2]. The size of its pores is small compared with the incident sound wavelengths, and it can achieve significant loss of sound energy through the viscous and thermal processes inside the porous material. An additional sound absorption mechanism for viscous processes in a porous sound-absorbing material is the thermal exchange between pore-borne sound wave compressions and rarefaction and the pore walls [3]. The sound absorption coefficient increases with the increase in the thickness of the porous structure, and the frequency at the first peak decreases [4] due to the quarter wavelength resonance of the hard-backed porous material [5]. The thickness of the sound absorption material needs to be limited to save space and weight. The porous structure also has high specific strength, high stiffness, and lightweight properties, and it has been used for decades as a material for aeronautics [6], aerospace [7], and building structures [8].
The porous materials applied in sound absorption include foam structures [9], lattice structures [10], honeycomb structures [11], and triply periodic minimal surfaces (TPMS) [12]. Foam structures with low density and thermal conductivity, combined with their interesting mechanical properties, make them excellent thermal and sound insulators [13]. The TPMS structure is a potential sound absorption material because it is an open-pore porous structure with a pore size and porosity that can be set within the range of the typical values of other open-pore porous materials for sound absorption. It can theoretically achieve a “cavity-like” effect in the complex internal holes [14]. However, it is difficult to manufacture the TPMS structure using traditional processing techniques due to its complex internal cavity structure.
In recent years, with the rapid developments in additive manufacturing technology that can prepare complex spatial structures, more possibilities have been provided for the design of new sound-absorbing material structures. Some researchers prepared porous structures using fused deposition modeling (FDM) additive manufacturing technology and conducted sound absorption tests, and they found that multilayered microchannels with a sound absorption coefficient peak up to 0.87 at 2700 Hz were produced, and the total sample thickness was 25.4 mm [15]. The starlet-shaped open-porous structure produced by additive manufacturing technology with ABS material had a higher noise-reduction coefficient in comparison with rhomboid, cartesian, and octagonal structures [16]. The different additive manufacturing technologies, including digital light processing (DLP), the use of stereo lithography apparatus (SLA), laser cladding deposition (LCD), selective laser melting (SLM), and FDM, were applied to manufacture the same porous structure, and it was demonstrated that the sound absorption measurements performed on samples with the same cellular design were very close, and that additive manufacturing technologies are suitable for reproducing porous samples designed for sound absorption [17]. The broadband sound absorption of porous structures manufactured via FDM can be achieved by using the smallest filaments, reducing the lattice parameter and changing the orientation of the filaments [18]. By combining pairs of resonators responsible for absorbing different close frequencies, a compact porous asymmetric broad target-frequency bandwidth sub-wavelength absorber was designed and manufactured by FDM technology, and an average sound absorption coefficient of 99% was obtained over almost an octave [19]. The angle of the microtube in porous polycarbonate material was adjusted from 0 to 45°, and the resonance peak shifted to a lower frequency [20]. The acoustic wave energy dissipation can be enhanced by modifying the diameter, shape or spacing of the porous materials manufactured by FDM [21], but the twisted cross-section of slits, which is an imperfection of FDM, influences the experimental results. Based on SLA technology, the acoustic absorption characteristics of diamond, primitive and gyroid have been researched [22], and the small unit cell or high volume fraction can enhance the effective frequency ranges. However, this experimental research on the sound absorption performance of the TPMS structure showed that its sound absorption coefficient was still poor owing to the sub-wavelength absorption of the homogeneous structure. To further enhance the sound absorption coefficient and the frequency range of the TPMS structure, it is necessary to optimize the structural design.
Due to the gradient changes in its internal physical properties, the acoustic medium with gradient characteristics is receiving increasing attention. A composite structure with a graded structure has a broadband sound absorption coefficient and achieves sub-wavelength sound absorption at low and mid-frequencies, and the first resonance peak of the absorption coefficient is 0.87 at 1151 Hz [23]. The sub-wavelength sound absorber can absorb sound waves with a wavelength greater than four times the absorber thickness at resonance absorption [24]. A gradient-structured fiber sponge with super elasticity and stretchability by combining humidity-assisted multistep electro-spinning demonstrated that the gradient change in porosity and pore diameter in the z direction endowed the fibrous sponge material with high-efficiency absorption of broadband sound waves [25]. A gradient ceramsite structure with a high sound absorption coefficient was proposed [26], but the compressive and flexural strengths of gradient ceramsite structures are only greater than 3 MPa and 1 MPa, which are too low to be used for structural materials. It was demonstrated that the average sound absorption coefficient of 88% and an absorption frequency bandwidth (490–4000 Hz) of the graded structure could be achieved by impedance matching [27], and the sound-exposed surface layer of the gradient absorber had a lower impedance than the subsequent layers. Acoustic structures with graded properties could be described as multiresonant absorbers [28], and it is possible to tune plate resonances by gradient design. The sound absorption characteristics of gradient porous structures can be further optimized by structural design. To develop an acoustic absorber with high efficiency and thin thickness, four-layer gradient compressed porous metals were manufactured, and it was verified that the average sound absorption coefficient of the graded structure (compression ratio: 90%−0%−30%−60%) was 60.33% with an 11 mm thickness range from 100 to 6000 Hz, which was 93.8% higher than the graded structure (compression ratio: 0%−30%−60%−90%) with an 11 mm thickness [29]. This illustrates that the regular pattern of porosity distribution in a graded porous structure influences the sound absorption characteristics. The sound absorption performance of graded porous structures was optimized by a nonlinear conjugate gradient algorithm [30], and the graded structures showed a shifting of the perfect sound absorption peak to low frequencies, and perfect absorption frequency range could also be widened compared to the homogeneous structure. Based on the database of anisotropic porous unit cells and grade properties, an optimization technique was proposed to maximize the sound absorption coefficient [18], and an omnidirectional absorption material was obtained.
The gradient structure design can achieve broadband sound absorption and sub-wavelength perfect sound absorption, but there has been limited research on the sound absorption characteristics of the graded TPMS. In this research, the influence of height, offset thickness of surface, and element size on the sound absorption property of TPMS was investigated, and the purpose was to obtain optimized structural design interval parameters. Based on the optimized parameters, the graded acoustic structures were designed with three functions, and the effects of the graded directions and functions on the sound absorption characteristics were analyzed to obtain the material with broadband and perfect sound absorption. Moreover, the mechanical properties of TPMS were obtained by compression tests and digital image correlation (DIC) tests to verify the efficiency of the acoustic absorption materials with high strength and energy absorption.

2. Materials and Methods

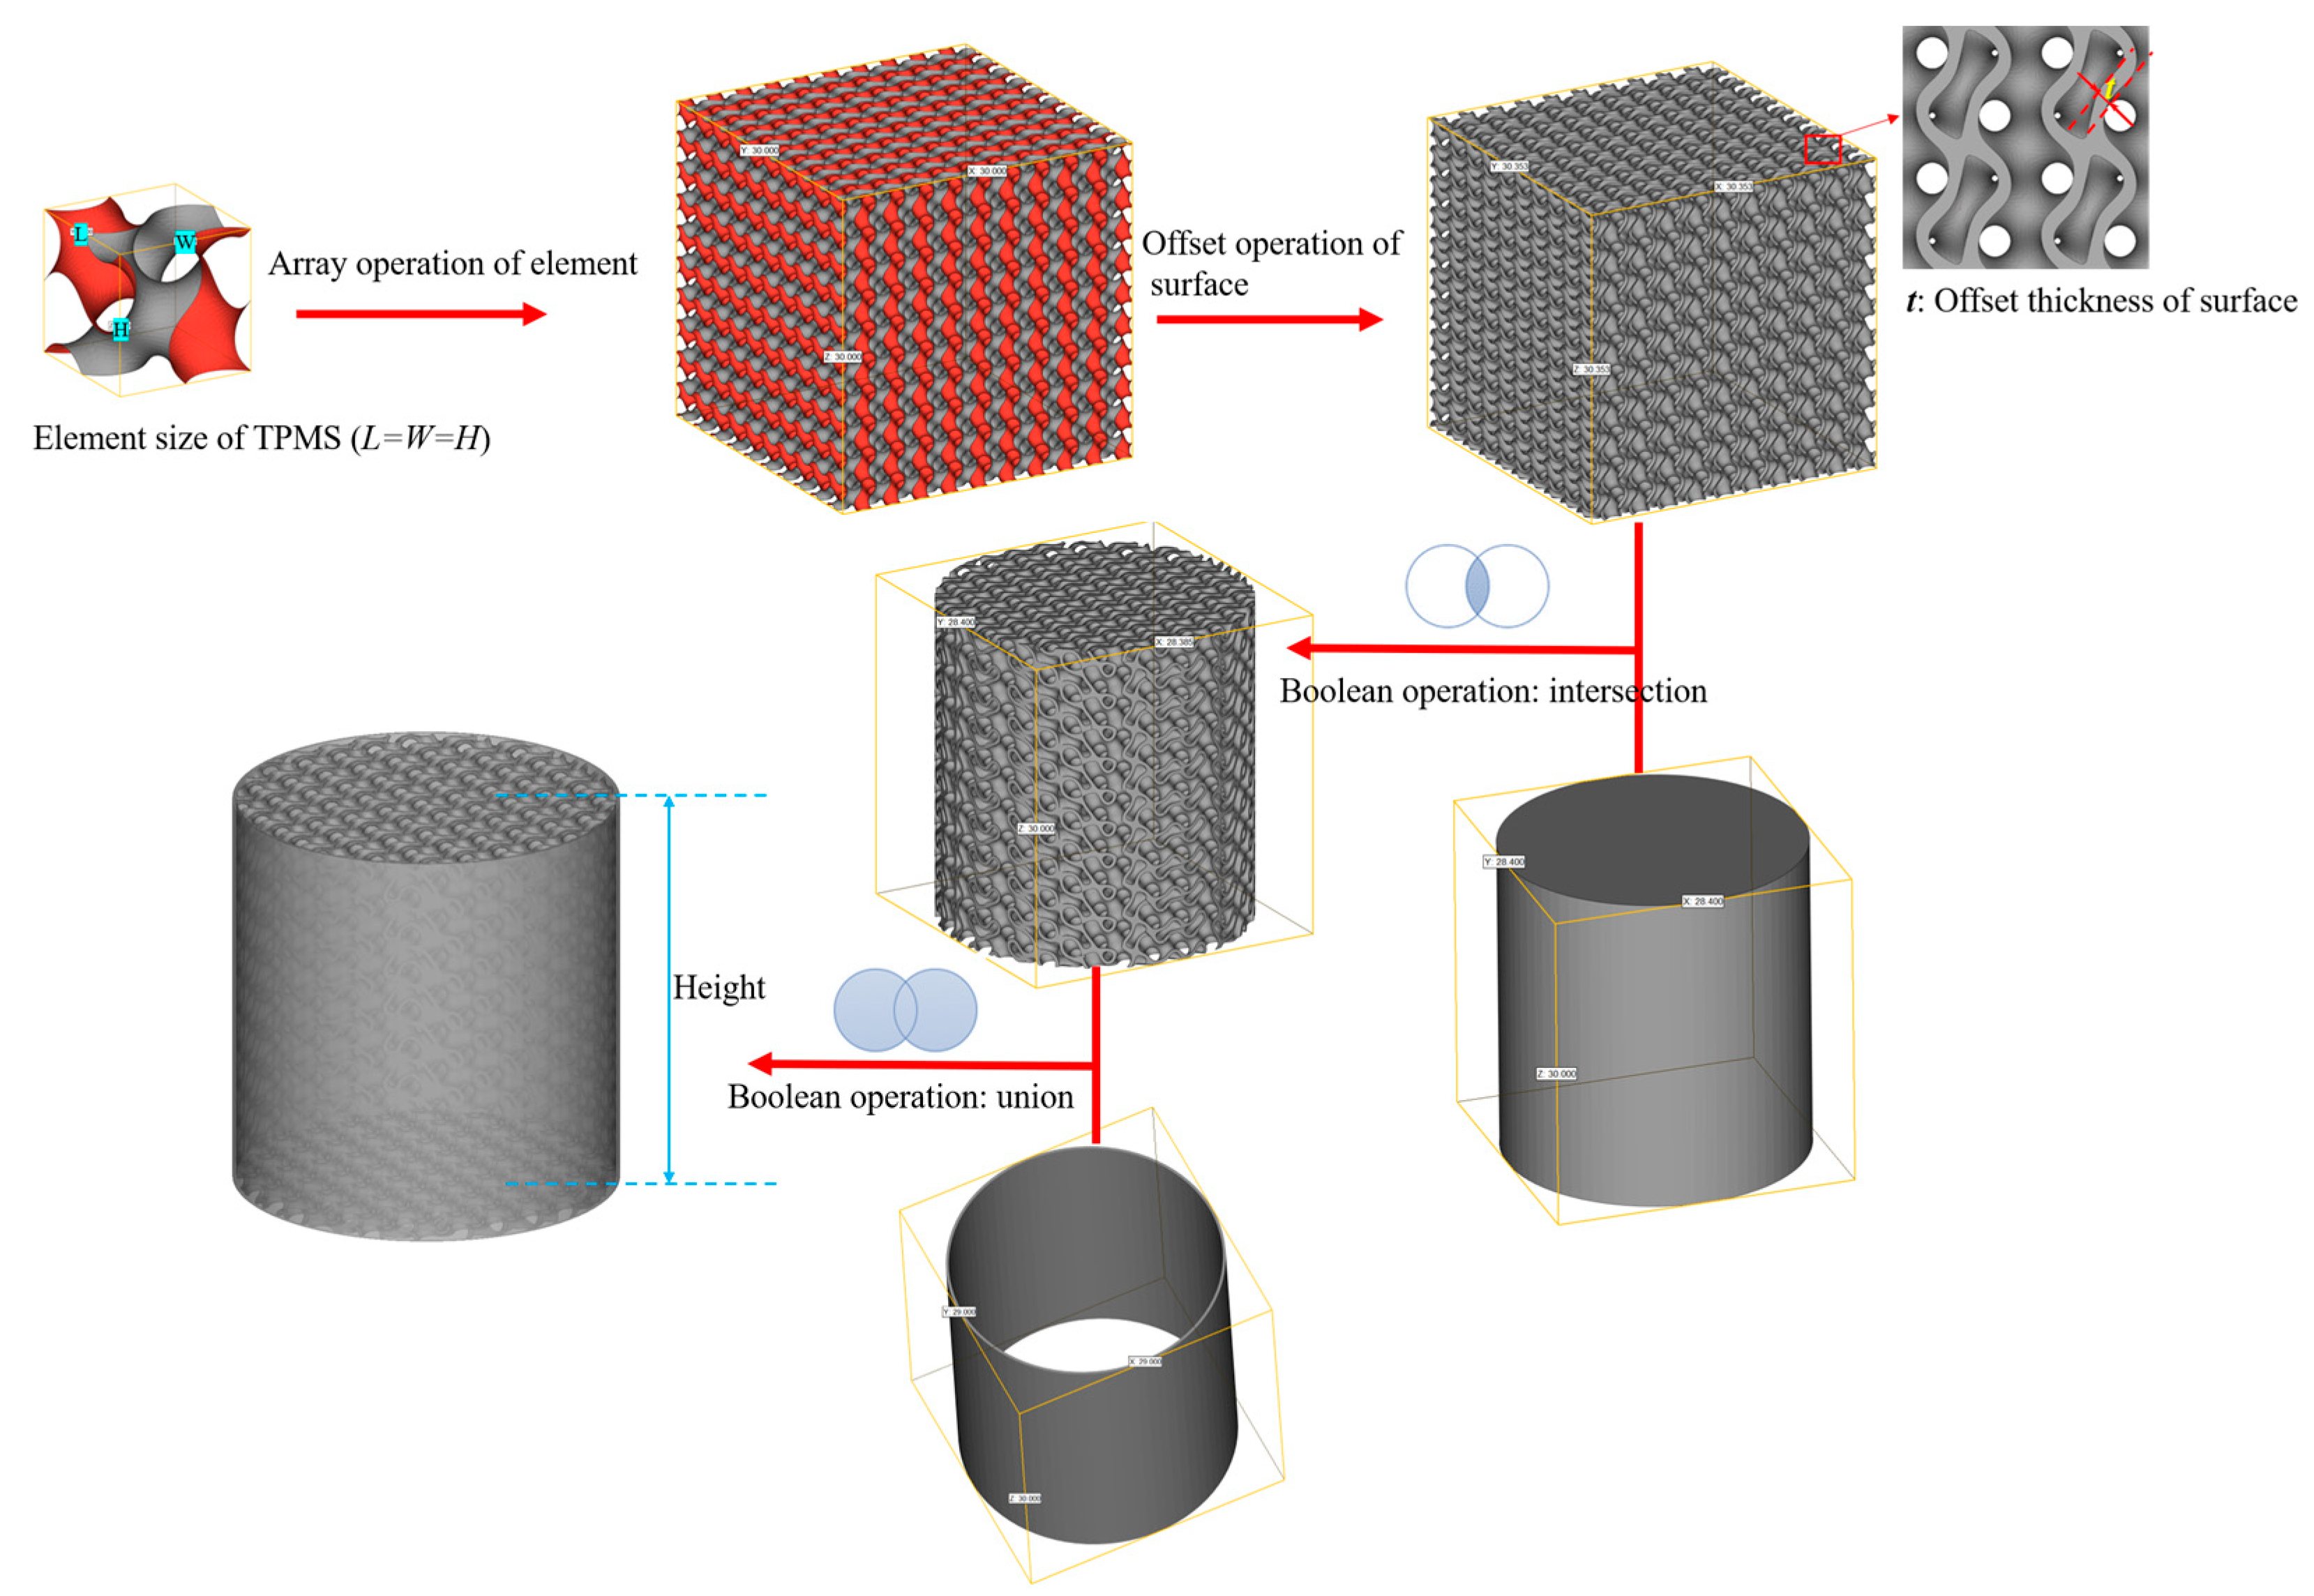
2.1. Modelling of TPMS

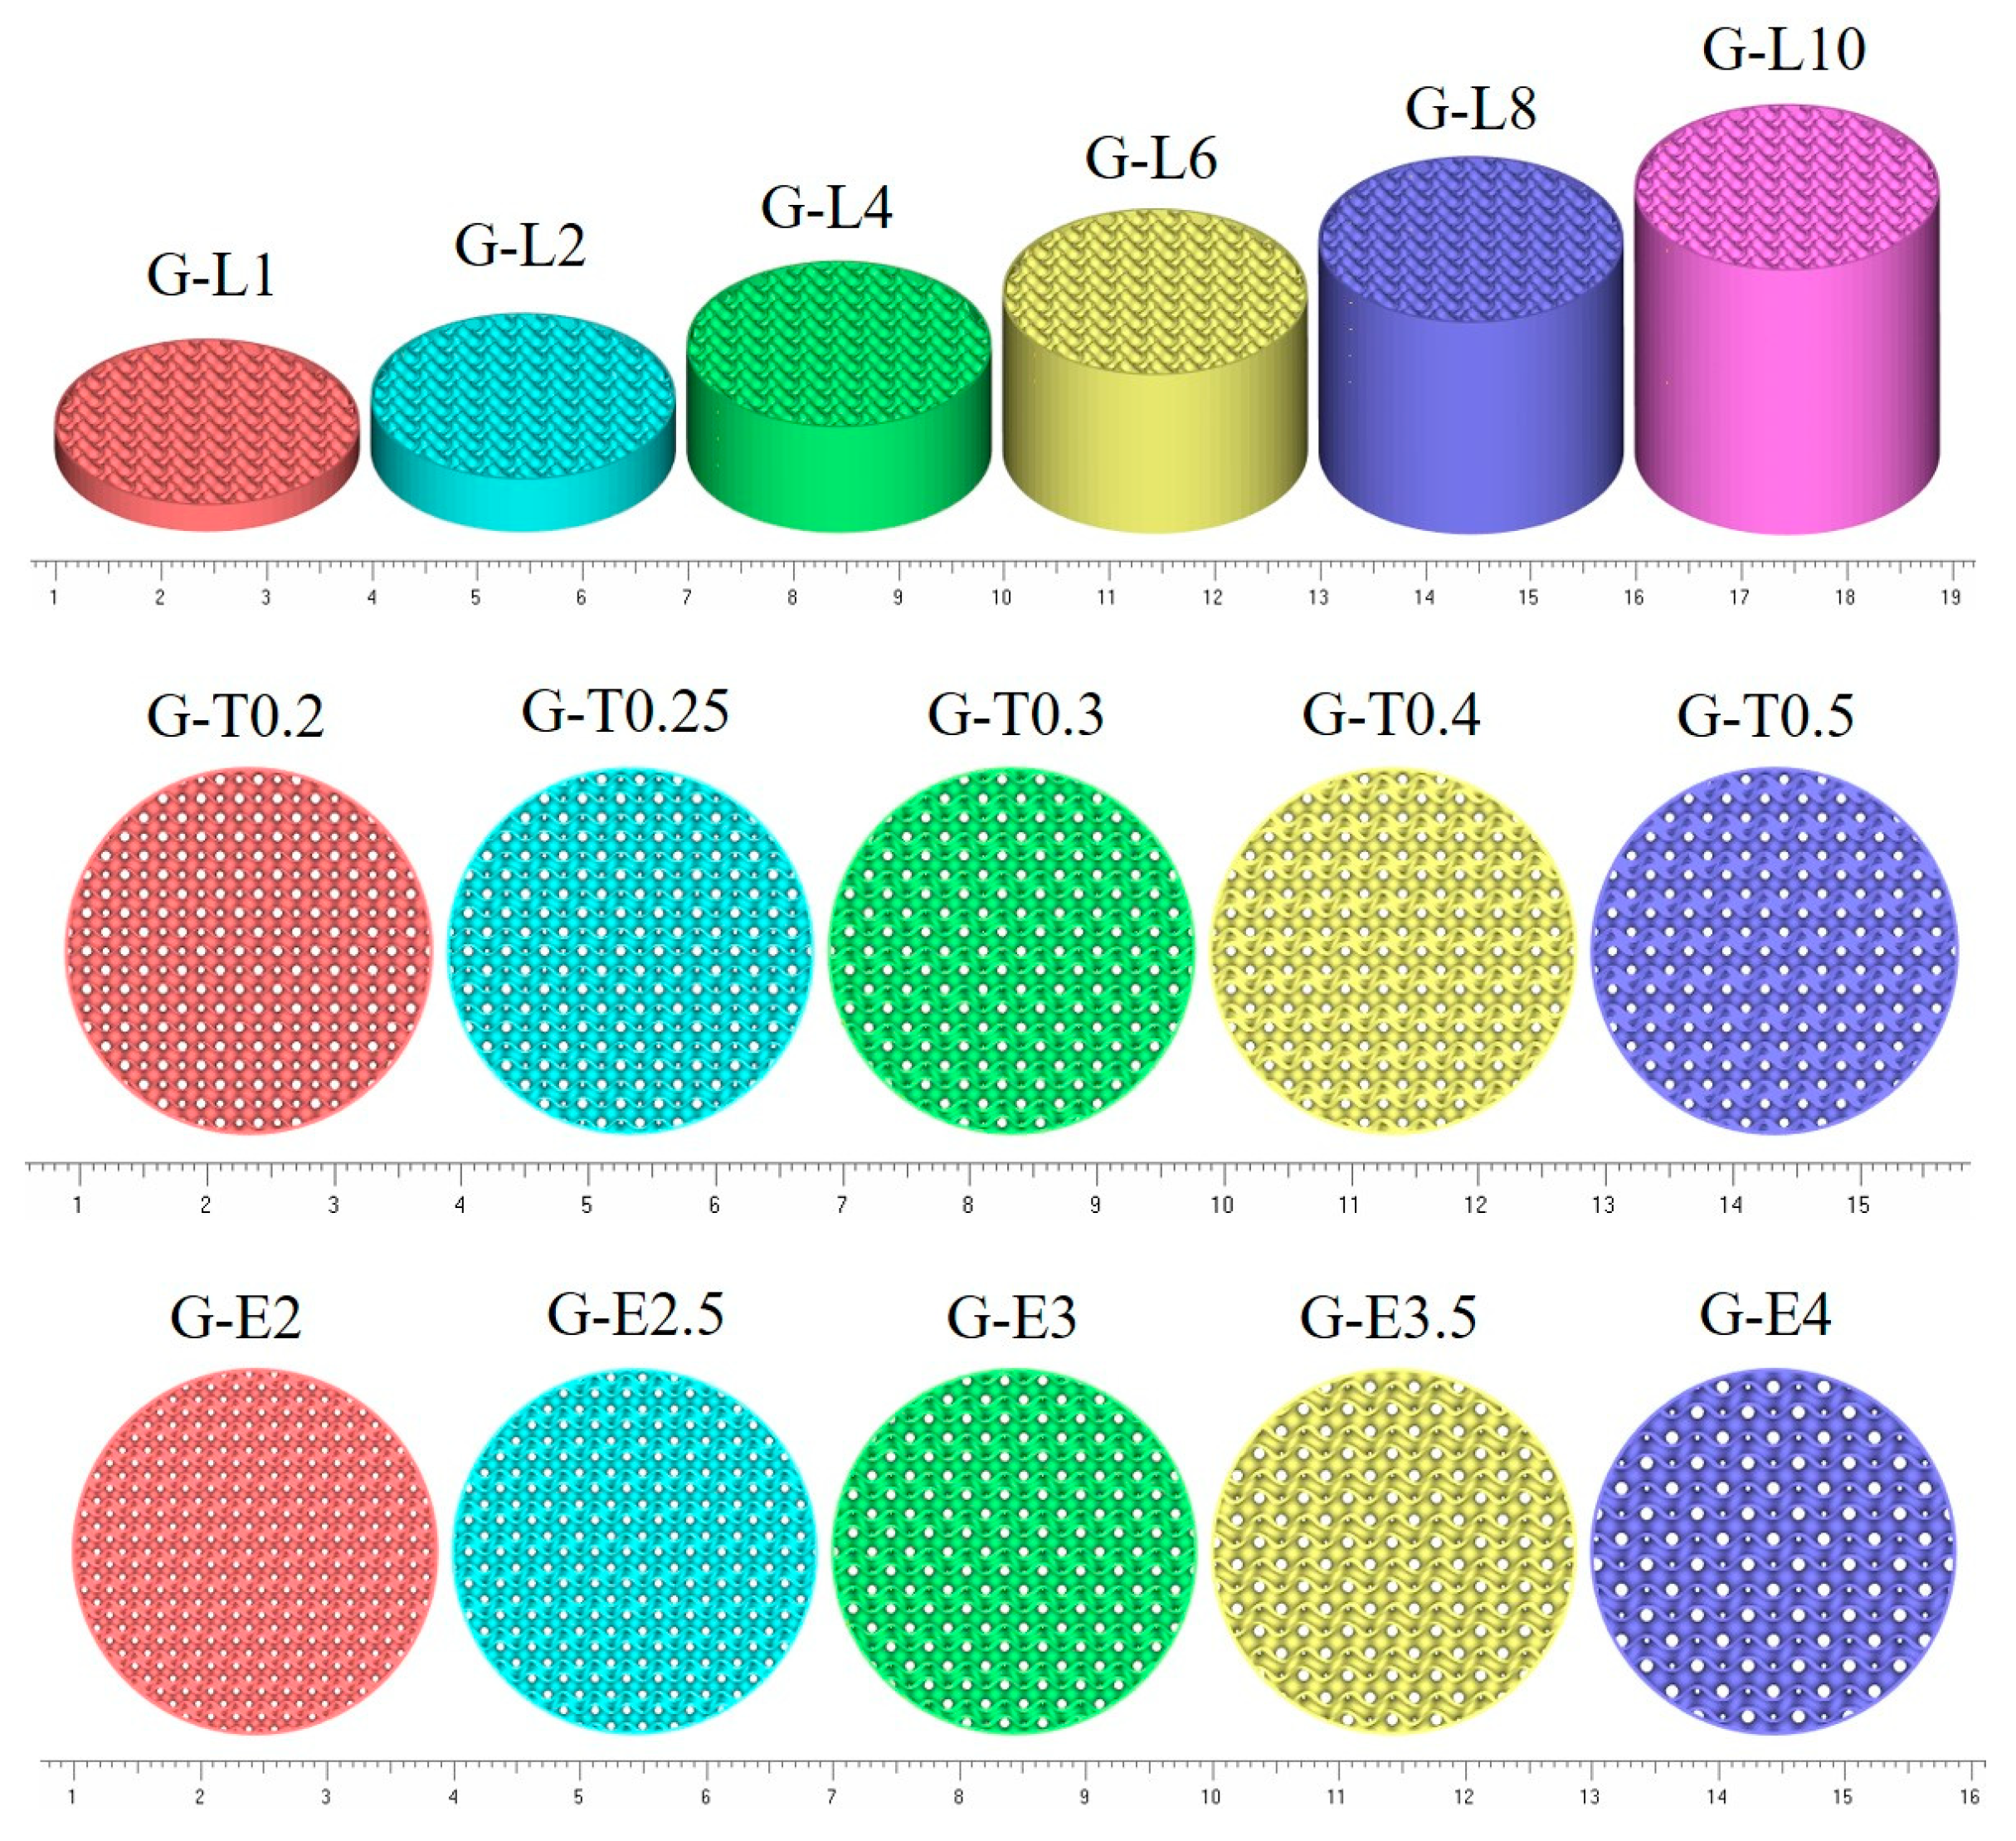
2.1.1. Design of Homogeneous TPMS

TPMSs were generated by MATLAB code with function (1). The minimal surface was obtained when the function Fgyroid was equal to zero, its average curvature was zero, and this surface was free of self-intersection. The element size of structure parameters was adjusted by parameter s in function (1), and the number of layers of gyroid was adjusted by the calculation range (x, y, z) of function (1). The design process of the TPMS for testing is shown in Figure 1. After obtaining the curved surface of gyroid, the porous structure was obtained by offset thickening of the surface in Materialise Magics 21.0 software, and the offset thickening distance of the surface was named the offset thickness of the surface, t. Then, the final model was obtained by a two-step Boolean operation with a solid cylinder (diameter = 28.4 mm, height = z mm) and hollow cylinders (outer diameter = 29 mm, inner diameter = 28.4 mm, and height = z mm). A one-layer structure representing this structure consists of one element length in the z-axis direction; when the element size is 3 mm, the height of the one -layer structure is 3 mm. The designed parameters of the gyroid are listed in Table 1, and the models of homogeneous gyroid structures are shown in Figure 2.
F g y r o i d = sin 2 π x s × cos 2 π y s + sin 2 π y s × cos 2 π z s + sin 2 π z s × cos 2 π x s  

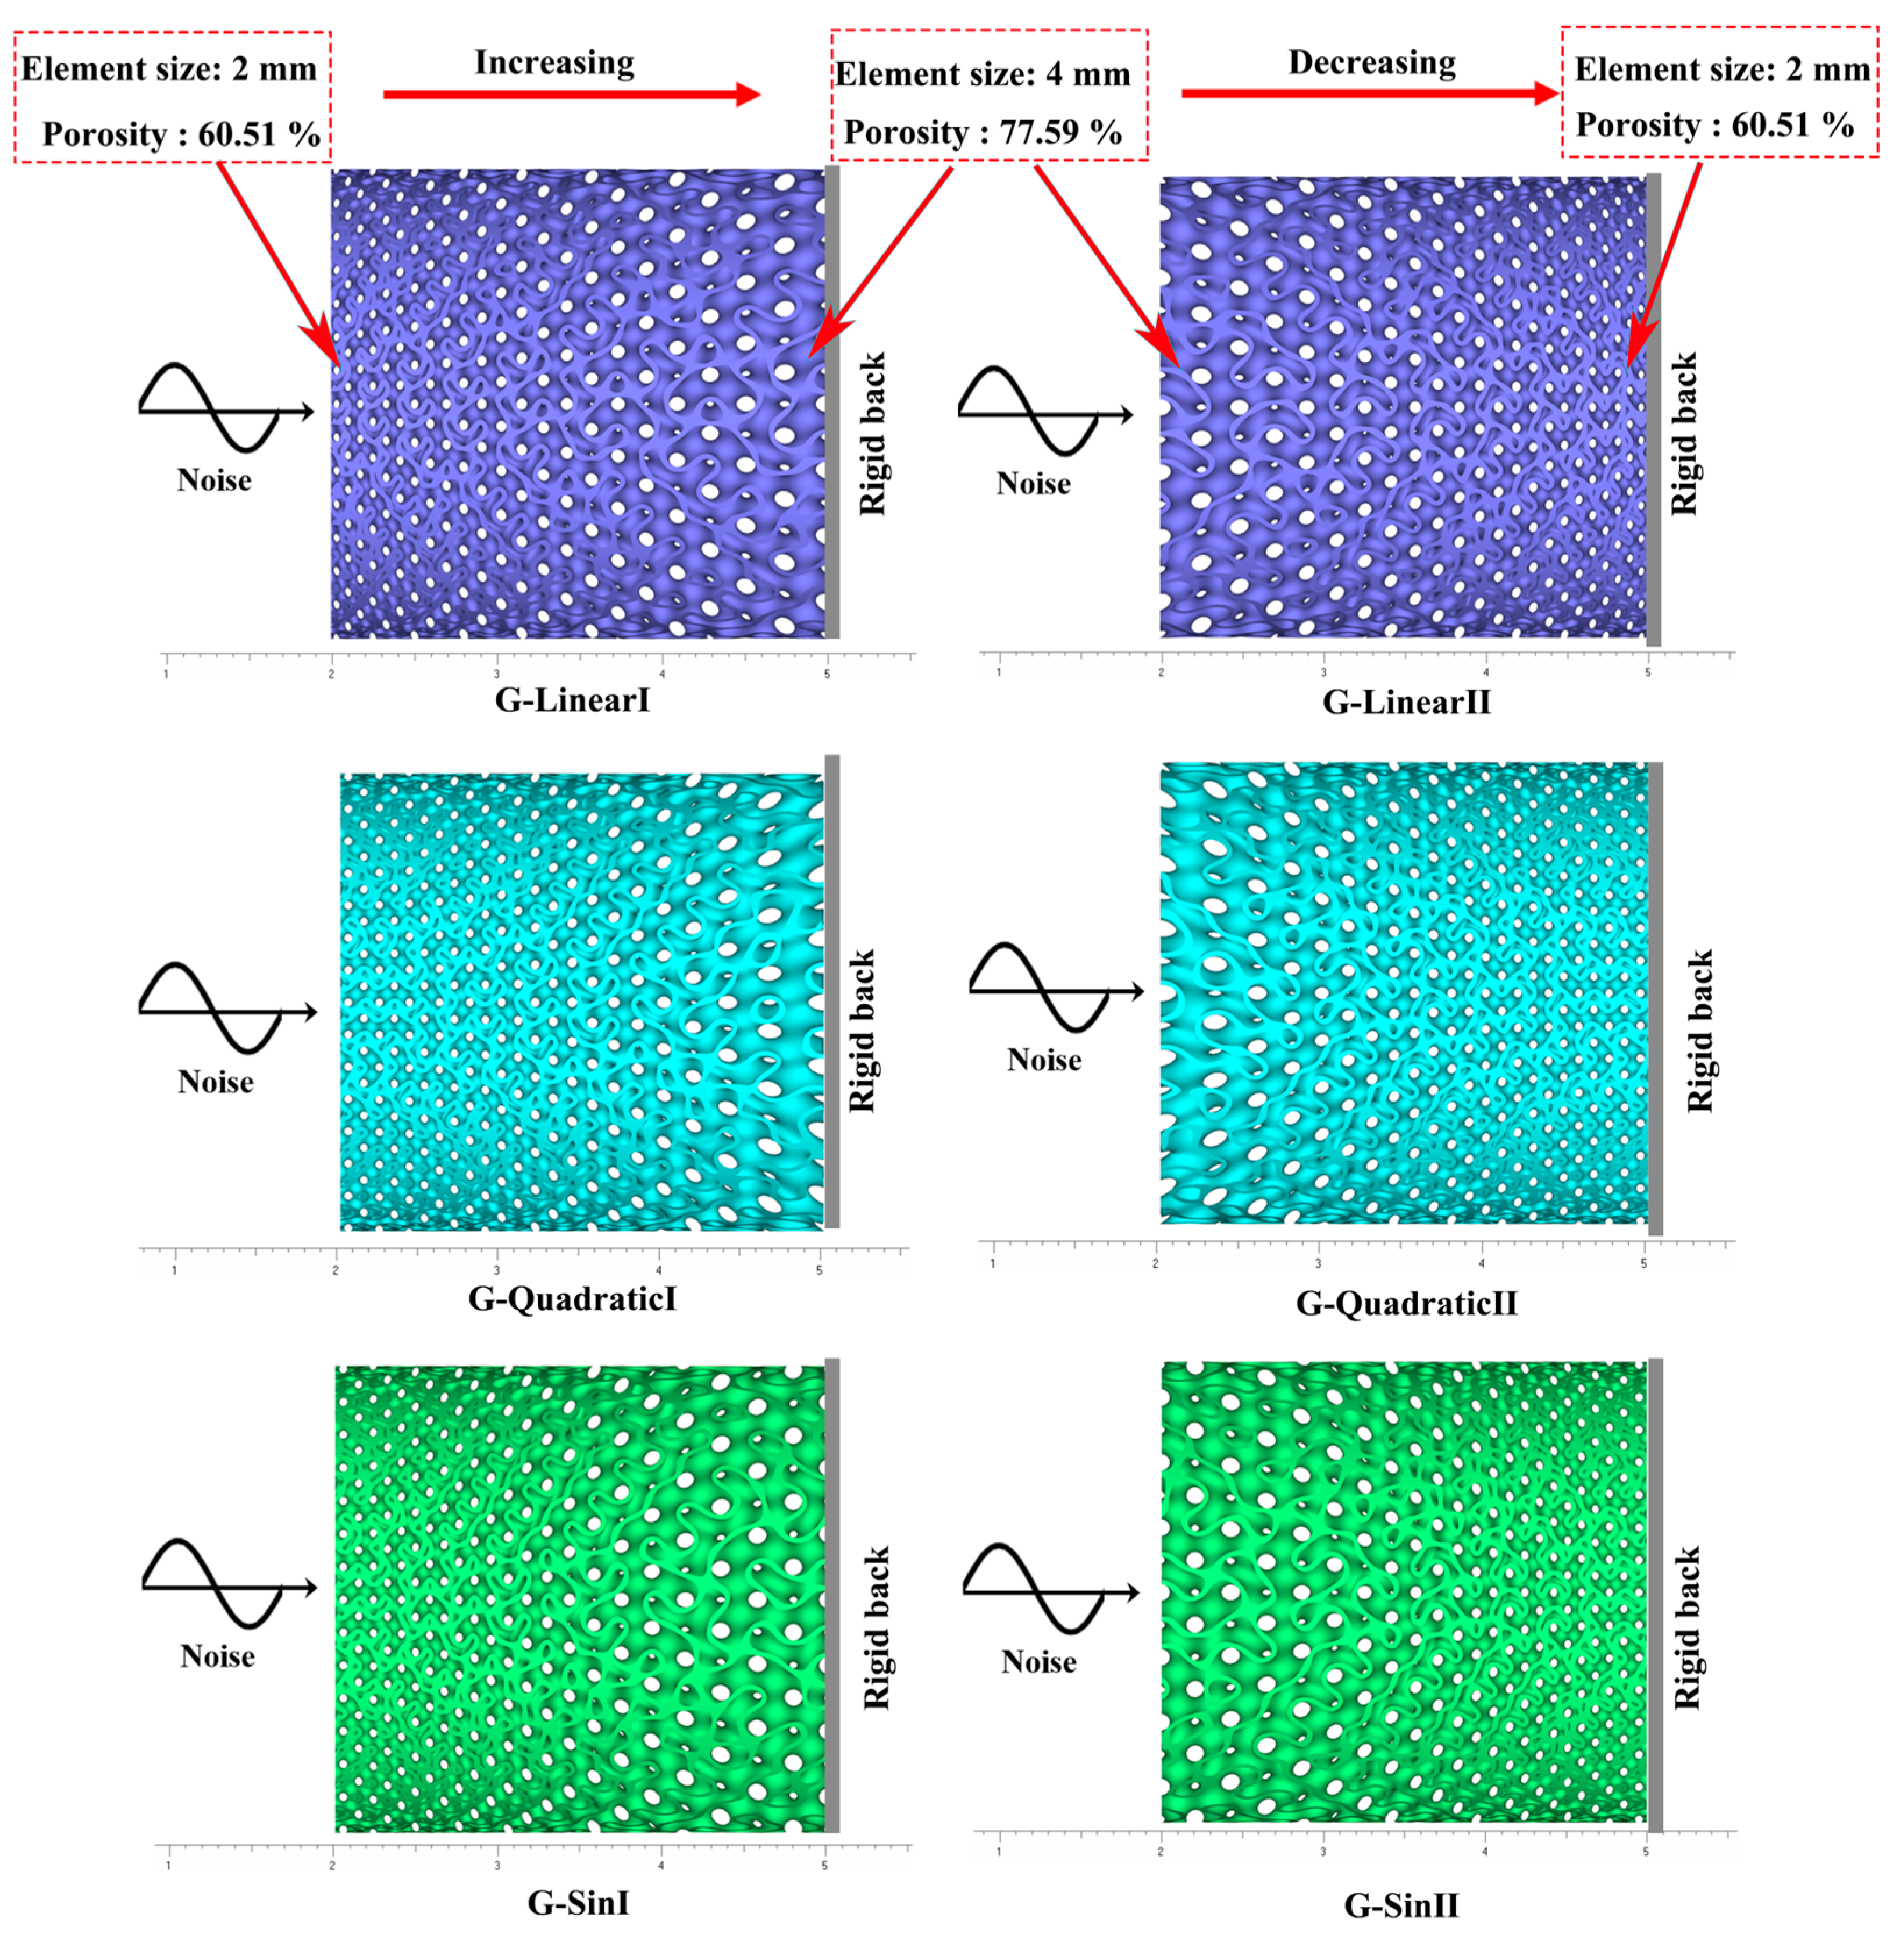
2.1.2. Design of Graded TPMS

TPMS structures with graded element size can be obtained by the adjustment of parameter s in function (1), and the parameter s was set as a function related to the x coordinate, such as a linear function (2), a quadratic function (3), and a sine function (4). When z is 0, then s is equal to 2; when z is 30, then s is equal to 4. Therefore, the element size of the gyroid was distributed from 2 to 4 mm along the z-axis with linear variation, quadratic variation, and sine variation, respectively. The functional relationship curves between element size and structural distance are shown in Figure 3, and the structural parameters of graded gyroid structures are listed in Table 2.
s = 1 15 z + 2
s = 1 450 z 2 + 2
s = 3 + sin ( π z 30 π 2 )
Based on the graded function of element size, the graded gyroid structures were designed and are shown in Figure 4. There are mainly two types of gradient properties for porous materials: (1) type-I: incident sound wave → [low porosity → high porosity] → rigid back; (2) type-II: incident sound wave → [high porosity → low porosity] → rigid back. The noise source was a power amplifier, and a plane wave at normal incidence was generated by this power amplifier. A type-I structure was defined when the noise waves flowed from the surface with a small element size to the surface with a large element size, and a Type-II structure was defined when the noise waves flowed from the surface with a large element size to the surface with a small element size. It is worth noting that, when the offset thickness of the surface is the same, the smaller the unit size, the lower the porosity.

2.2. Additive Manufacturing

The TPMS structures were produced by laser powder bed fusion (LPBF) equipment (Dimetal-280, produced by Laseradd Co., Ltd., Guangzhou, China), as shown in Figure 5, and the processing parameter for LPBF is shown in Table 3. The AlSi7Mg powder was supplied by Avimetal Powder Metallurgy Technology Co., Ltd., Beijing, China, and its particle size distribution was from 15 to 53 μm (D10 = 22.56 μm, D50 = 38.37 μm, D90 = 60.90 μm). The chemical composition of the AlSi7Mg powder is shown in Table 4. The contour scanning was applied in the manufacturing process, and spot compensation was set to 0.1 mm.

2.3. Dimensional Accuracy Measurement

The offset thickness of the surface of the TPMS was measured by a depth-of-field microscope (VHX-5000, KEYENCE Co., Shanghai, China), and each surface of the TPMS was measured five times.

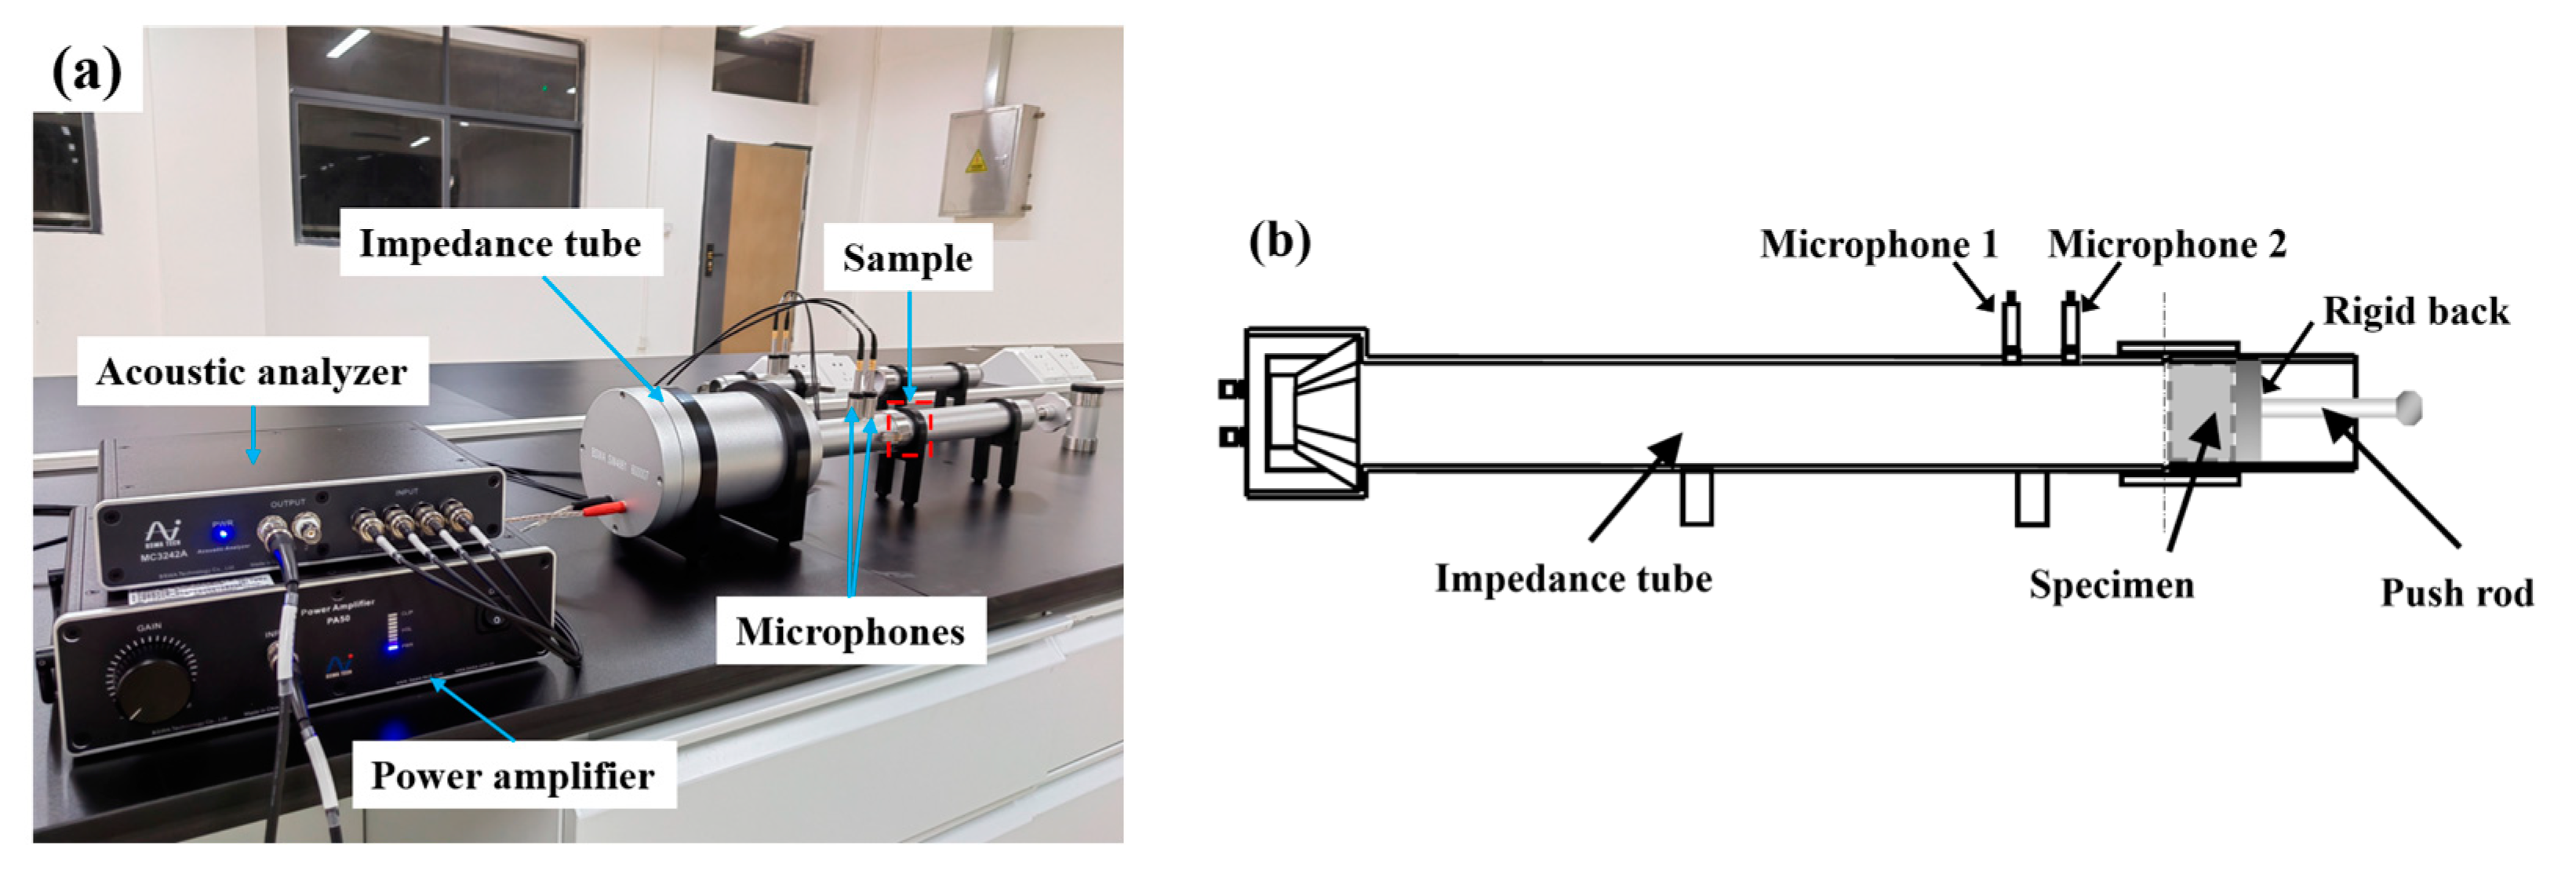
2.4. Sound Absorption Coefficient Test

Based on the method of the two-microphone transfer function and acoustic impedance tube, in accordance with the ASTM E1050-12 standard [31], the absorption coefficient of TPMS was measured by an impedance tube with a 29 mm diameter (SW4661, BSWA Technology Co., Ltd., Beijing, China), as shown in Figure 6. TPMS structures were inserted into the impedance tube with the rigid backing. The measurement frequency was in the range of 500–6300 Hz. Two microphones were applied to collect the acoustic data, and the data was analyzed by VA-Lab V2.0 software (BSWA Technology Co., Ltd., China).
The reflection coefficient R with rigid back was calculated by function (5).
R = H e j k s e j k s H e j 2 k ( l + s )
H—the ratio of pressure between two microphones.
k—equal 2pf/c; wave number, m−1.
l—distance from the test sample to the center of the nearest microphone, m.
s—center-to-center spacing between microphones, m.
The sound absorption coefficient α was calculated by function (6).
α = 1 R 2
The average absorption coefficient at 1/3 octave was calculated by function (7), and the sound absorption coefficients at 12 frequency positions between 500 and 6300 Hz were involved in this calculation.
A α = α i 12
The sound absorption characteristics of sound absorption materials are strongly influenced by the excitation frequency. Therefore, the first peak of sound absorption was analyzed, and the sound absorption coefficient α1 and frequency f1 at the first peak were obtained. The full width at half maximum (FWHM) of the first peak was calculated to evaluate the peak of sound absorption.

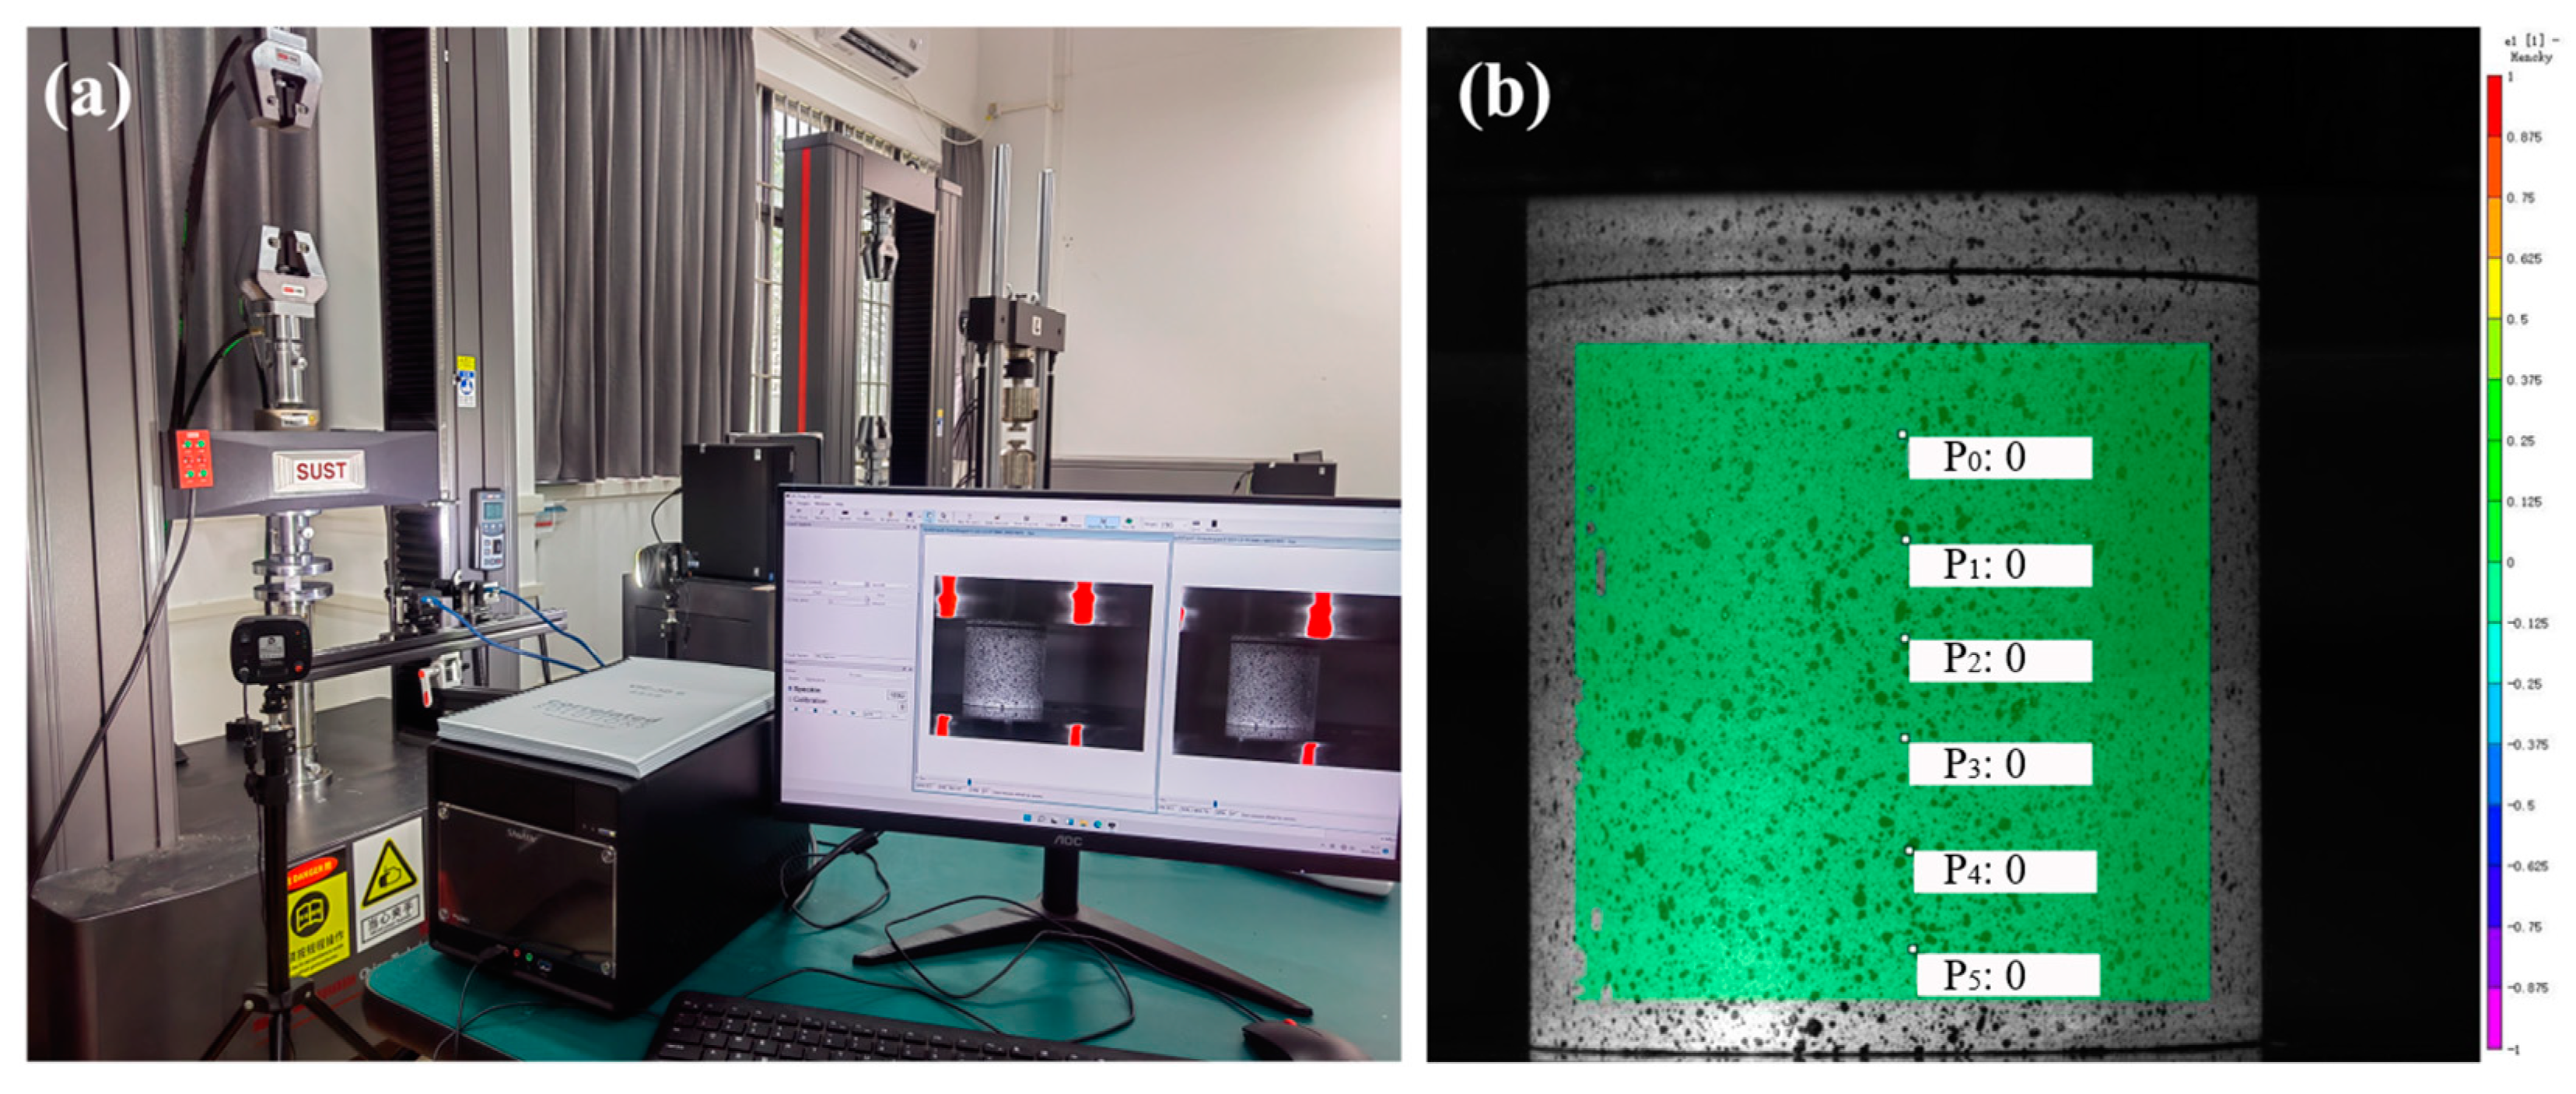
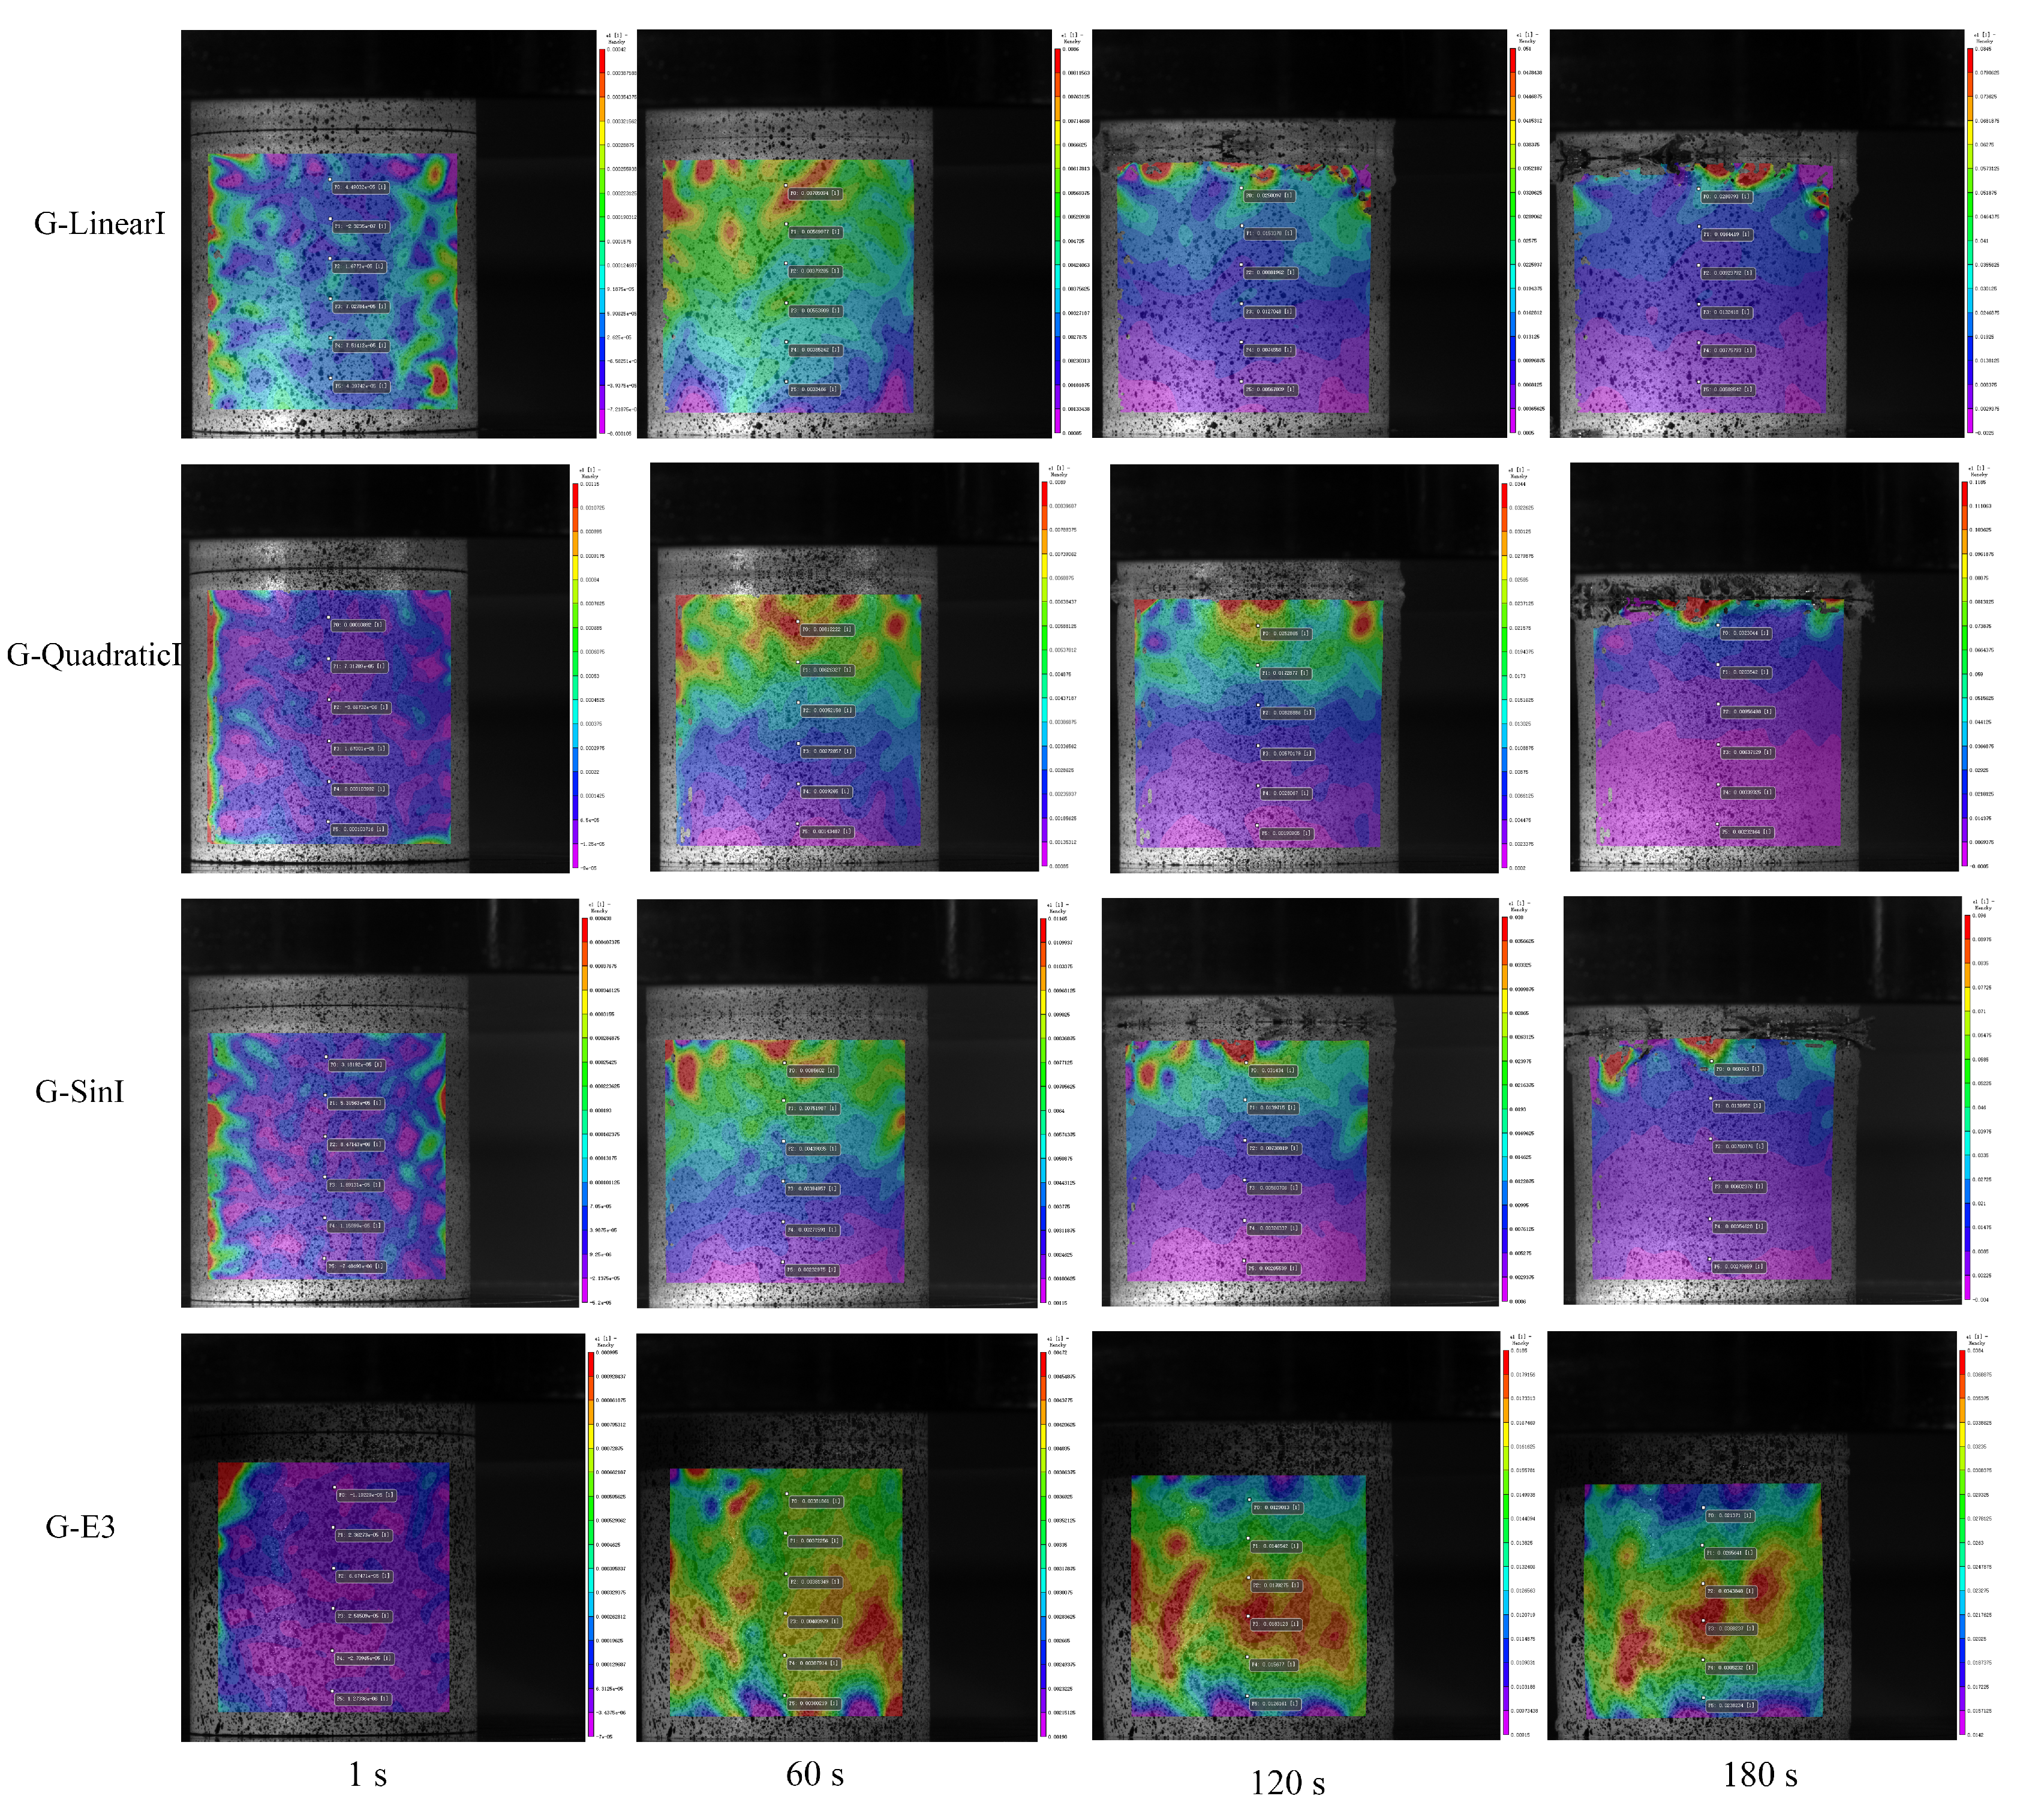
2.5. Mechanical and DIC Test

The compressive properties of TPMS were measured by a universal electronic testing machine (CMT5105-100kN, SUST Co., Ltd., Zhuhai, China), and there were three duplicate samples. The displacement speed was set at 1 mm/min, and the data analysis reference standard was ISO 13314:2011 [32].
The compressive behavior of TPMS was detected by DIC equipment (VIC-3D, Correlated Solutions, Inc., Columbia, South carolina, USA), as shown in Figure 7a. Two cameras were used to capture images of the deformation of the porous sound-absorbing structures. The pixel size of the CCD chip in the DIC camera was 3376 × 2704, and the displacement accuracy was 0.01 pixels. After the images were captured by two cameras, the region of interest (ROI) was set at the outline of the specimen. The relevant areas of the image through grayscale were located, and the surface displacement and strain distribution of the object were calculated. To compare the trend of strain changes at these six locations, six points were distributed in the middle of the specimen for the strain analysis, as shown in Figure 7b.

3. Results and Discussion

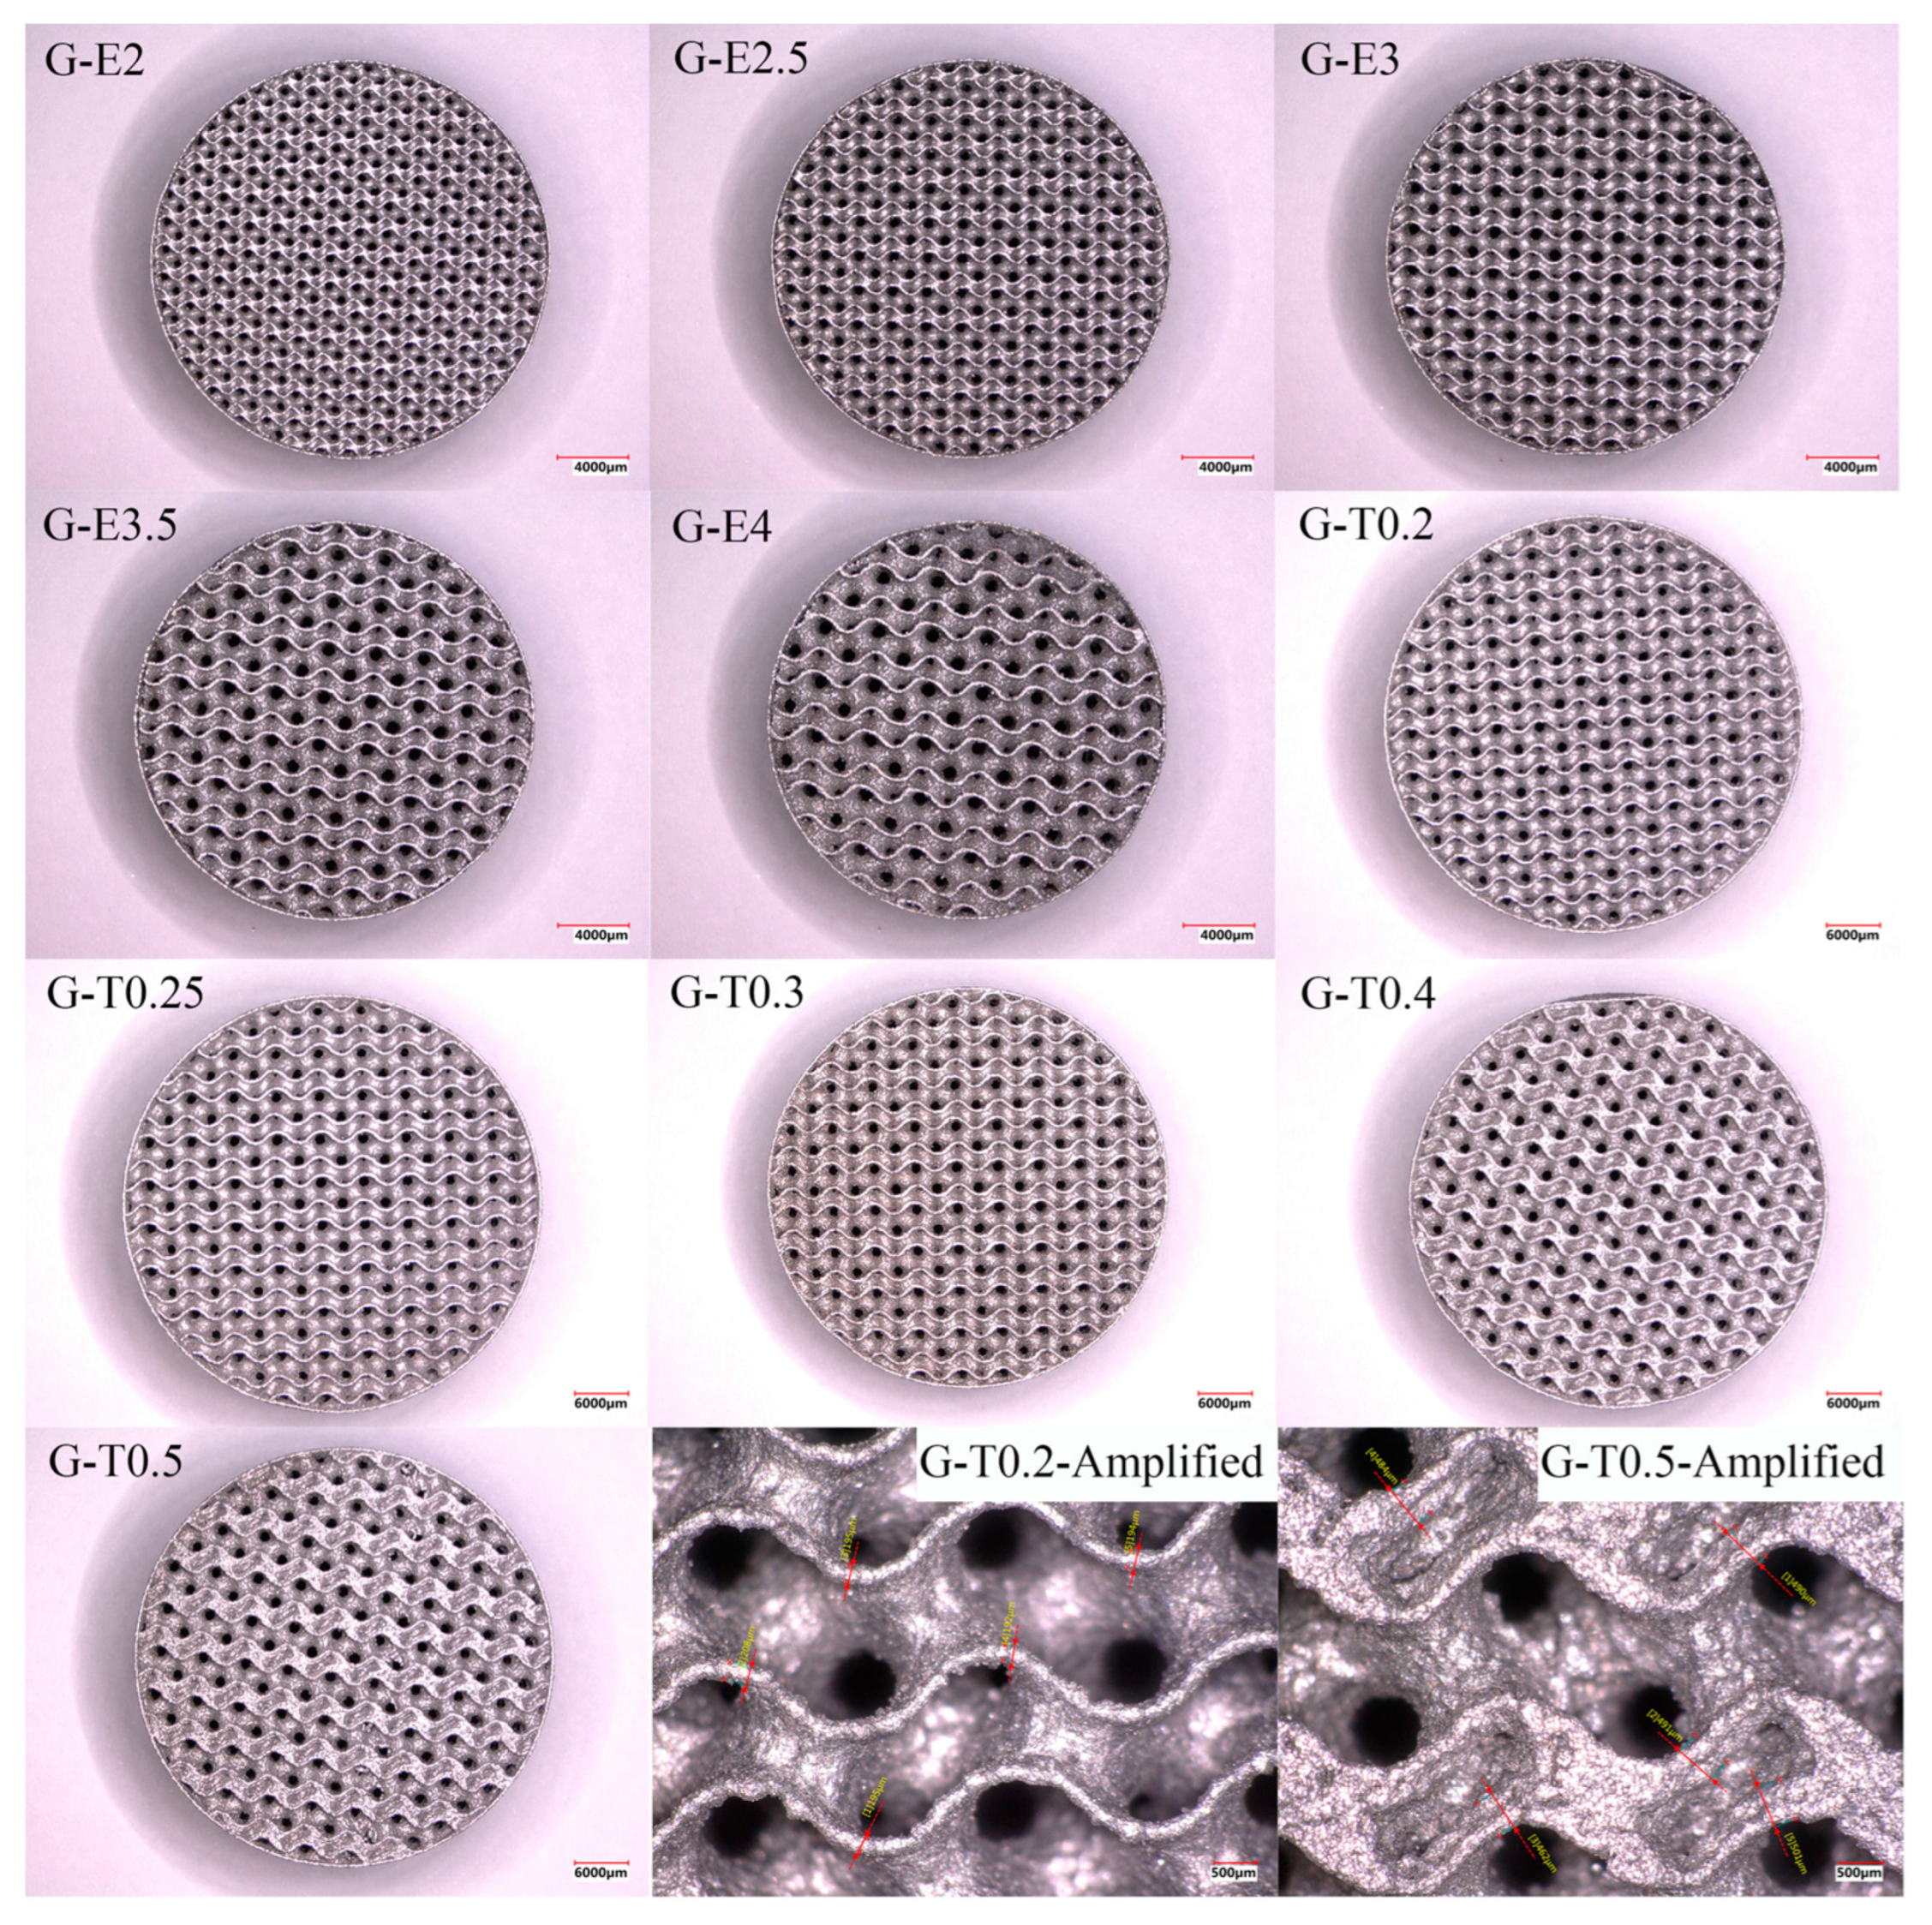
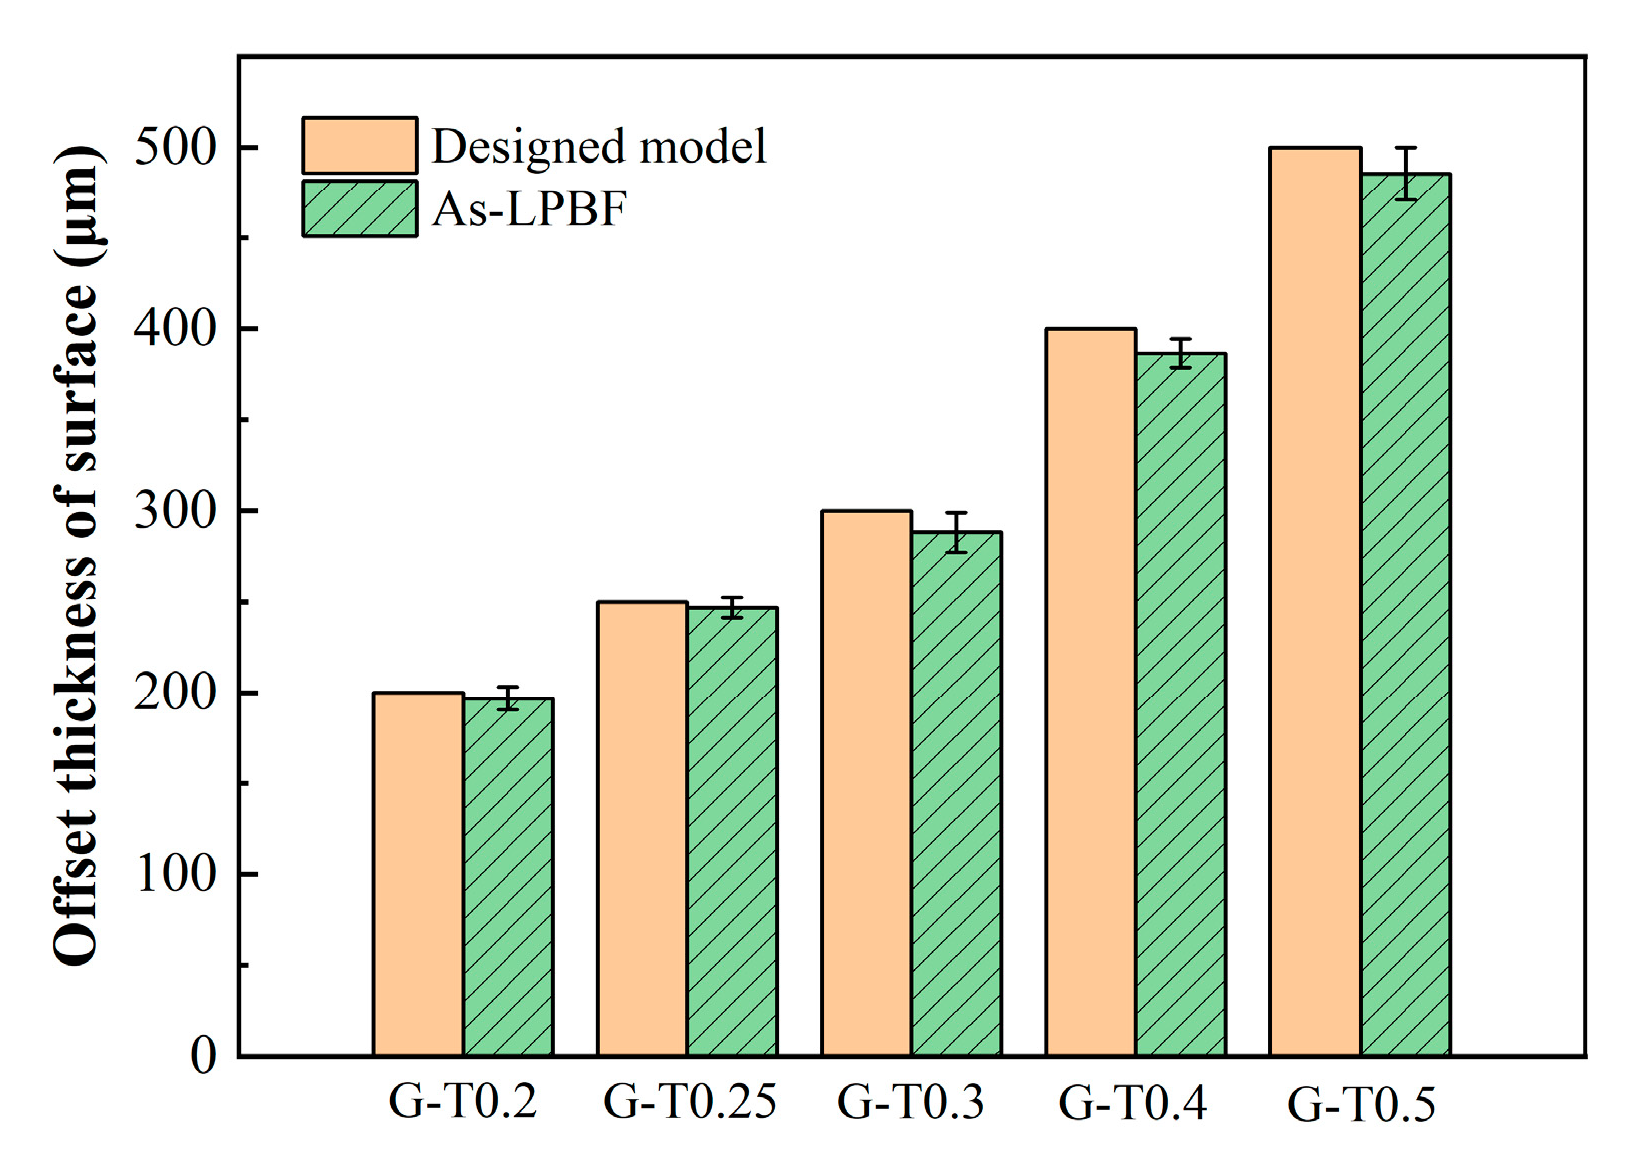
3.1. Forming Quality by LPBF

The homogeneous gyroid structures fabricated by LPBF are shown in Figure 8, and the dimensional accuracy measurement result is shown in Figure 9. It was noted that the printing accuracy of the gyroid was consistent with the designed model, and the size error was very small.

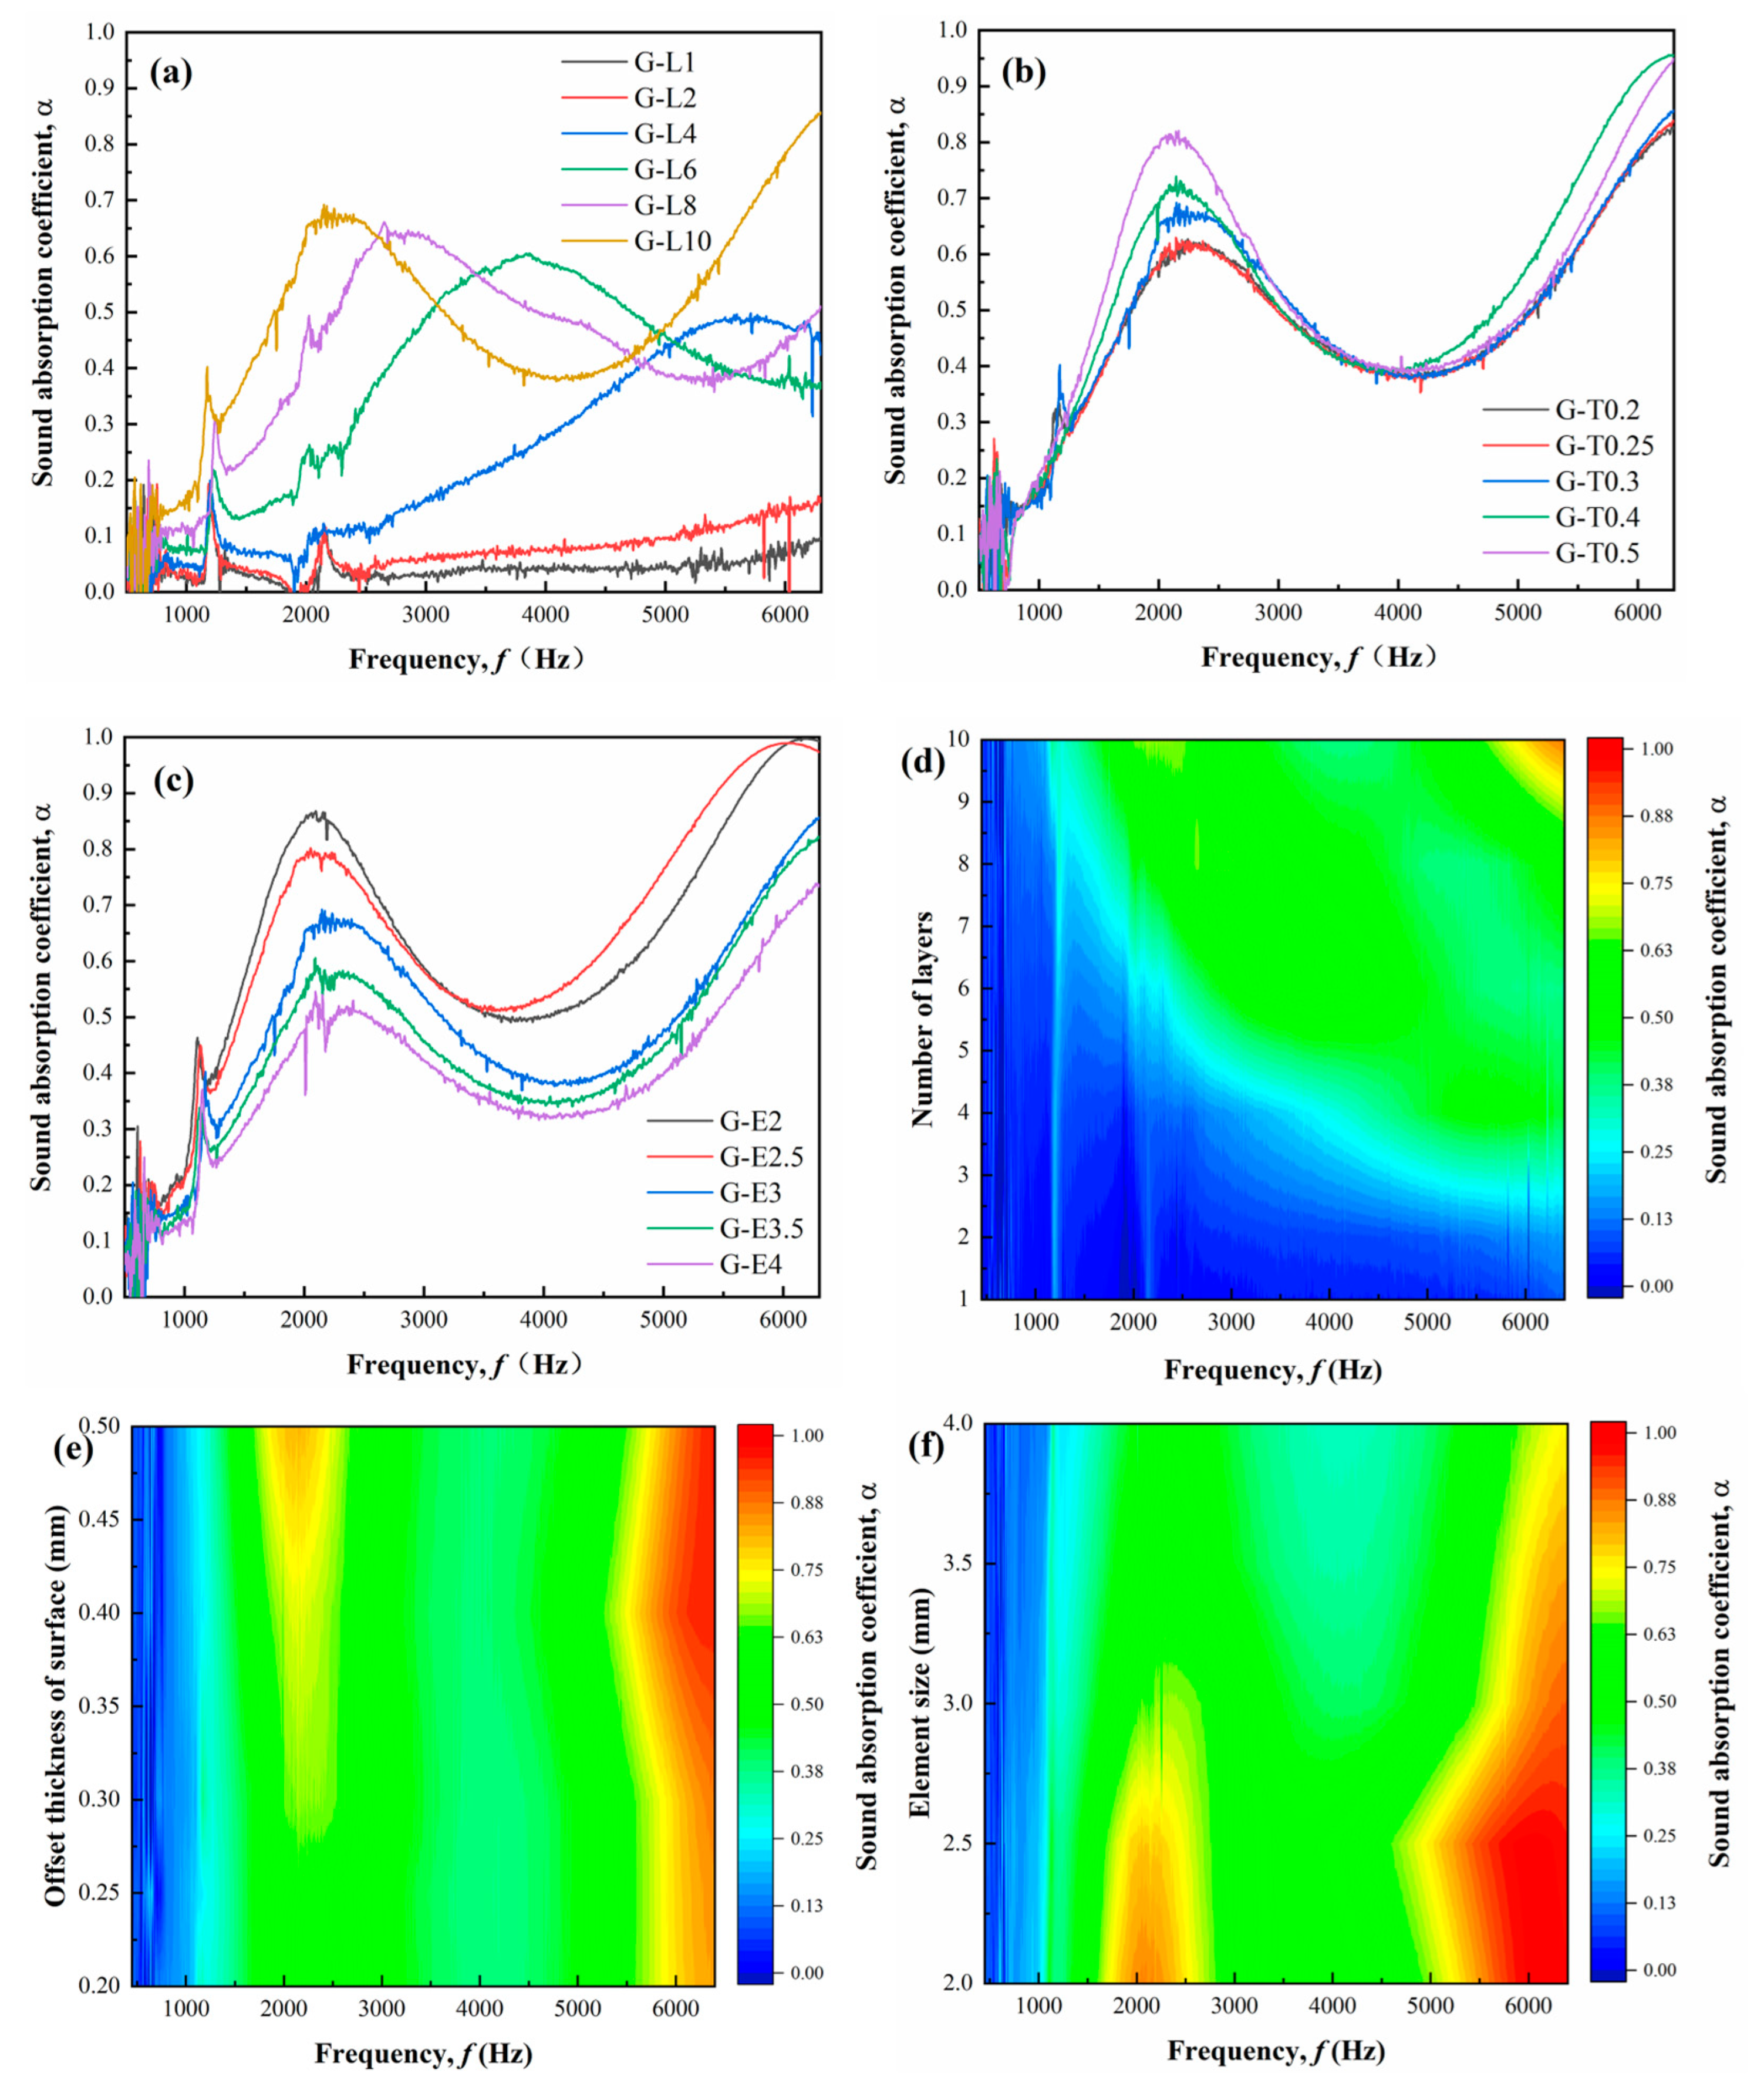
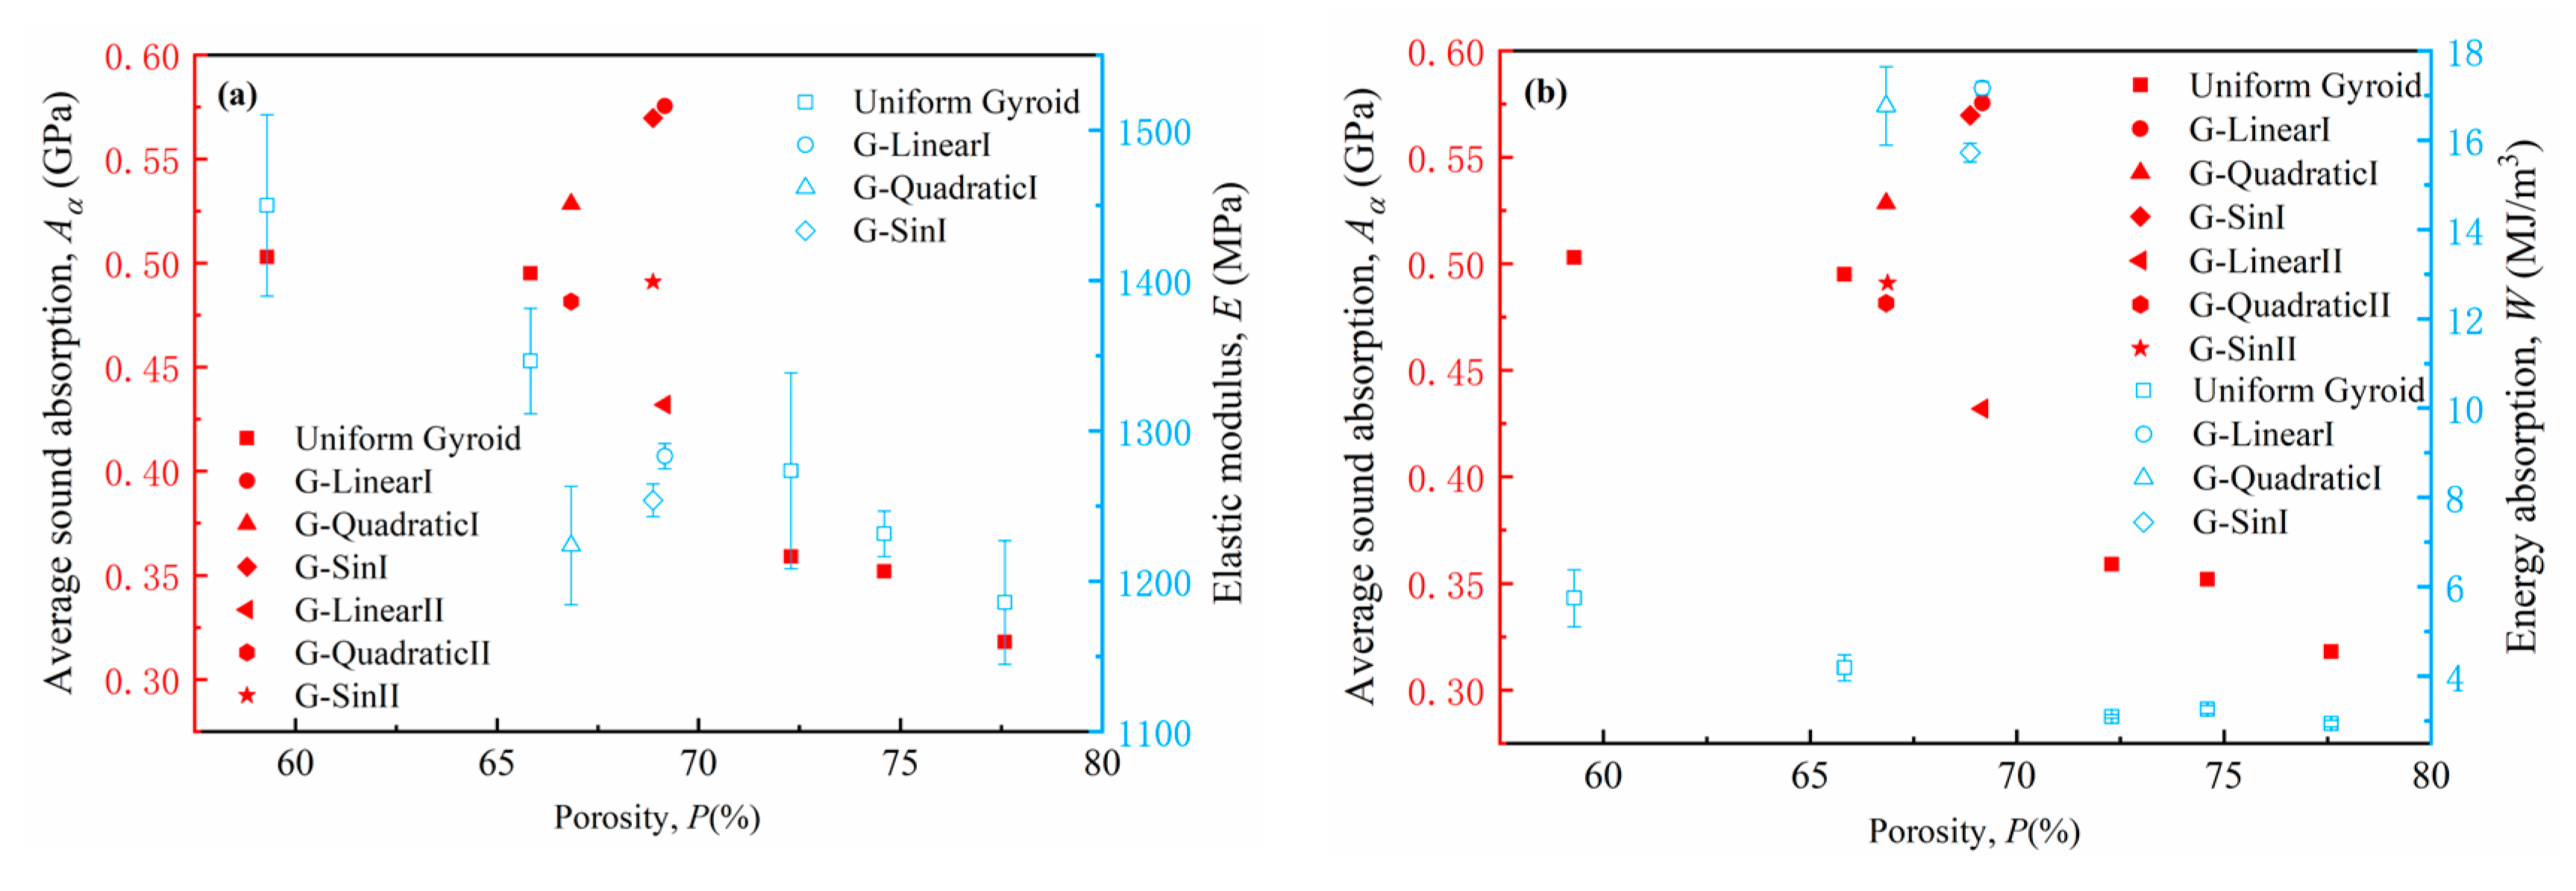
3.2. Sound Absorption Characteristics of Homogeneous TPMS

The influence of the structural parameters of a homogeneous gyroid on the sound absorption coefficient is presented in Figure 10, and the sound absorption characteristics are listed in Table 5. As shown in Figure 10a, the sound absorption coefficient increased slowly as the frequency increased when the height of sample was less than 12 mm. After the height of sample was equal to 12 mm, the sound absorption coefficient had a peak at 5712 Hz. The first resonance frequency of sound absorption moved toward a lower frequency as the height of the porous structure increased. The resonance frequency shifted to 2234 Hz when the number of structural layers increased to ten. This is related to the quarter wavelength resonance of a sound wave, and the increase in thickness of the material will cause the sound absorption peak to shift towards lower frequencies.
It was noted that the FWHM of the first peak decreased as the number of layers increased, which meant that the width of the first peak narrowed. The average sound absorption coefficient increased with the number of layers. The average sound absorption coefficient represents the average sound absorption capacity of the structure from 500 to 6300 Hz. The higher the average sound absorption coefficient, the better the broadband sound absorption effect of the structure. The sound absorption varied with the number of layers and frequency, as shown in Figure 10d, and the optimized design parameter region is located in the upper right corner of the contour.
The influence of the offset thickness of the surface on the sound absorption coefficient curves is shown in Figure 10b. The sound absorption coefficient at the first peak and flow resistance of the gyroid increased as the offset thickness of the surface increased, but the frequency at the first peak changed little with the increase in offset thickness of surface. This demonstrates that the resonance frequency is independent of the offset thickness of the surface. The average sound absorption coefficient increased slowly as the offset thickness of surface increased. The sound absorption contour with different offset thicknesses of the surface is shown in Figure 10e, and there are two high sound absorption coefficient regions. The first region is located near the frequency of 2000 Hz, and the second region is located near the frequency of 6000 Hz.
The influence of element size on the sound absorption coefficient curves and the sound absorption contour is shown in Figure 10c,f, respectively. When the size of the element was reduced from 4 to 2 mm, the α1 of the gyroid increased by 58.97%, and α1 of G-E2 reached 0.868, which means that the gyroid with a small element size enhances the sound absorption coefficient peak. The average sound absorption coefficient increased by 58.18% as the element size reduced from 4 to 2 mm. It was noted that the flow resistance of G-E2 was 3917 Pa·s/m2, which was 3.6 times that of G-E4 with a 4 mm element size. Although the reduction in unit size can enhance the sound absorption coefficient at 2094 Hz, when the element size was 2 mm, the porosity of the structure had decreased to 59.30%, and the weight of the structure had increased. Therefore, the element size cannot be designed too small. The change in sound absorption coefficient and weight should be considered comprehensively.

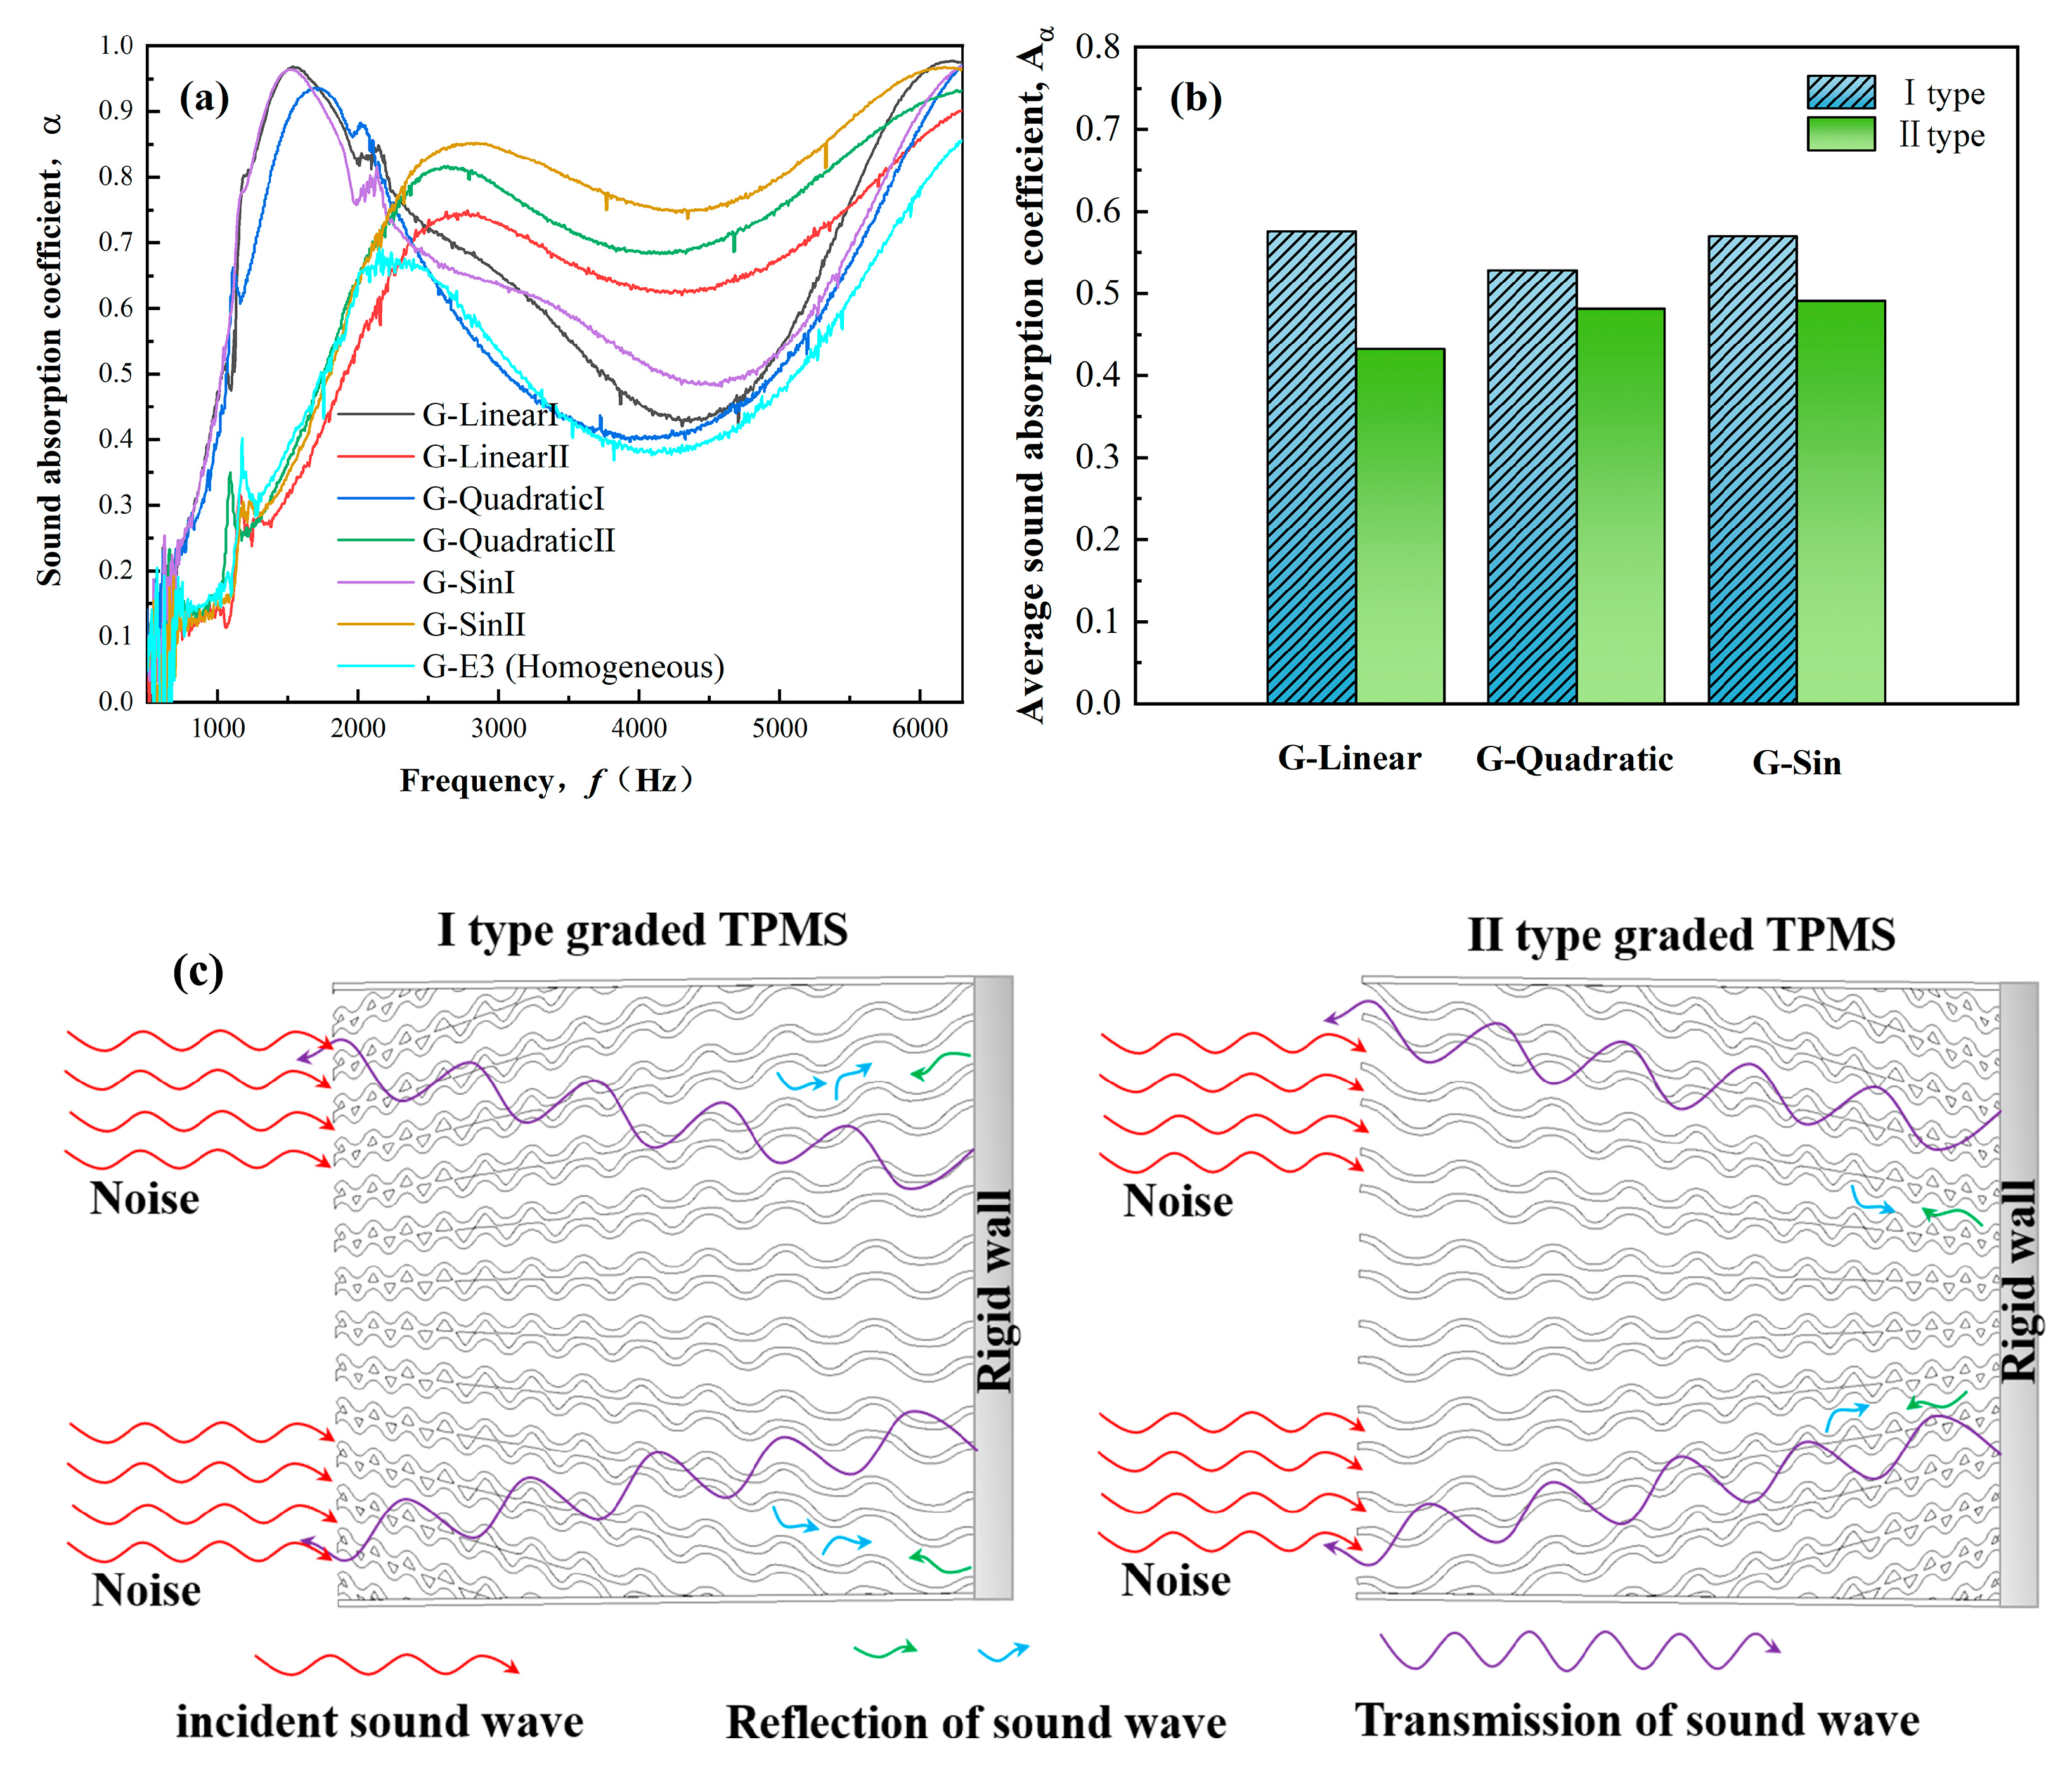
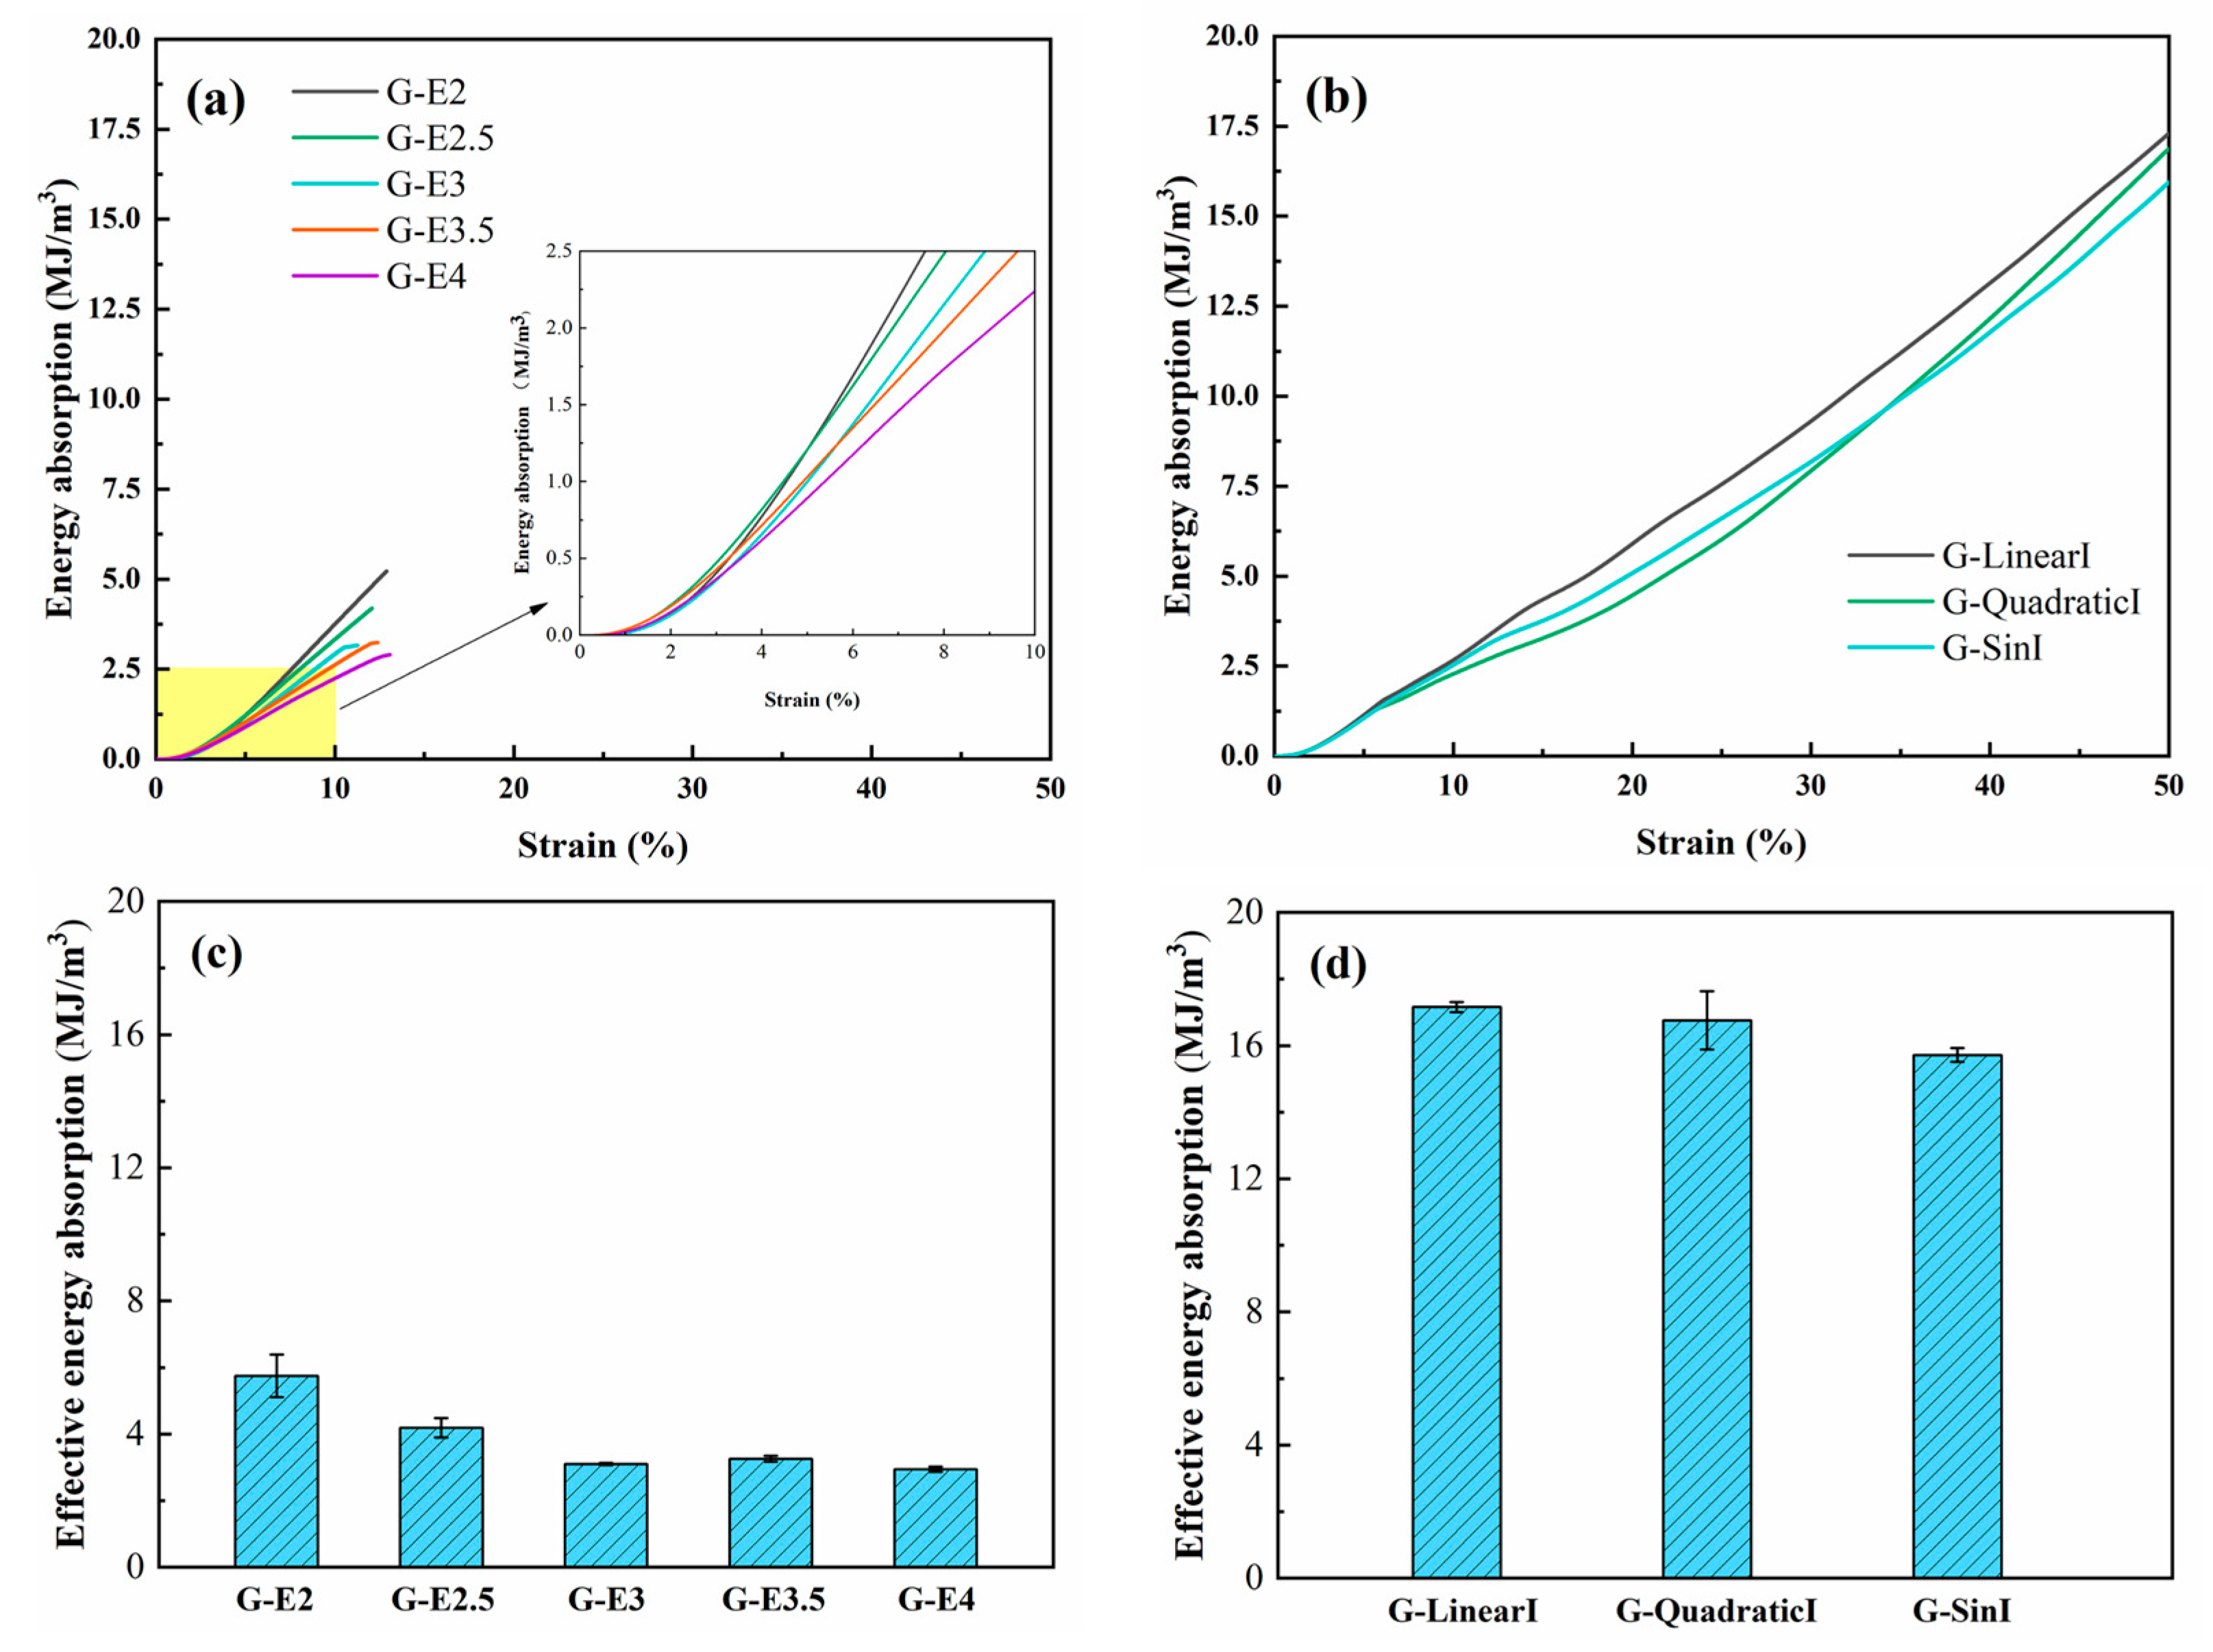
3.3. Sound Absorption Characteristics of Graded TPMS

Based on the sound absorption results of the homogeneous gyroid, the graded gyroid structures were designed by three kinds of functions, including linear function, quadratic function, and sine function. The influence of the graded function of the gyroid on the sound absorption coefficient is shown in Figure 11. According to the sound absorption coefficient curves, the sound absorption characteristics were calculated and are listed in Table 6. The average sound absorption coefficient of G-QuadraticI with a porosity of 66.84% was 6.75% higher than that of G-E2.5 with a porosity of 65.83%, and it wa 27.33% higher than that of G-T0.4 with a porosity of 65.52%. It should be noted that the average sound absorption coefficient of G-QuadraticI was the smallest of the three Type-I gradient structures. Additionally, the first peaks of sound absorption of all three Type-I-graded gyroid structures were all greater than 0.9, which is higher than that of a homogeneous gyroid.
When the linear graded distribution was changed from type-II to type-I, the resonance frequency of the first peak shifted from 2772 to 1534 Hz, and the sound absorption coefficient of the first peak also increased from 0.749 to 0.968. The average sound absorption coefficient of G-LinearI was higher than that of G-LinearII. The resonance frequencies of the first peaks of G-QuadraticI and G-SinI were 1680 Hz and 1528 Hz, respectively. The resonance frequencies of the first peak of G-QuadraticII and G-SinII were 2610 Hz and 2834 Hz, respectively. This indicated that no matter what type of function change is used, the resonance frequency of the type-I structure moves to a lower frequency than that of the type-II structure. The average sound absorption coefficient type-I structure was higher than that of the type-II structure, and the difference of average sound absorption coefficient between these two types was the largest in the linear graded structure, reaching 33.22%. The flow resistance of G-LinearI was 5082 Pa·s/m2, which was the highest among all the TPMS models in this research. This demonstrated that the type-I structure with a small element size on the side contacting the sound source had a higher average sound absorption coefficient. The type-II structure with a large element size on the side contacting the sound source had a lower average sound absorption coefficient. The average sound absorption coefficient of gradient foam metal is 0.6033 [29], which is only 4.83% higher than that of G-LinearI, but there is no obvious resonance peak in this gradient foam metal.
It was noted that the FWHM of type-I was less than type-II, and the FWHM of G-SinII was the highest of all the graded structures, but the first resonance frequency of G-SinII shifted to a higher frequency. Compared with GL-10, the FWHM of G-SinII was 142.43% wider. This result illustrates that type-II has a relatively wide high-frequency absorption performance. The Johnson–Champoux–Allard–Lafarge Model and direct numerical simulations were applied to acoustically characterize the graded TPMS with 10 mm thickness and primitive type TPMS cell, and TPMS with 90% porosity (rigid backing) to 50% porosity (top surface) achieved perfect absorption near 4000 Hz, and TPMS with 50% porosity (rigid backing) to 90% porosity (top surface) had a broaden absorption at high frequencies [33]; these numerical results are similar to our experimental ones.
The mechanism of sound absorption in graded TPMS is illustrated in Figure 11c. The type-I material acted similarly to a Helmholtz resonator composed of a neck (a small aperture in a large surface with low porosity) and a cavity with high porosity. This is a mass spring system. The resonance of the material was sub-wavelength (frequencies range from 1528 to 1680 Hz), lower than that of the equivalent homogeneous porous material with the same total thickness. The first resonance of type-II materials (frequencies ranged from 2610 to 2834 Hz) was higher than that of a homogeneous structure with the same total thickness (frequencies ranged from 2054 to 2244 Hz). The large pores close to the sound source make acoustic waves easy to propagate into graded porous structures, and thus the materials have less reflection and more propagated acoustic energy [34]. Compared with a homogeneous structure, the type-II arrangements broadened the absorption spectra. At normal incidence, perfect sound absorption happens when the surface impedance of porous material is equal to the characteristic impedance of the air. This acoustic characteristic of graded porous structures was also demonstrated in the two-dimensional continuously graded phononic crystal (CGPC) [35], and the graded structure enhanced acoustic scattering and lengthened the propagation path, subsequently dissipating energy.

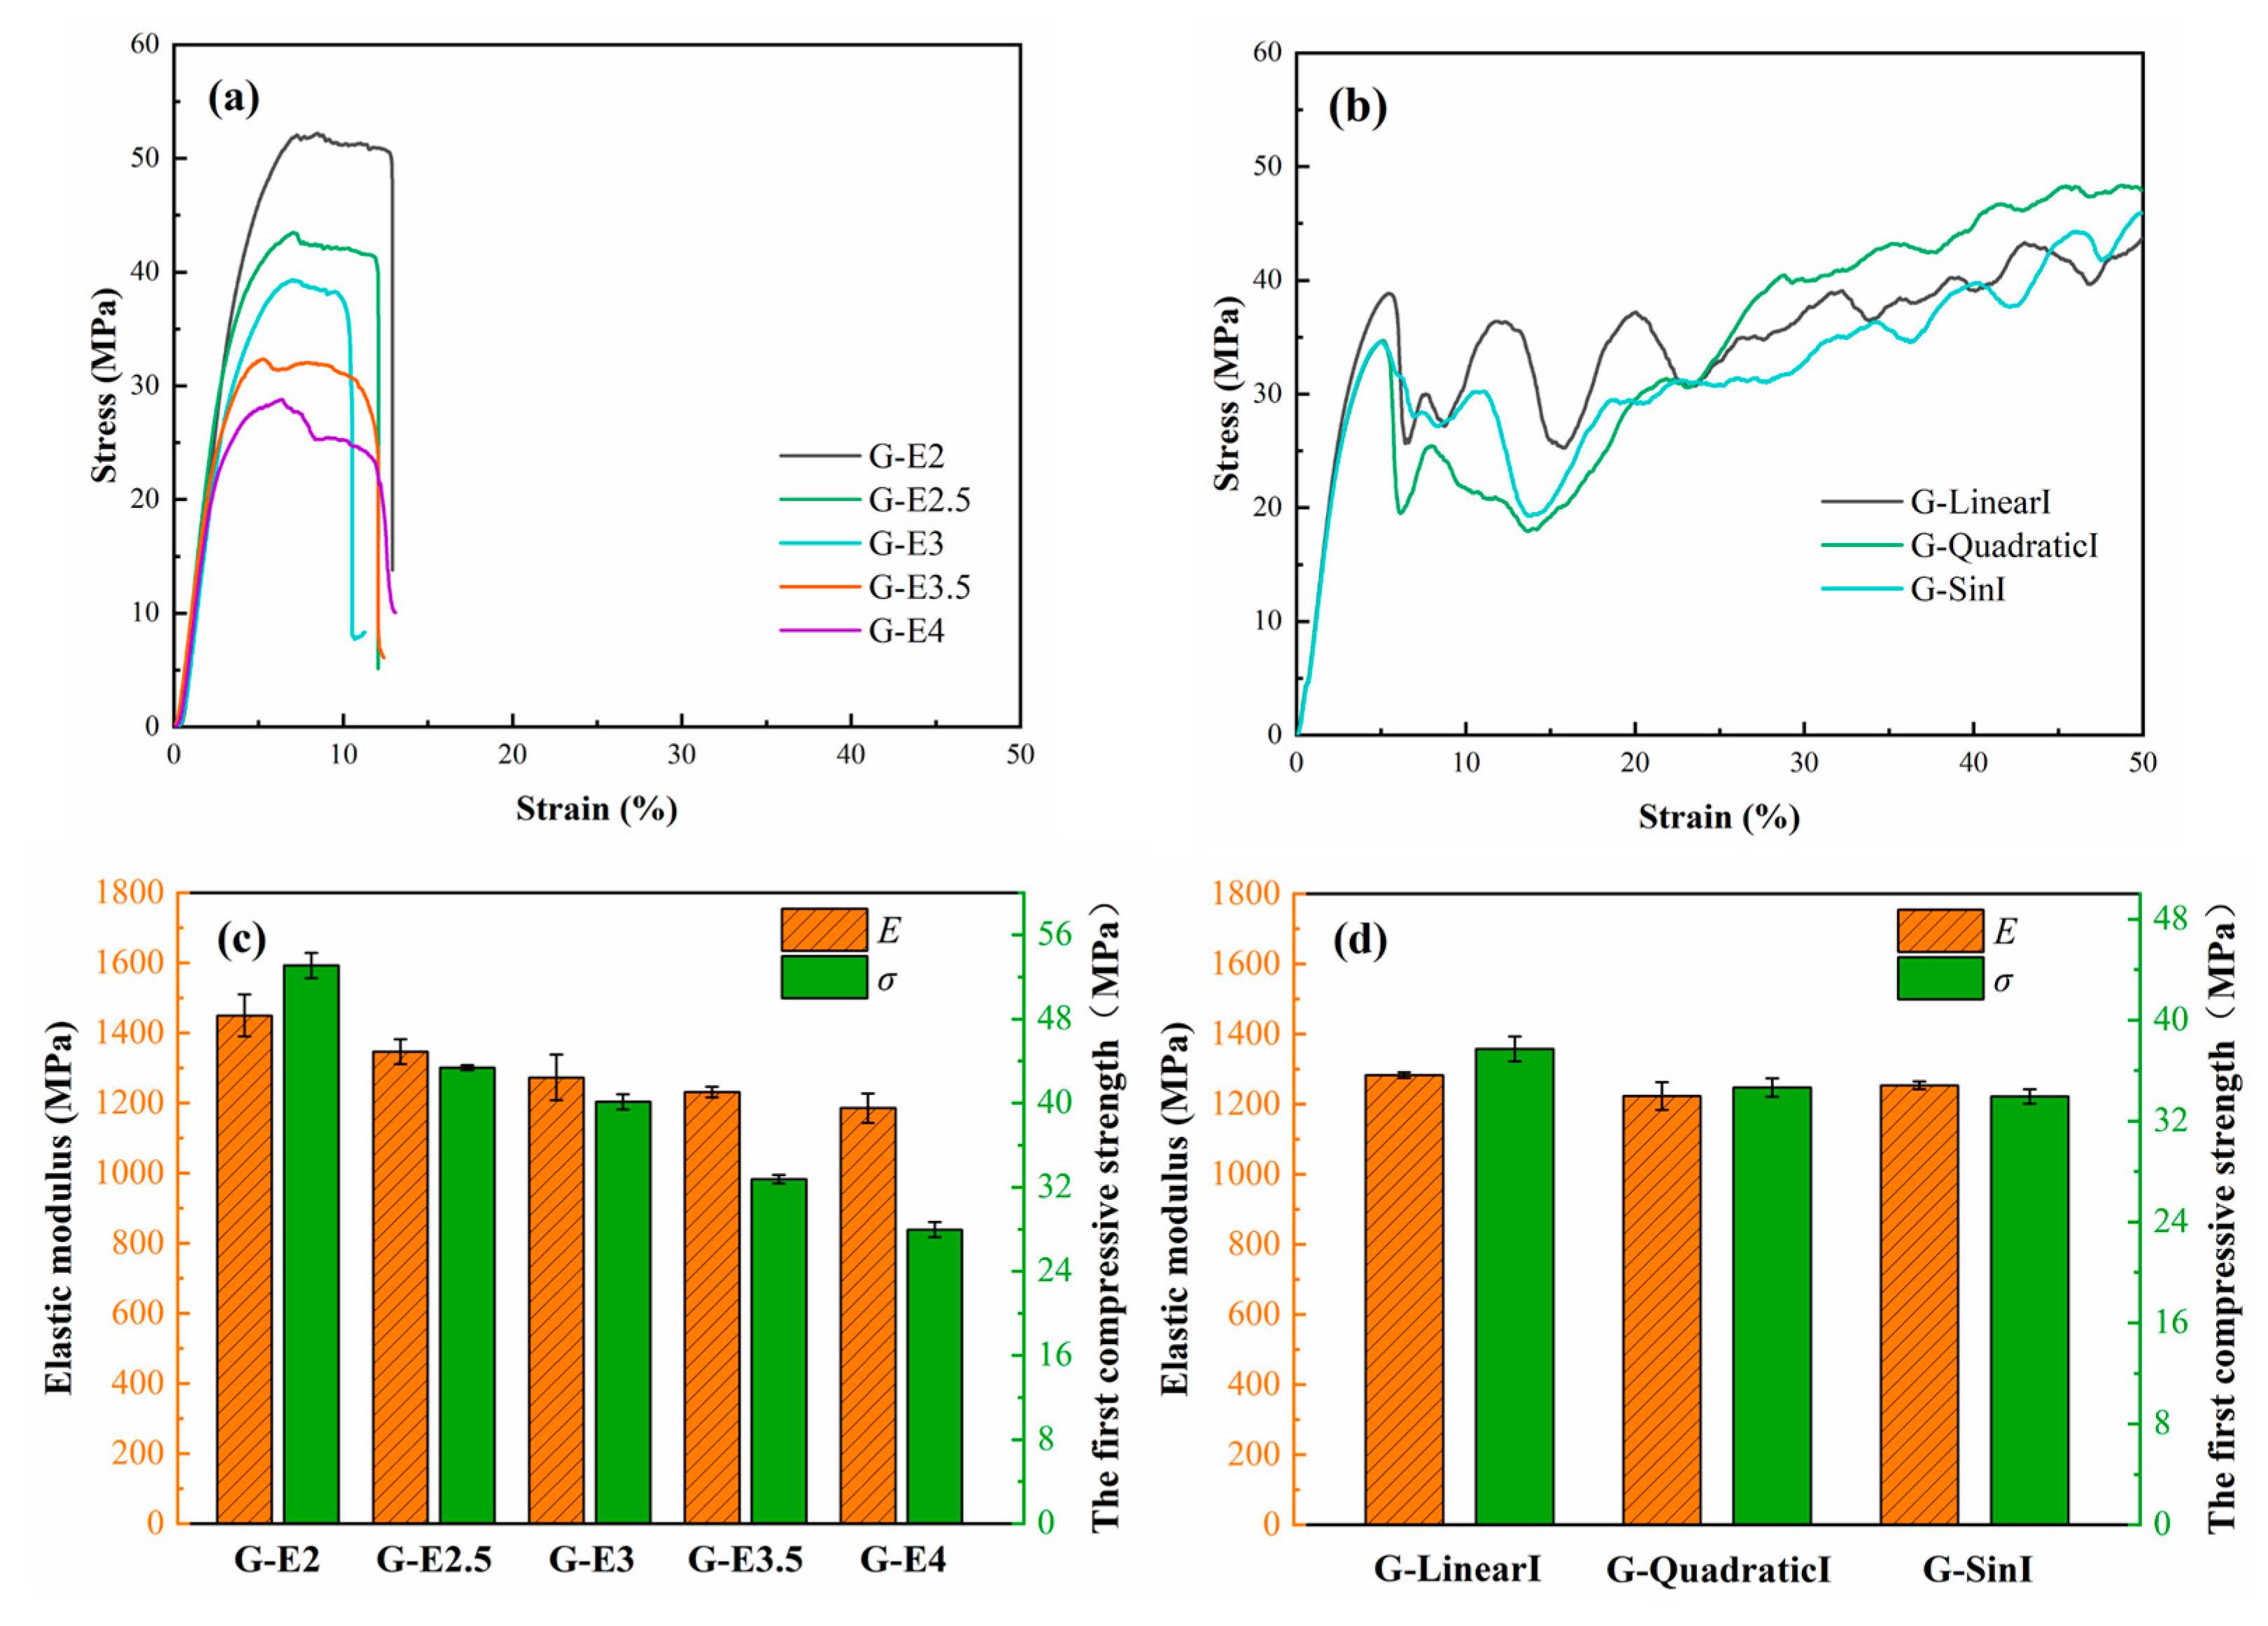
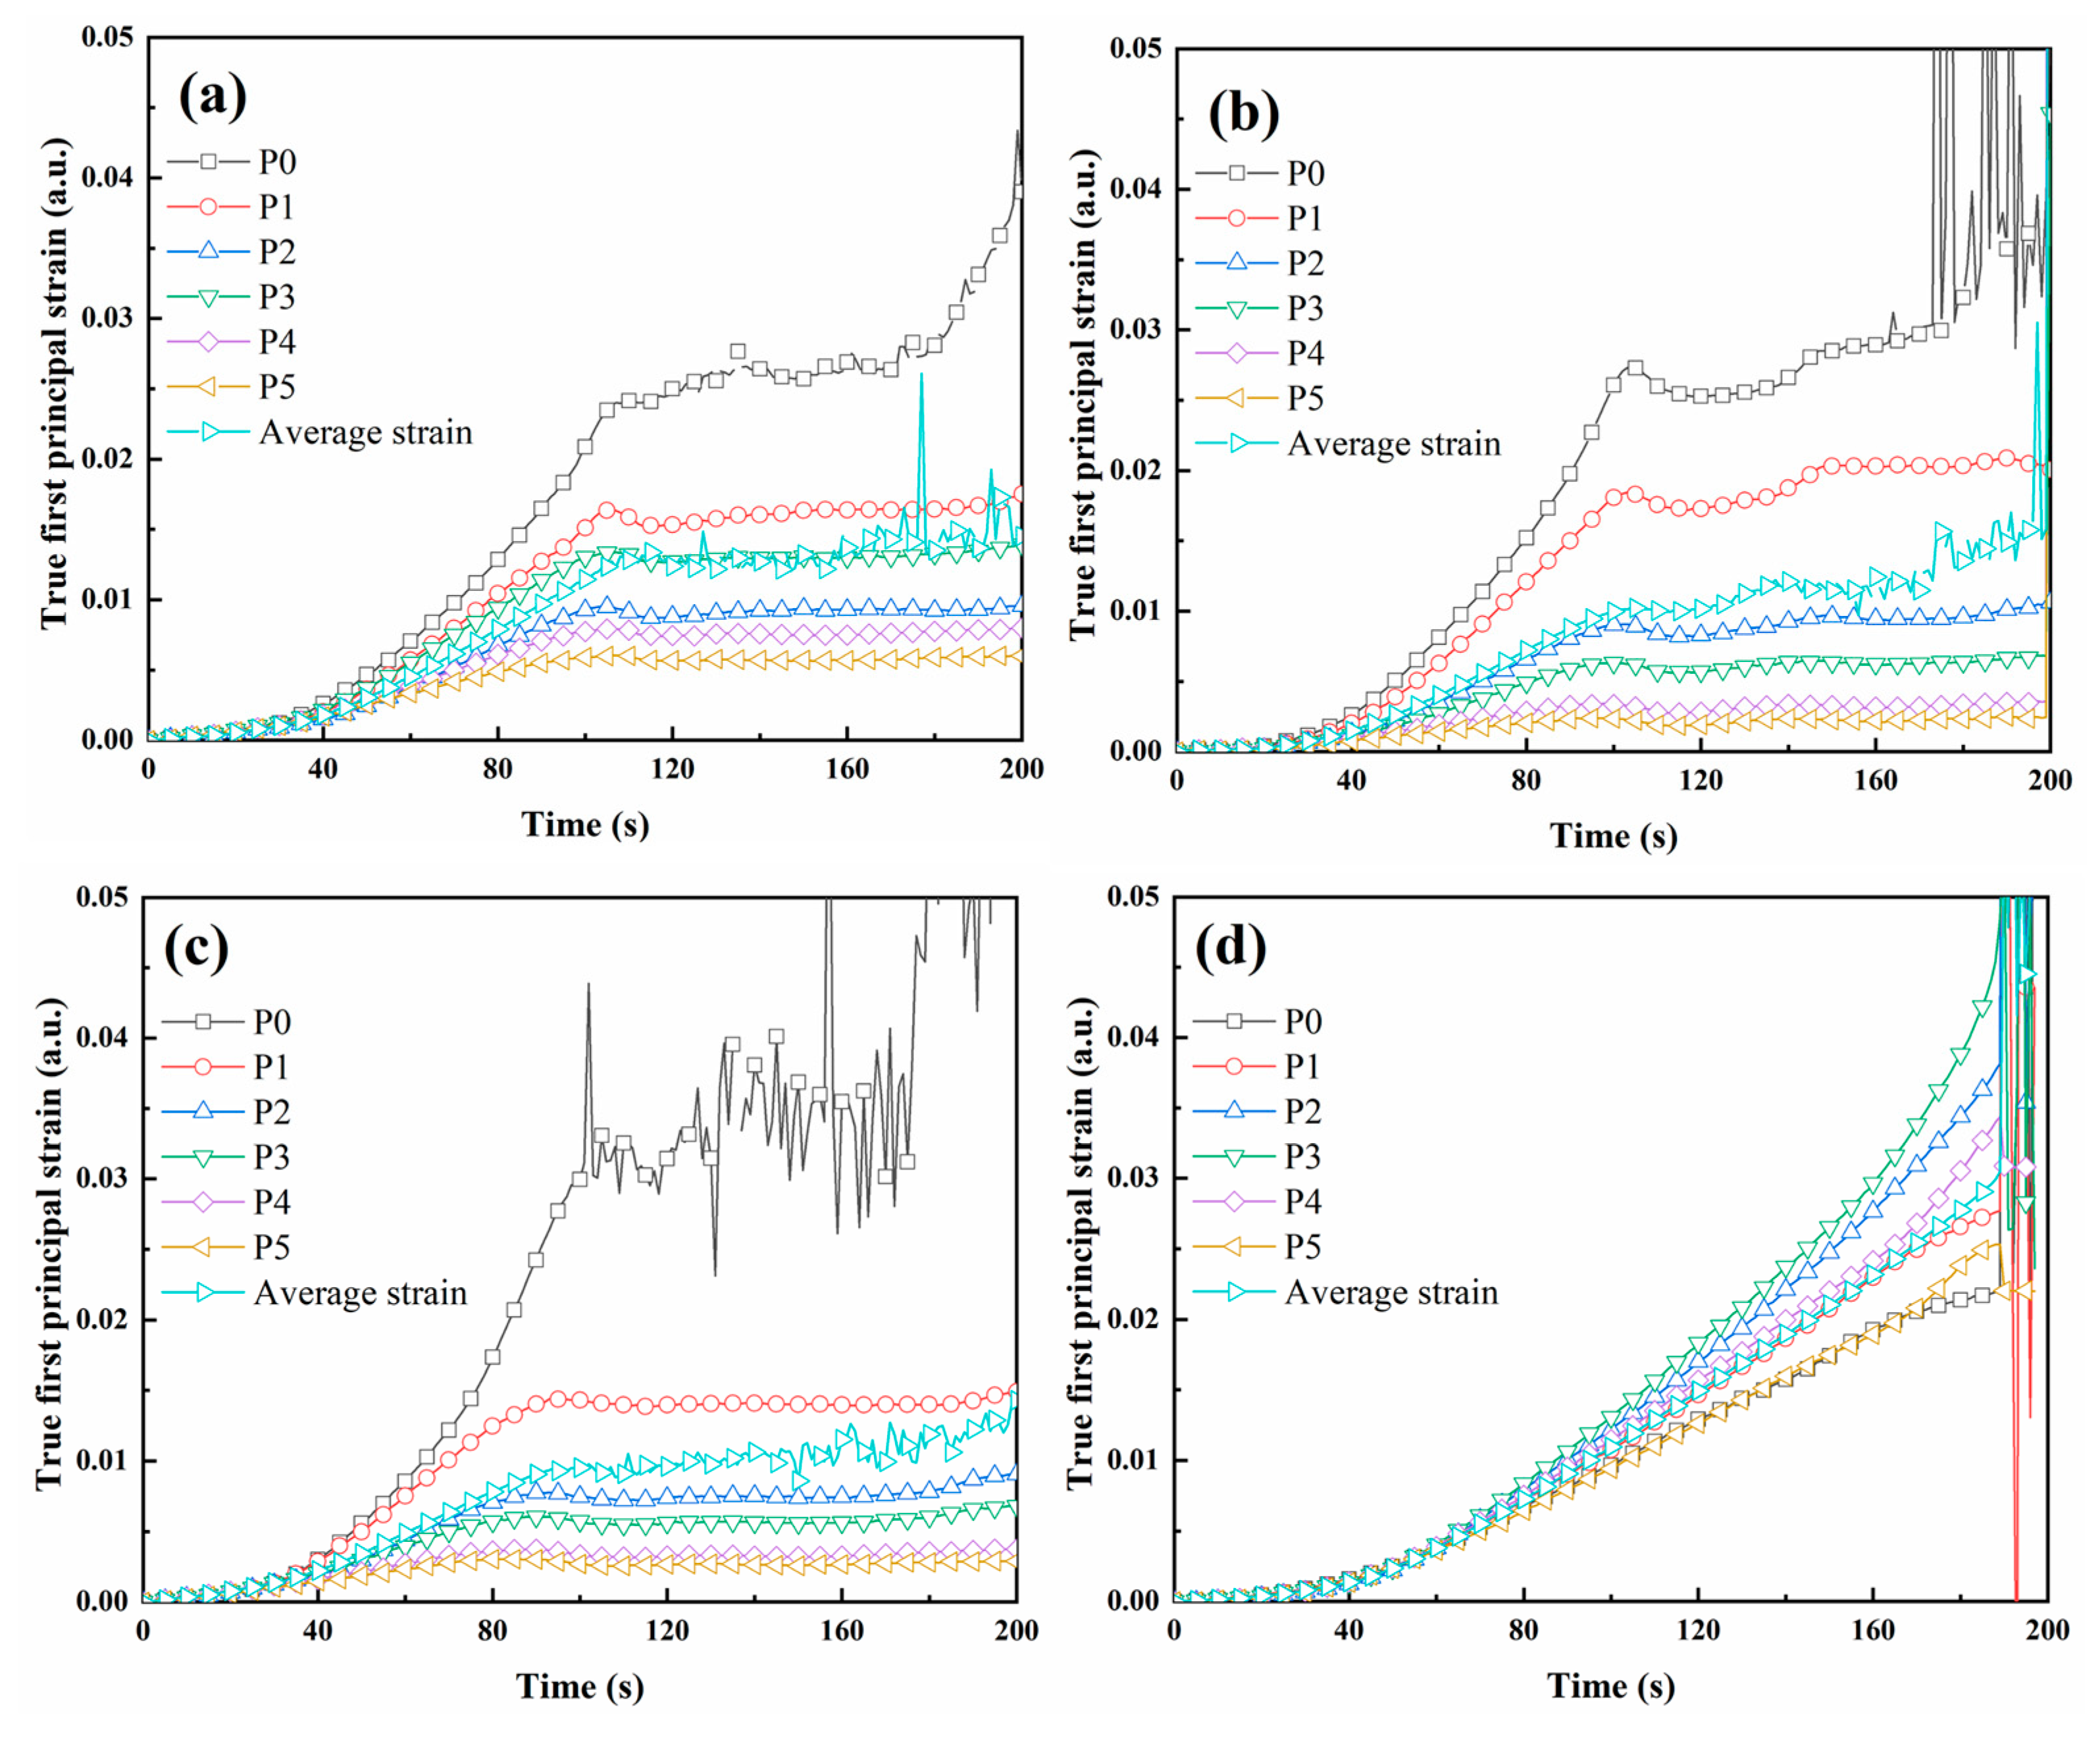
3.4. Mechanical Properties of TPMS

The compression results of TPMS are shown in Figure 12, showing that the homogeneous gyroid had a short yield plateau, and compressive failure strain was between 9.5 and 15%. The first compressive strength and elastic modulus of a homogeneous gyroid decreased as the element size increased, as shown in Figure 12c. The compression curves of graded gyroid structures all had a long yield plateau with over 50% strain, as shown in Figure 12b. There were multiple stress peaks in the yield plateaux of the graded gyroid structures due to the layer-by-layer fracturing of the aluminum alloy porous structures [36].
The elastic moduli of G-LinearI, G-QuadraticI, and G-SinI were 1283.15 ± 8.51 MPa, 1223.62 ± 39.41 MPa, and 1253.77 ± 10.90 MPa, respectively. The differences in the elastic moduli of the graded structures were not significant. Compared to homogeneous structures, the mechanical properties of graded structures had decreased slightly, but due to changes in the mechanical compression mode, their mechanical energy absorption performance had changed. The true first principal strain nephograms of the homogeneous gyroid and graded gyroid structures are shown in Figure 13. The true first principal strain nephograms of G-LinearI, G-QuadraticI, and G-SinI show a layer-wise failure pattern, and this phenomenon is also observed at G-FGS with graded structure shot by DIC [37]. This phenomenon is caused by the porosity-graded variation. The compressive strength of the gyroid with high porosity is weaker than that of the gyroid with low porosity, as illustrated in Figure 12c, and the part of the gyroid with high porosity is prioritized when entering the yielding stage. Therefore, the graded TPMS shows a layer-wise failure pattern, which is common in graded porous structures [38] and graded material structures [39].
The strain–time curves of six points distributed at the surface of the graded gyroid were analyzed by DIC, as shown in Figure 14a–c. The ranking of strain magnitude of G-LinearI on the yield platform was P0 > P1 > P3 > P2 > P4 > P5. The ranking of strain magnitude of G-QuadraticI on the yield platform was P0 > P1 > P2 > P3 > P4 > P5. The ranking of strain magnitude of G-SinI on the yield platform was P0 > P1 > P2 > P3 > P4 > P5. This result shows that the strain decreased layer by layer from top to bottom. The influence of these three functions on the compressive strain of gradient structures lies in the varying magnitudes of the strain differences. The order of strain differences between P0 and P5 was G-SinI > G-QuadraticI > G-LinearI. This result shows that the linear gradient of porosity has little effect on the structural strain difference, while the sinusoidal gradient has a greater impact on the strain difference.
The strain nephogram of G-E3 presents relatively homogeneous changes in the initial stage, and then high strain areas appear in the 45° direction and the middle. In the final stage, a 45° shearing band of G-E3 was observed at 180 s. The 45° shearing band is commonly observed in the homogeneous porous structure [40,41]. The strain–time curves of six points distributed at the surface of the homogeneous gyroid were analyzed by DIC, as shown in Figure 14d. The strains at these six points did not differ significantly during the initial stage of compression. When the true strain was greater than 0.01, the strain curves of the six points began to separate significantly, and the difference gradually expanded. The true strain growth rate was the fastest at points P2 and P3 in the middle region, while the true strain growth rate was the slowest at points P0 and P5. This indicates that the compression shear failure of homogeneous TPMS is due to greater strain near the diagonal structure part.
The energy absorption properties of TPMS are shown in Figure 15. The homogeneous gyroids were all broken at strain values of 11 to 13%, and then the structures lost their ability. In terms of quasi-static energy absorption, the homogeneous structures failed due to fractures caused by shear bands, as shown in Figure 13, resulting in lower energy absorption values. However, gradient structures were compressed layer by layer due to the high to low porosity of the structure, and each layer of the structure can play a buffering role in energy absorption. Therefore, the effective energy absorption strain values of the graded gyroid structures all exceeded 50%, and the effective strain was set at 50% according to test standard ISO 13314:2011. The effective energy absorption of G-E2, G-E2.5, G-E3, G-E3.5, and G-E4 was 5.75 ± 0.64 MJ/m3, 4.19 ± 0.29 MJ/m3, 3.10 ± 0.04 MJ/m3, 3.26 ± 0.09 MJ/m3, and 2.94 ± 0.08 MJ/m3, respectively. This demonstrated that the effective energy absorption increased with the increase in the elemental size of the gyroid. The effective energy absorption of G-Linear was 17.16 ± 0.15 MJ/m3, which was the highest of the three types of graded structures and was four times that of G-E2.5. This shows that the energy absorption properties of the graded porous structures are superior to those of homogeneous porous structures, and this is also demonstrated in the rod-shaped gyroid structures [42].
The average sound absorption coefficient, elastic modulus and energy absorption of TPMS are shown in Figure 16. The average sound absorption and elastic modulus of the homogeneous gyroid are located at the diagonal position in Figure 16a, and this illustrates that the average sound absorption and elastic modulus decrease as the porosity increases. It was noted that the sound absorptions of G-SinI and G-LinearI were the highest of these structures, and their elastic modulus was also located at the diagonal position in Figure 16a. The energy absorption of the homogeneous gyroid is located at the left lower corner of Figure 16b. The average sound absorption and energy absorption of G-SinI and G-LinearI were the highest and are located in the middle upper position. It is proven that under the same weight, G-SinI and G-LinearI have better sound and energy absorption performances.

4. Conclusions

This study proposes a design method for a TPMS structure with high specific strength for broadband and perfect sound absorption. The sound absorption characteristics and compression properties of this TPMS were investigated by acoustic impedance tube tests, compression tests, and DIC analysis. The following conclusions were obtained:
(1)
The frequency corresponding to the sound absorption peak shifts to low frequencies as the height of the material increases. The sound absorption coefficient of the gyroid increases as the height of the material increases from 3 to 30 mm, the offset thickness of the surface increases from 0.2 to 0.5 mm, and the element size decreases from 4 to 2 mm. Based on the contour of sound absorption, the optimized structural design interval parameters were obtained independently for each parameter, and all other parameters were kept constant.
(2)
The graded direction and function have an impact on the sound absorption characteristics. Owing to the multiple scattering and Helmholtz-resonator-like effect, the first resonance peak of the graded TPMS with porosity from 60.51 to 77.59% is higher than the graded TPMS with porosity from 77.59 to 60.51%, and the former achieves perfect absorption at 1528 Hz, and the latter has a broadband sound absorption coefficient.
(3)
The compressive yield plateau of homogeneous TPMS is short due to the 45° shearing band, and graded TPMS has a long yield plateau in a layer-wise failure pattern. The length of the yield plateau determines that the energy absorption value of graded TPMS is higher than that of homogeneous TPMS.

Author Contributions

Conceptualization, M.Z.; methodology, M.Z.; formal analysis, C.L. and M.D.; investigation, M.Z. and C.L.; data curation, M.Z., M.D. and J.L.; writing—original draft preparation, M.Z.; writing—review and editing, C.L., M.D., Y.L. and D.W.; visualization, C.L.; supervision, D.W.; project administration, M.Z.; funding acquisition, M.Z. All authors have read and agreed to the published version of the manuscript.

Funding

This research was funded by Guangdong Basic and Applied Basic Research Foundation (No. 2023A1515012704, No.2021A1515110033), and Program for Scientific Research Start-up Funds of Guangdong Ocean University (No. 360302022201), Student Innovation Team Project of Guangdong Ocean University, (No. CXTD2023021).

Institutional Review Board Statement

Not applicable.

Informed Consent Statement

Not applicable.

Data Availability Statement

Data are contained within the article.

Conflicts of Interest

The authors declare no conflict of interest.

References

  1. Rastegar, N.; Ershad-Langroudi, A.; Parsimehr, H.; Moradi, G. Sound-absorbing porous materials: A review on polyurethane-based foams. Iran. Polym. J. 2022, 31, 83–105. [Google Scholar] [CrossRef]
  2. Allard, J.; Atalla, N. Propagation of Sound in Porous Media: Modelling Sound Absorbing Materials; John Wiley & Sons: Hoboken, NJ, USA, 2009. [Google Scholar]
  3. Mamtaz, H.; Hosseini Fouladi, M.; Nuawi, M.Z.; Narayana Namasivayam, S.; Ghassem, M.; Al-Atabi, M. Acoustic absorption of fibro-granular composite with cylindrical grains. Appl. Acoust. 2017, 126, 58–67. [Google Scholar] [CrossRef]
  4. Wang, X.; Li, Y.; Chen, T.; Ying, Z. Research on the sound absorption characteristics of porous metal materials at high sound pressure levels. Adv. Mech. Eng. 2015, 7, 1–7. [Google Scholar] [CrossRef]
  5. Leclaire, P.; Umnova, O.; Dupont, T.; Panneton, R. Acoustical properties of air-saturated porous material with periodically distributed dead-end pores. J. Acoust. Soc. Am. 2015, 137, 1772–1782. [Google Scholar] [CrossRef]
  6. Palma, G.; Mao, H.; Burghignoli, L.; Göransson, P.; Iemma, U. Acoustic Metamaterials in Aeronautics. Appl. Sci. 2018, 8, 971. [Google Scholar] [CrossRef]
  7. Bheekhun, N.; Abu Talib, A.R.; Hassan, M.R. Aerogels in Aerospace: An Overview. Adv. Mater. Sci. Eng. 2013, 2013, 406065. [Google Scholar] [CrossRef]
  8. Cobo, P.; Simón, F. Multiple-Layer Microperforated Panels as Sound Absorbers in Buildings: A Review. Buildings 2019, 9, 53. [Google Scholar] [CrossRef]
  9. Choe, H.; Sung, G.; Kim, J.H. Chemical treatment of wood fibers to enhance the sound absorption coefficient of flexible polyurethane composite foams. Compos. Sci. Technol. 2018, 156, 19–27. [Google Scholar] [CrossRef]
  10. Guo, J.; Xiao, Y.; Ren, H.; Chen, H.; Yu, D.; Wen, J. Broadband low-frequency sound insulation of double-panel metastructures with a perforated lattice truss-core sandwich plate. Mech. Syst. Signal Process 2023, 200, 110634. [Google Scholar] [CrossRef]
  11. Xie, S.; Yang, S.; Yang, C.; Wang, D. Sound absorption performance of a filled honeycomb composite structure. Appl. Acoust. 2020, 162, 107202. [Google Scholar] [CrossRef]
  12. Kong, X.; Liu, B.; Li, Z.; Zhang, P.; Shi, C. Research on Sound Absorption Properties of Tri-Periodic Minimal Surface Sandwich Structure of Selective Laser Melting Titanium Alloy. Mater. Trans. 2023, 64, 861–868. [Google Scholar] [CrossRef]
  13. Gama, N.; Ferreira, A.; Barros-Timmons, A. Polyurethane Foams: Past, Present, and Future. Materials 2018, 11, 1841. [Google Scholar] [CrossRef] [PubMed]
  14. Lu, J.-Y.; Alhammadi, A.; Giannini, V.; Al Teneiji, M.; Lee, D.-W. Elastic Vibration Bandgap of Architectured Materials based on Triply Periodic Minimal Surfaces. In Proceedings of the 2021 Fifteenth International Congress on Artificial Materials for Novel Wave Phenomena (Metamaterials), New York, NY, USA, 20–24 September 2021; pp. 11–14. [Google Scholar]
  15. Johnston, W.; Sharma, B. Additive manufacturing of fibrous sound absorbers. Addit. Manuf. 2021, 41, 101984. [Google Scholar] [CrossRef]
  16. Monkova, K.; Vasina, M.; Monka, P.P.; Kozak, D.; Vanca, J. Effect of the Pore Shape and Size of 3D-Printed Open-Porous ABS Materials on Sound Absorption Performance. Materials 2020, 13, 4474. [Google Scholar] [CrossRef]
  17. Zieliński, T.G.; Opiela, K.C.; Pawłowski, P.; Dauchez, N.; Boutin, T.; Kennedy, J.; Trimble, D.; Rice, H.; Van Damme, B.; Hannema, G.; et al. Reproducibility of sound-absorbing periodic porous materials using additive manufacturing technologies: Round robin study. Addit. Manuf. 2020, 36, 101564. [Google Scholar] [CrossRef]
  18. Cavalieri, T.; Boulvert, J.; Gabard, G.; Romero-García, V.; Escouflaire, M.; Regnard, J.; Groby, J.-P. Graded and Anisotropic Porous Materials for Broadband and Angular Maximal Acoustic Absorption. Materials 2020, 13, 4605. [Google Scholar] [CrossRef]
  19. Boulvert, J.; Humbert, T.; Romero-García, V.; Gabard, G.; Fotsing, E.R.; Ross, A.; Mardjono, J.; Groby, J.-P. Perfect, broadband, and sub-wavelength absorption with asymmetric absorbers: Realization for duct acoustics with 3D printed porous resonators. J. Sound Vib. 2022, 523, 116687. [Google Scholar] [CrossRef]
  20. Liu, Z.; Zhan, J.; Fard, M.; Davy, J.L. Acoustic properties of a porous polycarbonate material produced by additive manufacturing. Mater. Lett. 2016, 181, 296–299. [Google Scholar] [CrossRef]
  21. Opiela, K.C.; Zieliński, T.G.; Attenborough, K. Limitations on validating slitted sound absorber designs through budget additive manufacturing. Mater. Des. 2022, 218, 110703. [Google Scholar] [CrossRef]
  22. Yang, W.; An, J.; Chua, C.K.; Zhou, K. Acoustic absorptions of multifunctional polymeric cellular structures based on triply periodic minimal surfaces fabricated by stereolithography. Virtual Phys. Prototyp. 2020, 15, 242–249. [Google Scholar] [CrossRef]
  23. Gao, N.; Tang, L.; Deng, J.; Lu, K.; Hou, H.; Chen, K. Design, fabrication and sound absorption test of composite porous metamaterial with embedding I-plates into porous polyurethane sponge. Appl. Acoust. 2021, 175, 107845. [Google Scholar] [CrossRef]
  24. Prasetiyo, I.; Anwar, K.; Brahmana, F.; Sakagami, K. Development of stackable subwavelength sound absorber based on coiled-up system. Appl. Acoust. 2022, 195, 108842. [Google Scholar] [CrossRef]
  25. Feng, Y.; Zong, D.; Hou, Y.; Yin, X.; Zhang, S.; Duan, L.; Si, Y.; Jia, Y.; Ding, B. Gradient structured micro/nanofibrous sponges with superior compressibility and stretchability for broadband sound absorption. J. Colloid Interface Sci. 2021, 593, 59–66. [Google Scholar] [CrossRef]
  26. Yang, K.; Long, G.; Tang, Z.; Pan, X.; Su, W.; Xie, Y. Mechanical and acoustic properties of ceramsite sound absorbing boards with gradient structure. Acoust. Aust. 2022, 50, 393–403. [Google Scholar] [CrossRef]
  27. Wu, F.; Zhang, X.; Ju, Z.; Zhao, J.; Hu, M.; Gao, M.; Luo, J.; Pu, H. Ultra-Broadband Sound Absorbing Materials Based on Periodic Gradient Impedance Matching. Front. Mater. 2022, 9, 909666. [Google Scholar] [CrossRef]
  28. Umnova, O.; Brooke, D.; Leclaire, P.; Dupont, T. Multiple resonances in lossy acoustic black holes—Theory and experiment. J. Sound Vib. 2023, 543, 117377. [Google Scholar] [CrossRef]
  29. Yang, X.; Shen, X.; Bai, P.; He, X.; Zhang, X.; Li, Z.; Chen, L.; Yin, Q. Preparation and Characterization of Gradient Compressed Porous Metal for High-Efficiency and Thin-Thickness Acoustic Absorber. Materials 2019, 12, 1413. [Google Scholar] [CrossRef]
  30. Boulvert, J.; Cavalieri, T.; Costa-Baptista, J.; Schwan, L.; Romero-Garcia, V.; Gabard, G.; Fotsing, E.R.; Ross, A.; Mardjono, J.; Groby, J.-P. Optimally graded porous material for broadband perfect absorption of sound. J. Appl. Phys. 2019, 126, 175101. [Google Scholar] [CrossRef]
  31. ASTM E1050-12; Standard Test Method for Impedance and Absorption of Acoustical Materials Using a Tube, Two Microphones and a Digital Frequency Analysis System. ASTM: West Conshohocken, PA, USA, 2012.
  32. ISO 13314:2011; Mechanical Testing of Metals Ductility Testing Compression test for Porous and Cellular Metals. ISO Publishing: Geneve, Switzerland, 2011.
  33. Guan, X.; Yang, J.; Deckers, E.; Hornikx, M. Computational Characterization of Functionally Graded Porous Ansorbers Based On Triply Periodic Minimal Surfaces (TPMS). In Proceedings of the 10th Convention of the European Acoustics Association, Turin, Italy, 11–15 September 2023. [Google Scholar]
  34. Zhang, X.H.; Qu, Z.G.; He, X.C.; Lu, D.L. Experimental study on the sound absorption characteristics of continuously graded phononic crystals. AIP Adv. 2016, 6, 105205. [Google Scholar] [CrossRef]
  35. Zhang, X.; Qu, Z.; Xu, Y. Enhanced sound absorption in two-dimensional continuously graded phononic crystals. Jpn. J. Appl. Phys. 2019, 58, 090904. [Google Scholar] [CrossRef]
  36. Maskery, I.; Aboulkhair, N.; Aremu, A.; Tuck, C.; Ashcroft, I.; Wildman, R.D.; Hague, R. A mechanical property evaluation of graded density Al-Si10-Mg lattice structures manufactured by selective laser melting. Mater. Sci. Eng. A 2016, 670, 264–274. [Google Scholar] [CrossRef]
  37. Zhang, X.; Jiang, L.; Yan, X.; Wang, Z.; Li, X.; Fang, G. Revealing the apparent and local mechanical properties of heterogeneous lattice: A multi-scale study of functionally graded scaffold. Virtual Phys. Prototyp. 2022, 18, 1. [Google Scholar] [CrossRef]
  38. Yang, L.; Mertens, R.; Ferrucci, M.; Yan, C.; Shi, Y.; Yang, S. Continuous graded Gyroid cellular structures fabricated by selective laser melting: Design, manufacturing and mechanical properties. Mater. Des. 2019, 162, 394–404. [Google Scholar] [CrossRef]
  39. Zhang, M.; Yang, Y.; Wang, D.; Song, C.; Chen, J. Microstructure and mechanical properties of CuSn/18Ni300 bimetallic porous structures manufactured by selective laser melting. Mater. Des. 2019, 165, 107583. [Google Scholar] [CrossRef]
  40. Liu, F.; Ran, Q.; Zhao, M.; Zhang, T.; Zhang, D.Z.; Su, Z. Additively manufactured continuous cell-size gradient porous scaffolds: Pore characteristics, mechanical properties and biological responses in vitro. Materials 2020, 13, 2589. [Google Scholar] [CrossRef]
  41. Zhang, L.; Feih, S.; Daynes, S.; Chang, S.; Wang, M.Y.; Wei, J.; Lu, W.F. Energy absorption characteristics of metallic triply periodic minimal surface sheet structures under compressive loading. Addit. Manuf. 2018, 23, 505–515. [Google Scholar] [CrossRef]
  42. Wang, Y.; Liu, F.; Zhang, X.; Zhang, K.; Wang, X.; Gan, D.; Yang, B. Cell-size graded sandwich enhances additive manufacturing fidelity and energy absorption. Int. J. Mech. Sci. 2021, 211, 106798. [Google Scholar] [CrossRef]
Figure 1. Design process of TPMS for test.
Coatings 13 01950 g001
Figure 2. Models of homogeneous gyroids with different layers, offset thickness of surface and element size.
Coatings 13 01950 g002
Figure 3. The functional relationship curves between element size and structural distance: (a) type-I graded distribution of element size, (b) type-II graded distribution of element size.
Coatings 13 01950 g003
Figure 4. Designed model of the graded gyroid structures.
Coatings 13 01950 g004
Figure 5. LPBF equipment.
Coatings 13 01950 g005
Figure 6. (a) Two-microphone impedance tube equipment, (b) scheme of impedance tube.
Coatings 13 01950 g006
Figure 7. DIC test: (a) DIC test equipment and (b) strain of six points were extracted by DIC.
Coatings 13 01950 g007
Figure 8. Homogeneous gyroid manufactured by LPBF.
Coatings 13 01950 g008
Figure 9. Measurement of gyroid with different offset thicknesses of surface.
Coatings 13 01950 g009
Figure 10. Influence of structural parameters on the sound absorption curves of homogeneous gyroid: (a) number of layers, (b) offset thickness of surface, and (c) element size. Influence of structural parameters on contours of sound absorption, (d) number of layers, (e) offset thickness of surface, and (f) element size.
Coatings 13 01950 g010
Figure 11. Influence of the function on (a) the sound absorption coefficient, (b) the average sound absorption coefficient, (c) the mechanism of sound absorption of graded gyroid.
Coatings 13 01950 g011
Figure 12. Compression results of TPMS: (a) compressive stress–strain curves of homogeneous gyroids, (b) compressive stress–strain curves of graded gyroids, (c) compressive properties of homogeneous gyroids, and (d) compressive properties of graded gyroids.
Coatings 13 01950 g012
Figure 13. The true first principal strain nephogram of TPMS analyzed by DIC.
Coatings 13 01950 g013
Figure 14. The true first principal strain–time curves analyzed by DIC: (a) G-linear, (b) G-quadratic, (c) G-sin, and (d) G-E3.
Coatings 13 01950 g014
Figure 15. Energy absorption of TPMS: (a) energy absorption curves of homogeneous gyroid, (b) energy absorption curves of graded gyroid, (c) effective energy absorption of homogeneous gyroid, and (d) effective energy absorption of graded gyroid.
Coatings 13 01950 g015
Figure 16. (a) Average sound absorption coefficient and elastic modulus of TPMS, (b) average sound absorption coefficient and energy absorption of TPMS.
Coatings 13 01950 g016
Table 1. Structural parameters of homogeneous gyroid.
SpecimensNumber of LayersHeight/mmElement Size/mmOffset Thickness of Surface/mmPorosity/%
G-L11330.372.29
G-L22630.372.29
G-L441230.372.29
G-L661830.372.29
G-L882430.372.29
G-L10103030.372.29
G-T0.2103030.280.57
G-T0.25103030.2575.21
G-T0.3103030.372.29
G-T0.4103030.465.52
G-T0.5103030.560.51
G-E2153020.359.30
G-E2.512302.50.365.83
G-E3103030.372.29
G-E3.58.6303.50.374.60
G-E47.53040.377.59
Table 2. Structural parameters of graded gyroid structures.
SpecimensNumber of LayersHeight (mm)Element Size (mm)Offset Thickness of Surface (mm)Porosity (%)
G-LinearI10302→40.369.16
G-LinearII10304→20.369.16
G-QuadraticI10302→40.366.84
G-QuadraticII10304→20.366.84
G-SinI10302→40.368.87
G-SinII10304→20.368.87
Table 3. The processing parameter for LPBF.
Laser Power
(W)
Scanning Speed
(mm/s)
Layer Thickness
(mm)
Scanning Space
(mm)
15013000.030.09
Table 4. Chemical composition of AlSi7Mg powder.
ElementAlSiMgCuFeMnNiO
Composition (wt. %)Bal.6.7300.6780.0450.2810.1980.0120.070
Table 5. Sound absorption characteristics of homogeneous gyroids.
SpecimenPorosity (%)f1 (Hz)α1FWHM (Hz)AαFlow Resistance (Pa·s/m2)
G-L172.29---0.0384382
G-L2 72.29---0.0552561
G-L472.2957120.49843790.1523429
G-L672.2938660.60539380.2532454
G-L872.2926520.66139290.3131829
G-L1072.2922340.68516240.3591800
G-T0.280.5722440.62732240.3741640
G-T0.2575.2121440.63028660.3751734
G-T0.372.2922340.68516240.3591800
G-T0.465.5221460.73926560.4152234
G-T0.560.5121660.82123230.4302348
G-E259.3020960.86827470.5033917
G-E2.565.8320540.80230810.4953895
G-E372.2922340.68516240.3591800
G-E3.574.6020940.60628900.3521403
G-E477.5920940.54629910.3181076
Table 6. Sound absorption characteristics of graded gyroid.
SpecimenPorosity (%)f1 (Hz)α1FWHM (Hz)Flow Resistance (Pa·s/m2)
G-LinearI69.1615340.96828150.57555082
G-LinearII69.1627720.74954360.43203032
G-QuadraticI66.8416800.93622050.52843341
G-QuadraticII66.8426100.81760090.48154026
G-SinI68.8715280.96434250.56974666
G-SinII68.8728340.85274110.49104545
Disclaimer/Publisher’s Note: The statements, opinions and data contained in all publications are solely those of the individual author(s) and contributor(s) and not of MDPI and/or the editor(s). MDPI and/or the editor(s) disclaim responsibility for any injury to people or property resulting from any ideas, methods, instructions or products referred to in the content.

