Article

Wear Resistance Study of Bionic Pitted Ni Cladding Layer on 7075 Aluminum Alloy Drill Pipe Surface

1
College of Construction Engineering, Jilin University, Changchun 130026, China
2
Engineering Research Center of Geothermal Resources Development Technology and Equipment, Ministry of Education, Jilin University, Changchun 130026, China
3
Key Laboratory of Drilling and Exploration Technology in Complex Conditions, Ministry of Natural Resources, Jilin University, Changchun 130026, China
4
Department of Electrical Engineering and Energy Technology, University of Vaasa, P.O. Box 700, 65101 Vaasa, Finland
5
Department of Civil Engineering, Aalto University, P.O. Box 12100, 02130 Espoo, Finland
*
Author to whom correspondence should be addressed.
Coatings 2023, 13(10), 1768; https://doi.org/10.3390/coatings13101768
Submission received: 31 August 2023 / Revised: 3 October 2023 / Accepted: 11 October 2023 / Published: 13 October 2023
(This article belongs to the Special Issue Investigation on Corrosion Behaviour of Metallic Materials)

Abstract

:
To enhance the lifespan of drill pipes and minimize wear, this study introduces a bionic structure model inspired by the pit shape structure found in the dung beetle’s abdomen. The stress distribution and wear of bionic pitted structure and ordinary structure are simulated by finite element software. The findings revealed that the bionic structure significantly improves stress distribution, resulting in an impressive 81.3% increase in lifespan. Subsequently, the surface of the 7075 aluminum drill pipe was coated with Ni powder by a laser cladding system. Wear tests were conducted to analyze the wear and surface damage behavior of the cladding layer. The microstructure, composition, and microhardness of the cladding layer were measured and observed. The results showed that the cladding layer was mainly composed of Al3Ni2 and had high hardness. Additionally, a transition region exists between the cladding layer and the substrate, comprising relatively low hardness Al, thereby enhancing the drill pipe’s ability to withstand alternating loads. Furthermore, the bionic structure possesses the capability to store particles, effectively reducing the occurrence of abrasive wear and increasing the lifespan by 70.0%.

1. Introduction

The performance of drill pipes has become increasingly important in recent years due to the growing number of complex well types, including deep wells, ultra-deep wells, and large displacement horizontal wells. Aluminum alloy drill pipes are popular due to their lightweight, good corrosion resistance, low bending stress, and non-magnetic properties [1,2,3]. However, the low hardness of the aluminum alloy drill pipe and the inevitable spiral bending downhole result in significant wear between the pipe and the wellbore and casing, leading to a reduced lifespan for the aluminum alloy drill pipe [4,5,6]. So, the demand for improving the wear resistance of aluminum alloy drill pipes has become urgent.
In order to improve the wear resistance of aluminum alloys, surface treatment methods such as liquid-phase metallurgy, solid-phase metallurgy, friction stir welding [7,8] micro-arc oxidation, spraying, and laser cladding are usually mentioned [9,10,11]. Laser cladding is a popular method for improving the wear resistance of aluminum alloy drill pipes due to its advantages of fast solidification, low substrate deformation, good metallurgical bonding, excellent performance, and good forming quality [12,13,14,15]. Ni-based powders have been studied and widely used in laser cladding materials for their good wettability, corrosion resistance, high-temperature self-lubrication, and moderate price [16]. However, applying laser cladding on the entire substrate surface may result in defects such as porosity, cracks, and material waste [17,18]. Bionics can effectively solve this problem.
Bionic research has found that the structure of some biological surfaces has high wear resistance, which is a feature gradually formed by biological evolution and optimization over hundreds of millions of years to adapt to the living environment [19]. The discovery of this phenomenon points out a new direction for the study of the wear resistance of friction pairs. Therefore, researchers explored the protective effects of various biological structures [20,21,22] on frictional wear surfaces, and then a bionic non-smooth surface was proposed. Jones et al. [23] and Minhaeng et al. [24] created dimple-like pits on cylindrical Co-Cr-Mo and 15CrMo alloy surfaces, respectively. Their research demonstrated the wear resistance of these bionic pits. Zhang [25] experimented with various bionic units on gray cast iron specimens and found that coupling these units improved the sliding wear resistance of the material. Mao C et al. [26] preliminarily explored the effects of dung beetle structure on the wear resistance pit tire tread compounds. Therefore, combining the bionic coupling functional surface with laser cladding can not only improve wear resistance but also reduce the formation of pores and cracks [27,28].
In this paper, the relationship between the diameter of the bionic pit shape structure and the center distance was summarized by observing the abdomen of multiple dung beetles. Then, a bionic pit shape structure model was established. The stress distribution and wear of bionic pitted structure and ordinary structure were simulated and compared using ANSYS, which is rarely studied in the existing literature. Subsequently, laser cladding was used to add bionic and normal structural cladding layers to the surface of the drill pipe, and wear tests were conducted using granite. Wear tests were conducted to analyze the wear and the surface damage behavior of the cladding layer. The microstructure, composition, and microhardness of the cladding layer were measured and observed, respectively, by SEM, XRD, and microhardness tester. The feasibility of the simulation results was verified, and a good foundation for subsequent studies was laid.

2. Measurement of Biological Surface Structure and Finite Element Analysis

2.1. Measurement of Biological Surface Structure

Dung beetles, as soil-dwelling animals, dig a storage chamber in the soil and push food to hide in it. The amount of earth to be moved to excavate a storage chamber is equivalent to 400 times the weight of the dung beetle itself [29]. In order to reduce the damage caused by soil, dung beetles evolved their pit shape structure on their abdomen over the years.
So as to investigate the features of the pit shape structures and furnish a basis for model establishment and test specimen preparation, three dung beetles were observed under a microscope. The aim was to determine the relationship between the diameter of the pit shape structure and the distance from the center of the circle.
The dung beetles used for observation were exclusively male and collected from the Yitong River area in Jilin Province, as depicted in Figure 1. After being thoroughly washed and disinfected with water and alcohol, they were made into samples and fixed onto a platform using playdough. The abdomen of the dung beetles was observed using a digital microscope. Figure 2 shows the abdomen of a dung beetle magnified 20 times under a microscope. It can be seen that the abdomen of the dung beetle has an obvious pit shape structure, and the pit units are circular and approximately distributed in a straight line, as shown in Figure 2a. In addition, the pit units have a local five-dot arrangement, as shown in Figure 2b. This structure can effectively reduce wear and greatly improve the wear resistance of the dung beetle’s body surface.
During the observation, two circular areas were marked on the abdomen of each dung beetle. The diameter of the pits within each area and the distance between the centers of two adjacent pits were measured. This process resulted in six groups of data for pit diameter and center distance. After calculating the average diameter and center distance for each group, Table 1 was obtained.
In the table, S is the distance between the centers of two pits (mm); D is the pit diameter (mm); S ¯ is the average center distance of pits (mm); D ¯ is the average diameter of pits (mm).
S = S 1 + S 2 + S n n
D = D 1 + D 2 + D n n
It can be seen that the center distance of dung beetle abdominal pits ranges from 0.2 to 0.32 mm and the diameter from 0.1 to 0.16. The ratio between the average center distance and the average diameter in Table 1 is shown in Figure 3.
It can be seen that the ratio of center distance to diameter is extremely close for different dung beetle abdominal pits despite their differences in size. The ratio of the average center distance to the average diameter of the six groups was averaged, and the result was 1.98.

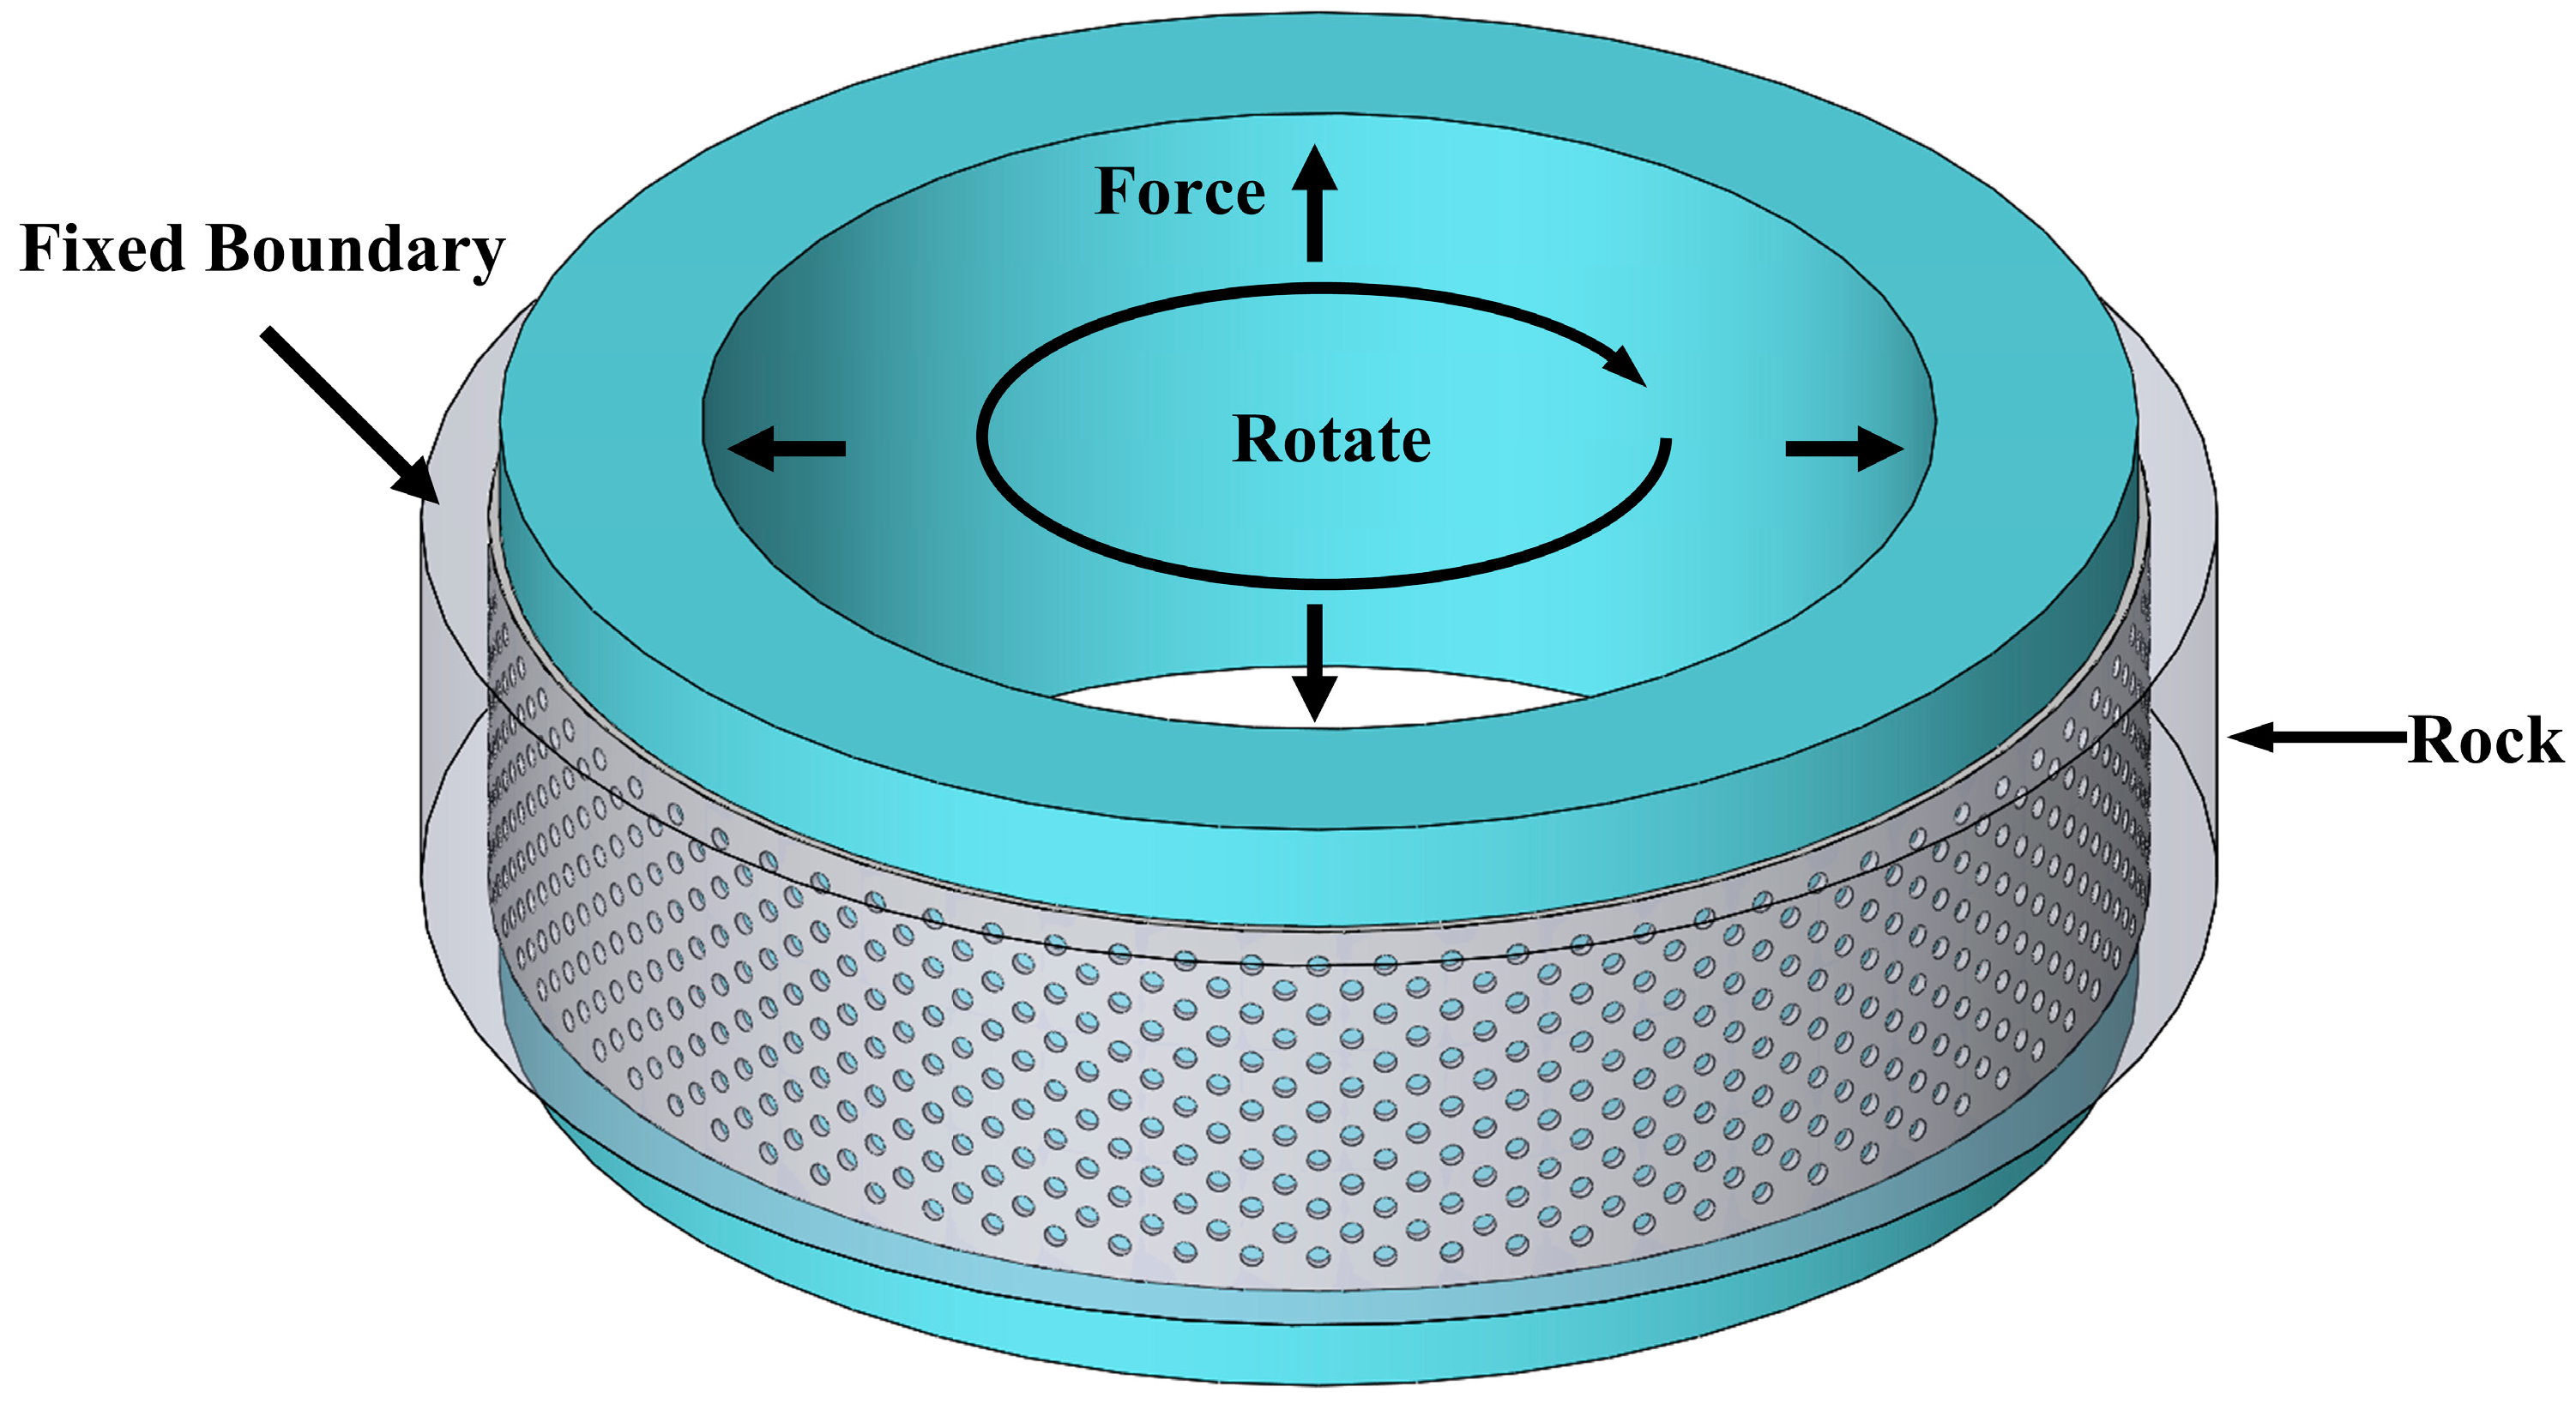
2.2. Finite Element Analysis

2.2.1. Geometric Model and Material Properties

Taking 7075 aluminum drill pipe for drilling as the research object, the three-dimensional geometric model of the drill pipe was established. The model was coated with Ni on the exterior, with two different structures: pit shape and normal. These structures are depicted in Figure 4a. The pit shape structure was inspired by the abdominal structure of dung beetles, as shown in Figure 4b. The center distance between adjacent pits was 3.96 mm and the diameter of the pits was 2 mm. The ratio between them was 1.98, which is consistent with the result in Figure 3. The outer diameter of the model is 147 mm, with 2 mm of the cladding layer. At the same time, annular cross-grinding rock samples were established outside the coating, as shown in Figure 5. The material was granite, with a thickness of 6 mm.
The boundary conditions are set in the load module. The motion path of the drill pipe could only rotate around the Y-axis. Pressure was applied on the inner side. For the rock sample, it is necessary to restrict its movement conditions in all directions, so fixed constraints were imposed. The boundary conditions are shown in Figure 5. The simulation was conducted for a duration of 2 s, with a lateral force of 100 N and a rotational speed of 30 rpm. The basic parameters of the materials used are outlined in Table 2 [30].

2.2.2. Wear Simulation

At the continuum mechanics scale, the wear phenomenon can use the phenomenological model to estimate. The model relates various state parameters of the contact surface to the amount of wear [31]. The finite element analysis software ANSYS can approximately calculate the wear caused by the material loss by repositioning the contact node at the contact surface. The Ansys Mechanical platform uses the Archard model to evaluate the wear.
In the field of continuum mechanics, wear can be estimated using a phenomenological model that correlates different state parameters at the interface to material loss [29]. To approximate the material loss caused by wear, the finite element analysis software Ansys repositions the contact nodes on the contact surface. The amount of wear is estimated using the Archard model in the Ansys Mechanical platform.
In 1953, Archard successfully built the Archard model based on Holm’s model. It expresses the relationship between wear rate and contact pressure, material hardness and sliding speed, and its expression is as follows:
d V d t = K P a ν s b σ s n
In the formula,
  • V—wear volume;
  • P—contact load;
  • Vs—slipping speed between the contacting objects;
  • a—contact stress index;
  • b—speed index;
  • n—in-plane normal;
  • K—the wear coefficient;
  • σ s —plastic yield strength of softer materials.
The yield strength is assumed to be equal to the hardness value, and the yield pressure in Equation (3) can be replaced by hardness (H). Then, the Archard wear model expression can be rewritten as follows:
dV dt = K P a v s b H n
H—The Brinell hardness of softer materials; the Brinell hardness of Ni is about 282.
Where P and vs are determined by boundary conditions, whereas k, a, and b need to be input. In this paper, k is 1 × 10⁻⁶ and both a and b are 1.
The workflow of ANSYS for wear simulation is illustrated in Figure 6. It mainly consists of two steps: condition setting and wear simulation cycle. Before starting the simulation, the setup conditions inside the red box need to be defined, including the pressure, velocity, and friction coefficients. Since the purpose of the simulation is to compare the two structures, the coefficient of friction remains the same. In the wear simulation cycle, the contact nodes in each iteration are repositioned, each node along the X, Y, and Z direction of the relative displacement of node pressure and the speed is calculated, and then the material from the coating surface is removed to show wear and tear. The iterative process continues until the stable wear phase is reached. If the stable wear phase is not reached, the cycle proceeds to the next iteration, as shown in the blue box [32].

3. Experiment

3.1. Experimental Material and Laser Cladding Process

The experimental materials for this study consisted of a base material and a cladding material. The base material utilized was a 7075 aluminum alloy drill pipe, with ∅147 mm as outer diameter and 60 mm high. Prior to laser cladding, the oxide layer on the alloy surface was removed using a grinding wheel, followed by cleaning with acetone and coating with a light-absorbing material. The cladding material used was nickel powder, with a purity of 99.9% and a particle size of 50–100 μm (as shown in Figure 7). Prior to conducting the experiments, the powder was dried in a vacuum at 150 °C for 2 h.
Laser cladding was carried out on an aluminum alloy tube using a CO2 multifunctional CNC laser processing equipment. The equipment includes a fiber laser, a cooling system, and a control system. The laser power is 300 W and the speed is 30 mm/min. The laser wavelength is 1064 nm. The principle of laser cladding is illustrated in Figure 8. The surface of the aluminum alloy is heated by a laser-localized heating tube until it melts and by adopting the method of synchronous and rapid spraying of feeding powder in front of the laser beam to precast good Ni powder. When the beam is removed, the material goes through cooling consolidation in the outer layer of the aluminum alloy and forms a metallurgical bonding layer. The laser path to form different shapes of the cladding layer is controlled. The cladding thickness of the two structures is 2 mm, and the cladding is relatively uniform. During the laser cladding process, the flux of CO2 is 15 L/min and the purity is greater than 99.9%.

3.2. Sliding Wear Tests

In order to simulate the actual drilling conditions of aluminum alloy drill pipe in the well and measure the wear resistance of the laser cladding layer, a drill pipe wear test bench was designed and machined (Figure 9a). Its working principle is shown in Figure 9b. The bench is capable of conducting wear tests on normal and biomimetic structures simultaneously. This ensures that the test conditions remain consistent and leads to improved reliability of the results.
In this test, granite was selected as the rock sample, and the rock rotation speed ω was 40 r/min. The circumferential force was 500 N. In order to simulate the actual working environment of the drill pipe in the downhole, the contact part was continuously washed with drilling fluid during the test, and water was selected as the drilling fluid. Each test cycle was 30 min. The wear resistance was assessed by measuring the mass loss before and after the test. To minimize testing errors, the average value was determined based on three measurements conducted for each group.

3.3. Microhardness Testing

After conducting the wear test, the specimen was cut along the surface of the vertical cladding layer. The cut surface underwent a smoothing and polishing process using sandpaper with grit sizes of #600, #1000, #2000, and #5000, respectively. Subsequently, the specimen was subjected to a hardness test using an HV1000 micro-Vickers hardness tester with a 1 kg load and a loading time of 15 s.

3.4. Microstructural Observation and Component Testing

After polishing and cleaning, the specimens were titrated and etched using Keller reagent (1.0 mL HF + 1.5 mL HCl + 2.5 mL HNO3 + 95 mL H2O) for 15 s, followed by washing with anhydrous ethanol. Carl Zeiss-AxioImager A2m optical metallographic microscope (OM), Hitachi S-4800, and Hitachi JSM-IT500A scanning electron microscope (SEM) equipped with energy dispersive spectroscopy (EDS) were used to analyze the organization of the specimen, and Rigaku D/Max 2500C X-ray diffractometer (XRD) was used to analyze the physical phase of the cladding layer, with a scanning range of 20~90°.

4. Results and Discussion

4.1. Analysis of Simulation Results

First, the stress distribution was observed. Since the maximum stress appeared on the applied surface, which was not helpful for this study, the stress nephograms of the contact surface between two models at 2 s were extracted. Because the coating was circular and the two kinds of structures were symmetrical, part of the model was cut to show that the rotation direction was from left to right.
As shown in Figure 10, the surface stress distribution of the two kinds of structures is obviously dissimilar, but both show strong regularity. In the pit shape structure, the stress distribution around each pit unit is similar, with significantly higher stresses on both sides of the rotation direction compared to other areas. This stress concentration phenomenon is caused by the shape variation between the bionic structure and the surrounding coating. Additionally, it leads to a variation in stresses between two adjacent pit units in the circumferential direction, where the stresses initially decrease and then increase. On the other hand, the stress distribution in the horizontal direction of the normal structure is uniform without any concentration phenomenon. Moreover, the axial stress distribution demonstrates a clear decreasing trend from the middle to both sides.
The stress value of every node in region 1 of Figure 10a was extracted. The coordinate origin was set at the center of the circle, with the positive X and Y axes representing the forward and vertical directions, respectively, establishing the coordinate system. We then created a position–stress scatter diagram (Figure 11a) and a three-dimensional diagram (Figure 11b). The stress values of points a–d are presented in Table 3.
As can be seen from Figure 11, the stress is mainly concentrated on both sides of the rotation direction of the pit unit, forming a fan-shaped influence range that is concentrated within 0.5 mm. In contrast, the stress is relatively small in the vertical direction and beyond 0.5 mm. Additionally, the stress peak value is approximately 6–7 times greater than the minimum stress value. This stress concentration phenomenon can cause failure on both sides of the pit unit and then spread to other areas.
Points a and b were located in the middle position, whereas region 1 was situated at the edge. The stresses at points a and b exceeded the maximum stresses in region 1, indicating that the overall stress distribution of the pit shape structure also shows a decreasing trend from the middle to both sides. Moreover, the stress at point d was approximately four times higher than that of point a, suggesting that the peak stress of the normal structure was significantly greater than the peak stress of the pit shape structure, so the damage of the normal structure was greater than that of the crater structure. The macroscopic manifestation had greater wear than the cratered structure. This is because the lateral force applied causes elastic deformation in both Al alloy and Ni. However, the significant difference in elastic modulus between the two materials results in different deformation volumes. The normal structure, due to the continuous coating, causes the stress to be unreleasable and stored within the coating, whereas the bionic structure coating breaks the continuous surface, allowing for the release of stress. In addition, the stress at point d is approximately 1.4 times higher than that at point c, indicating that the normal structure has a more uniform stress distribution, with smaller gaps between the stress peaks and valleys.
After the wear of the coating and rock rotation for 2 s, the wear results of the two kinds of structures were compared in Table 4. Figure 12 depicts the comparison of the wear volume of the two models via a red part. The pit shape structure coating exhibited a reduction of 84.7% in wear volume compared to the normal structure coating, ignoring the change in the surface area caused by the variation in coating thickness. The wear depth of the two types of structures is depicted in the blue part in Figure 12. The results indicate that the lifespan of the pit shape coating increased by 81.3% compared to the normal coating, demonstrating a significant improvement effect.

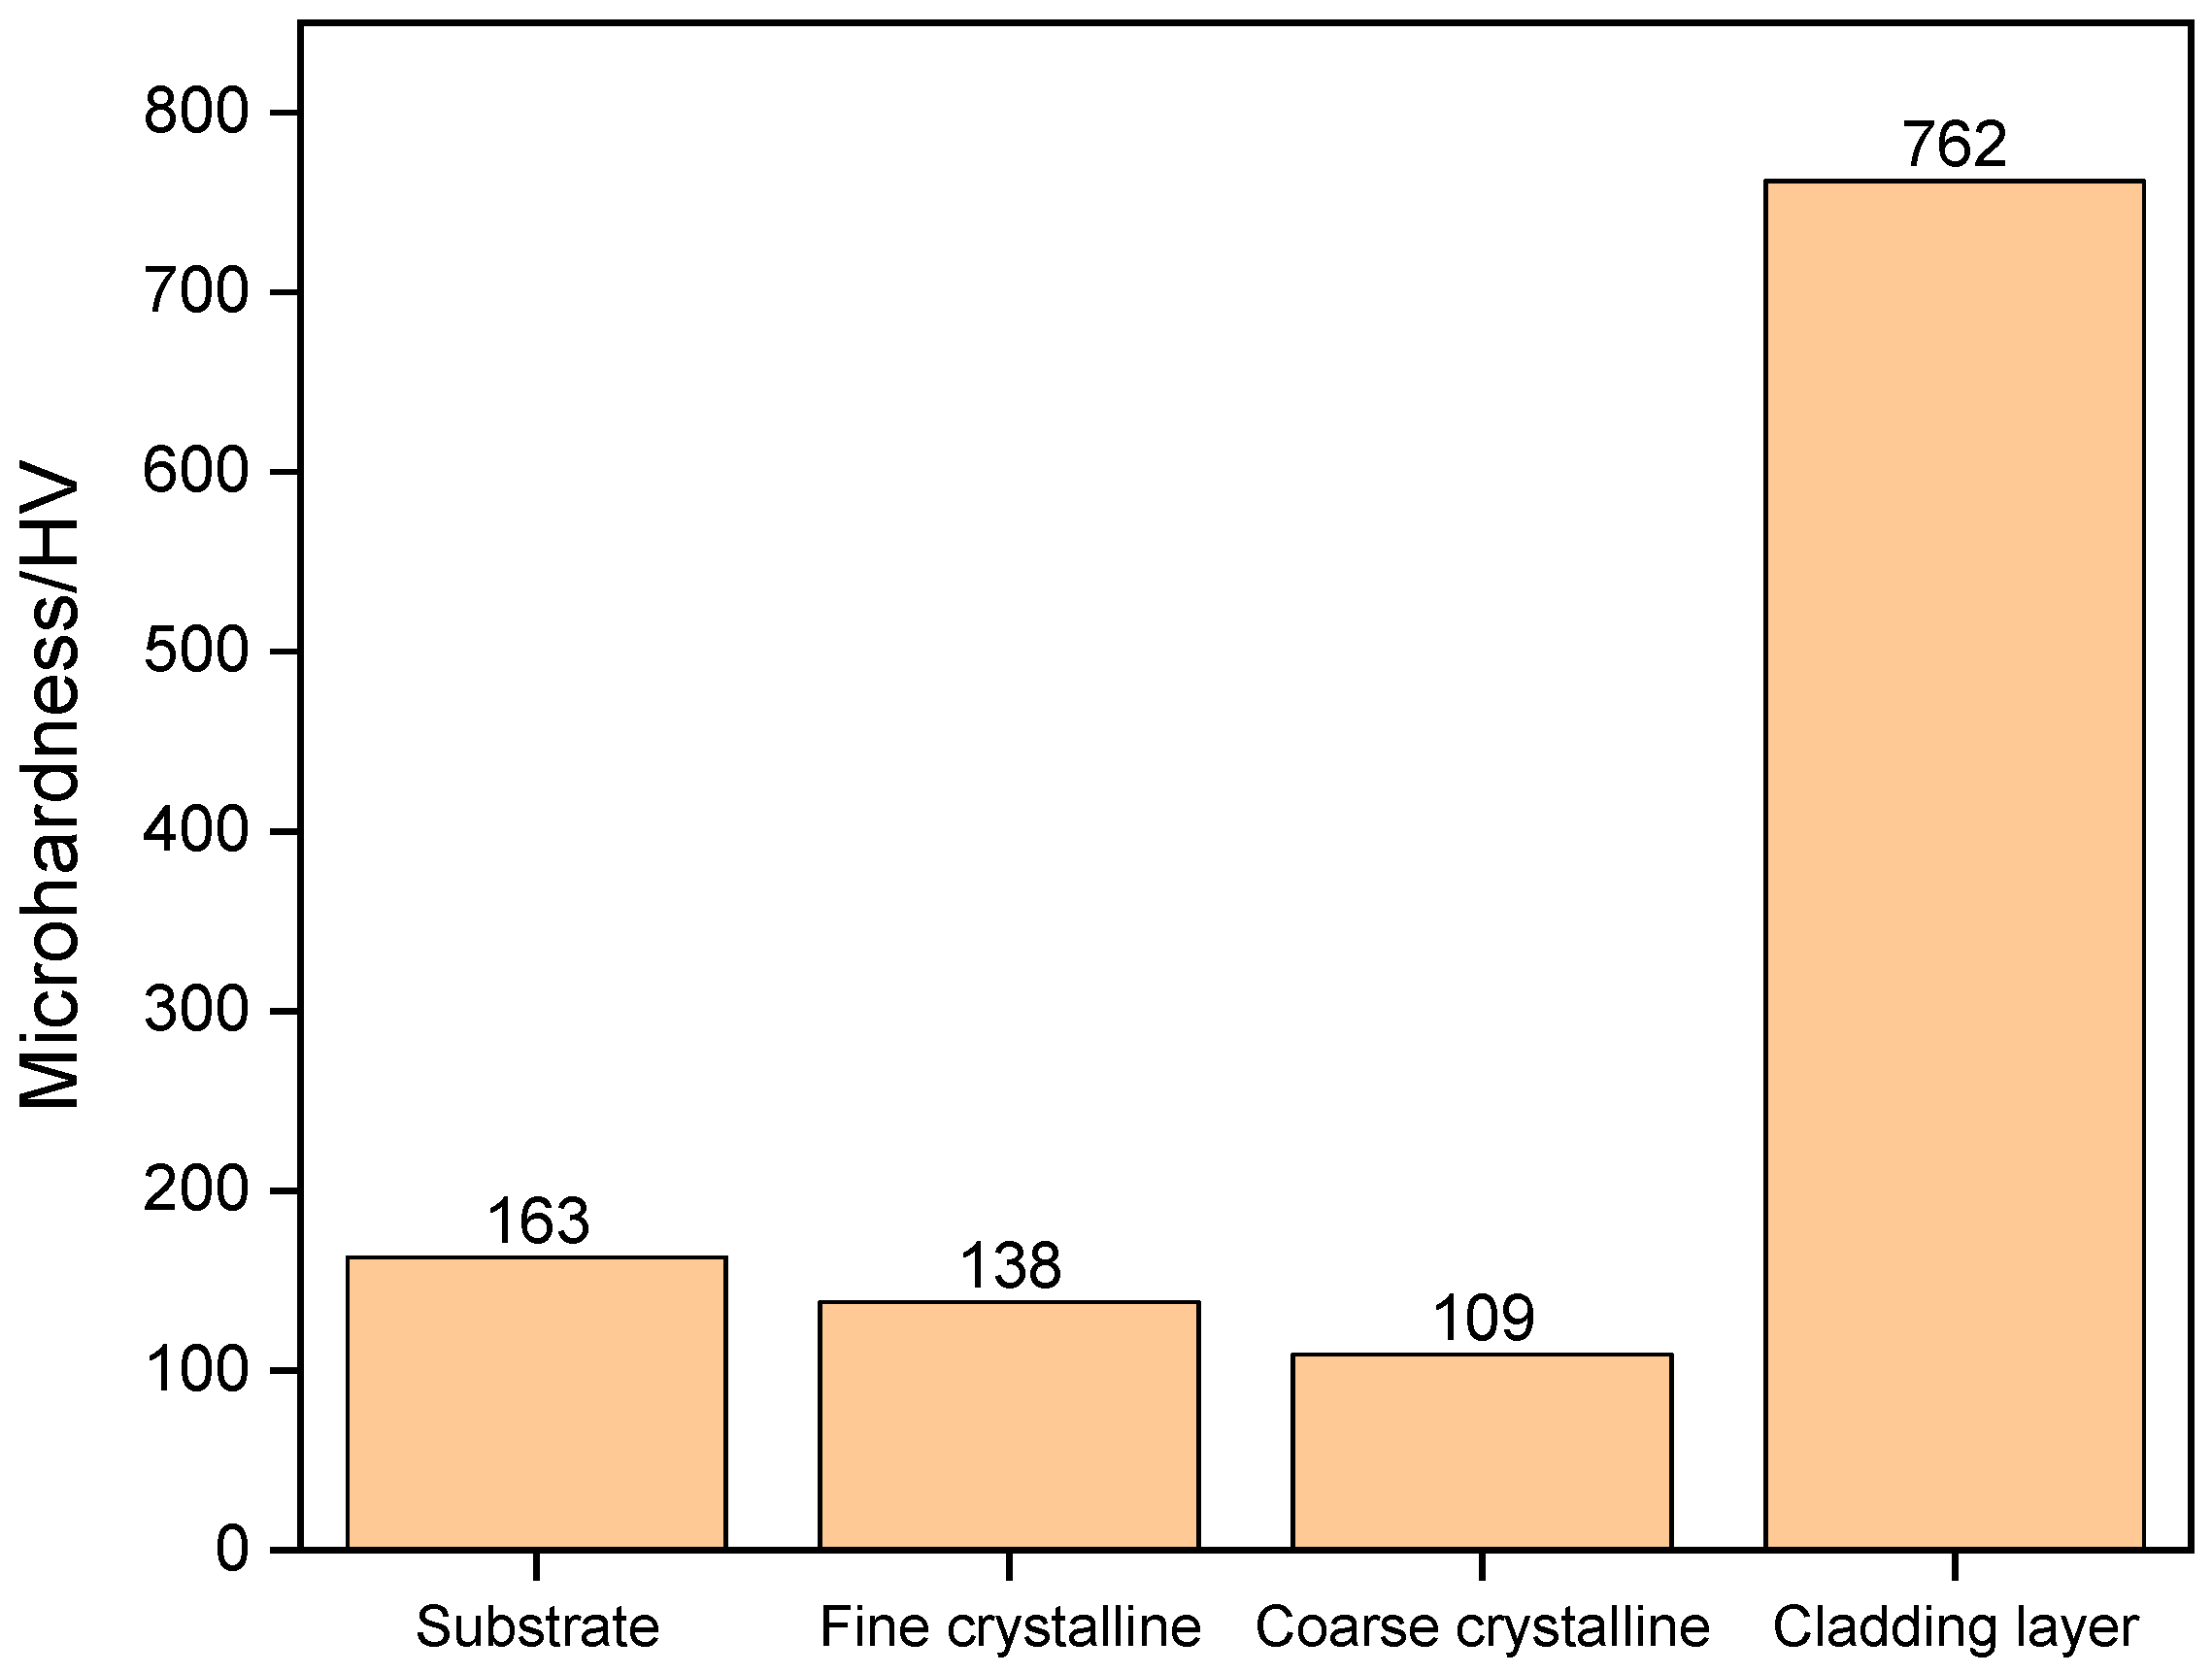
4.2. Analysis of Cladding Layer

Figure 13 presents the scanning electron microscope images taken before corrosion with the Keller reagent. The image clearly displays a distinct demarcation line between the molten cladding layer and the substrate, both before and after polishing. This demarcation line is indicated by the red arrows in Figure 13a,b. A good metallurgical bonding state exists between the cladding layer and the substrate, and no obvious cracks are observed at the interface bonding before and after polishing. In addition, a small number of pores is found at the bottom of the coating, but overall, the performance of the coating is not affected.
The specimen was then etched using the Keller reagent. The morphology of the cladding layer and the substrate after corrosion under an optical metallographic microscope are shown in Figure 14. It is evident that a transition region, approximately 140 µm in thickness, exists between the cladding layer and the substrate. Within this region, the coarse crystal region has a thickness of about 100 µm, whereas the fine crystal region has a thickness of about 40 µm. Due to the limited magnification of the metallographic microscope, a scanning electron microscope was used to further analyze the microstructure and products between the cladding layer and the substrate.
Figure 15 shows the SEM micrographs between the substrate and the cladding layer. It shows that the grain size and morphology in the fine crystal zone are significantly different from those in the coarse crystal zone. The grain morphology in the fine crystal zone has an equiaxed crystal distribution with a grain size length from 5 to 10 µm, and the coarse crystal zone exhibits a columnar morphology with grain sizes between 10 and 20 µm. The EDS spectra of point A and point B illustrated in Figure 16 indicate that the composition of both points is primarily Al with some impurities. This suggests that the coarse and fine crystal regions are a result of recrystallization and grain growth during the process of melting and condensation of Al.
Figure 17a displays the SEM morphology of the cladding layer. It shows a uniformly distributed cast-equiaxed crystal organization without Ni powder particles in the cladding layer. At the same time, there are tiny gaps in the cladding layer. In Figure 17b, the EDS spectra of point C are shown. The primary composition of the clad layer is the Al-Ni phase, with minor amounts of other elements including C, O, Si, and Cr. This can be attributed to the laser cladding process being conducted in a CO2 environment and the presence of impurities in the Ni powder.
In order to further determine the molten layer products, the cladding layer was analyzed using XRD. The results are shown in Figure 18. Figure 18 indicates that the cladding layer is mainly composed of Al3Ni2 and Al phase. It is worth noting that Ni only has a peak at 45 degrees that overlaps with the identified intermetallic phase, whereas the other angles do not show consistency. Secondly, both Al and Al3Ni2 also overlap with the identified intermetallic phase at the 45 degree peak, and the other angles show a high level of consistency. Lastly, there is no ferromagnetism on the surface of the cladding layer. Based on these observations, it can be concluded that the Ni powder completely reacted with Al to form Al3Ni2.
It is crucial to comprehend the thermodynamic analysis of the chemical reactions occurring within the clad layer to regulate its microstructure and properties [33]. In the laser cladding process, both the aluminum alloy substrate and Ni powder dissolve, and the chemical reactions that take place during the solidification of the melt pool are demonstrated below:
3Al + 2NiAl3Ni2
Al3Ni2 has high hardness and wear resistance. Figure 19 shows the microhardness data of each typical area from the surface of the cladding layer toward the substrate. As can be seen, the surface hardness of the cladding layer is 762 HV, which is 4.7 times the surface of the 7075 aluminum alloy substrate. The hardness of the coarse and fine crystal region is reduced to a certain extent compared to the 7075 aluminum alloy substrate. The hardness of the fine grain zone is 138 HV, which is 15.3% lower than that of the matrix, whereas the hardness of the coarse grain zone is 109 HV, which is 33.1% lower than that of the matrix. In reference [34], Ni was also used as the cladding layer material, and Al-Si alloy was used as the matrix material. The microhardness test results are similar to those in this paper [34]. The high hardness of Al3Ni2, acting as the hard phase, exhibits excellent resistance to deformation. On the other hand, the transition region and the aluminum alloy substrate, acting as the soft phase, can effectively absorb the shear stress generated during the test.

4.3. Data and Status of Wear Tests

Wear test results are presented in Table 5. The orange part in Figure 20 shows the comparison of the mass loss of the two structures. The comparison shows that the mass loss of the pit shape structured cladding layer is 75.4% lower compared to the normal structured cladding layer.Ignoring the surface area changes caused by cladding thickness, the green part in Figure 20 shows the comparison of the wear per area of the two structures. The result shows that the lifespan of the pit shape structure cladding layer improved by 70.0%, which is similar to the simulation results.
The surface of the two specimens after the wear test is shown in Figure 21. It shows that the area in the middle of the normal structure exhibits significant wear and noticeable shedding, whereas the edge area is relatively complete and has no obvious shedding phenomenon. The pit shape structure is severely worn around the pit unit, and the middle area is also more worn than the edge area. Two kinds of structure surface morphology after the wear test are consistent with the stress distribution in Figure 10, which verifies the accuracy of the finite element model simulation analysis.
The shedding area of the cladding layer in the normal structure exhibits obvious annular grooves, and no similar phenomenon is observed on the pit shape structure. This difference is attributed to the presence of particles that have not been washed off, which become trapped between the cladding layer and the rock. As a result, these particles undergo abrasive wear as they are cut by the rotating cladding layer. However, due to the existence of pit units, the pit shape structure can store the particles in it, effectively reducing abrasive wear, as shown in Figure 22.
By combining wear and surface morphology, the bionic structure plays an important role in improving the stress distribution and extending the cladding life.

5. Conclusions

In this paper, the relationship between pit diameter and center distance was obtained by observing and measuring the pit shape structure on the abdomen of dung beetles. Subsequently, the stress distribution and wear conditions of the bionic structure and normal structure model during rock grinding were simulated and analyzed, and the friction and wear experiments were carried out. The microstructure, composition, and hardness behavior of the specimen were characterized using a scanning electron microscope, X-ray diffractometer, and microhardness tester. Based on the above research, the following conclusions are drawn:
(1)
By studying and comparing the abdominal pit shape structure of dung beetles and measuring two kinds of parameters, pit diameter and center distance, the obtained ratio of them was around 1.98.
(2)
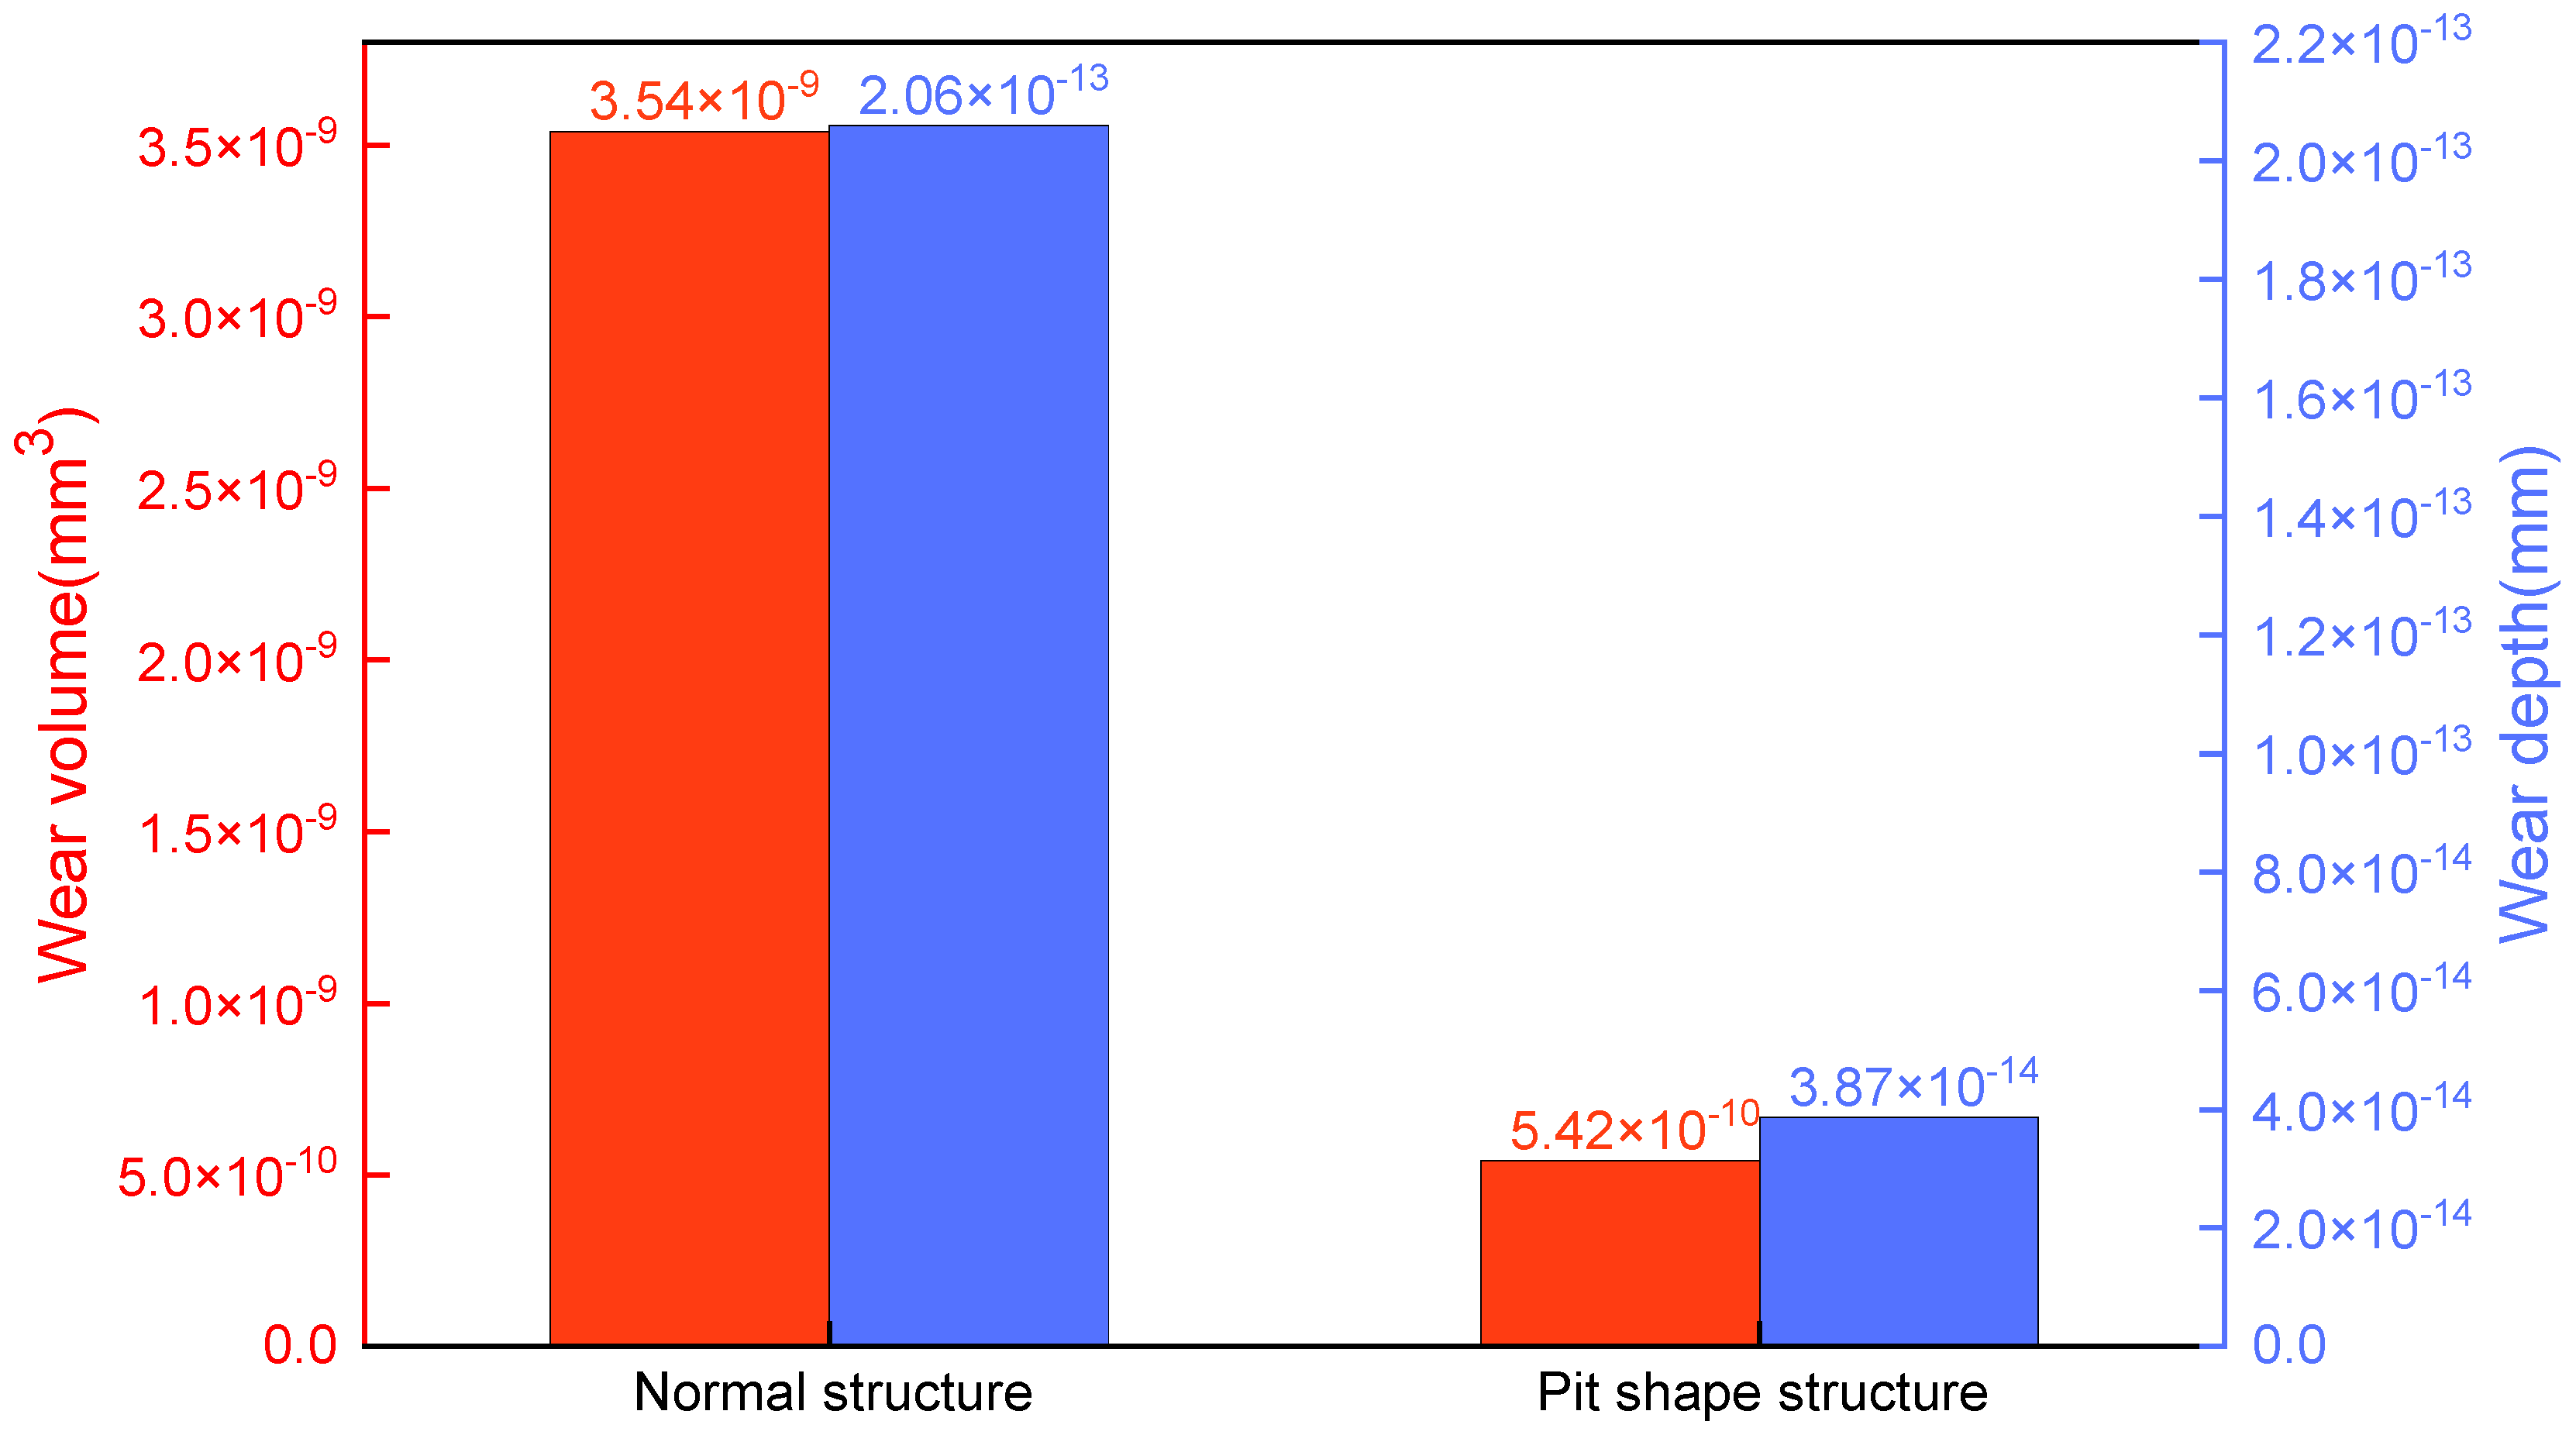
The bionic pit shape structure model was established. Compared to the general structure, the results of finite element simulation showed that the bionic structure can significantly improve stress distribution, and the peak stress of the bionic structure was significantly reduced. A significant stress concentration phenomenon occurred near the pit unit, and the life span improved by 81.3%.
(3)
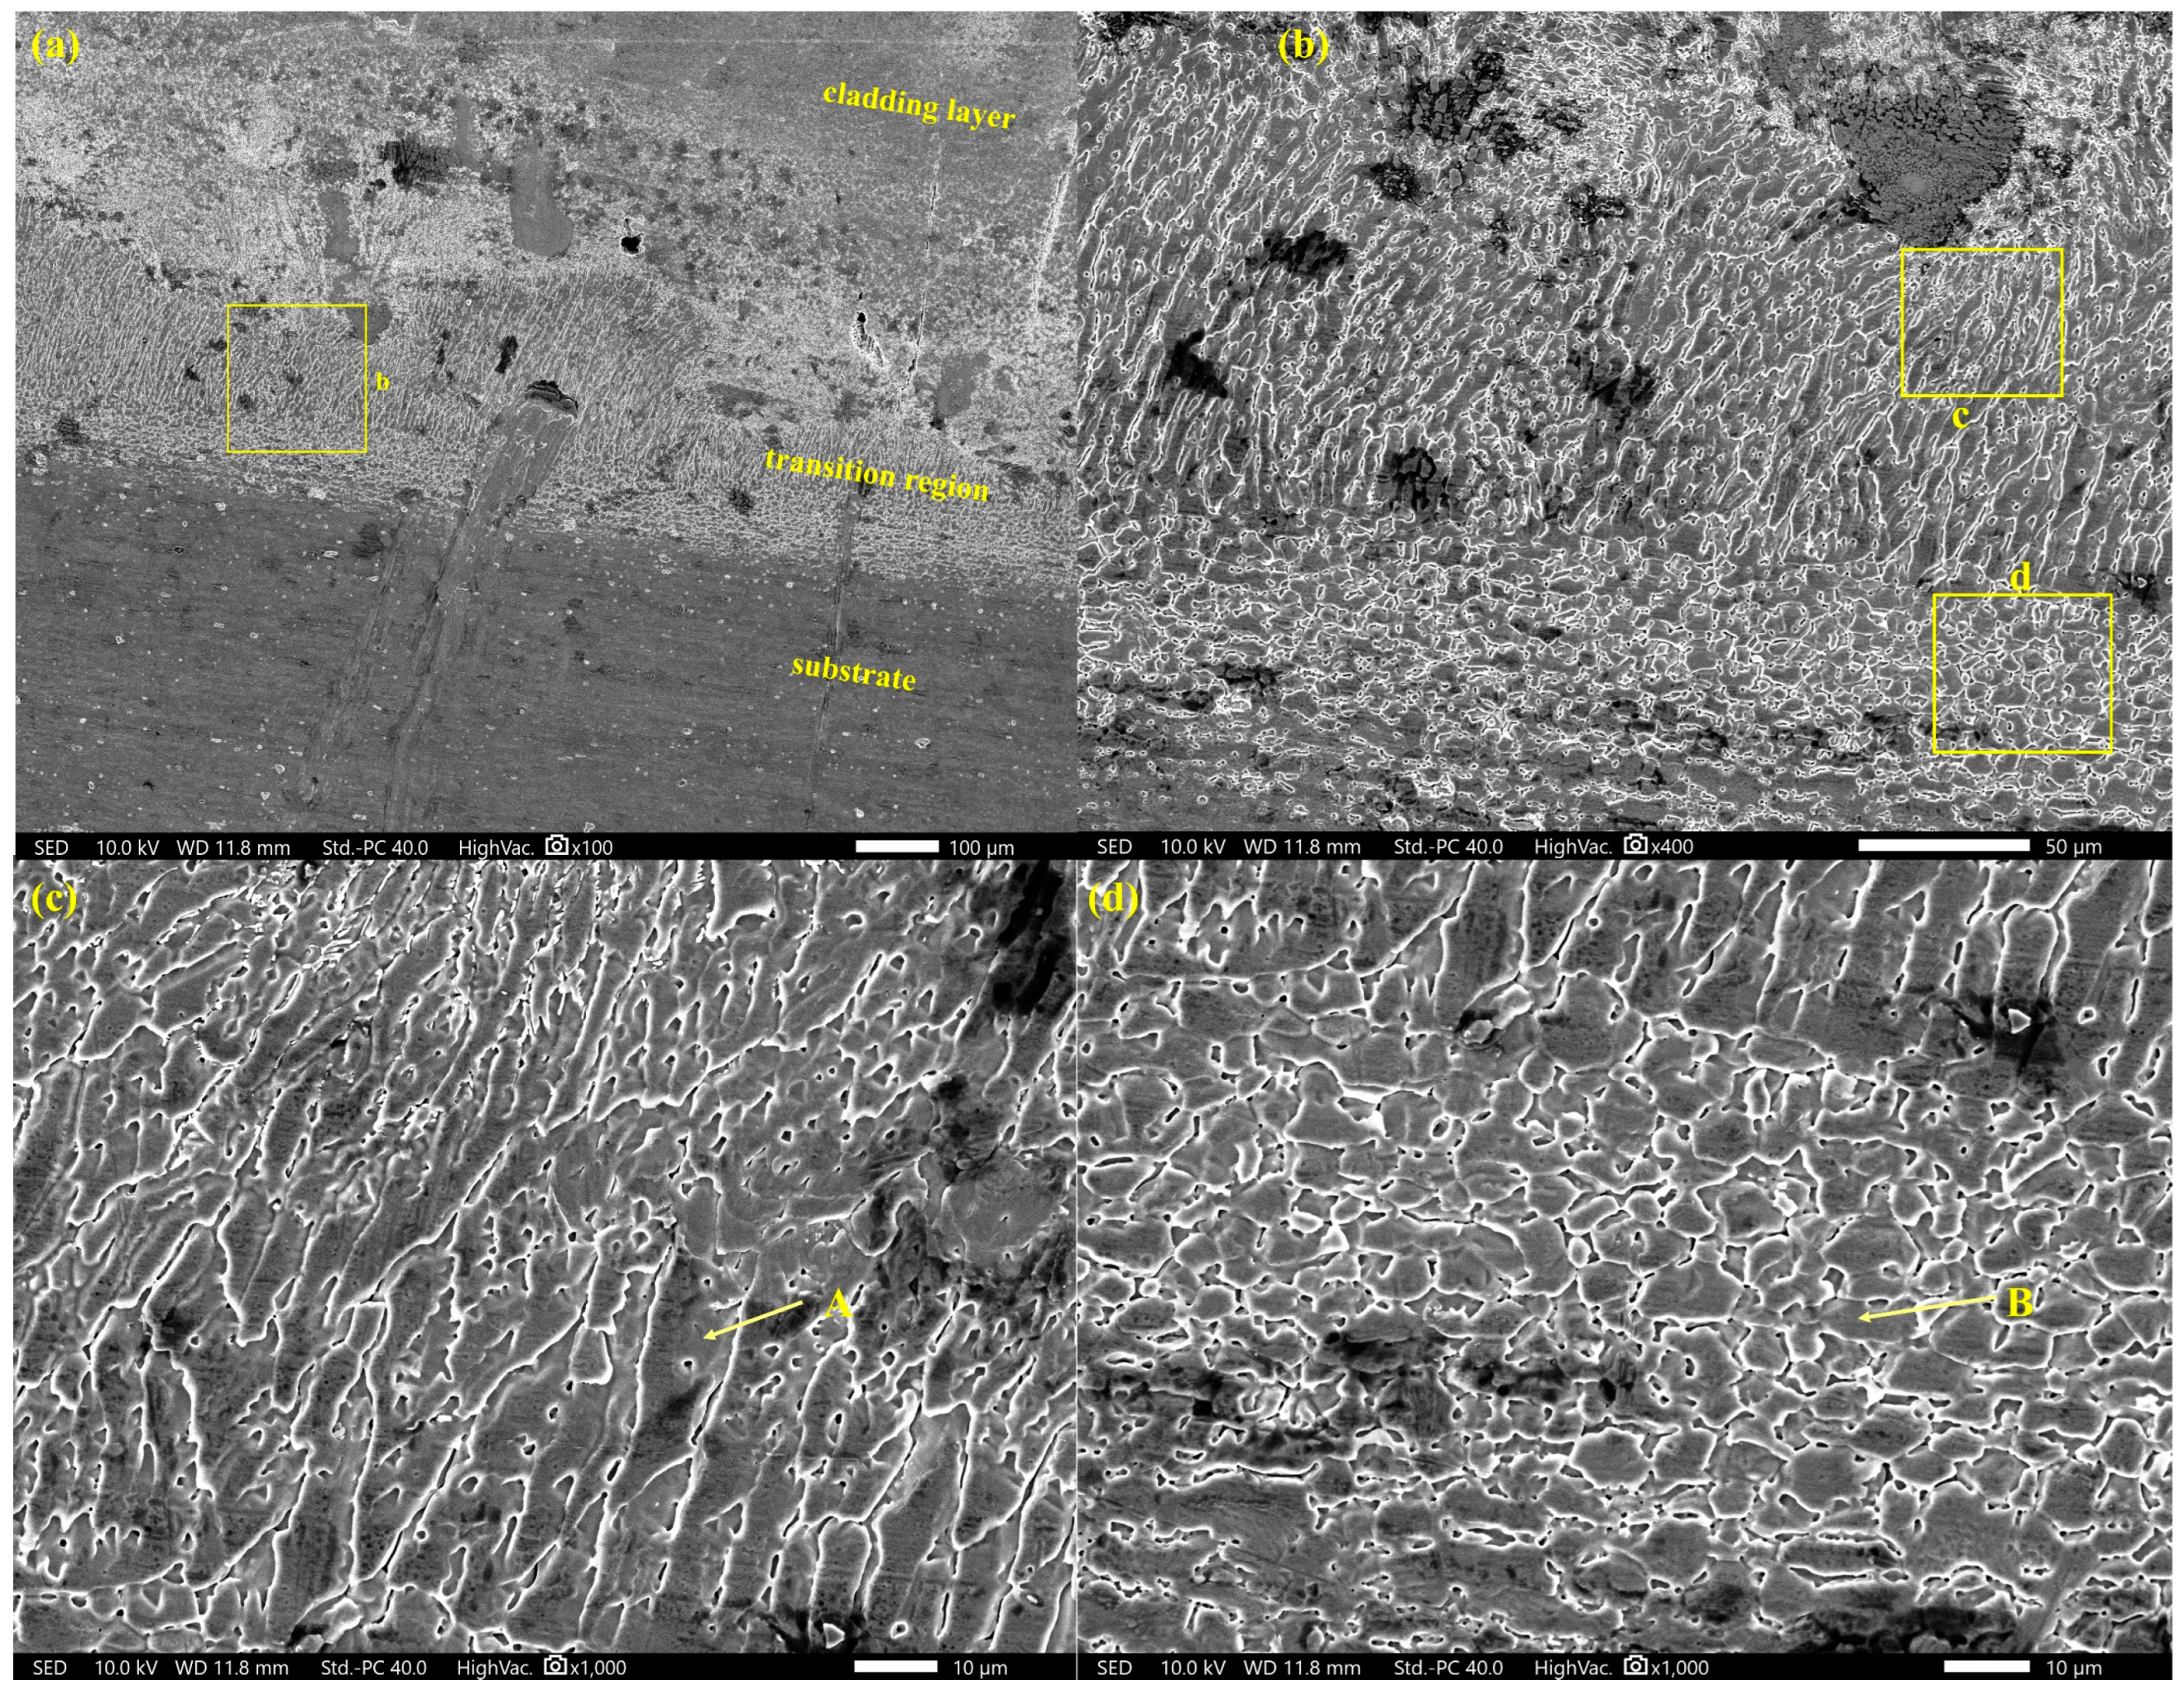
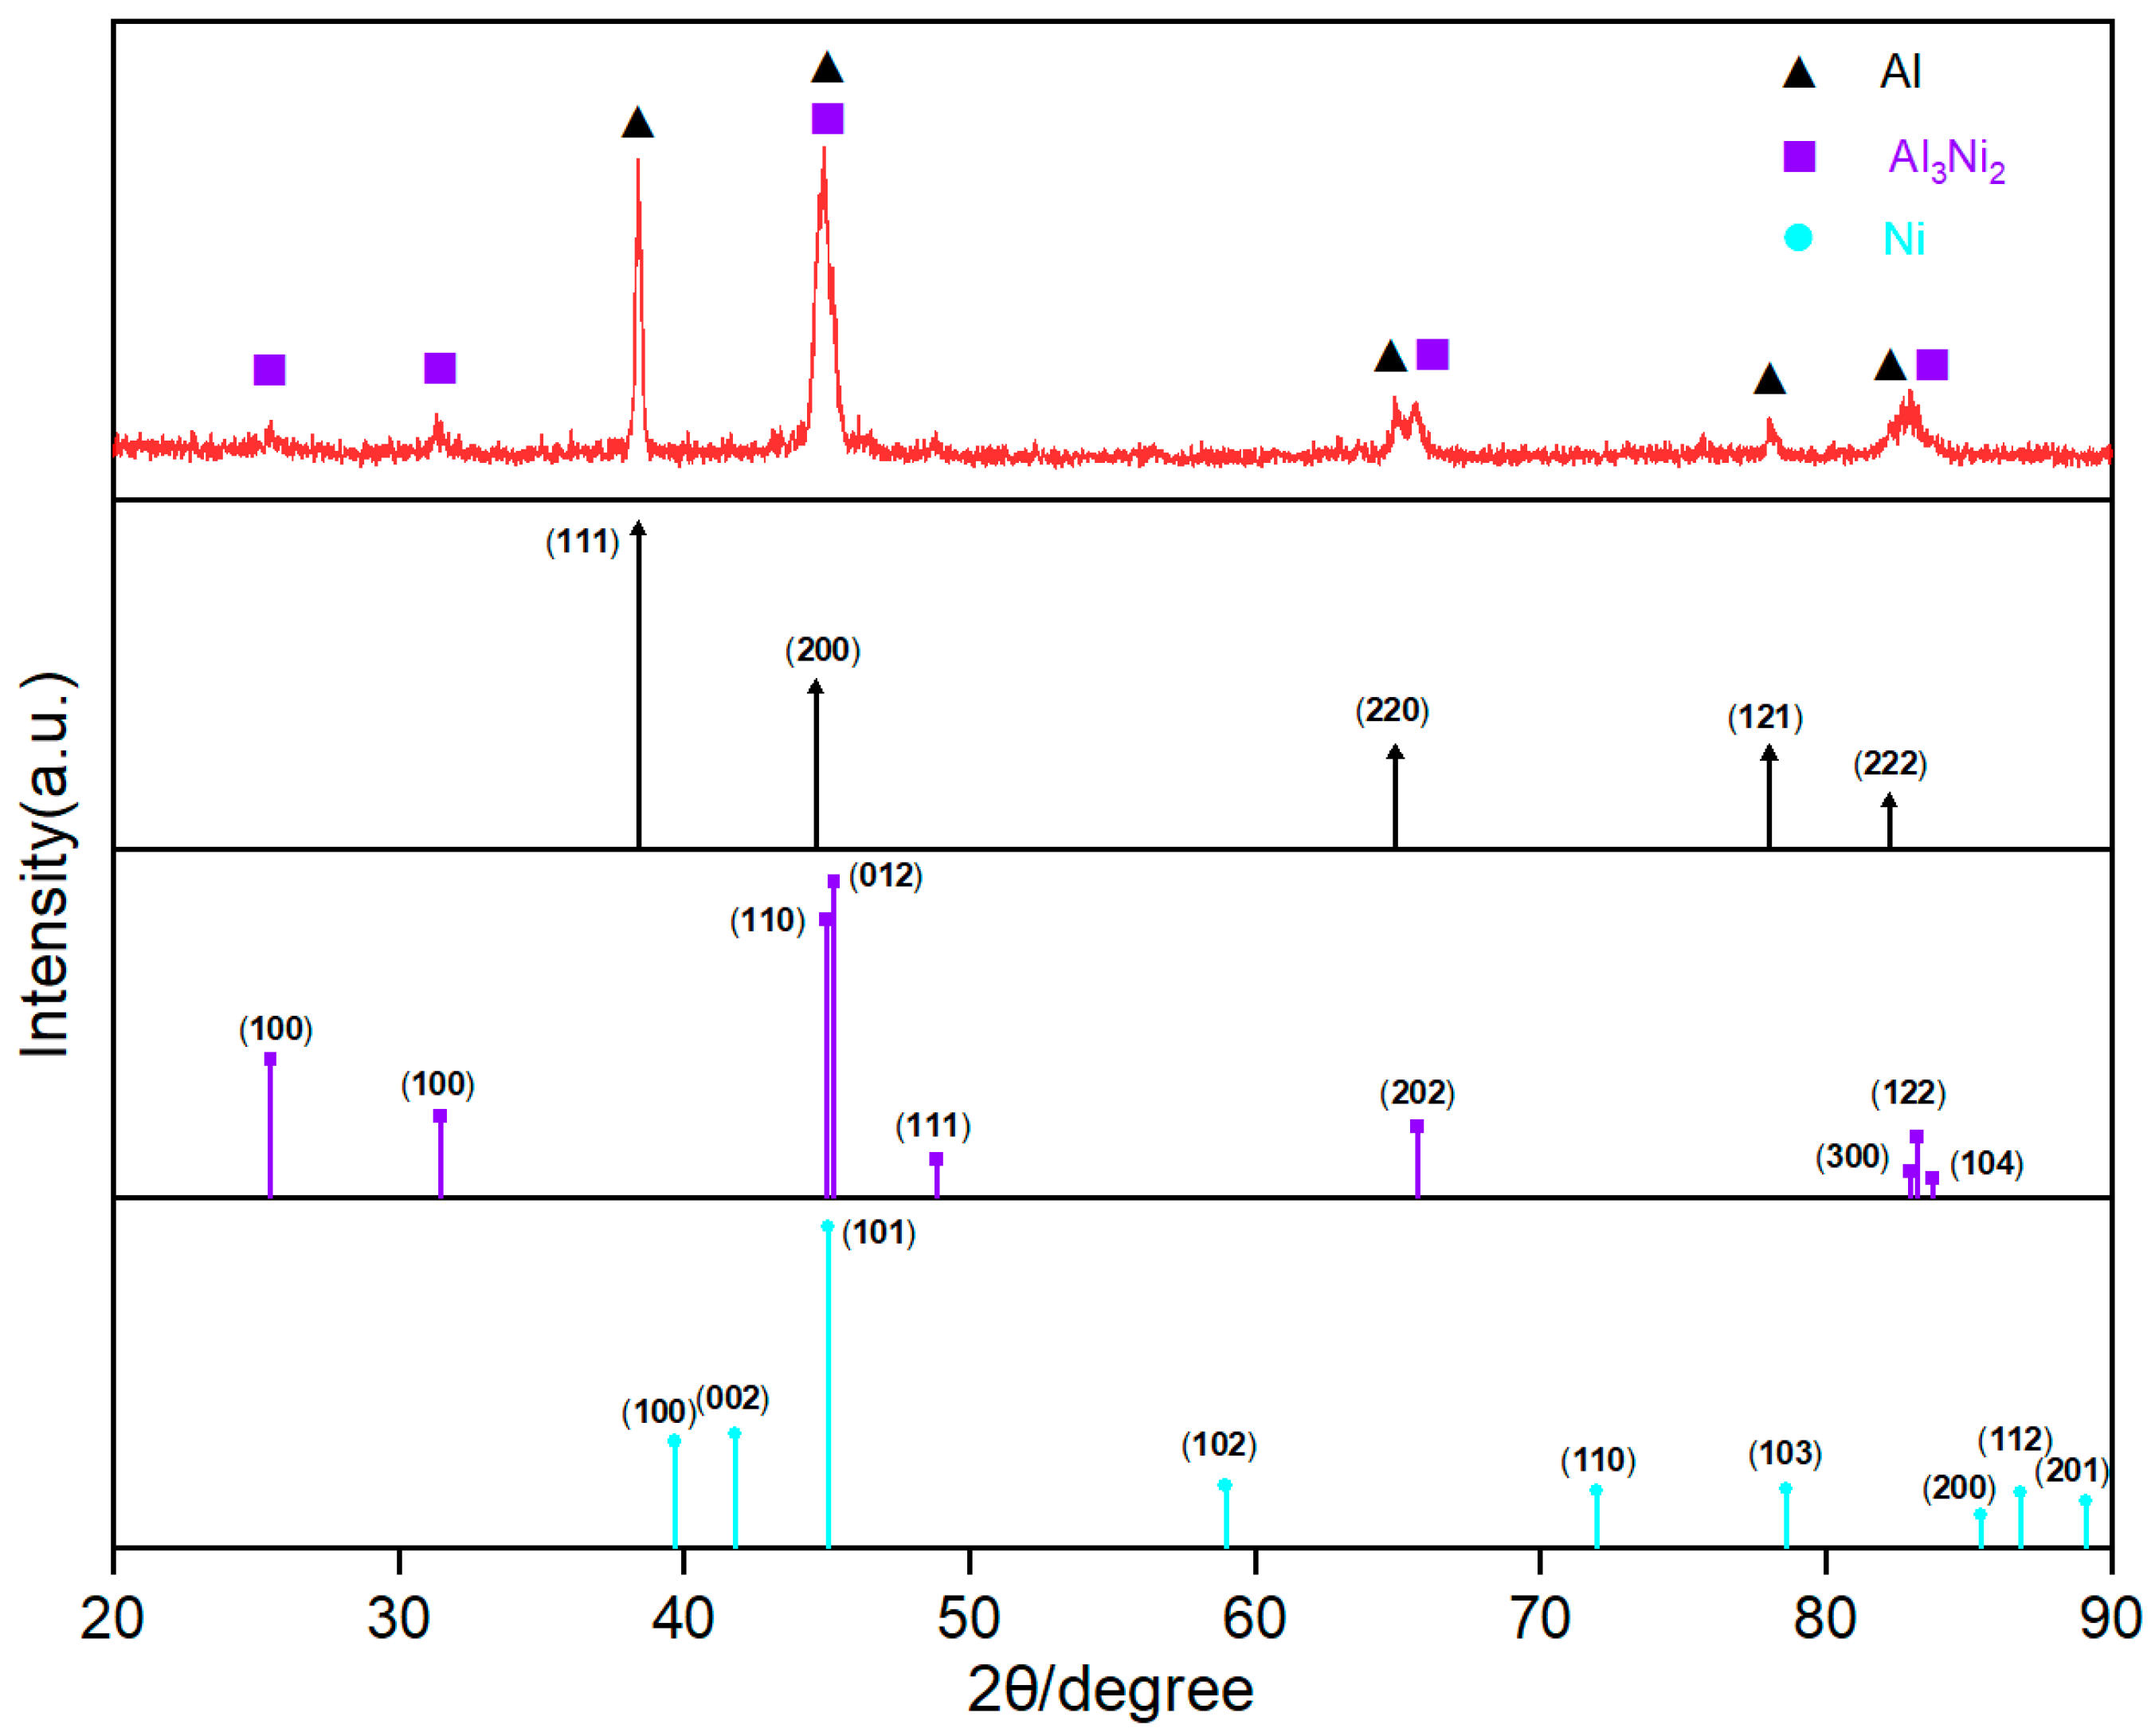
The coating after laser cladding is predominantly composed of Al3Ni2, which exhibits high hardness. Furthermore, a transition region exists between the cladding layer and the substrate, with the composition being aluminum, which has relatively low hardness. This combination improves the ability of the drill pipe to withstand alternating loads.
(4)
The surface appearance of two specimens after the wear test aligns with the stress distribution gained from ANSYS. Additionally, the lifespan of the pit shape structure increased by 70.0%. This increase closely matches the simulation results and validates the accuracy of the ANSYS analysis findings.
(5)
Pit shape structure plays a crucial role in altering the stress distribution, as it effectively stores the abrasive particles and reduces the occurrence of abrasive wear. This, in turn, enhances the lifespan of the cladding layer.

Author Contributions

Data curation, C.Z.; Formal analysis, X.L. (Xiaoshu Lü); Methodology, Y.Z.; Project administration, K.G.; Software, X.X.; Visualization, H.A.; Writing, original draft, X.L. (Xu Li). All authors have read and agreed to the published version of the manuscript.

Funding

This research has been funded by the National Key R & D Program of China (Grant No. 2022YFC3005903-2), the Engineering Research Center of Geothermal Resources Development Technology and Equipment (Grant Nos. 23021 and 23022), the Graduate Innovation Fund of Jilin University (Grant No. 2023CX106), and the Ministry of Education, Jilin University, National Natural Science Foundation of China (Grant No. 41972324 and No. 42172345).

Institutional Review Board Statement

Not applicable.

Informed Consent Statement

Not applicable.

Data Availability Statement

The datasets used and/or analyzed during the current study are available from the corresponding author upon reasonable request.

Conflicts of Interest

The authors declare no conflict of interest.

References

  1. Liang, J.; Yue, W.; Gu, Y.; Liu, J.; Wang, C.; Ma, H. Improving Corrosion Resistance and Corrosive Wear Resistance of Aluminum Alloy Drill Pipe by Surface Nanocrystallization and Micro-arc Oxidation. J. Mater. Eng. Perform. 2018, 27, 4462–4472. [Google Scholar] [CrossRef]
  2. Kondrat’ev, S.Y.; Shvetsov, O.V. Technological and Operational Features of Drill Pipes from Aluminum Alloys 2024 and 1953. Met. Sci. Heat. Treat. 2018, 60, 32–38. [Google Scholar] [CrossRef]
  3. Kondrat’ev, S.Y.; Shvetsov, O.V. Effect of High-Temperature Heating on the Structure and Properties of Aluminum Alloys in the Production of Drill Pipes. Met. Sci. Heat. Treat. 2013, 55, 191–196. [Google Scholar] [CrossRef]
  4. Sun, Y.; Wang, X.; Liu, B.; Ding, D.; Meng, Q. Inverse solution to heat transfer coefficient during heat assembly of aluminum alloy drill pipes. Adv. Mech. Eng. 2017, 9, 265–276. [Google Scholar] [CrossRef]
  5. Zhao, X.; Chen, X.; Wang, X. Effect of aging processes on corrosion behavior and stress corrosion sensitivity of pre-stretched 7075 aluminum alloy. Mater. Corros. 2018, 69, 850–857. [Google Scholar] [CrossRef]
  6. Lourenço, M.I.; Netto, T.A.; Silva, N.d.S.d.; Ribeiro Plácido, J.C. Multiaxial Fatigue of Aluminum Drill Pipes—Experiments and Numerical Analyses. J. Offshore Mech. Arct. Eng. 2022, 144, 011802. [Google Scholar] [CrossRef]
  7. Lee, I.S.; Hsu, C.J.; Chen, C.F.; Ho, N.J.; Kao, P.W. Particle-reinforced aluminum matrix composites produced from powder mixtures via friction stir processing. Compos. Sci. Technol. 2011, 71, 693–698. [Google Scholar] [CrossRef]
  8. Tjong, S.C. Recent progress in the development and properties of novel metal matrix nanocomposites reinforced with carbon nanotubes and graphene nanosheets. Mater. Sci. Eng. R Rep. 2013, 74, 281–350. [Google Scholar] [CrossRef]
  9. Algahtani, A.; Mahmoud, E.; Khan, S.; Tirth, V. Experimental Studies on Corrosion Behavior of Ceramic Surface Coating using Different Deposition Techniques on 6082-T6 Aluminum Alloy. Processes 2018, 6, 240. [Google Scholar] [CrossRef]
  10. Chi, Y.; Gu, G.; Yu, H.; Chen, C. Laser surface alloying on aluminum and its alloys: A review. Opt. Lasers Eng. 2018, 100, 23–37. [Google Scholar] [CrossRef]
  11. Wang, C.; Bai, S.; Xiong, Y. Recent advances in surface and interface engineering for electrocatalysis. Chin. J. Catal. 2015, 36, 1476–1493. [Google Scholar] [CrossRef]
  12. Zhang, P.; Liu, X.; Yan, H. Phase composition, microstructure evolution and wear behavior of Ni-Mn-Si coatings on copper by laser cladding. Surf. Coat. Technol. 2017, 332, 504–510. [Google Scholar] [CrossRef]
  13. Lu, X.; Liu, X.; Yu, P.; Qiao, S.; Zhai, Y.; Wang, M.; Chen, Y.; Xu, D. Synthesis and characterization of Ni60-hBN high temperature self-lubricating anti-wear composite coatings on Ti6Al4V alloy by laser cladding. Opt. Laser Technol. 2016, 78, 87–94. [Google Scholar] [CrossRef]
  14. Sun, G.; Zhang, Y.; Liu, C.; Luo, K.; Tao, X.; Li, P. Microstructure and wear resistance enhancement of cast steel rolls by laser surface alloying NiCr–Cr3C2. Mater. Des. 2010, 31, 2737–2744. [Google Scholar] [CrossRef]
  15. Wang, G.; Zhang, J.; Shu, R.; Yang, S. High temperature wear resistance and thermal fatigue behavior of Stellite-6/WC coatings produced by laser cladding with Co-coated WC powder. Int. J. Refract. Met. Hard Mater. 2019, 81, 63–70. [Google Scholar] [CrossRef]
  16. Paul, C.; Sellamuthu, R. Effect of nickel content on hardness and wear behaviour of surface modified functionally graded Cu-Sn bronze alloy. Int. J. Mater. Eng. Innov. 2016, 7, 43–55. [Google Scholar] [CrossRef]
  17. Xie, S.; Li, R.; Yuan, T.; Chen, C.; Zhou, K.; Song, B.; Shi, Y. Laser cladding assisted by friction stir processing for preparation of deformed crack-free Ni-Cr-Fe coating with nanostructure. Opt. Laser Technol. 2018, 99, 374–381. [Google Scholar] [CrossRef]
  18. Weng, Z.; Wang, A.; Wu, X.; Wang, Y.; Yang, Z. Wear resistance of diode laser-clad Ni/WC composite coatings at different temperatures. Surf. Coat. Technol. 2016, 304, 283–292. [Google Scholar] [CrossRef]
  19. Pang, Z.; Zhou, H.; Xie, G.; Cong, D.; Meng, C.; Ren, L. Effect of bionic coupling units’ forms on wear resistance of gray cast iron under dry linear reciprocating sliding condition. Opt. Laser Technol. 2015, 70, 89–93. [Google Scholar] [CrossRef]
  20. Jiang, H.; Liu, Y.; Zhang, Y.; Liu, Y.; Fu, X.; Han, D.; Song, Y.; Ren, L.; Sun, H. Reed Leaf-Inspired Graphene Films with Anisotropic Superhydrophobicity. ACS Appl. Mater. Interfaces 2018, 10, 18416–18425. [Google Scholar] [CrossRef]
  21. Arjangpay, A.; Darvizeh, A.; Tooski, M.Y. Effects of Structural Characteristics of a Bionic Dragonfly Wing on Its Low Velocity Impact Resistance. J. Bionic Eng. 2018, 15, 859–871. [Google Scholar] [CrossRef]
  22. Zhang, H.; Liu, S.; Xiao, H.; Zhang, X. Synthesis and Tribological Properties of Bio-Inspired Nacre-Like Composites. Materials 2018, 11, 1563. [Google Scholar] [CrossRef]
  23. Jones, K.; Schmid, S.R. Experimental Investigation of Laser Texturing and its Effect on Friction and Lubrication. Procedia Manuf. 2016, 5, 568–577. [Google Scholar] [CrossRef]
  24. Cho, M. Friction and wear of a hybrid surface texturing of polyphenylene sulfide-filled micropores. Wear 2016, 346–347, 158–167. [Google Scholar] [CrossRef]
  25. Zhang, H.; Zhang, P.; Sui, Q.; Zhao, K.; Zhou, H.; Ren, L. Influence of Multiple Bionic Unit Coupling on Sliding Wear of Laser-Processed Gray Cast Iron. J. Mater. Eng. Perform. 2017, 26, 1614–1625. [Google Scholar] [CrossRef]
  26. Mao, C.; Ma, Y.; Wu, S.; Wei, Y.; Li, J. Wear resistance and wet skid resistance of composite bionic tire tread compounds with pit structure. Mater. Res. Express 2019, 6, 085331. [Google Scholar] [CrossRef]
  27. Wang, Y.; Liu, B.; Guo, Z. Wear resistance of machine tools’ bionic linear rolling guides by laser cladding. Opt. Laser Technol. 2017, 91, 55–62. [Google Scholar] [CrossRef]
  28. Qi, C.; Zhan, X.; Gao, Q.; Liu, L.; Song, Y.; Li, Y. The influence of the pre-placed powder layers on the morphology, microscopic characteristics and microhardness of Ti-6Al-4V/WC MMC coatings during laser cladding. Opt. Laser Technol. 2019, 119, 105572. [Google Scholar] [CrossRef]
  29. Cheng, J.; Li, F.; Wang, Y.; Wang, Y.; Liu, X.; Zhang, J.; Wang, Z.; Li, Y.; Wang, H.; Yang, Z.; et al. Dweller and tunneler dung beetles synergistically accelerate decomposition of cattle and horse dung in a semi-arid steppe. Agric. Ecosyst. Environ. 2022, 329, 107873. [Google Scholar] [CrossRef]
  30. Wang, X.; Liu, B.; Gao, K.; Meng, Q.; Sun, Y. Analysis of Thermal Deformation and Influencing Factors in Shrink-Fitting Assembly of Aluminum Alloy Drill Pipe. Adv. Mech. Eng. 2016, 8, 1687814016674099. [Google Scholar] [CrossRef]
  31. Sysaykeo, D.; Linares, J.-M.; Mermoz, E. Wear Behavior of a Bio-inspired Bearing for off-center Loads. J. Bionic Eng. 2020, 17, 1251–1262. [Google Scholar] [CrossRef]
  32. Rezaei, A.; Van Paepegem, W.; De Baets, P.; Ost, W.; Degrieck, J. Adaptive finite element simulation of wear evolution in radial sliding bearings. Wear 2012, 296, 660–671. [Google Scholar] [CrossRef]
  33. Farayibi, P.K. Microstructural Evolution of Metal Matrix Composites Formed by Laser Deposition of Ti-6Al-4V Wire and WC-W2C Powder. Adv. Eng. Forum 2018, 26, 22–32. [Google Scholar] [CrossRef]
  34. Krishnakumar, M.; Mohnbabu, A.; Saravanan, R. Impact of Surface Alloying of Nickel on Microstructure, Hardness and Wear on Aluminium–12%Silicon Alloy. Trans. Indian. Inst. Met. 2019, 72, 2395–2402. [Google Scholar] [CrossRef]
Figure 1. (a) Dung beetles for observation. (b) The abdomen of a dung beetle.
Coatings 13 01768 g001
Figure 2. (a) Linear arrangement; (b) five-dot arrangement.
Coatings 13 01768 g002
Figure 3. (a) S ¯ and D ¯ ; (b) the ratio of S ¯ / D ¯ .
Coatings 13 01768 g003
Figure 4. (a) Pit shape structure model and normal structure model; (b) pit shape structure parameters.
Coatings 13 01768 g004aCoatings 13 01768 g004b
Figure 5. Rock sample diagram and boundary condition.
Coatings 13 01768 g005
Figure 6. Workflow of the wear simulation method.
Coatings 13 01768 g006
Figure 7. (a) Ni powder; (b) magnified by 20 times.
Coatings 13 01768 g007
Figure 8. Schematic diagram of a laser cladding process.
Coatings 13 01768 g008
Figure 9. (a) Test bench; (b) schematic diagram of the test.
Coatings 13 01768 g009
Figure 10. Stress nephogram of the contact surface between (a) pit shape structure and (b) normal structure and rock samples.
Coatings 13 01768 g010
Figure 11. Box selection area (a) location—stress scatter plot; (b) location—stress 3D map.
Coatings 13 01768 g011aCoatings 13 01768 g011b
Figure 12. Comparison of wear and wear depth after simulation.
Coatings 13 01768 g012
Figure 13. (a) Before polishing; (b) after polishing.
Coatings 13 01768 g013
Figure 14. Magnified by 200 times under a metallurgical microscope.
Coatings 13 01768 g014
Figure 15. The SEM micrographs of (a) specimen, (b) transition region, (c) coarse crystal region, and (d) fine crystal region.
Coatings 13 01768 g015
Figure 16. EDS analyses of (a) point A and (b) point B.
Coatings 13 01768 g016
Figure 17. (a) The SEM micrographs of the cladding layer; (b) EDS analyses of point C.
Coatings 13 01768 g017
Figure 18. Comparison of XRD spectra of the cladding layer with Al3Ni2, Al, and Ni.
Coatings 13 01768 g018
Figure 19. Microhardness test results for each region.
Coatings 13 01768 g019
Figure 20. Comparison of wear and wear depth after test.
Coatings 13 01768 g020
Figure 21. (a) Normal structural; (b) pit shape structural surface morphology after test.
Coatings 13 01768 g021
Figure 22. Wear process of two structures.
Coatings 13 01768 g022
Table 1. Abdominal pit shape structure parameters of dung beetle.
NumberRegionS (mm)D (mm) S ¯ (mm) D ¯ (mm) S ¯ / D ¯
11-10.28, 0.27, 0.280.14, 0.14, 0.150.2780.1421.95
0.29, 0.27, 0.280.13, 0.15, 0.14
1-20.30, 0.31, 0.280.15, 0.16, 0.160.3040.1541.97
0.32, 0.310.14, 0.16
22-10.26, 0.27, 0.270.12, 0.13, 0.130.2580.1282.01
0.24, 0.26, 0.250.14, 0.13, 0.12
2-20.24, 0.23, 0.240.12, 0.13, 0.130.2420.1231.96
0.23, 0.25, 0.260.11, 0.12, 0.13
33-10.25, 0.25, 0.270.12, 0.12, 0.130.2580.1252.06
0.26, 0.260.13, 0.11, 0.14
3-20.21, 0.22, 0.230.11, 0.10, 0.120.2170.1121.93
0.22, 0.21, 0.210.11, 0.11, 0.12
Table 2. Physical parameters for finite element analysis.
ModelMaterialDensity (kg·m−3)Elastic Modulus (GPa)Poisson’s Ratio
CoatingNi89002100.3
Drill pipeAluminum alloy2810720.33
RockGranite2650400.25
Table 3. Stress at selected points.
Positionabcd
Stress (Mpa)5.73 × 10−41.39 × 10−41.62 × 10−32.29 × 10−3
Table 4. Wear result.
ModelWear of 2 s
(mm3)
Comparison of WearSurface Area
(mm2)
Wear Depth
(mm)
Comparison of Life Span
Normal structure3.54 × 10−9 17,2032.06 × 10−13
Pit shape structure5.42 × 10−1084.7% reduction14,0123.87 × 10−1481.3% improvement
Table 5. Wear test results.
ModelMass Loss
(g)
Comparison of Mass LossSurface Area
(mm2)
Wear per Unit Area
(g/mm3)
Comparison of Life Span
Normal structure4.10 17,2032.38 × 10−4
Pit shape structure1.0175.4% reduction14,0127.21 × 10−570.0% improvement
Disclaimer/Publisher’s Note: The statements, opinions and data contained in all publications are solely those of the individual author(s) and contributor(s) and not of MDPI and/or the editor(s). MDPI and/or the editor(s) disclaim responsibility for any injury to people or property resulting from any ideas, methods, instructions or products referred to in the content.

