1. Introduction
Magnesium (Mg) and magnesium alloys, as the lightest structural materials, have many advantages, including light weight, high stiffness and strength, excellent dimensional stability, good electromagnetic shielding and damping characteristics [
1,
2,
3]. For decades, a lot of research work has been devoted to magnesium and its alloys, aimed at improving their roles in engineering applications [
4,
5,
6,
7]. However, the low hardness and high chemical activity of magnesium and its alloys seriously limit their wide-spread applications, especially in aggressive environments. Surface treatment is one of the effective methods to improve the surface properties of magnesium alloys. Plasma electrolytic oxidation (PEO) technology is an advanced surface treatment technology that was developed from traditional anodization [
8,
9]. By using this technology, metals and their alloys, such as Al [
10], Mg [
11,
12,
13], Ti [
14,
15], Zr [
16], Ta [
17] and Cu [
18,
19], can grow a layer of oxide ceramic coating on the surface. These coatings have strong bonding with the substrate, good wear and corrosion resistance, thermal stability and high hardness [
8,
9].
Unlike conventional anodization, which has a simple electrochemical mechanism that involves the migration of anions and cations to form a film [
20,
21,
22], PEO works at potentials above the breakdown potential of the oxide coating, resulting in the occurrence of plasma discharges, which trigger complex physical–chemical processes other than electrochemical reactions, including the plasma chemical process, thermal process and sintering [
23,
24,
25,
26]. Hussein et al. [
27] described the growth of magnesium alloy PEO coatings as a process in which dielectric breakdown occurs at the weak point of the oxide, and then the molten oxide is ejected from the coating/substrate interface, rapidly solidified and recrystallized when it reaches the coating/electrolyte interface. Such repeated steps form a thick coating with complex compounds. However, Zhu et al. [
28] found that a slow growth process controlled by an ion migration mechanism helps the formation of the barrier layer in the PEO of pure aluminum. PEO discharges are normally accompanied by the release of large amounts of gases, which inevitably cause pores and various defects within the coatings [
29,
30,
31,
32,
33].
The introduction of cathodic polarization (such as AC, bipolar pulses) can improve the homogeneity, thickness and quality of PEO coatings [
34,
35,
36]. In particular, when the ratio of the cathodic-to-anodic current or charge (R = j
c/j
a or R = Q
c/Q
a) is greater than 1, a so-called “soft sparking” PEO regime will be triggered for aluminum and its alloys [
37,
38,
39]. The soft sparking occurs after the coating has grown to a certain thickness and is normally manifested by an obvious drop in the anodic potential and decreases in the acoustic sound emissions and micro-discharge size [
34,
37,
39]. The occurrence of soft sparks can result in a faster coating growth rate, fewer defects and higher uniformity [
34].
The mechanisms of cathodic polarization and soft sparking are very complex and are still the key research topics in PEO. Yerokhin et al. reported that the main role of cathodic polarization is to interrupt the continuous anode discharge, and to provide a gas environment for plasma discharge and the possible cathodic-discharge phenomenon [
26]. Sah et al. [
40,
41] proposed that cathodic polarization can randomize the position of the subsequent anodic breakdown, avoiding repeated breakdowns at the same position and the formation of large discharge channels. Hussein et al. [
35] believe that the application of cathodic currents can weaken the strong plasma discharges. Cheng et al. [
36] think that cathodic hydrogen evolution can promote the transport of electrolyte ions to the electrode surface, thereby facilitating the formation of uniform and thick coatings.
The explanation for the phenomenon of soft sparking is more complex. Regarding the drop in the anodic potential in the soft-sparking state, Gębarowski and Pietrzyk considered that it is due to the large amount of hydrogen evolution in the cathodic stage, which destroys the barrier layer [
38]. Rogov et al. [
42] proposed the local acidification hypothesis and the “active zone” theory to explain the related phenomena of the soft-sparking process. They believe that once the oxide coating reaches a certain thickness, localized acidification eliminates voltage barriers at the oxide coating/electrolyte interface, resulting in a drop in the anodic potential. Martin et al. [
43] found that increased cathodic polarization leads to delayed spark discharges, and they thus propose a mechanism of electrical-charge accumulation. Martin et al. [
43] and Cheng et al. [
39] found that there is an optimum cathodic-to-anodic current or charge ratio (R) for the soft-sparking effect in aluminum alloys, with a value of approximately R = 1.2. Beyond this ratio, the coatings become thinner or even cannot form [
39,
43]. Interestingly, Cheng et al. showed that the anodic potential does not necessarily decrease under the optimum R value [
39]. In addition, He et al. [
44] demonstrate that the internal temperature of the coating under the condition of soft sparking is higher than those under conventional discharges, leading to the formation of more alpha alumina phase and black copper (II) oxide. The reason is that the amorphous outer layer formed under soft sparking and the amorphous barrier layer at the oxide/substrate interface can effectively prevent the heat from escaping out of the coating system. In addition, Martin et al. also found that increasing the anodic current density and frequency is beneficial for establishing an earlier soft-sparking state [
45]. A recent study found that adding carbon nanotubes to the electrolyte can also lead to the earlier occurrence of soft sparking [
46].
The research on the phenomenon of soft sparking mainly focuses on Al and its alloys. Due to the advantages of soft sparking on Al alloys, people have also strived to achieve the soft-sparking effect on other metals. However, the research on soft sparking on other metals is not satisfactory and has not achieved similar effects to those of Al alloys [
35,
47,
48,
49,
50]. Rogov et al. [
42] found that the relatively consistent soft-sparking phenomenon will appear in those metals forming insulating oxide on the surface, such as Mg, Al, Zr and Ta, while the typical anodic-potential drop of soft sparking will not appear in those metals forming the semiconductor oxide, such as Ti and Nb, but a certain degree of spark softening can also be observed on these metals. At present, there are also a few literature works dedicated to achieving soft sparking on Mg. Tjiang et al. [
47] triggered soft sparking on pure magnesium in a solution containing zirconium K2ZrF6 at R = ~1.16, resulting in a PEO coating with fewer pores and a relatively dense structure. However, there were still cracks and pores in the coating. Arrabal [
50] studied different types of magnesium alloys at R = ~1.2 and found that the occurrence time of the soft sparking depends on the type of magnesium alloy matrix, and defects in the coating are improved. However, the densification of the inner layer on the Mg alloy surface has not been completed. Maryam [
51,
52] triggered the soft sparking of an AZ31 magnesium alloy by changing the cathodic duty cycle, resulting in a coating with good wear and corrosion resistance. Pan et al. [
53] and Gao et al. [
54] indicated that hydrogen evolution via the appropriate cathodic current promotes ion diffusion and exchange, but excessive cathodic current can hinder the movement of the required anions in the coating, and a large amount of hydrogen can even damage the integrity of the coating. In addition, the PEO coatings of magnesium and magnesium alloys obtained under the aforementioned soft sparking still have some pores and are not dense compared to the effect of soft sparking on aluminum alloys. Even if pure magnesium is in a soft-sparking state, the coating will peel off after 60 min, as confirmed by Tjiang [
47]. This also indicates that there is a difference in the growth of oxide coatings between magnesium and aluminum in the soft-sparking state.
Surveying the PEO literature on Mg-based alloys, Tsai [
55] found that the strategy of softened plasma works best on the coatings on Mg alloys when the electrolytic solution contains a substantial amount of aluminate, commonly NaAlO
2. Therefore, the authors believe that researchers essentially resort to the rectifying aluminum oxide on Mg-based metals in replicating soft sparking and its associated dense inner layer. For the electrolytic solutions without aluminate, Tsai thought that the cathodic component in the waveform is ineffective in obtaining a dense inner layer by citing several works on the PEO of Mg alloys [
56,
57,
58,
59].
In this work, the PEO behaviors of pure magnesium and AZ31 and AZ91 magnesium alloys were systematically studied at different R ratios in a typical silicate solution, which is used in the study of the soft-sparking phenomenon on Al alloy. The Al contents of these three alloys increased sequentially, which can be used to investigate the effect of the Al content on the PEO behavior of Mg substrate.
2. Experimental
2.1. Materials
Samples with a dimension of 10 mm × 20 mm × 4 mm were cut from the rolled plates of pure magnesium (Mg 99 wt.%) and AZ31 magnesium alloy (nominal composition in wt.%: Al 3%, Zn 1%, Mn 0.2% and Mg balance). Samples of the same dimension for the AZ91 magnesium alloy (nominal composition in wt.%: Al 9%, Zn 1%, Mn 0.2% and Mg balance) were cut from an extruded rod with a diameter of 27 mm. Each specimen was then connected with a copper wire and mounted with resin, leaving a working area of 10 mm × 20 mm. The working surface of each specimen was successively ground to a 2000-grit SiC finish, degreased in ethanol, rinsed in distilled water and dried in a stream of warm air.
2.2. PEO
PEO was carried out in a 1 L glass cell equipped with mechanical stirring and a water-cooling system. The temperature of the cooling water was set at 20 °C. The electrolyte was 5 g L−1 Na2SiO3·9H2O + 1 g L−1 KOH, which was prepared by dissolving analytical-grade chemicals (Sinopharm Chemical Reagent Co., Ltd., Shanghai, China) in distilled water. During the PEO process, the anode was the magnesium samples, and the cathode was a large stainless-steel plate. The power supply was a 5 KW pulse electrical source (MAO-5D, Pulsetech Electrical Co., Ltd., Chengdu, China). The duty cycle of the waveform was 20% and the frequency was 100 Hz. An oscilloscope (Tektronix TDS 1002C-SC) was used to monitor the current waveforms during PEO. The applied average anodic current density was 0.172 A cm−2, and the average cathodic current densities were kept at 0, 0.103, 0.155, 0.206, 0.275 and 0.550 A cm−2, constituting cathodic-to-anodic current density ratios (Rs) of 0, 0.6, 0.9, 1.2, 1.6 and 3.2, respectively.
2.3. Characterization
Real-time imaging and optical emission spectroscopy (OES) were employed to investigate the plasma discharges during PEO. A digital camera (Canon Powershot G5) was used to record the plasma discharges and the appearance of the PEO coatings. The thicknesses of the coatings were measured by using an eddy-current thickness gauge (TT260, Times Group, Beijing, China). The OES spectra were acquired using a spectrometer (Ocean Optics, HR4000) in the wavelength range of 250–710 nm. The system for the spectrum collection was placed outside of the quartz window of the glass vessel, with the distance between the collimating lens and the specimen fixed at ~10 mm. An integration time of 2 s was adopted to record the light emissions in this study. Atomic and ionic lines in the collected spectra were identified using the NIST online spectral database [
60].
The corrosion resistances of the substrates and PEO coatings were evaluated via polarization curves. Polarization curves were produced using an electrochemical workstation (CHI660C). The corrosive medium was a 3.5 wt.% NaCl solution. The configuration of a 3-electrode system was employed. The working electrode was the samples with exposed areas of 2 cm2, the counter electrode was a large platinum plate and the reference electrode was a saturated calomel electrode (SCE). To eliminate the influence of the crevices between the specimen edges and mounting resin on the measured polarization curves, the edges of all the samples were sealed with paraffin. Prior to the polarization curves, the open-circuit potential (OCP) was recorded for 1800 s in order to obtain a stable state. The polarization curves were recorded between −0.5 V and +1.5 V with reference to the OCP, using a scanning rate of 1 mV/s.
A field-emission scanning electron microscope (SEM) (QUANTA FEG 250) with energy-dispersive X-ray spectroscopy (EDS) was used to examine the morphologies and compositions of the coatings. The cross sections of the coatings were observed via the conventional mounting and polishing method. All samples were sputtered with platinum or gold for 180 s before SEM.
In order to investigate the growth mechanism of the coating, a small piece of rectangular magnesium metal was encapsulated together with the aforementioned 10 mm × 20 mm × 4 mm pure magnesium specimen with epoxy resin. The small piece of magnesium was very close to the pure magnesium specimen but was kept insulated from it. The two were then polished to the same plane with 5000-grit SiC paper. After that, the small piece of magnesium was protected by 704 silicon rubber. Subsequently, the pure magnesium specimen was subjected to PEO treatment. A cross section of the specimen was prepared to observe the relative position of the PEO coating to the original surface (the protected magnesium piece) under SEM.
A Rigaku D/max 2500 X-ray diffractometer (XRD) (Cu Kα radiation, 40 kV, 250 mA) was used to detect the phase compositions of the coatings. The scanning range is 10–80° in 2θ and the scanning rate is 4°/min.
The friction performances of the substrates and coatings were analyzed via dry sliding wear tests. For the pure magnesium and AZ31 alloy, PEO coatings formed under R = 0 and R = 0.6 for 2400 s were tested. Coatings formed under R = 0, 0.6 and 1.2 for 2400 s were tested for the AZ91 magnesium alloy. Tests were performed on the HT1000 friction and wear tribometer (Zhongke Kaihua Technology Co., Ltd., Lanzhou, China). The load is 5 N, and the counter material is a Cr steel ball with a diameter of 4 mm and a hardness value of 62 HRC. The wear radius was set to 2 mm, the rotation speed was 318 rpm and the sliding time was 1200 s. After the wear tests, the cross-section profiles of the wear scars were examined via the probe attached to an SFT-2M pin-disc-friction and wear-testing instrument (Zhongke Kaihua Technology Co., Ltd., Lanzhou, China). Wear rates were calculated by dividing the calculated wear volume losses by the total sliding distance and load.
3. Results
3.1. Cell Potential–Time Responses
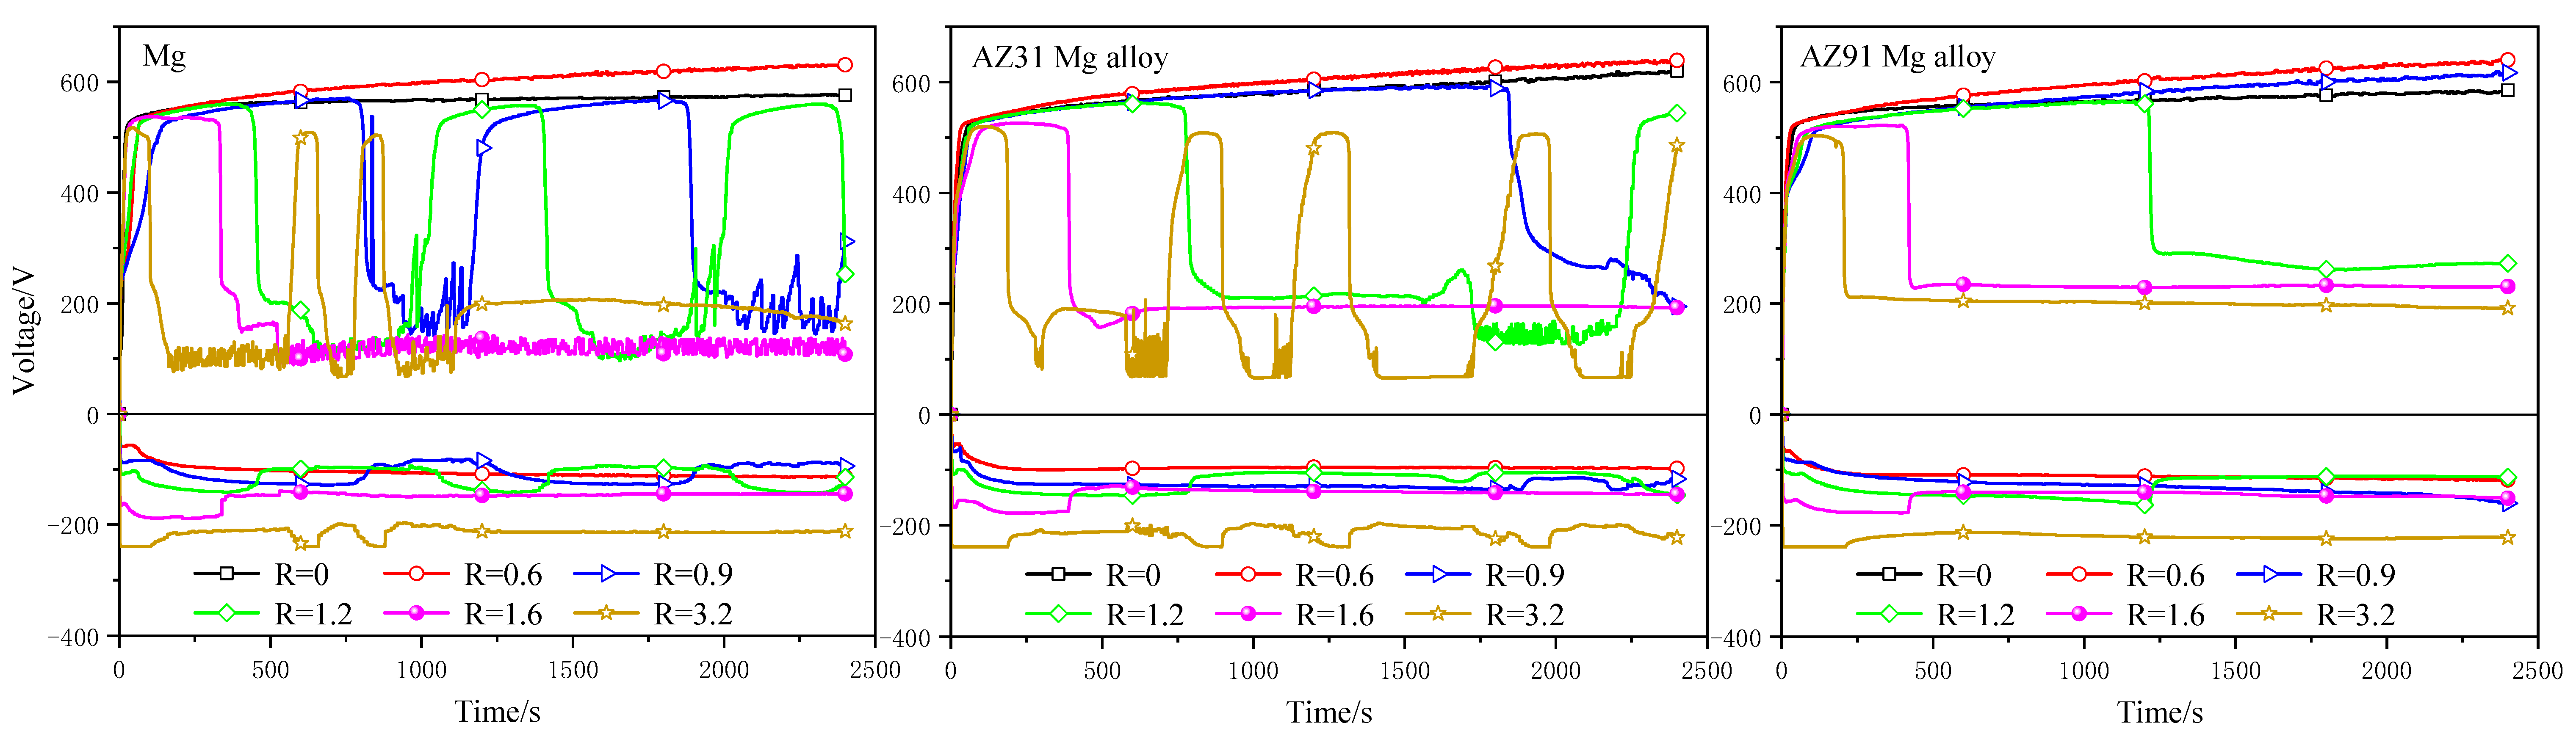
Figure 1 shows the cell potential–time responses of the pure magnesium and AZ31 and AZ 91 magnesium alloys during PEO under R ratios from 0 to 3.2 for 2400 s. In the initial period, the anodic potential of the pure magnesium at different R values rapidly increased at a nearly linear rate to ~500 V. Then, the rising rate of the anodic potential was significantly reduced, accompanied by the appearance of sparks. However, in the subsequent PEO stage, there were differences in the cell potential–time curves for different R values. The anodic potentials of R = 0 and R = 0.6 increased slowly to the final values of 577 V and 631 V at 2400 s, respectively. During most of the PEO period, the potential at R = 0.6 remained higher than that at R = 0. However, the potential at R = 0.9 did not rise continuously. At the PEO time of 760 s, the potential at R = 0.9 suddenly decreased from ~571 V to ~224 V, accompanied by a weakening of the plasma discharges. Afterwards, the potential remained at relatively low values (~200 V), with fluctuations being observed, and this stage lasted for ~385 s. At ~1145 s, the anodic potential rose again, reaching 524 V at 1242 s, accompanied by the reappearance of strong sparks. Afterwards, the potential decreased again at ~1857 s. Visual observation showed that the decrease in the potential was due to the destruction of the coating. However, after the coating was completely detached from the sample, strong sparks reappeared and the potential rose again. The cell potential–time responses of the pure magnesium at higher R values were similar to that at R = 0.9, except for an earlier decrease at greater R values. In addition, the cell potential at R = 1.6 did not show recoveries after the potential dropped.
The cell potential–time responses at different R values for the AZ31 magnesium alloy were similar to those of the pure magnesium. The anodic potential at R = 0.6 was higher than that at R = 0, with final values of 637 V and 616 V at 2400 s, respectively. When the R ≥ 0.9, the potential of the AZ31 magnesium alloy underwent a sudden drop or multiple drop-and-rise cycles at the later stage of the PEO treatment.
Unlike the pure magnesium and AZ31 magnesium alloy, the cell potential–time responses of the AZ91 magnesium alloy did not show a decrease in the anodic potential at R = 0.9. At the termination of the PEO, the anodic-potential values were 585 V (R = 0), 641 V (R = 0.6) and 616 V (R = 0.9) at 2400 s, respectively. When R ≥ 1.2, the AZ91 magnesium alloy also experienced a decrease in the anodic potential, but there was no oscillation in the anodic potential.
The amplitudes of the cathodic potentials were much lower than those of the positive ones. In R values ranging from 0.6 to 3.2, the cathodic potentials of the three samples were normally lower than −250 V. The cathodic potentials were usually more negative at higher R values.
3.2. Real-Time Imaging of Sparks
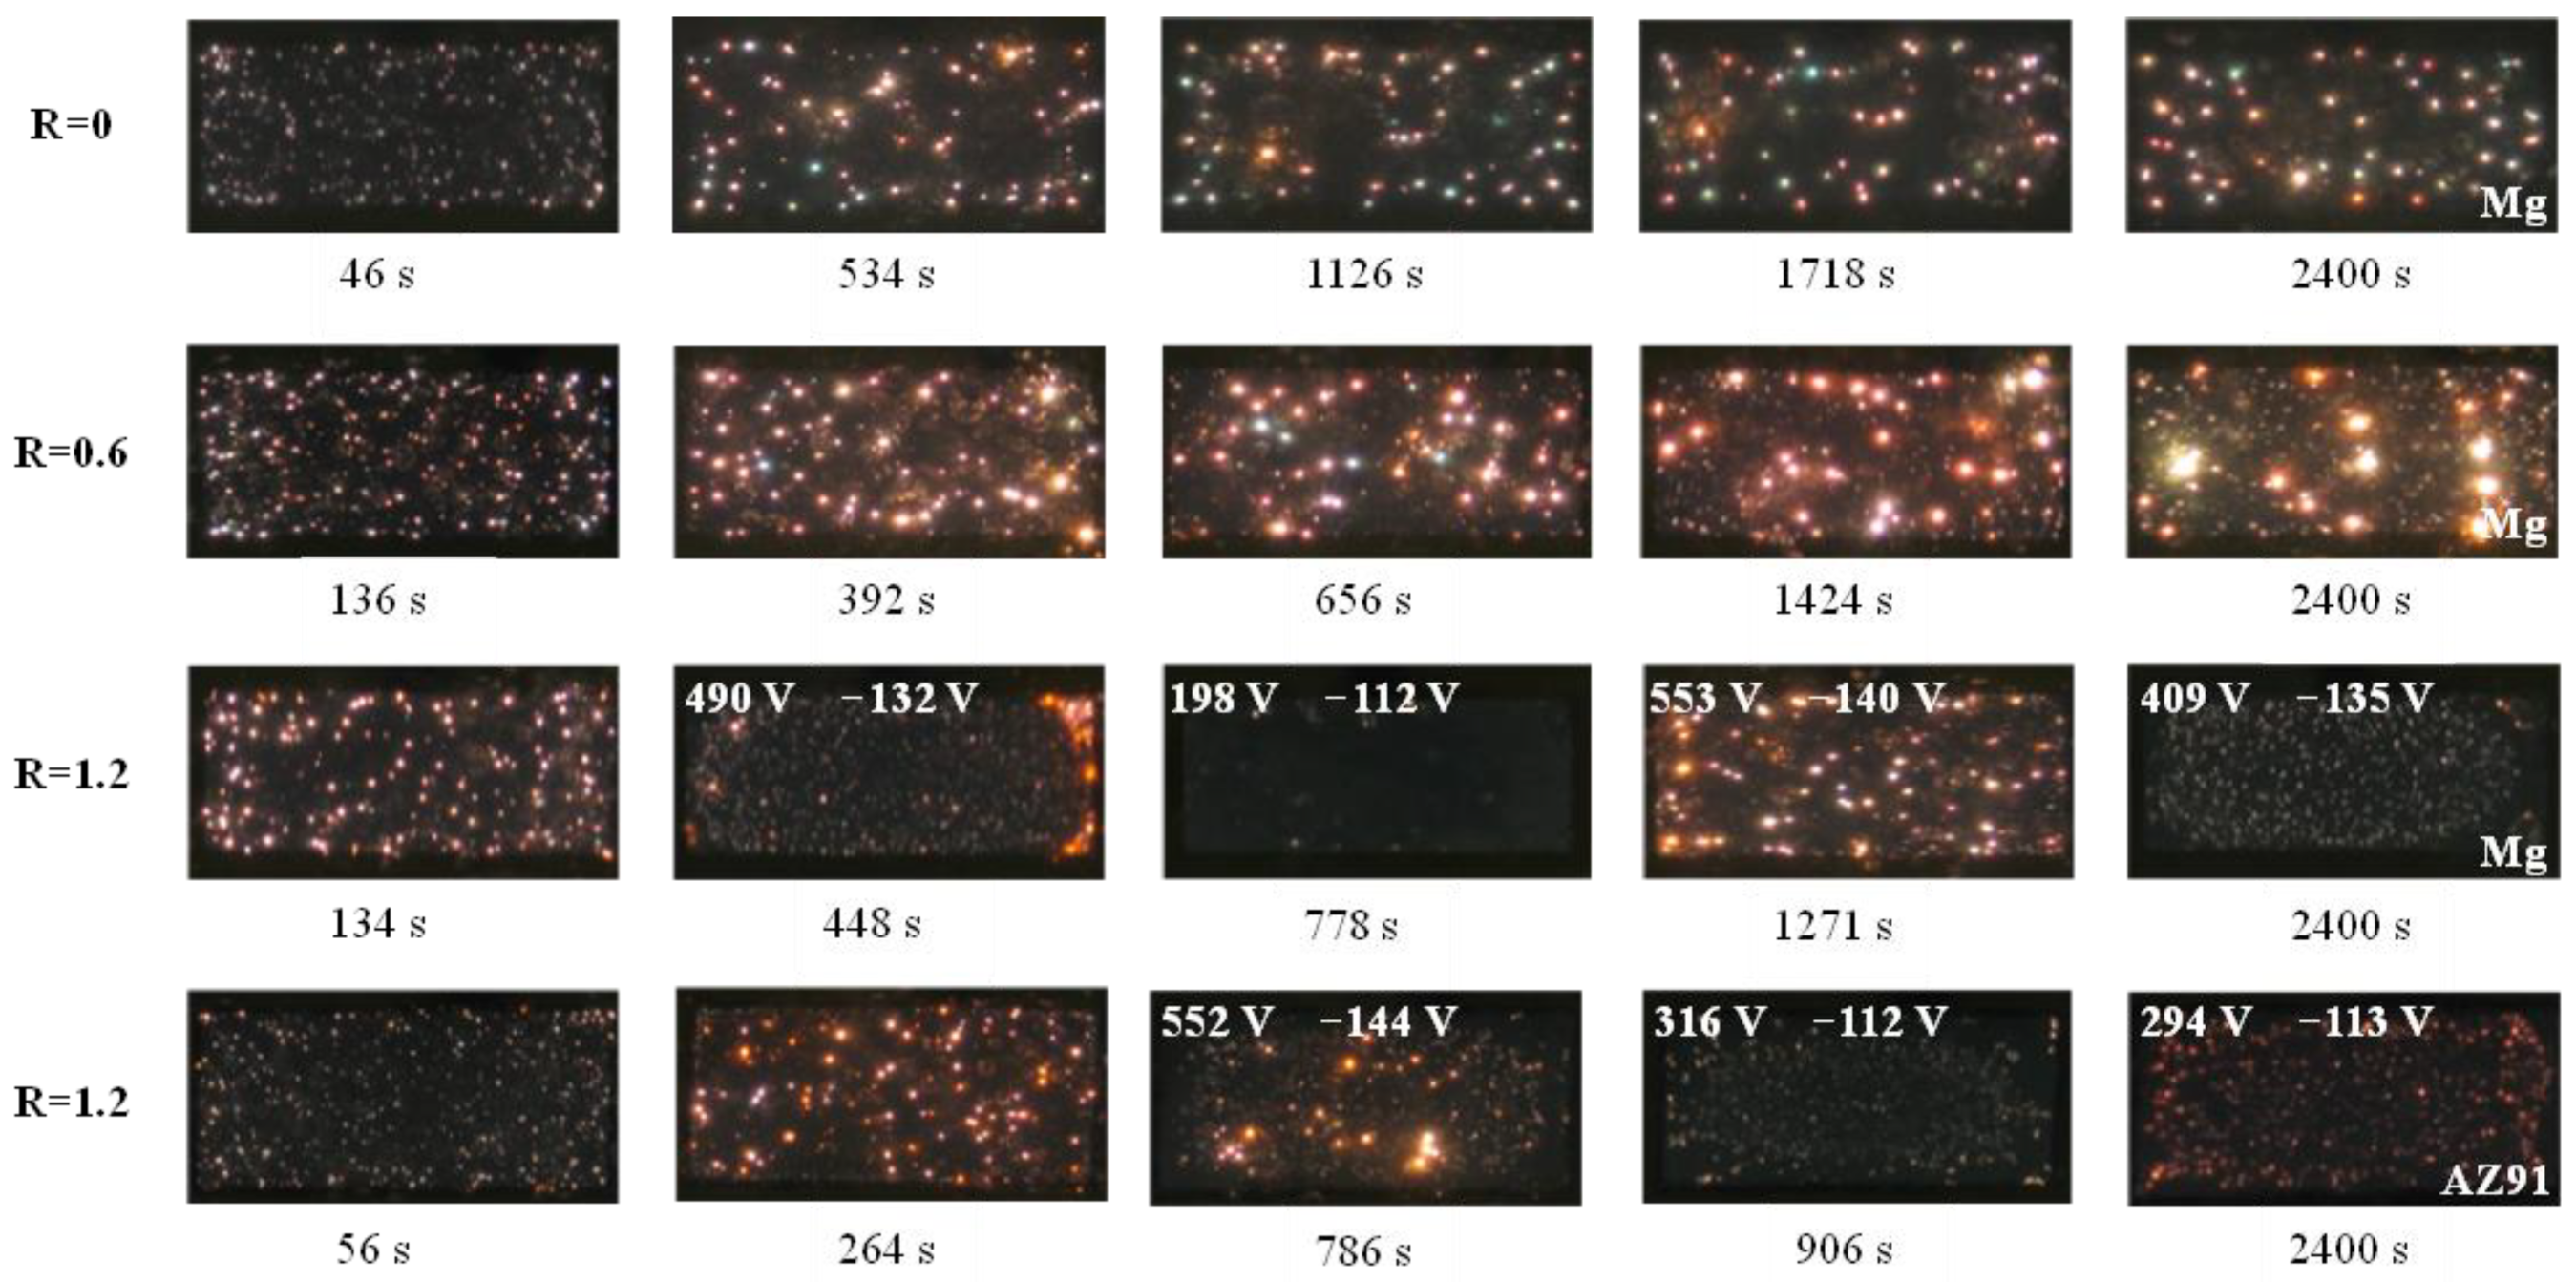
Figure 2 shows the plasma discharges of the pure magnesium and AZ91 magnesium alloy at different R values during the PEO process. The images were recorded at an exposure time of 1/100 s. When the pure magnesium was treated without cathodic polarization (R = 0), numerous small sparks were seen on the metal surface during the initial stage, such as at 46 s. The number of sparks decreased but their intensity increased with time, as shown by the image at 534 s. However, after 534 s, the sparks were basically kept in a similar state. The increase in the spark intensity was usually accompanied by louder acoustic emissions, and a few green sparks could be observed. The green sparks may have been related to the excitation of the Mg in the plasma. The discharging behavior of the pure magnesium at R = 0.6 was similar to that at R = 0, but, in the later stage of the PEO, the sizes of the sparks were significantly larger than those in the condition without cathodic polarization. At the further increased cathodic polarization of R = 1.2, the initial sparks of the pure magnesium at 134 s were similar to those at R = 0 and 0.6. However, the spark intensity weakened at 448 s, accompanied by the drop in the anodic potential to ~490 V, despite a few large sparks at the right-hand edge of the sample. The anodic potential further dropped to 198 V at 778 s, with the near extinguishment of the sparks. At this moment, it was observed with the naked eye that the coating almost peeled off from the surface. However, the potential rose again after the coating was completely peeled off, and strong sparks occurred again, as shown by the image at 1271 s. At 2400 s, the potential dropped again, accompanied by a decrease in the spark intensity, as the formed coating underwent another flaking-off and growth cycle.
The relationship between the spark discharges and R ratio for the AZ31 magnesium alloy was largely similar to that of the pure magnesium; thus, the plasma discharges of the AZ31 alloy are not shown here. The AZ91 magnesium alloy did not exhibit a potential drop until R = 0.9, and the discharging behavior was similar to that of the pure magnesium at R values of 0 or 0.6.
Figure 2 only includes the discharges under R = 1.2 for the AZ91 alloy. The plasma discharges intensified from 0 to 786 s, as was the case for the pure magnesium at R = 0.6. However, the plasma discharges drastically weakened at 906 s and 2400 s, accompanied by the decrease in the anodic potential.
3.3. OES
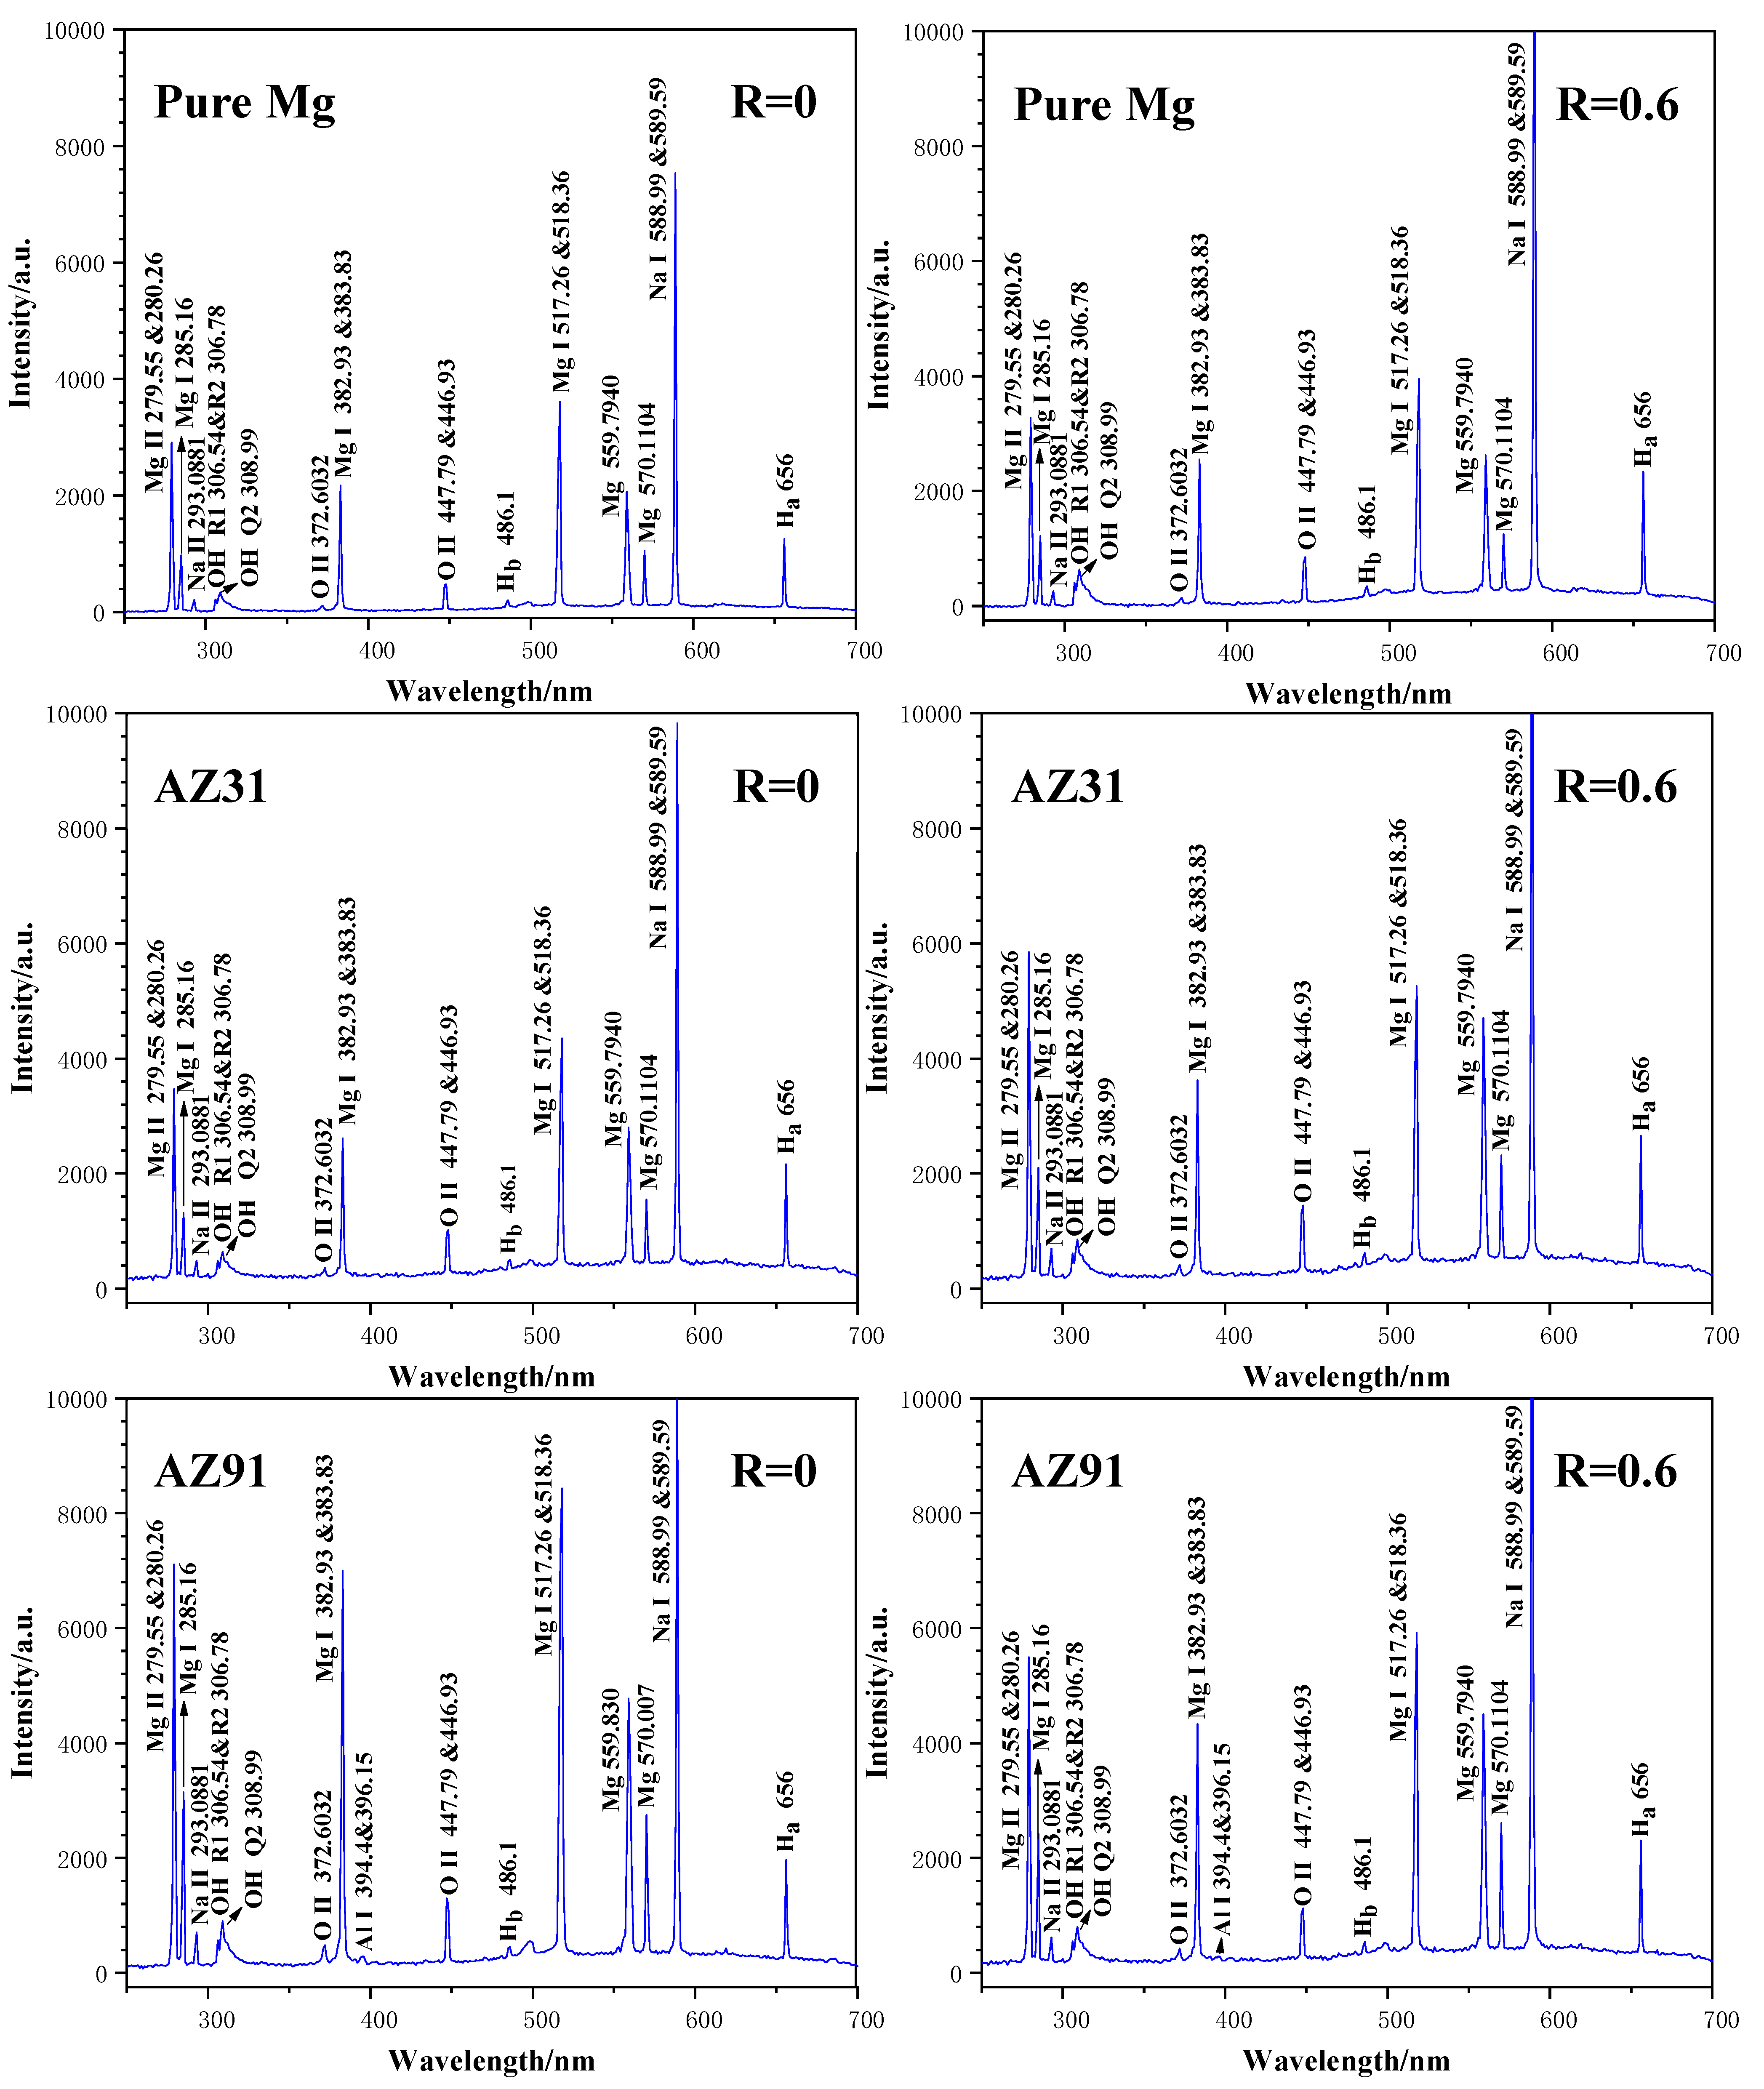
Figure 3 shows the OES spectra recorded at 600 s for the pure magnesium and AZ31 and AZ91 magnesium alloys at R = 0 and R = 0.6. The results indicate that, in the sodium silicate solution, the strongest emission lines collected for the pure magnesium at R = 0 were the Na I lines at 588.99 and 589.59 nm. Characteristic emission lines of other elements from the electrolyte, such as O II and Há, Hâ and OH, were also present on the spectrum. In addition, multiple spectral lines of Mg, which came from the substrate, were recorded. It is worth noting that we attribute the two spectral lines at 559.79 and 570.11 nm to Mg. However, databases and the literature do not show the presence of spectral lines at the two positions for species of Mg. The assignment to the Mg lines is based on our deduction. We collected the emission spectra of pure Al in the same solution, showing the absence of the two spectral lines. Therefore, it can be ruled out that these two spectral lines came from the electrolyte. As a result, we can only attribute the two spectral lines to the substrate metal (Mg) at present. The spectral lines collected for the pure magnesium at R = 0.6 are almost identical to those at R = 0.
The emission spectra for the AZ31 and AZ91 magnesium alloys at R = 0 and R = 0.6 are almost the same as that of the pure magnesium. The only difference is that the AZ91 magnesium alloy had weak Al I doublet peaks at 394.4 and 396.1 nm at R = 0, which had even lower intensities at R = 0.6. The results of this experiment showed that the OES spectra were not sensitive to the alloying element of Al.
3.4. Macroscopic Appearances
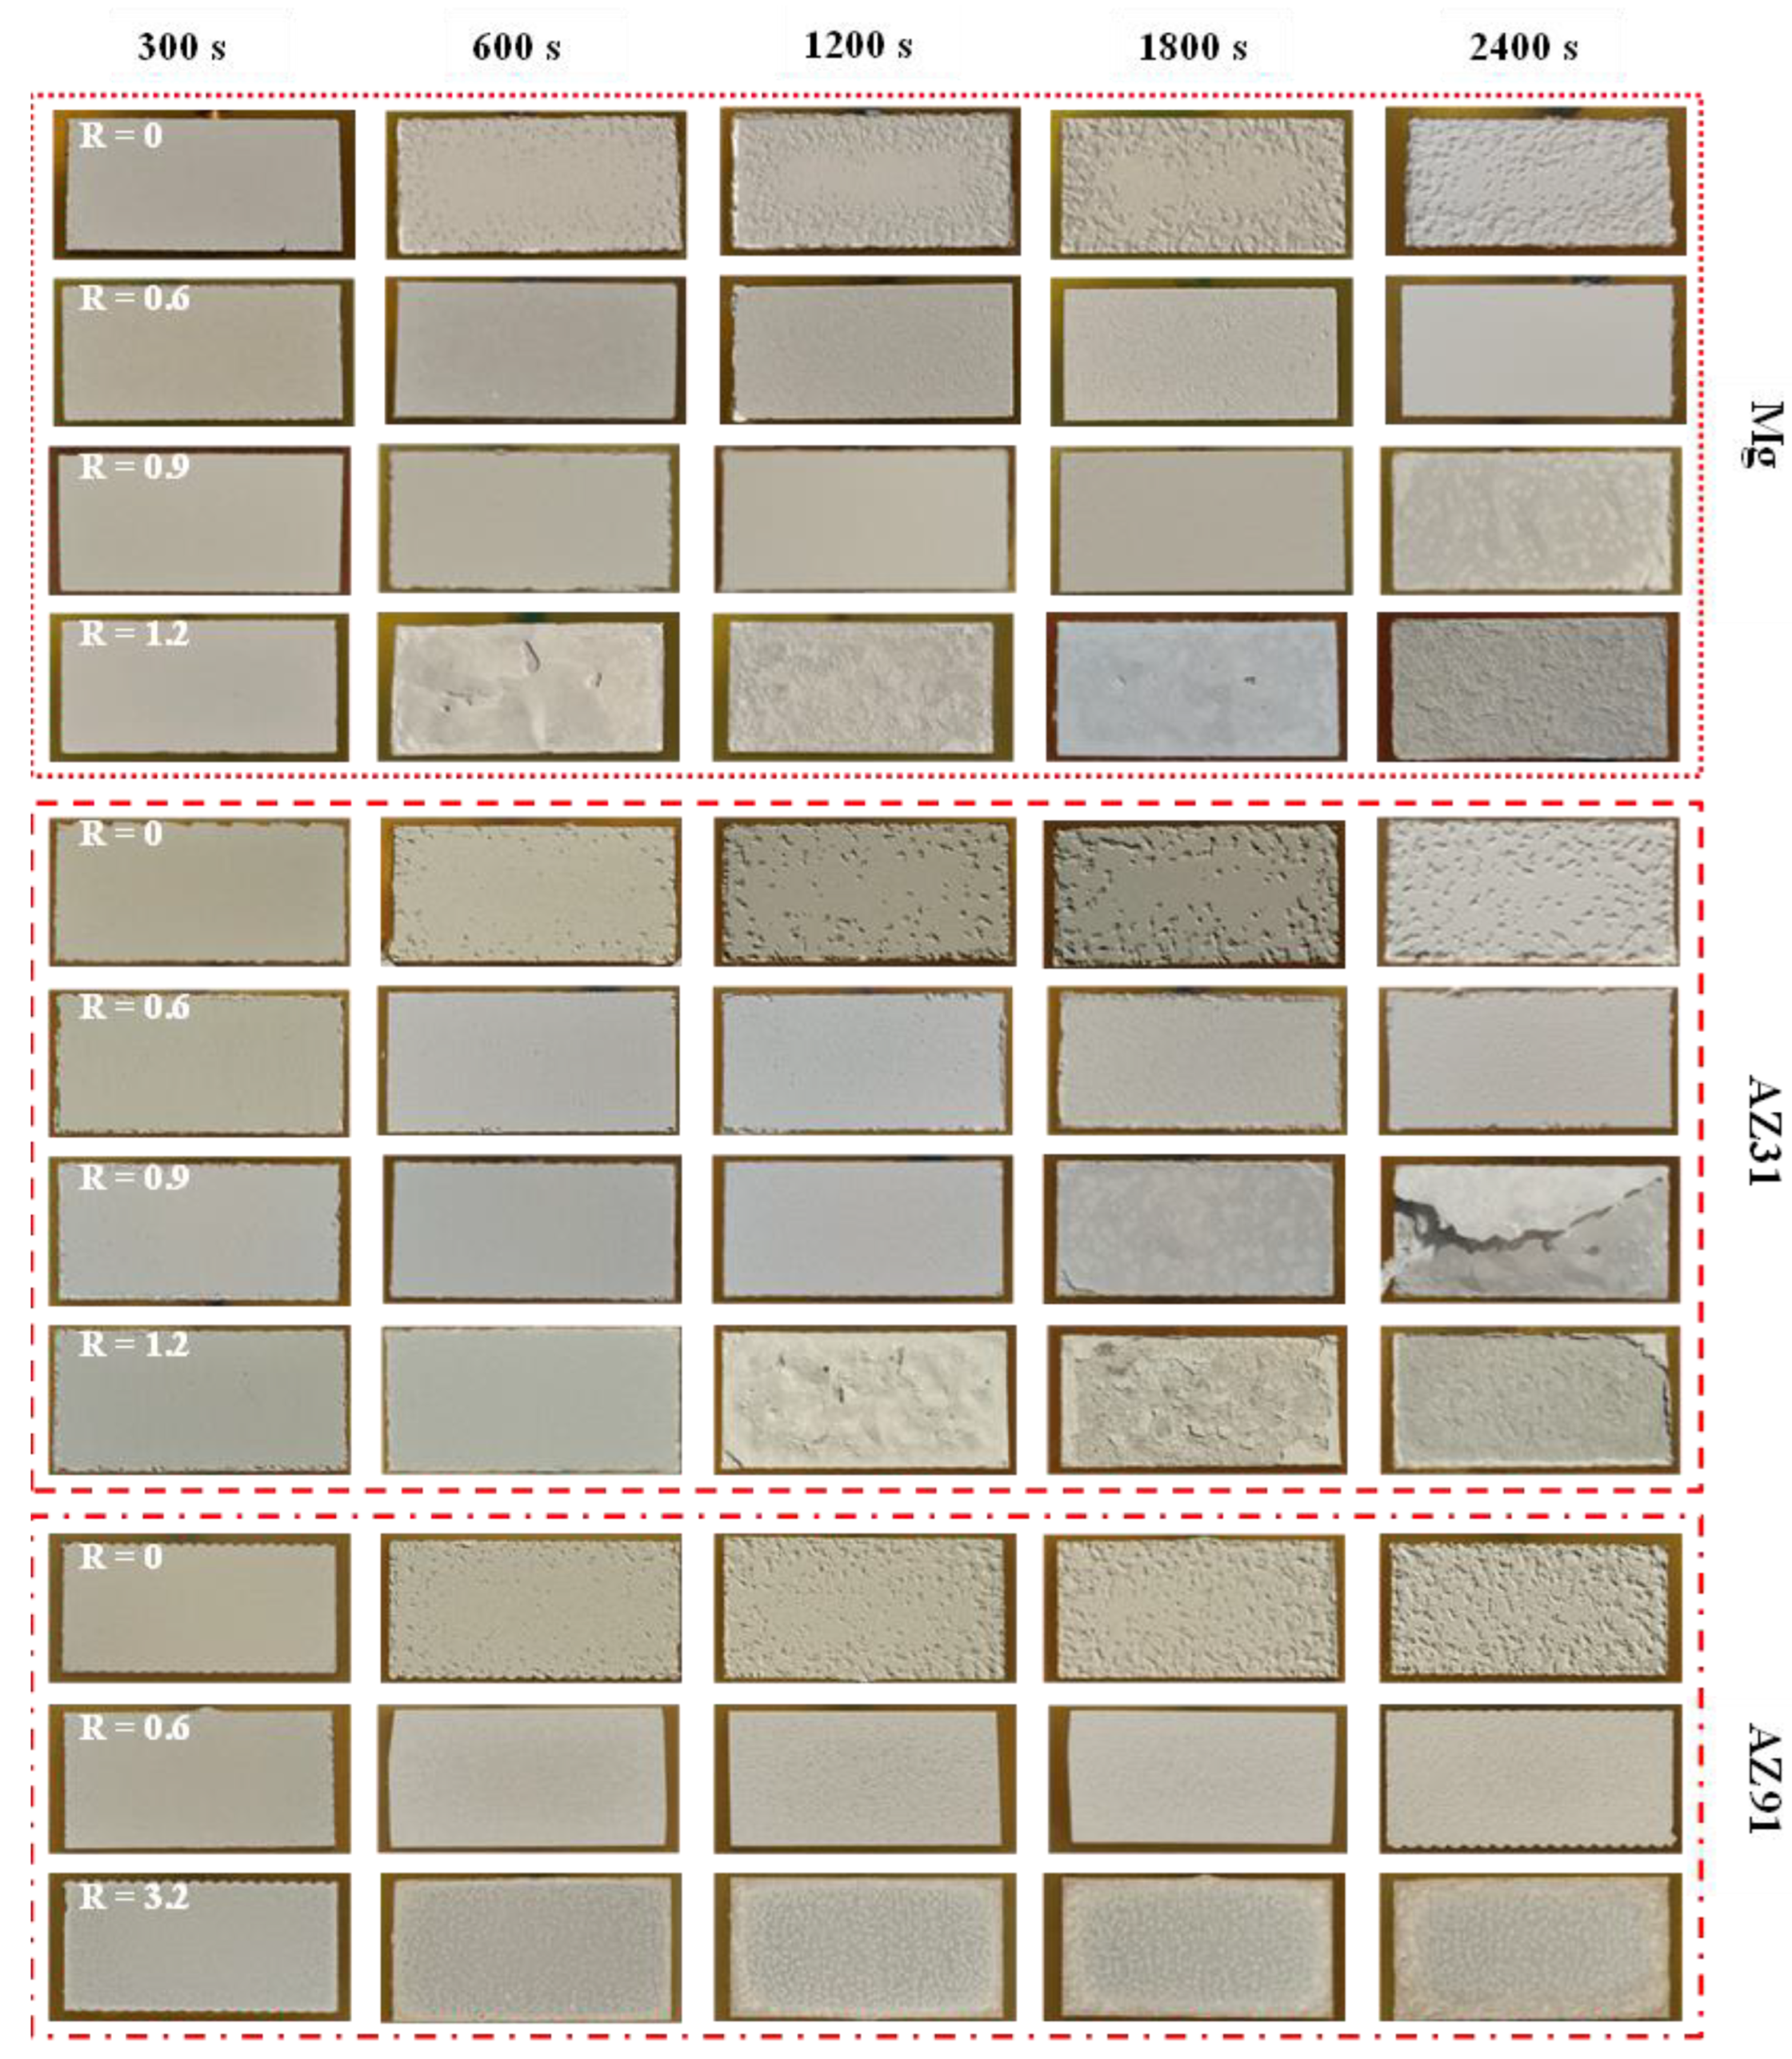
The appearances of PEO coatings on the pure magnesium and AZ31 and AZ91 magnesium alloys at different R ratios and treatment times, taken by a digital camera, are displayed in
Figure 4. When there was no cathodic polarization (i.e., R = 0), many pits were observed on the surface of the PEO coating of pure magnesium after 600 s. The density of the pits was relatively high at the edge of the sample, and, over time, they gradually extended towards the center. When cathodic current was applied, such as at R = 0.6, the surface porosity of the coatings decreased significantly compared to that at R = 0. Further increasing the cathodic polarization to R = 0.9 led to more compact coatings in the early PEO stages. However, long-term-coating surfaces may experience blistering, detachment and re-oxidation. The coating at 1200 s was grown via the secondary oxidation of the pure magnesium after the preliminary coating was completely detached, and the coating at 2400 s once again exhibited blistering on the surface. At R = 1.2, the PEO coatings on the pure magnesium blistered, broke and oxidized again, just like the behavior at R = 0.9. However, the time to blistering was significantly shortened (see the image at 600 s for R = 1.2).
The performance of the AZ31 magnesium alloy under different R ratios was basically consistent with that of the pure magnesium. Uniform and dense coatings were formed only at R = 0.6. Further increasing the cathodic polarization resulted in blistering, cracking and re-oxidation.
The PEO of the AZ91 magnesium alloy showed numerous pits on the coatings at R = 0, which were similar to those on the pure magnesium and AZ31 alloy. The coatings formed on the AZ91 alloy at R = 0.6 also improved in uniformity. However, the AZ91 magnesium alloy responded differently to cathodic polarization at higher R ratios. The coatings formed under higher R ratios did not exhibit blistering or detachment as those in the first two alloys. The appearances of the coatings grown on the alloys under the highest R value of 3.2 are shown in
Figure 4. No significant damage to the coatings was found throughout any of the entire PEO process.
3.5. Coating Thickness
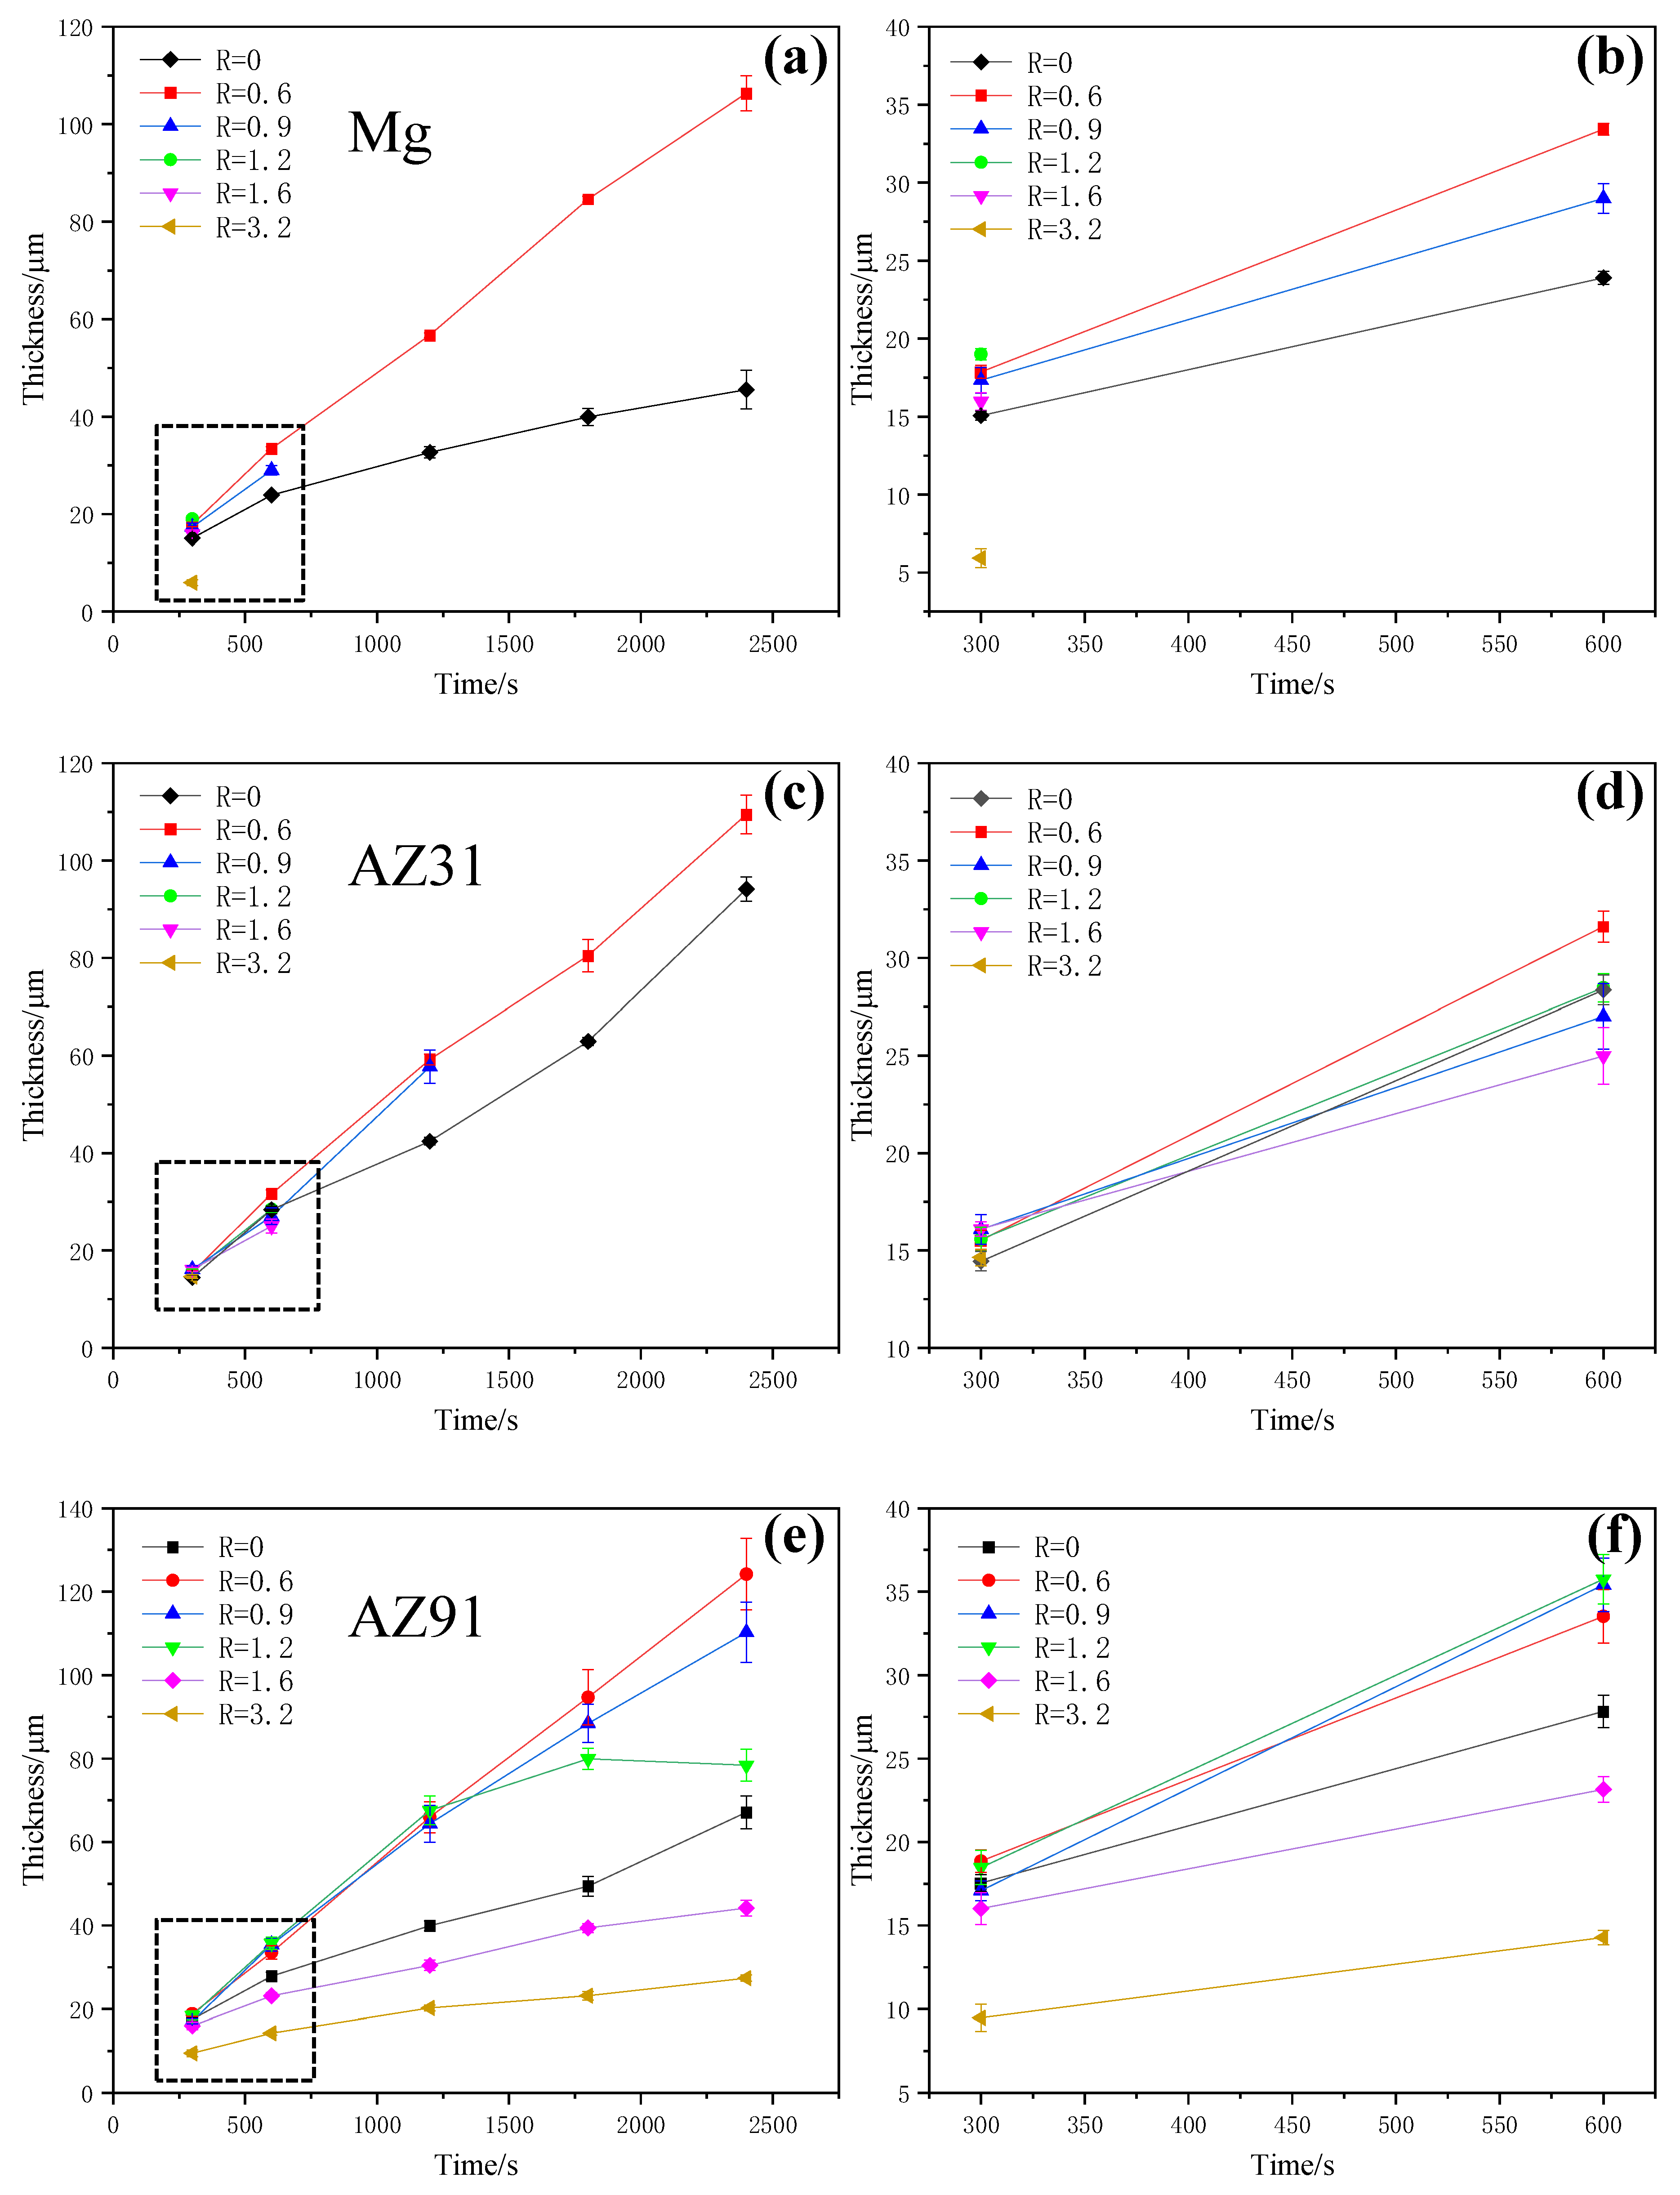
Figure 5 shows the relationship between the coating thickness and time during the PEO of the pure magnesium and AZ31 and AZ91 magnesium alloys. Overall, for the three samples, the maximum thicknesses at 2400 s under R = 0.6 were 106.4, 109.5 and 124.2 µm, respectively. However, the PEO of the pure magnesium and magnesium alloys without cathodic polarization showed significantly reduced thicknesses at 2400 s, being 45.6, 94.2 and 67.1 µm, respectively. Therefore, the application of cathodic polarization at R = 0.6 significantly increased the thicknesses of the coatings. The thickness data on the pure magnesium and AZ31 magnesium alloy are absent at long times, due to the damage of the coatings. However, the thickness data for the AZ91 magnesium alloy are complete, as the coatings were not damaged in this case. In an R range from 0.6 to 1.2, the thickness of the coatings on the AZ91 alloy at a specific time was higher than that under R = 0. However, the coating thicknesses obtained at too-high R values (1.6 and 3.2) were smaller than those of the coatings formed under R = 0.
3.6. SEM Morphology
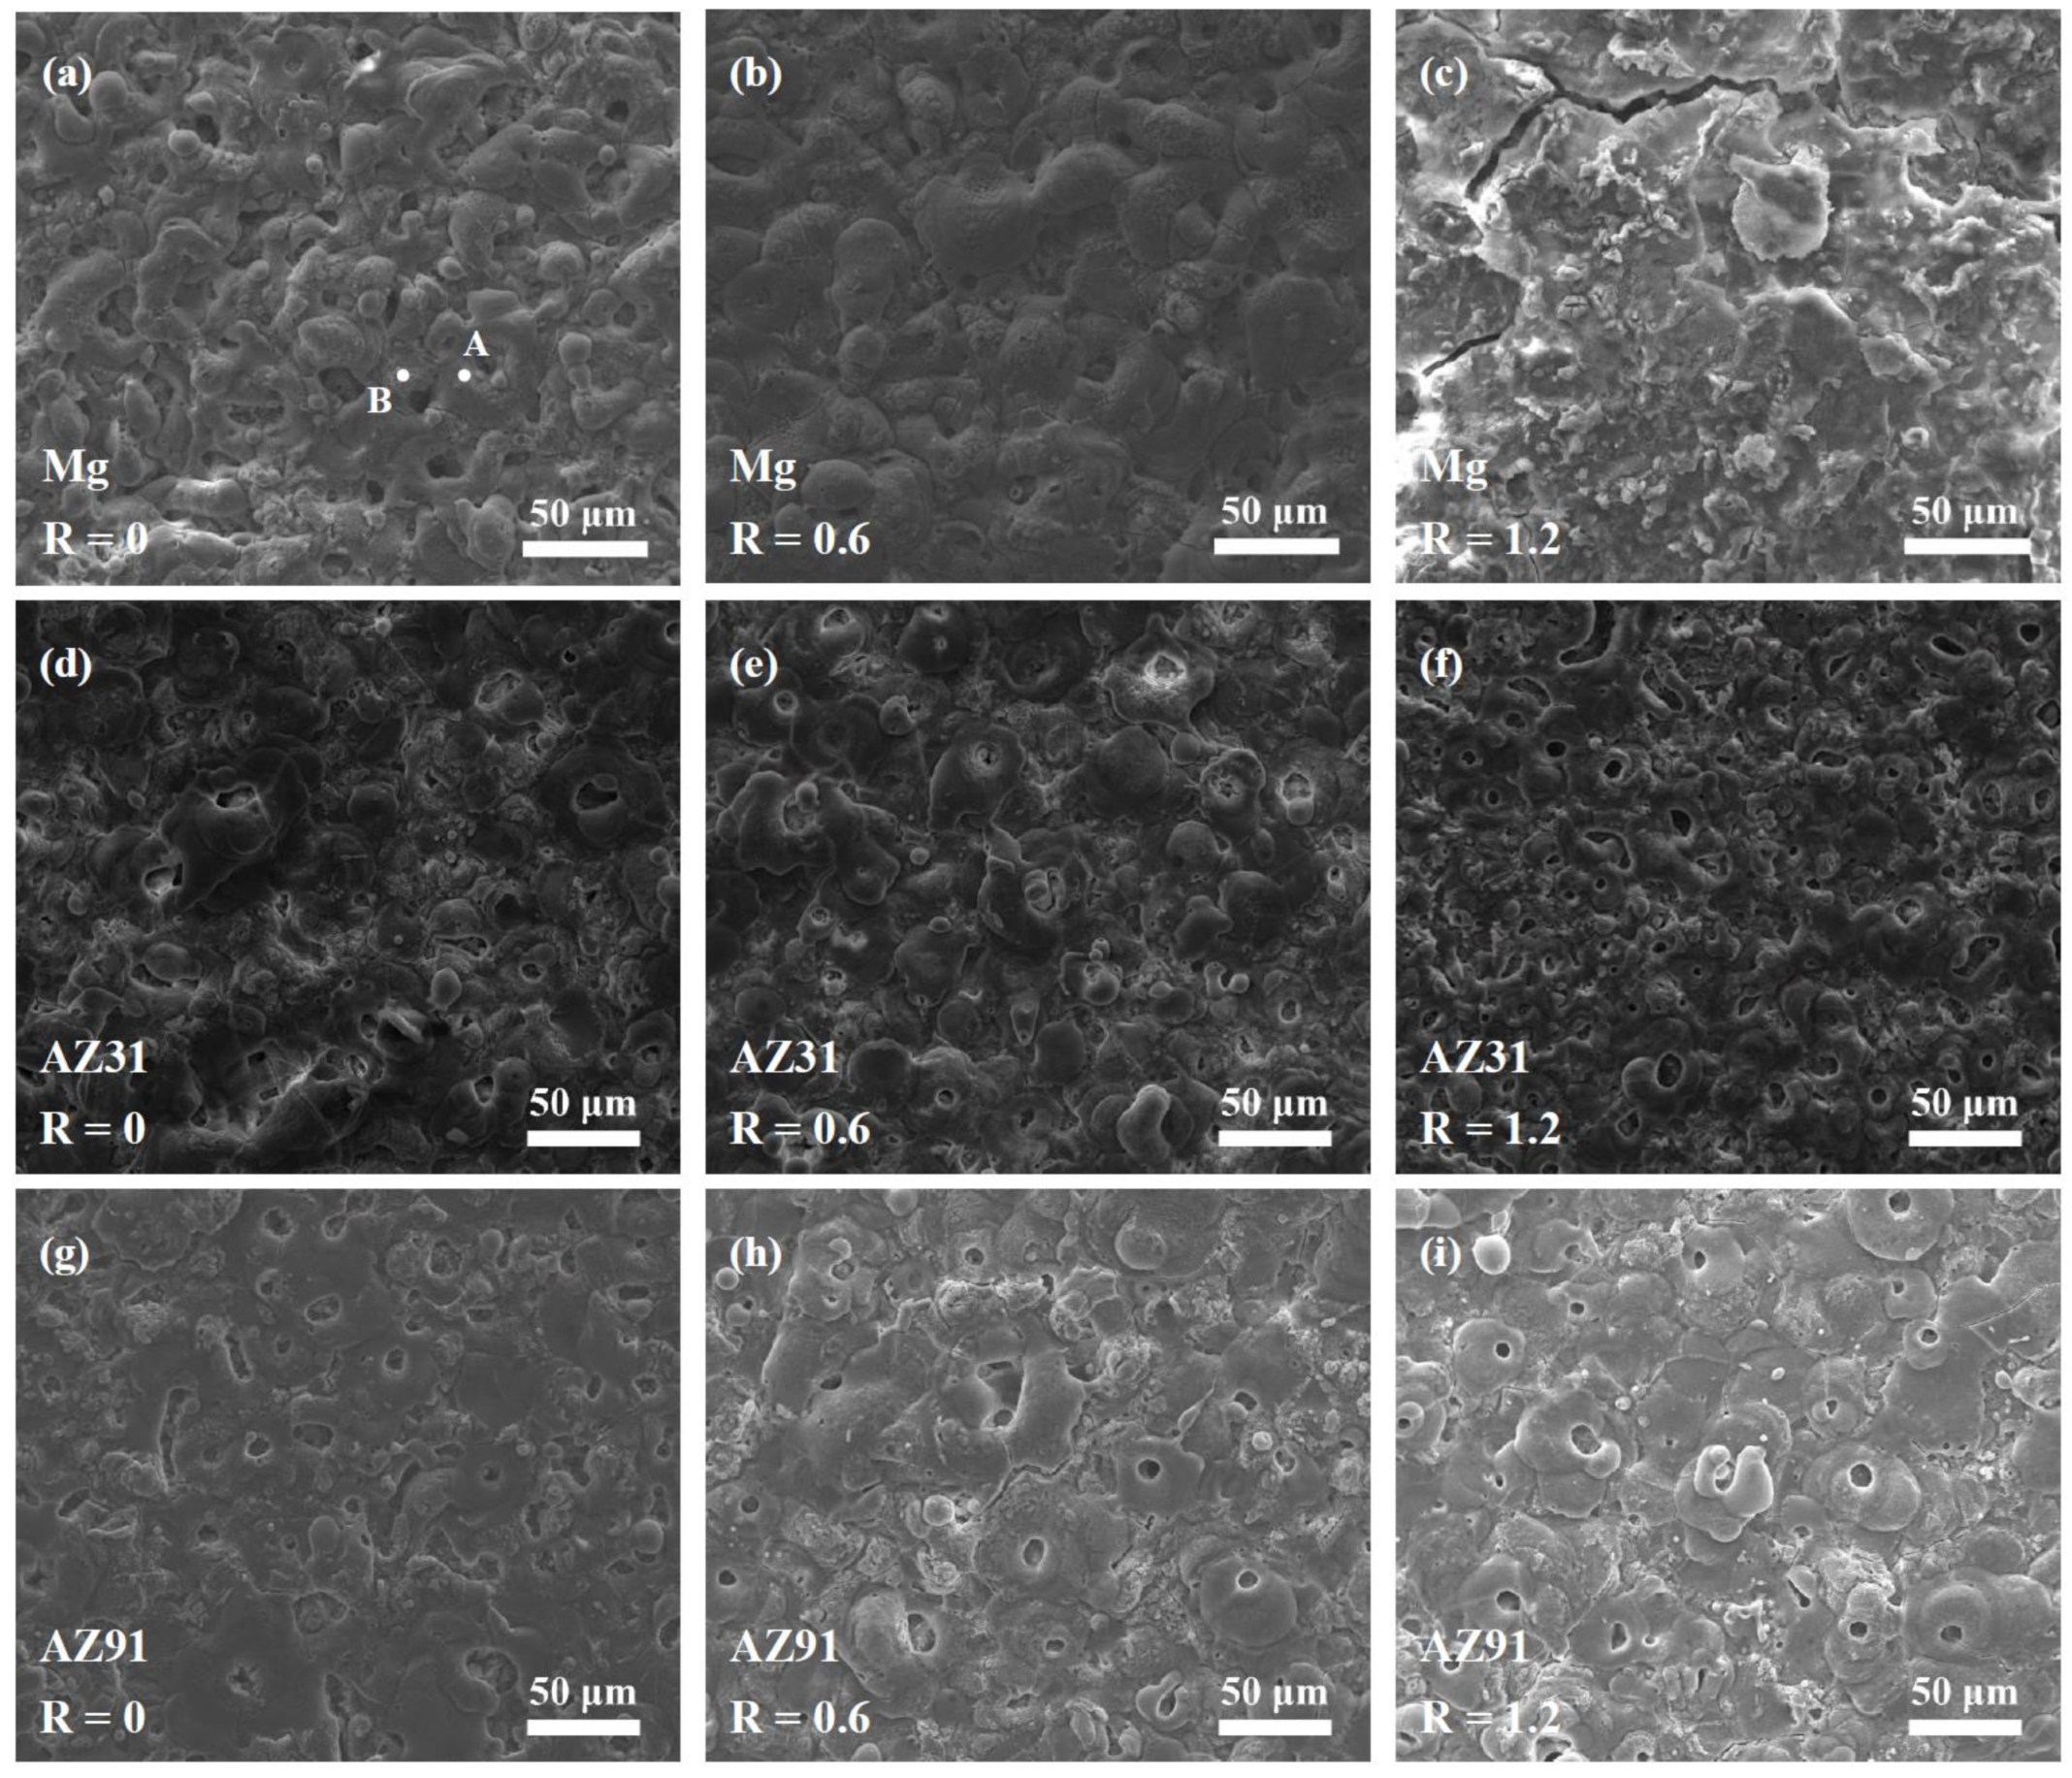
Figure 6 shows the surfaces of the coatings formed for 600 s at different R values on the pure magnesium and AZ31 and AZ91 magnesium alloys. It can be seen that at 600 s, the oxide coatings of the pure magnesium and AZ31 and AZ91 magnesium alloys exhibited similar morphologies in most conditions, with irregular or pancake-shaped solidified oxides distributed on the coating surfaces, and there were also many circular or irregular pores on the surfaces. Points A and B in
Figure 6a belong to the PEO coating of the pure magnesium formed under R = 0, and they represent the flat areas around a discharging pore and nodular feature, respectively. EDS analysis shows that point A has a composition of 34.3 wt% O, 48.4 wt% Mg and 15.6 wt% Si, whereas point B consists of 40.9 wt% O, 33.1 wt% Mg, 23.3 wt% Si and 1.5 wt% K. Therefore, the nodular feature (point B) has a higher Si content from the electrolyte than that of point A near the large pore. The high Mg content of point A indicates that the flat areas around the discharge pores are formed by the penetrating discharges from the substrate [
5]. Due to the high cathodic polarization (R = 1.2), the coating on the pure magnesium was damaged, as can be seen in
Figure 6c. However, the coatings formed under the same condition on the AZ31 and AZ91 alloys were undamaged (
Figure 6f,i).
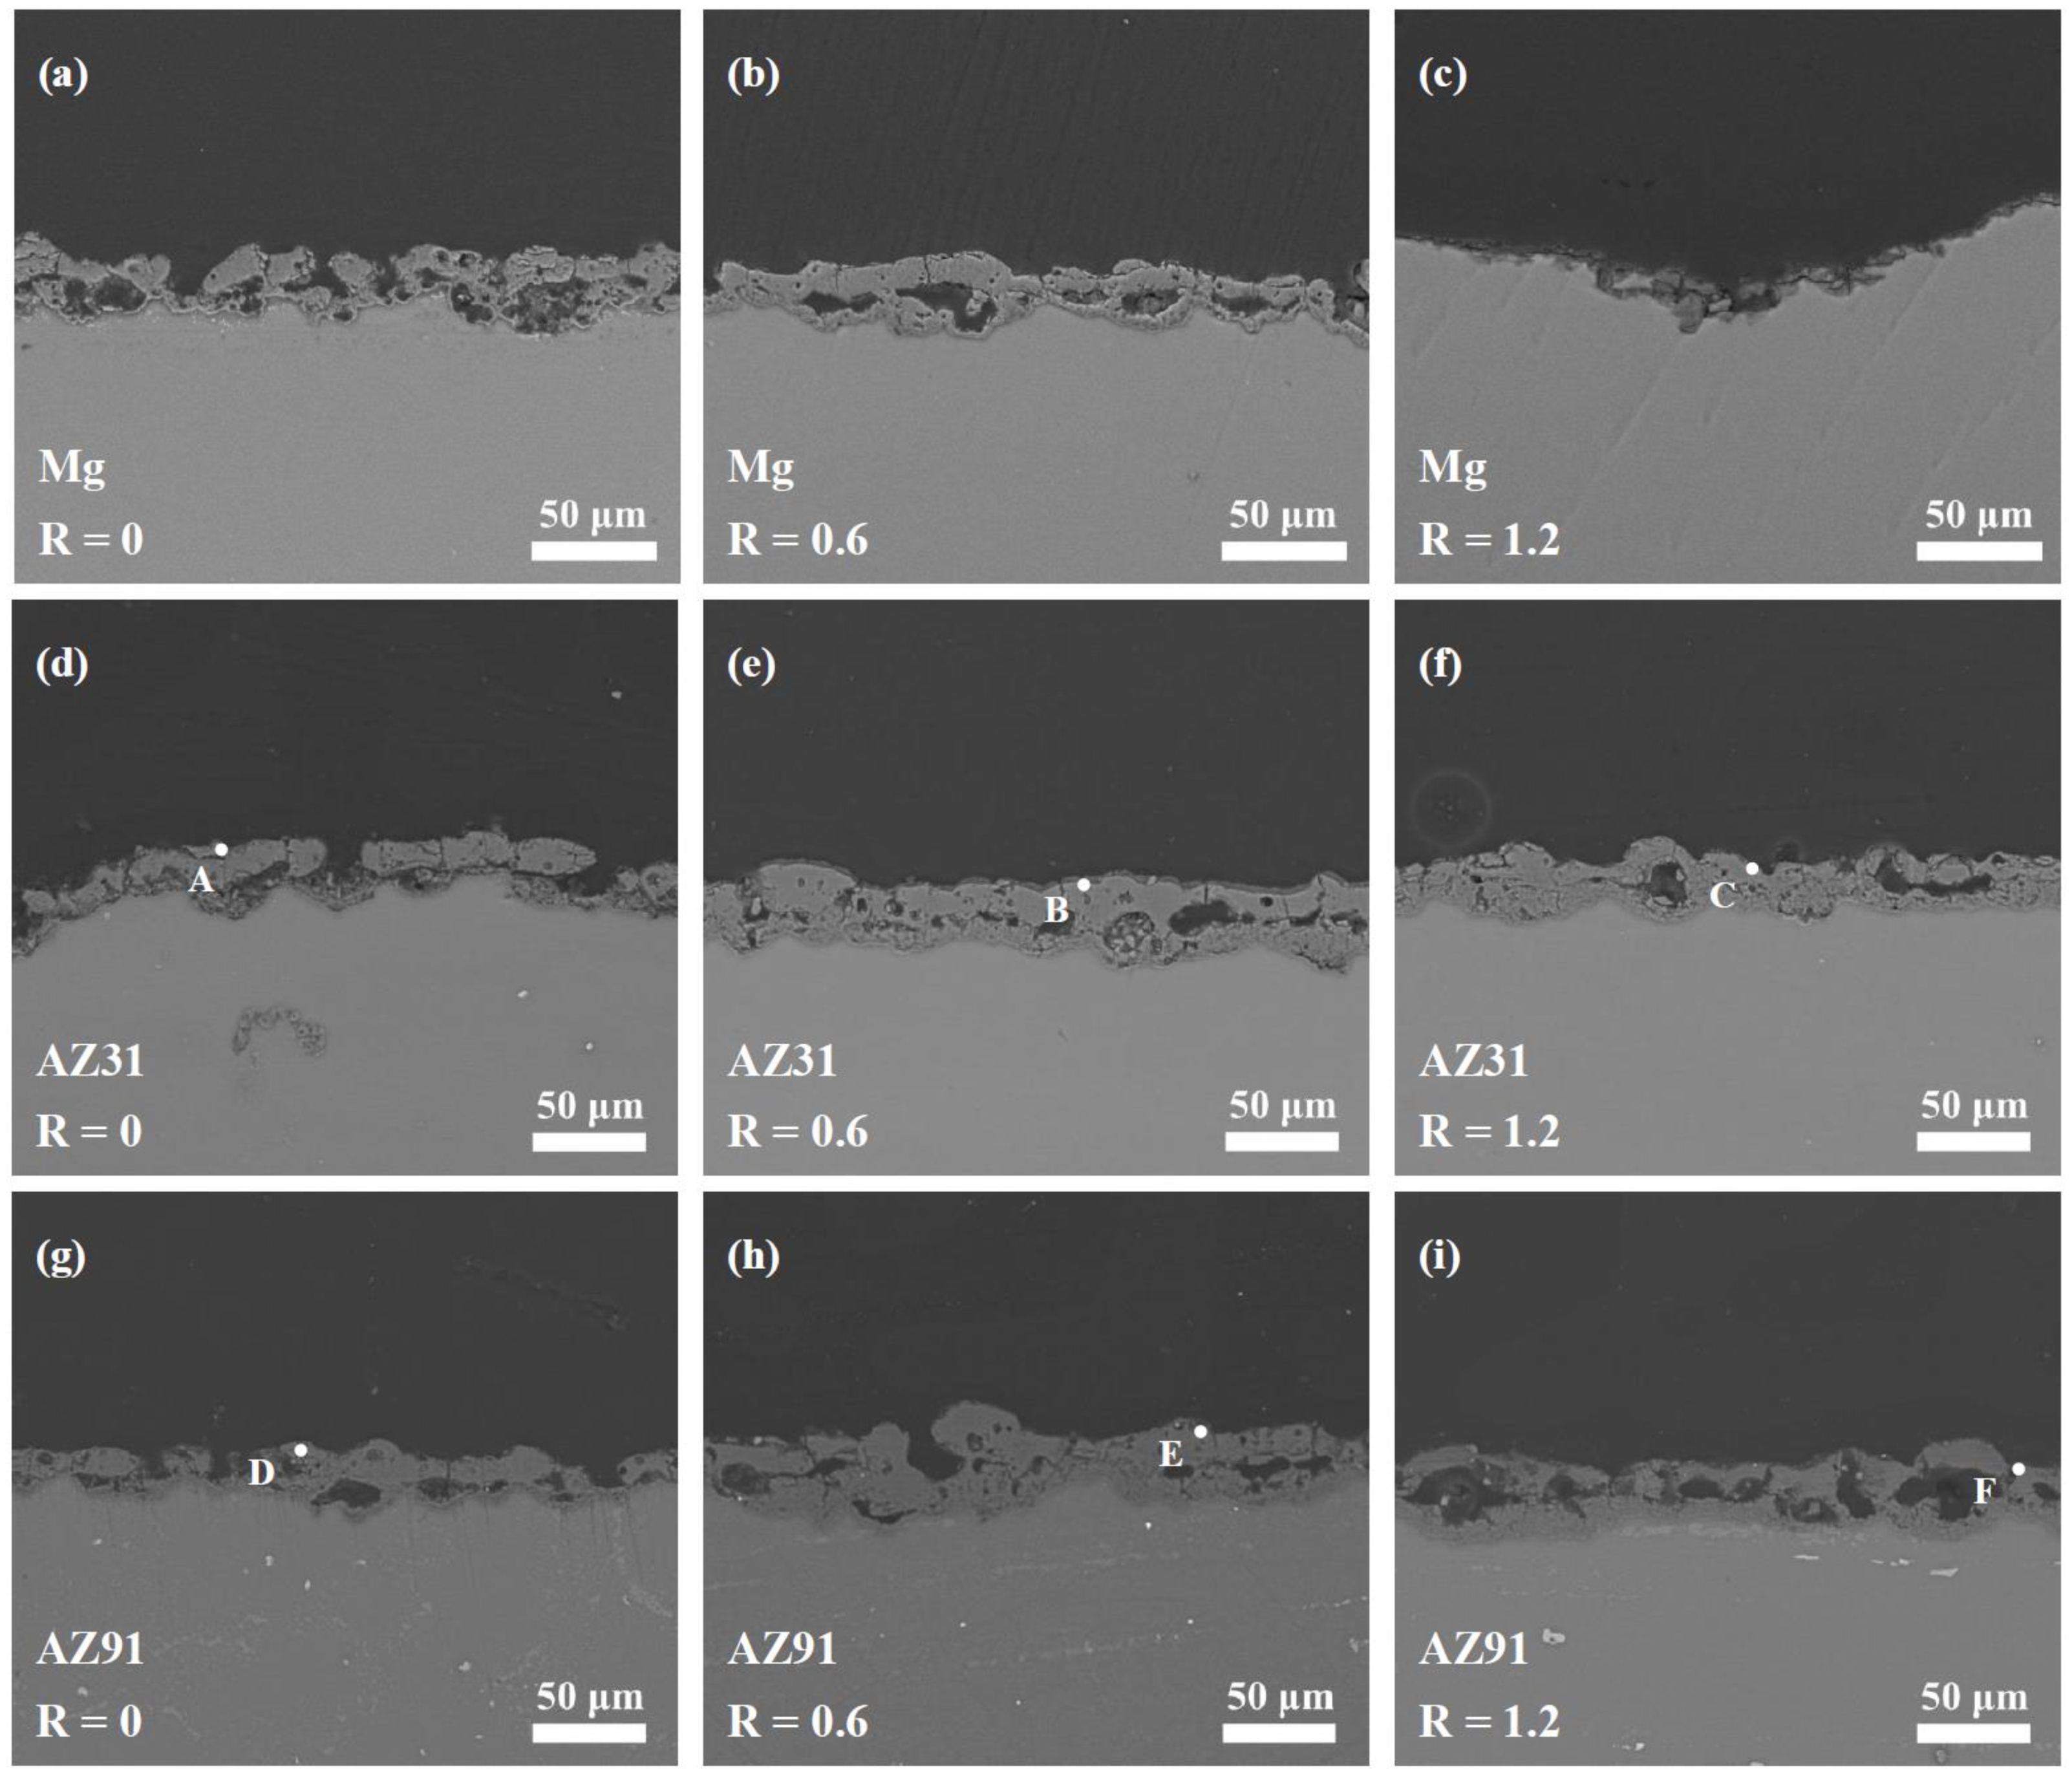
The cross sections of the coatings formed for 600 s on different samples are shown in
Figure 7. The cross sections show more and less pores as well as unevenness within the different samples. For the pure magnesium, the original coating peeled off at R = 1.2, only showing the remains of an inner coating (see
Figure 7c). EDS analyses were performed on the outer parts of the cross sections of the coatings on the AZ31 and AZ91 magnesium alloys. The results are listed in
Table 1. The results show that the Al content was present within the coatings on the AZ31 and AZ91 alloys, and a higher fraction of Al was found with the PEO coatings of the AZ91 magnesium alloy.
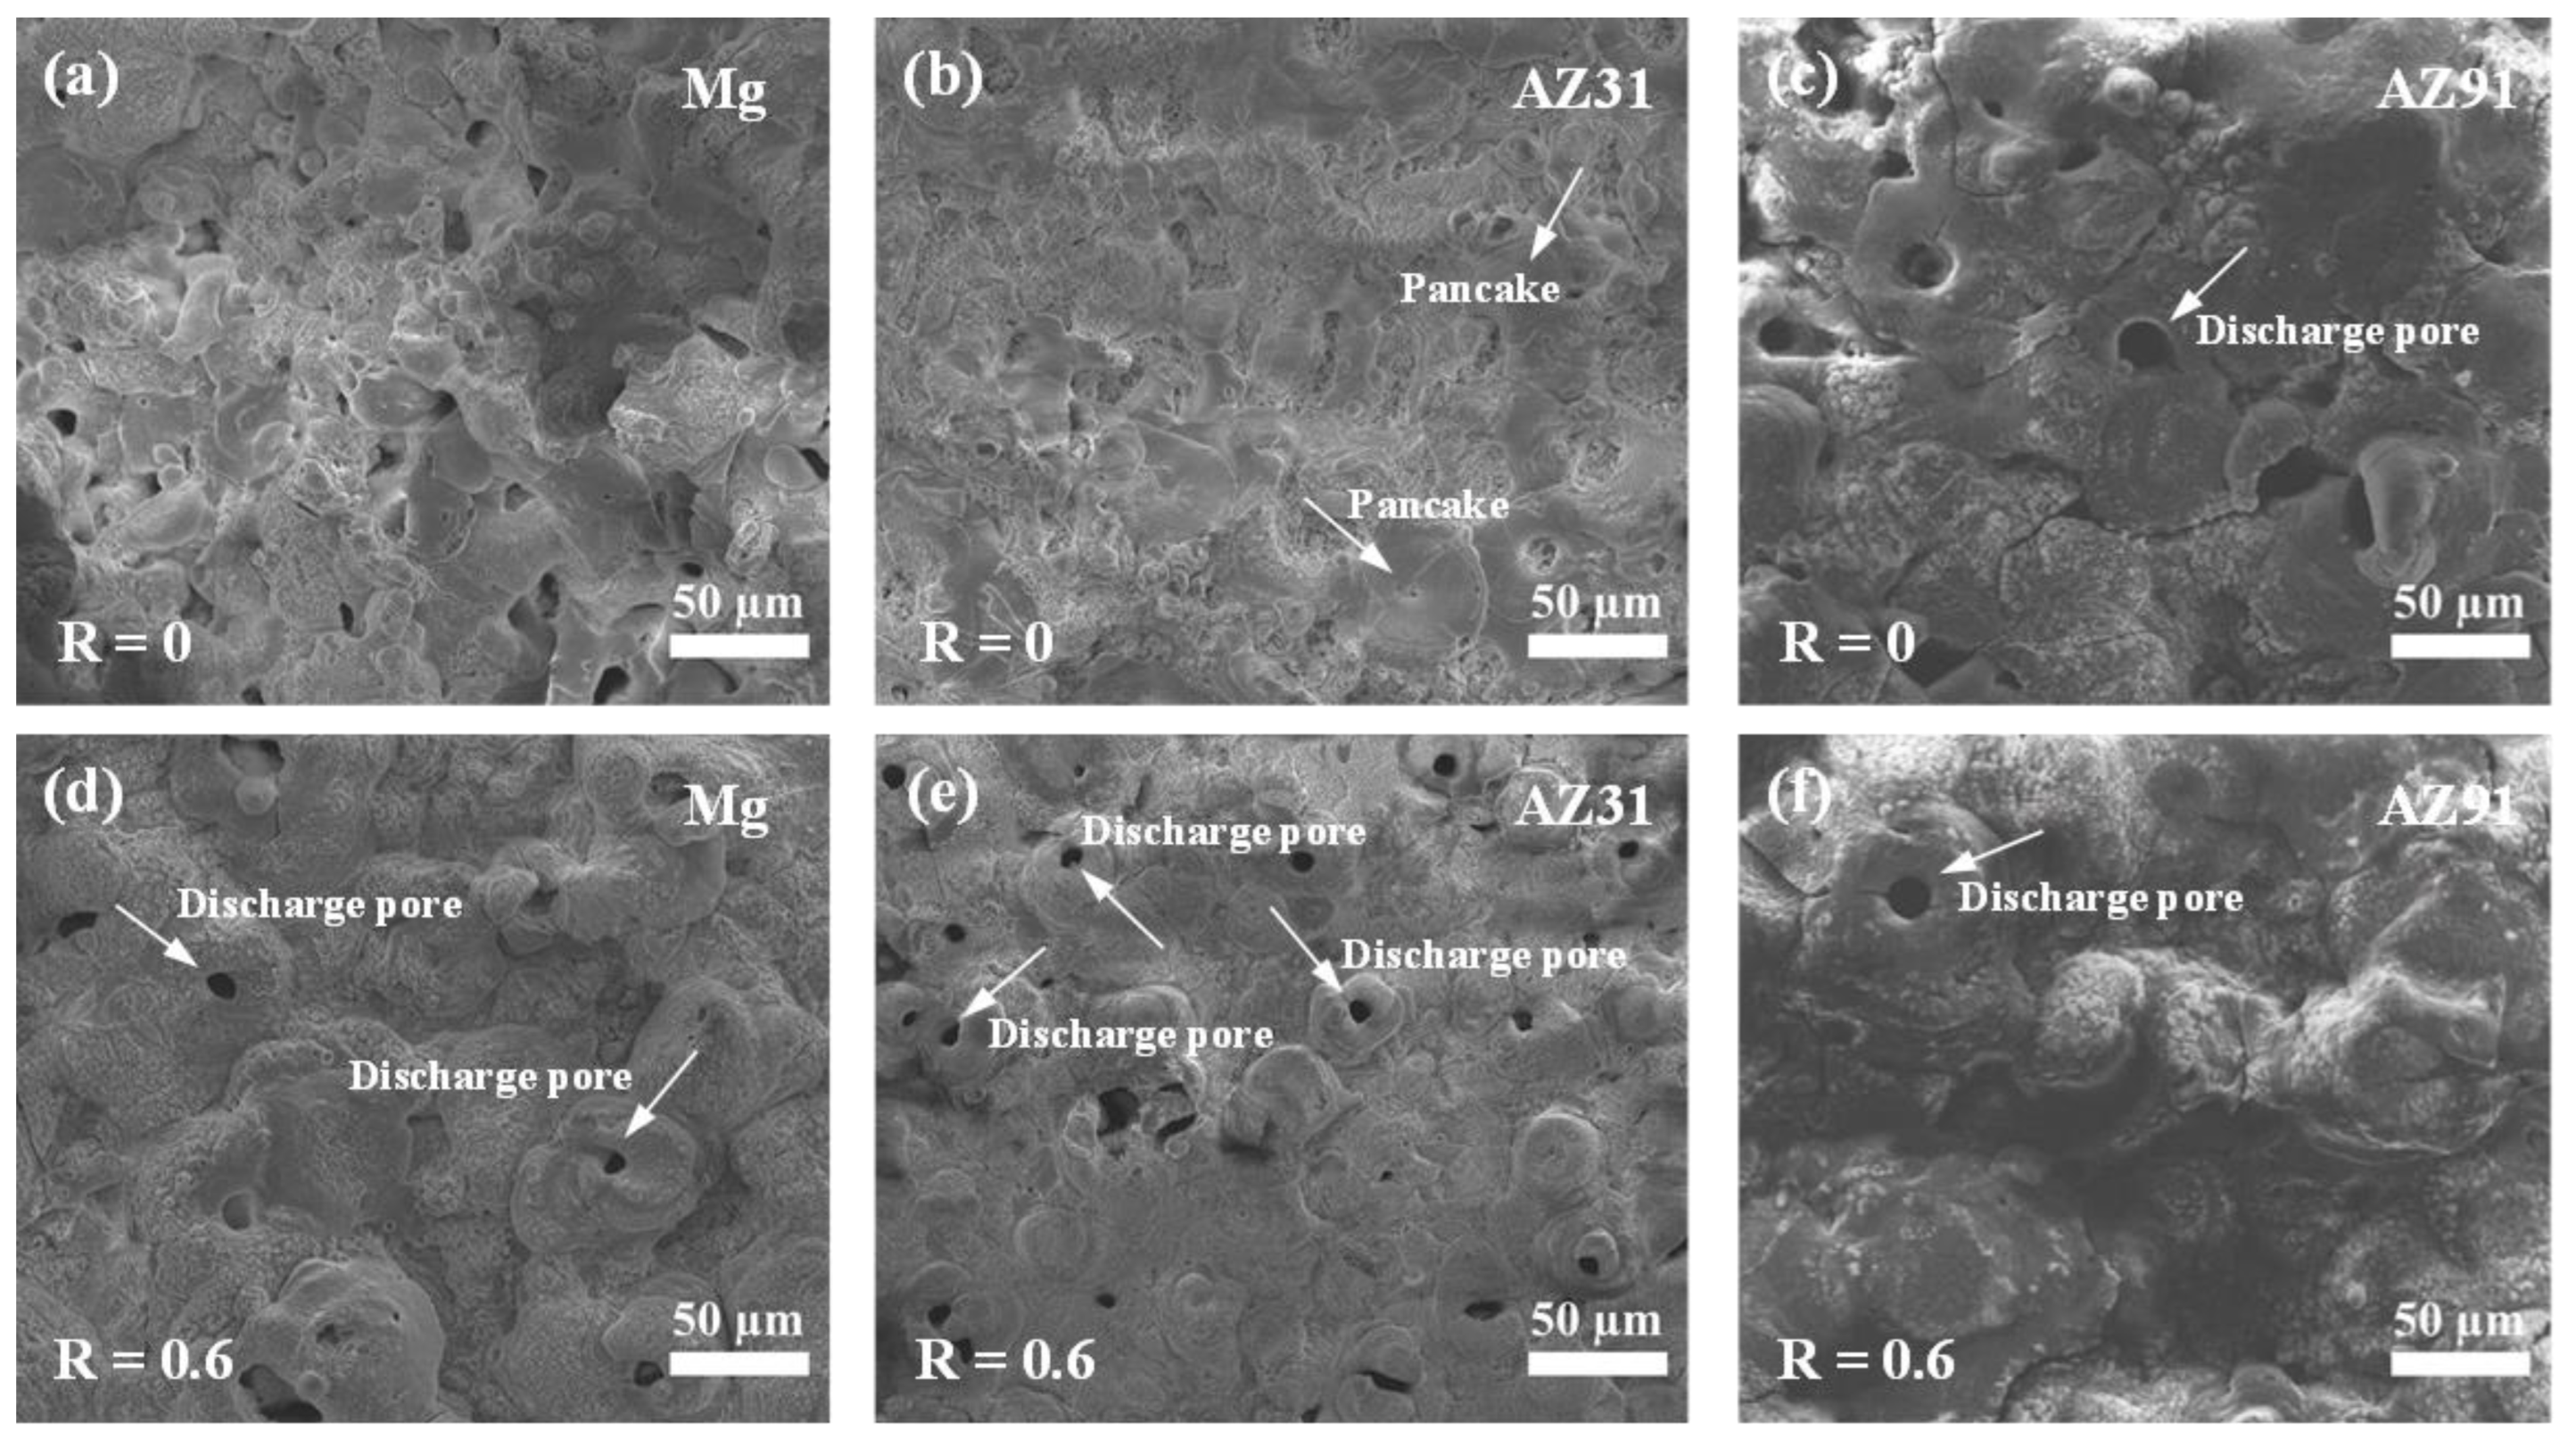
Figure 8 shows the surface morphologies of the coatings formed for 2400 s on different samples under the R ratios of 0 and 0.6. The surface roughness of the coatings is significantly increased compared to that at 600 s. Solidified oxides in irregular shapes are distributed on the surfaces of the coatings. There are a few pores on the surfaces of the coatings, and the numbers of pores are reduced compared with those coatings formed for 600 s. Some coatings have pancake- or crater-like morphologies on their surfaces, as indicated by the arrows in the figure. The pancake structure is more pronounced on the surfaces of the coatings formed at R = 0.6. These pancake structures are commonly encountered in PEO, which are caused by the repeated penetrating discharges during PEO [
5]. At the same time, the PEO process produces a large amount of gas, and the pores are believed to be caused by gas emissions from the PEO process [
5].
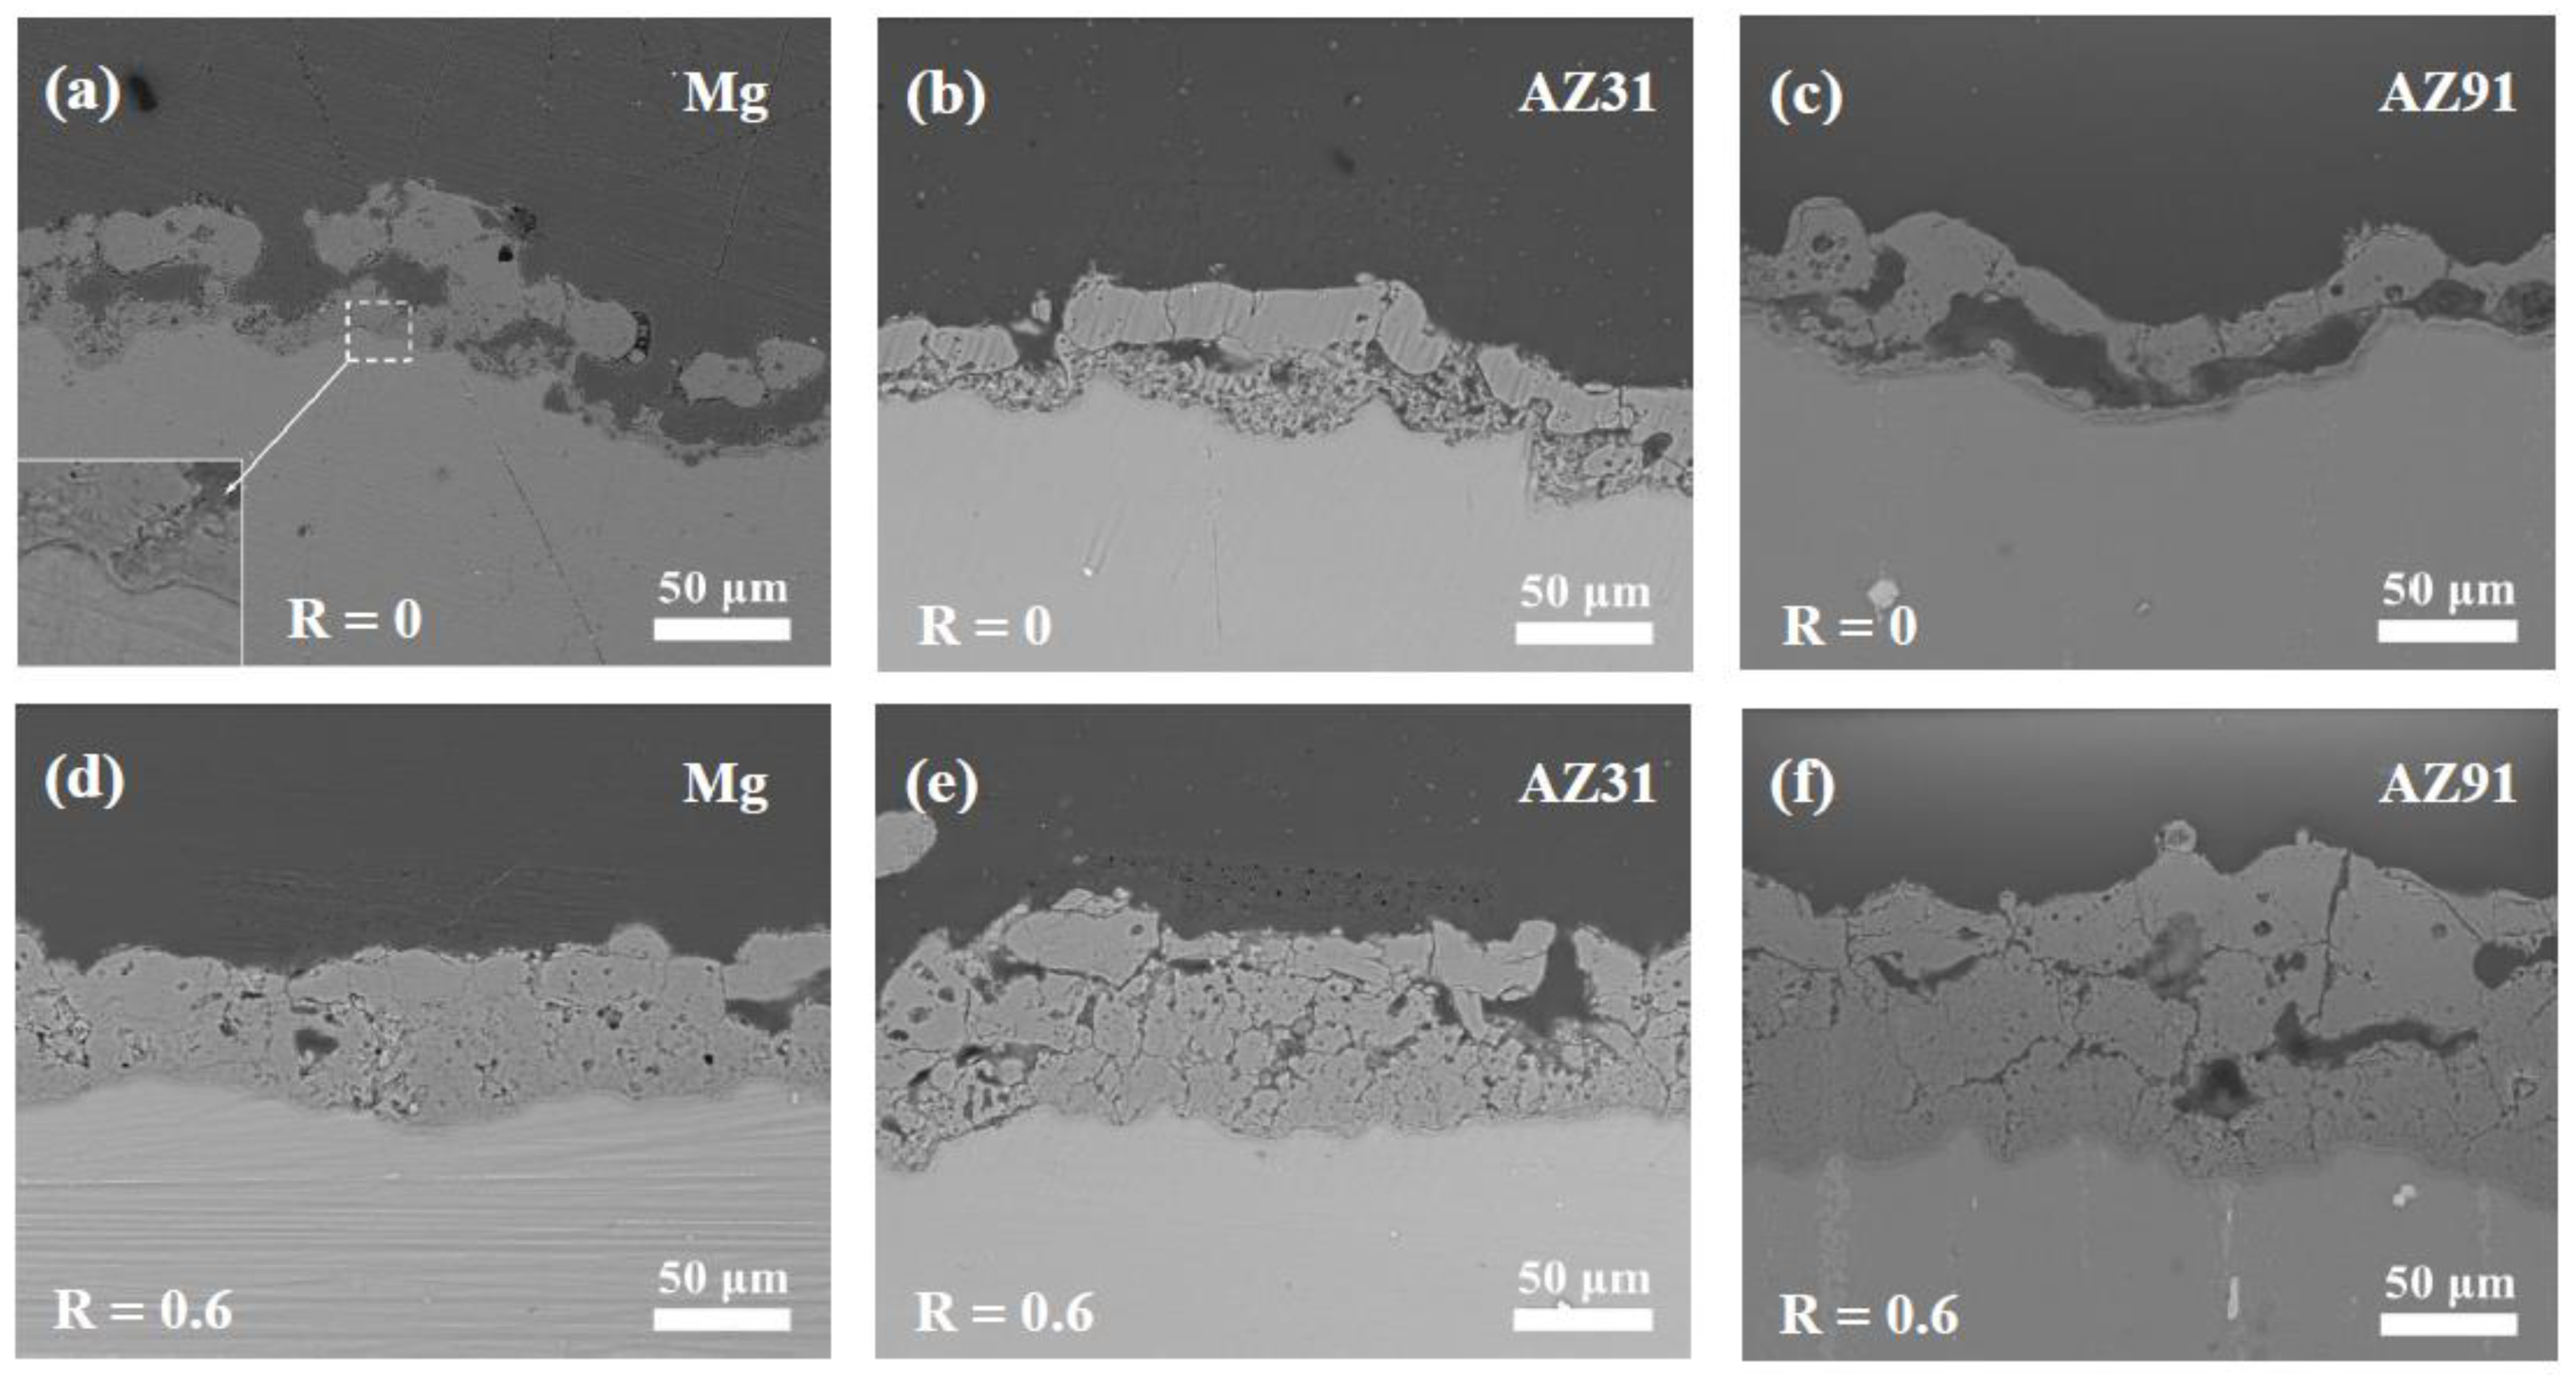
Figure 9 shows the cross sections of the coatings formed for 2400 s under R = 0 and 0.6 on the pure magnesium and AZ31 and AZ91 magnesium alloys. At R = 0, the coating thicknesses for the different samples were around 50 µm, and the uniformities of the coatings were poor. The coatings can be roughly divided into a thicker outer layer and an inner layer. Large, elongated pores are observed between the inner and outer layers of the coatings on the pure magnesium and AZ91 alloy. Significant undulations are observed with the coating/substrate interfaces for all coatings formed under R = 0. The enlarged view of the coating/substrate interface in
Figure 9a (the inset) indicates the presence of a dense barrier layer. This barrier layer is often mentioned in the literature, and it can provide the main corrosion resistance for PEO coatings [
61,
62]
After applying cathodic polarization (R = 0.6), the thicknesses and uniformities of the coatings were significantly improved (see
Figure 9d–f). The coating thicknesses were 71.9, 89.3 and 128.9 µm for the pure magnesium and AZ31 and AZ91 magnesium alloys, respectively.
Uniform PEO coatings could be formed for longer times on the AZ91 magnesium alloy up to a high R ratio of 3.2.
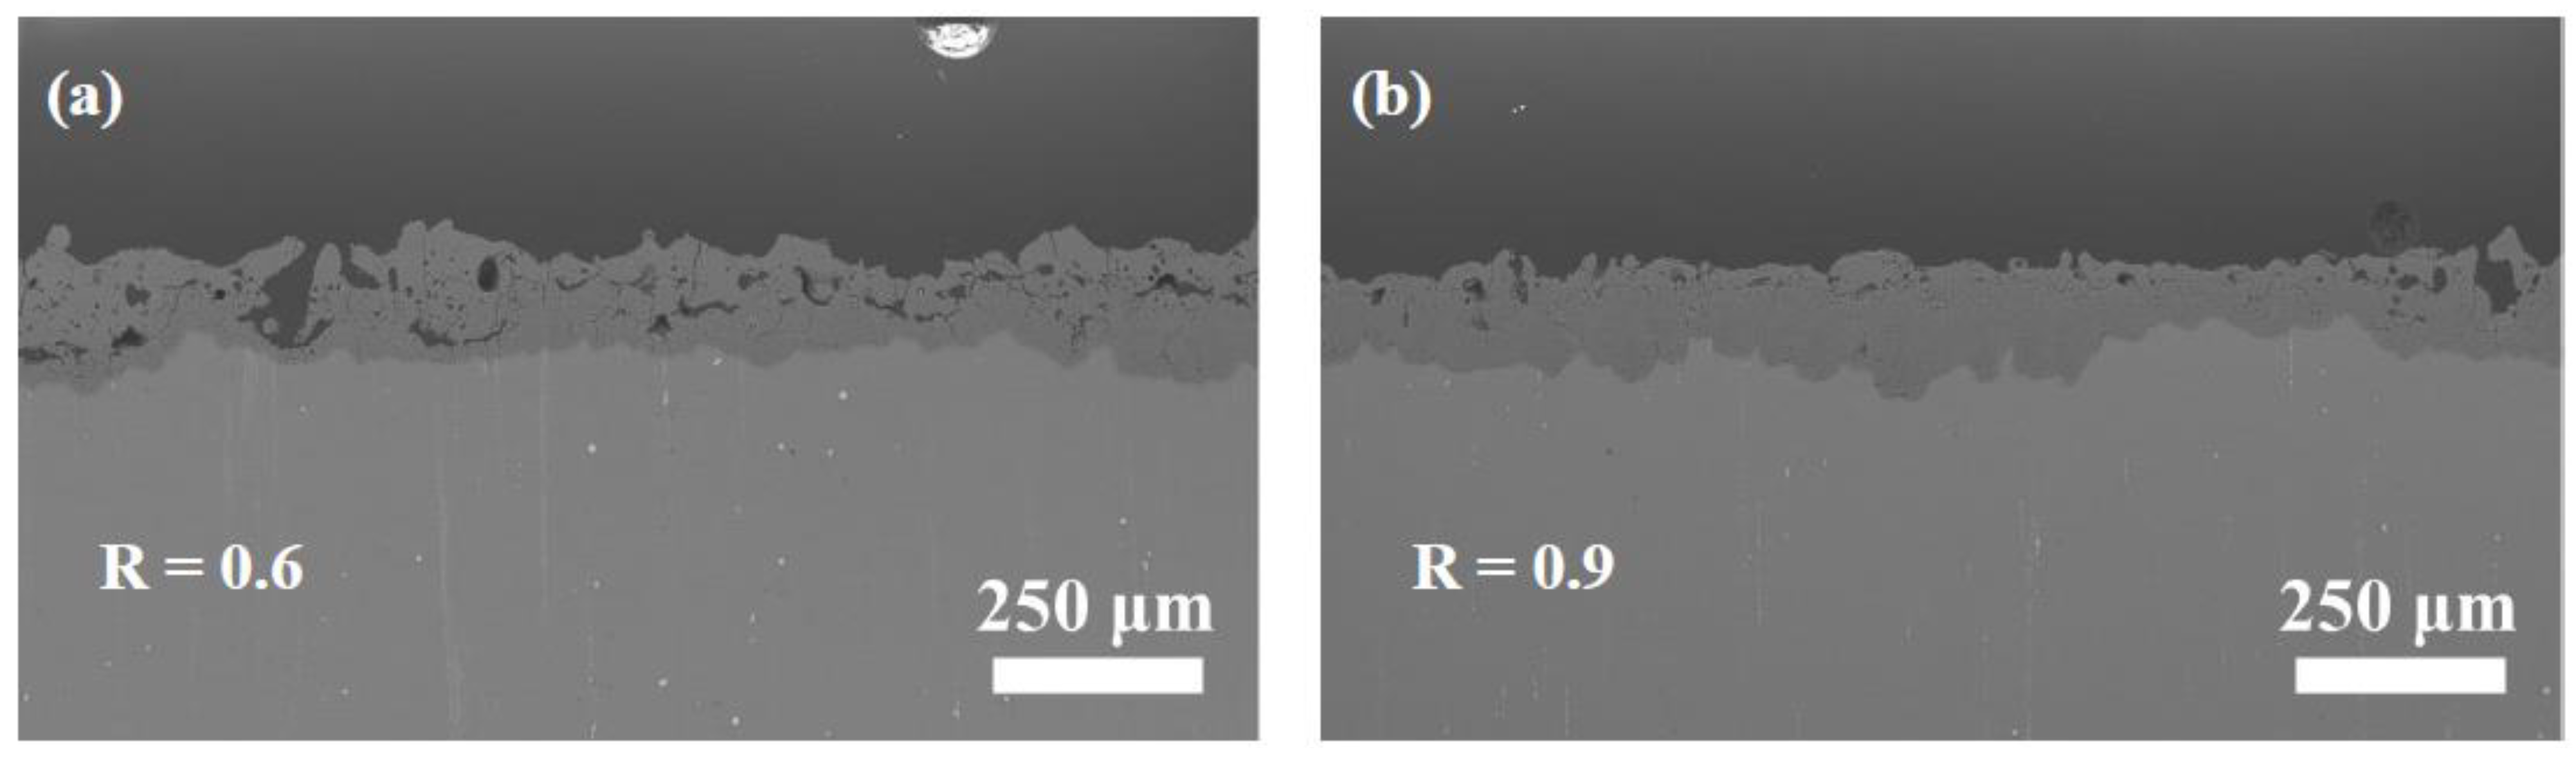
Figure 10 compares the cross sections of the coatings formed for 2400 s under R = 0.6 and R = 0.9. The coatings formed under R = 0.6 have a few elongated pores within the cross section. However, the elongated pores are significantly reduced within the cross section under R = 0.9. Therefore, a higher R is beneficial for the growth of denser coatings with fewer defects on AZ91 magnesium alloy.
3.7. XRD
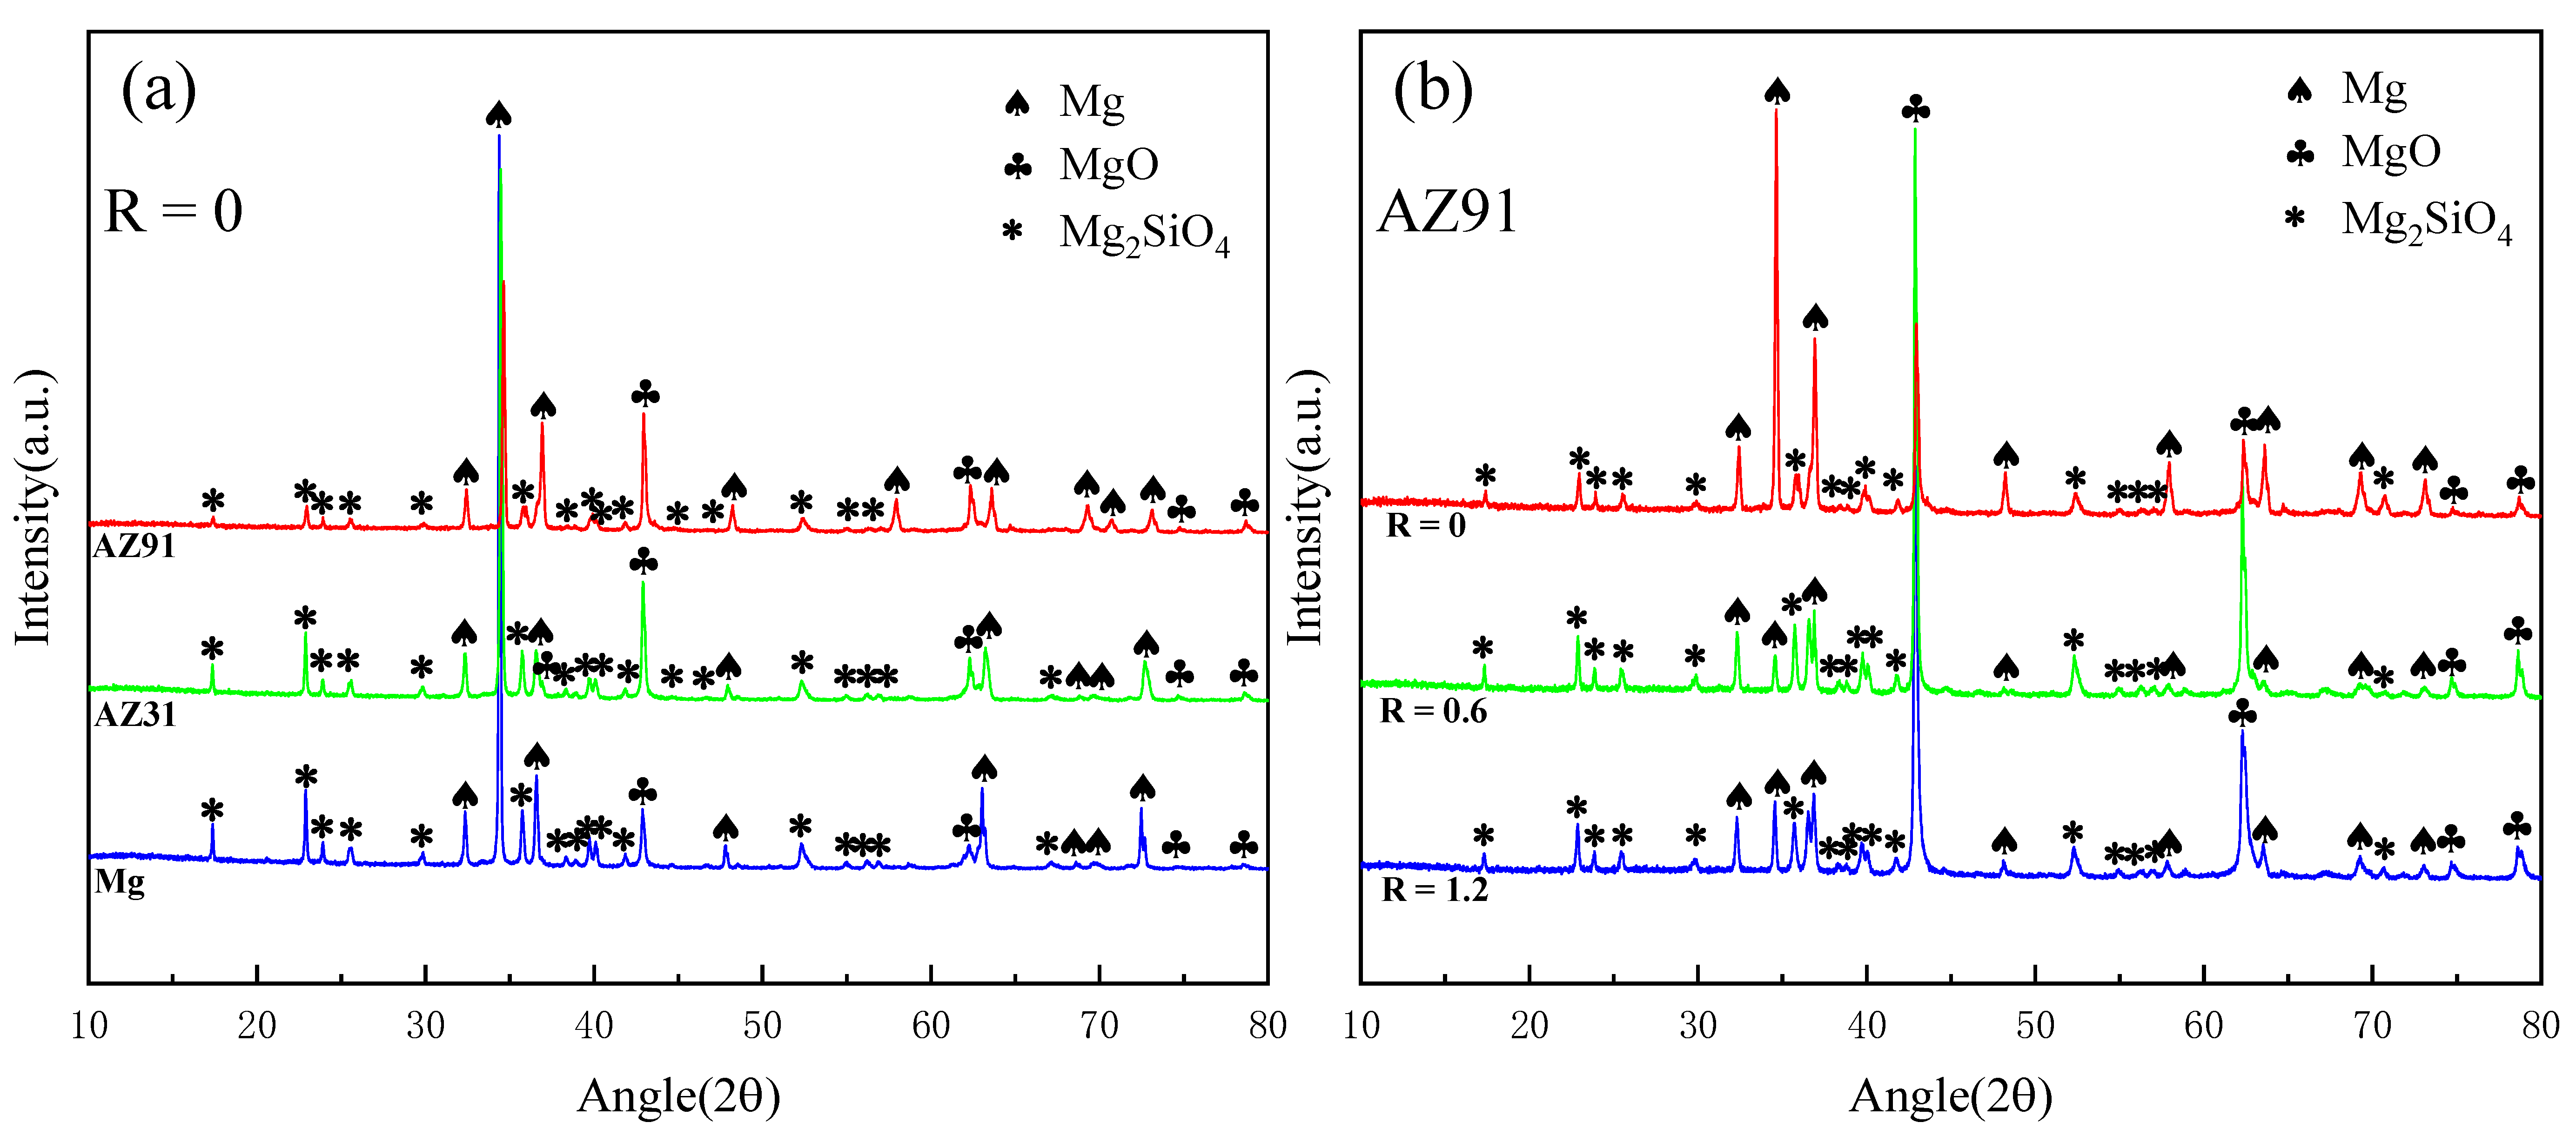
Figure 11a shows the XRD patterns of the PEO coatings on the pure magnesium and AZ31 and AZ91 magnesium alloys formed for 2400 s under R = 0, whereas
Figure 11b compares the XRD patterns of the PEO coatings on the AZ91 magnesium alloys formed for 2400 s with different R values. According to
Figure 11a, the phase compositions for the three samples were nearly the same, consisting of mainly MgO and Mg
2SiO
4. Perhaps due to the low content of aluminum, no XRD diffraction peaks related to the species of Al were found for the PEO coatings formed on the AZ31 and AZ91 magnesium alloys. The diffraction peaks of Mg are clearly seen on the XRD patterns of all the PEO coatings, which can be attributed to the fact that X-rays penetrated the thin and porous coatings during the examination.
Figure 11b shows that the phase compositions of the coatings formed on the AZ91 magnesium alloy under R = 0.6 and R = 0 were the same as that of the coating formed without the application of cathodic polarization (R = 0), except for increased diffraction peaks for Mg
2SiO
4 and MgO on the former coatings. The result shows that cathodic polarization did not alter the phase compositions of the coatings. The reduction in the intensity of the Mg peaks in the XRD patterns at R = 0.6 and 1.2 is due to the formation of thicker and denser coatings after the application of cathodic polarization.
3.8. Growth Regularity
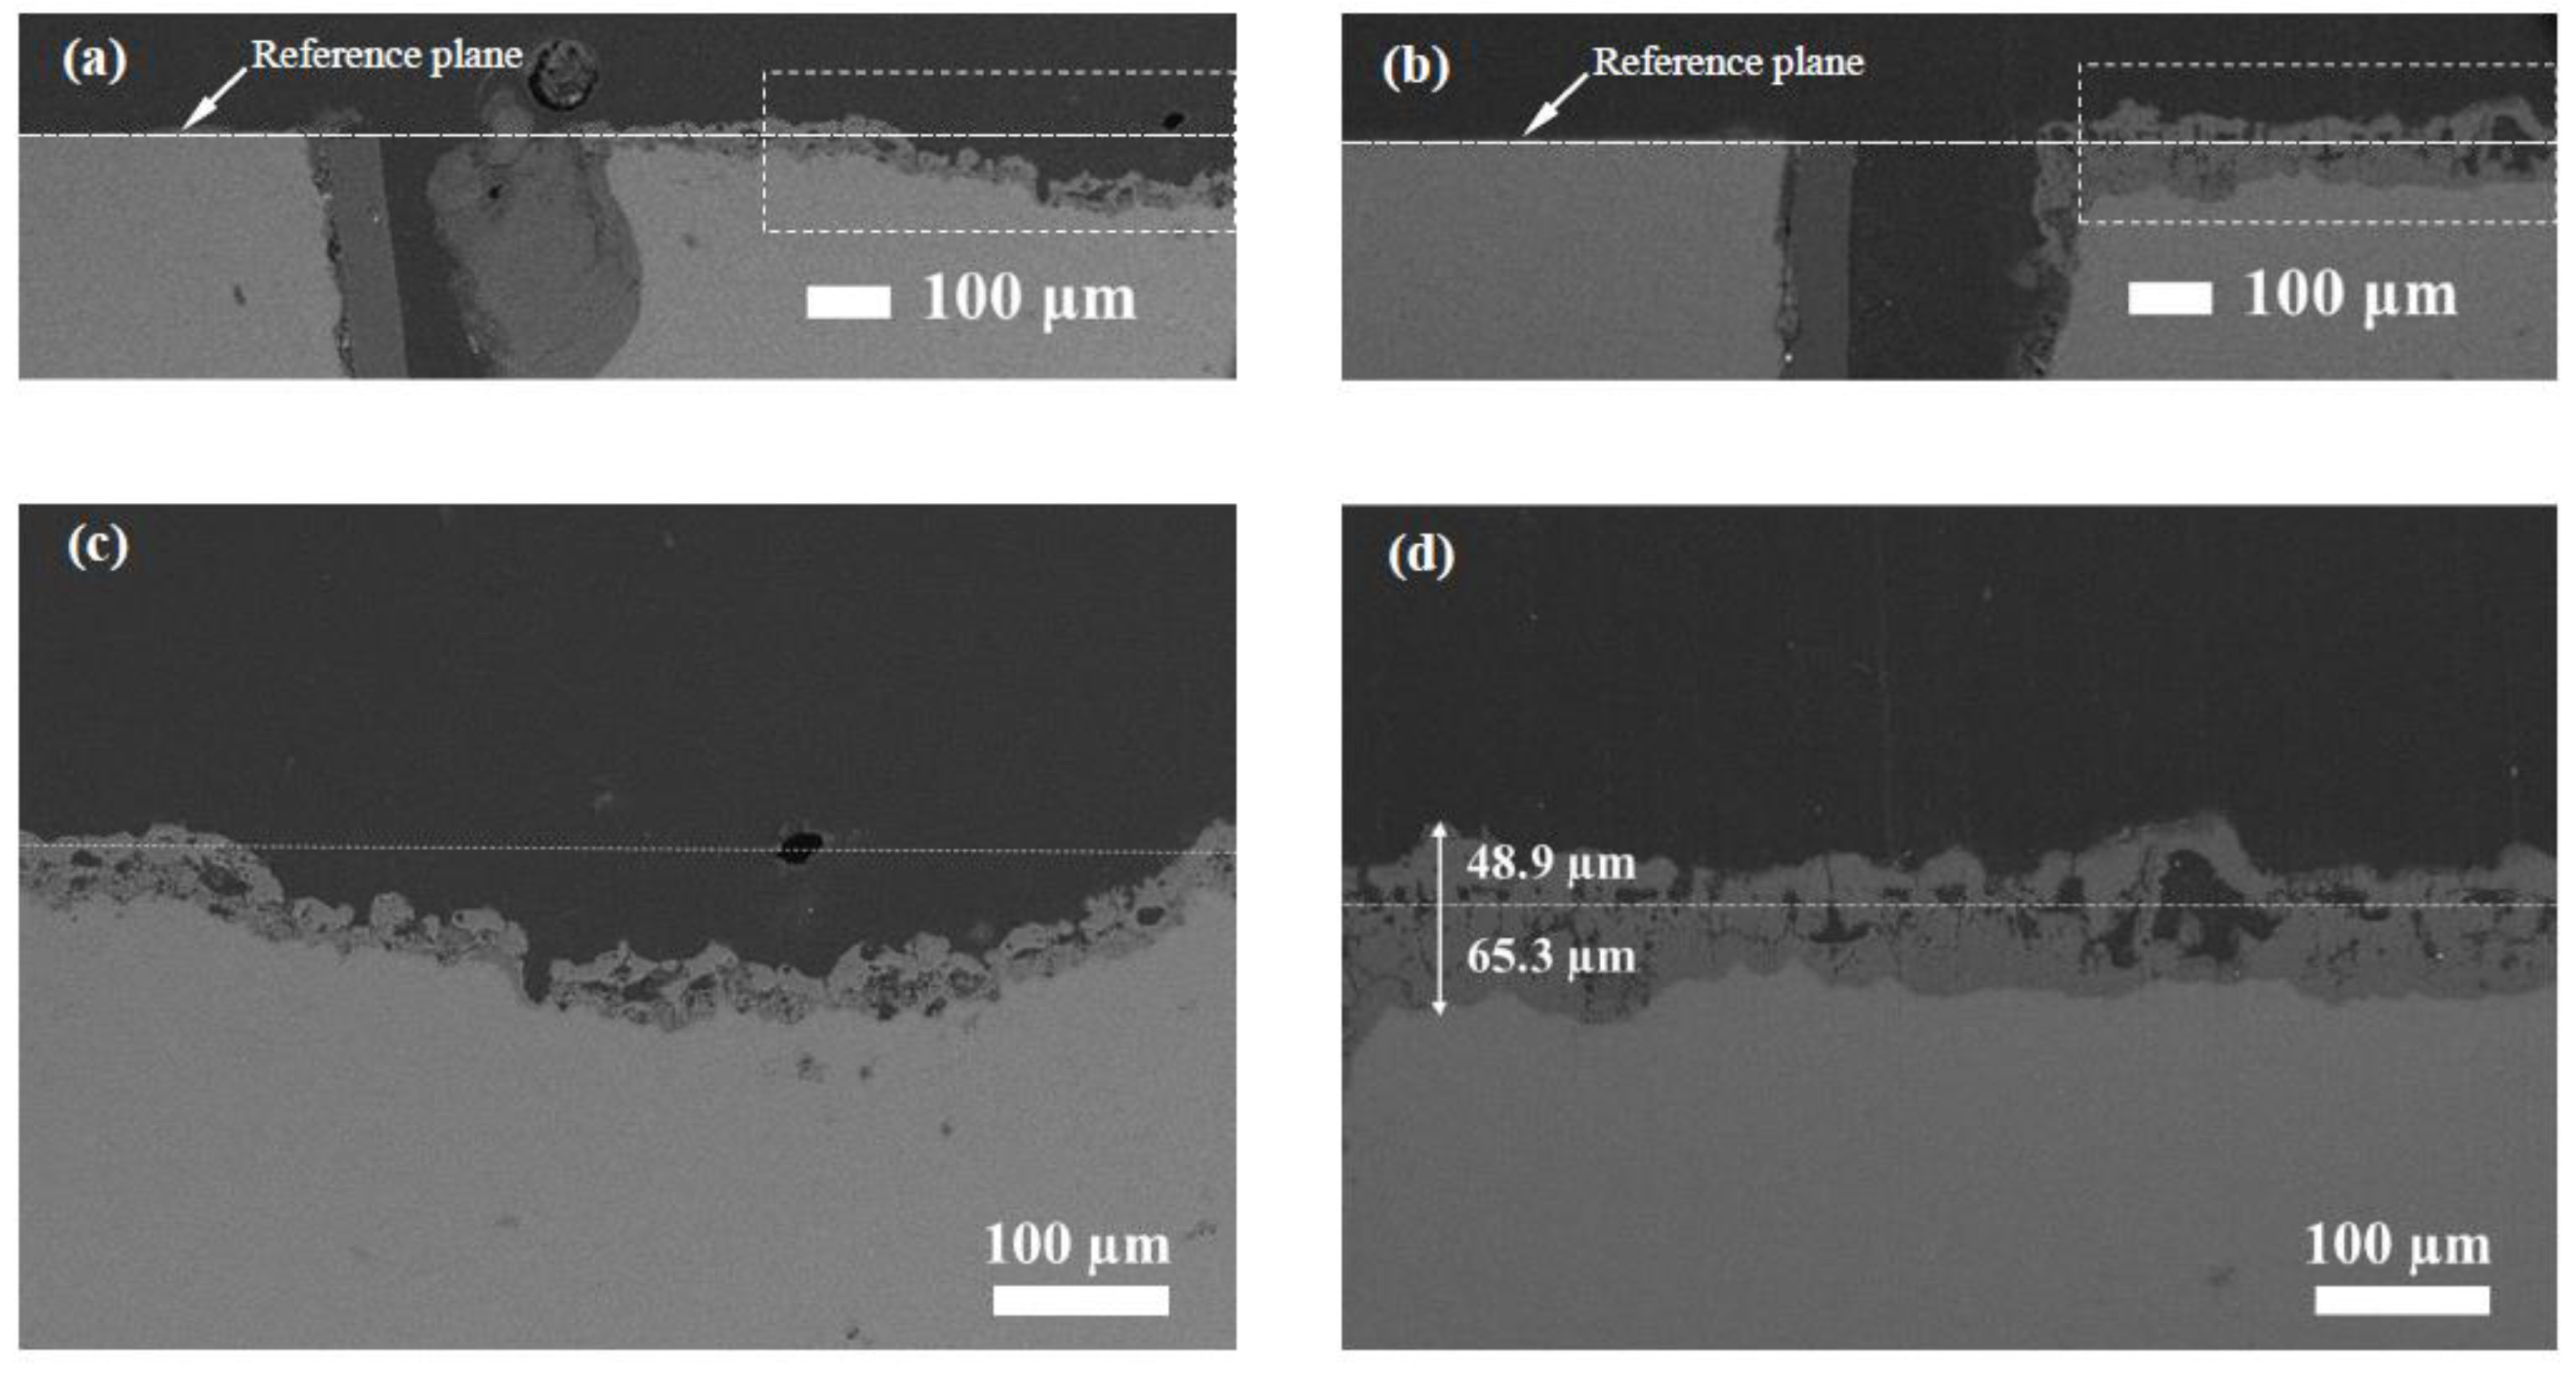
Figure 12 depicts the effect of cathodic polarization on the growth regularity of the PEO coatings on the pure magnesium.
Figure 12a,b show the cross sections of the coatings formed for 2400 s at R = 0 and R = 0.6. A piece of un-oxidized magnesium adjacent to the left side of the PEO coatings is served to show the original surface prior to oxidation. From
Figure 12(a), it can be seen that for the sample prepared at R = 0, a large-sized pit was formed not far from the left sample edge. The enlarged image in
Figure 12c shows that the size of the pit is ~550 µm. This feature should correspond to the macroscopic pits observed in
Figure 4. The oxide-coating thickness on the surface of the sample at R = 0 is ~37 µm, evenly covering the sample surface, including the surfaces of the pits. According to
Figure 12c, even for the oxide coating at the left edge, most of the coating is located below the original sample surface, indicating that the coating basically grew inward.
After the application of the cathodic current, the uniformity and thickness of the coating were significantly improved, and no pits similar to those at R = 0 were found with the cross section at R = 0.6. From
Figure 12b,d, it can be seen that the coating formed at R = 0.6 grew both outward and inward, with an outward growth of approximately 48.9 µm and an inward growth of ~65.3 µm.
3.9. Polarization Curves
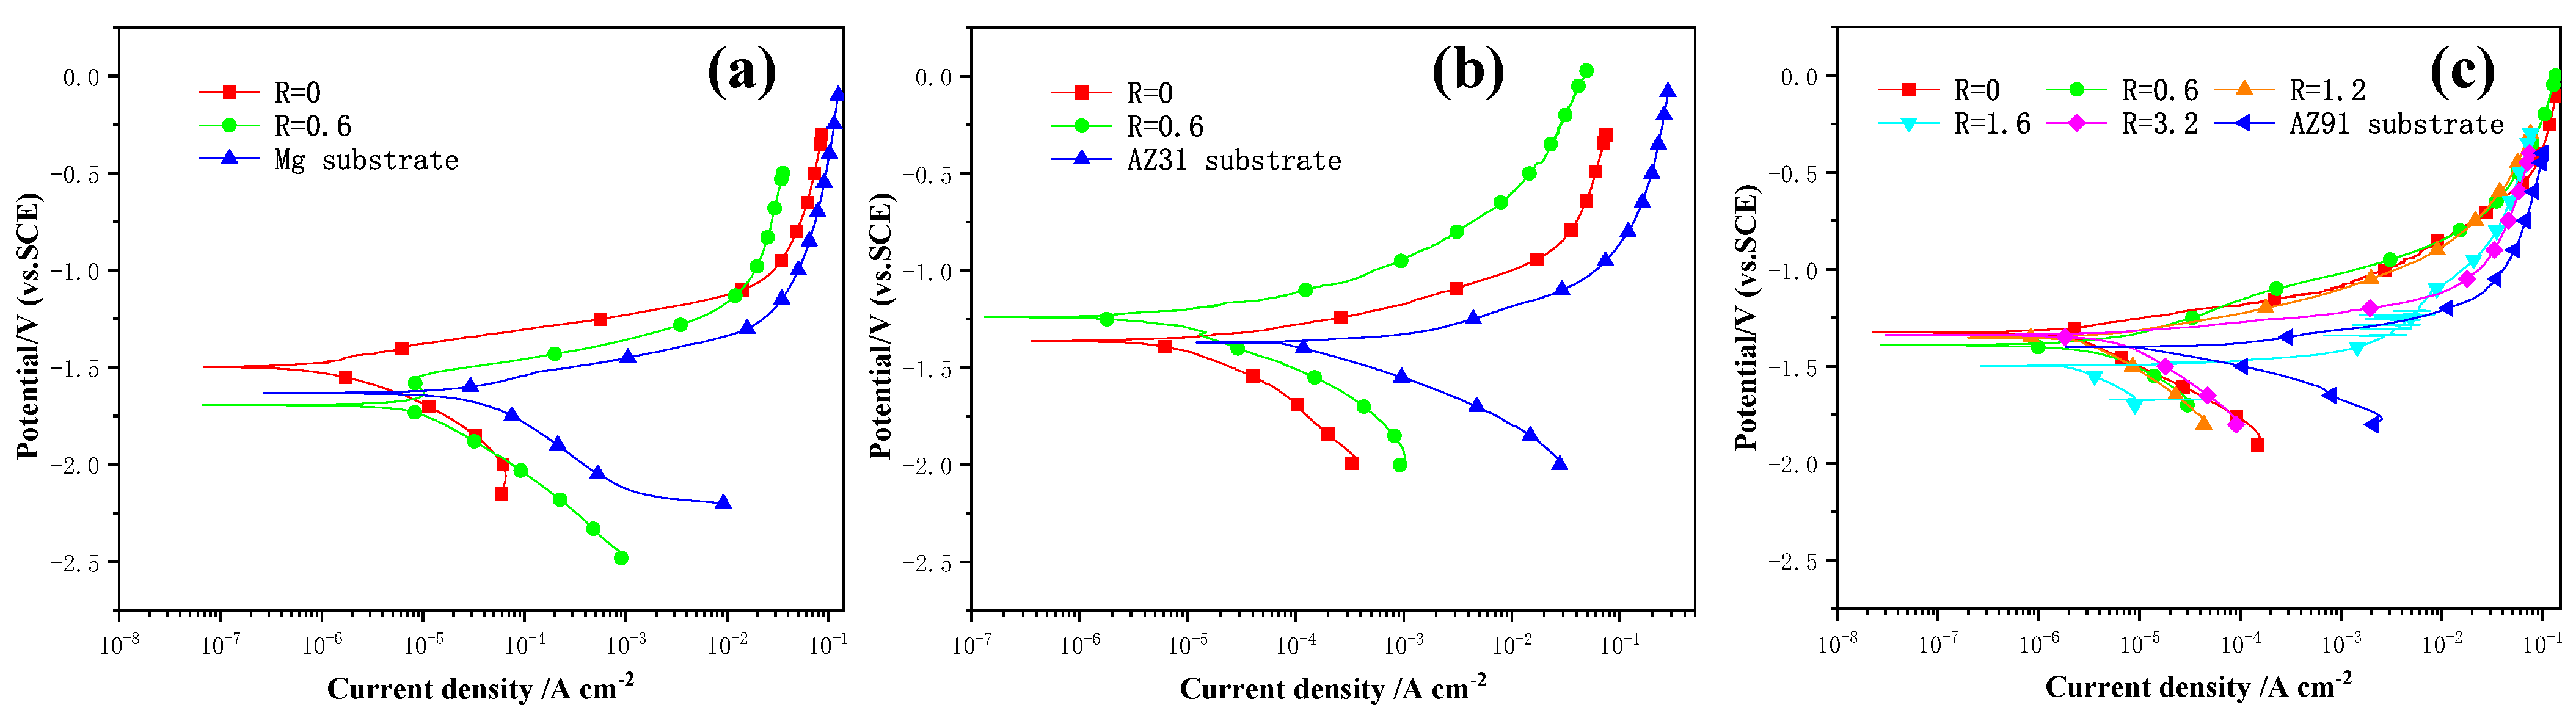
Figure 13 shows the polarization curves tested in a 3.5 wt% NaCl solution for the pure magnesium and AZ31 and AZ91 magnesium alloys and their PEO coatings formed in the dilute silicate electrolyte for 2400 s at different R values. The parameters of the corrosion potential (E
corr) and free-corrosion current density (I
corr) are listed in
Table 2. The values of the E
corr were read from the inversion points on the polarization curves, while the corrosion current densities were obtained via the Tafel extrapolation method.
According to
Table 2, the E
corr values of the pure Mg and AZ31 and AZ91 magnesium alloys are −1.625, −1.371 and −1.398 V (vs. SCE), respectively, indicating that the corrosion potential was improved after the addition of the alloying elements. The standard equilibrium electrode potentials for Mg and Al are −2.34 and −1.67 V (vs. SHE), respectively. Therefore, it is not surprising that the AZ31 and AZ91 magnesium alloys had higher corrosion potentials than that of the pure magnesium. Samples with more positive corrosion potentials usually indicate less of a thermodynamic tendency towards corrosion. It is also noted from
Figure 13 that the PEO treatment normally led to improved corrosion potentials for the samples. However, the coating formed on the pure magnesium at R = 0.6 and the coating formed on the AZ91 magnesium alloy at R = 1.6 exhibited lower corrosion potentials compared with the untreated metal. In our recent work, PEO coatings formed on tantalum under high cathodic polarization also exhibited considerably lower corrosion potentials, which was attributed to the incorporation of hydrogen species or cations [
63].
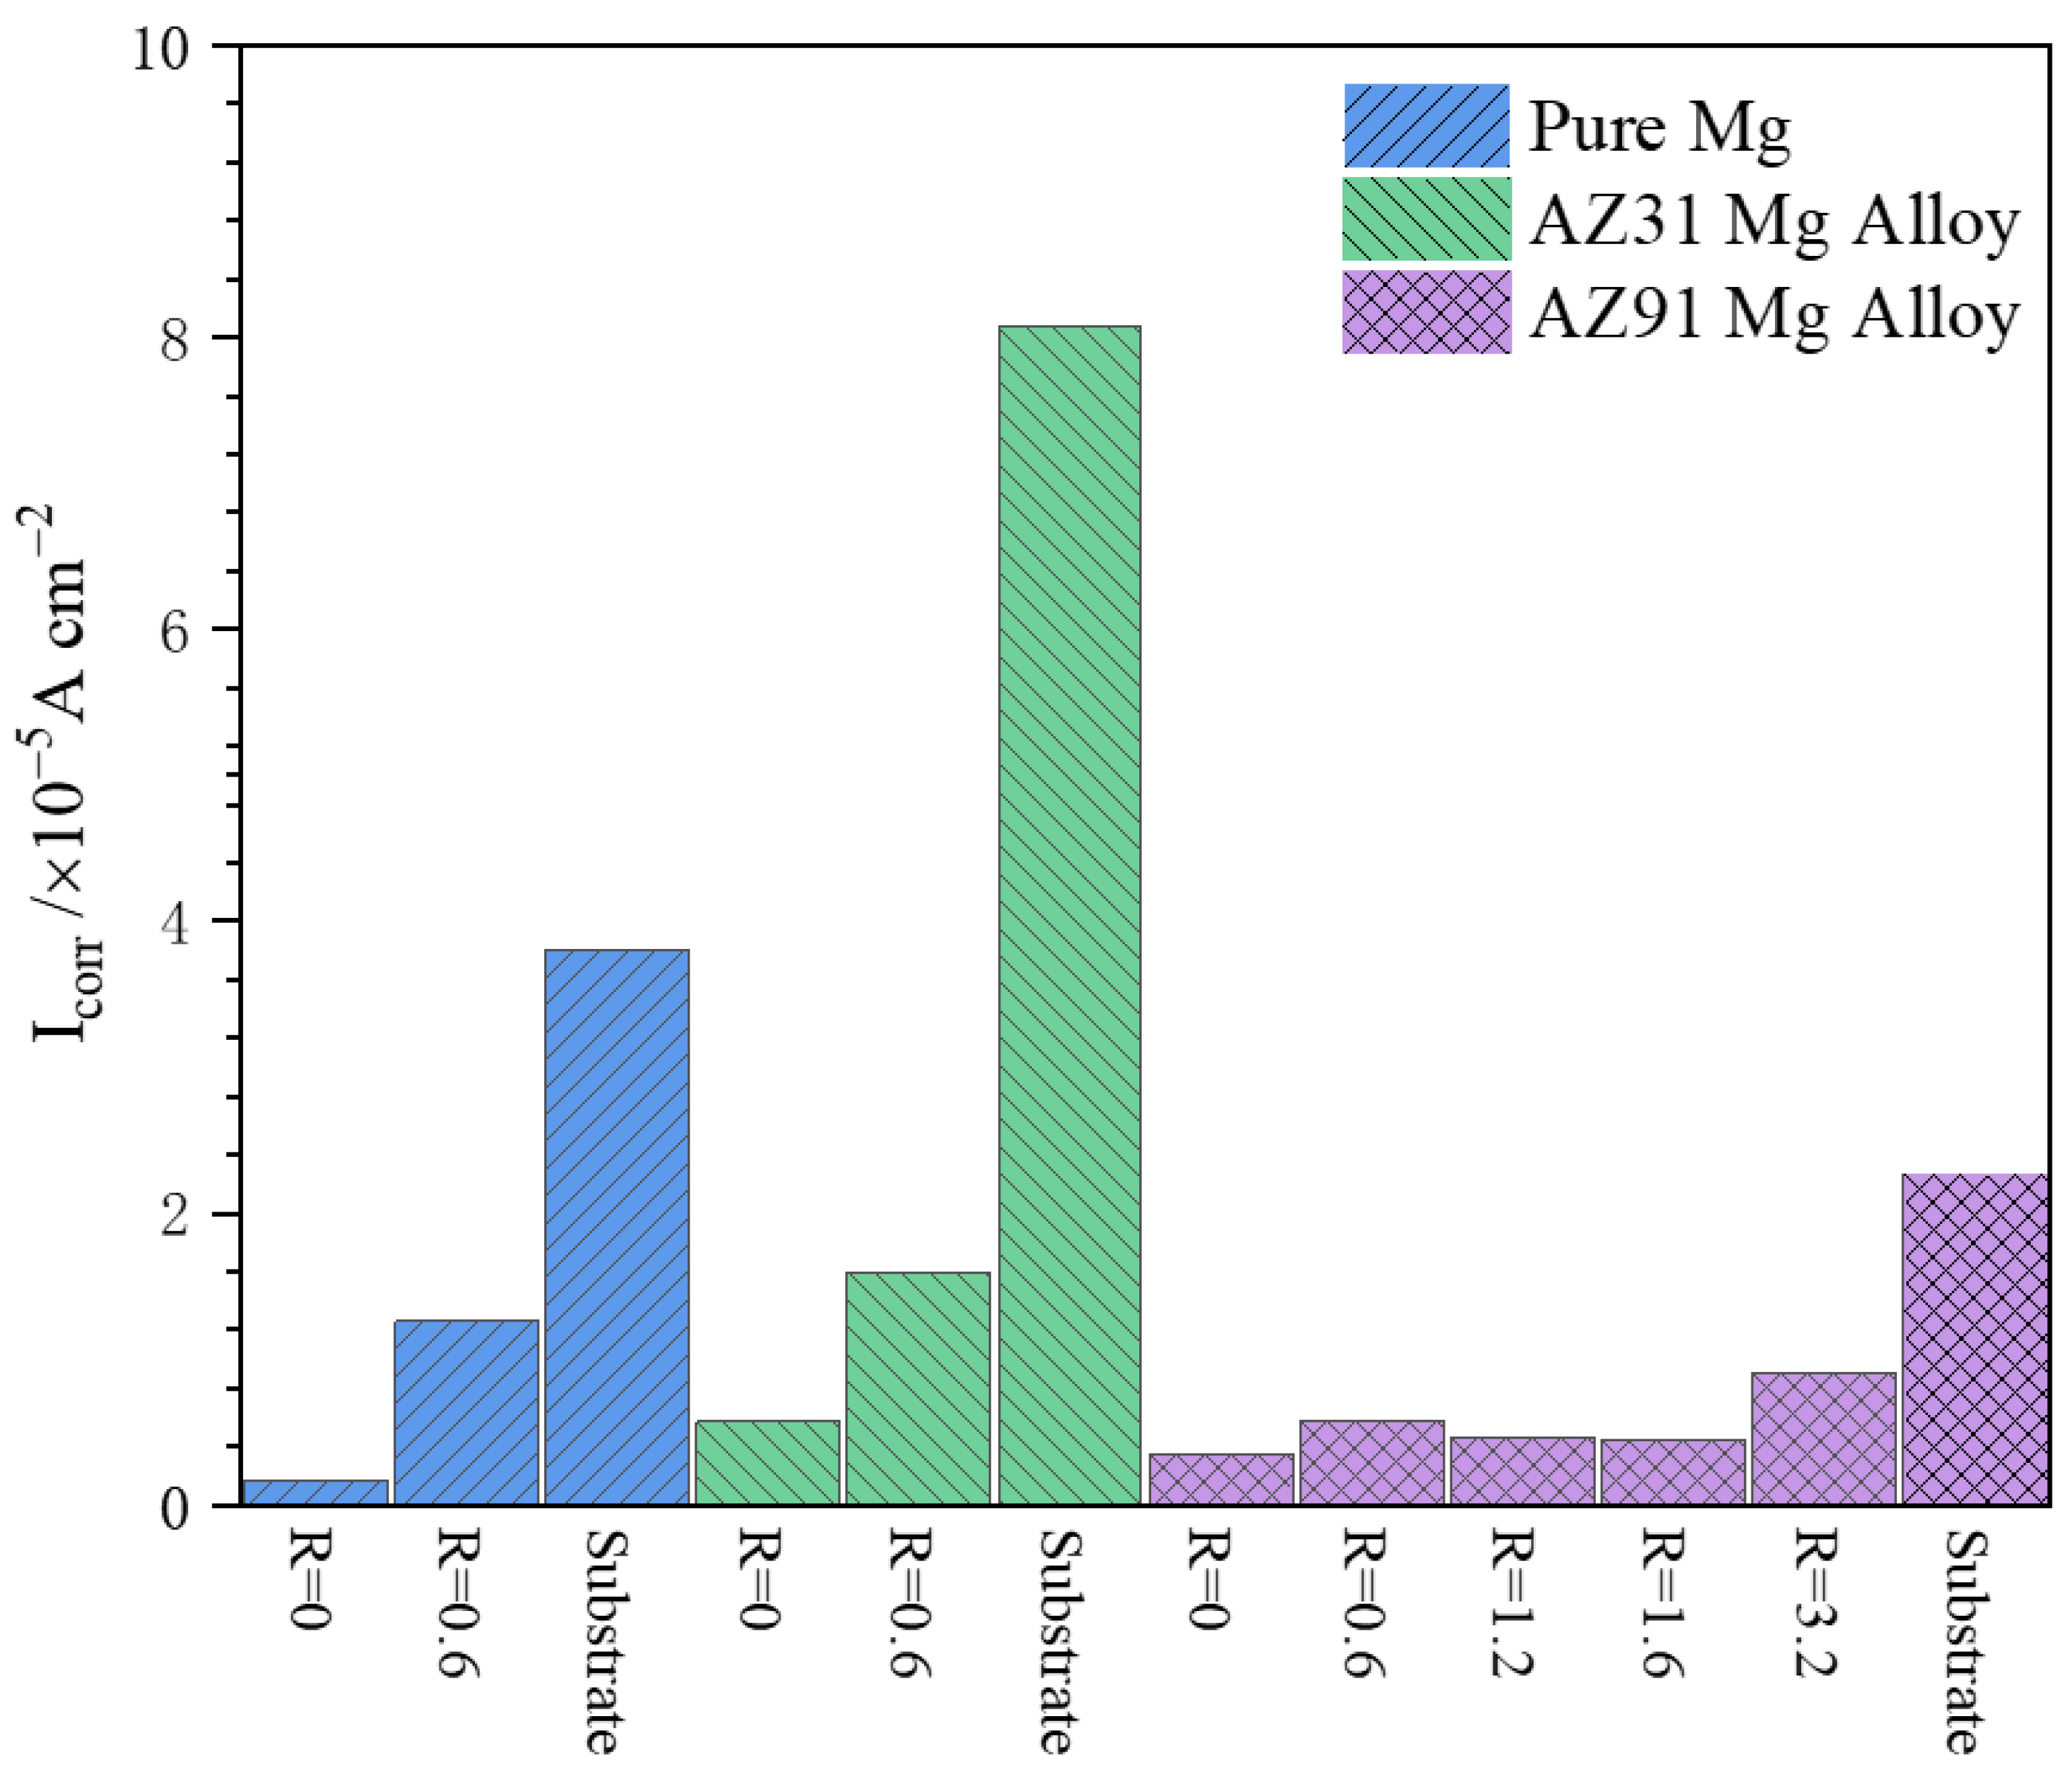
The corrosion current densities of the different samples are further plotted in the histogram of
Figure 14. The I
corr of the pure magnesium is 3.80 × 10
−5 A cm
−2. The AZ31 magnesium alloy shows a higher corrosion current density of 8.07 × 10
−5 A cm
−2. However, the I
corr of the AZ91 magnesium alloy is the lowest among the three uncoated samples (2.26 × 10
−5 A cm
−2). PEO treatment can improve the corrosion resistance of pure magnesium and AZ31 and AZ91 magnesium alloys. However, the corrosion resistance of the coatings does not improve with an increase in the R value. It can be seen in
Figure 13 that the coatings formed under R = 0 normally possessed lower I
corr values than those of the coatings formed with cathodic polarization. The coating formed under R = 0 on the pure magnesium displays the lowest corrosion current density (I
corr = 1.66 × 10
−6 A cm
−2). However, the corrosion current densities of the coatings formed under R = 0 on the AZ31 and AZ91 magnesium alloys are 5.69 × 10
−6 A cm
−2 and 3.52 × 10
−6 A cm
−2, respectively. The application of a cathodic polarization of R = 0.6 led to coatings with improved corrosion current densities of 1.26 × 10
−5 A cm
−2 and 1.60 × 10
−5 A cm
−2 on the pure magnesium and AZ31 magnesium alloy, respectively. The coatings formed with different cathodic polarizations on the AZ91 magnesium alloy normally had higher corrosion resistances than the coatings formed on the pure magnesium and AZ31 magnesium alloy under R = 0.6.
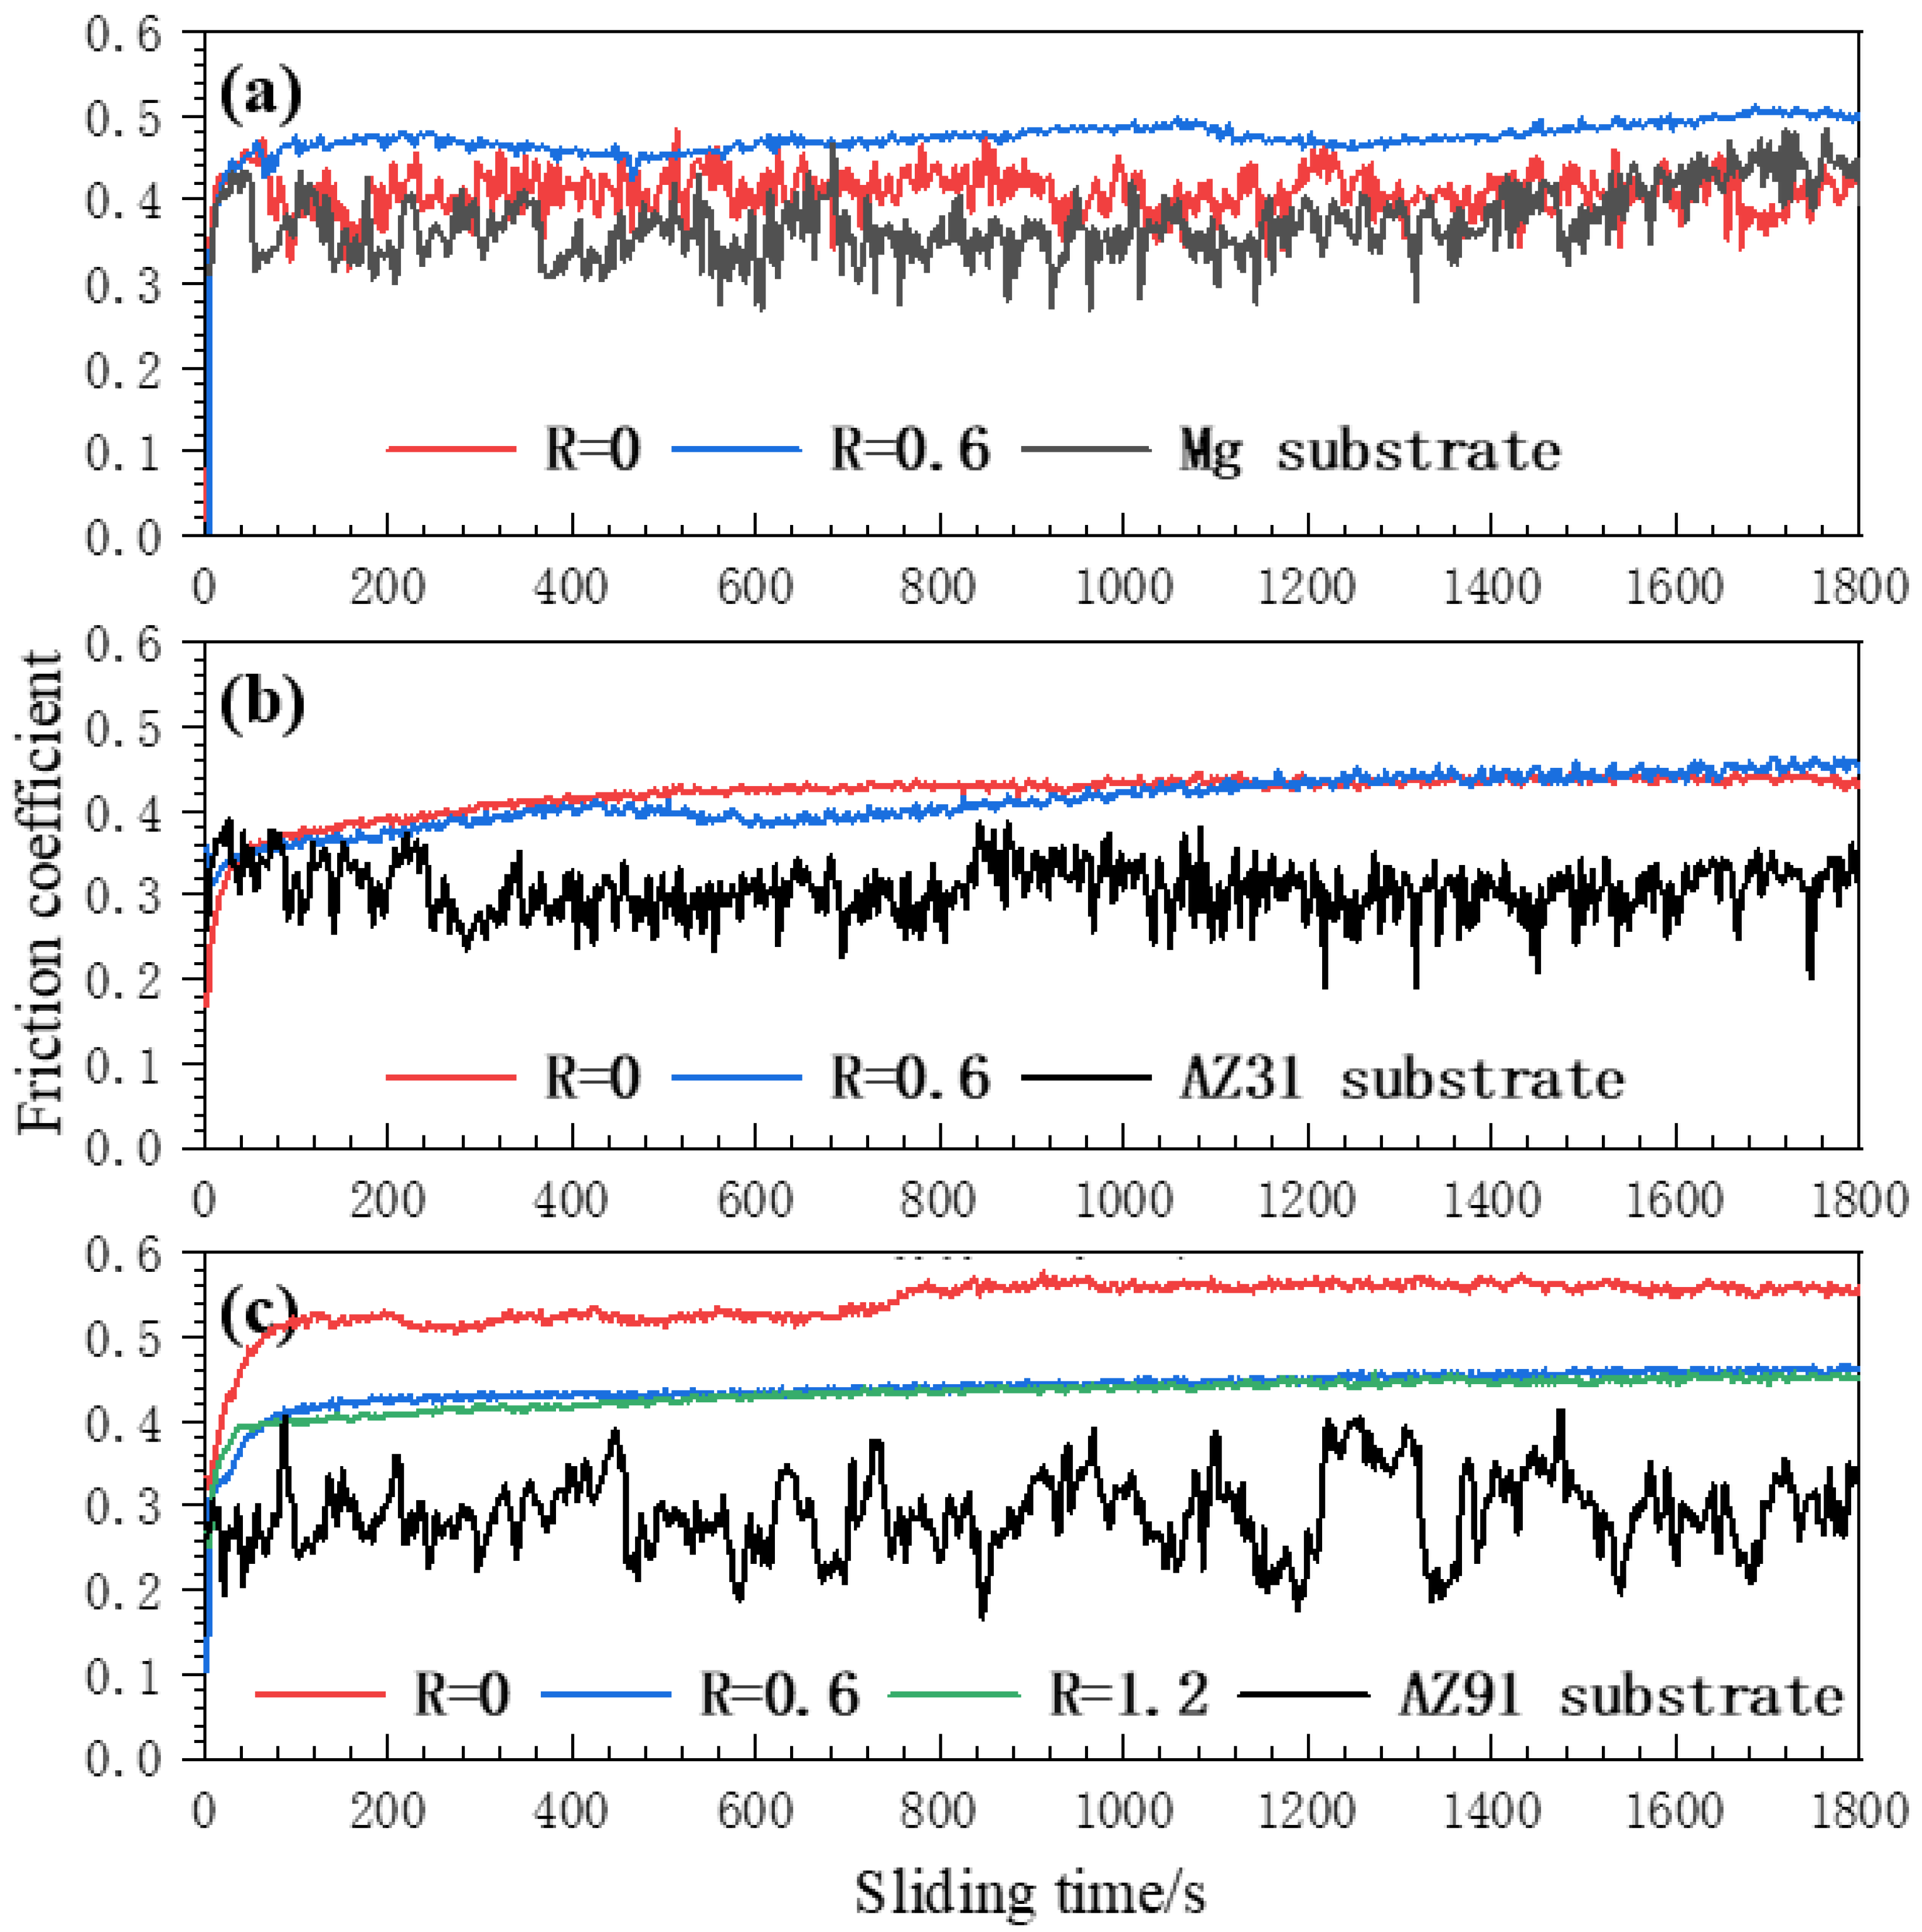
3.10. Wear
Figure 15 shows the variation in the friction coefficients during the 1800 s dry sliding tests under a load of 5 N against a Cr steel ball for the uncoated and PEO-coated pure magnesium and AZ31 and AZ91magnesium alloys.
For the pure magnesium, the friction coefficient curves of the substrate and the R = 0 coating were similar, showing significant fluctuations after the initial surge in the friction coefficient. The friction coefficient of the substrate and R = 0 coating normally ranged between 0.32 and 0.48. In contrast, the friction coefficient curve of the PEO coating formed under R = 0.6 was more stable, with a slightly higher friction coefficient value throughout the entire process than those of the other two samples, and its value was around 0.5 in the later stage.
For the uncoated and coated AZ31 alloy samples, only the substrate showed fluctuations in the friction coefficient, the values of which remained between approximately 0.28 and 0.36. The curves of the friction coefficients for the oxide coatings formed under R = 0 and R = 0.6 are higher than that of the substrate, and the curves are relatively stable. Moreover, their values are very close, showing values of around 0.45 for the later stage of the friction tests.
Similarly, only the substrate of the AZ91 magnesium alloy exhibited significant fluctuations in the friction coefficient, with values ranging between ~0.2 and ~0.4. The sample with an R = 0 coating had the highest friction coefficient, showing values between 0.5 and 0.56 after the initial surge. The friction coefficient curves of the coatings formed under R = 0.6 and 1.2 almost coincide, with values ranging from 0.4 to 0.46 during most of the process.
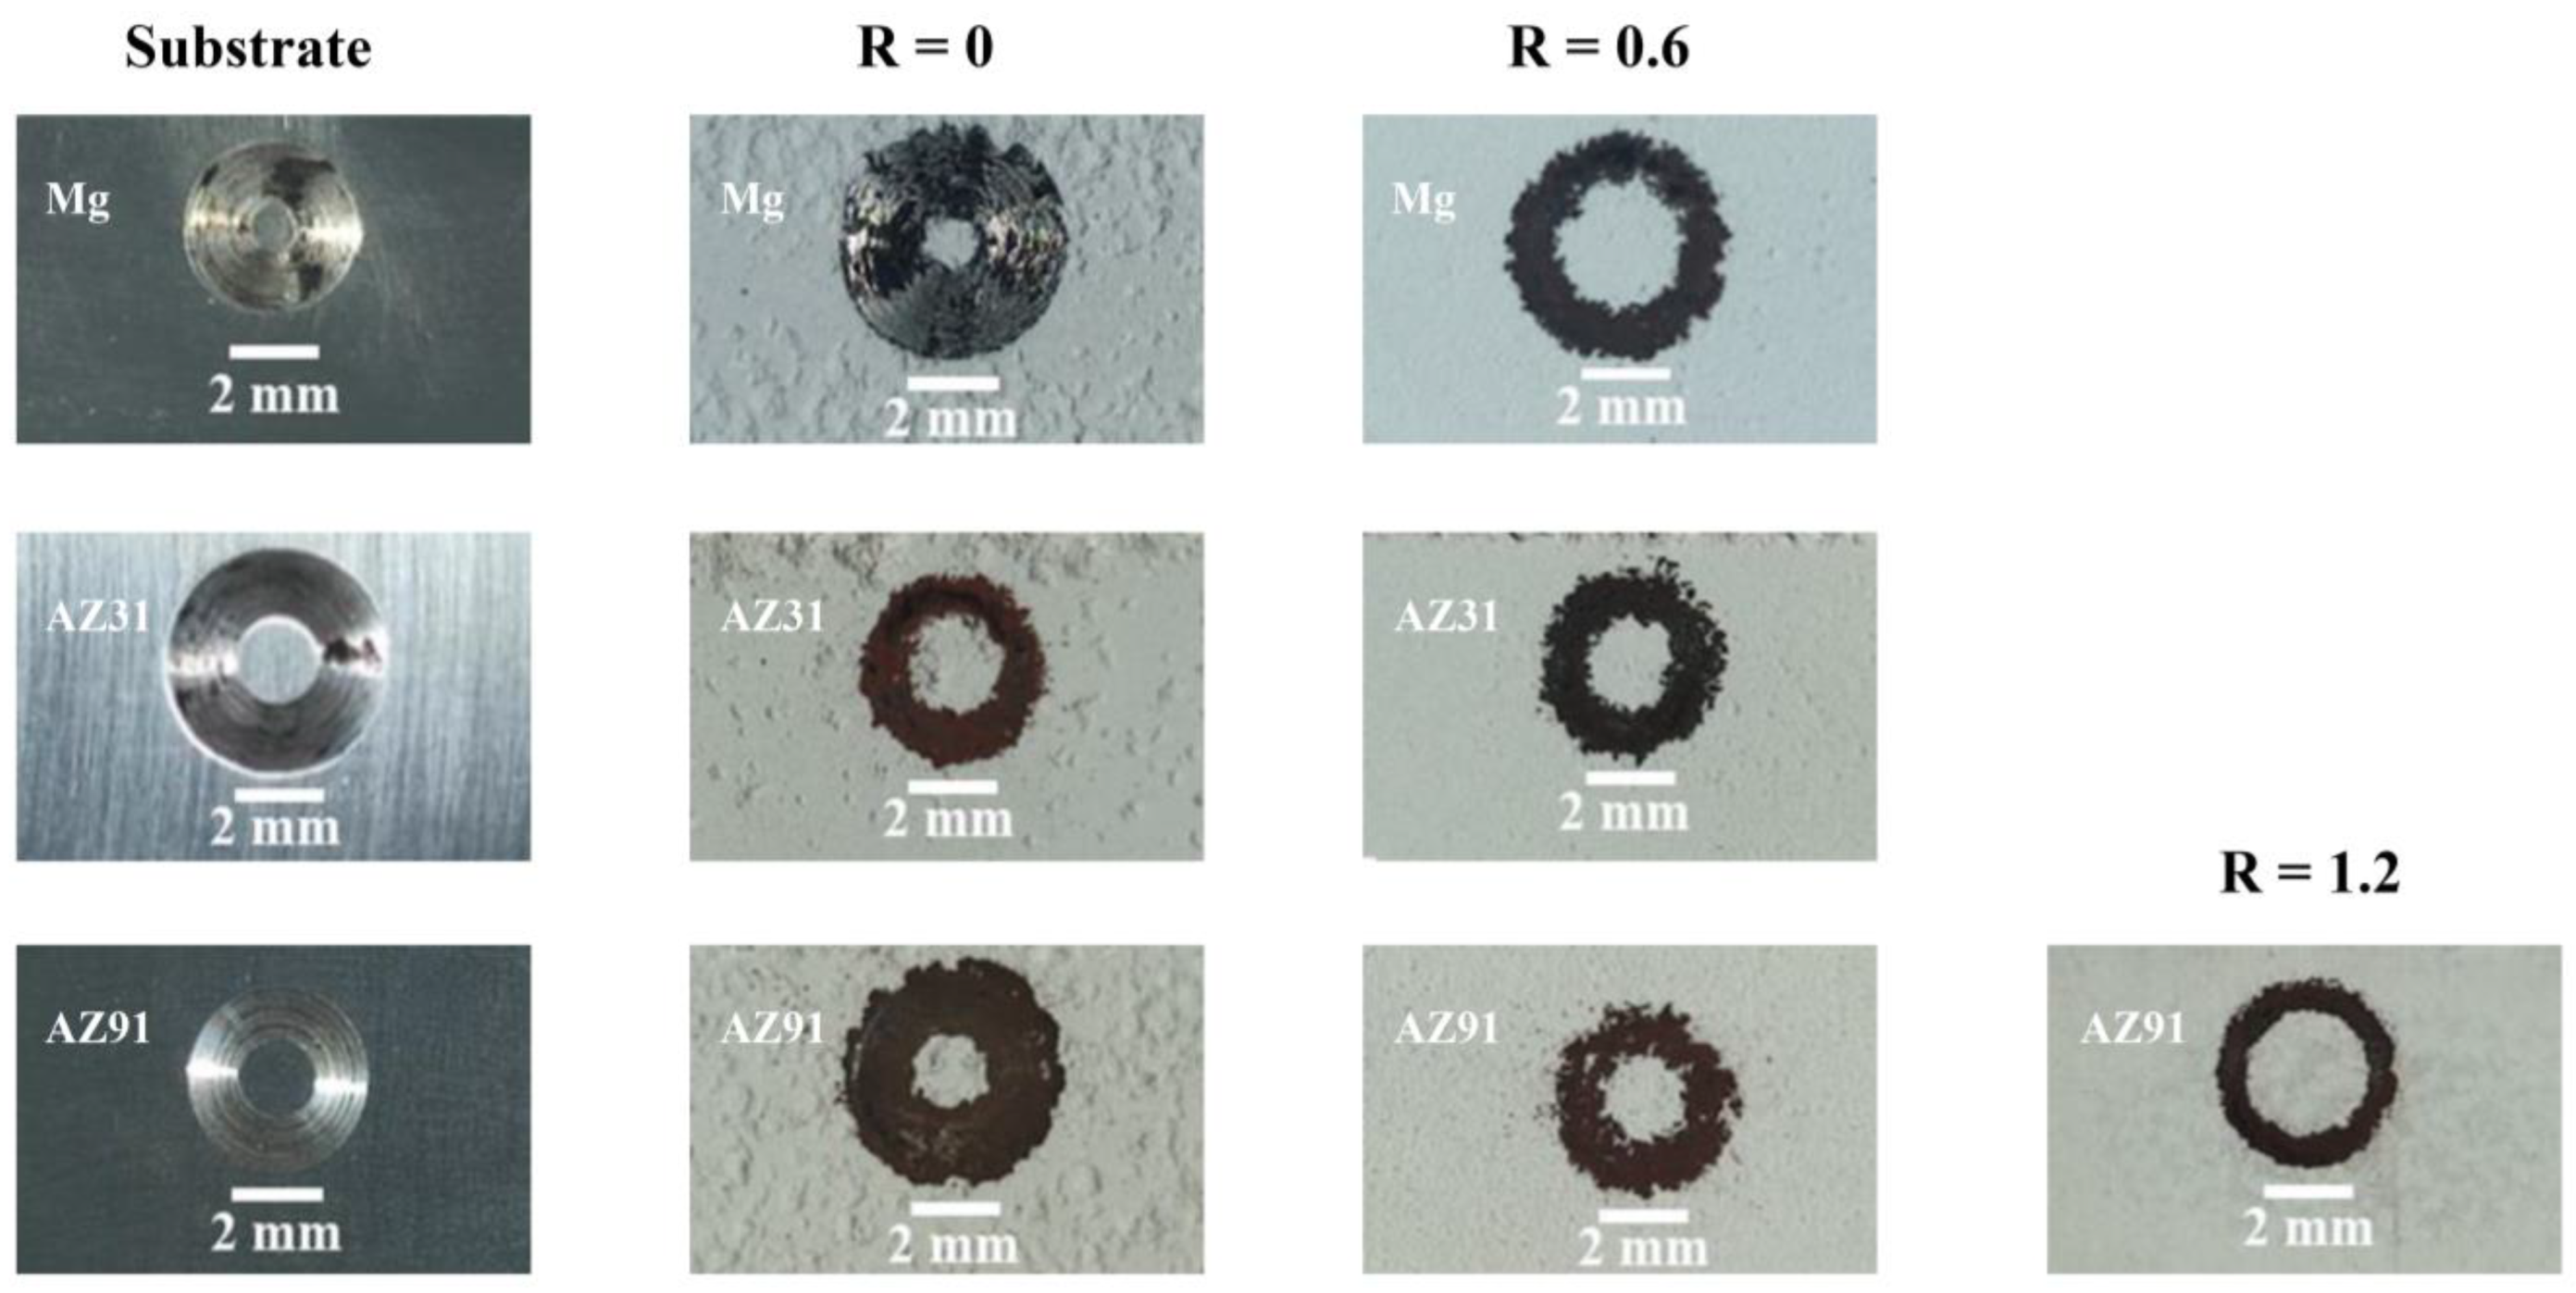
Figure 16 shows the appearances of the different samples after the dry sliding tests. It can be seen that all the metal substrates and the R = 0 coating on the pure magnesium are heavily worn, showing broad wear tracks with metallic luster. Except for the coating formed on the pure magnesium under R = 0, all the coated samples formed dark-brown wear tracks. The dark-brown wear tracks are the “transfer layers”, which were formed due to material transfer and the tribo-oxidation of the steel counterpart under the combined action of mechanical stresses and frictional heating [
64]. For the pure magnesium and AZ91 magnesium alloy, the coatings formed under R = 0.6 exhibit narrower wear tracks than the coatings formed under R = 0, indicating the better wear resistance of the former. However, for the AZ31 alloy, the coatings formed under R = 0 and R = 0.6 show comparable wear tracks in width. It is noted that the narrowest wear track is found with the coating formed under R = 1.2 on the AZ91 magnesium alloy.
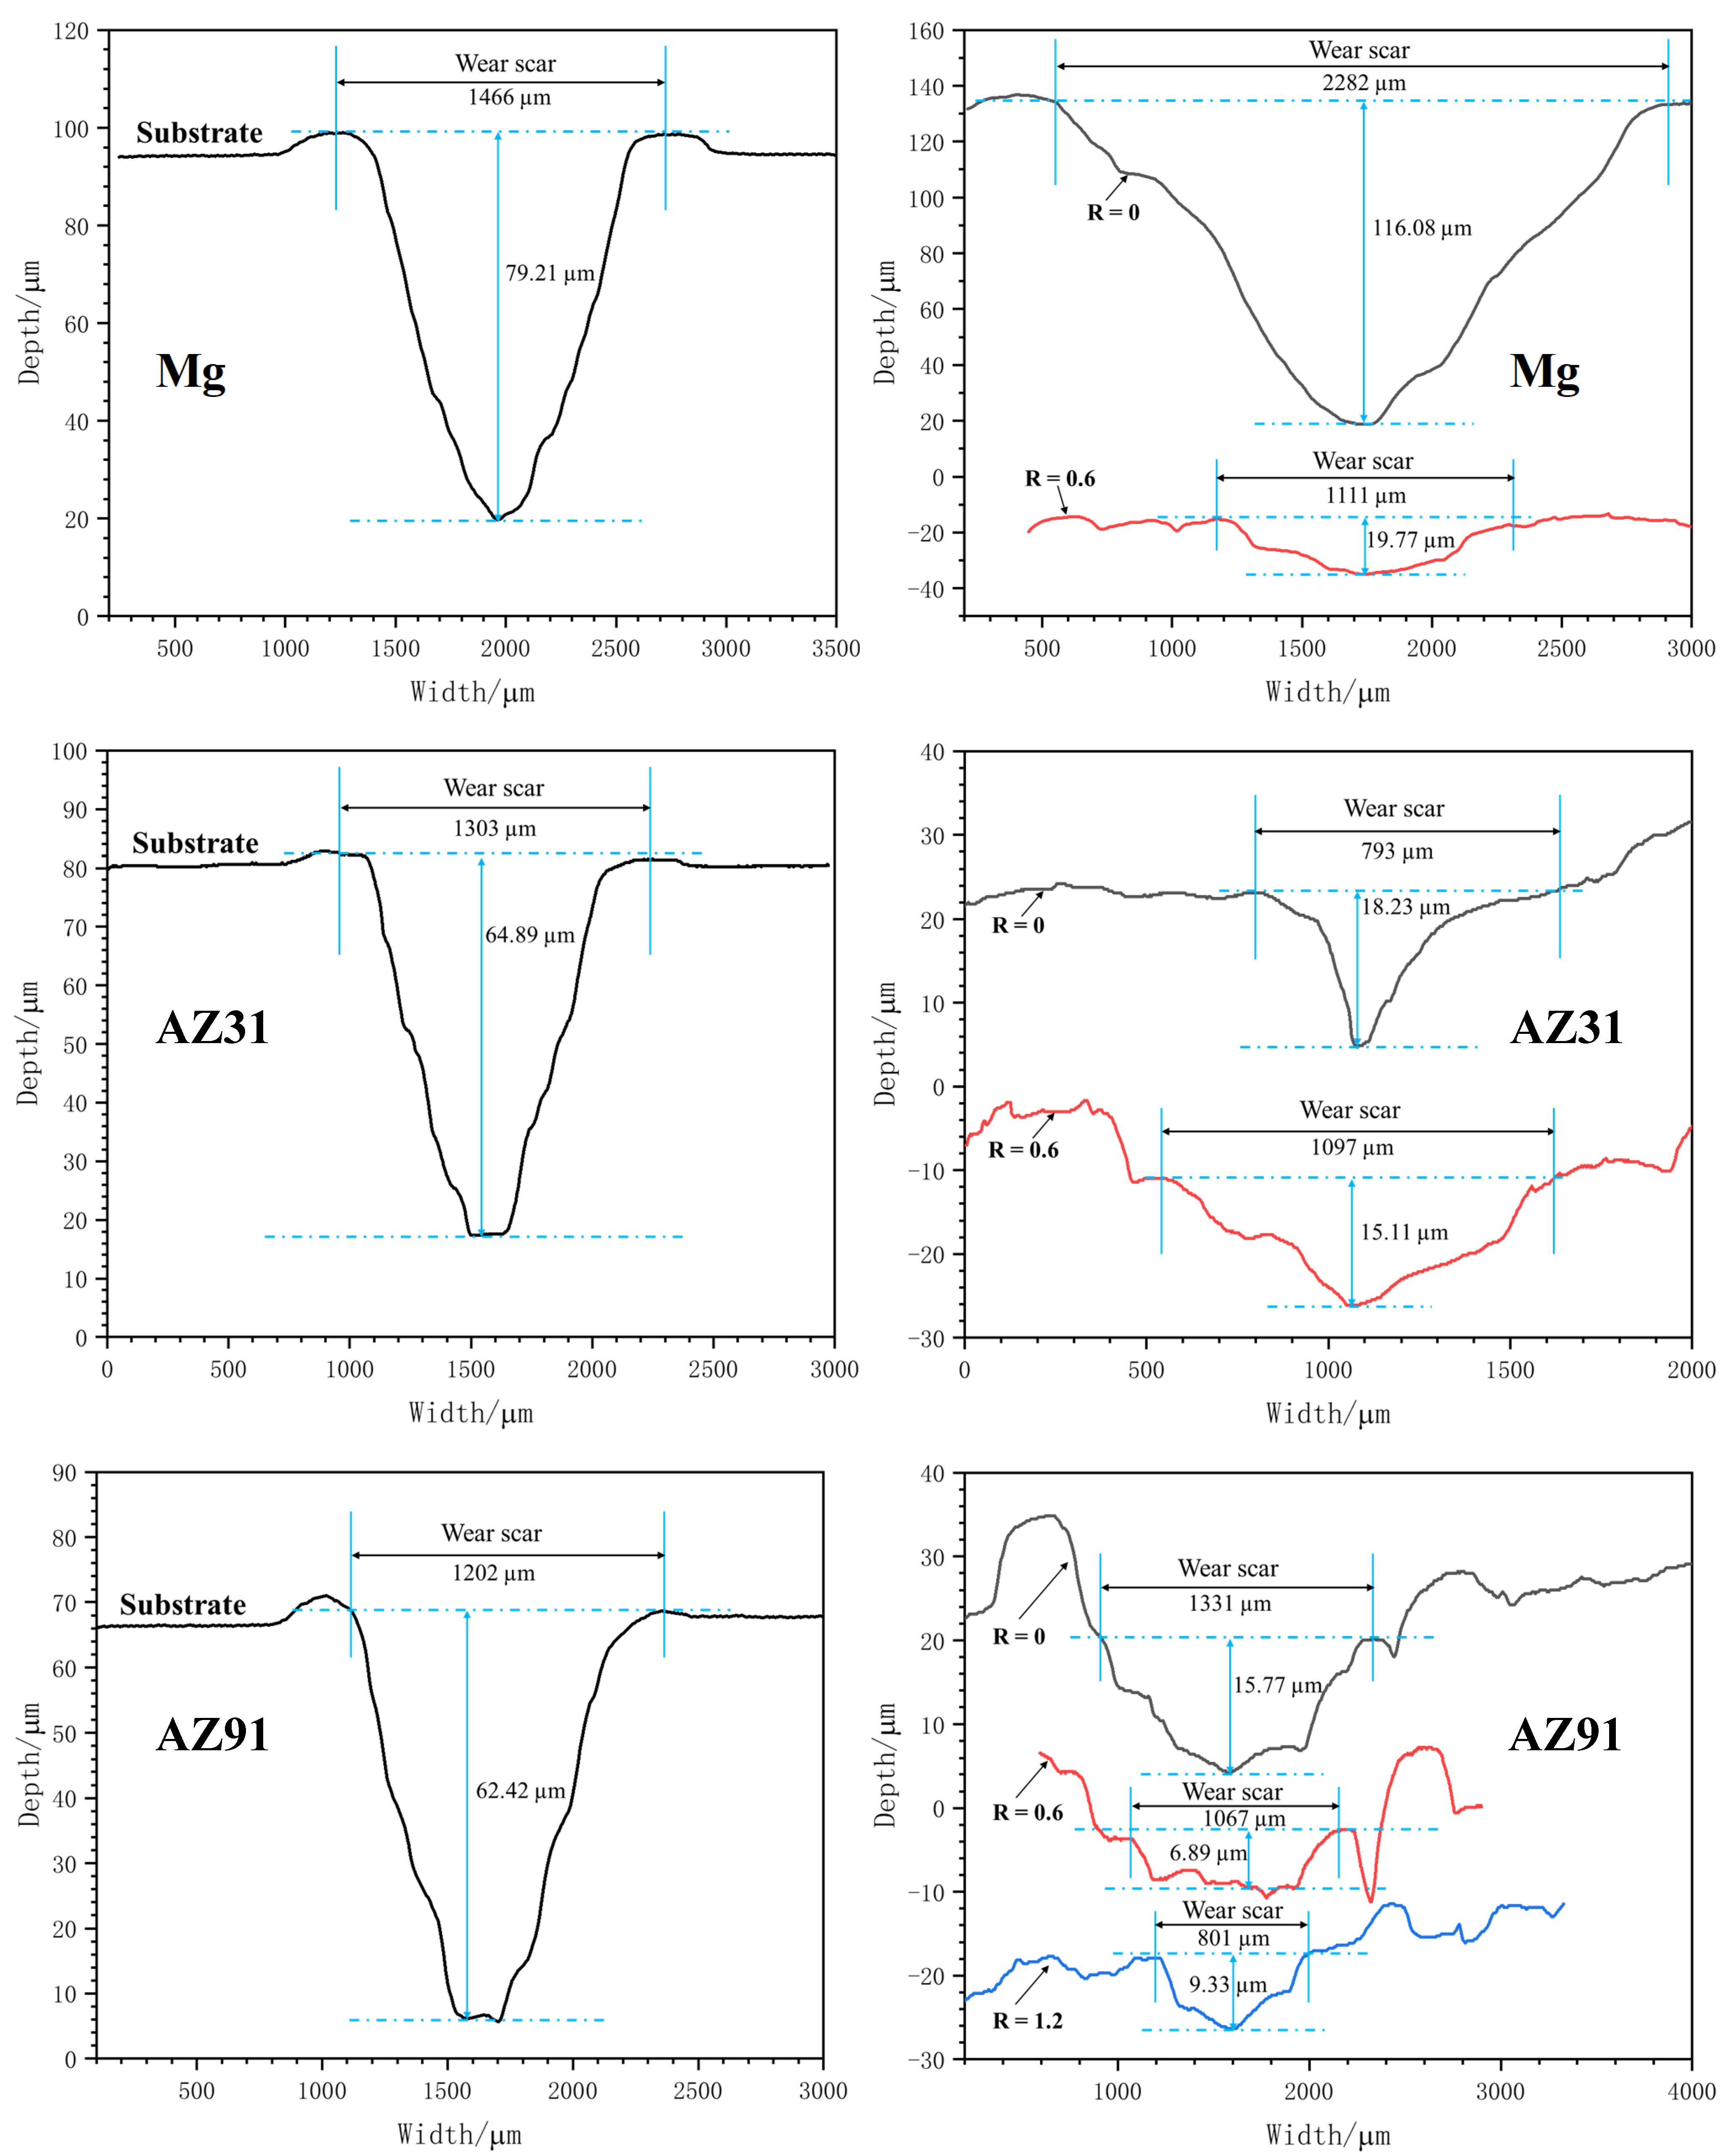
Figure 17 shows the corresponding cross-sectional profiles for the wear tracks. It can be seen that the wear track depths on the uncoated substrates are in the range of 62.42–79.21 μm. The coating formed under R = 0 on the pure magnesium shows the deepest wear scar at 116.08 μm. It is believed that the debris of broken coating material was entrapped within the wear track, imposing an additional micro-cutting effect on the substrate, thereby leading to a deeper wear track. In contrast, the wear depth on the coating formed on the pure magnesium under R = 0.6 is only 19.77 μm, indicating the significant improvement in the wear resistance. Other coatings formed on the AZ31 and AZ91 alloys show wear depths in the same order; their values are between 6.98 and 18.23 μm. However, the narrowest wear scar width is recorded for the coating formed on the AZ91 alloy under R = 1.2, with a value of 801 μm.
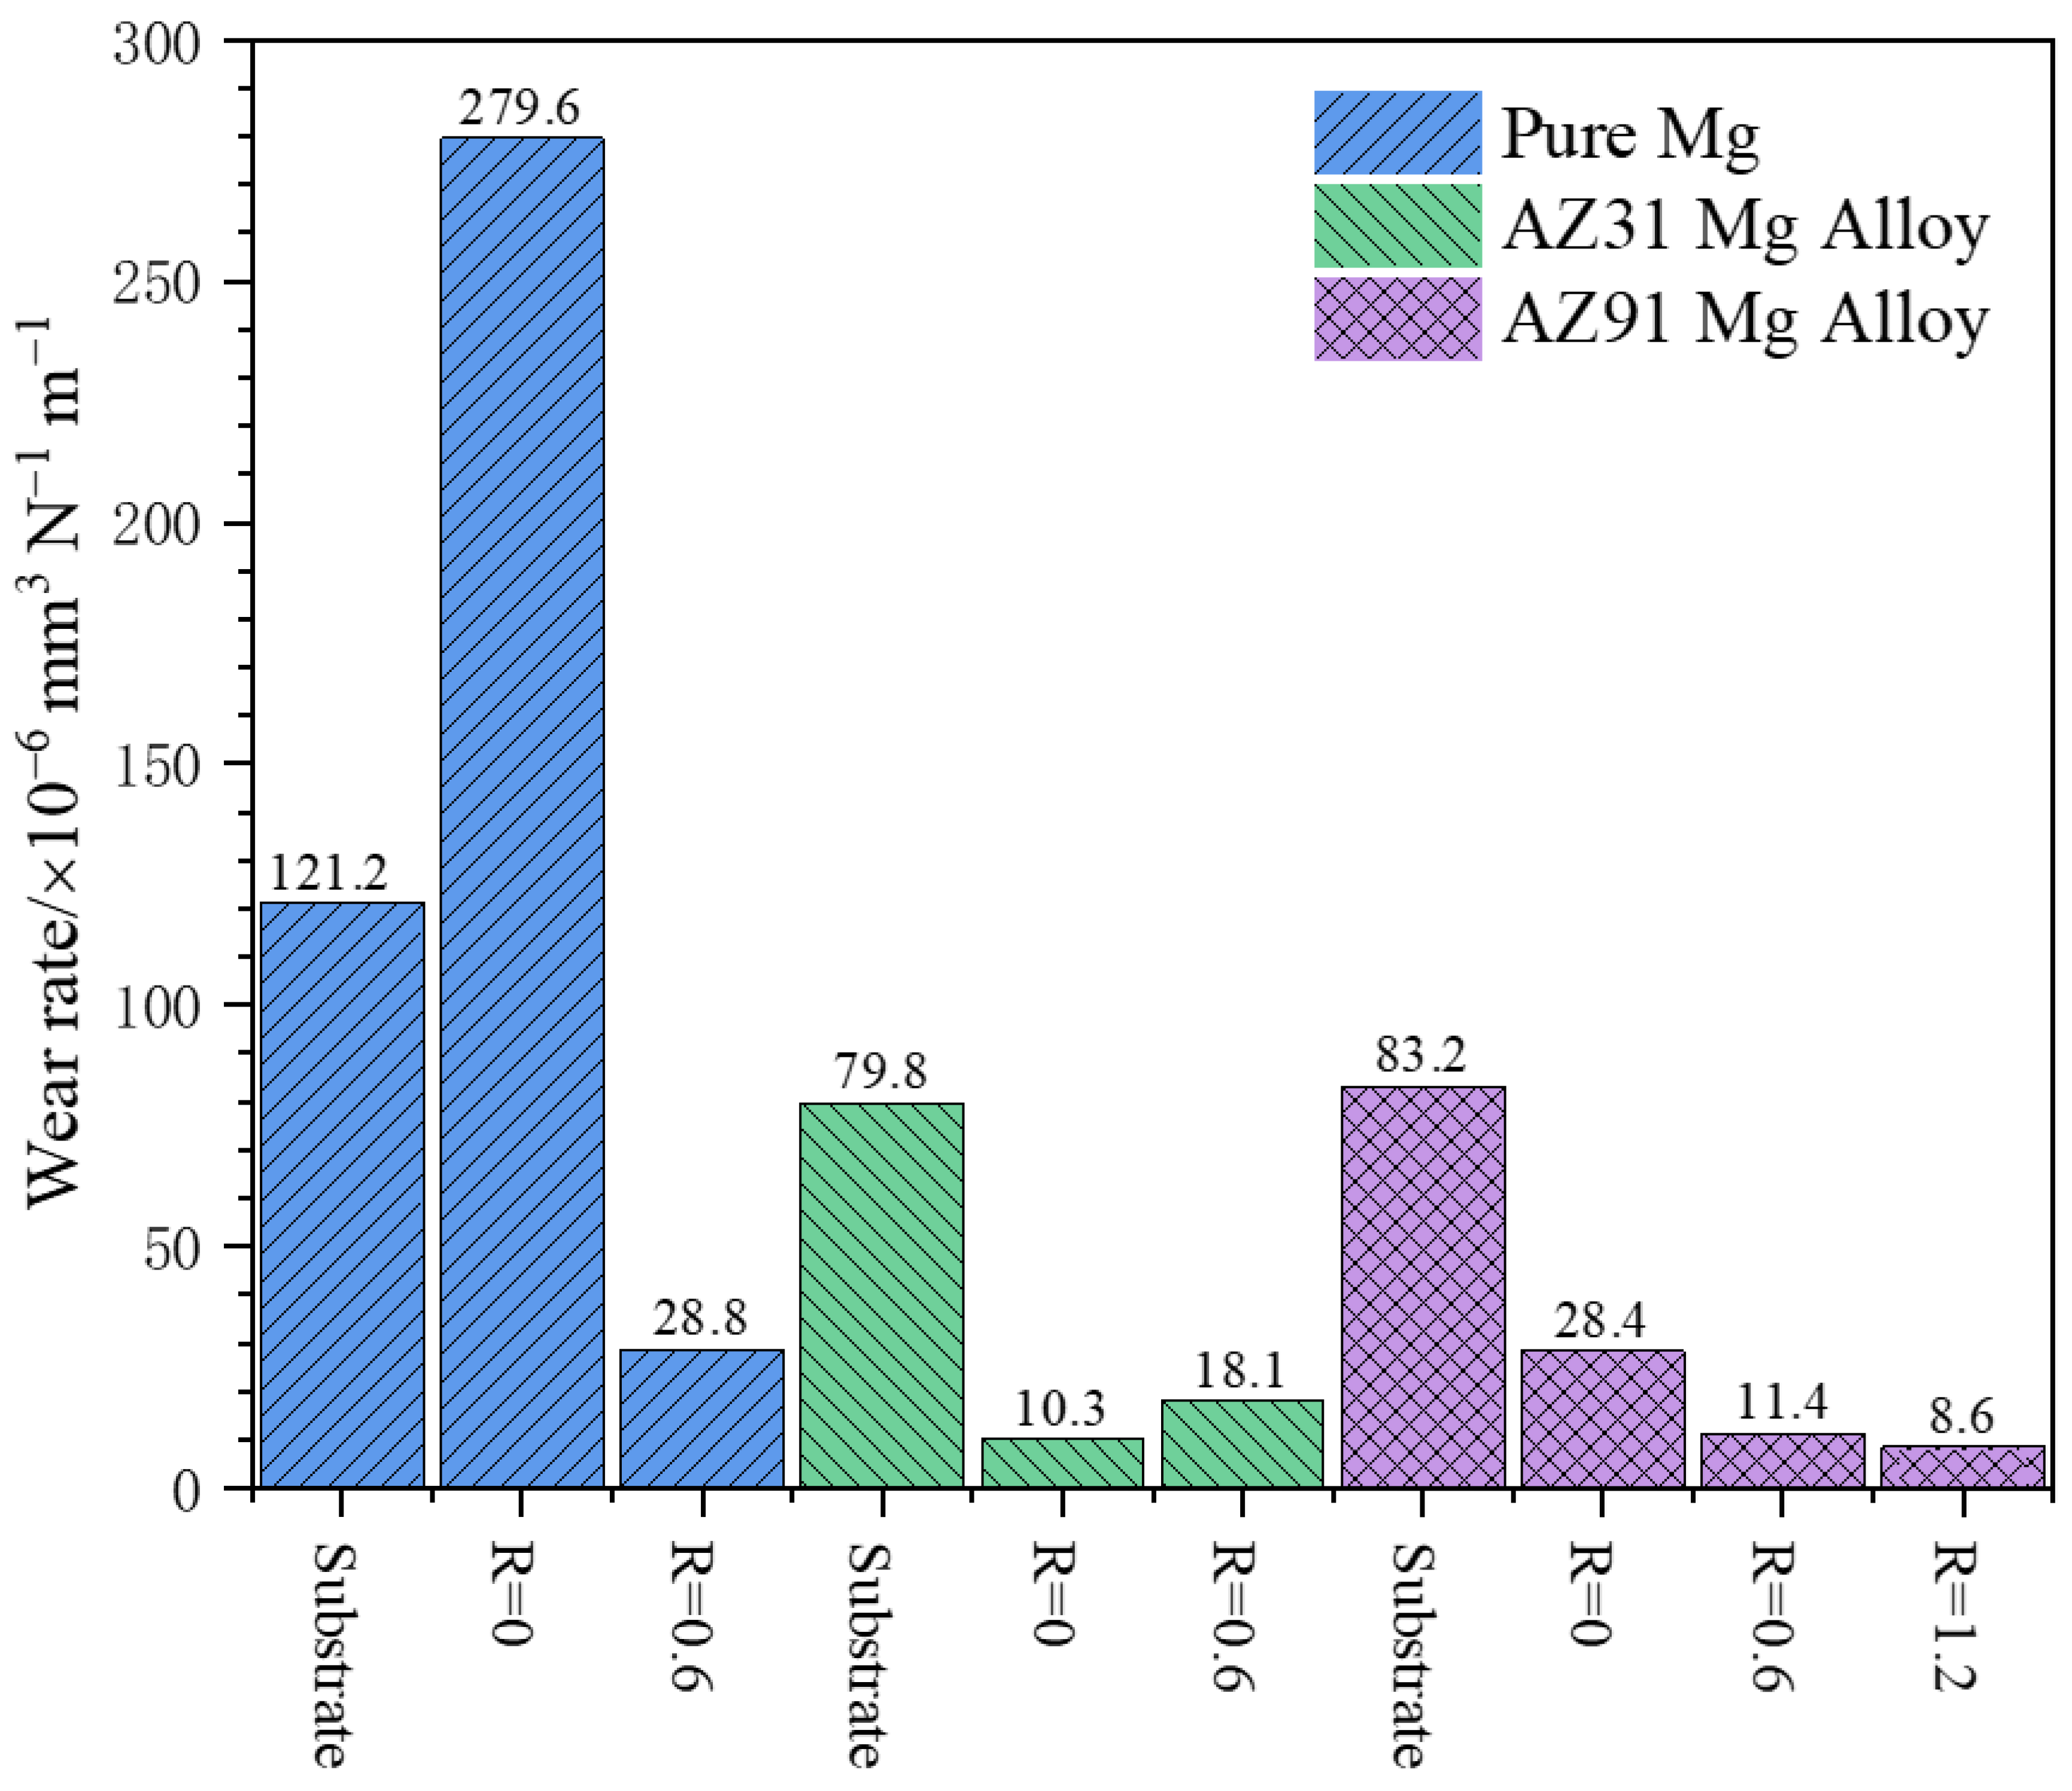
The wear rates of the different samples are calculated and plotted in
Figure 18. The PEO coating formed under R = 0 on the pure magnesium shows the highest wear rate of 279.6 × 10
−6 mm
3/(N·m), whereas the lowest wear rate is registered for the PEO coating formed under R = 1.2 on the AZ91 magnesium alloy, which is 8.6 × 10
−6 mm
3/(N·m).
4. Discussion
In this work, the effect of cathodic polarization on the PEO behaviors and coating properties of pure magnesium and AZ31, and AZ91 magnesium alloys was systematically studied in a dilute silicate solution. The main findings are as follows:
The PEO of the pure magnesium and AZ31 and AZ91 magnesium alloys without cathodic polarization led to a large number of pores on the coatings in the later stage. The thicknesses of the coatings were low, with poor uniformity, and the coatings mainly grew inward;
The lower cathodic polarization (R = 0.6) greatly improved the thickness and uniformity of the coatings, and the growth mechanism of the coatings shifted to both inward and outward growth;
When the cathodic polarization was high, the anodic potential decreased or fluctuated during the PEO process. At this point, some features of soft sparking appeared, such as weakened sparks and lower acoustic emissions, but their impacts on the quality of the coating were negative, leading to the blistering or flaking off of the coating;
The increase in the Al content in the magnesium alloys seemed to improve the tolerance to high cathodic polarization and was beneficial for the compactness of the coating. When the R values were 0.9 and 1.2, the coating thickness on the AZ91 magnesium alloy was only slightly lower than that at R = 0.6, and the compactness of the coating was improved. Even at the highest R value of 3.2, there was no coating flaking-off phenomenon for the AZ91 alloy;
The PEO coatings improved the corrosion resistance of the substrates. Compared with the coatings formed under R = 0, cathodic polarization slightly decreased the corrosion resistance of the coatings. Excessive cathodic polarization damaged the coatings on the pure magnesium and AZ31 alloy. For the AZ91 magnesium alloy, excessive cathodic polarization led to a lowered corrosion potential and decreased corrosion resistance;
The coatings formed under R = 0.6 usually possessed high wear resistances than the coatings formed under R = 0. The PEO coating on the AZ91 magnesium alloy formed under R = 1.2 displays the narrowest wear scar.
This study further demonstrates that the significant improvement in the coating thickness and uniformity related to soft sparking reported in the literature may be only confined to aluminum alloys. Although the soft sparking of the magnesium and magnesium alloys in this study was not related to an improvement in the coating quality, the effect of cathodic polarization on the PEO coating formation process was similar to that of aluminum alloys. After applying a certain cathodic current (e.g., R = 0.6), the uniformity and thickness of the coating first significantly increased, which is consistent with those of aluminum alloys [
39]. In addition, it has been found in the relevant research on aluminum alloys that excessive cathodic polarization can also result in a reduced coating thickness, blistering, flaking off and other phenomena [
39,
43]
According to the literature [
52,
65,
66], for the PEO of magnesium and magnesium alloys, the main anodic reactions can be written as follows:
According to Reaction (1), Mg2+ is produced via the dissolution of the magnesium substrate under a strong electric field. Reaction (2) is a side reaction of oxygen generation under anodic polarization. In the initial PEO stage, traditional anodic film is formed under the electric field via the ion migration mechanism: Mg2+ ions move towards the electrolyte/coating interface, whereas the anions of O2−, OH− and SiO32− move towards the substrate. The cations and anions meet within the film, leading to the formation of MgO (Reaction (3)), Mg(OH)2 (Reaction (4)) and Mg2SiO4 (Reaction (5)). Mg2+ can also enter the electrolyte directly. After reaching the breakdown potential, the magnesium in the substrate will directly react with oxygen in the molten-discharge channels to form MgO (Reaction (10)). Similarly, in the presence of high-temperature-discharge channels, Mg(OH)2 and SiO32− may undergo thermal decomposition to form SiO2 and MgO, manifested by Reactions (6)–(8). MgO can also react with SiO2 to form magnesium olivine (Reaction (9)).
For PEO without the application of cathodic polarization, many large-sized pits are formed on the surfaces of magnesium and magnesium alloys in the later stage of PEO (see
Figure 4). The formation of these pits may be related to the strong anodic dissolution of the Mg substrate. The greater possibility for the pit formation may be that the formed oxide coating has been damaged by the strong discharges. Within the PEO discharge channels, there are high temperatures (10
3–10
4 K) and pressures (~10
2 MPa) [
8], accompanied by plasma generation and gas release. When the cohesive force of the oxide coating itself is less than the mechanical stress associated with the gas release within the discharge channels, the oxide coating may break down locally, forming the pits.
After applying a certain cathodic polarization (R = 0.6), the formation of pits on the surface of the oxide coating is basically suppressed, and the uniformity and thickness of the coating are significantly improved. The growth mechanism of the coating also becomes a mode of both inward and outward growth. The reactions involved during the cathodic polarization may include the following:
The cathodic process generally involves the release of hydrogen gas (Reactions (11) and (12)), but, according to Rogov et al. [
42], it is also possible to generate neutral hydrogen complexes (Reaction (13)). Neutral hydrogen species exist in the lattice of the oxide, leading to an increase in the conductivity of the oxide coating, which may be the reason for the decrease in the anodic potential during soft sparking [
42].
The improvement in the coating thickness and uniformity after the application of cathodic polarization is a common phenomenon in PEO studies that has been reported in PEO studies of various metals [
35,
36,
39,
63]. Cheng et al. [
36] believe that the hydrogen evolution during the cathodic process promotes the transport of reactant particles in the electrolyte. Therefore, more electrolyte components participate in the coating formation, leading to an increase in the coating thickness and uniformity. The increase in the thicknesses of the PEO coatings on the magnesium and magnesium alloys after the application of cathodic polarization in this study can be explained by the same mechanism. In this study, the species involved in the coating formation in the electrolyte was mainly SiO
32− ions. Due to the participation of more electrolytic species in the coating formation, the growth pattern of the coatings also shifted to both outward and inward growth.
The blistering and flaking off of the coating under excessive cathodic polarization is associated with the internal stress caused by hydrogen evolution. Hydrogen ions or water molecules can travel through the porosity of the oxide coating to the barrier layer near the coating/substrate interface, where they receive electrons to produce hydrogen bubbles. When the cathodic polarization is too high, a large amount of hydrogen gas is generated, causing the coating to blister or detach. In addition, excessive cathodic polarization can also lead to a decrease in the coating thickness, which has been observed in the PEO of aluminum [
39,
43] and tantalum [
63], which is consistent with this study.
The reason for the decrease in the coating thickness caused by excessive cathodic polarization is believed to be related to the repulsion of the cathodic electric field on the anions. During the formation of the oxide coatings, anions such as SiO
32−, OH
− and O
2− also participate in the coating-forming reactions. An excessively high cathodic electric field will repel the anions adjacent to the surface liquid layer and within the coating, thereby reducing the number of anions participating in the coating formation reactions and leading to a decrease in the coating thickness. This mechanism was proposed in our research on the effect of cathodic polarization on the PEO of tantalum [
63].
An interesting phenomenon in this study was the tolerance to cathodic polarization in the AZ91 magnesium alloy. Although the EDS and XRD show that the compositions and phase compositions of the coatings on the pure magnesium and magnesium alloys are similar, the PEO coatings on the AZ91 magnesium alloy exhibited a completely different capability to resist the peeling caused by cathodic hydrogen evolution. For the pure magnesium and AZ31 magnesium alloys, the coatings blistered and peeled off at R = 0.9, whereas the AZ91 alloy did not show significant damage to the coating until R = 3.2. The anti-exfoliation ability of the PEO coatings on the AZ91 magnesium alloy may be related to the Al content in the substrate. Interestingly, the tolerance of the AZ91 magnesium alloy to cathodic polarization in this study was even better than that of the aluminum alloy. In our previous study, when an Al-Cu-Li alloy was PEO-treated under R = 2.0 and 3.3, the coatings exhibited significant blistering and flaking off in the later stage [
39]. It is possible for the Al component to improve the compactness of the PEO coating on magnesium alloys, as Tsai et al. [
55] found that only in a sodium aluminate electrolyte can magnesium-based metals obtain a dense inner layer under the soft-sparking condition. The mechanism of the anti-exfoliation of the PEO coatings on AZ91 magnesium alloy under excessive cathodic polarization is very complex and requires further research.
For pure magnesium and AZ31 magnesium alloy, the optimal cathodic polarization is R = 0.6. Under this condition, the thickness and uniformity of the coatings are improved, as well as the wear resistance of the coatings. However, a further increase in the R value will result in damage to the resultant coatings.
Due to the higher tolerance of the AZ91 magnesium alloy to cathodic polarization, although the coating thickness was highest at R = 0.6, further increasing the R value led to denser coatings, and the wear scar width on the coating formed under R = 1.2 was the narrowest. This indicates that a higher R value may result in more wear-resistant coatings.
As for the corrosion resistance, the coatings without cathodic polarization were slightly more corrosion-resistant than the coatings formed under the moderate cathodic polarization of R = 0.6. This phenomenon may be related to the fact that the barrier layers at the coating/substrate interfaces of the coatings formed under R = 0 were denser than those formed under R = 0.6. As mentioned previously, the barrier layers provide the main corrosion resistance for PEO coatings [
61,
62]. For the pure magnesium and AZ31 magnesium alloy, excessive cathodic polarization was detrimental to the corrosion resistance of the samples, as the coatings were damaged. For the AZ91 alloy, excessive cathodic polarization was also detrimental, as these coatings had lowered corrosion potentials and larger corrosion current densities compared with those of the coating formed under R = 0. The same phenomenon has been observed in previous studies [
39,
63]. It is believed that the incorporation of hydrogen species leads to a decrease in the corrosion resistance [
63].
Regarding the soft-sparking phenomenon, the pure magnesium and AZ31 alloy exhibited anodic-potential drops and reductions in the intensity of sparks at high R values, but the coatings were damaged when these characteristics of soft sparking occurred. The AZ91 alloy also experienced decreases in the anodic potential and strength of the discharging sparks under R = 1.2, which correspond to the optimum R value for the soft sparking of aluminum alloys [
39], but, in this study, the efficiency of the coating formation under this R value decreased (see
Figure 5). Therefore, in this study, the soft sparking on the magnesium and its alloys is possibly not related to the improvement in the coating quality.


