Article

Influence of the Nitrogen Flux Ratio on the Structural, Morphological and Tribological Properties of TiN Coatings

1
Shandong Provincial University Laboratory for Protected Horticulture, Weifang University of Science and Technology, Weifang 262700, China
2
University Featured Laboratory of Materials Engineering for Agricultural Machinery of Shandong Province, Weifang University of Science and Technology, Weifang 262700, China
3
School of Mechanical Engineering, Qilu University of Technology (Shandong Academy of Sciences), Jinan 250353, China
*
Author to whom correspondence should be addressed.
Coatings 2023, 13(1), 78; https://doi.org/10.3390/coatings13010078
Submission received: 5 November 2022 / Revised: 30 December 2022 / Accepted: 30 December 2022 / Published: 31 December 2022
(This article belongs to the Special Issue Ceramic Films and Coatings: Properties and Applications)

Abstract

:
In this study, the structural characteristics of TiN coatings deposited by DC magnetron sputtering on the surface of AISI 304 stainless steel were modulated by performing deposition at four different nitrogen flux ratios. The XRD results indicated that the coatings mainly contained face-centered cubic TiN phase. The experimental results showed that the nitrogen flux ratio played a major role in determining the microstructure and the mechanical and tribological properties of the TiN coatings. SEM images revealed that the thickness of the TiN coatings decreased linearly as the nitrogen flux ratio increased from 0.25 to 0.55. However, the grain size had a nonlinear relationship with the nitrogen flux ratio. When the nitrogen flux ratio was 0.45, the grain size was only 5.3 nm. Theoretical and experimental analysis showed that the TiN coating deposited at a nitrogen flux ratio of 0.45 had the best mechanical properties, which due to its minimum grain size and (111) orientation, and the best tribological performance under unlubricated conditions, may have been due to its higher fracture toughness and plastic deformation resistance among the four TiN coatings.

1. Introduction

Titanium nitride (TiN) coatings have been widely used as wear-protective hard coatings in automobiles, impellers, and cutting cools because of their good mechanical and tribological properties [1,2,3]. In addition, the high thermal stability, chemical stability and low resistivity of TiN coatings make them widely used not only as protective coatings for mechanical tools, but also in the decoration [4] and micro-electronic industries [5]. Especially with the development of micro-electromechanical systems (MEMS) and precision machinery, the demand for thin TIN coatings with high wear resistance and high hardness of several hundred nanometers thickness has greatly increased. In recent years, TiN has also become commonly used as a protective surface coating for orthopedic implants and cardiac valves [6] due to its excellent biocompatibility and hemocompatibility [7]. These applications require highly dense coatings and have typical deposition temperatures lower than 450 °C [8]. Improving the wear resistance of a surface coating can extend the lifespan of an implant, thus reducing costs to patients. Physical vapor deposition (PVD) is widely utilized for the deposition of TiN coatings to improve the tribological properties of the mechanical components. Among the different PVD methods, DC magnetron sputtering can be used to obtain high-density TiN coatings that generate little gas pollution and strong adhesion between the deposited coating and the substrate [9]. However, most of the problems associated with TiN production are due to its requirements of high voltages and temperatures. Much of the literature has reported the preparation of TiN coatings at high temperatures [10,11]. Gerlach et al. [12] prepared a TiN coating by reactive evaporation at 1023 K. However, the effects of deposition parameters on the microstructure, and the mechanical and tribological properties of TiN coatings have rarely been studied at low temperatures [13]. The microstructure and properties of a coating can be adjusted by changing the deposition parameters [14]. TiN coatings with a high density and excellent mechanical and tribological properties can be obtained by optimizing the deposition process.
To understand the relationship between the process parameters, microstructure, and properties of TiN coatings deposited at low temperatures, various studies have been carried out. The nitrogen flux ratio during the deposition of a TiN coating influences some major properties of the coatings. Therefore, in this report, TiN coatings were deposited by DC magnetron sputtering to investigate the effect of the nitrogen flux ratio on the structural, morphological and tribological behavior of the low-temperature deposited TiN coatings. The nitrogen flux ratio was varied from 0.25, 0.35, 0.45, to 0.55 under an Ar/N2 atmosphere at a deposition temperature of 300 °C.

2. Experimental Section

2.1. Deposition of TiN Coatings

Before deposition, the AISI 304 stainless steel samples (Ra = 20 nm) were washed ultrasonically in anhydrous ethanol, petroleum ether, and deionized water for 15 min each and then dried with nitrogen for later use. DC magnetron sputtering of a Ti target (99.9%) was used to prepare TiN coatings on the cleaned samples. When the pressure inside the sputtering chamber stabilized at the set value of 4.0 × 10⁻³ Pa, the specimens were etched with Ar+ for 20 min at a low-duty cycle (30%) and a high bias voltage (−800 V). During the deposition stage, the flow rate of argon gas (99.9%) was 60 mL/min, and the working pressure was approximately 5.0 × 10⁻¹ Pa at −50 V and 7 A. First, a Ti transition layer was sputtered on the flats for 15 min, and then the nitrogen flow was turned on. At that moment, the sputtering chamber contained a mixture of Ar and N2 (99.9%) with different nitrogen flux ratios R(N2) = f(N2)/f(Ar + N2), and the pressure was maintained at 5 × 10⁻¹ Pa by adjusting the grating. Deposition was continued at a constant temperature of 300 °C for 4 h. The TiN coatings obtained at R(N2) = 0.25, 0.35, 0.45 and 0.55 were denoted as TiN-0.25, TiN-0.35, TiN-0.45 and TiN-0.55, respectively.

2.2. Characterization of TiN Coatings

The phase structure of the TiN coatings was characterized by X-ray diffraction (XRD, Bruker, Karlsruhe, Germany) using Cu Kα radiation. Small-angle glancing mode (1.5°) with scattering angles from 20 to 90° was used to avoid interference by the substrate peaks. Scanning electron microscopy (SEM, MERLIN Compact, Jena, Germany) was used to characterize the surface, abrasion, and cross-sectional morphology of the TiN coatings. The surface morphology and roughness of the samples were investigated with atomic force microscopy (AFM, Bruker, Karlsruhe, Germany). The chemical composition of wear scars was analyzed by energy-dispersive X-ray spectroscopy (EDS, MERLIN Compact, Jena, Germany). The adhesion between the TiN coatings and the substrate was measured using a UMT-3 (CETR, Bruker, Rheinstetten, Germany) with a load range of 0–30 N and scratch length of 3 mm. The device collected the acoustic signal of the peeling coatings to determine the critical load (Lc) of coating adhesion. It is generally believed that there are at least two stages during the deformation and failure of a coating. The former represents the loading force when a coating peels for the first time (Lc1), and the latter represents the loading force when the coating is completely peeled off (Lc2) [15].
Tribological properties of the TiN coating were assessed by UMT-3 under unlubricated conditions. The tests were carried out in ball-on-flat reciprocating mode using a GCr15 ball with a diameter of 9.525 mm at room temperature (20 ± 5 °C) and a relative humidity of 70 ± 5%. Before the test, samples and balls were cleaned ultrasonically in acetone for 15 min. During the tribological experiments, the stroke was 6 mm, the frequency was 2 Hz and the normal load was 20 N with a maximum Hertzian contact pressure of 1.45 GPa. To ensure the reliability of the test results, the same experimental conditions were tested three times. The friction sensor with a 20 N load was 2.5 mN, which was accurate enough to measure the friction coefficient in the order of millesimals under that load.

3. Results and Discussion

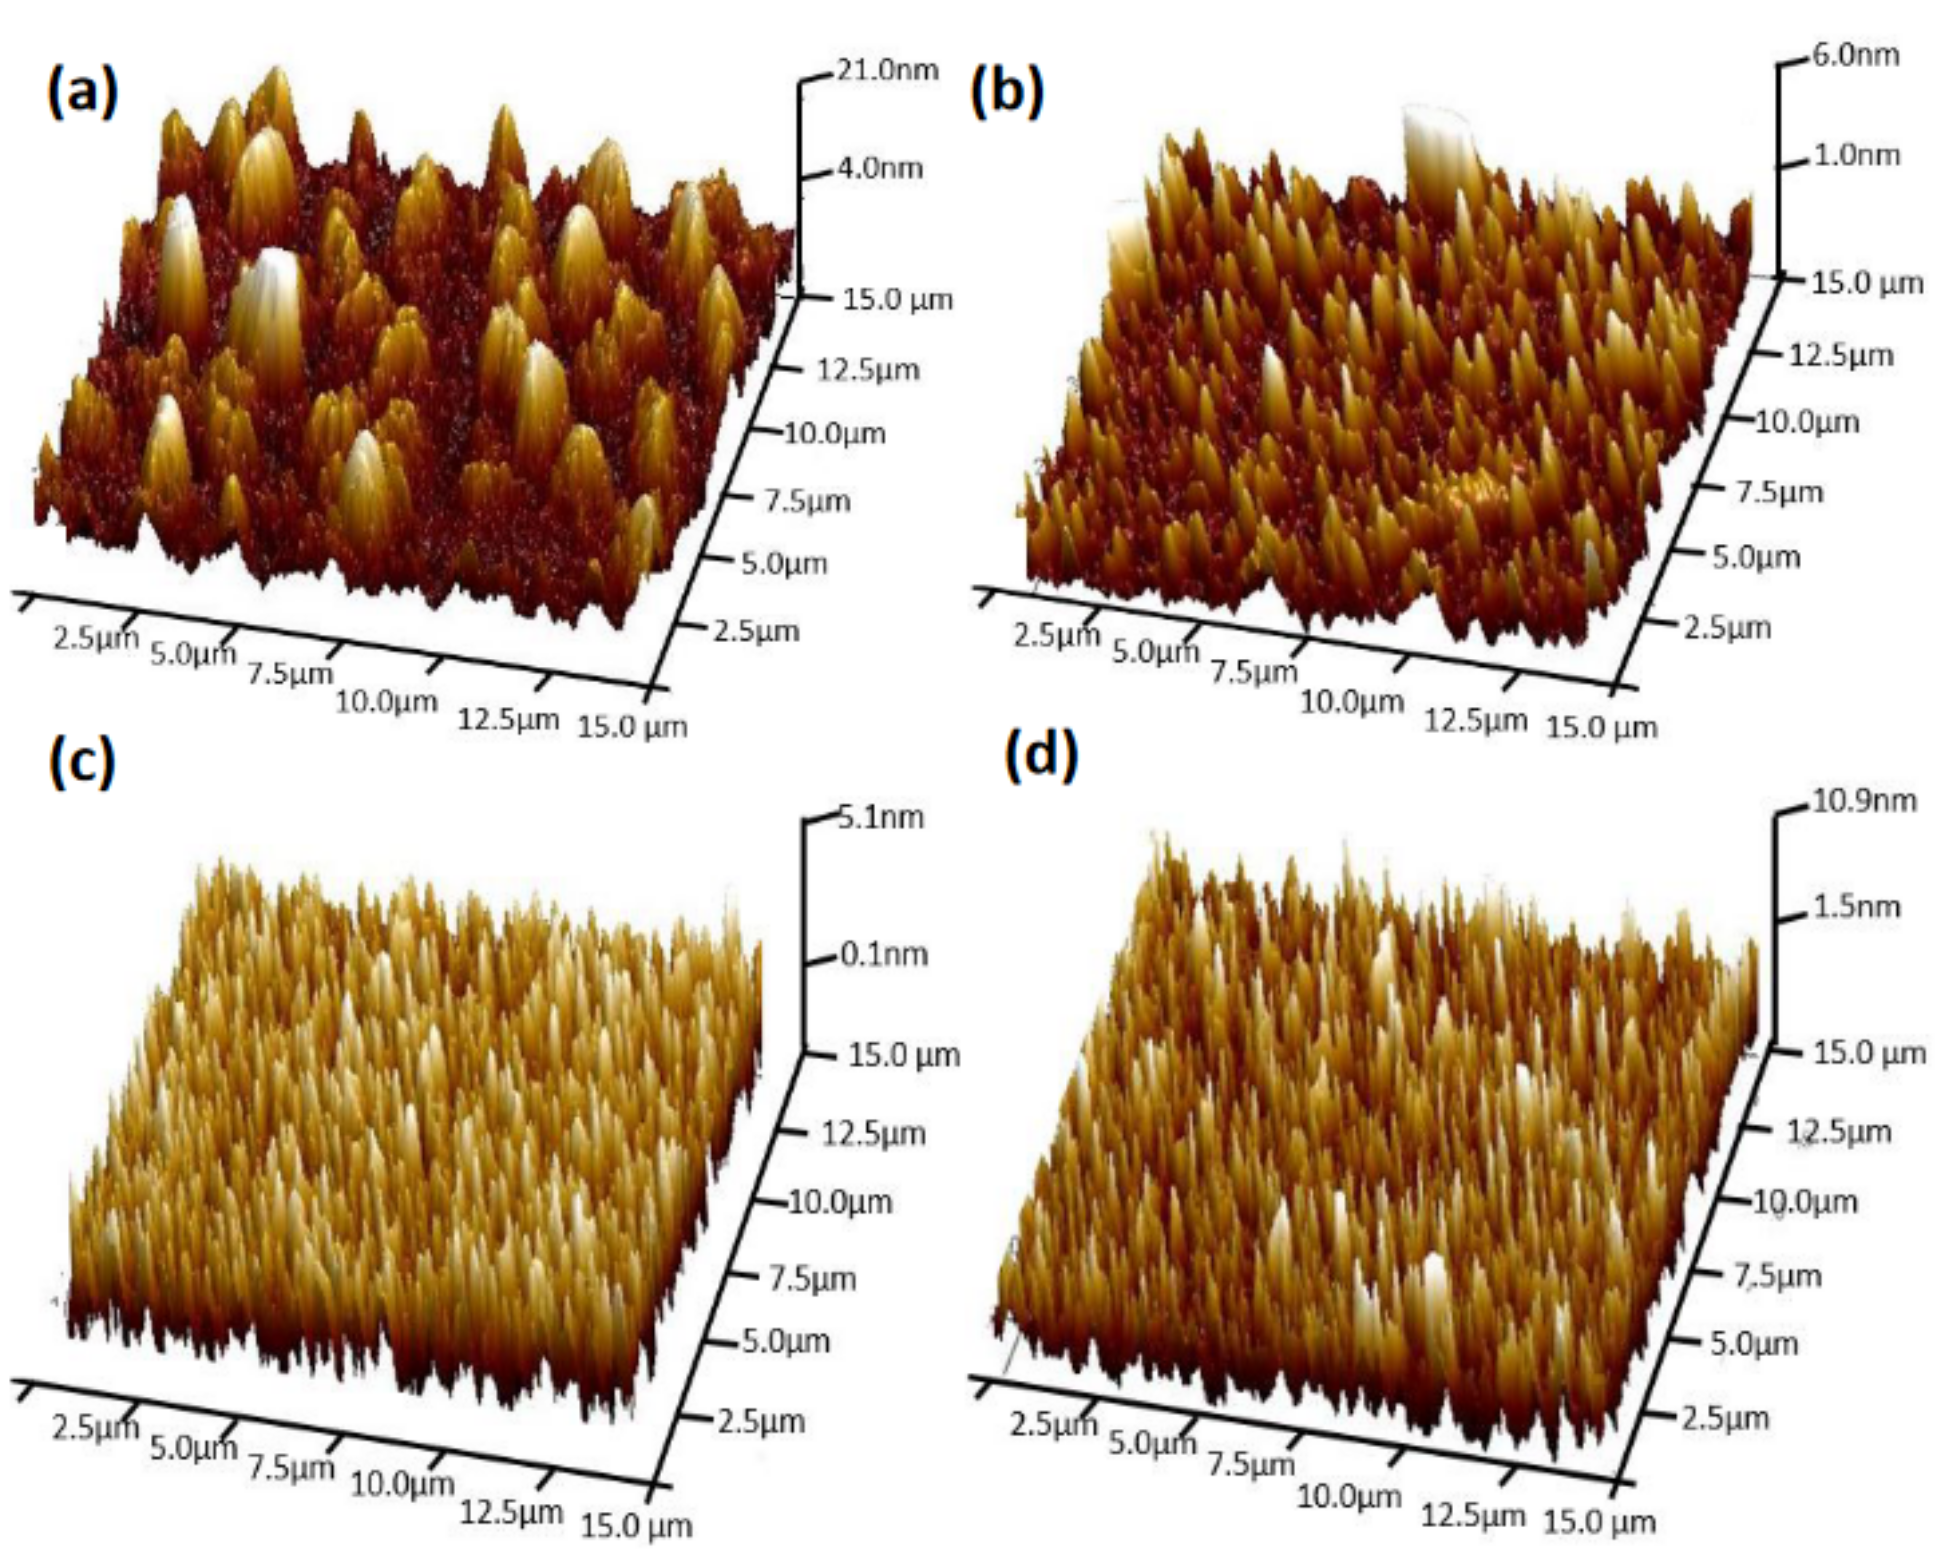
3.1. Microstructure and Morphology of TiN Coatings

The XRD patterns of the substrate and TiN coatings deposited at different R(N2) are shown in Figure 1. The peaks at diffraction angles of 36.8, 42.6, 62.1 and 73.8° corresponded to TiN(111), TiN(200), TiN(220), and TiN(222), respectively. The XRD pattern of the TiN coatings showed that the four coatings mainly existed as face-centered cubic TiN phase (JCPDS-ICDD NO. 87-0629). The TiN-0.25, TiN-0.35 and TiN-0.45 coatings showed two strong peaks for TiN(111) and TiN(200), and another relatively weak peak for TiN(220). For the TiN-0.45 coating, the strongest peak was at 36.8°, illustrating that the TiN coating preferred the (111) orientation. The sharp peak indicated good crystallinity [16]. Some theories and hypotheses state that the preferred orientation of TiN depends on the lowest total energy, which is the result of competition between strain energy and surface energy [17]. When R(N2) was small, the TiN coating had no obvious preferred orientation, but when R(N2) gradually increased to 0.45, the sputtering power of the nitrogen was lower than that of Ar, and the average free path and adsorption energy of particles decreased upon increasing R(N2). The adsorbed atoms did not have enough mobility to move on the surface and migrate to the (111) plane at lower energy position, so they formed columnar structures perpendicular to the surface due to competitive grain growth. When R(N2) continued to increase to 0.55, the preferred TiN orientation changed from (111) to (200), because upon increasing the nitrogen flux ratio, the degree of nitriding of the coating increased. Its deposition rate decreased, leading to an increase in the surface diffusion capacity of the deposited particles [18]. This is consistent with previous studies [19,20].
The texture coefficient, grain size and lattice parameters of the microstructure were calculated from the XRD patterns of the coatings. The texture coefficient (Tc) determining the degree of the preferred orientation was calculated by formula (1) [21]:
T c = I m ( hkl ) / I 0 ( hkl ) 1 / n 1 n I m ( hkl ) / I 0 ( hkl )
where Im(hkl) is the integrated intensity of the hkl plane, I0(hkl) is the relative intensity of the hkl plane obtained from the JCPDS card, and n is the number of reflections. As shown in Figure 2, the texture coefficient of the TiN coatings was calculated from their respective XRD patterns using Equation (1). For each R(N2), the value of n was 4. As the R(N2) increased, the value of Tc for the TiN(111) orientation increased first and then decreased, in which the largest value of Tc was observed at R(N2) = 0.45.
Figure 3a depicts the distribution of the lattice parameters of the TiN coatings at different R(N2). The lattice parameters increased from 4.240 Å to 4.266 Å as R(N2) increased from 0.25 to 0.55 (JCPDS No.87-0629), obtained using MDI Jade 6 software [22]. In this report, the resulting increase in the lattice parameters is consistent with previous reports [23,24]. The lattice parameter is generally 4.240 Å at ambient temperature. Soudgren et al. proposed that lower lattice parameters may be attributed to a reduction in the ratio of N and Ti in the TiN coatings [23].
Scherer’s formula was used to calculate the grain size of the TiN coatings [25].
D = 0.9 λ B cos θ
where λ is the wavelength of the X-ray source (1.54056 Å), B is the FWHM of diffraction lines, and θ is the diffraction angle. The grain size approximately showed a decreasing trend as the nitrogen flux ratio increased, as shown in Figure 3b. This was because the mobility of the deposited atoms decreased, resulting in less diffusion. On the other hand, the sputtering energy of the atoms decreased as the sputtering rate decreased under a high nitrogen flux ratio. The formation of nanoparticles in the coating is affected by the ion energy, ion flux, trace impurities, texture and other factors [26]. Adatoms with low energy had less mobility to slip on the surface, and were dispersed across the grains and grain boundaries to form coarse grains. Therefore, the grain size of the TiN coating decreased as the nitrogen flux ratio increased. However, when R(N2) was 0.55, the grain size of the TiN coating increased, and agglomerated particles appeared due to the random Brownian motion of the particles. This made it possible for the particles to collide and adhere directly at a high nitrogen flux ratio [27].
Figure 4 shows the surface morphology and cross-sectional FESEM micrographs (insert) of the TiN coatings. The deposit rates of the TiN coatings were calculated based on the thickness and deposit time. The largest and smallest values were 4.3 nm/min and 2.8 nm/min at R(N2) = 0.25 and 0.55, respectively. The thickness of the TiN coatings decreased linearly as the nitrogen flux ratio increased from 0.25 to 0.55 because the sputtering rate of Ti decreased as the nitrogen flux ratio increased [28].
The surface morphology of the TiN coatings changed obviously at different nitrogen flux ratios. As shown in Figure 4a, the grains of the TiN-0.25 coating showed a tri-pyramid shape and uneven particle size with large gaps. When the nitrogen flux ratio increased, the particles size became smaller, and the structure became denser (Figure 4 and Figure 5). However, when R(N2) increased to 0.55, large particles reappeared, which is consistent with changes in the grain size. Combining Figure 1 and Figure 4 shows that the preferred orientation changed from (200) to (111), the surface of the coating became uniform, and dense particles with a clear interface formed. Hence, the TiN-0.45 coating exhibited a dense columnar microstructure with well-defined grain boundaries.

3.2. Mechanical Performance of TiN Coatings

The mechanical properties of the TiN coatings measured by nano-indentation tests are shown in Table 1. Nano-indentation is a common method for determining the Young’s modulus of coatings. The accuracy of the test is strongly influenced by the surface quality of the material [29], so the roughness and grain size differences of the coating surface may be the main reason for the large deviations in its elastic modulus and hardness. The hardness and elastic modulus of the TiN coatings dramatically decreased as the nitrogen flux ratio increased. The mechanical properties of the coatings were affected by grain size, internal microstress, orientation, and other factors. According to the Hall–Petch relationship, the hardness of the material is inversely proportional to the grain size [30]. Combined with the results of the previous grain size calculations, our conclusions are consistent with this relationship. The TiN-0.45 coating had the greatest hardness and elastic modulus of 26.1 GPa and 329.5 GPa, respectively, which was similar to most of the previous studies on TiN [31]. One previous study [32] indicated that the (111) texture coefficient is a key factor of coating hardness, which is due to the hardest orientation of TiN being (111).
Figure 6 shows the adhesion results of the TiN coating. The magnitude of the acoustic signal depended on the peeling of the coating. The location of the first crack (Lc1) was determined by combining the acoustic signal and the scratch morphology of the TiN coating at R(N2) = 0.25, 0.35, 0.45 and 0.55, which occurred at 1.8, 3.1, 13.6 and 7.8 N, respectively. The loads at which the coating completely peeled off (Lc2)) were 2.3, 5.0, 17.2 and 8.8 N, respectively. This suggests that the adhesion between the TiN coating and steel substrate increased and then decreased with the increase in nitrogen flux ratio. The adhesion was influenced by the thickness, microstrain and atomic arrangement [33]. When R(N2) was less than 0.45, the microstrain increased, and the film thickness decreased. Therefore, the thickness overcame the effect of microstrain and improved the adhesion. As the nitrogen flux ratio continued to increase, the energy of the adsorbed atoms decreased, so atoms were severely attenuated, the compactness of the coating decreased, and the microstrain increased. Combined, these effects reduced the adhesion of the TiN coatings. As shown in Figure 6c, the TiN-0.45 coating had a few chips in its surface but no significant coating shedding. The Lc2 of this coating is comparable to the Ti-TiN-multilayer PVD coatings with a thickness of about 2.7 μm [34].

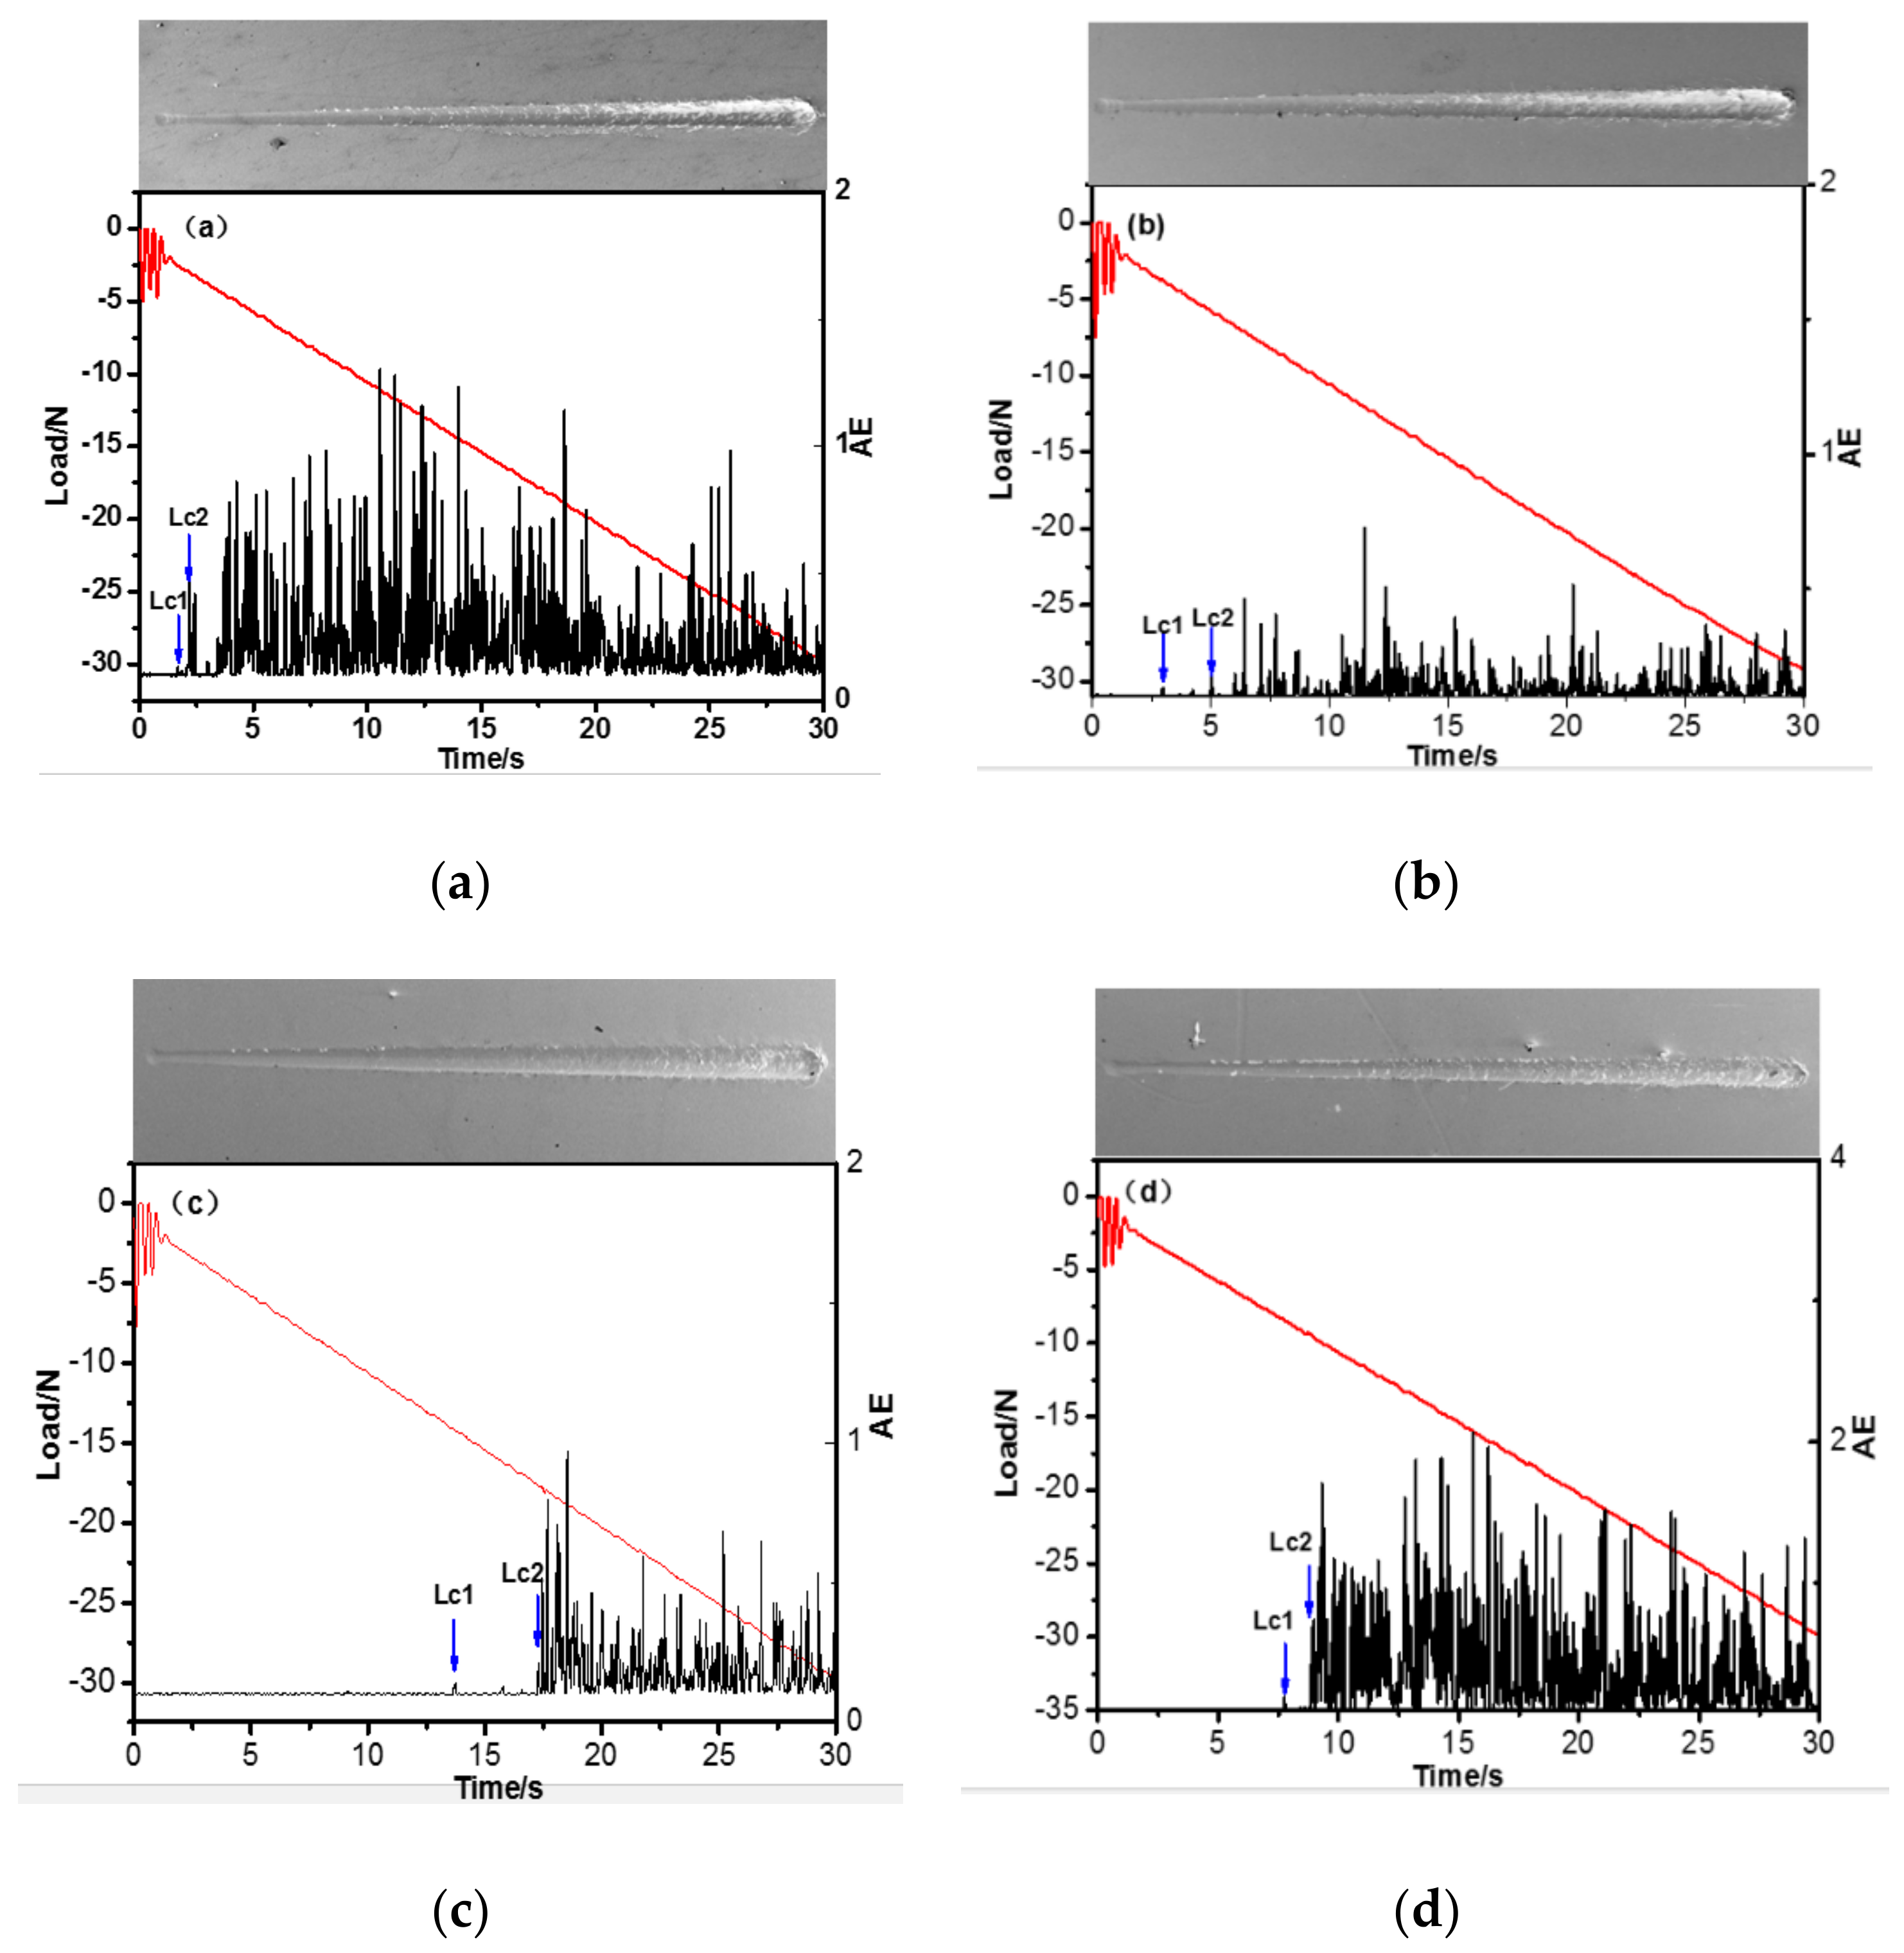
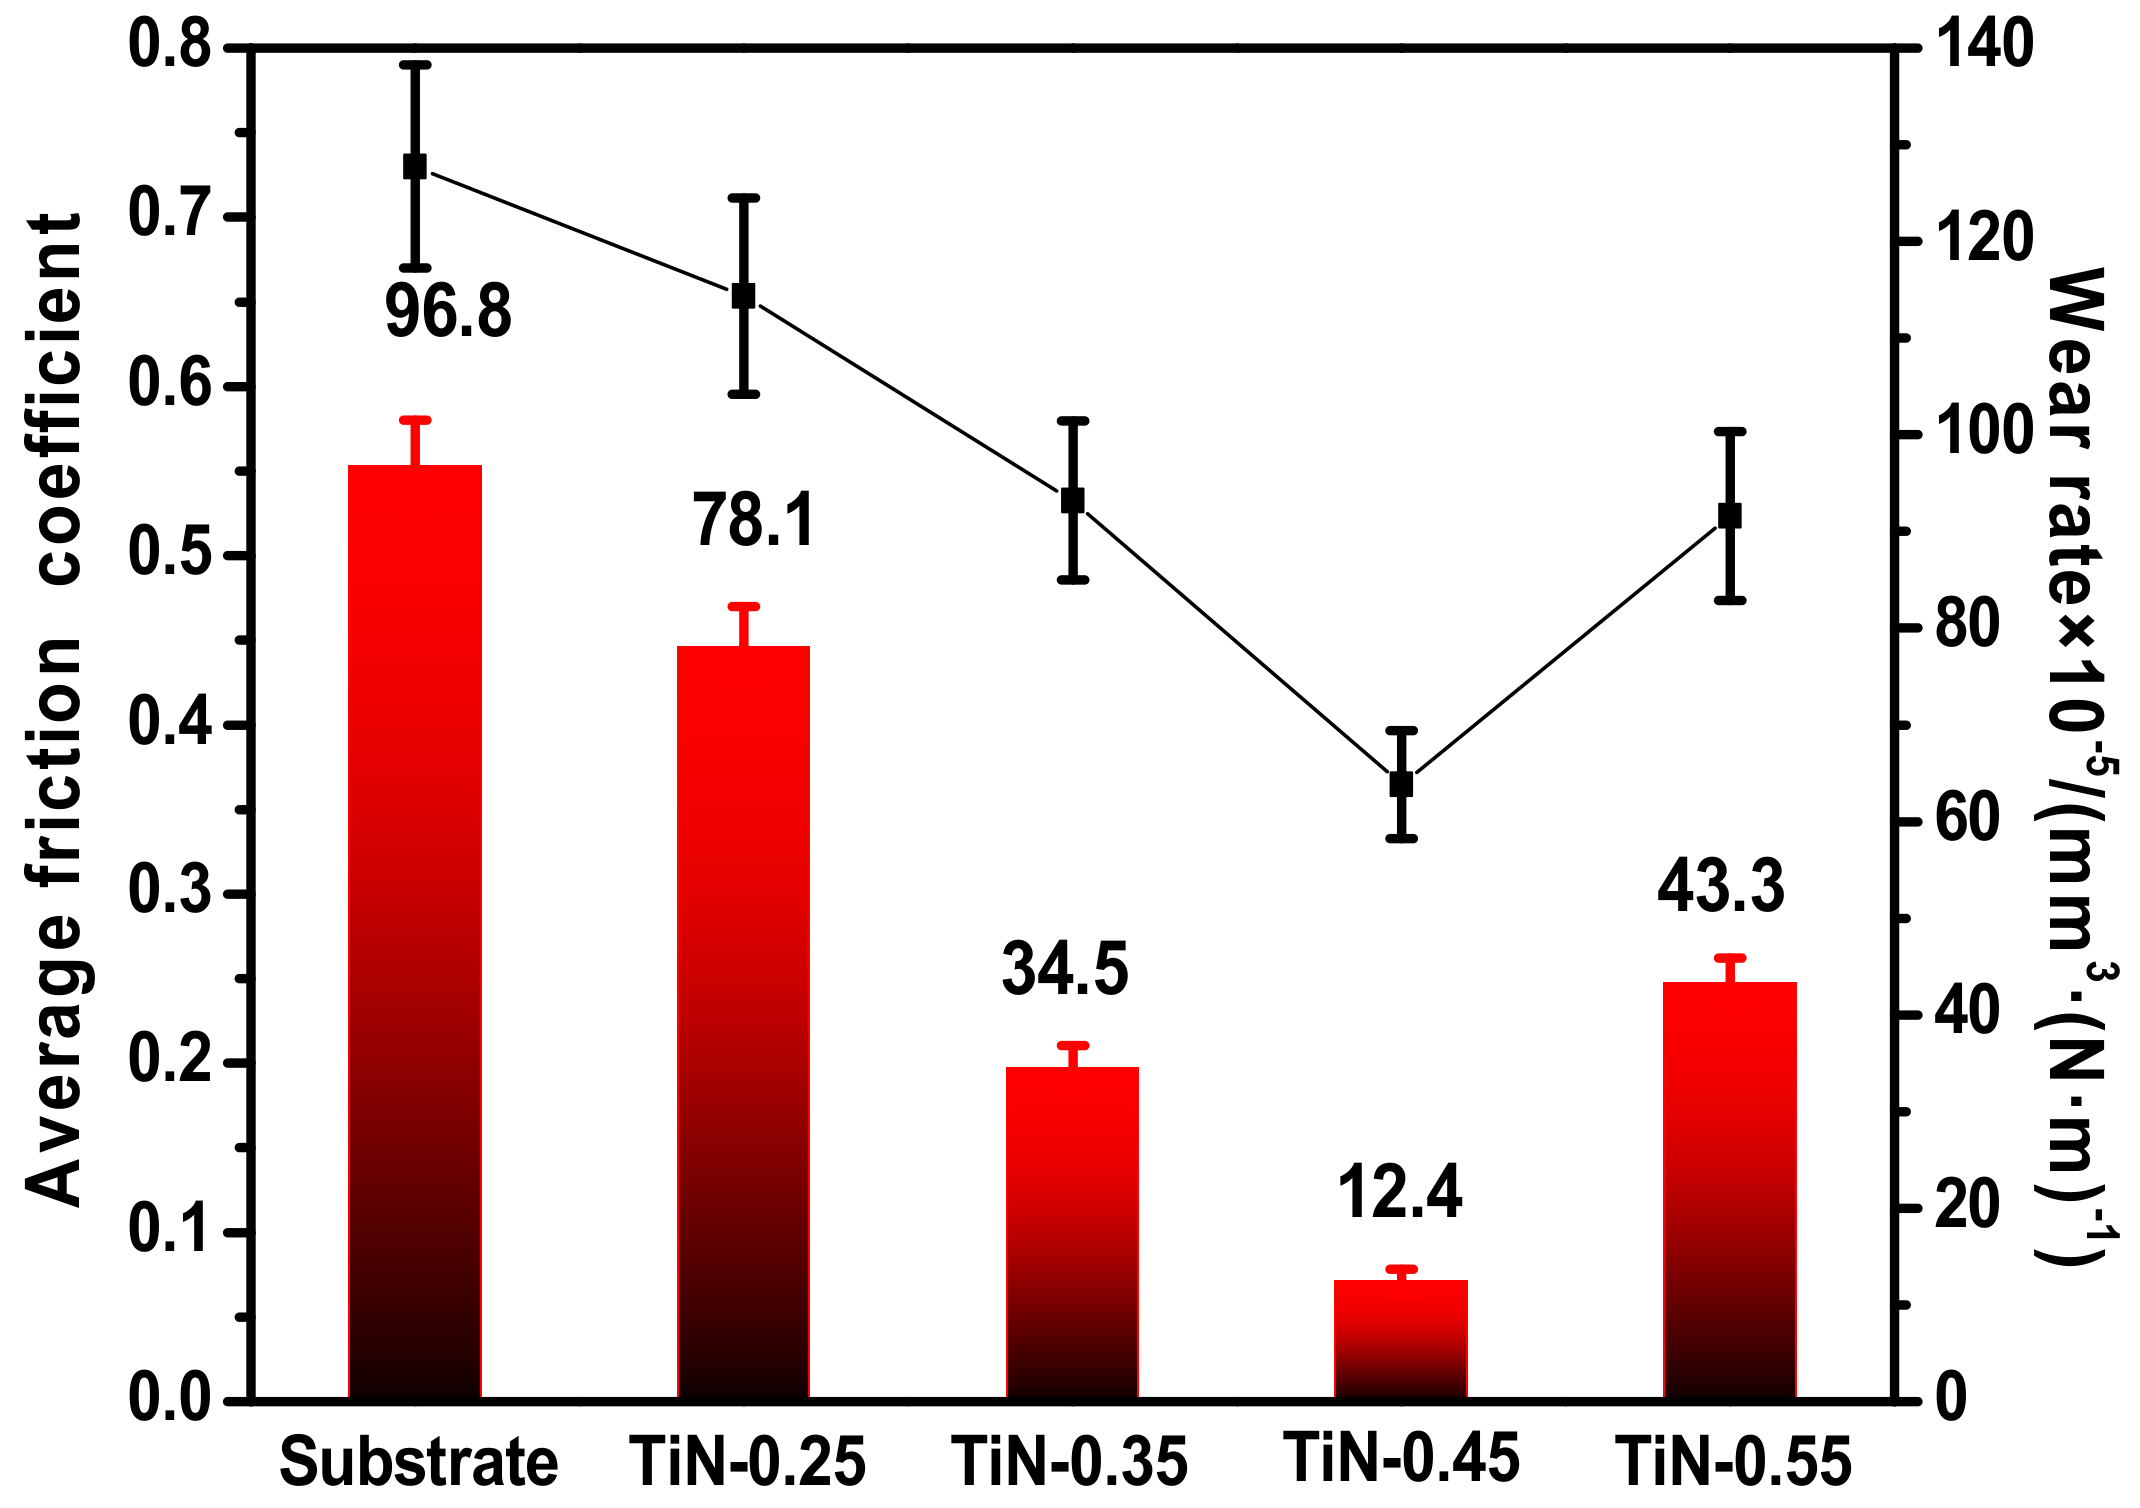
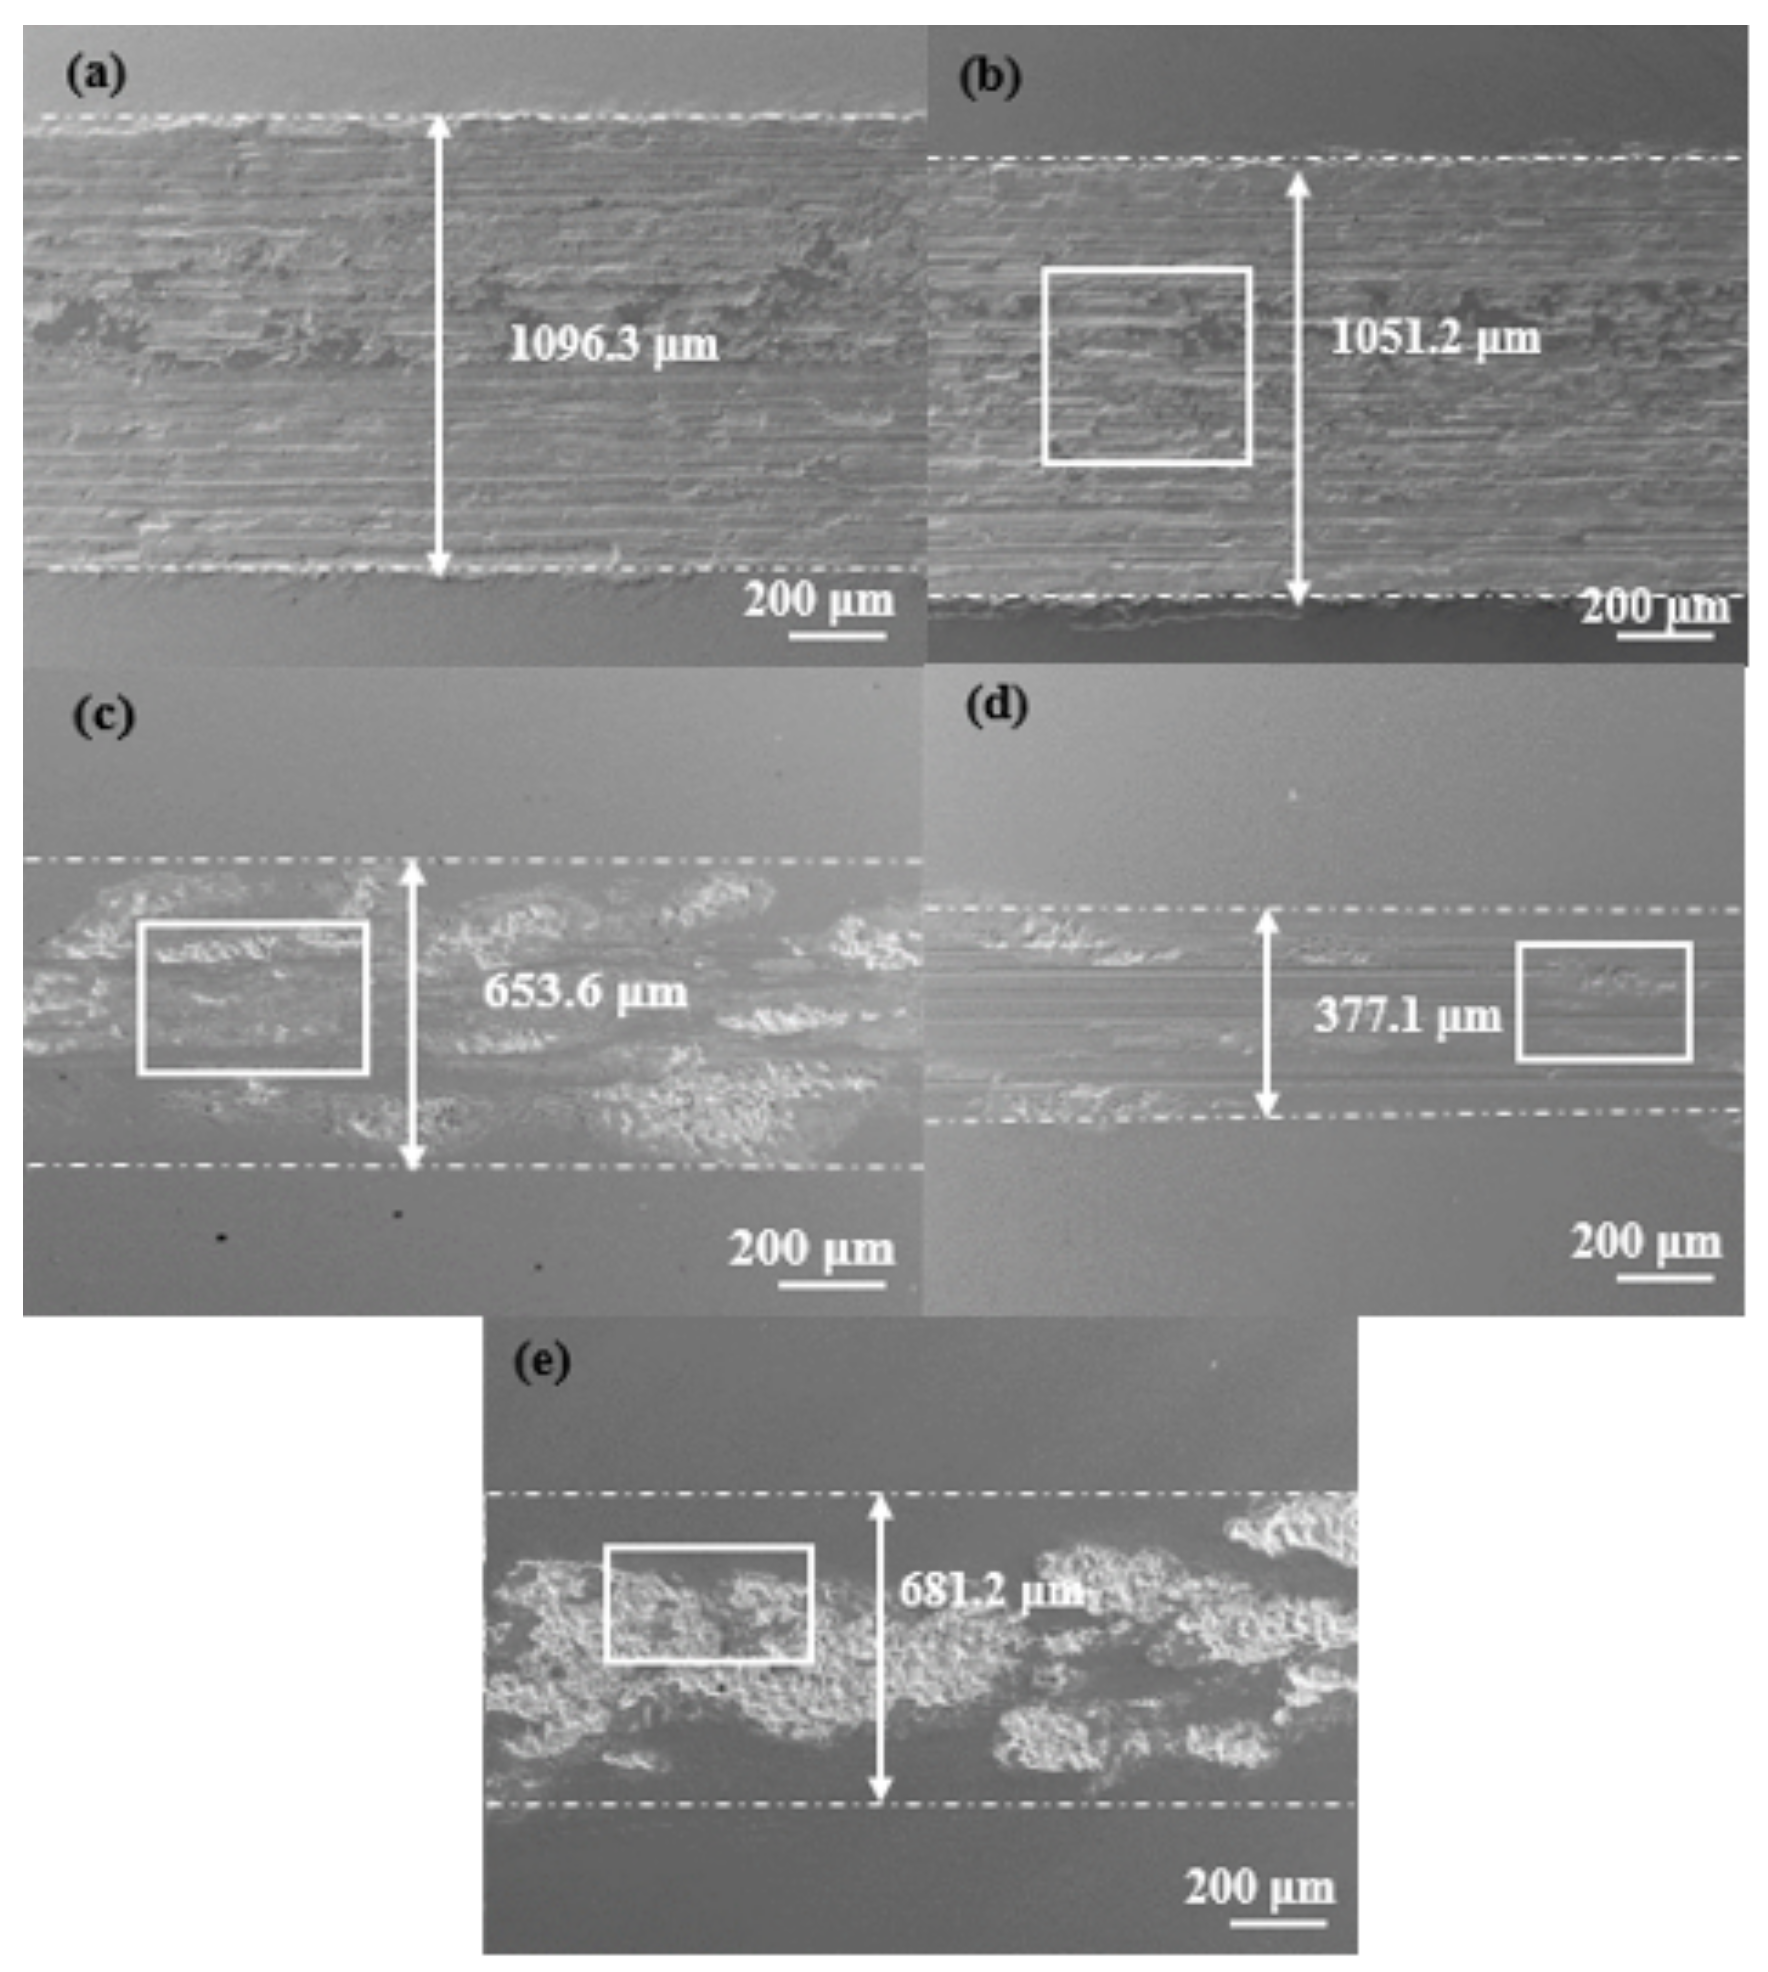
3.3. Tribological Performance

Figure 7 shows the friction coefficient (COF) and wear rates for the uncoated and TiN-coated steel under unlubricated conditions at a load of 20 N. The TiN-coated steel showed a lower COF than the uncoated steel. The most striking case was for the TiN-0.45 coating, which showed the smallest COF of 0.36. Correspondingly, the TiN-0.45 coating possessed the lowest wear rate of 12.4 × 10⁻⁵ mm3N−1m−1, which was only one-eighth of the uncoated steel (96.8 × 10⁻⁵ mm3N−1m−1).
Figure 8 and Figure 9 show SEM images of the morphology of the wear track for flats and dual steel balls after tribological tests at a load of 20 N under unlubricated conditions. For the steel/steel system (Figure 8a), the surface of the wear track on the substrate steel was full of furrows and scratches. The width of the wear track was about 1096.3 μm and the diameter of the grinding steel ball reached 1074.5 μm. The TiN-0.25 coating showed a wear track surface morphology similar to that of the uncoated steel, indicating that the TiN-0.25 coating was almost worn out. This observation was confirmed by EDS analysis (Table 2), as indicated by the lower number of Ti and N atoms and larger number of Fe atoms inside the wear track. The other TiN coatings showed wear tracks with different surface morphologies. Especially for the TiN-0.45 coating (Figure 8d), a smoother surface was observed for the wear track on both the flat and steel ball, suggesting it had excellent wear resistance. The EDS analysis in Table 2 also supports the SEM observation.
The values of H/E and H3/E2 are more suitable for predicting the failure resistance of PVD coatings during unlubricated sliding [35]. A higher value of H/E means that stress can be distributed over a larger area, thereby delaying the failure of a coating. The higher value of H3/E2 means a coating possesses greater toughness, thus improving a sample’s resistance to mechanical failure. This is consistent with the tribological properties of the TiN coating. Of the four TiN coatings, the TiN-0.45 coating had the largest H/E and H3/E2 value and, therefore, the best wear resistance.

4. Conclusions

TiN coatings deposited at different nitrogen flux ratios presented different microstructures and mechanical properties. The effects of nitrogen flux ratio on the microstructure were studied in terms of lattice orientation, grain size and lattice coefficient. The influence of nitrogen flux on the coating deposition rate, elastic modulus, adhesion and other mechanical properties of the TiN coatings was analyzed in detail. The following is a summary of our conclusions:
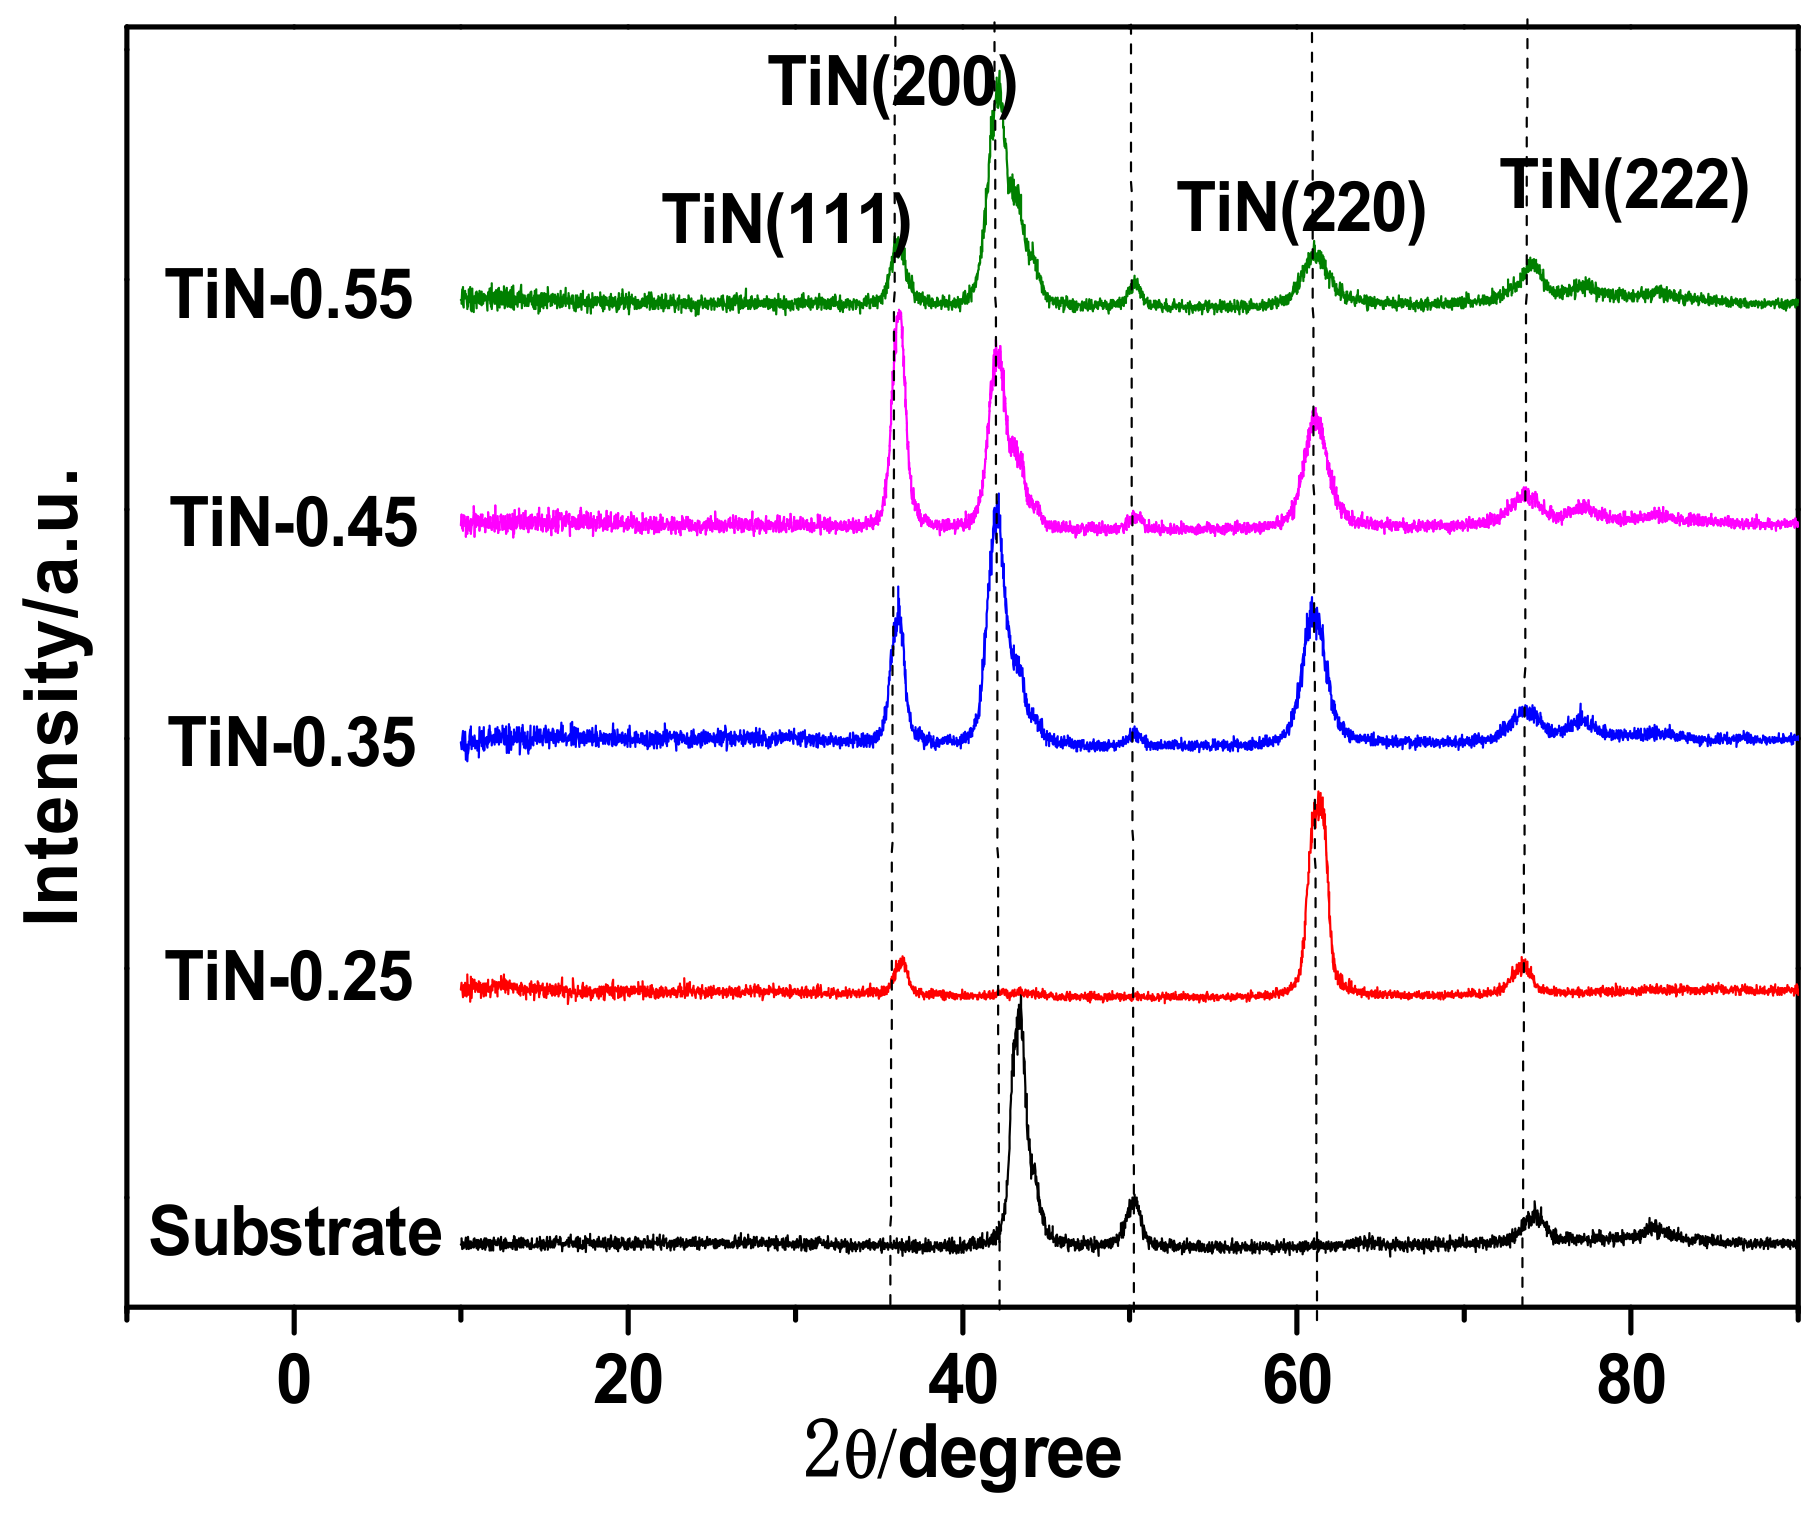
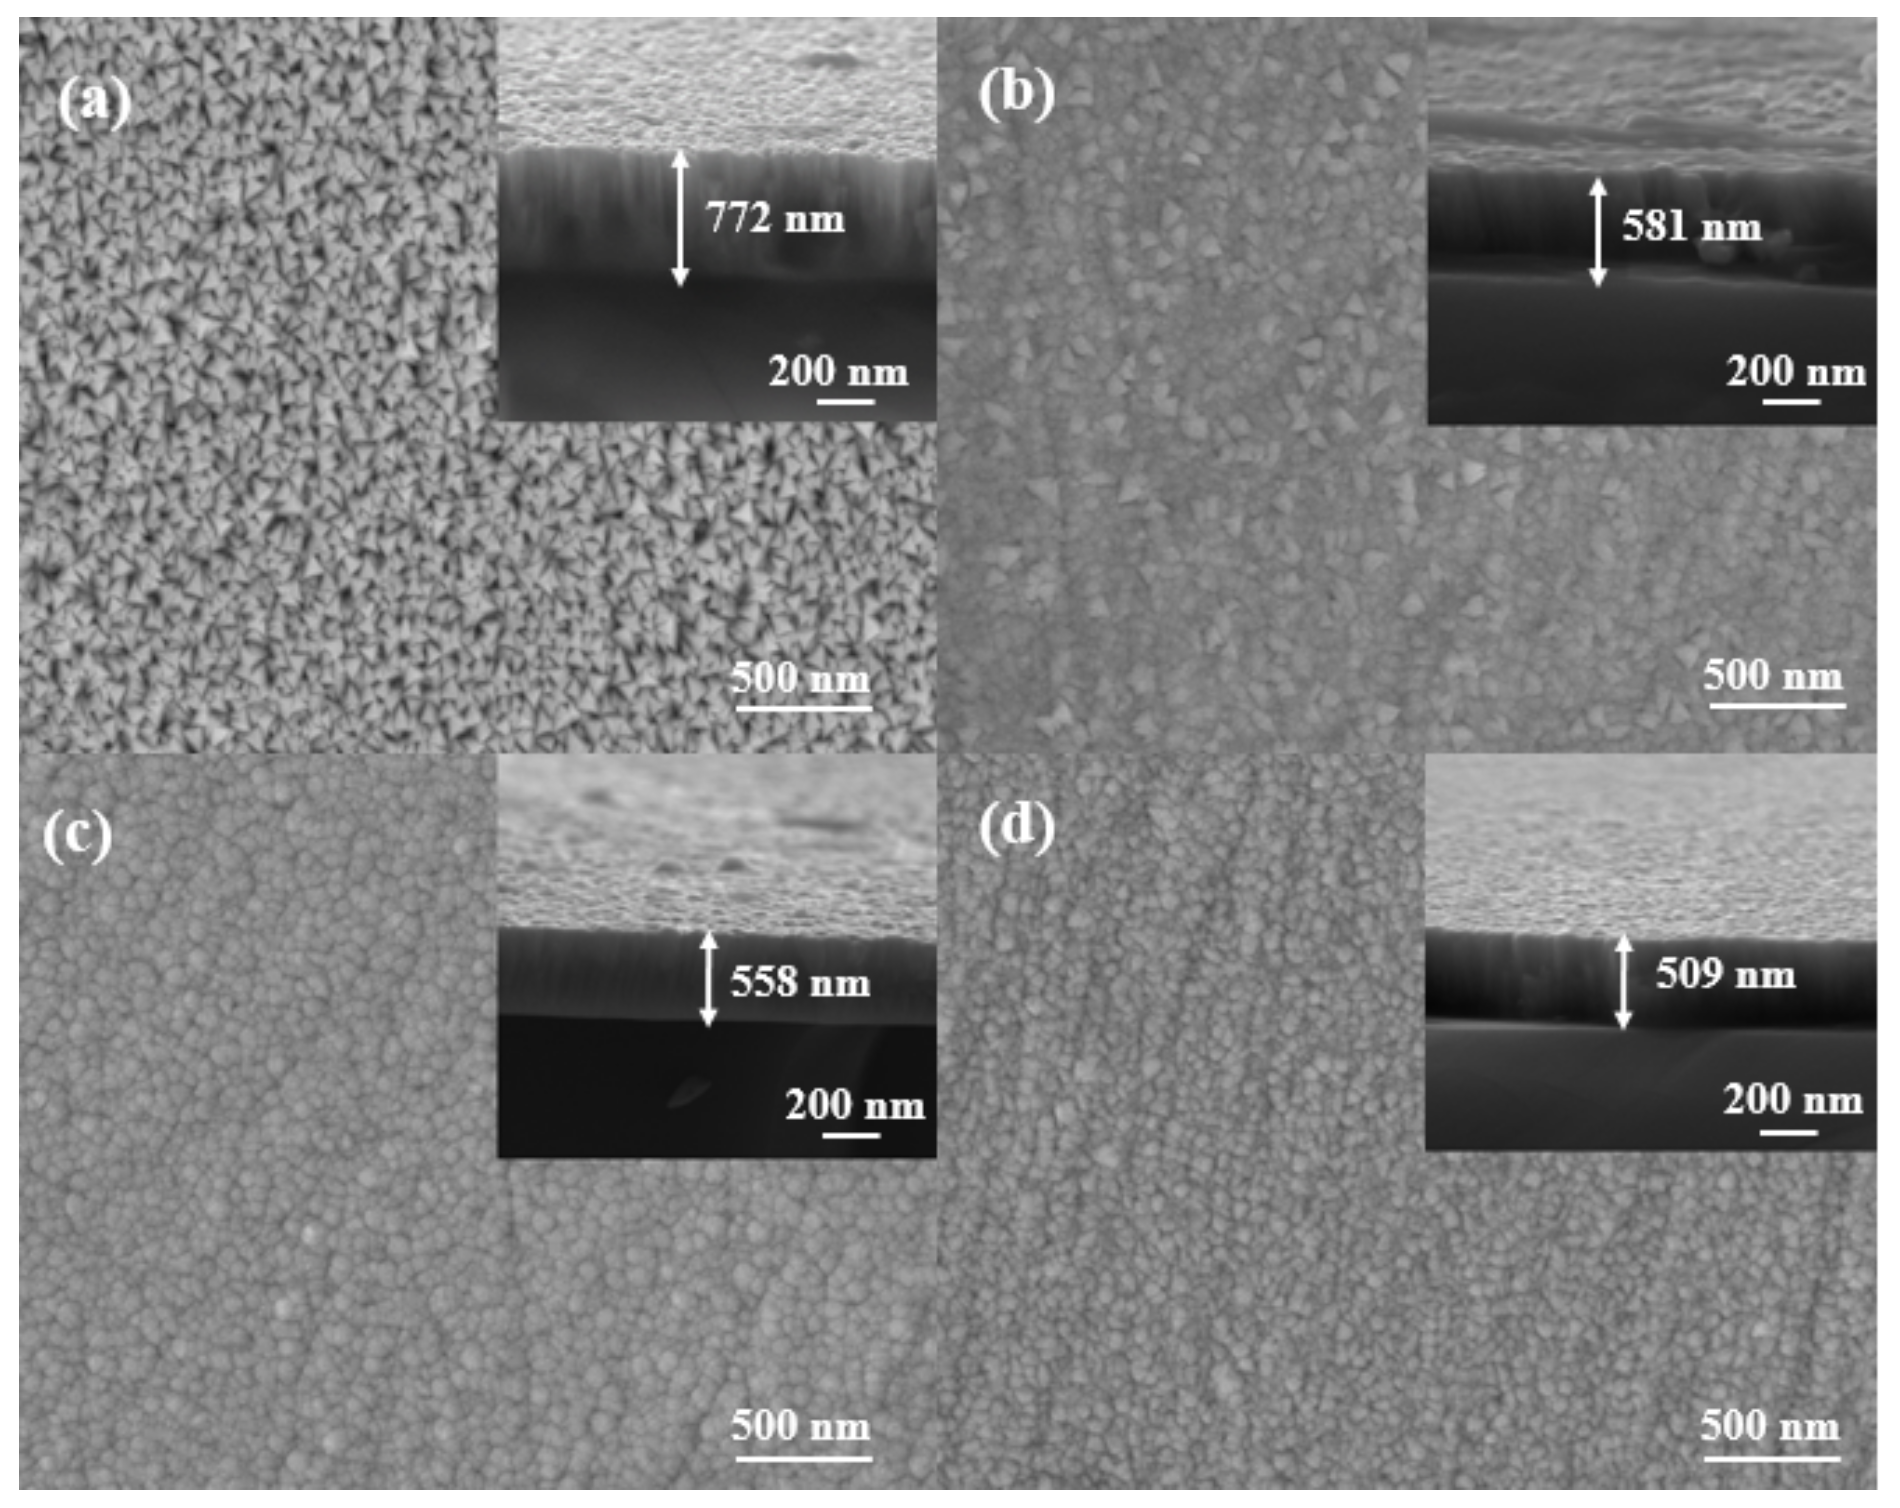
  • The phase structure of the TiN coatings deposited at R(N2) = 0.25, 0.35, 0.45, and 0.55 was mainly face-centered cubic TiN. All TiN coatings had obvious columnar crystals. The TiN-0.45 coating possessed the densest columnar microstructure of the four TiN coatings.
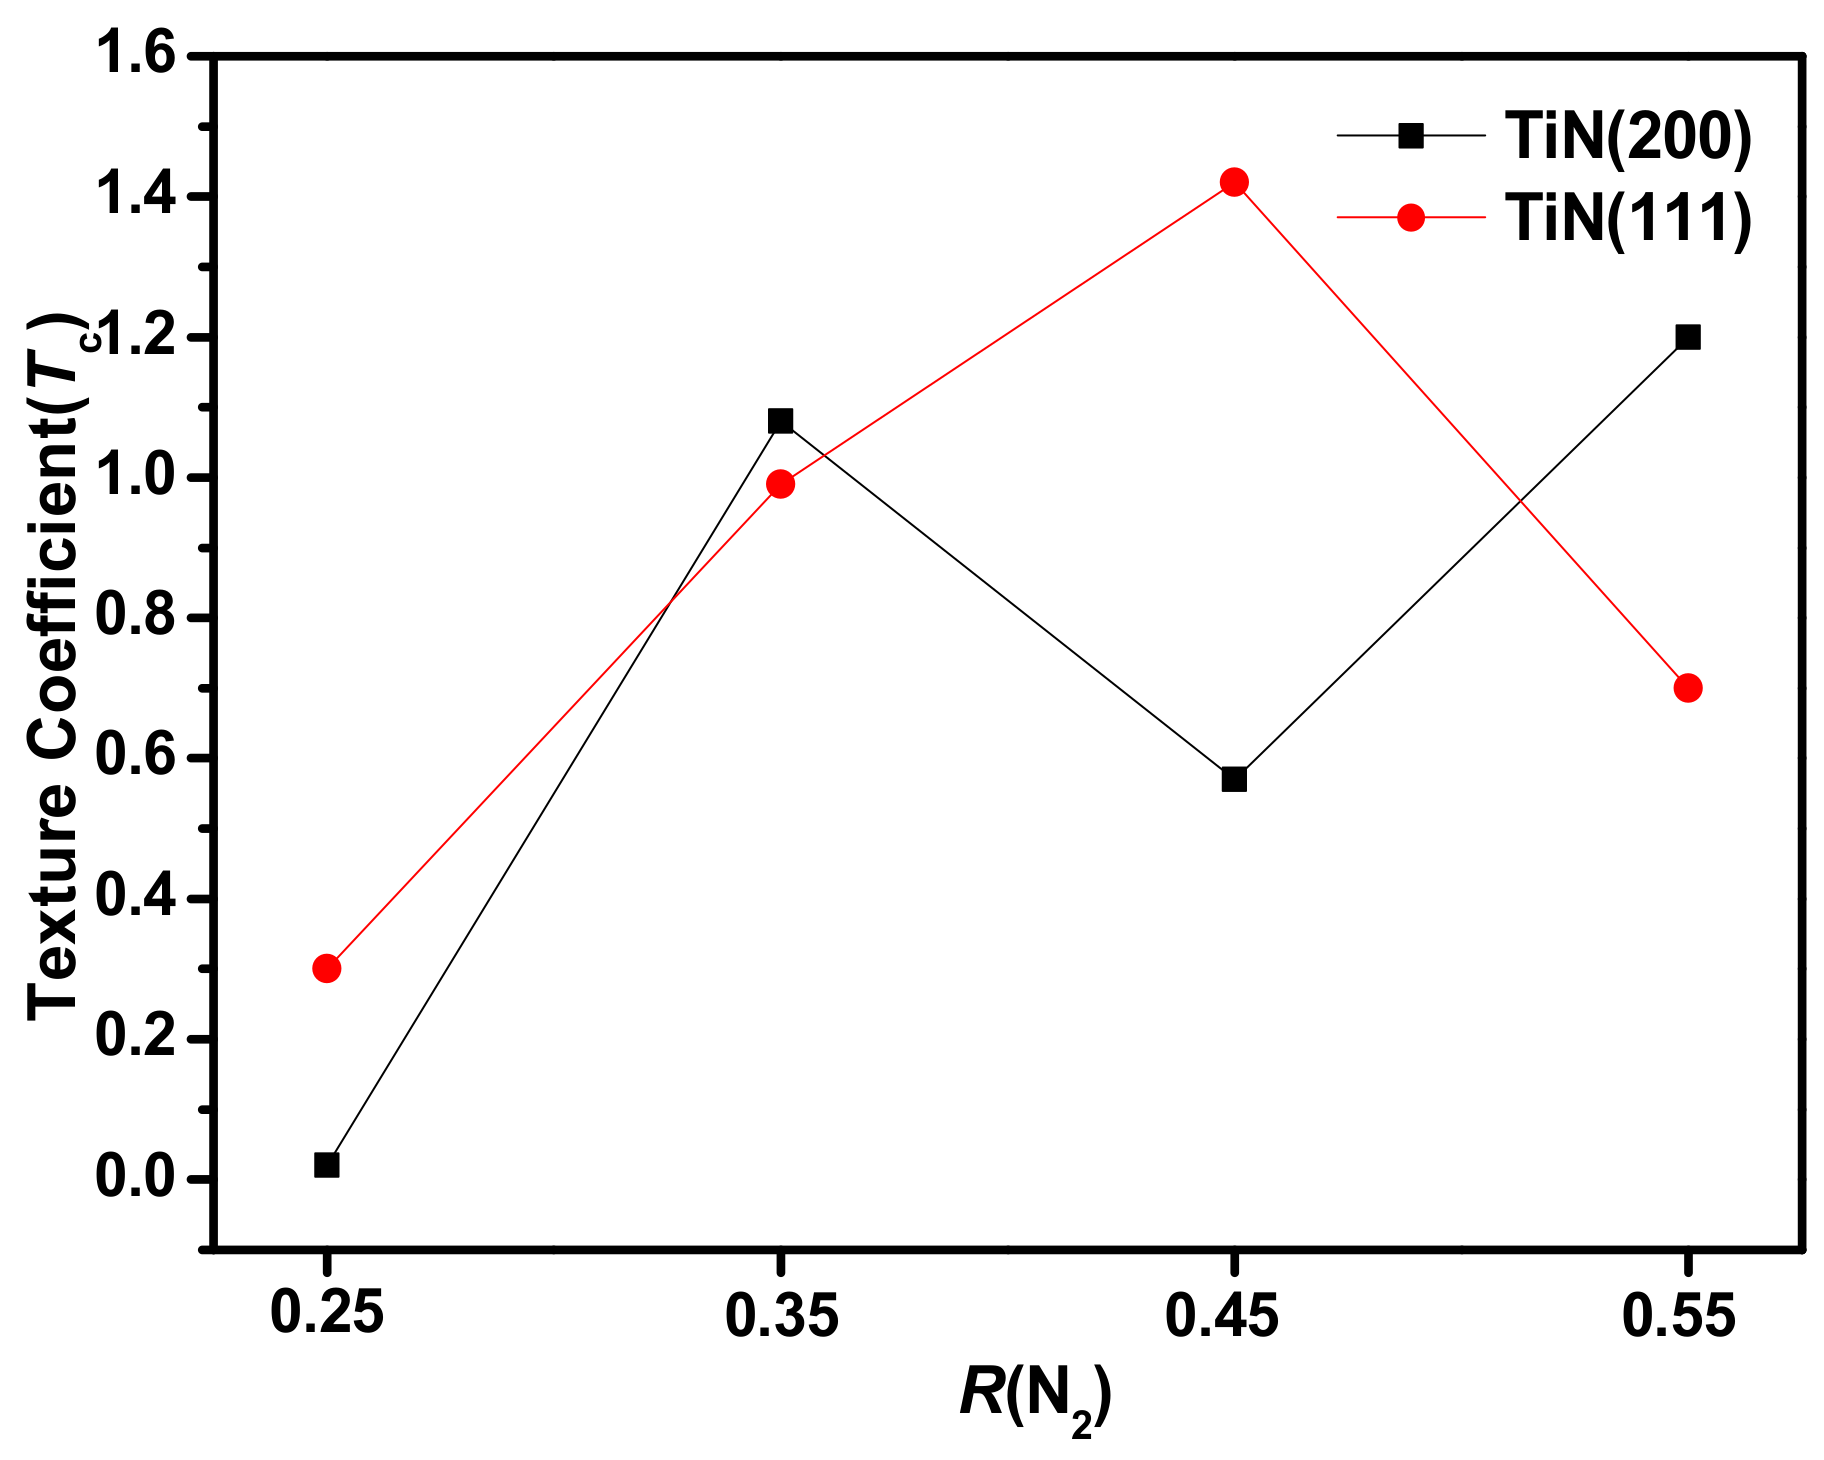
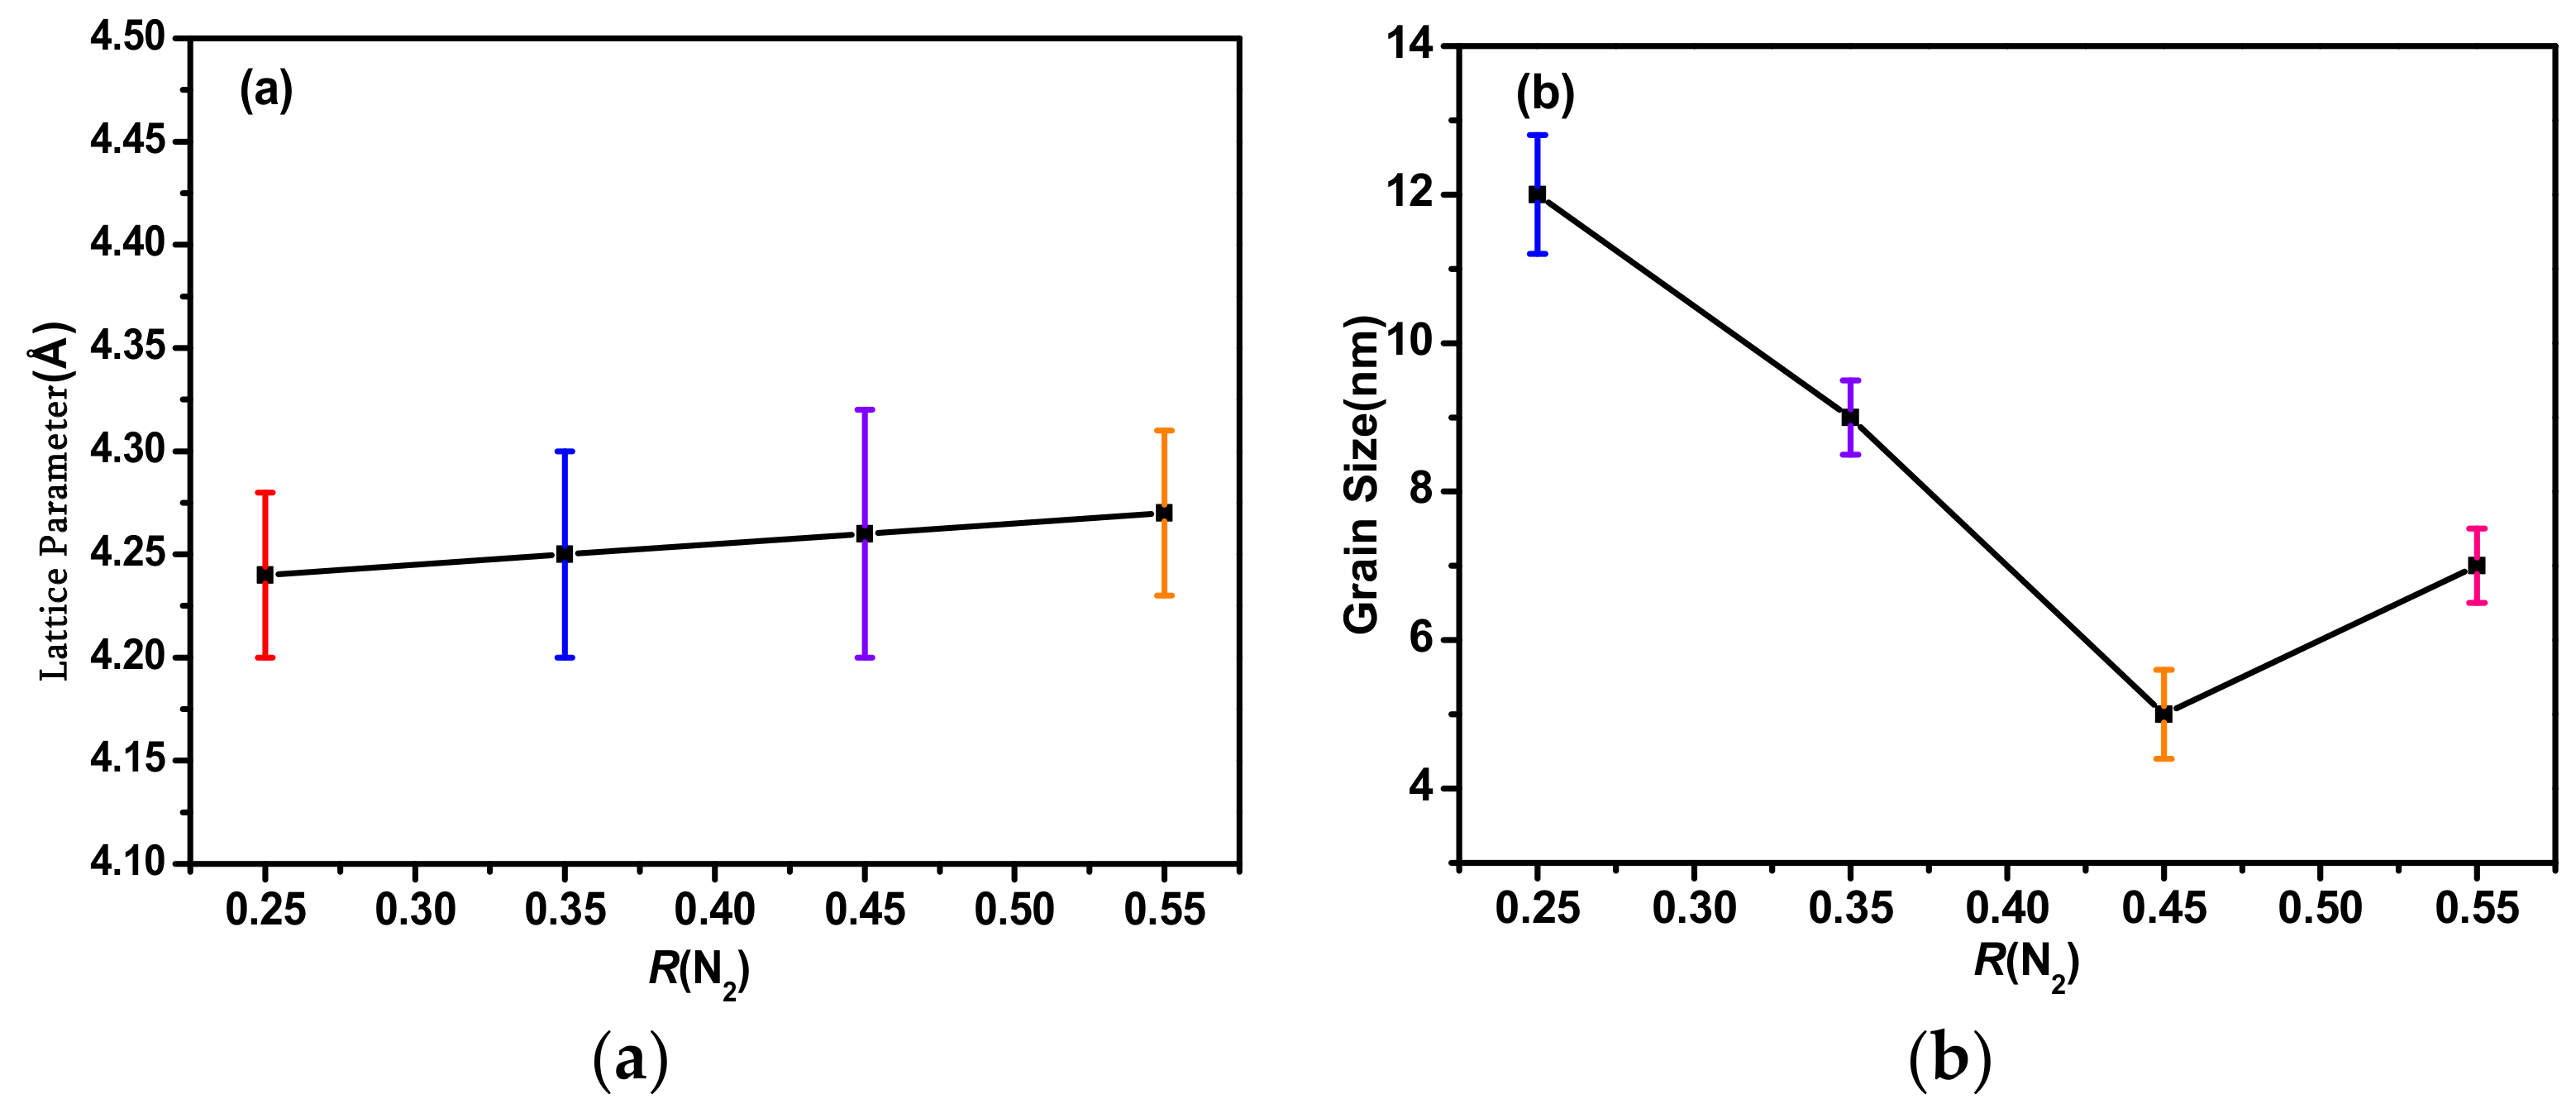
  • The nitrogen flux ratio strongly affected the mechanical properties of the coating, and the TiN-0.45 coating had the best mechanical properties (hardness, elasticity modulus, H/E, and H3/E2) due to its minimum grain size and (111) orientation. In addition, the thickness of the TiN coating was inversely correlated with R(N2) and decreased from 772 nm to 509 nm as R(N2) decreased.
  • The TiN-0.45 coating had the largest values of H/E and H3/E2 and, therefore, the best wear resistance among the four TiN coatings.

Author Contributions

Conceptualization, S.G.; Methodology, Y.W. and Q.L.; Investigation, X.F. and S.G.; Data curation, S.G., B.L. and H.Z.; Writing—original draft, X.F.; Supervision, Q.L.; Funding acquisition, X.F. and Y.W. All authors have read and agreed to the published version of the manuscript.

Funding

The authors acknowledge the financial support by National Natural Science Foundation of China (51975304), Scientific Research Funding of Weifang University of Science and Technology, China, under Grant No. KJRC2022011.

Institutional Review Board Statement

Not applicable.

Informed Consent Statement

Not applicable.

Data Availability Statement

Not applicable.

Conflicts of Interest

The authors declare no conflict of interest.

References

  1. Xi, Y.; Bai, Y.; Gao, K.; Pang, X.; Yang, H.; Yan, L.; Volinsky, A.A. Residual stress and microstructure effects on mechanical, tribological and electrical properties of TiN coatings on 304 stainless steel. Ceram. Int. 2018, 44, 15851–15858. [Google Scholar] [CrossRef]
  2. Bobzin, K. High-performance coatings for cutting tools. CIRP J. Manuf. Sci. Technol. 2017, 18, 1–9. [Google Scholar] [CrossRef]
  3. Sawada, S.; Tamai, T.; Hattori, Y. Effect of contact force on the friction coefficient of electroplated TiN films for automotive applications. J. Jpn. Inst. Met. 2009, 73, 659–665. [Google Scholar] [CrossRef] [Green Version]
  4. Lousa, A.; Esteve, J.; Mejia, J.P.; Devia, A. Influence of deposition pressure on the structural mechanical and decorative properties of TiN thin films deposited by cathodic arc evaporation. Vacuum 2007, 81, 1507–1510. [Google Scholar] [CrossRef]
  5. Ma, Y.; Wang, X.; Gu, X.; Zhang, H.; Lu, J.; Liu, H. Fabrication of Metallic Micro-Parts Reinforced with Nano-and Micro-Sized TiN Particles via Laser Shock Processing. J. Mater. Eng. Perform. 2022, 31, 786–800. [Google Scholar] [CrossRef]
  6. Franks, W.; Schenker, I.; Schmutz, P.; Hierlemann, A. Impedance characterization and modeling of electrodes for biomedical applications. IEEE Trans. Biomed. Eng. 2005, 52, 1295–1302. [Google Scholar] [CrossRef]
  7. Jeyachandran, Y.; Narayandass, S.; Mangalaraj, D.; Areva, S.; Mielczarski, J. Properties of titanium nitride films prepared by direct current magnetron sputtering. Mater. Sci. Eng. A 2007, 445, 223–236. [Google Scholar] [CrossRef]
  8. Toth, L.E. Refractory Materials, Transition Metal Carbides and Nitrides; Academic Press Inc.: New York, NY, USA, 1971; Volume 7, p. 88. [Google Scholar]
  9. Shukla, K.; Rane, R.; Alphonsa, J.; Maity, P.; Mukherjee, S. Structural, mechanical and corrosion resistance properties of Ti/TiN bilayers deposited by magnetron sputtering on AISI 316L. Surf. Coatings Technol. 2017, 324, 167–174. [Google Scholar] [CrossRef]
  10. Hua, M.; Ma, H.; Li, J.; Mok, C. Tribological behaviours of patterned PVD TiN spot coatings on M2 steel coated with different bias voltages. Surf. Coat. Technol. 2006, 200, 3612–3625. [Google Scholar] [CrossRef]
  11. Pihosh, Y.; Goto, M.; Kasahara, A.; Oishi, T.; Tosa, M. Influence of reacting nitrogen gas consistence on the properties of TiN films prepared by rf. magnetron sputtering. Appl. Surf. Sci. 2005, 244, 244–247. [Google Scholar] [CrossRef]
  12. Gerlach, J.; Höche, T.; Frost, F.; Rauschenbach, B. Ion beam assisted MBE of GaN on epitaxial TiN films. Thin Solid Film. 2004, 459, 13–16. [Google Scholar] [CrossRef]
  13. Chen, G.S.; Guo, J.J.; Lin, C.K.; Hsu, C.-S.; Yang, L.C.; Fang, J.S. Evaluation of radio-frequency sputter-deposited textured TiN thin films as diffusion barriers between copper and silicon. J. Vac. Sci. Technol. A Vac. Surf. Film. 2002, 20, 479–485. [Google Scholar] [CrossRef]
  14. Arshi, N.; Lu, J.; Joo, Y.K.; Lee, C.G.; Yoon, J.H.; Ahmed, F. Study on structural, morphological and electrical properties of sputtered titanium nitride films under different argon gas flow. Mater. Chem. Phys. 2012, 134, 839–844. [Google Scholar] [CrossRef]
  15. Stanishevsky, A.; Lappalainen, R. Tribological properties of composite Ti (N, O, C) coatings containing hard amorphous carbon layers. Surf. Coatings Technol. 2000, 123, 101–105. [Google Scholar] [CrossRef]
  16. Bin, D.; Tao, Y.; Hu, Z. The microstructure, mechanical and tribological properties of TiN coatings after Nb and C ion implantation. Appl. Surf. Sci. 2013, 284, 405–411. [Google Scholar] [CrossRef]
  17. Pelleg, J.; Zevin, L.Z.; Lungo, S.; Croitoru, N. Reactive-sputter-deposited TiN films on glass substrates. Thin Solid Film. 1991, 197, 117–128. [Google Scholar] [CrossRef]
  18. Lu, G.; Yu, L.; Ju, H.; Zuo, B.; Xu, J. Influence of nitrogen content on the thermal diffusivity of TiN films prepared by magnetron sputtering. Surf. Eng. 2020, 36, 192–198. [Google Scholar] [CrossRef]
  19. Banerjee, R.; Singh, K.; Ayyub, P.; Totlani, M.K.; Suri, A.K. Influence of the Ar/N2 ratio on the preferred orientation and optical reflectance of reactively sputter deposited titanium nitride thin films. J. Vac. Sci. Technol. A Vac. Surf. Film. 2003, 21, 310–317. [Google Scholar] [CrossRef]
  20. Li, T.Q.; Noda, S.; Tsuji, Y.; Ohsawa, T.; Komiyama, H. Initial growth and texture formation during reactive magnetron sputtering of TiN on Si (111). J. Vac. Sci. Technol. A Vac. Surf. Film. 2002, 20, 583–588. [Google Scholar] [CrossRef] [Green Version]
  21. Wang, Y.; Tang, W.; Zhang, L. Crystalline size effects on texture coefficient, electrical and optical properties of sputter-deposited Ga-doped ZnO thin films. J. Mater. Sci. Technol. 2015, 31, 175–181. [Google Scholar] [CrossRef]
  22. Material Data Inc. MDI Jade 6 User’s Manual; Material Data Inc.: Livermore, CA, USA, 2004. [Google Scholar]
  23. Arshi, N.; Lu, J.; Koo, B.H.; Lee, C.G.; Ahmed, F. Effect of nitrogen flow rate on the properties of TiN film deposited by e beam evaporation technique. Appl. Surf. Sci. 2012, 258, 8498–8505. [Google Scholar] [CrossRef]
  24. Sundgren, J.E. Structure and properties of TiN coatings. Thin Solid Film. 1985, 128, 21–44. [Google Scholar] [CrossRef]
  25. Warren, B.E. X-ray Diffraction; Addison Wesley Publishing Co.: London, UK, 1969. [Google Scholar]
  26. Chawla, V.; Jayaganthan, R.; Chandra, R. Structural characterizations of magnetron sputtered. Mater. Charact. 2008, 59, 1015–1020. [Google Scholar] [CrossRef]
  27. Mohapatra, S.S.; Ranjan, S.; Dasgupta, N.; Mishra, R.K.; Thomas, S. Nano-Carriers for Drug Delivery: Nanoscience and Nanotechnology in Drug Delivery; Elsevier: Amsterdam, The Netherlands, 2019. [Google Scholar] [CrossRef]
  28. Kiahosseini, S.R.; Larijani, M.M. Effects of nitrogen gas ratio on the structural and corrosion properties of ZrN thin films grown on biodegradable magnesium alloy by ion-beam sputtering. Appl. Phys. A 2017, 123, 759. [Google Scholar] [CrossRef]
  29. Qasmi, M.; Delobelle, P. Influence of the average roughness Rms on the precision of the Young’s modulus and hardness determination using nanoindentation technique with a Berkovich indenter. Surf. Coat. Technol. 2006, 201, 1191–1199. [Google Scholar] [CrossRef]
  30. Lee, J.H.; Nathanael, A.J.; Hong, S.I. Effect of nitrogen flow rate on the structure and properties of TiN thin films deposited onto β-type Ti-15Mo-3Nb-3Al-0.2Si alloy Substrates by Reactive Magnetron Sputtering. Adv. Mater. Res. 2012, 557, 1998–2001. [Google Scholar] [CrossRef]
  31. Lia, J.; Zheng, H.; Sinkovits, T.; Hee, A.C.; Zhao, Y. Mono and multiple TiN(/Ti) coating adhesion mechanism on a Ti–13Nb–13Zr alloy. Appl. Surf. Sci. 2015, 355, 502–508. [Google Scholar] [CrossRef]
  32. Huang, J.H.; Lau, K.W.; Yu, G.P. Effect of nitrogen flow rate on structure and properties of nanocrystalline TiN thin films produced by unbalanced magnetron sputtering. Surf. Coat. Technol. 2005, 191, 17–24. [Google Scholar] [CrossRef]
  33. Huang, J.H.; Ho, C.H.; Yu, G.P. Effect of nitrogen flow rate on the structure and mechanical properties of ZrN thin films on Si(1 0 0) and stainless steel substrates. Mater. Chem. Phys. 2007, 102, 31–38. [Google Scholar] [CrossRef]
  34. Ali, R.; Sebastiani, M.; Bemporad, E. Influence of Ti–TiN multilayer PVD-coatings design on residual stresses and adhesion. Mater. Des. 2015, 75, 47–56. [Google Scholar] [CrossRef]
  35. He, C.; Zhang, J.; Xie, L.; Ma, G.; Du, Z.; Wang, J.; Zhang, D. Microstructure, mechanical and corrosion properties of TiN/Ni nano-multilayered films. Rare Metals. 2019, 38, 979–988. [Google Scholar] [CrossRef]
Figure 1. XRD pattern of the TiN coatings.
Coatings 13 00078 g001
Figure 2. The texture coefficient of the TiN coating at different R(N2).
Coatings 13 00078 g002
Figure 3. (a) Lattice parameter and (b) grain size of the TiN coating at different R(N2).
Coatings 13 00078 g003
Figure 4. Surface morphology and cross-sectional images (insert) of (a) TiN-0.25 (b) TiN-0.35 (c) TiN-0.45 (d) TiN-0.55 coatings.
Coatings 13 00078 g004
Figure 5. Three-dimensional representation (15 × 15 μm2) of the surface morphology of the (a) TiN-0.25 (b) TiN-0.35 (c) TiN-0.45 (d) TiN-0.55 coating.
Coatings 13 00078 g005
Figure 6. The scratch morphologies and results of scratch test of the (a) TiN-0.25 (b) TiN-0.35 (c) TiN-0.45 (d) TiN-0.55 coating. (Red line is load, black line is acoustic emission intensity (AE).)
Coatings 13 00078 g006
Figure 7. Wear rates and friction coefficient for the steel substrate and the TiN coating sliding against GCr15 steel ball under unlubricated conditions. (Line graph is friction coefficient, and bar graph is wear rates.)
Coatings 13 00078 g007
Figure 8. SEM images morphology for wear scars on the (a) substrate and TiN coating at R(N2) of (b) 0.25, (c) 0.35 (d) 0.45 (e) 0.55 at load of 20 N under unlubricated conditions. White square is the EDS test area.
Coatings 13 00078 g008
Figure 9. SEM images of morphology for wear scars on the dual ball sliding against (a) substrate and TiN coatings at R(N2) of (b) 0.25, (c) 0.35 (d) 0.45 (e) 0.55 at load of 20 N under unlubricated conditions.
Coatings 13 00078 g009
Table 1. Mechanical properties of the TiN coatings.
R(N2)Roughness
(nm)
Hardness
(GPa)
Elasticity modulus
(GPa)
H/EH3/E2
(GPa)
0.2526.03 ± 0.1518.50 ± 4.10278.0 ± 28.70.067 ± 0.0080.082 ± 0.012
0.356.81 ± 0.1223.32 ± 2.21315.2 ± 31.10.074 ± 0.0120.128 ± 0.017
0.451.46 ± 0.0826.14 ± 2.07329.5 ± 28.70.080 ± 0.0070.165 ± 0.025
0.553.90 ± 0.1420.87 ± 3.52296.8 ± 30.10.007 ± 0.0060.103 ± 0.009
Table 2. EDS analysis of the wear scars corresponding to the white frame in Figure 8 of the four TiN coatings under 20 N load under unlubricated conditions.
R(N2)Element (at.%)
TiNFeCr
0.2522.574.4030.7742.26
0.3552.9824.2617.944.82
0.4560.4528.7610.010.78
0.5556.3316.8123.083.78
Disclaimer/Publisher’s Note: The statements, opinions and data contained in all publications are solely those of the individual author(s) and contributor(s) and not of MDPI and/or the editor(s). MDPI and/or the editor(s) disclaim responsibility for any injury to people or property resulting from any ideas, methods, instructions or products referred to in the content.

