1. Introduction
Numerous approaches to fabricate one- or multi-dimensional nanoscale and nanostructured materials have been developed [
1,
2,
3,
4]. Among them, anodic oxidation, which is a self-organization method, represents a direct and elegant method [
5,
6]. A highly ordered nano-porous or nanotubular oxide layer can be formed under tuned anodization parameters. Metals such as Ti, Zr, Hf, Nb, Ta and Al have been successfully used to grow nanostructured oxide layers by anodic processing in fluoride containing electrolytes [
7,
8,
9,
10]. The anodically grown nanotube arrays have a wide range of uses in gas sensors, photocatalysis, biomedicine, and energy conversion, etc., [
11,
12,
13,
14,
15,
16,
17], thanks to their unique properties and good functionality.
Except for the pure metals, anodic nanostructured oxides have also been successfully grown on binary alloys such as TiAl, TiNb, TiZr, TiTa or biomedical alloys with more complex components, for example Ti6Al4V [
18,
19,
20,
21,
22]. Compared to pure metals, the “anodizing window” could be drastically widened. In the selection of electrochemical parameters, the alloys have more “flexibility” to successfully form the self-organized oxide. Moreover, geometries could be established that are not possible in the pure metal [
23,
24]. Recently, enlightened by the study of “entropy-stabilized oxides”, single phased nanotube consisting of mixed metal oxides have been developed, which formed on equi-atomic TiZrHfNbTa high-entropy alloy (HEA) [
25]. These nanotubes consisting of multi-component oxides are highly stable at elevated temperatures, which gives them the potential to be used in devices working under high-temperature [
26]. However, the growth mechanism and how the anodic conditions, including anodization parameters and bath composition, influence the growth of tube and morphology, such as diameter, length, and tube wall structure, remains unknown.
In the present work, by controlling the anodization parameters (applied voltages and time) and bath compositions (fluoride concentration and water content), we reveal how the synthetic parameters influence the tube growth and morphology formed on equi-atomic TiZrHfNbTa HEA, therefore gaining insight into the growth mechanism and the feasibility of controlling the morphology of multi-component oxide nanotubes.
2. Materials and Methods
Fabrication of HEA precursor: Equal atom percent pure metals (purity > 99 wt.%) of Ta, Nb, Hf, Zr, and Ti were used as raw materials to form the alloy ingots by arc-melting. The oxygen in the argon atmosphere was guttered by pure Ti. The casting bars were sealed in vacuum quartz tubes, then annealed in a chamber oven at 1400 °C for 24 h and subsequently water-quenched to room temperature. Sheets of size 10 × 10 × 1 mm were ground with silicon carbide papers of different grades, then polished using 0.1 mm diamond paste. Finally, the samples were ultrasonically cleaned in acetone and dried.
Anodic oxidation: Anodizations were conducted by a two-electrode system. A platinum gauze was set as cathode and TiZrHfNbTa HEA as anode. The solution was ethylene glycol containing different amounts of ammonium fluoride and deionized water (
Table 1). Reagent-grade chemicals were used to prepare the electrolyte. The anodization potential was set from 20–100 V for different times from 2–10 h (
Table 1) and was performed at 20 °C using a high-voltage potentiostat IT6514E. The oxidized samples were rinsed in deionized water after the anodization, then dried in N
2 stream.
Microstructure Characterization: Morphological characterization of the nanotubes was examined by field emission scanning electron microscope (FE-SEM, Zeiss SupraTM 55, Carl Zeiss AG, Oberkochen, Germany). The thickness of the oxidation film and nanotubes’ diameter were determined by analyzing the cross-sectional and bottom-view images. The samples were mechanically scratched. The wall thickness of the nanotubes was measured by TEM (Tecnai G2 F30 S-TWIN, 300 kV, FEI company, Hillsboro, OR, USA).
3. Results and Discussion
3.1. General Aspects of Growth of HEO Nanotube Arrays
Typical equi-atomic TiZrHfNbTa HEA possesses a single body-centered cubic (BCC) crystal structure with no secondary phases. All elements are metallic binding without any formation of intermetallic compounds. The as cast alloy has dendrite and inter-dendrite regions because of the partition of the alloying elements in the liquid and the solid phases during the solidification process [
27]. However, the concentration difference is small and even disappears in the fast cooling region. TiZrHfNbTa HEA has been investigated comprehensively due to its excellent mechanical properties [
28,
29]. Each constituent metal, i.e., Ti, Zr, Hf, Nb and Ta in the TiZrHfNbTa HEA, can be used to form nanotube layers [
5]. A new class of multi-component nanotube oxidation arrays containing Ta
2O
5, Nb
2O
5, HfO
2, ZrO
2 and TiO
2 with an amorphous phase at room temperature was successfully synthesized, as reported in our previous work [
25], and are highly stable at elevated temperatures.
According to previous reports, the formation of nanotubes includes three states. In the first stage, a stable oxide film forms on the surface, according to Equations (1)–(3):
In the second stage, a competition between oxide formation and dissolution of fluoride ions such as [TiF6]2− takes place when the fluoride concentration is appropriate. In this stage, a current increase occurs, and irregular nanoscale pores are initially formed that penetrate the initial compact oxide. In the last stage, an oxide tube starts to form and finally a stable tube growth is established. Based on the nanotube formation process, the critical effects (including applied voltage, time, fluoride and water concentration) affecting any stages would finally influence the formation and morphology of the nanotubes formed on the studied equi-atomic TiZrHfNbTa HEA and will be revealed in the present study.
3.2. Effect of Anodization Voltage
Figure 1 presents the SEM pictures of the cross-sectional, bottom and top views of the HEO nanotube arrays formed under various potentials from 20–100 V after anodization for 4 h in the ethylene glycol solution containing 0.1 mol/L NH
4F and 10 vol.% of water. The samples were mechanically scratched for the observation of cross-sectional and bottom views. A highly ordered self-organized nanotube film could be formed on TiZrHfNbTa HEA after anodization in the fluoride-containing electrolyte, as clearly demonstrated in the SEM images of
Figure 1. It should be mentioned that highly ordered nanotube layers can be formed on HEA at a wider anodic oxidation potential range (20–100 V), whereas for pure Ti, regular tubular forms only occur in the range 10–25 V [
30]. Obviously, the selection of electrochemical parameters for the successful formation of nanotubes on HEA is more “flexible”.
The thickness of the oxide layers formed at different potentials is plotted in
Figure 1f. The length of the nanotube increases with potential from 20–60 V but decreases from 60–100 V. The increase of the length results from the increased growth rate since the higher voltage leads to a higher steady state current density. However, at high voltages (>60 V), the trend is opposite. The decrease of the layer thickness at high anodization voltage (80 and 100 V) might be attributed to the electro-polishing, which results in the collapse of nanotubes at the upper parts. As shown in
Figure 1c–e, when the anodization voltage is high, cracks in the tube walls can be found inside the nanotubes and two layers with different tube diameters can be observed (
Figure 1(c3,d3,e3)). The formation of two layers at high potential is due to the formation and growth of new tubes occurring in the breakdown locations. Those sites are not stable. Therefore, the newly formed tubes are not straight and show smaller diameter. The formation of two layers indicates that the breakdown starts to happen only when the length of the nanotube layer reaches a certain thickness. Overall, the length of HEO nanotubes could be controlled by anodizing potentials in the scale from 10–45 μm, which is higher and wider than that formed on pure Ti or binary alloys, such as TiNb, TiZr and TiAl, etc. [
18,
19,
20]. The diameter of the HEO nanotube is another geometric feature that is greatly affected by the anodization voltage.
Figure 1g presents the changes in diameter measured at bottom of the nanotubes. The diameter increases linearly with anodizing potential from 20–100 V. The slope is about 2.5 nm/V. Using potentials between 20 to 100 V, HEO nanotubes with a diameter from 50–250 nm could be formed.
Figure 2 shows the TEM results of the HEO nanotubes. It can be clearly seen that the nanotube has a single wall structure with a smooth surface. The wall thickness is measured and presented in
Figure 2f. The thickness increases with anodization potential from 20–60 V but decreases from 60–80 V and keeps steady with further potential increase. Overall, the anodization potential has a great effect on the growth rate and morphology of HEO nanotube. The length and diameter of HEO nanotube could be tuned by anodizing voltages, from about 10 to 45 μm in length and from 50–250 nm in diameter, scales much wider than that formed on traditional Ti-alloys.
3.3. Effect of Time
Figure 3 shows the SEM pictures of cross-sectional, bottom and top view of the HEO nanotube arrays formed under 60 V in the ethylene glycol solution containing 0.1 mol/L NH
4F and 10 vol.% of water after anodization time of 2–10 h. The cross-sectional SEM images in
Figure 3(a1–d1) demonstrate the formation of highly ordered nanotube, which grows perpendicularly to the TiZrHfNbTa HEA substrate. However, the morphologies of the top surface are quite different after various anodization times, changing from “pore” to “grass”, as after anodization for 6 h.
Figure 3e indicates the change of the layer length with time. Before 4 h, the length increases, but keeps steady with a further extended period. It is known that when the nanotube is growing under a steady state (which usually begins after anodization for several minutes), the current will remain stable. Since the tube growth is proportional to the electrical flow through the system, the layer’s thickness is mainly determined by anodic oxidation time. However, with the extension of anodic oxidation time, the maximum thickness of the nanotube layer that can be achieved is limited, as indicated in
Figure 3e.
With longer anodization time, the nanotubes formed are chemically etched constantly in the fluoride-containing electrolyte. The etching leads to the thinning of the tube-walls especially near the top surface. The partially dissolved tube walls lead to uneven bending and collapse near the surface, thus leading to the surface morphology changes to “nanograss” [
31,
32,
33], as presented in
Figure 3(b3–d3). In some literature, this relatively dense, disordered nanotube layer formation after prolonged anodizing is rephrased to a nanowire synthesis [
34]. However, these disordered tube tops are not desired for most applications. Several routes have been proposed to prevent the formation of the layer of “nanograss”, or to remove this layer after anodic oxidation.
Figure 3f presents the changes in diameter with anodization time. The statistical results reveal that the anodization time does not have obvious influence on nanotube diameter. The diameter remains relative steady with prolonged oxidation time.
The thickness of the HEO nanotube walls formed after different times are measured according to the TEM images, as presented in
Figure 4. The wall surfaces are smooth without any interconnections (ripples). The thickness increases before anodization for 4 h, then decreases with further extended time. The decrease of the thickness might be due to the chemical etching with longer anodization time.
3.4. Effect of Initial Fluoride Concentration
To analyze the influence of fluoride concentration on the tube geometry and growth, the ethylene glycol solution consisting of 10 vol.% DI water and various amounts of NH
4F from 0.02–0.1 mol/L were used for the anodization process. A voltage of 60 V was applied for the anodization time of 4 h. The SEM images of cross-sectional, bottom, and top view of the HEO nanotube arrays formed are shown in
Figure 5. As presented in
Figure 5(a1–d1), the cross-sectional images indicate the formation of regular nanotubes under each condition, and the surface morphologies are similar. However, the fluoride concentration has an obvious impact on the growth rate of the nanotubes, as revealed in
Figure 5e; the length of nanotubes increases linearly with the fluoride concentration. There are two reasons that growth is highly dependent on fluoride concentration. Firstly, the fluoride ions play the key role in oxide formation and dissolution reaction [
35]. When the nanotube grows in a steady state, the bottom oxide (barrier layer) preserves a constant thickness. To keep this condition, the rate of oxide formation at the oxide–metal interface should be equal to the rate of dissolution at the oxide–electrolyte interface. Since the oxide–metal interface is the front of the nanotube growth, the growth rate of the tube is equal to the oxide formation rate at the oxide–metal interface. Therefore, the dissolution rate at the interface of oxide–electrolyte is also equal to the growth rate. It is known that the dissolution rate of the oxides is proportional to fluoride concentration when the process is field assisted, thus concluding that the growth rate of nanotube is in line with the concentration of fluoride. Secondly, the fluoride concentration has direct impact on electrolyte conductivity. The concentration is in line with the conductivity of the electrolyte, thus at the same time is proportional to the growth rate of nanotube [
36]. The fluoride concentration has obvious influence on growth rate, as discussed. However, according to
Figure 5(a2–d2) and
Figure 5f, the tube diameters do not change clearly with the fluoride content.
3.5. Effect of Initial Water Content
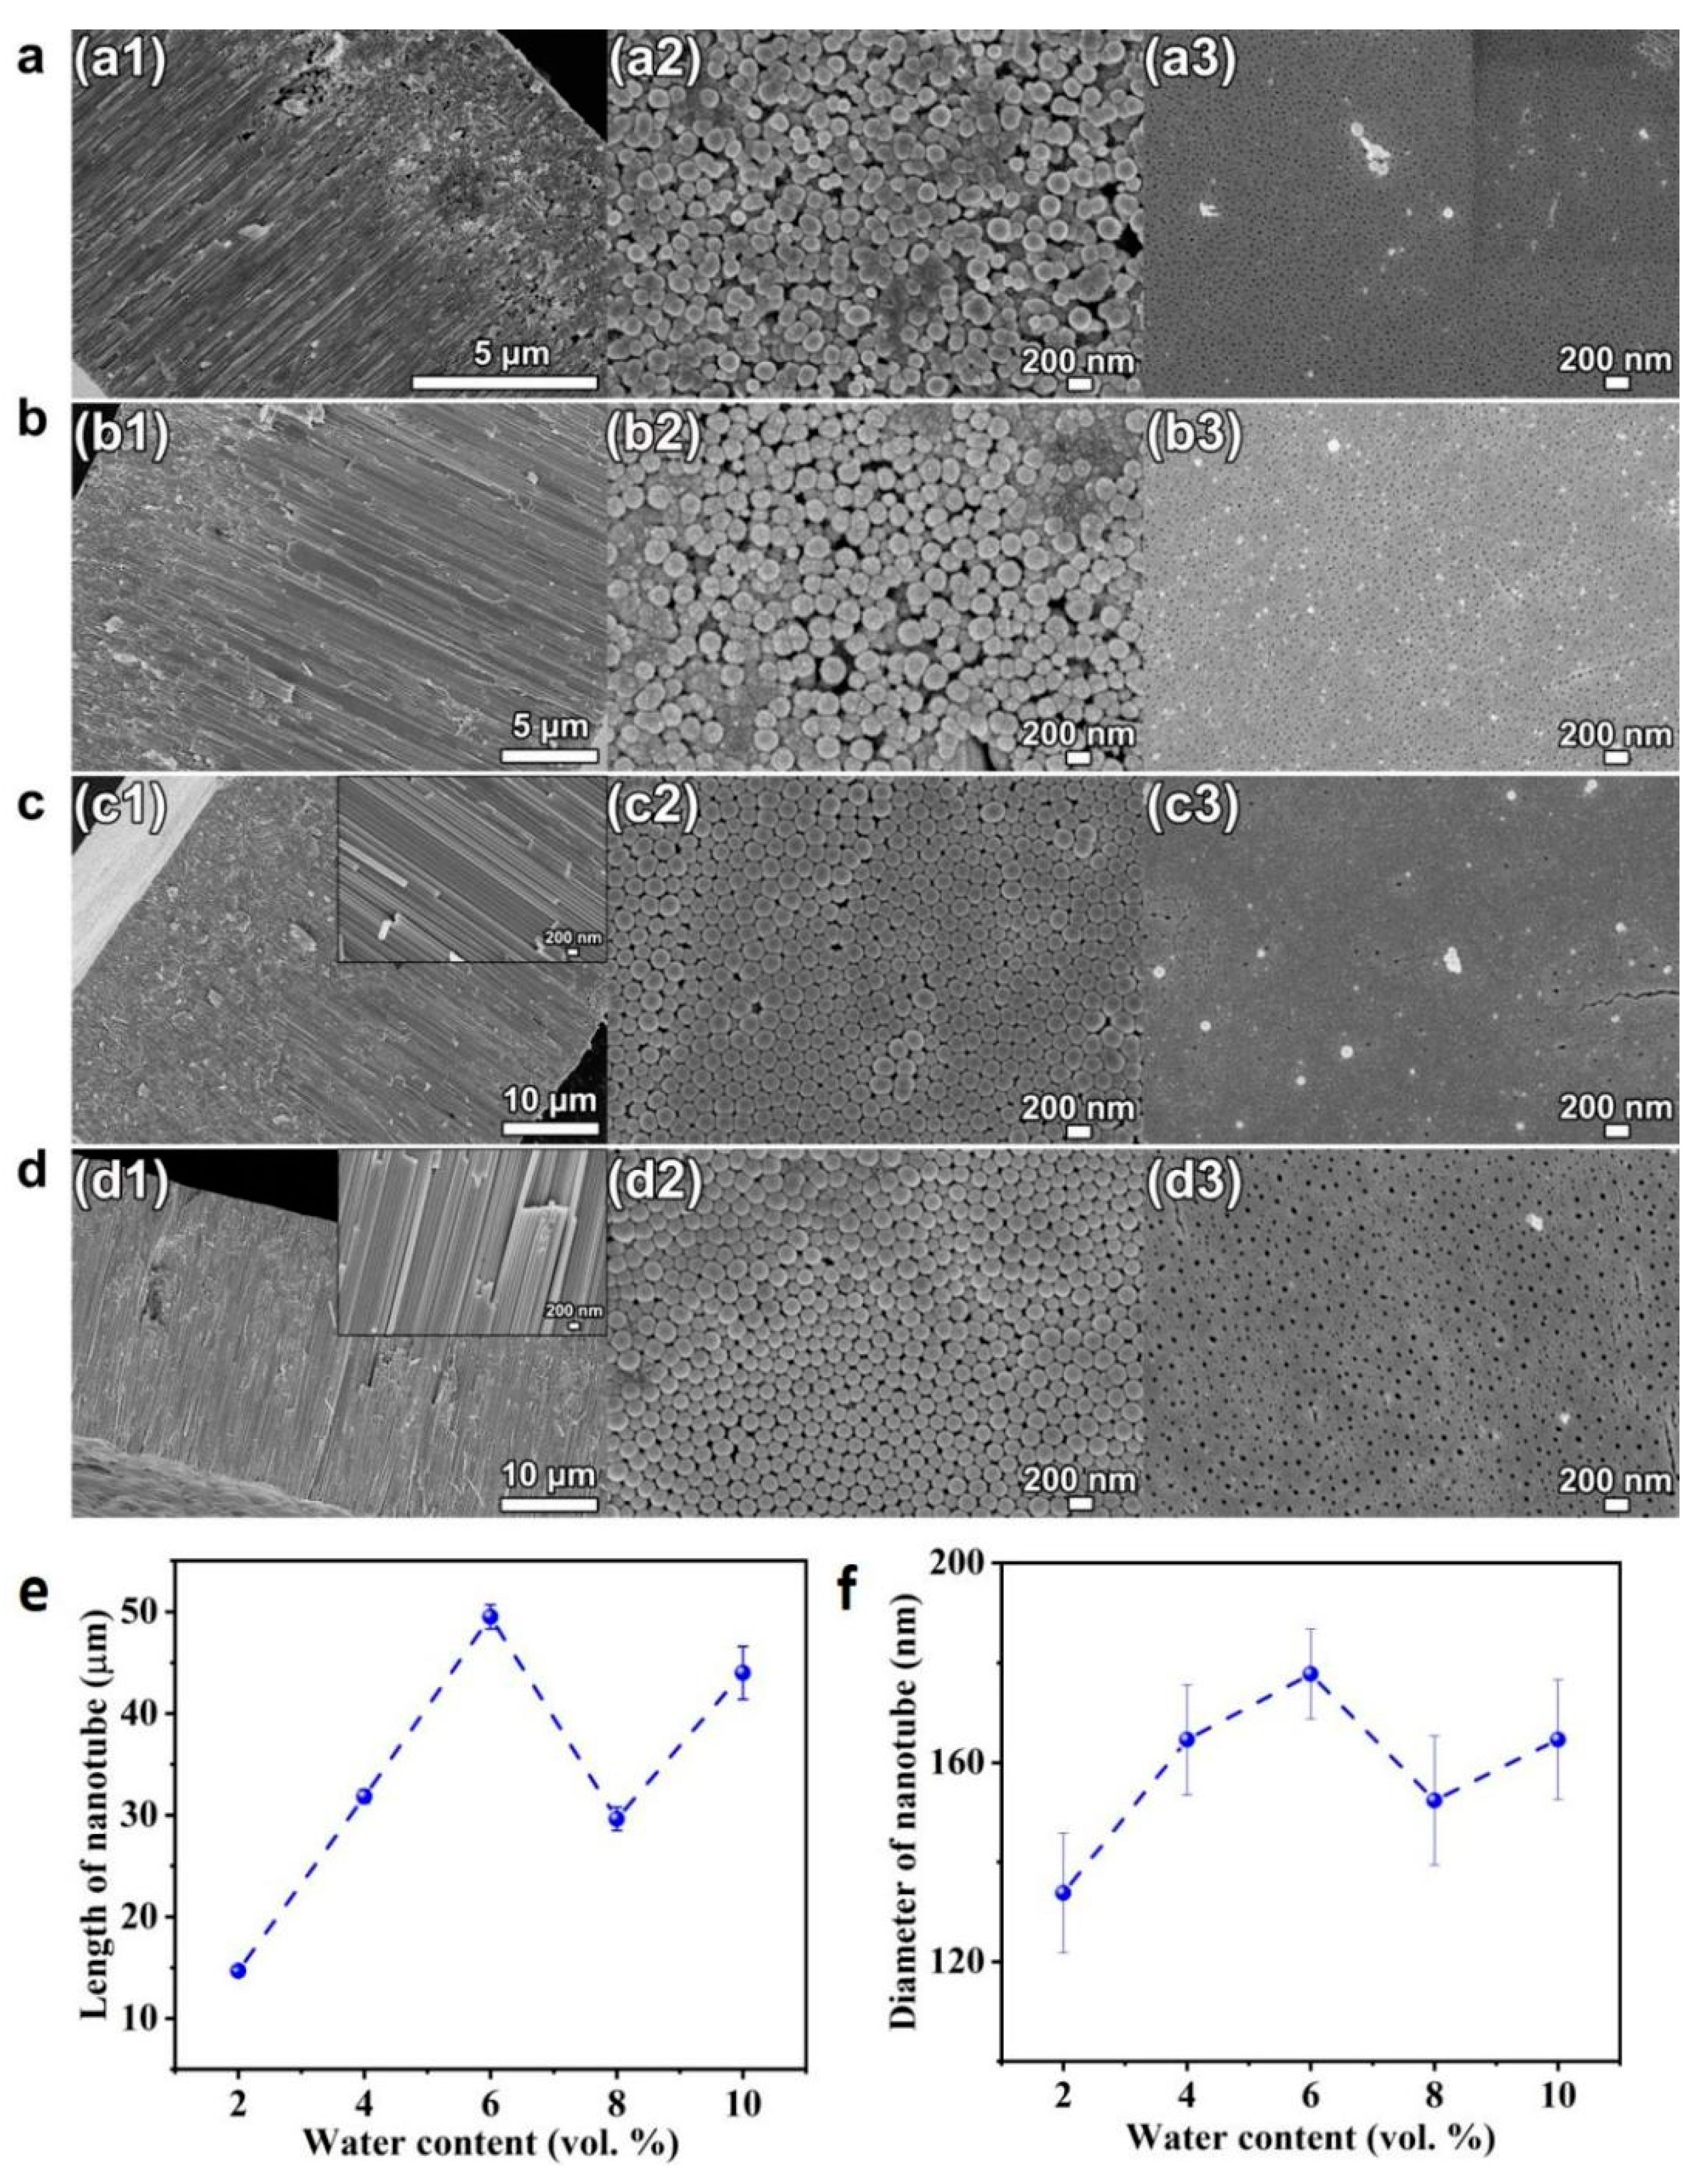
To study the impact of water, the ethylene glycol solution consisting of 0.1 mol/L NH
4F and different amounts of DI water ranging from 2–10 vol.% were used for anodization. The voltage is set as 60 V for the anodization time of 4 h. The SEM pictures of cross-sectional, bottom and top view of the HEO nanotube arrays formed are shown in
Figure 6. It is known that the addition of water will increase the conductivity of solution and provide more oxygen for the oxide formation [
37]. Therefore, it is usually intuitively inferred that more water content could enhance the growth rate. However, in previous reported studies [
38,
39], it is evident that higher water content leads to decrease in tube growth efficiency. The reason is that, when the water (oxygen) content is sufficient, the formation of compact oxide would decrease the conductivity, thus decreasing the growth rate.
Figure 6e presents the changes of the thickness of nanotube layer with water content. When the water content is lower than 6 vol.%, the layer thickness increases with water content, a trend different from reported work, as mentioned above. This is due to the fact that the layer thickness is not only dependent on growth rate, but the dissolution process has a great impact as well. It can be clearly seen in
Figure 6(a1,b1) that breakdown occurs. When the length of the tubular layer reaches a certain thickness, the breakdown starts to happen and holes appear in the tube walls. This morphology is usually observed when the water content is low and the voltage is high. The high voltage would accelerate the fluoride migration, thus increasing the dissolution process. At the same time, since the water content is low, the oxygen is insufficient for oxide formation under high voltage. Therefore, the breakdown events appear and reduce the thickness. When the concentration of water is above 6 vol.% under the applied voltage of 60 V, the growth rate decreases with water content, as revealed in
Figure 6e.
The water content also influences the diameter and thickness of the nanotubes, as presented in
Figure 6f and
Figure 7. When the water content is low (less than 6 vol.%), a nearly proportional increases of the tube diameter and wall thickness with water content is observed. This fact illustrates the presence of an additional voltage drop at the tube electrolyte or interfaces when the water content is low, due to the difference between the oxide formation rate and the dissolution rate. When the water content is higher than 6 vol.%, the diameter and wall thickness do not change obviously, indicating that the diameter of the nanotube is determined by the applied voltage.
4. Conclusions
In the present work, we investigate the influence of synthetic parameters on the growth and morphology of nanotubes formed on equi-atomic TiZrHfNbTa HEA. The highly ordered nanotube layers consisting of multi-component oxides can be formed in a wide range of electrochemical conditions and the TiZrHfNbTa HEA has more “flexibility” in the selection of experimental parameters to form the nanotube oxide more successfully than with traditional alloys. The present study suggested that the tube growth on the equi-atomic TiZrHfNbTa HEA is controlled by the processes of the oxidation formation and chemical dissolution, which is consistent with the field assisted mechanism. Detailed conclusions can be drawn as follows:
Nanotube length and diameter have a liner relationship with the anodization voltage. However, at high voltage, electro-polishing leads to a decrease in the layer thickness. The length and diameter of HEO nanotube layers could be tuned by anodizing voltages, from approximately 10 to 45 μm in length and from 50 to 250 nm in diameter.
The thickness of nanotube layer increases with time before anodization for 4 h, then decreases with further extended time due to chemical etching.
The thickness of nanotubes layer increases linearly with the fluoride concentration, since the higher fluoride concentration leads to better electrolyte conductivity and accelerates the dissolution of the barrier layer.
At a certain voltage, when the water is insufficient, the growth rate increases with the water content and vice versa.
Author Contributions
Conceptualization, Y.S. and Z.L.; methodology, R.L. and Z.L.; investigation, Y.S. and R.L.; resources, Y.S. and Z.L.; writing—original draft preparation, Y.S.; writing—review and editing, Y.S. and Z.L.; visualization, Y.S.; funding acquisition, Y.S. and Z.L. All authors have read and agreed to the published version of the manuscript.
Funding
This research was funded by the National Natural Science Foundation of China, Grant Nos. 51901242, 52101194, 52101202; Natural Science Foundation of Hunan Province, Grant No. 2022JJ40078; The Fundamental Research Funds for the Central Universities, Grant Nos. 531118010621, 531118010671; The Science and Technology Innovation Program of Hunan Province, Grant No. 2022RC1083. The Gusu Leading Talents Program, Grant No. ZXL2021206; The Basic Research Program of Taicang, Grant No. TC2021JC03.
Institutional Review Board Statement
Not applicable.
Informed Consent Statement
Not applicable.
Data Availability Statement
Not applicable.
Acknowledgments
Y.S., R.L., Z.F. are grateful to Zhaoping Lu, who has provided kind suggestion.
Conflicts of Interest
The authors declare no conflict of interest. The funders had no role in the design of the study; in the collection, analyses, or interpretation of data; in the writing of the manuscript, or in the decision to publish the results.
References
- Kasuga, T.; Hiramatsu, M.; Hoson, A.; Sekino, T.; Niihara, K. Formation of titanium oxide nanotube. Langmuir 1998, 14, 3160–3163. [Google Scholar] [CrossRef]
- Kasuga, T.; Hiramatsu, M.; Hoson, A.; Sekino, T.; Niihara, K. Titania nanotubes prepared by chemical processing. Adv. Mater. 1999, 11, 1307–1311. [Google Scholar] [CrossRef]
- Adachi, M.; Murata, Y.; Okada, I.; Yoshikawa, S. Formation of titania nanotubes and applications for dye-sensitized solar cells. J. Electrochem. Soc. 2003, 150, G488–G493. [Google Scholar] [CrossRef]
- Lakshmi, B.B.; Patrissi, C.J.; Martin, C.R. Sol−gel template synthesis of semiconductor oxide micro- and nanostructures. Chem. Mater. 1997, 9, 2544–2550. [Google Scholar] [CrossRef]
- Ghicov, A.; Schmuki, P. Self-ordering electrochemistry: A review on growth and functionality of TiO2 nanotubes and other self-aligned MOx structures. Chem. Commun. 2009, 20, 2791–2808. [Google Scholar] [CrossRef]
- Macak, J.M.; Tsuchiya, H.; Ghicov, A.; Yasuda, K.; Hahn, R.; Bauer, S.; Schmuki, P. TiO2 nanotubes: Selforganized electro-chemical formation, properties and applications. Curr. Opin. Solid State Mater. Sci. 2007, 11, 3–18. [Google Scholar] [CrossRef]
- Ghicov, A.; Tsuchiya, H.; Macak, J.M.; Schmuki, P. Titanium oxide nanotubes prepared in phosphate electrolytes. Electrochem. Commun. 2005, 7, 505–509. [Google Scholar] [CrossRef]
- Tsuchiya, H.; Schmuki, P. Self-organized high aspect ratio porous hafnium oxide prepared by electrochemical anodization. Electrochem. Commun. 2005, 7, 49–52. [Google Scholar] [CrossRef]
- Sieber, I.; Hildebrand, H.; Friedrich, A.; Schmuki, P. Formation of self-organized niobium porous oxide on niobium. Electrochem. Commun. 2005, 7, 97–100. [Google Scholar] [CrossRef]
- Wei, W.; Berger, S.; Hauser, C.; Meyer, K.; Yang, M.; Schmuki, P. Transition of TiO2 nanotubes to nanopores for electrolytes with very low water contents. Electrochem. Commun. 2009, 12, 1184–1186. [Google Scholar] [CrossRef]
- Wu, H.; Zhang, Z. Photoelectrochemical water splitting and simultaneous photoelectrocatalytic degradation of organic pol-lutant on highly smooth and ordered TiO2 nanotube arrays. J. Solid State Chem. 2011, 184, 3202–3207. [Google Scholar] [CrossRef]
- Varghese, O.K.; Gong, D.; Paulose, M.; Ong, K.G.; Grimes, C.A. Hydrogen sensing using titania nanotubes. Sens. Actuators B Chem. 2003, 93, 338–344. [Google Scholar] [CrossRef]
- Park, H.; Kim, W.-R.; Jeong, H.-T.; Lee, J.-J.; Kim, H.-G.; Choi, W.-Y. Fabrication of dye-sensitized solar cells by transplanting highly ordered TiO2 nanotube arrays. Sol. Energy Mater. Sol. Cells 2011, 95, 184–189. [Google Scholar] [CrossRef]
- Plylahan, N.; Letiche, M.; Barr, M.K.S.; Ellis, B.; Maria, S.; Phan, T.N.; Bloch, E.; Knauth, P.; Djenizian, T. High energy and power density TiO2 nanotube electrodes for single and complete lithium-ion batteries. J. Power Sources 2015, 273, 1182–1188. [Google Scholar] [CrossRef]
- Chen, B.; Hou, J.; Lu, K. Formation mechanism of TiO2 nanotubes and their applications in photoelectrochemical water splitting and supercapacitors. Langmuir 2013, 29, 5911–5919. [Google Scholar] [CrossRef] [PubMed]
- Minagar, S.; Berndt, C.; Wang, J.; Ivanova, E.; Wen, C. A review of the application of anodization for the fabrication of nanotubes on metal implant surfaces. Acta Biomater. 2012, 8, 2875–2888. [Google Scholar] [CrossRef]
- Kaluža, L.; Soukup, K.; Koštejn, M.; Karban, J.; Palcheva, R.; Laube, M.; Gulková, D. On stability of high-surface-area Al2O3, TiO2, SiO2-Al2O3, and activated carbon supports during preparation of NiMo sulfide catalysts for parallel deoxygenation of octanoic acid and hydrodesulfurization of 1-benzothiophene. Catalysts 2022, 12, 1559. [Google Scholar] [CrossRef]
- Tsuchiya, H.; Akaki, T.; Nakata, J.; Terada, D.; Tsuji, N.; Koizumi, Y.; Minamino, Y.; Schmuki, P.; Fujimoto, S. Metallurgical aspects on the formation of self-organized anodic oxide nanotube layers. Electrochim. Acta 2009, 54, 5155–5162. [Google Scholar] [CrossRef]
- Tsuchiya, H.; Berger, S.; Macak, J.M.; Muñoz, A.G.; Schmuki, P. A new route for the formation of self-organized anodic porous alumina in neutral electrolytes. Electrochem. Commun. 2007, 9, 545–550. [Google Scholar] [CrossRef]
- Ghicov, A.; Yamamoto, M.; Schmuki, P. Lattice widening in niobium-doped TiO2 nanotubes: Efficient ion intercalation and swift electrochromic contrast. Angew. Chem. Int. Ed. 2008, 47, 7934–7937. [Google Scholar] [CrossRef]
- Macak, J.M.; Gong, B.G.; Hueppe, M.; Schmuki, P. Filling of TiO2 nanotubes by self-doping and electrodeposition. Adv. Mater. 2007, 19, 3027–3031. [Google Scholar] [CrossRef]
- Tsuchiya, H.; Akaki, T.; Nakata, J.; Terada, D.; Tsuji, N.; Koizumi, Y.; Minamino, Y.; Schmuki, P.; Fujimoto, S. Anodic oxide nanotube layers on Ti Ta alloys: Substrate composition, microstructure and self-organization on two-size scales. Corros. Sci. 2009, 51, 1528–1533. [Google Scholar] [CrossRef]
- Ghicov, A.; Aldabergenova, S.; Tsuchiya, H.; Schmuki, P. TiO2–Nb2O5 nanotubes with electrochemically tunable morphologies. Angew. Chem. Int. Ed. 2006, 45, 6993–6996. [Google Scholar] [CrossRef]
- Abdi, S.; Khoshkhoo, M.S.; Shuleshova, O.; Bönisch, M.; Calin, M.; Schultz, L.; Eckert, J.; Baró, M.; Sort, J.; Gebert, A. Effect of Nb addition on microstructure evolution and nanomechanical properties of a glass-forming Ti–Zr–Si alloy. Intermetallics 2014, 46, 156–163. [Google Scholar] [CrossRef]
- Lei, Z.; Liu, X.; Li, R.; Wang, H.; Wu, Y.; Lu, Z. Ultrastable metal oxide nanotube arrays achieved by entropy-stabilization en-gineering. Scr. Mater. 2018, 146, 340–343. [Google Scholar] [CrossRef]
- Lei, Z.; Liu, X.; Wang, H.; Wu, Y.; Jiang, S.; Lu, Z. Development of advanced materials via entropy engineering. Scr. Mater. 2019, 165, 164–169. [Google Scholar] [CrossRef]
- Couzinié, J.P.; Dirras, G.; Perrière, L.; Chauveau, T.; Leroy, E.; Champion, Y. Guillot, Microstructureo-fanear-equimolarrefractoryhigh-entropyalloy. Mater. Lett. 2014, 126, 285–287. [Google Scholar] [CrossRef]
- Senkov, O.N.; Scott, J.M.; Senkova, S.V.; Miracle, D.B.; Woodward, C.F. Microstructure and room temperature properties of a high-entropy TaNbHfZrTi alloy. J. Alloys Compd. 2011, 509, 6043–6048. [Google Scholar] [CrossRef]
- Wang, S.; Wu, M.; Shu, D.; Zhu, G.; Wang, D.; Sun, B. Mechanical instability and tensile properties of TiZrHfNbTa high entropy alloy at cryogenic temperatures. Acta Mater. 2020, 201, 517–527. [Google Scholar] [CrossRef]
- Taveira, L.; Macak, J.; Sirotna, K.; Dick, L. Voltage oscillations and morphology during the galvanostatic formation of self-organized TiO2 nanotubes. J. Electrochem. Soc. 2006, 153, B137. [Google Scholar] [CrossRef]
- Kim, D.; Ghicov, A.; Schmuki, P. TiO2 Nanotube arrays: Elimination of disordered top layers (“nanograss”) for improved photoconversion efficiency in dye-sensitized solar cells. Electrochem. Commun. 2008, 10, 1835–1838. [Google Scholar] [CrossRef]
- Song, Y.-Y.; Lynch, R.; Kim, D.; Roy, P.; Schmuki, P. TiO2 nanotubes: Efficient suppression of top etching during anodic growth key to improved high aspect ratio geometries. Electrochem. Solid State Lett. 2009, 12, C17. [Google Scholar] [CrossRef]
- Hebert, K.; Albu, S.; Paramasivam, I.; Schmuki, P. Morphological instability leading to formation of porous anodic oxide films. Nat. Mater. 2011, 11, 162–166. [Google Scholar] [CrossRef] [PubMed]
- Lim, J.H.; Choi, J. Titanium oxide nanowires originating from anodically grown nanotubes: The bamboo-splitting model. Small 2007, 3, 1504–1507. [Google Scholar] [CrossRef] [PubMed]
- Xie, Z.; Blackwood, D. Effects of anodization parameters on the formation of titania nanotubes in ethylene glycol. Electrochim. Acta 2010, 56, 905–912. [Google Scholar] [CrossRef]
- Lee, J.; Kim, H.; Kim, Y.; Lee, Y. TAK, Effect of electrolyte conductivity on the formation of a nanotubular TiO2 photoanode for a DSSC. J. Korean Phys. Soc. 2009, 54, 1027–1031. [Google Scholar] [CrossRef]
- Raja, K.; Gandhi, T.; Misra, M. Effect of water content of ethylene glycol as electrolyte for synthesis of ordered titania nanotubes. Electrochem. Commun. 2007, 9, 1069–1076. [Google Scholar] [CrossRef]
- Albu, S.P.; Schmuki, P. Influence of anodization parameters on the expansion factor of TiO2 nanotubes. Electrochim. Acta 2013, 91, 90–95. [Google Scholar] [CrossRef]
- Yin, L.; Ji, S.; Liu, G.; Xu, G.; Ye, C. Understanding the growth behavior of titania nanotubes. Electrochem. Commun. 2011, 13, 454–457. [Google Scholar] [CrossRef]
Figure 1.
(a–e) SEM images of cross-sectional (a1–e1), bottom (a2–e2) and top view (a3–e3) of the HEO nanotube arrays formed under various potentials: (a) 20 V, (b) 40 V, (c) 60 V, (d) 80 V and (e) 100 V after anodization for 4 h in the ethylene glycol solution containing 0.1 mol/L NH4F and 10 vol.% of water; (f) The changes in nanotube length and diameter (g) with applied potential.
Figure 2.
(a–e) TEM images of the HEO nanotubes formed under various potentials: (a) 20 V, (b) 40 V, (c) 60 V, (d) 80 V and (e) 100 V after anodization for 4 h in the ethylene glycol solution containing 0.1 mol/L NH4F and 10 vol.% of water; (f) the changes in nanotube wall thickness with applied potential.
Figure 3.
(a–d) SEM images of cross-sectional (a1–d1), bottom (a2–d2) and top view (a3–d3) of the HEO nanotube arrays formed under 60 V in the ethylene glycol solution containing 0.1 mol/L NH4F and 10 vol.% of water after different anodization times, (a) 2 h, (b) 6 h, (c) 8 h, and (d) 10 h; (e) The changes in nanotube length and diameter (f) with anodization time.
Figure 4.
(a–e) TEM images of the HEO nanotubes formed under 60 V in the ethylene glycol solution containing 0.1 mol/L NH4F and 10 vol.% of water after different anodization times, (a) 2 h, (b) 4 h, (c) 6 h, (d) 8 h and (e) 10 h; (f) Changes in nanotube wall thickness with anodization time.
Figure 4.
(a–e) TEM images of the HEO nanotubes formed under 60 V in the ethylene glycol solution containing 0.1 mol/L NH4F and 10 vol.% of water after different anodization times, (a) 2 h, (b) 4 h, (c) 6 h, (d) 8 h and (e) 10 h; (f) Changes in nanotube wall thickness with anodization time.
Figure 5.
(a–d) SEM images of cross-sectional (a1–d1), bottom (a2–d2), and top views (a3–d3) of the HEO nanotube arrays formed under 60 V in the ethylene glycol solution containing 10 vol.% of water and different amounts of NH4F: (a) 0.02 mol/L, (b) 0.04 mol/L, (c) 0.06 mol/L and (d) 0.08 mol/L after the anodization for 4 h; (e) Changes in nanotube length and diameter (f) with fluoride concentration.
Figure 6.
(a–d) SEM images of cross-sectional (a1–d1), bottom (a2–d2) and top views (a3–d3) of the HEO nanotube arrays formed under 60 V in the ethylene glycol solution containing 0.1 mol/L NH4F and different amounts of DI water: (a) 2 vol.%, (b) 4 vol.%, (c) 6 vol.% and (d) 8 vol.% after the anodization for 4 h; (e) Changes in nanotube length and diameter (f) with water content.
Figure 7.
TEM images of the HEO nanotubes formed under 60 V in the ethylene glycol solution containing 0.1 mol/L NH4F and different amounts of DI water: (a) 2 vol.%, (b) 4 vol.%, (c) 6 vol.%, (d) 8 vol.% and (e) 10 vol.% after the anodization for 4 h; (f) Changes in nanotube wall thickness with anodization time.
Table 1.
Detailed experimental parameters including various anodization conditions (applied voltages and time) and bath compositions (fluoride concentration and water content).
Table 1.
Detailed experimental parameters including various anodization conditions (applied voltages and time) and bath compositions (fluoride concentration and water content).
| Voltage (V) | Time (h) | NH4F Content (mol/L) | H2O Content (vol.%) |
|---|
| 20 | 4 | 0.1 | 10 |
| 40 | 4 | 0.1 | 10 |
| 60 | 4 | 0.1 | 10 |
| 80 | 4 | 0.1 | 10 |
| 100 | 4 | 0.1 | 10 |
| 60 | 2 | 0.1 | 10 |
| 60 | 6 | 0.1 | 10 |
| 60 | 8 | 0.1 | 10 |
| 60 | 10 | 0.1 | 10 |
| 60 | 4 | 0.02 | 10 |
| 60 | 4 | 0.04 | 10 |
| 60 | 4 | 0.06 | 10 |
| 60 | 4 | 0.08 | 10 |
| 60 | 4 | 0.1 | 2 |
| 60 | 4 | 0.1 | 4 |
| 60 | 4 | 0.1 | 6 |
| 60 | 4 | 0.1 | 8 |
| Disclaimer/Publisher’s Note: The statements, opinions and data contained in all publications are solely those of the individual author(s) and contributor(s) and not of MDPI and/or the editor(s). MDPI and/or the editor(s) disclaim responsibility for any injury to people or property resulting from any ideas, methods, instructions or products referred to in the content. |
© 2022 by the authors. Licensee MDPI, Basel, Switzerland. This article is an open access article distributed under the terms and conditions of the Creative Commons Attribution (CC BY) license (https://creativecommons.org/licenses/by/4.0/).


