1. Introduction
C-Cu contacts are used as the first choice for moving current collection parts in high-speed railway pantograph-contact line systems due to their excellent conductivity and self-lubricity [
1,
2,
3]. To ensure the safety and stability of energy transfer in railway systems, it is particularly important to study the friction and wear characteristics of C-Cu contacts [
4,
5,
6]. In the case of fixed material, the main factors affecting the tribological properties include the lubrication state of contact pairs, operating conditions, and environment. For C-Cu contacts, most studies on tribological properties focus on the influence of operating conditions, including velocity [
7,
8], contact pressure [
9,
10], and current level [
11,
12,
13].
In a large number of studies on friction and wear properties of carbon-graphite materials, it has been found that moisture is a key influencing factor [
14,
15,
16,
17,
18,
19,
20,
21]. As early as 1978, Lee and Johnson found that metal-graphite brushes had a lower friction coefficient and wear loss in humid environments [
14]. Water adsorption on the lamellar graphite surface terminates the graphite active edge bond, thus reducing the graphite surface energy and improving its self-lubrication performance [
15]. Rietsch et al. further studied the adsorption and desorption process of water on graphite surfaces through isotopically labeled water to explain how the lubrication properties of graphite depend on water [
16]. Surface passivation of water has also been observed in ultrananocrystalline diamond and tetrahedral amorphous carbon, which significantly reduces the friction coefficient of these two materials [
17]. Zaiti et al. found that the existence of water vapor contributes to the high orientation of the microcrystals on the graphite surface, which is an important reason for the decrease in the friction coefficient and wear amount of graphite materials [
18]. However, water does not always play a role in increasing the lubrication properties of graphite materials. Morstein et al. found in a study of graphite coatings that under high load conditions, when the humidity exceeds 37%, the wear rate of graphite coating will increase significantly, and the dissolution and stratification of graphite coating caused by excessive water is an important reason [
19]. Hirani and Goilkar found in their research on the tribological properties of carbon–graphite face seals that excessive water drains the carbon layer formed between the primary seal and flange surfaces and consequently increases the wear rate of carbon seals [
20]. Wu et al. studied the current-carrying friction of C-Cu contacts and found that the wear of the carbon slider increased with humidity. They believed that the main reason was that water passivation made the carbon layer slip more easily [
21].
The C-Cu contacts of the pantograph-contact line systems usually operate in rainfall or in a high humidity and heat environment. The operation experience shows that the damage of the C-Cu electrical contacts is intensified during rainfall, and the wear of the carbon slider is 3 times that of the dry environment. However, the C-Cu electrical contacts are different from those of the mechanical friction system, and the electrical damage caused by the high current is the main reason for the wear of the carbon slider [
22]. In this case, it is uncertain whether the increased wear of the carbon slider caused by water is also attributable mainly to the loss of the carbon lubricating film. After all, in the presence of water film, the transmission of current at the C-Cu interface is different from that in the dry condition, and the change in electrical damage of the C-Cu contacts is not clear. Although the reference [
21] also studied the influence of humidity on the current-carrying wear of C-Cu contacts, it was found that the wear of the carbon slider was aggravated under humidity. However, the current level in the test is only 2 A, which is far from the actual current level (hundreds A) of the pantograph-contact line systems, and it is difficult to fully explain the causes of abnormal wear of the carbon slider. Therefore, it is necessary to investigate the influence of moisture on the current-carrying tribological properties of C-Cu contacts at different current levels.
In this paper, current-carrying friction tests of C-Cu contacts under six water content levels and six current levels are carried out. The effects of water content on FC, wear, electrical contact resistance (ECR), and discharge energy were tested. Based on the surface morphology and composition analysis results of the carbon samples, the deterioration mechanism of the tribological properties of C-Cu contacts in a water environment was discussed. Through this study, the theoretical basis is provided for the design and formulation of the operation, overhaul, and maintenance plans of high-speed railway pantograph-contact line systems in rainfall or hot and humid environments. It also points out the direction for the research and development of new pantograph strip materials suitable for rainfall environments.
2. Materials and Methods
2.1. Experimental Device
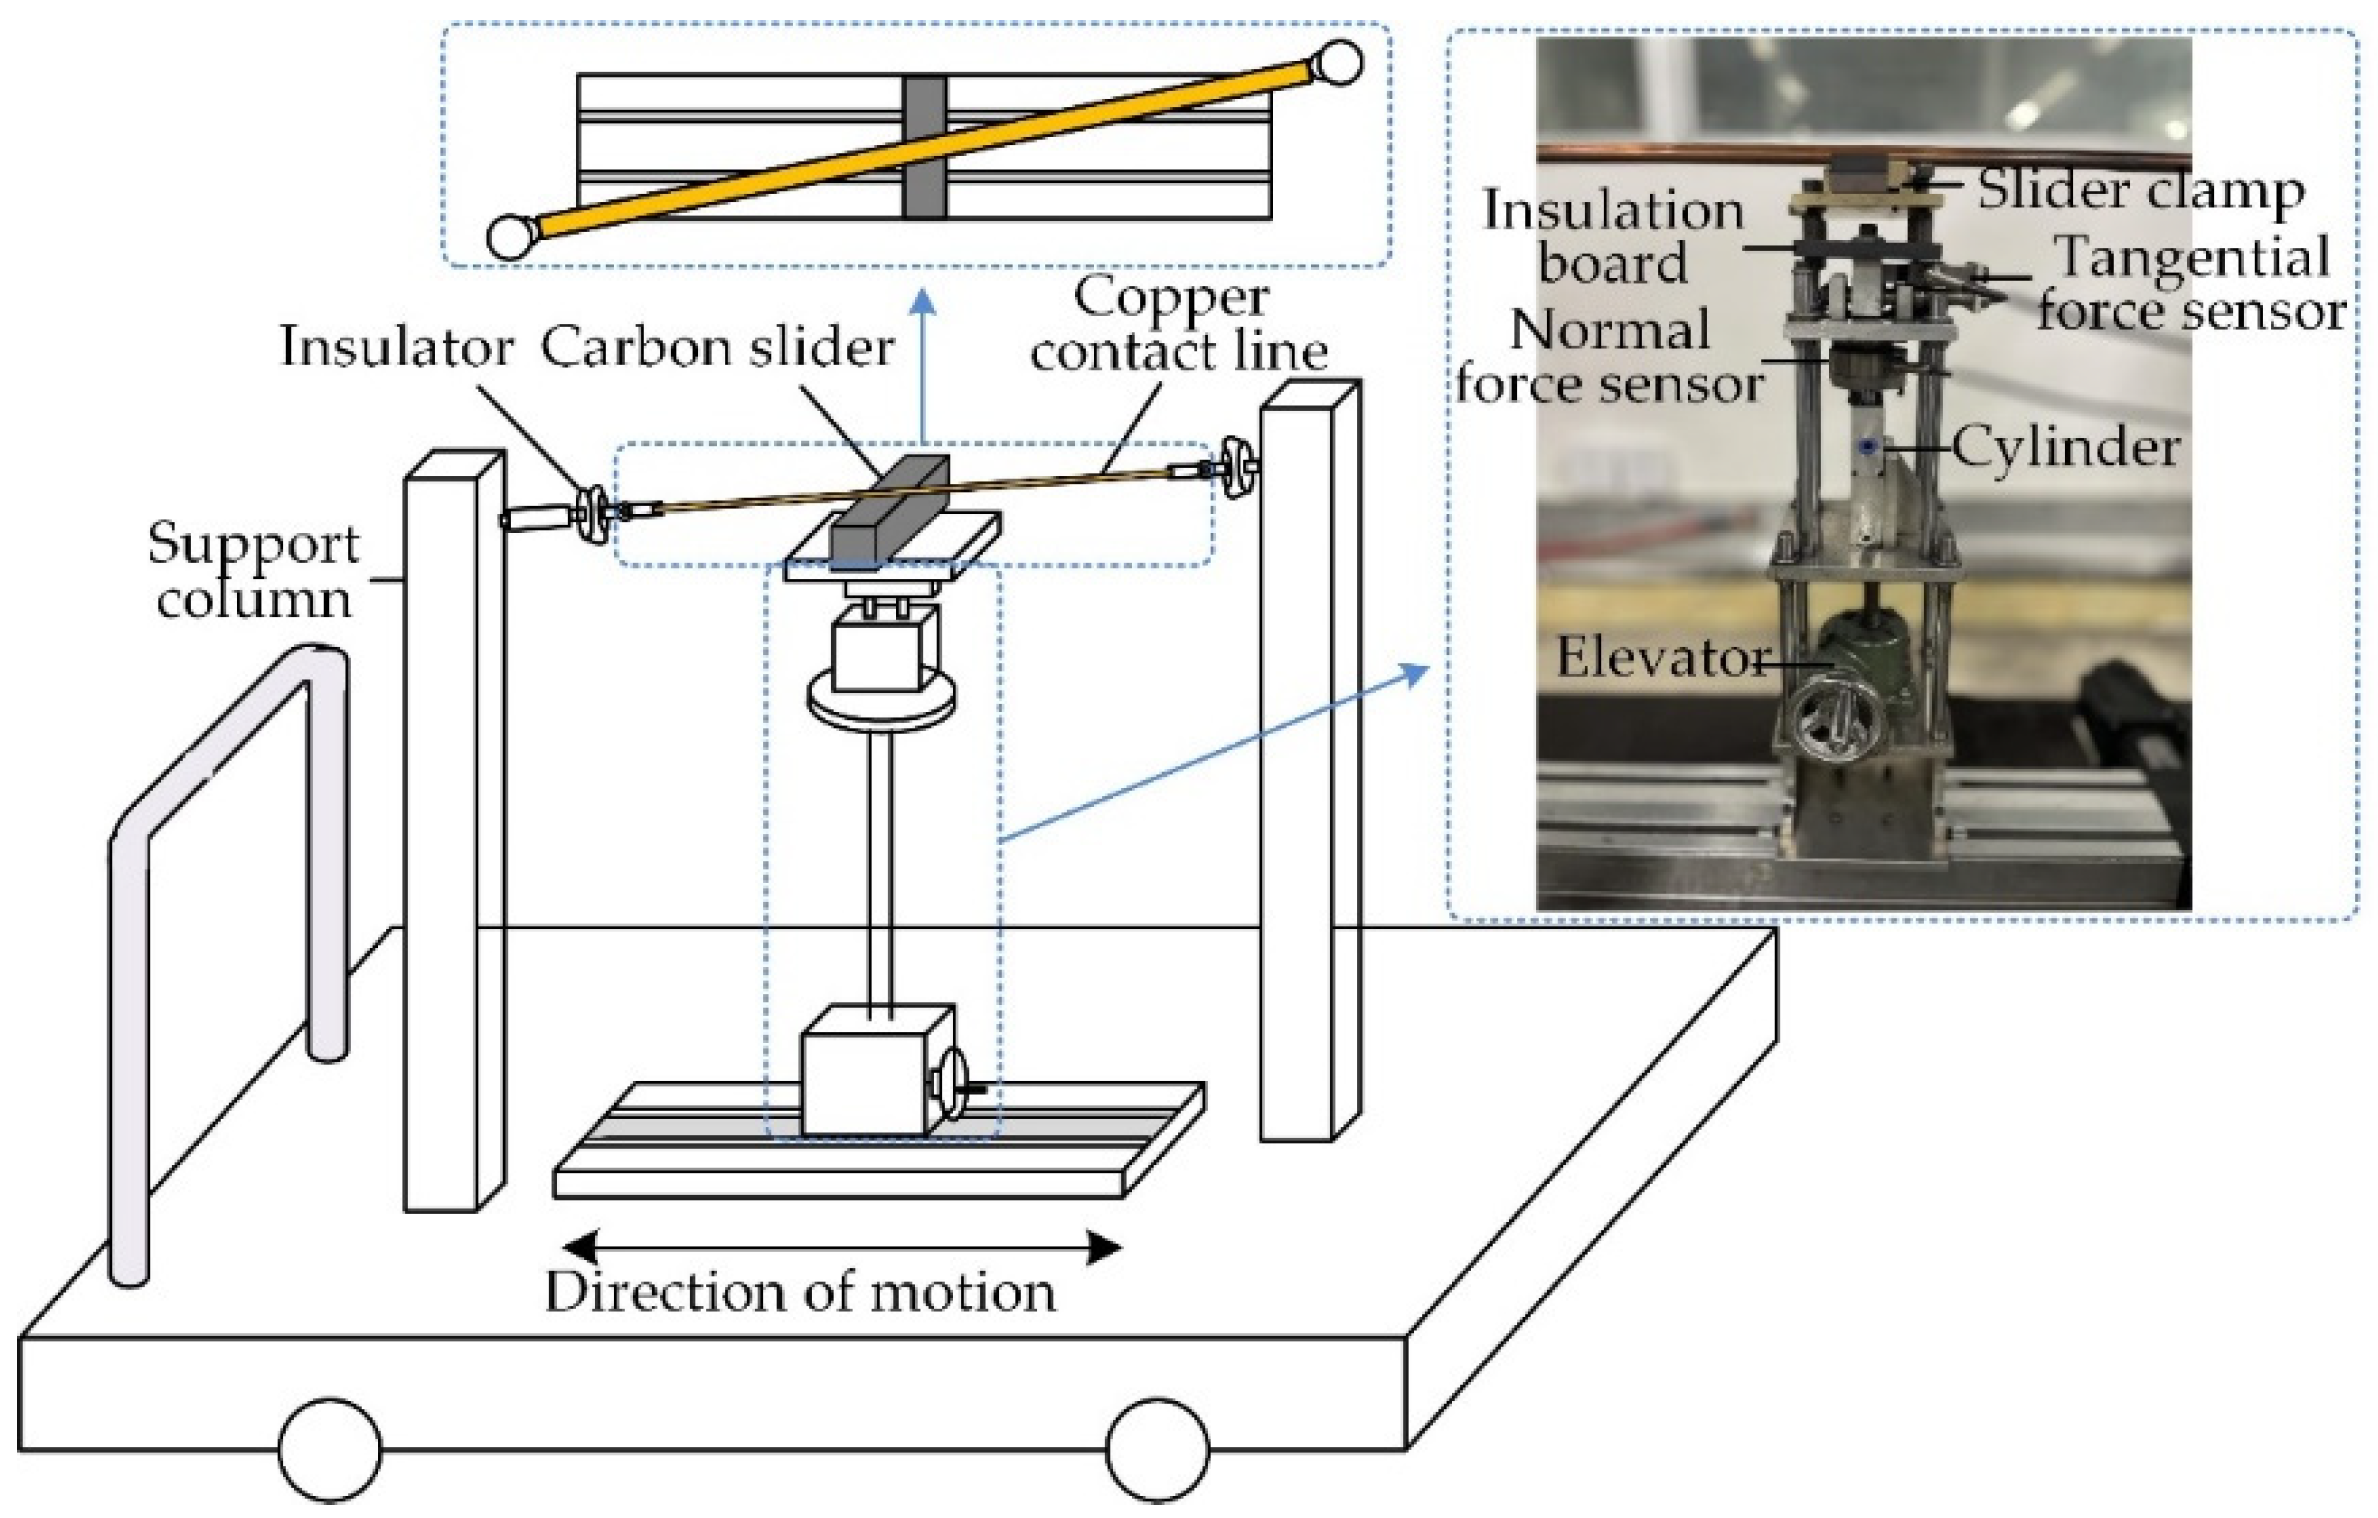
The self-made reciprocating current-carrying friction test platform simulating the operating state of the pantograph-contact line systems is shown in
Figure 1 [
23]. The copper contact line is at an angle of 15 °C in a horizontal direction and is fixed between the support column through the insulator and the contact line clamp. The carbon slider is installed in the fixture of the moving parts, which can slide reciprocally under the contact line through the linear guide rail to simulate the “Z” movement of the pantograph-contact line systems. The effective travel of the linear guide rail is 500 mm, and the operating frequency is continuously adjustable from 0.3–6 Hz. A cylinder is arranged directly below the slider fixing device, which can provide a 0–500 N continuously adjustable load for C-Cu contacts. The matching AC/DC current source can provide 0–200 A continuously adjustable AC/DC current for C-Cu contacts.
The data acquisition system in the test was introduced in a previous study [
24], which can collect the voltage, current, contact pressure, friction force, and contact interface temperature between the C-Cu contacts during the test.
2.2. Test Conditions and Test Materials
The carbon sample used in the test is a pure carbon slider produced by Dongxin Electric Carbon Co., LTD. (Zigong, China) with a size of 100 mm × 35 mm × 35 mm. The copper sample is made of a pure copper contact line with a cross-sectional area of 150 mm
2. The chemical composition and physical properties of the above materials are shown in
Table 1.
The test conditions are shown in
Table 2. The motion frequency of the C-Cu contacts set in the test was 6 Hz, the applied load was 120 N, and the test time was 60 min. Two variables are included in this test: water content and current. Through the preliminary test, it is found that the saturated water absorption capacity of the carbon slider used in the test is about 10 g. Therefore, the water content of the carbon slider in the test is set at 6 levels in the range of 0–10 g. The current is also set at 6 levels. The FC, wear loss, contact resistance, and discharge energy were extracted as characteristic quantities of the test results. In order to ensure different experimental conditions in each group, 36 non-repeated combinations of the two variable values were selected for the test. Each group was repeated three times to reduce experimental error.
The test process mainly includes the following 4 steps:
Step 1: Pretreatment and weighing of the carbon slider. The friction surface of the carbon slider was polished with 320# and 2000# sandpaper in turn, and then the carbon slider was ultrasonically cleaned with distilled water for 30 s. Put the cleaned carbon slider into a vacuum drying box and dry it at 105 °C for 8 h. Take out the carbon slider after drying and put it in the desiccant to cool to 25 °C. Then, weigh the carbon slider, and mark its mass as m1.
Step 2: Water content control of the carbon slider. Place the carbon slider into the measuring cylinder with deionized water and remove the slider when the water level drops to the specified scale. To make the carbon slider saturated with water absorption, a boiling method should be adopted [
25]. The carbon slider after water absorption is placed on the drain rack so that there is no dripping water on the carbon surface, and the mass of the carbon slider is
m2 at this time.
Step 3: Carry out the current-carrying friction test. The carbon slider, after absorbing water, was placed on the test machine for the current-carrying friction test. Four groups of data, including friction force, contact pressure, contact voltage drop, and current, were collected in real-time during the test. After the test, the carbon slider was cooled to 25 °C and weighed, and the mass of the carbon slider at this time was recorded as m3.
Step 4: The drying treatment of the carbon slider after the test. The carbon slider after the test was put into the drying box and dried at 105 °C for 8 h. After drying, remove the carbon slider and put it in the desiccant to cool to 25 °C. Then, weigh the carbon slider and mark its mass as m4.
2.3. Test Data Processing
When the load is applied to the C-Cu contacts during motion, the contact pressure perpendicular to the contact interface is
Fc, while the friction force parallel to the contact interface is
f. The FC
μ is calculated by the ratio of friction force
f to contact pressure
Fc, as shown in Equation (1). In the reciprocating motion of the carbon slider, tension, and pressure are applied to the force sensor in the two motion directions. Therefore, the signs of the friction forces in the two directions are opposite, which are denoted as
fl and
fr in two directions.
where the FC
μ is dimensionless; the unit of contact pressure
Fc and friction force
f,
fl, and
fr is N.
An electronic balance of type PR224 ZH with an accuracy of 0.0001 g was used to weigh the carbon slider. The wear loss of the carbon slider in the test process is calculated by Equation (2).
where the unit of
ω,
m1, and
m4 is g.
The measured voltage drop
U consists of three parts: copper voltage drop
Ua, carbon voltage drop
Ub, and contact voltage drop
Uab. According to the Ohm method, the ECR of C-Cu contacts is:
In this test, Ua and Ub are far less than Uab and can be ignored. The unit of R is Ω, the unit of U, Ua, Ub, and Uab is V, and the unit of I is A.
When the carbon slider is separated from the copper contact line, and the off-line voltage drop is greater than the arc starting voltage, discharge occurs [
26]. Discharge energy
E is related to the off-line voltage
U, current
I, and off-line time
t, as shown in Equation (4). The average single discharge energy can be obtained from the discharge energy
E and discharge frequency
N, as shown in Equation (5).
where the unit of
and
is J.
3. Results and Discussion
Before presenting the test results, all abbreviations that appear in this paper are explained. Abbreviations are represented by the first letter of the nomenclature. The friction coefficient is expressed by FC. The average friction coefficient is the average value of the friction coefficient during the test time, expressed by the AFC. The dynamic friction coefficient is the time domain function of the friction coefficient expressed by the DFC. Electrical contact resistance is expressed by the ECR. The average electrical contact resistance is the average value of the electrical contact resistance during the test time expressed by the AECR. The dynamic friction coefficient is the time domain function of the friction coefficient expressed by the DFC.
3.1. Influence of Water Content on Friction and Wear under Different Current
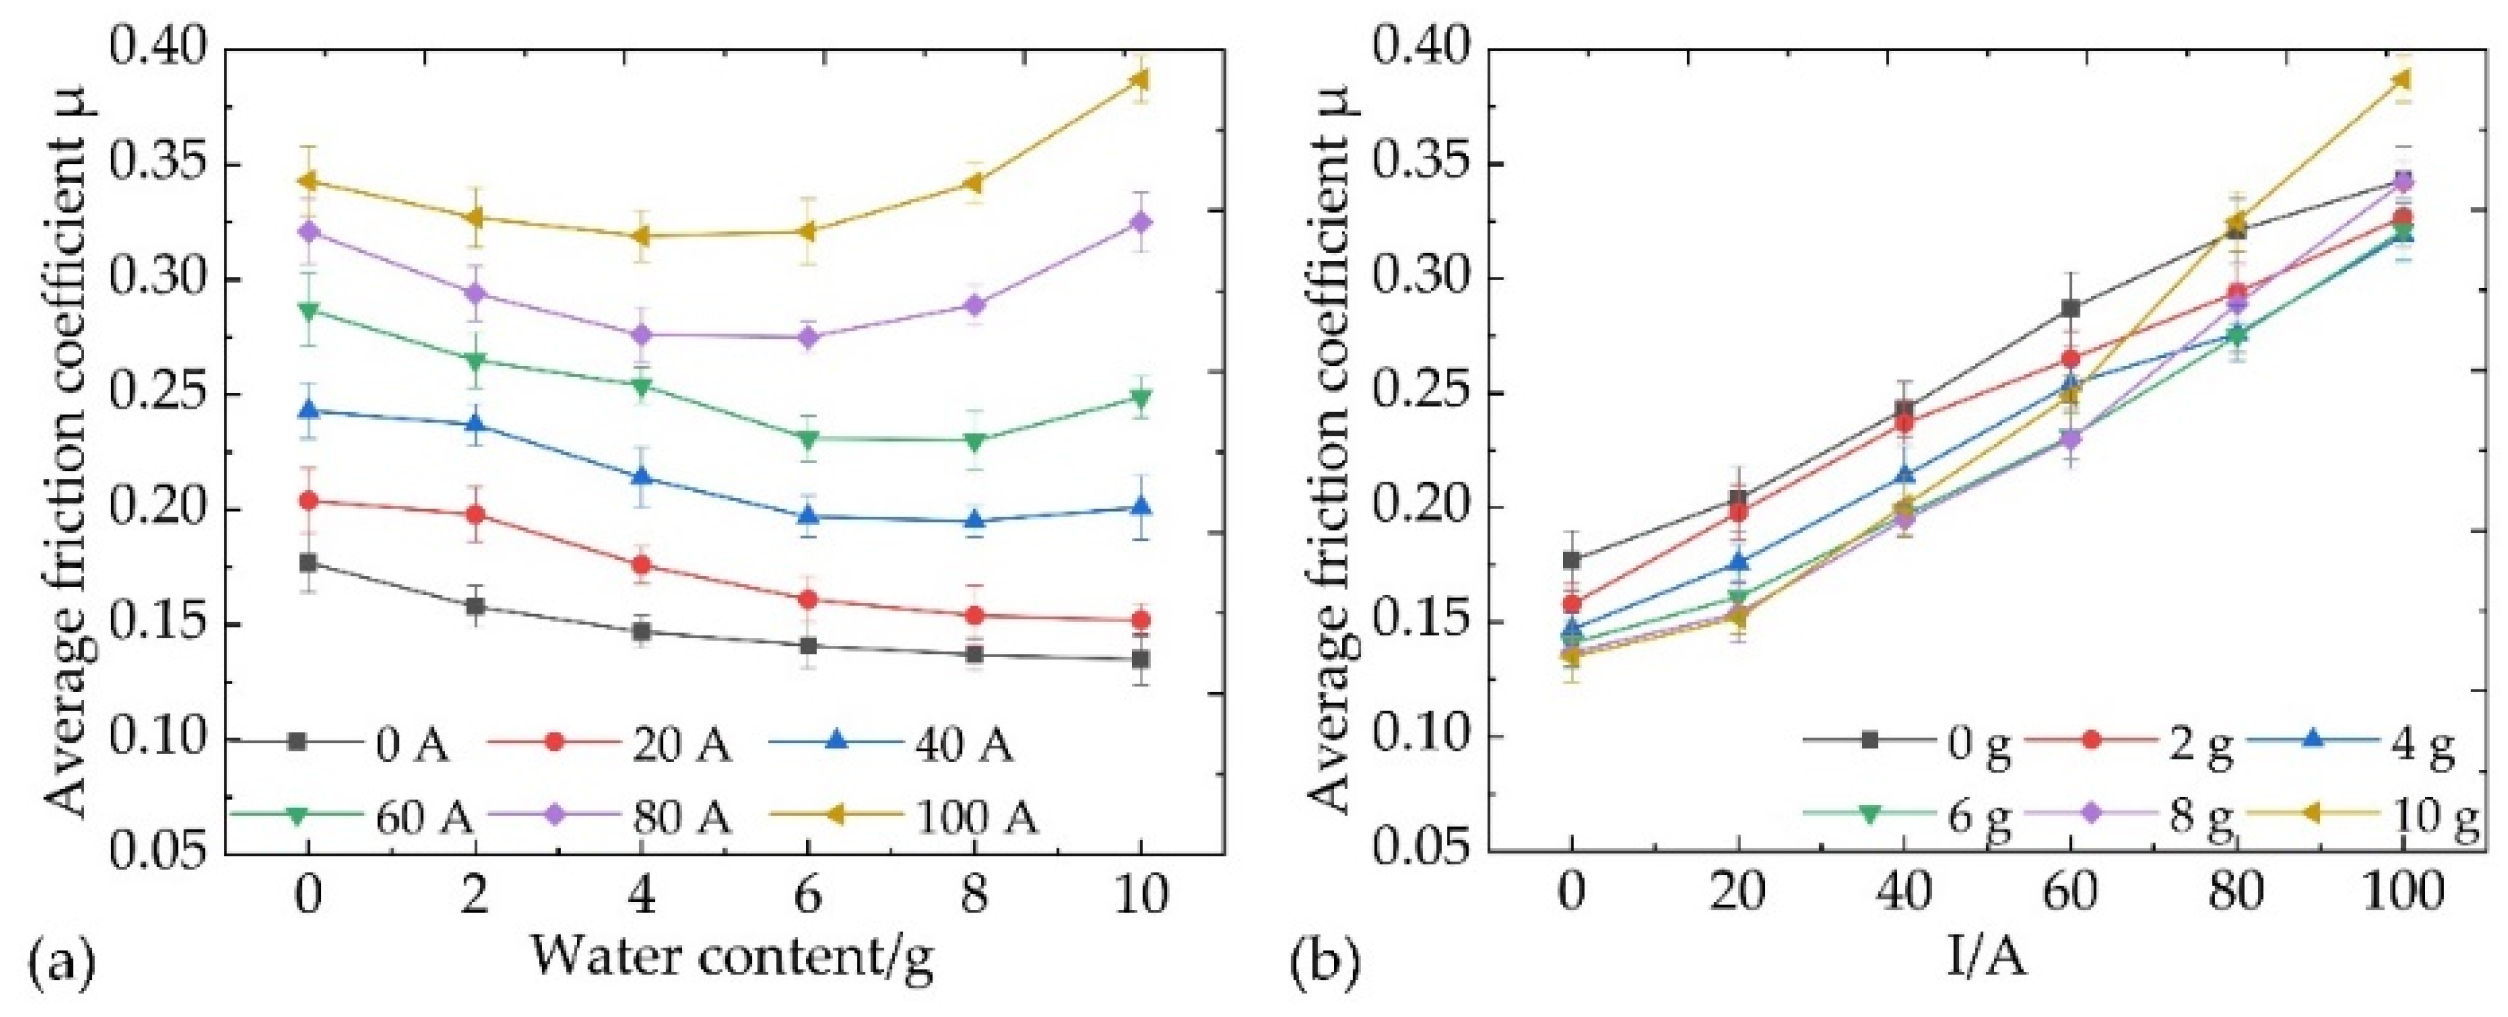
Figure 2 shows the variation trend of the average FC (AFC) with water content. The influence of water content on the AFC differed under different current levels (
Figure 2a). In the first case, when the current is between 0 A and 20 A, the AFC decreases with the rise of water content. The decrease rate of AFC reached the maximum before 6 g of water content and then gradually slowed down. When the water content is in the 8–10 g range, the AFC tends to be stable. In the second case, when the current was greater than or equal to 40 A, the AFC showed a U-shaped distribution with an increase in water content. The AFC has a minimum value. When the current is 40 A, the AFC reaches the minimum value at the point of 8 g. With the increase in current, the corresponding water content decreases when the AFC reaches the minimum value. The variation trend of AFC with the current is similar under different water content; that is, AFC increases monotonically with the increase of current (
Figure 2b). However, the rising rate of the AFC with the current was different with different water contents. It has the slowest rate of rise at 20 A and the fastest rate at 100 A.
In past studies [
15,
16,
27], the reason why water promotes the co-lubricity of carbon-metal contacts has been clarified. The free OH
− and H
+ in water are adsorbed on the surface of carbon materials, which helps to reduce the surface energy of active bonds, thus making the adhesive component in AFC decrease significantly. On the other hand, water first gathers at rough spots to form the curved liquid surface effect and to generate the curved liquid surface force. When the rough spots on the contact interface are covered by the liquid, the curved liquid surface force reaches the maximum [
28]. With the increase in water content, more contact spots were covered by the liquid, and the gradual rise of curved liquid surface force offsets the promoting effect of water on the lubrication property of carbon material. This is also an important reason why AFC decreases first and then becomes stable with water content at 0–20 A. At 40–80 A, a new factor appeared to make the AFC rise when the water content exceeded a certain value.
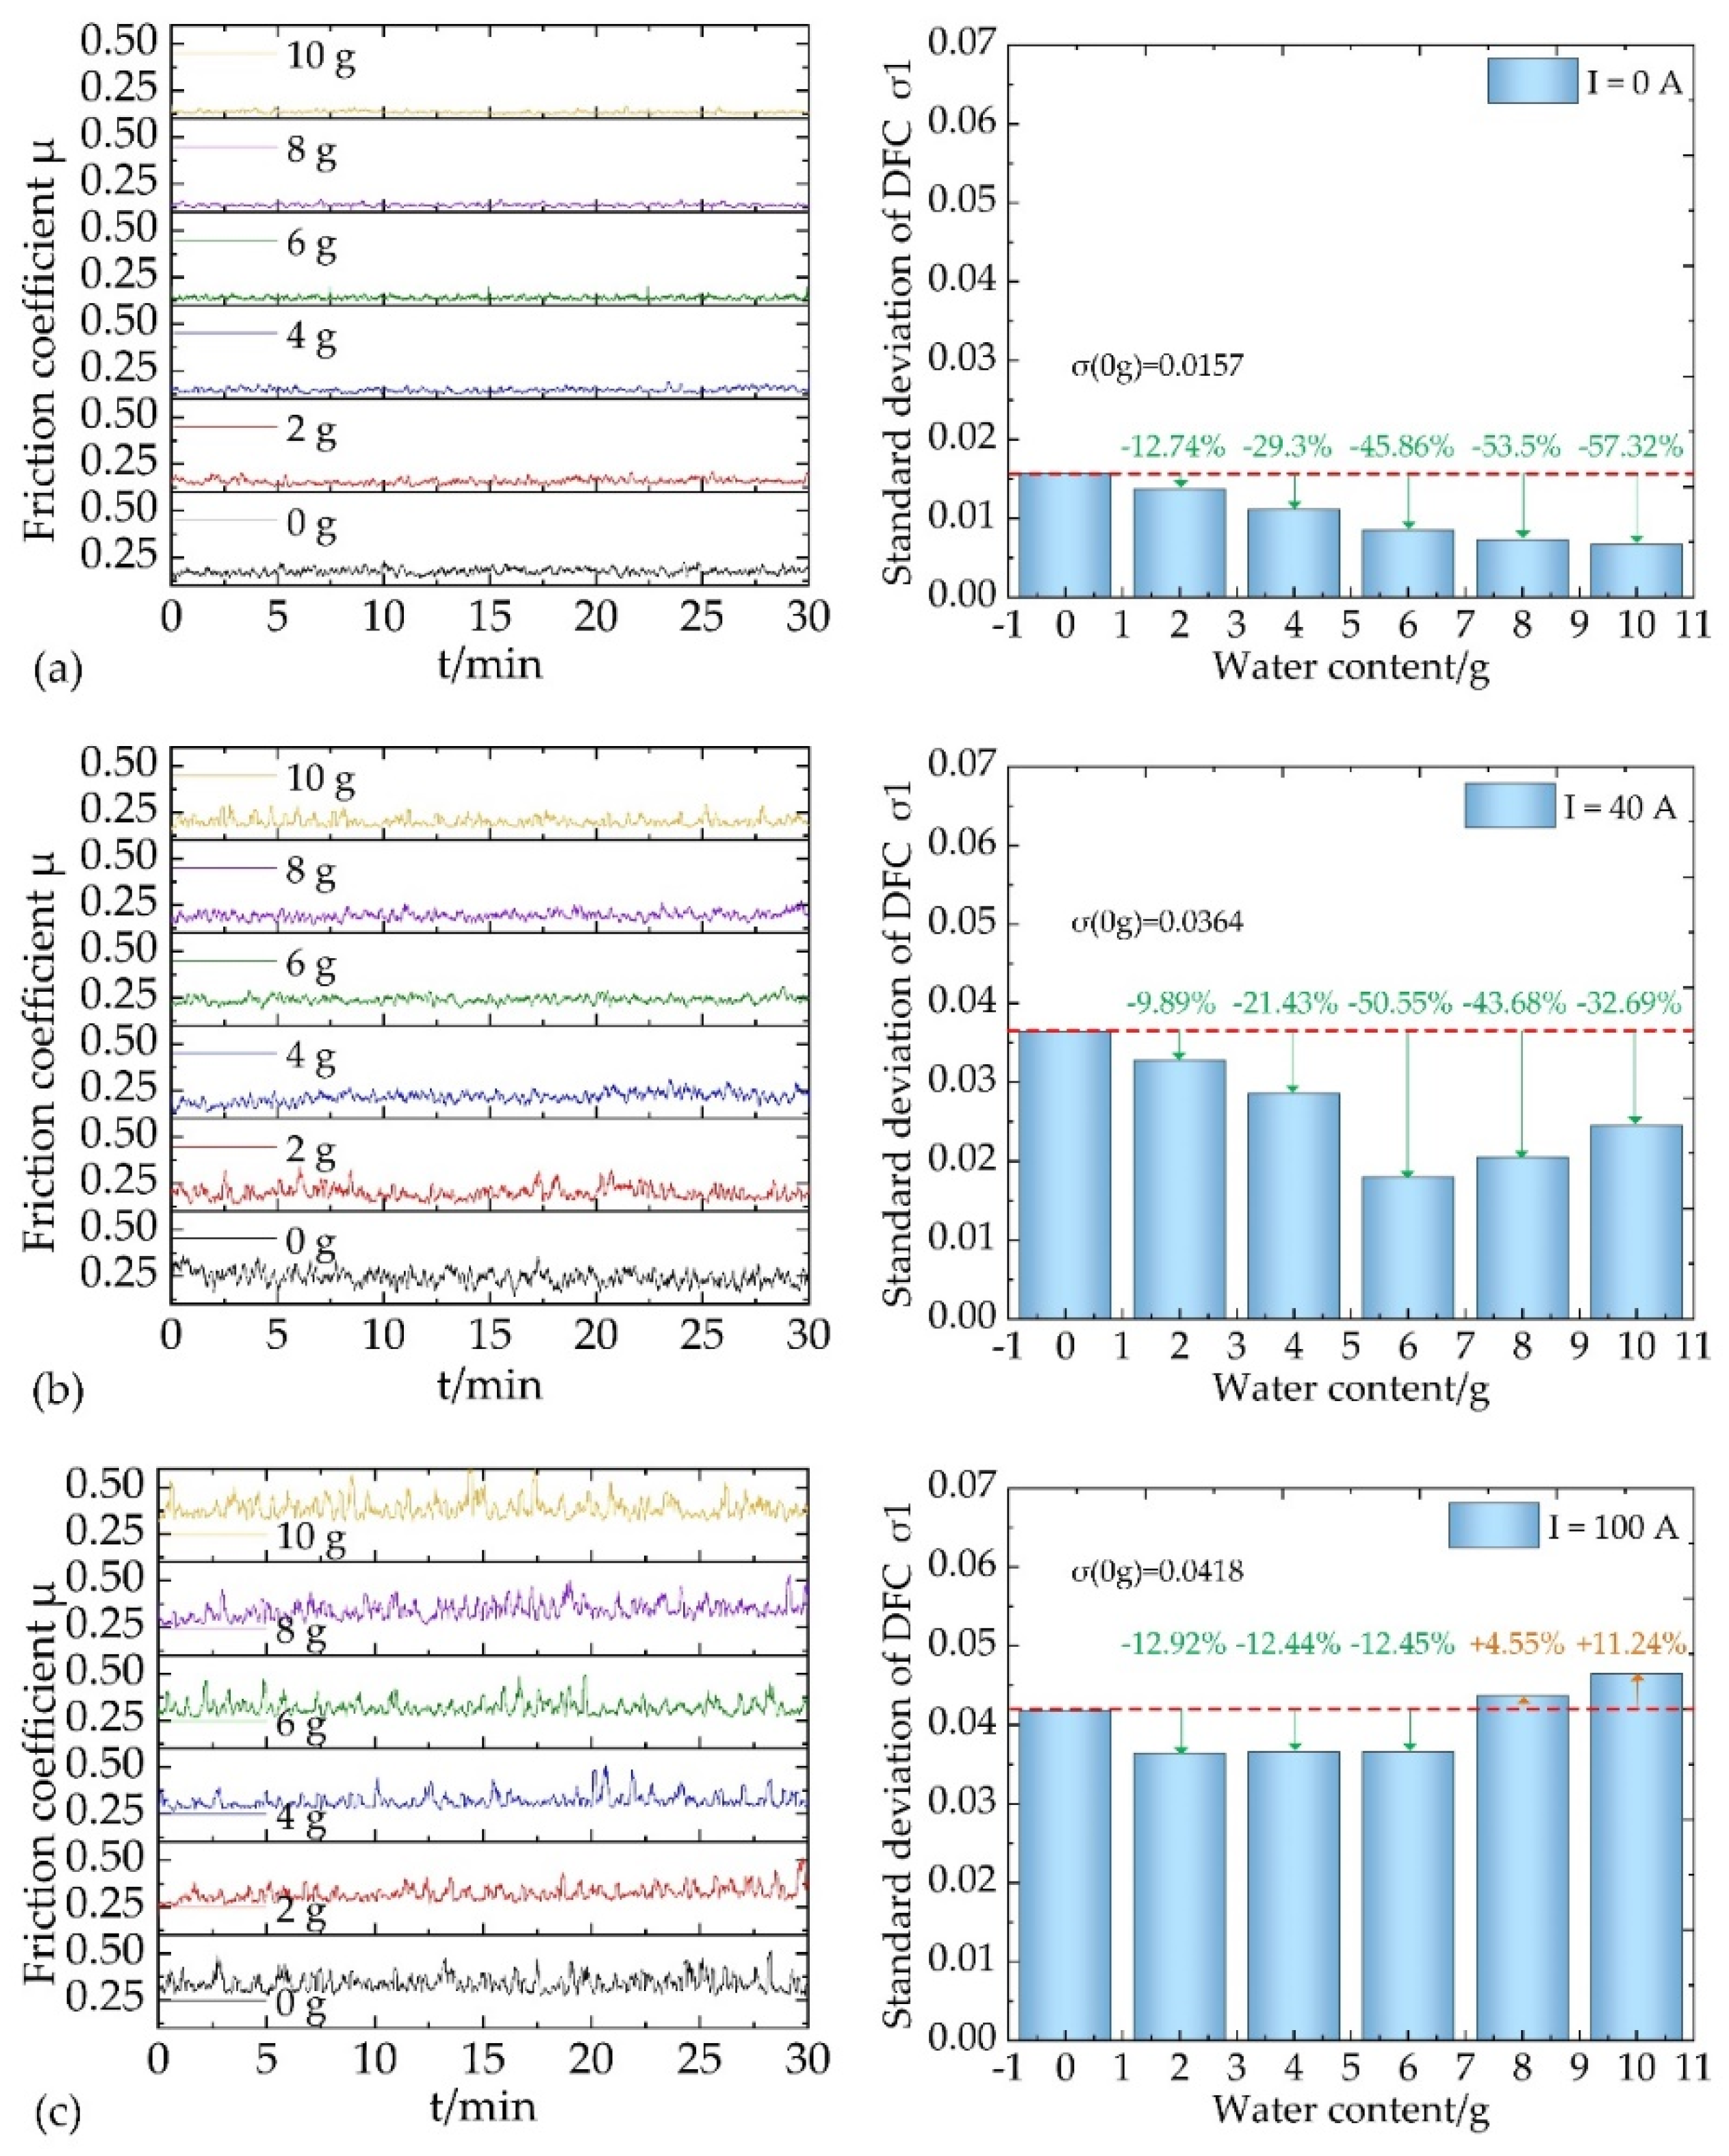
The influence of interface water content on dynamic FC (DFC) at currents of 10 A, 40 A, and 80 A was further studied, as shown in
Figure 3. When the C-Cu contact pair was in pure mechanical friction (
I = 0 A), the DFC fluctuated around 0.17 and then shifted downward with the increase of water content. When the water content was 6 g, the DFC shifted to 0.14, and the downward trend became weak. The DFC fluctuated around 0.14 in the 6–10 g range. According to the standard deviation of the DFC at 0 A, the fluctuation degree of DFC gradually slows down with the increase in water content, which indicates that the lubrication effect of water can not only make FC decrease but also make FC more stable. When the current is 40 A, the DFC fluctuates around 0.25 at 0 g and then translates downward to around 0.21 at 8 g. The water content continued to increase, and the DFC always fluctuated around 0.21. At 40 A, the standard deviation of the DFC decreased first and then increased with the increase in water content and reached the minimum value at 6 g water content. This indicates that new factors affecting friction increase the instability of the FC. The slight rise of the AFC at 40 A—10 g was mainly caused by the increase in DFC fluctuation. When the current reaches 100 A and the water content is less than or equal to 6 g, the DFC fluctuates around 0.31, while when the water content is more than 6 g, the DEF gradually shifts upward. After the standard deviation of the DFC drops from 0.0418 at 0 g to 0.0364 at 2 g, it enters a stable stage. When the water content exceeds 8 g, the standard deviation of the DFC increases rapidly, even exceeding that at 0 g. It needs to be further determined whether the factors causing this change are the same as those at 40 A.
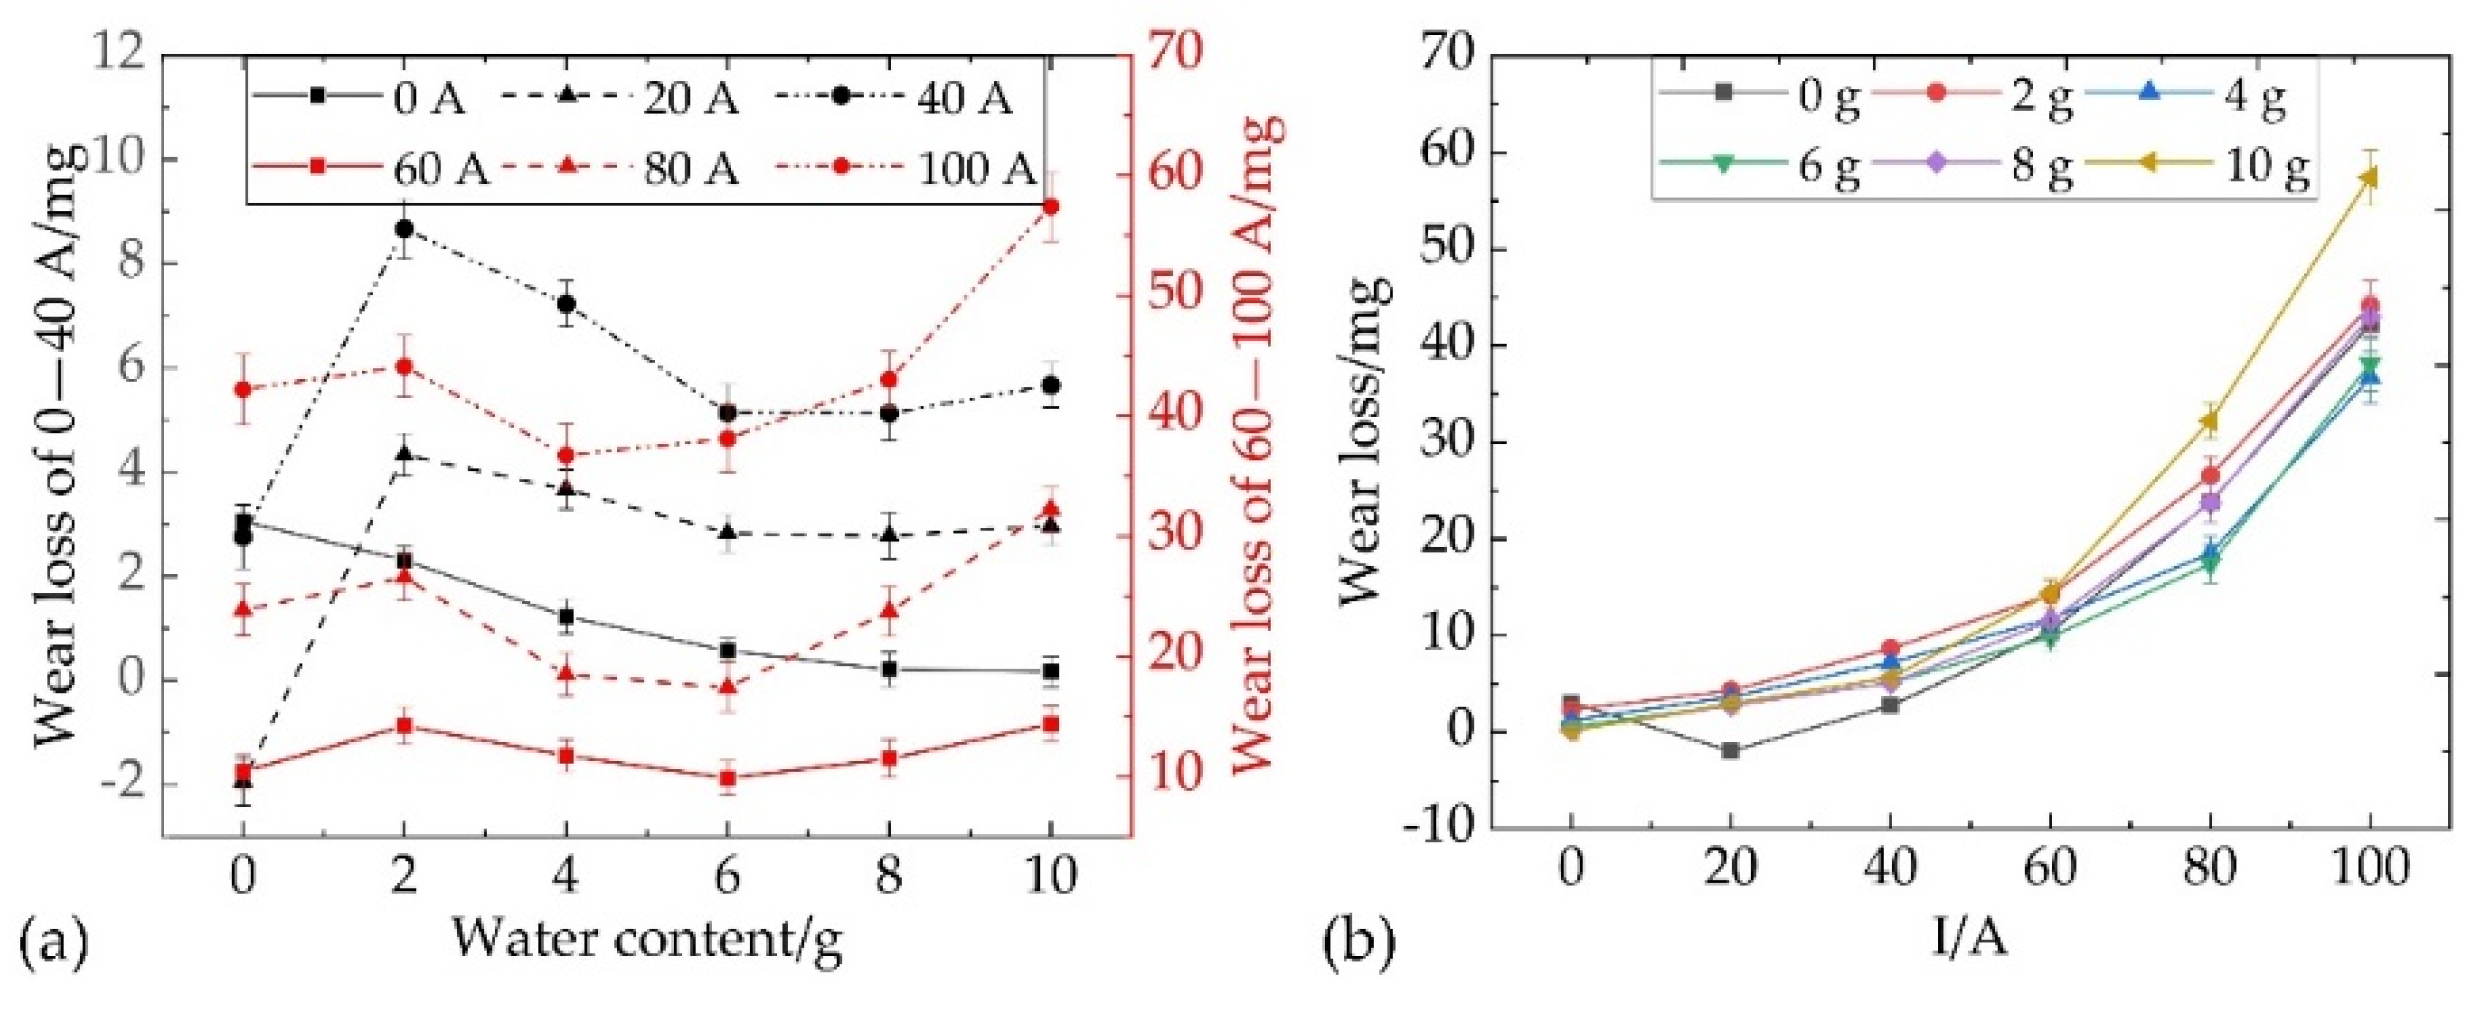
Figure 4 shows the variation trend of wear loss with water content. The effect of water content on wear loss is significantly different between the current-carrying condition and the pure mechanical condition (
Figure 4a). When the water content rises from 0 g to 2 g, the wear loss of pure mechanical friction decreases, while the wear loss of current-carrying friction increases. When the current rises from 20 A to 100 A, the gap of wear loss corresponding to 0–2 g water content gradually drops from 323% to 5%. The reasons for this difference need to be further explored. When the water content is greater than 2 g, there are still two trends of wear loss with water content under different current levels. In the first case, when the current is between 0 A and 20 A, the AFC decreases with the rise of water content. However, the change in wear loss at 0 A is still slightly different from that at 20 A. At 0 A, the decrease rate of wear loss gradually decreases with an increase in water content, while at 20 A, the wear loss is basically stable when the water content is greater than or equal to 6 g. In the second case, when the current is greater than or equal to 40 A, the wear quantity shows a U-shaped distribution with a rise in water content, which is similar to the changing trend of AFC. It is worth noting that when the current exceeds 80 A, the wear loss corresponding to a high water content (8–10 g) is far greater than that of other conditions, and the carbon slider is in an abnormal wear state.
On the one hand, the lubrication and isolation of the water film effectively reduces adhesion wear and delamination wear. On the other hand, water evaporation decreases the temperature of the contact interface and inhibits the oxidation wear of carbon materials. This is the main reason for the decrease in wear loss under low water content. The increase in wear loss at a high water content may be related to the obstruction of current transmission.
3.2. Influence of Water Content on ECR and Arc Discharge under Different Current
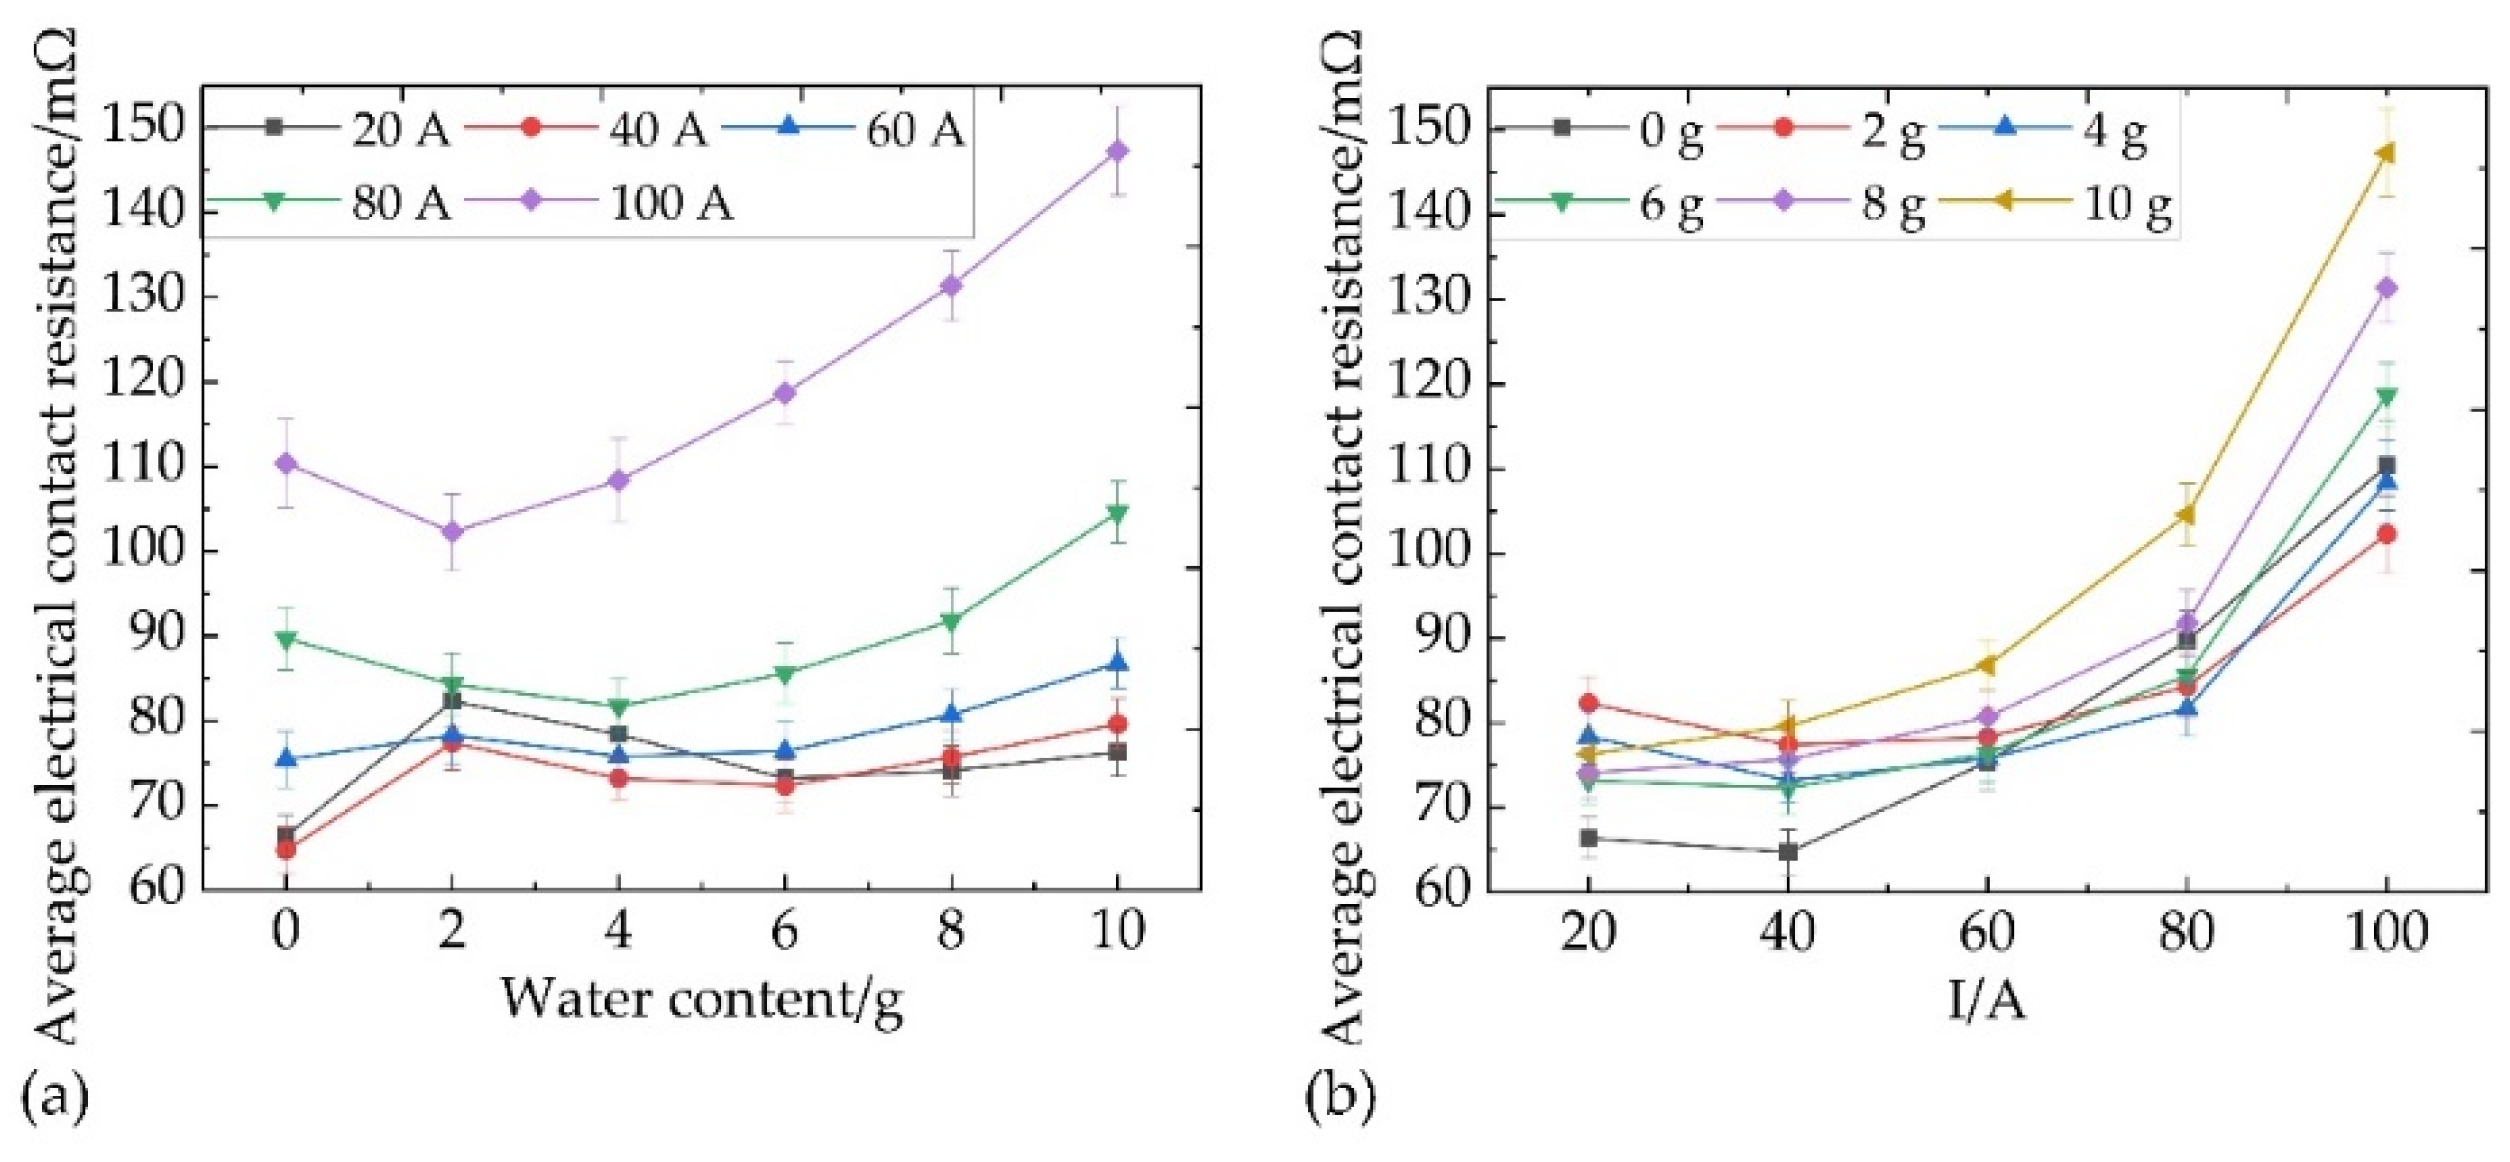
Figure 5 shows the variation trend of the average ECR (AECR) with water content. When the current is 20–60 A and 80–100 A, the changing trend of AECR with water content is different. The main difference appears in the water content of 0–2 g. When the current is lower than 60 A, the AECR corresponding to 0–2 g water content shows an upward trend. However, this upward trend gradually decreases with an increase in current. When the current is 80–100 A, the AECR decreases at 0–2 g water content. When the water content is more than 2 g, the AECR shows a U-shaped distribution with the water content at 20–80 A, while the AECR at 100 A increases monotonically with the water content. It is worth noting that at 20–80 A, the minimum value of AECR as a function of water content continuously moves forward with the rise of the current. When the current is 100 A, the minimum value of AECR obtained at 2 g water content may be the result of the advance of the minimum point. In other words, the changing trend of AECR with 2–10 g water content at 100 A is similar to that at 20–80 A. Under different water contents, the changing trend of AECR with current is slightly different. When the water content is less than 6 g, the AECR reaches the minimum value at a current of 40 A and then rises with the rise of the current. When the water content was more than 8 g, the AECR increased with the current.
The main factors affecting ECR include the number and size of contact spots and the interfacial film layer. In the water film, carbon/copper debris and positive/negative ions form a new current transmission channel under the action of electric field force, and the actual number of conductive spots increases, which is helpful in reducing ECR [
29]. However, when the coverage area and thickness of the water film increase further with the increase in water content, a large number of C-Cu spots cannot be directly contacted, and the velamen resistance increases significantly, which makes the ECR rise. In addition, the cooling effect of water weakens the plastic deformation of the C-Cu contact spots, and the size of the contact spots decreases, which may increase the ECR. When the current is small (
I ≤ 40 A), the leakage current channel in the water film can still complete the task of current transmission, so the increment of AECR is not significant at a large water content. However, as the current gradually increases, the conductive channel in the water film is difficult to transmit more current. At this time, the higher the water content, the more difficult the current transmission between C-Cu contacts, which is reflected in the significant increase in AECR. When the current is 0–60 A, the reason why the AECR corresponding to 2 g water content is higher than that of 0 g water content needs to be further explored.
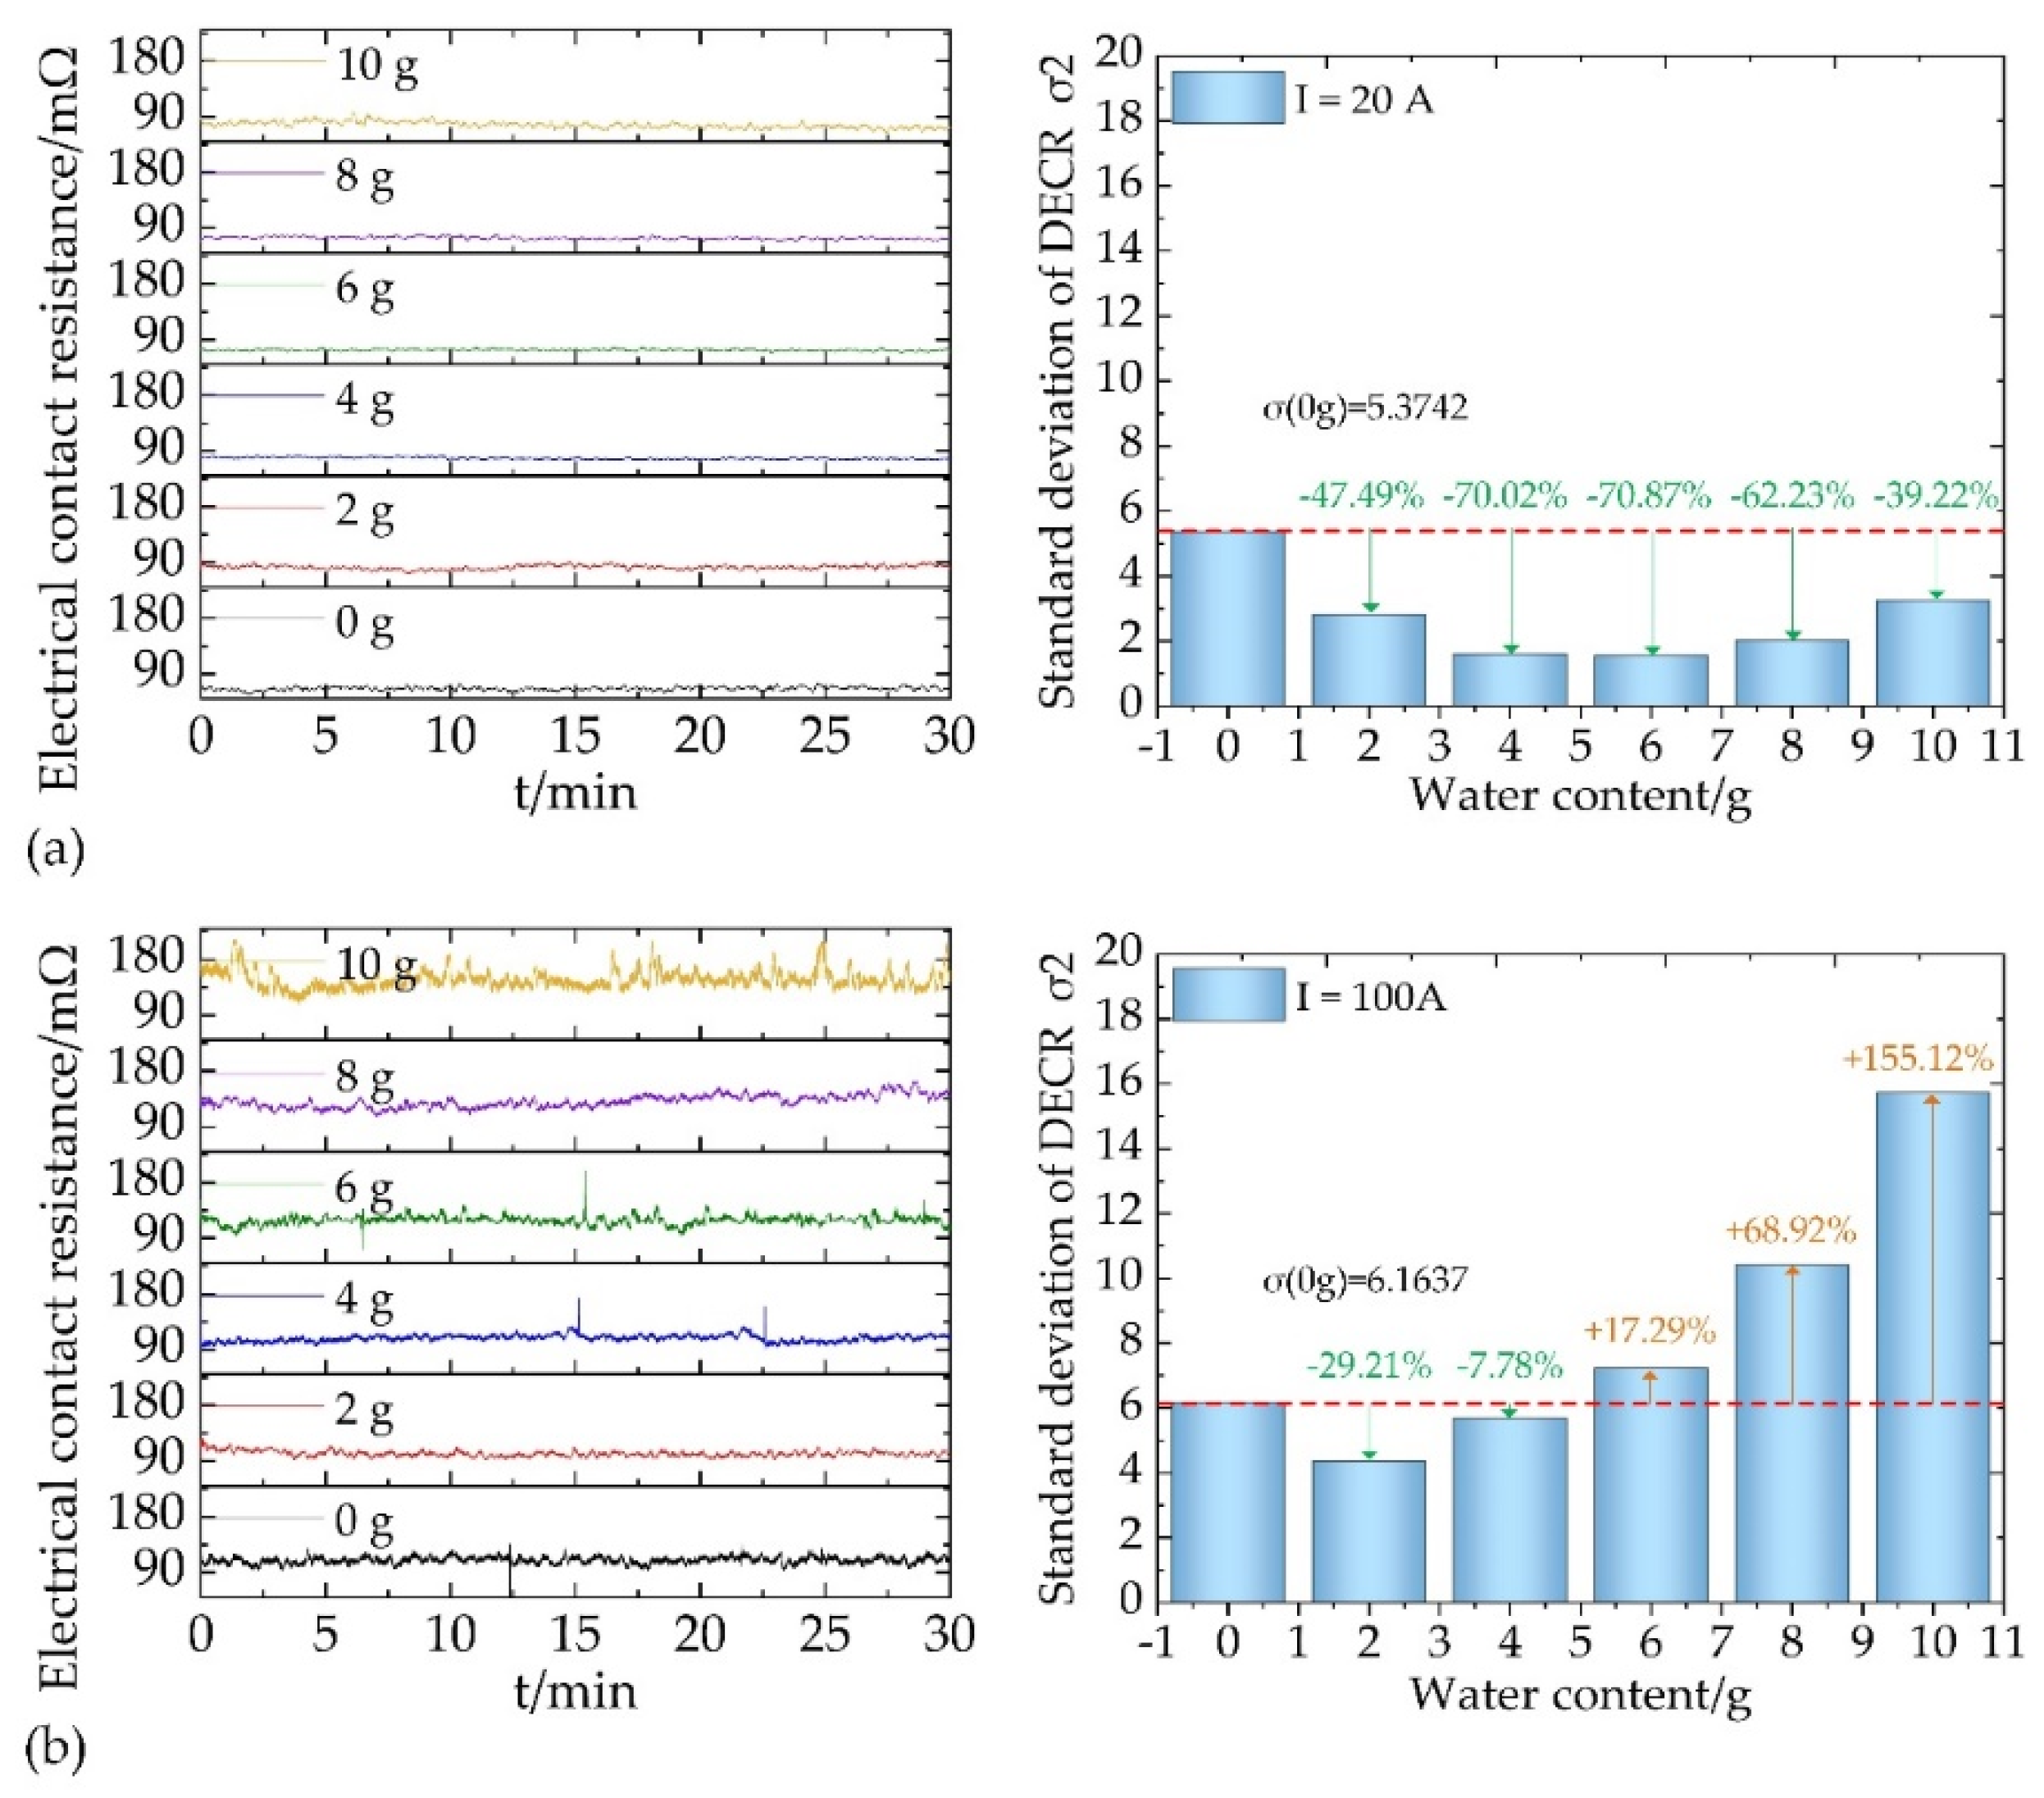
The dynamic ECR (DECR) changes with water content at the currents of 20 A and 100 A were further analyzed, as shown in
Figure 6. When the current is 20 A, the fiducial value of DECR corresponding to 0 g of water content is the lowest, but its fluctuation degree is the highest in terms of the standard deviation. When the water content reached 2 g, the DECR shifted upward, but the fluctuation degree of DECR decreased significantly. With a further increase in water content, DECR shifted downward, and the fluctuation degree gradually decreased. When the water content is greater than 6 g, the DECR basically stabilizes around 75 mΩ. However, the fluctuation of the DECR was the weakest when the water content was 6 g, and then the fluctuation was aggravated with an increase in water content. When the current reaches 100 A, DECR corresponding to 0–2 g water content fluctuates around about 110 mΩ, and DECR gradually shifts upward with a further increase in water content. The fluctuation degree of DECR reached the minimum value at 2 g water content and then increased rapidly with the increase in water content. The fluctuation degree of DECR corresponding to 10 g water content is increased by 155.12% compared with the case at 0 g water content.
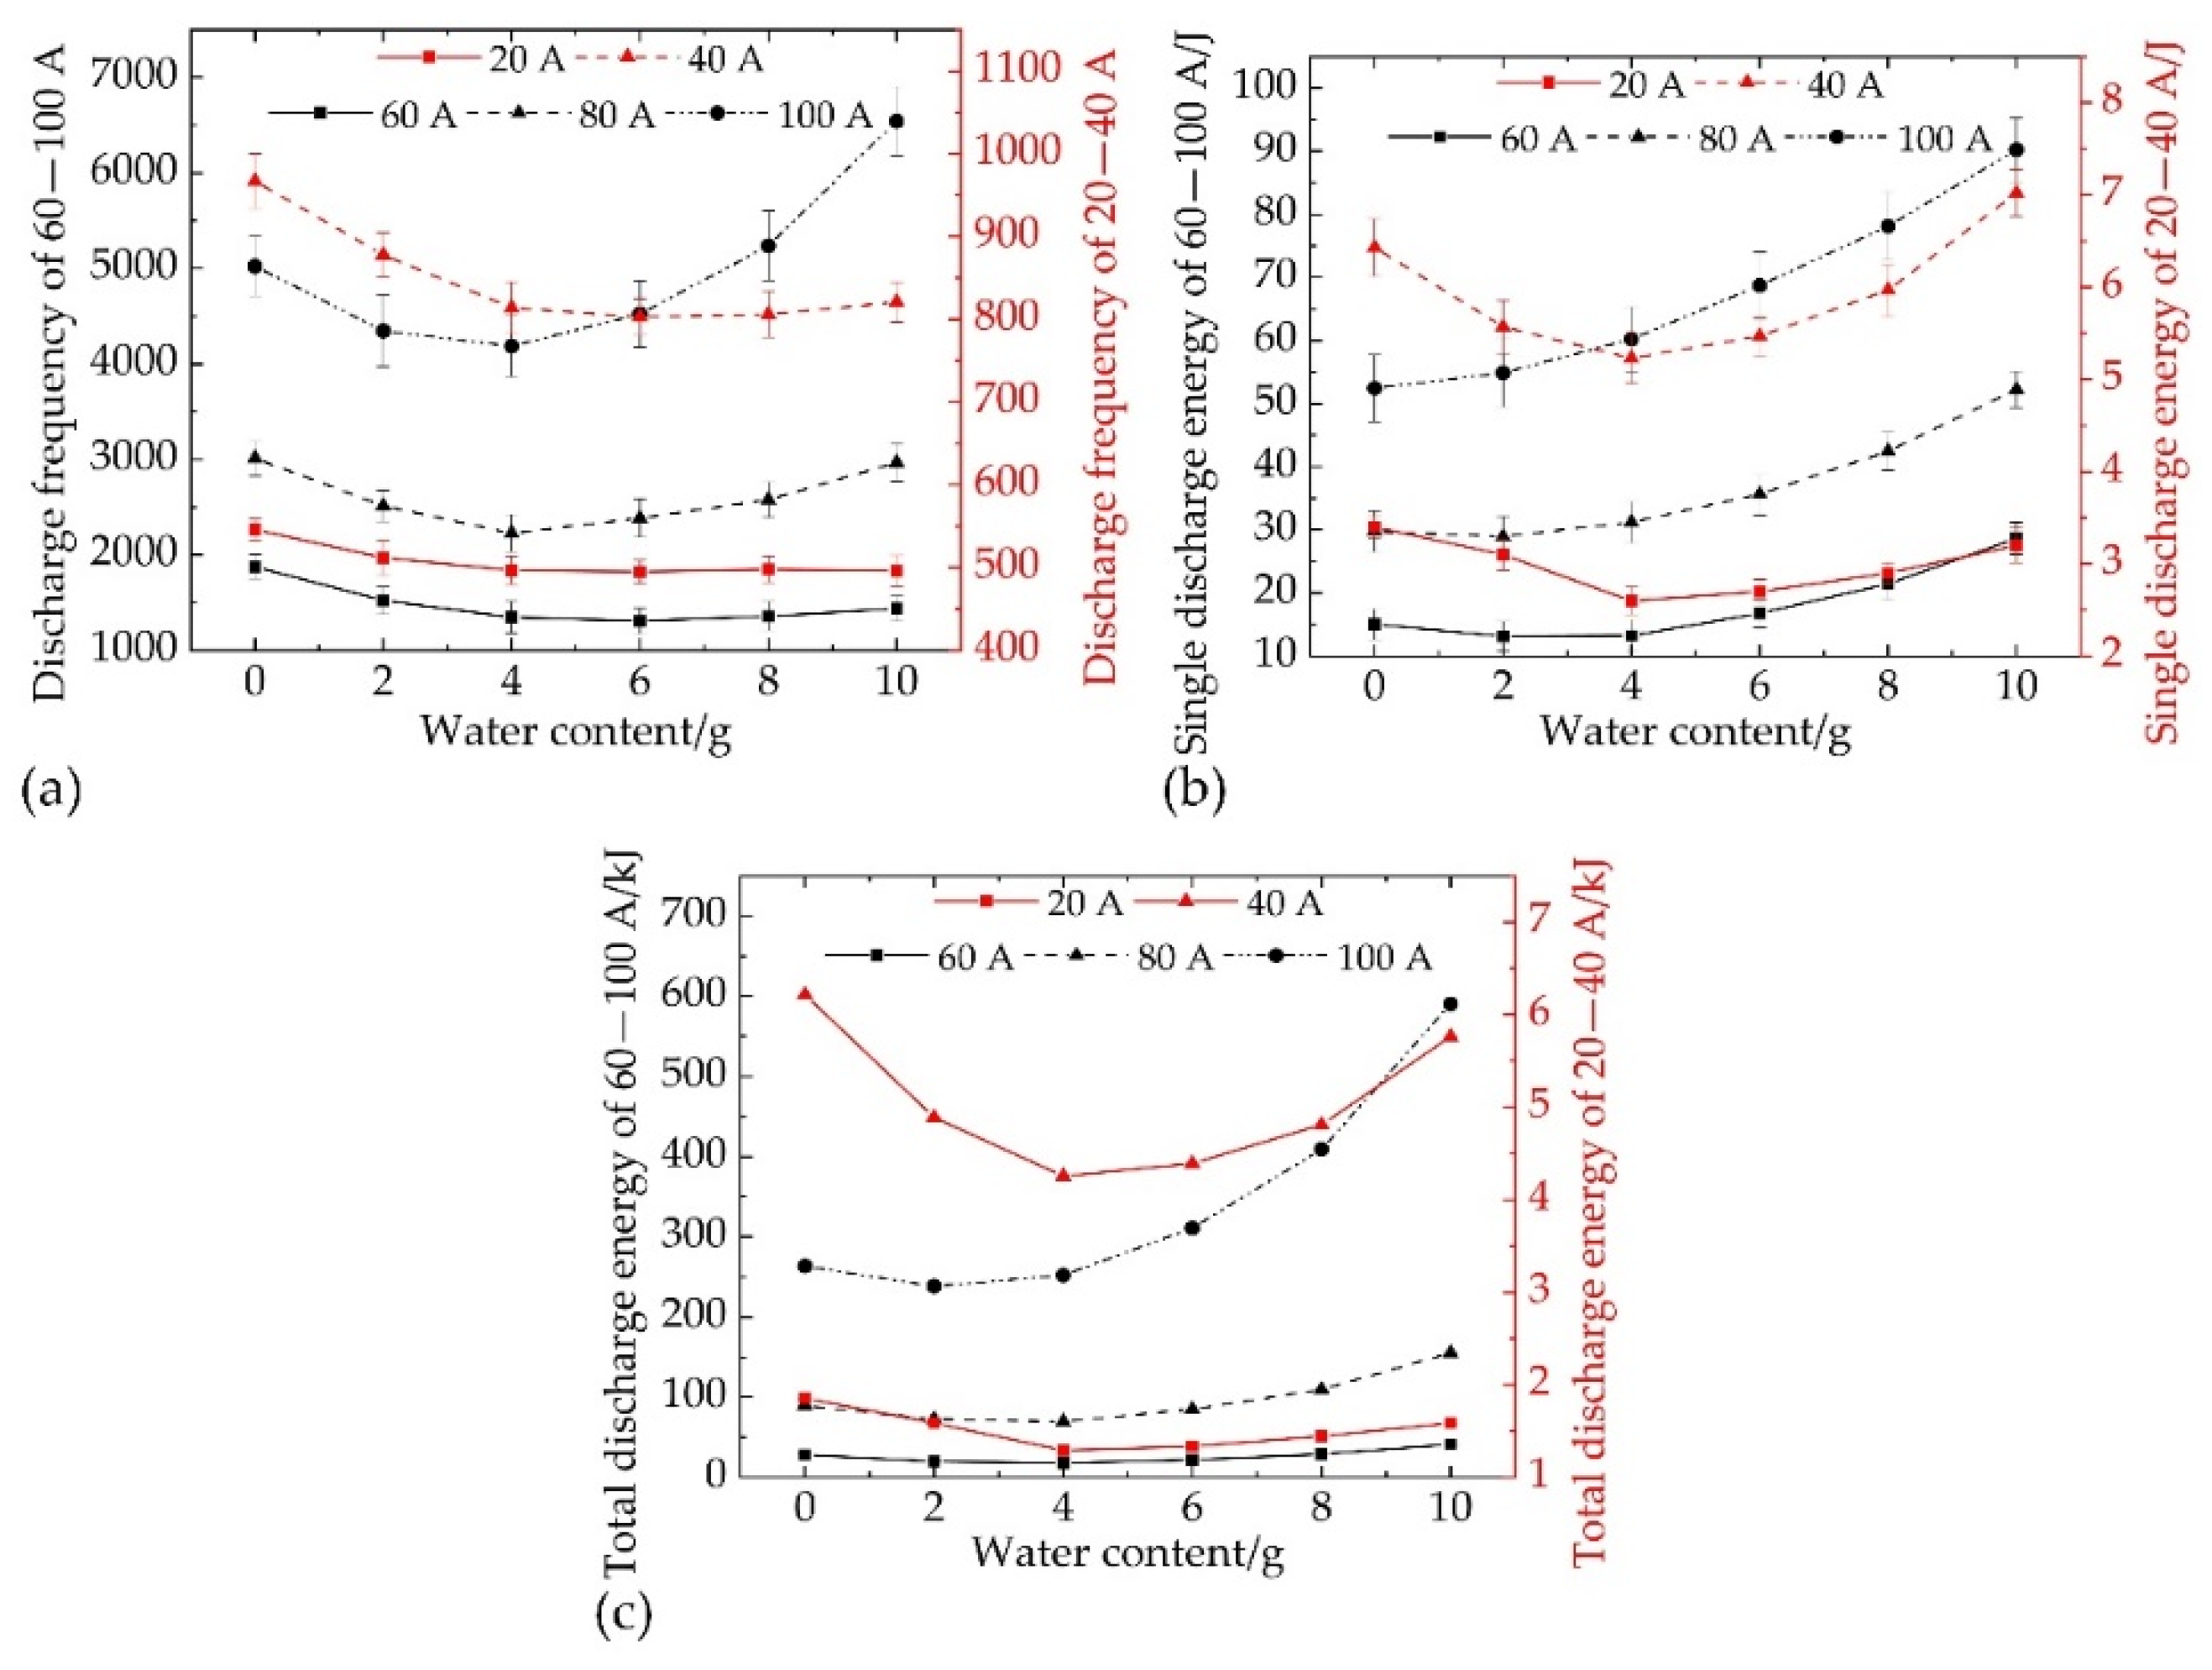
Figure 7 shows the variation trend of arc discharge characteristic parameters with water content. In the process of current-carrying friction, the discharge characteristic parameters concerned mainly include discharge frequency (
Figure 7a), average single discharge energy (
Figure 7b), and total discharge energy (
Figure 7c). Under different current levels, the discharge frequency and average single discharge energy showed two different trends with the increase in water content. When the current is in the range of 20–40 A, the discharge frequency decreases with water content, while the average single discharge energy shows a U-shaped distribution with water content. When the current exceeds 60 A, the discharge frequency shows a U-shaped distribution with water content, and the average single discharge energy increases with water content. The minimum point of discharge frequency with a current of 60–100 A and the minimum point of average single energy with a current of 20–40 A appear near 4 g water content. The variation in total discharge energy with water content is similar to that of the average single discharge energy.
The effect of water film on arc discharge when the current is less than or equal to 60 A is obviously different from that when the current is greater than or equal to 80 A. Firstly, the discharge mechanism is analyzed when the current is less than or equal to 60 A. The lubrication effect of the water film makes the relative motion of the C-Cu contacts more stable, which is beneficial for restraining the vibration separation of contact spots and reducing the discharge frequency. However, at the same time, the presence of water film increases the degree of non-uniformity of the electric field between C-Cu contacts and significantly increases the local field intensity [
30]. In the case of vibration separation or brittle fracture of contact spots, the locally enhanced electric field is easy to break down the air gap, which is manifested as the increase of discharge frequency and the decrease of average single discharge energy. When the current level does not far exceed the transmission limit of the leakage current channel in the water film, with the increase in water content, the lubrication performance of the water film decreases, but the ability to cause electric field distortion increases, which makes the decreasing rate of discharge frequency gradually close to zero. In addition, Joule heat and friction heat in the process of current-carrying friction cause the evaporation of water, while water molecules are electronegative, and the increase in water vapor content in the air increases the breakdown field strength of the air [
31]. When the water content is small, the distortion effect of the water film on the electric field is dominant, and the average single discharge energy decreases with the water content. When the water content exceeds a certain value, a large amount of water vapor effectively increases the breakdown field strength of the air, and the average single discharge energy increases with the water content. When the current is greater than or equal to 80 A, the water film seriously hinders the transmission of the current. Even if the contact spots are in stable contact, discharge still occurs in the water film. The higher the water content, the more frequent the discharge in the water film, resulting in a slight decrease and then a rapid increase in discharge frequency with water content. The breakdown field strength of liquids is much higher than that of gas, which leads to an increasing trend of average single-discharge energy with water content.
3.3. Morphology and Composition Analysis under Different Water Contents
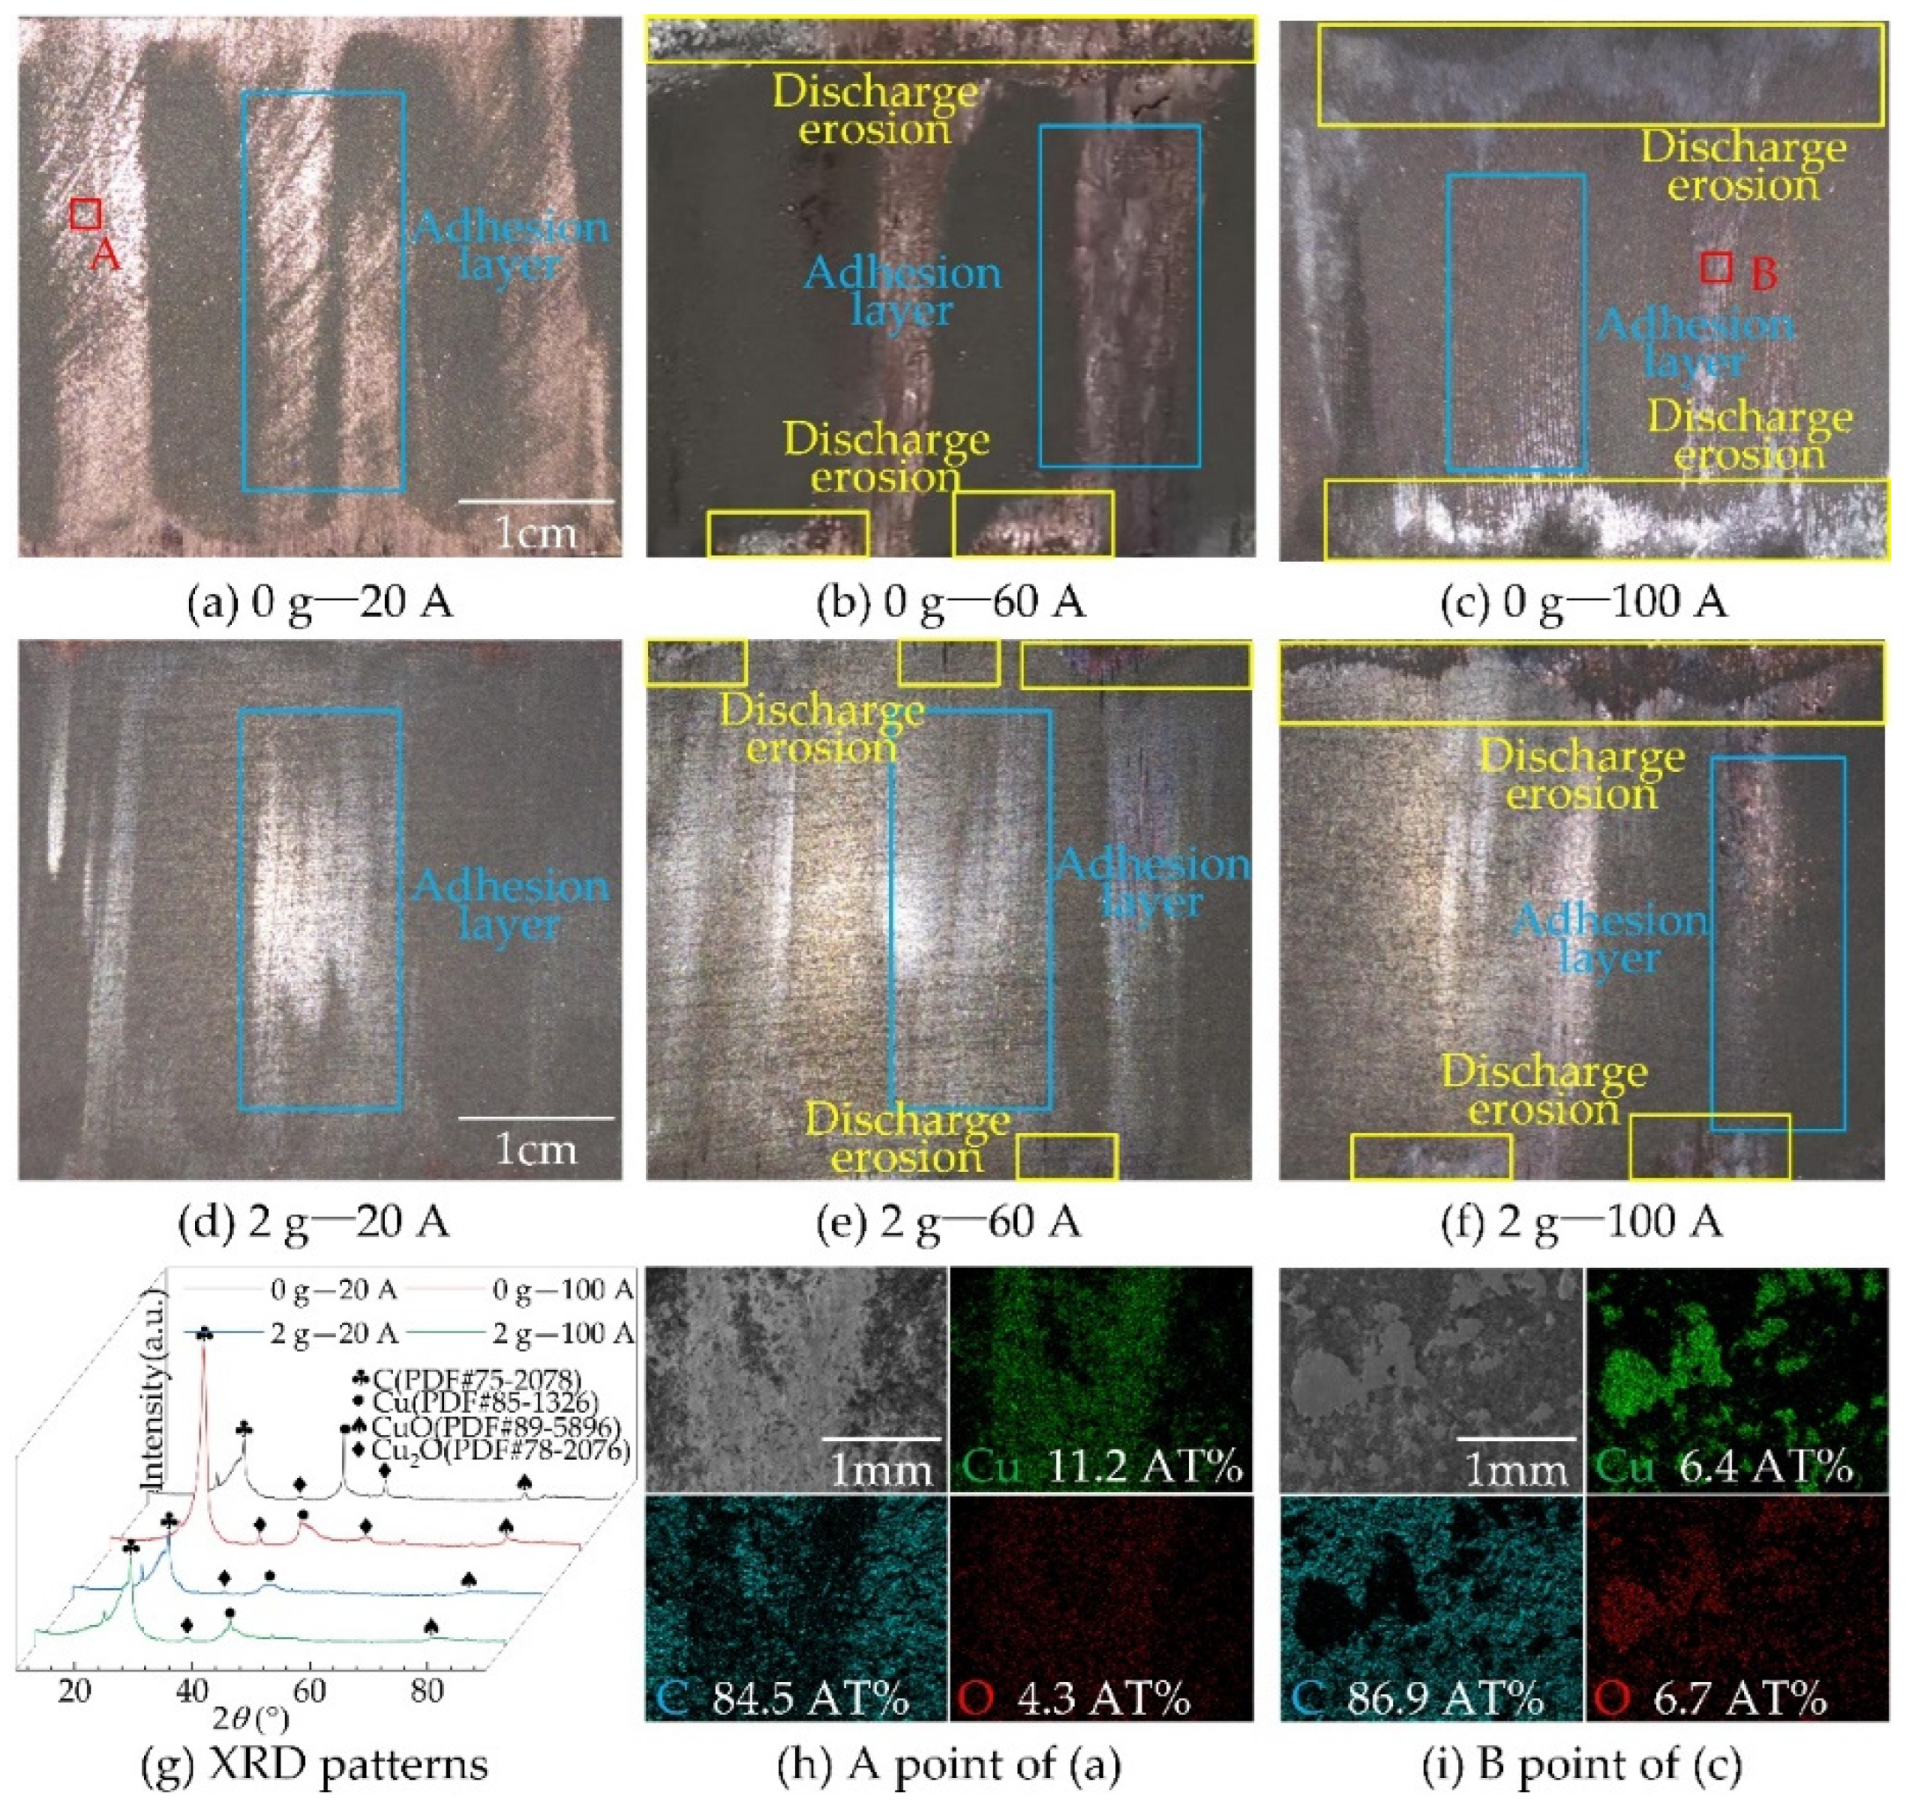
Figure 8 shows the surface morphology and element content of the carbon slider under different electric currents when the water content is 0–2 g. Compared with the case of 2 g water content, a copper-red, blue-purple, or silver-gray adhesion layer exists on the surface of the dry carbon slider (
Figure 8a–c). According to XRD composition analysis, the adhesion layer is mainly composed of Cu, CuO, and Cu
2O (
Figure 8g), which comes from the material transfer of the copper contact wire. When the water content is 0 g, the amount of copper transfer on the carbon surface decreases with the increase in current. However, it is found from the EDS spectra that the larger the current, the more overlap the enrichment areas of copper and oxygen elements, which indicates a higher degree of copper oxidation (
Figure 8h,i). Under dry conditions, the surface energy of carbon materials is very high, and the adhesion of carbon materials to copper materials is strong. At the same time, Joule heat reduces the hardness of copper materials. It enhances the activity of copper atoms, resulting in a large number of copper elements adhering to the carbon surface. The transferred copper offsets the loss of the carbon material and thus shows a low wear loss at 0 g water content. After the transfer of copper to the carbon surface, the lubricated C-Cu contacts change to highly adhesive Cu-Cu contacts, but the Cu-Cu contact spots have better conductivity. Therefore, when the current is less than 60 A, the average value and fluctuation degree of FC increase, while the ECR achieves a smaller value. With the increase of current, a large amount of Joule heat promotes the oxidation rate of the copper surface, and the adhesion between the copper oxide and carbon surfaces is relatively lower. The direct contact between the carbon-copper matrix is isolated to a certain extent [
32], which is the main reason for the decrease in the copper transfer amount.
When the water content increased to 2 g, the ions in the water film reduced the surface energy of the carbon material and, at the same time, isolated the direct contact of C-Cu spots to a certain extent, resulting in an insignificant copper transfer layer on the carbon surface (
Figure 8d–f). However, different from that at 0 g water content, the material transfer traces under high currents are more obvious. The copper ions move toward the carbon surface under the action of an electric field force in the water film. The larger the current, the stronger the electric field. The increase in copper ion migration in the water film is the main reason for the expansion of the transfer layer. The wear loss measured at 2 g water content is closer to the wear loss of the carbon material itself. Although the wear loss of carbon material is inhibited, the value is higher than that at 0 g water content. When the current is less than 60 A, the ECR also shows an upward trend due to the decrease in the copper transfer amount, but it is more stable. When the current is greater than 80 A, the barrier effect of the oxide film on the carbon surface at 0 g water content is higher than that of the water film at 2 g water content. Therefore, the ECR is different from that at 0–60 A but shows a downward trend.
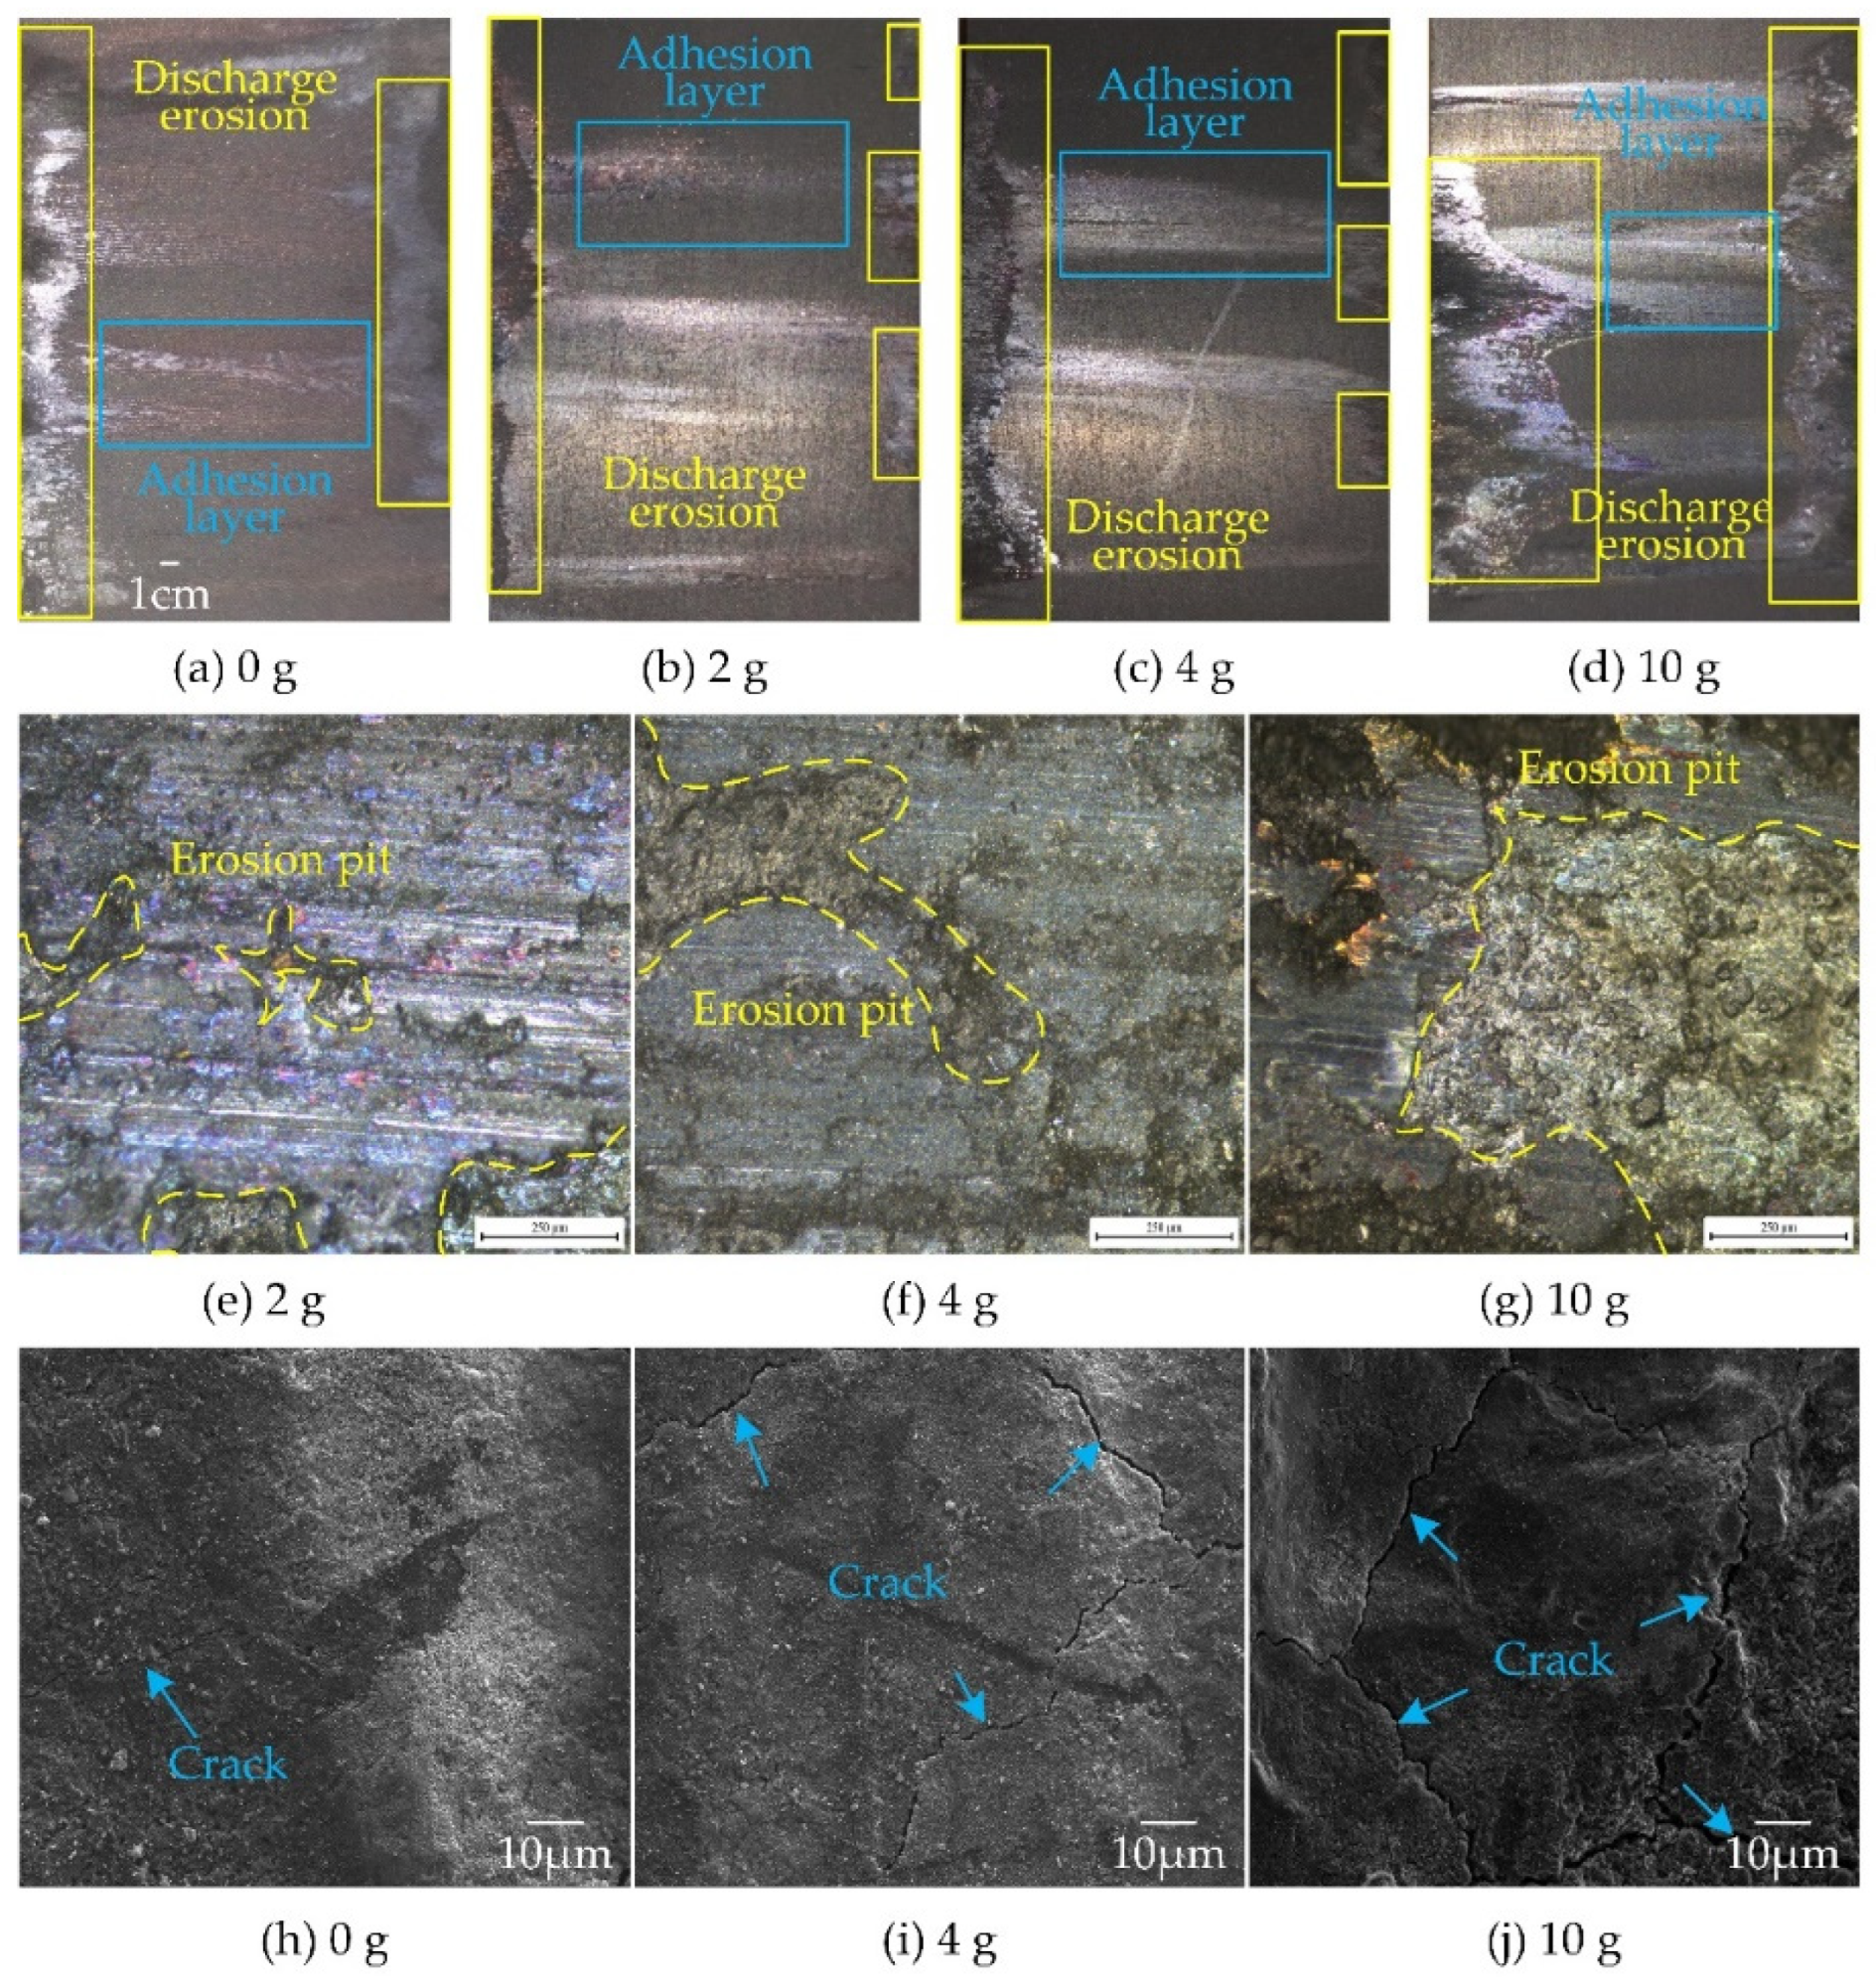
Figure 9 shows the surface morphologies of carbon materials with different water contents at 100 A. Similar to the variation trend of total discharge energy, the discharge erosion trace on the carbon surface gradually increases with the increase in water content (
Figure 9a–d), and the discharge erosion area grows faster when the water content is greater than 6 g. It can be inferred that the abnormal wear of carbon materials under high water content (8–10 g) is caused by discharge erosion. According to the metallographic microscopic images, the area and depth of the discharge erosion pit increase with the increase in water content, and copper ions migrating through the discharge plasma channel accumulate at the bottom of the erosion pit (
Figure 9e–g). These pits significantly increase the roughness of the carbon material, resulting in an increase in both the average value and the fluctuation degree of EF. On the other hand, the rough interface corresponds to fewer contact spots, and the current propagation is further hindered, which is an important reason for the significant increase in the mean value and fluctuation degree of the ECR. In addition, micro-cracks on the surface of carbon materials were observed in SEM images (
Figure 9h–j). The width, length, and number of microcracks increased significantly with the increase in water content. On the one hand, the high contact resistance and frequent discharge caused by interfacial water film aggravate the heat generation of the C-Cu interface. On the other hand, water evaporation accelerates heat dissipation on the carbon surface. This causes the local temperature gradient of the carbon material to increase observably. The concentration of thermal stress and the difference in the thermal expansion coefficient of each component of carbon material are important factors leading to the germination and expansion of micro-cracks [
33]. The higher the water content, the more obvious the role of water in promoting heat production and heat dissipation, which leads to a higher cracking degree of carbon materials. Micro-cracks are an important factor leading to the deterioration of carbon material properties. With the expansion of micro-cracks, the compression strength, tensile strength, and bending strength of carbon materials decrease significantly, which makes it difficult to cope with the operating environment of the railway pantograph-contact line system under strong vibration and impact.
3.4. Discussion
The material of the carbon slider in this paper is amorphous pyrolytic carbon with a low degree of graphitization and a large number of dangling bonds. Under dry conditions, the binding force of the C-Cu interface is strong, showing a high FC, which is also reflected in the morphology of the carbon slider in
Figure 8. The transfer of copper material to carbon material caused by high adhesion accelerates the wear of the copper contact line. In the C-Cu contacts of the pantograph-contact line systems, the important purpose of using a carbon slider is to protect the copper contact line, which will break due to wear and cause serious train running accidents. Therefore, some measures should be considered to enhance the lubricity of C-Cu contacts in areas with low humidity.
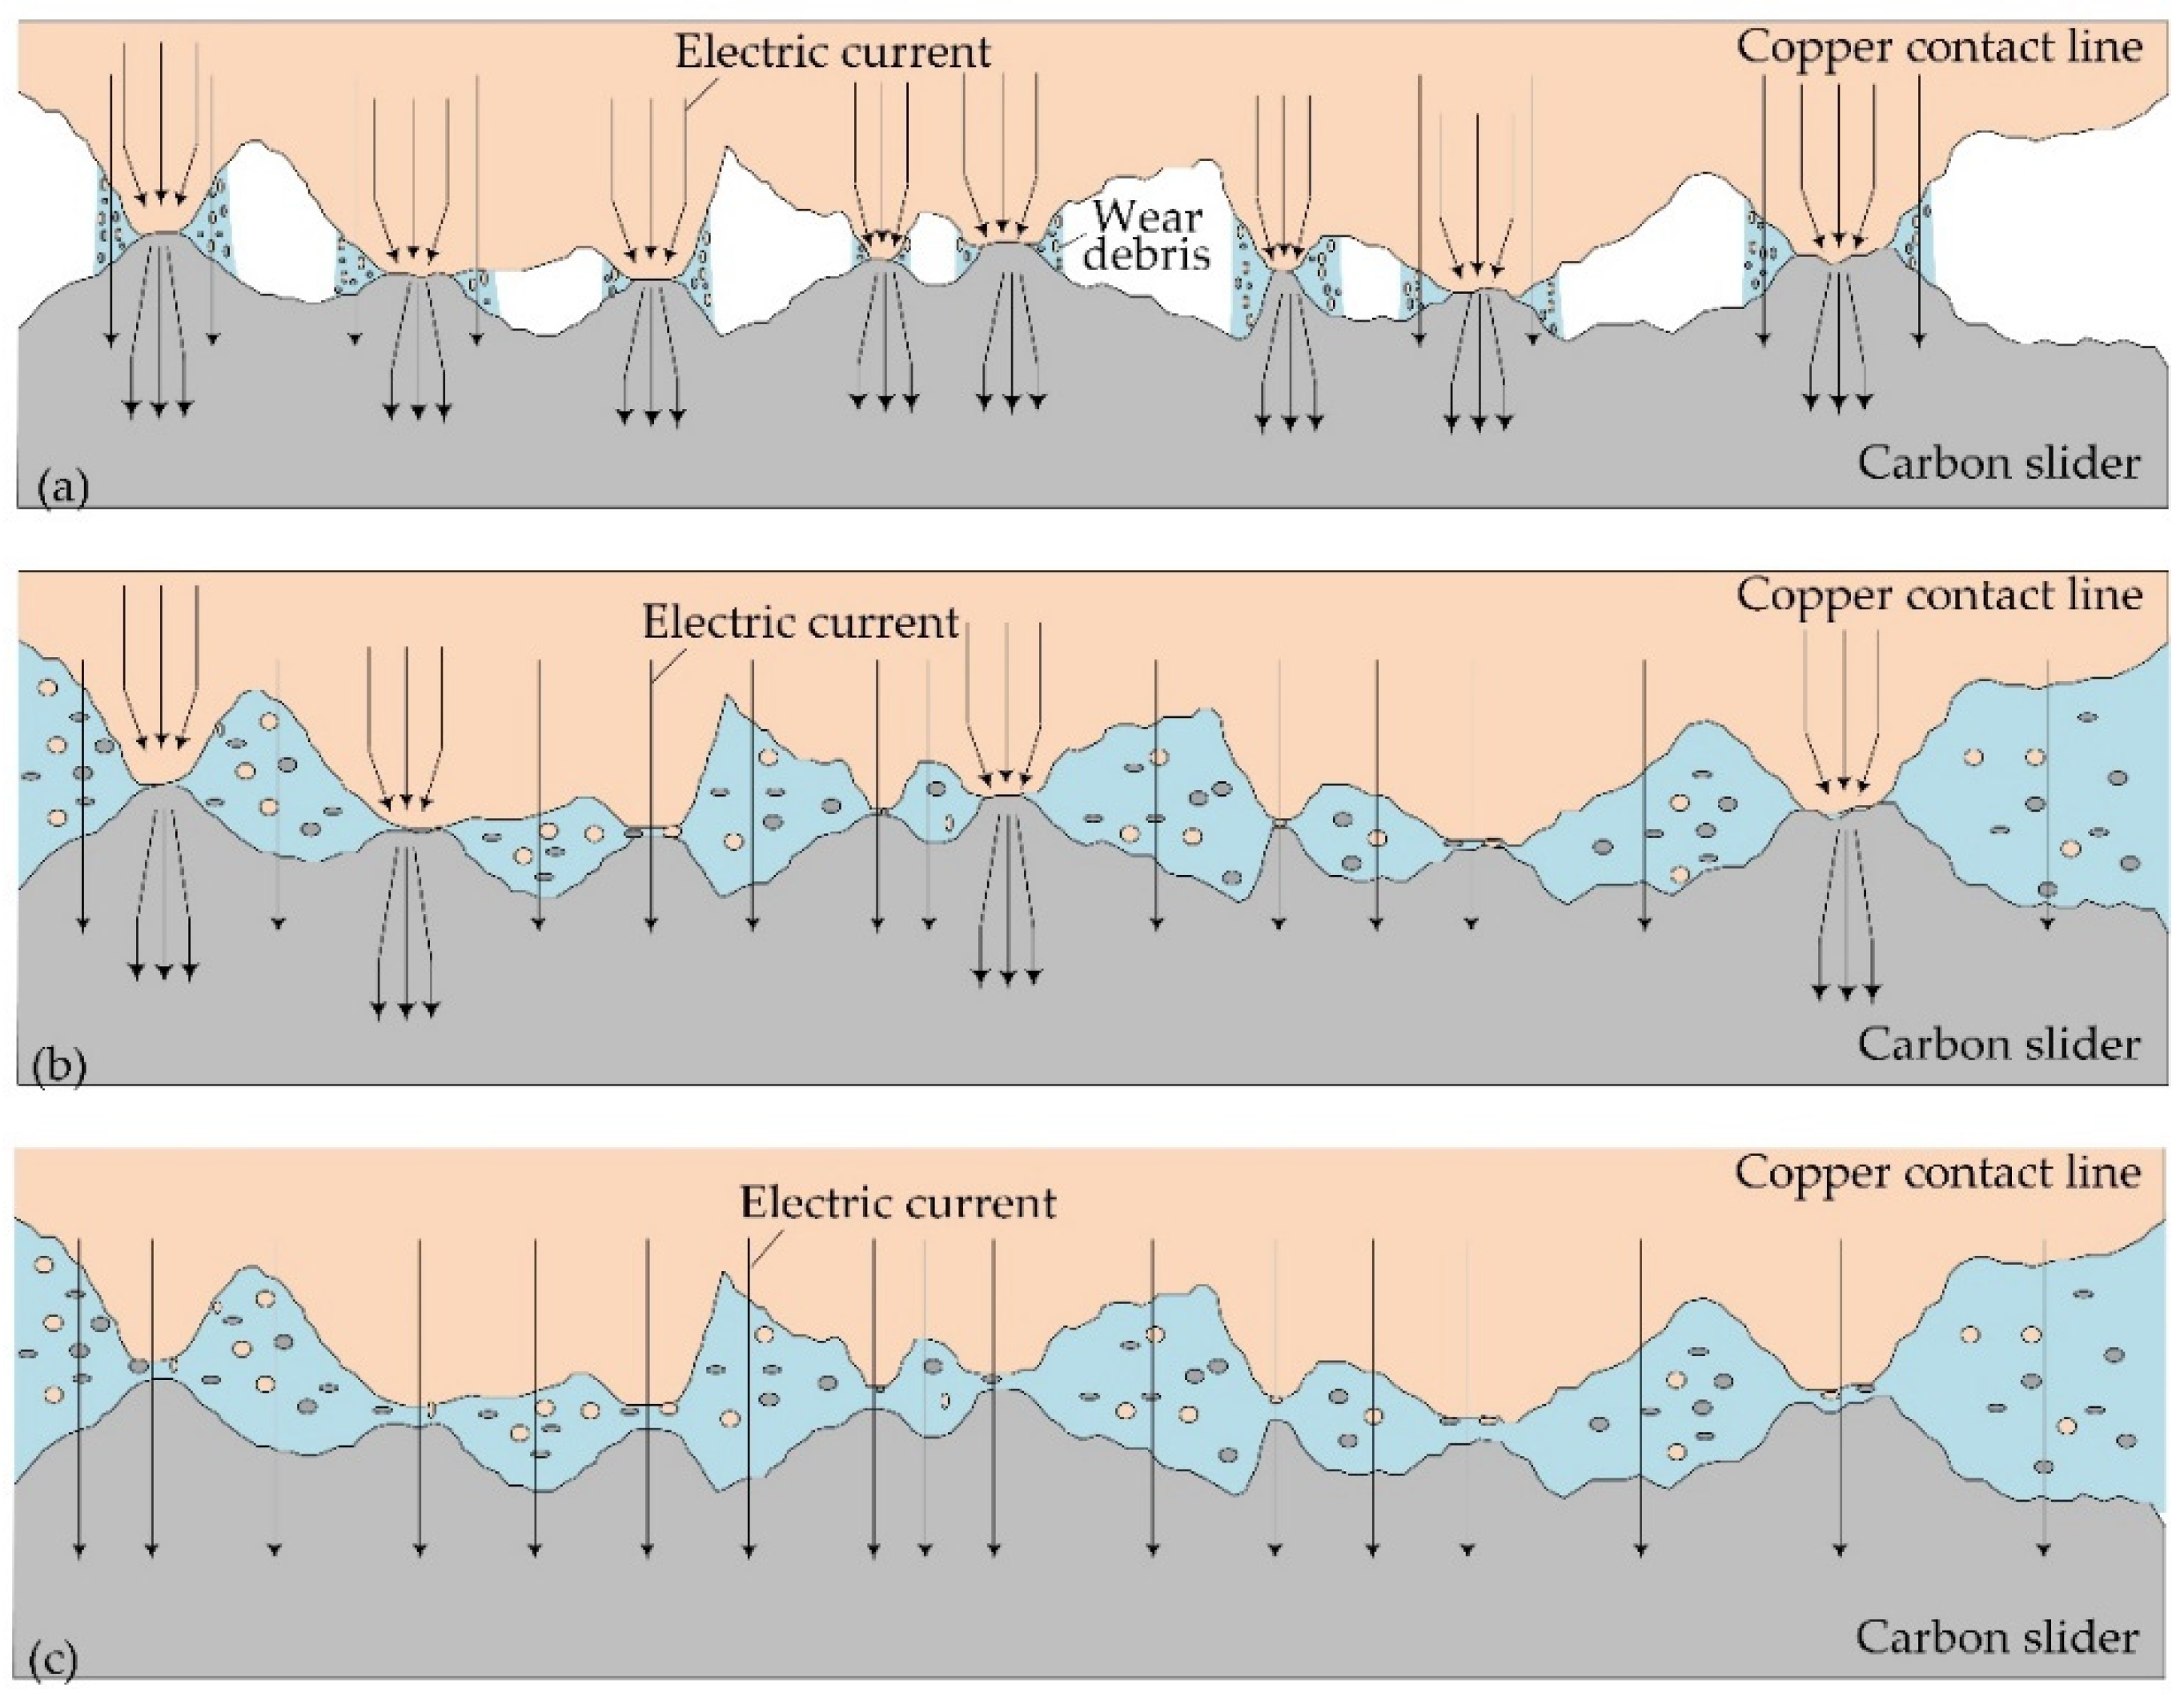
When the interface contains water, the water film distribution between the interfaces as the water content increases is shown in
Figure 10. Due to the curved liquid surface effect, the water film first accumulates at the contact spots (
Figure 10a). With an increase in water content, the water film gradually covers the entire contact area (
Figure 10c). On the one hand, with the increase in water content, the dangling bond on the carbon surface captures polar particles, reduces interface adhesion, and helps to form a continuous carbon friction film [
34], which is conducive to obtaining a smaller FC. On the other hand, the increase in the curved liquid surface force also makes the FC to decrease to a certain extent and then tend to be stable.
The change in the current conduction path in water film is an important factor that affects the friction and wear characteristics of the C-Cu interface. The carbon and copper abrasive particles and the copper ions of the contact line in the water film form a new current transmission channel under the action of an electric field force. In the case of water film coverage shown in
Figure 10a, the current can be conducted through both the contact spots and the conducting particles in the water film, and the current transmission capacity is improved. However, when the water film gradually covers the entire contact surface (
Figure 10b,c), the contact spots that can transmit current gradually decrease. When the water film completely covers the contact surface, current transmission can barely be completed in the case of a low current. However, at higher current levels, the conducting particles in the water film cannot undertake the task of current transmission. At this time, a high contact voltage drop is generated, accompanied by an intensified arc discharge. The wear loss of the carbon slider is significantly increased due to discharge erosion, which is consistent with the change in wear loss in
Figure 4 and the morphology of the carbon surface in
Figure 9. The intensified discharge erosion leads to a significant increase in the roughness of the contact interface materials, which decreases the stability of the C-Cu contact system, increases the FC and ECR, and further intensifies the discharge, thus forming closed-loop feedback that exacerbates the damage to the carbon-copper interface. The reasons for the decrease in the wear loss of carbon materials with low water content differ under different current levels. In addition to discharge erosion, the electrical damage to the carbon slider also includes oxidation wear caused by joule heat [
35]. However, this oxidation wear becomes significant only after the contact spot temperature exceeds 600 °C [
36]. Clearly, at low current levels, Joule heat is difficult to heat the contact spot to this temperature. Therefore, the main reason for the decrease in wear loss under the condition of low current is the passivation of water and the formation of friction film. Under high current conditions, oxidative wear is significant [
24]. The water film isolates the contact between carbon material and oxygen to a certain extent. Meanwhile, the evaporation of water causes Joule heat to spread rapidly, and the temperature of the contact spots decreases accordingly. The inhibition of oxidative wear of carbon materials is the main reason for the decrease in wear loss under large currents. In addition, the cooling effect of the water film increased the temperature gradient of the carbon material, and the material microcracks germinated and expanded. When the microcracks are connected with each other, the carbon material is separated locally, which further reduces the wear resistance of the carbon slider.
4. Conclusions
In this work, the variation trends of the current-carrying tribological properties of C-Cu contacts, including FC, wear loss, ECR, and arc discharge characteristics with water content, are studied. Combined with surface morphology and composition analysis, the essential causes of the abnormal wear of C-Cu contacts were explored. The relevant conclusions are as follows:
(1) When the current is less than or equal to 60 A, the AFC decreases first and then gradually becomes stable with the water content. When the current is greater than 80, the AFC is U-shaped with water content. The fluctuation degree of the DFC is U-shaped with an increase in water content under the current-carrying condition. The decrease in the surface energy of carbon materials caused by the water film is the main reason for the decrease in AFC and the stabilization of DFC. The curved liquid surface effect of the water film causes the FC to decrease to a certain degree and then tend to be stable. However, the hindrance effect of the water film on current transmission is to promote the increase of AFC and the increase of DFC fluctuation.
(2) There is an upward trend of wear loss at 0–2 g water content. The transfer of copper to the carbon surface results in lower wear loss at 0 g water content. When the water content is in the range of 2–10 g, the wear loss decreases with water content at 0–20 A, while presenting a U-shaped distribution with water content at 40–100 A. When the current exceeds 60 A, the wear loss of the carbon slide at 10 g water content is higher than that at the dry condition, which shows the abnormal wear of the carbon slide in the water environment. The increase in discharge erosion is the main cause of abnormal wear.
(3) When the current is less than or equal to 60 A, AECR shows a downward trend, while DECR’s standard deviation shows an upward trend at 0–2 g water content. At 0 g water content, the copper adhesion layer on the carbon surface helps to reduce AECR but makes DECR more unstable. At 2–10 g water content, AECR presents a U-shaped distribution with water content, and the minimum point of AECR moves forward with an increase in current. The minimum value of AECR at 100 A was obtained at 2 g water content. The current transmission obstruction and the increase of contact surface roughness caused by damage intensification are the reasons for the significant increase in AECR and the aggravation of DECR fluctuation when water content exceeds a certain value.
(4) There are two different trends in arc discharge characteristics with water content at different current levels. At 20–40 A, the discharge frequency decreases with water content, while the average single discharge energy shows a U-shaped distribution with water content. At 60–100 A, the discharge frequency presents a U-shaped distribution with water content, while the average single discharge energy increases with water content. The variation trend of total discharge energy with water content is similar to that of the average single discharge energy. The lubrication and distortion of the electric field caused by the water film contribute to the decrease in discharge frequency and discharge energy. However, when the water content increases to a certain extent, the water film seriously blocks the transmission of current, and discharge occurs in the water film, leading to a significant increase in discharge frequency and discharge energy.
(5) With an increase in water content, the current transmission resistance increases, and the heat generation of contact spots increases. At the same time, water evaporation accelerates heat emissions at the contact interface. The temperature gradient in the local area of the contact interface was significantly enlarged, and a thermal stress crack was generated and extended, which accelerated the deterioration of the carbon slider performance.
Author Contributions
Conceptualization, H.W., G.G. and G.W.; Data curation, H.W., L.D., X.L. and Q.W.; Formal analysis, H.W., L.D., X.L. and X.W.; Funding acquisition, G.G., X.L. and G.W.; Investigation, H.W., L.D., X.W. and Q.W.; Methodology, H.W., G.G., L.D., X.W., Q.W. and G.W.; Project administration, G.G. and G.W.; Resources, G.G.; Validation, H.W., G.G., L.D. and X.W.; Visualization, H.W., G.G., X.L. and Q.W.; Writing—original draft, H.W. and X.W.; Writing—review & editing, H.W. and L.D. All authors have read and agreed to the published version of the manuscript.
Funding
This project is supported by the National Natural Science Foundation of China (No. 51922090, 51837009, U19A20105, and 52267011), the Smart Grid Joint Fund and the National Natural Science Foundation of China (U1966602), and the Technology Project of Headquarter of SGCC (5500-202158104A-0-0-00).
Institutional Review Board Statement
Not applicable.
Informed Consent Statement
Not applicable.
Data Availability Statement
Not applicable.
Conflicts of Interest
The authors declare no conflict of interest.
References
- Xu, Z.; Gao, G.; Wei, W.; Yang, Z.; Xie, W.; Dong, K.; Ma, Y.; Yang, Y.; Wu, G. Characteristics of pantograph-catenary arc under low air pressure and strong airflow. High Volt. 2021, 7, 369–381. [Google Scholar] [CrossRef]
- Chen, Q.; Yang, Z.; Lin, J.; Wei, W.; Li, H.; Yin, G.; Liu, Y.; Li, P.; Tu, C.; Gao, G.; et al. Scalable, low-cost, and environment-friendly preparation of high strength carbon-matrix composites with tree-root-like structured reinforcements. Compos. Commun. 2022, 32, 101149. [Google Scholar] [CrossRef]
- Xie, W.; Wu, G.; Yang, Z.; She, P.; Wang, H.; Zuo, H.; Wei, W.; Gao, G.; Tu, C. Study on the erosion characteristics of copper-carbon electrode pairs by DC air arc. High Volt. 2021, 6, 674–683. [Google Scholar] [CrossRef]
- Yin, J.; Zhang, H.; Tan, C.; Xiong, X. Effect of heat treatment temperature on sliding wear behaviour of C/C-Cu composites under electric current. Wear 2014, 312, 91–95. [Google Scholar] [CrossRef]
- Li, S.B.; Yang, X.; Kang, Y.; Li, Z.; Li, H. Progress on Current-Carry Friction and Wear: An Overview from Measurements to Mecha-nism. Coatings 2022, 12, 1345. [Google Scholar] [CrossRef]
- Wu, G.; Wu, J.; Wei, W.; Zhou, Y.; Yang, Z.; Gao, G. Characteristics of the Sliding Electric Contact of Pantograph/Contact Wire Systems in Electric Railways. Energies 2017, 11, 17. [Google Scholar] [CrossRef] [Green Version]
- Yang, H.; Chen, G.; Gao, G.; Wu, G.; Zhang, W. Experimental research on the friction and wear properties of a contact strip of a pantograph–catenary system at the sliding speed of 350 km/h with electric current. Wear 2014, 332–333, 949–955. [Google Scholar] [CrossRef]
- Li, G.; Yan, Q. Comparison of Friction and Wear Behavior Between C/C, C/C-SiC and Metallic Composite Materials. Tribol. Lett. 2015, 60, 15. [Google Scholar] [CrossRef]
- Zheng, R.G.; Liu, X.M. Effect of load and velocity on wear behaviour of Cu based self-lubricating composite. Mater. Res. Innov. 2014, 18, S2-12–S2-15. [Google Scholar] [CrossRef]
- Yin, J.; Zhang, H.; Xiong, X.; Tao, H.; Wang, P.; Deng, C. Influence of applied load on wear behavior of C/C-Cu composites under electric current. Prog. Nat. Sci. 2017, 27, 192–196. [Google Scholar] [CrossRef]
- Wang, P.; Zhang, H.; Yin, J.; Xiong, X.; Tan, C.; Deng, C.; Yan, Z. Wear and friction behaviours of copper mesh and flaky graphite- modified carbon/carbon composite for sliding contact material under electric current. Wear 2017, 380–381, 59–65. [Google Scholar] [CrossRef]
- Poljanec, D.; Kalin, M. Effect of polarity and various contact pairing combinations of electrographite, polymer-bonded graphite and copper on the performance of sliding electrical contacts. Wear 2019, 426–427, 1163–1175. [Google Scholar] [CrossRef]
- Tu, C.J.; Deng, L.P.; Chen, D.; Xiong, X.Z.; Wang, Y.F.; Zhu, Y. Preparation of C-f/Cu-C contact strip and wear behaviour under electric current. Mater. Sci. Technol. 2017, 33, 98–103. [Google Scholar] [CrossRef]
- Lee, P.; Johnson, J. High-Current Brushes, Part II: Effects of Gases and Hydrocarbon Vapors. IEEE Trans. Compon. Hybrids Manuf. Technol. 1978, 1, 40–45. [Google Scholar] [CrossRef]
- Allouche, A.; Ferro, Y. Dissociative adsorption of small molecules at vacancies on the graphite (0001) surface. Carbon 2006, 44, 3320–3327. [Google Scholar] [CrossRef]
- Rietsch, J.-C.; Brender, P.; Dentzer, J.; Gadiou, R.; Vidal, L.; Vix-Guterl, C. Evidence of water chemisorption during graphite friction under moist conditions. Carbon 2013, 55, 90–97. [Google Scholar] [CrossRef]
- Konicek, A.R.; Grierson, D.S.; Sumant, A.V.; Friedmann, T.A.; Sullivan, J.P.; Gilbert, P.U.P.A.; Sawyer, W.G.; Carpick, R.W. Influence of surface passivation on the friction and wear behavior of ul-trananocrystalline diamond and tetrahedral amorphous carbon thin films. Phys. Rev. B. 2012, 85, 155448. [Google Scholar] [CrossRef] [Green Version]
- Zaidi, H.; Nery, H.; Paulmier, D. Stability of lub-ricating properties of graphite by orientation of the crystallites in the presence of water vapour. Appl. Surf. Sci. 1993, 70−71, 180–185. [Google Scholar] [CrossRef]
- Morstein, C.E.; Klemenz, A.; Dienwiebel, M.; Moseler, M. Humidity-dependent lubrication of highly loaded contacts by graphite and a structural transition to turbostratic carbon. Nat. Commun. 2022, 13, 5958. [Google Scholar] [CrossRef]
- Hirani, H.; Goilkar, S.S. Formation of transfer layer and its effect on friction and wear of carbon–graphite face seal under dry, water and steam environments. Wear 2009, 266, 1141–1154. [Google Scholar] [CrossRef]
- Wu, R.; Song, C.; Wu, H.; Lv, B.; Zhang, Y.; Zhang, Y. Effect of relative humidity on the current-carrying tribological properties of Cu-C sliding contact pairs. Wear 2021, 492–493, 204219. [Google Scholar] [CrossRef]
- Mei, G.M.; Fu, W.M.; Chen, G.X.; Zhang, W.H. Effect of high-density current on the wear of carbon sliders against Cu-Ag wires. Wear 2020, 452, 203275. [Google Scholar] [CrossRef]
- Wang, X.; Yang, Z.; Gao, G.; Wang, H.; Deng, L.; Wei, W. Effect of Wet Condition on the Wear Performance of Carbon Strip and Metal Contact Wire with Electric Current. In Proceedings of the 2020 IEEE International Conference on High Voltage Engineering and Application (ICHVE), Beijing, China, 6–10 September 2020; pp. 1–4. [Google Scholar] [CrossRef]
- Wang, H.; Gao, G.; Wei, W.; Yang, Z.; Yin, G.; Xie, W.; He, Z.; Ni, Z.; Yang, Y.; Wu, G. Influence of the interface temperature on the damage morphology and material transfer of C-Cu sliding contact under different current amplitudes. J. Mater. Sci. 2022, 57, 5006–5021. [Google Scholar] [CrossRef]
- Wang, X. Study on the Effect of Water on the Friction and Wear Performance of the Carbon/Metal Contact Pair with Electric Current. Master’s Thesis, Southwest Jiaotong University, Chengdu, China, April 2021. [Google Scholar]
- Chen, G.; Yang, H.; Zhang, W.; Wang, X.; Zhang, S.; Zhou, Z. Experimental study on arc ablation occurring in a contact strip rubbing against a contact wire with electrical current. Tribol. Int. 2013, 61, 88–94. [Google Scholar] [CrossRef]
- Hiratsuka, K.; Mariko, R.; Tsutsumi, T. Effects of sliding speed, periodic pauses, and atmospheric moisture content on the wear of graphite against cast iron. Wear 2019, 424–425, 255–260. [Google Scholar] [CrossRef]
- Sun, Y.X. Research on the Influence of Water and Oxygen Environment on the Tribological Characteristics of Rolling Cur-Rent-Carrying Pairs. Ph.D. Thesis, China Academy of Machinery Science and Technology Group, Beijing, China, June 2021. [Google Scholar]
- Ji, D.-H.; Li, H.-X.; Shen, M.-X.; Zhao, H.-P.; Hu, Q.; Liu, X.-L.; Xiong, G.-Y. The role of relatively humidity in friction and wear behaviors of carbon sliding against copper with electric current. Surf. Topogr. Metrol. Prop. 2021, 9, 048001. [Google Scholar] [CrossRef]
- Ren, X.; Jiang, X.; Yang, G.; Huang, Y.; Wu, J.; Yang, Z. Effect of Environmental Parameters on Streamer Discharge in Short Air Gap between Rod and Plate. Energies 2022, 15, 817. [Google Scholar] [CrossRef]
- Xu, P.; Zhang, B.; Chen, S.; He, J. Influence of humidity on the characteristics of positive corona discharge in air. Phys. Plasmas 2016, 23, 063511. [Google Scholar] [CrossRef]
- Lehmann, J.S.; Schwaiger, R.; Rinke, M.; Greiner, C. How Tribo-Oxidation Alters the Tribological Properties of Copper and Its Oxides. Adv. Mater. Interfaces 2020, 8, 2001673. [Google Scholar] [CrossRef]
- Deng, Q.; Yang, Z.F.; Yin, G.F.; Xie, W.H.; Huang, Z.L.; Ren, J.W.; Yan, Y.; Chen, Q.C.; Wu, G.N. The effect of thermal shock temperature difference on the structural, dynamics and me-chanical properties of carbon materials characterized by ultrasonic test technology. J. Mater. Sci. 2021, 56, 18522–18533. [Google Scholar] [CrossRef]
- Goilkar, S.; Hirani, H. Parametric study on balance ratio of mechanical face seal in steam environment. Tribol. Int. 2010, 43, 1180–1185. [Google Scholar] [CrossRef]
- Ding, T.; Chen, G.; Bu, J.; Zhang, W. Effect of temperature and arc discharge on friction and wear behaviours of carbon strip/copper contact wire in pantograph–catenary systems. Wear 2011, 271, 1629–1636. [Google Scholar] [CrossRef]
- Wang, H.; Gao, G.Q.; Lei, D.; Wang, Q.; Xiao, S.; Xie, Y.; Xu, Z.; Ma, Y.; Dong, K.; Chen, Q.; et al. Influence of Interface Temperature on the Electric Contact Characteristics of a C-Cu Sliding System. Coatings 2022, 12, 1713. [Google Scholar] [CrossRef]
| Disclaimer/Publisher’s Note: The statements, opinions and data contained in all publications are solely those of the individual author(s) and contributor(s) and not of MDPI and/or the editor(s). MDPI and/or the editor(s) disclaim responsibility for any injury to people or property resulting from any ideas, methods, instructions or products referred to in the content. |
© 2022 by the authors. Licensee MDPI, Basel, Switzerland. This article is an open access article distributed under the terms and conditions of the Creative Commons Attribution (CC BY) license (https://creativecommons.org/licenses/by/4.0/).


