
A Model Surface for Calculating the Reflectance of Smooth and Rough Aluminum Layers in the Vacuum Ultraviolet Spectral Range

Abstract
:1. Introduction
1.1. Motivation and Basic Idea of the Study
1.2. Previously Published Experimental Data Used in this Study
2. Idea of Modelling Approach
2.1. General
- : associated with Cu seeded aluminum films
- : associated with unseeded aluminum films
- : associated with Ti seeded aluminum films
2.2. Optical Constants
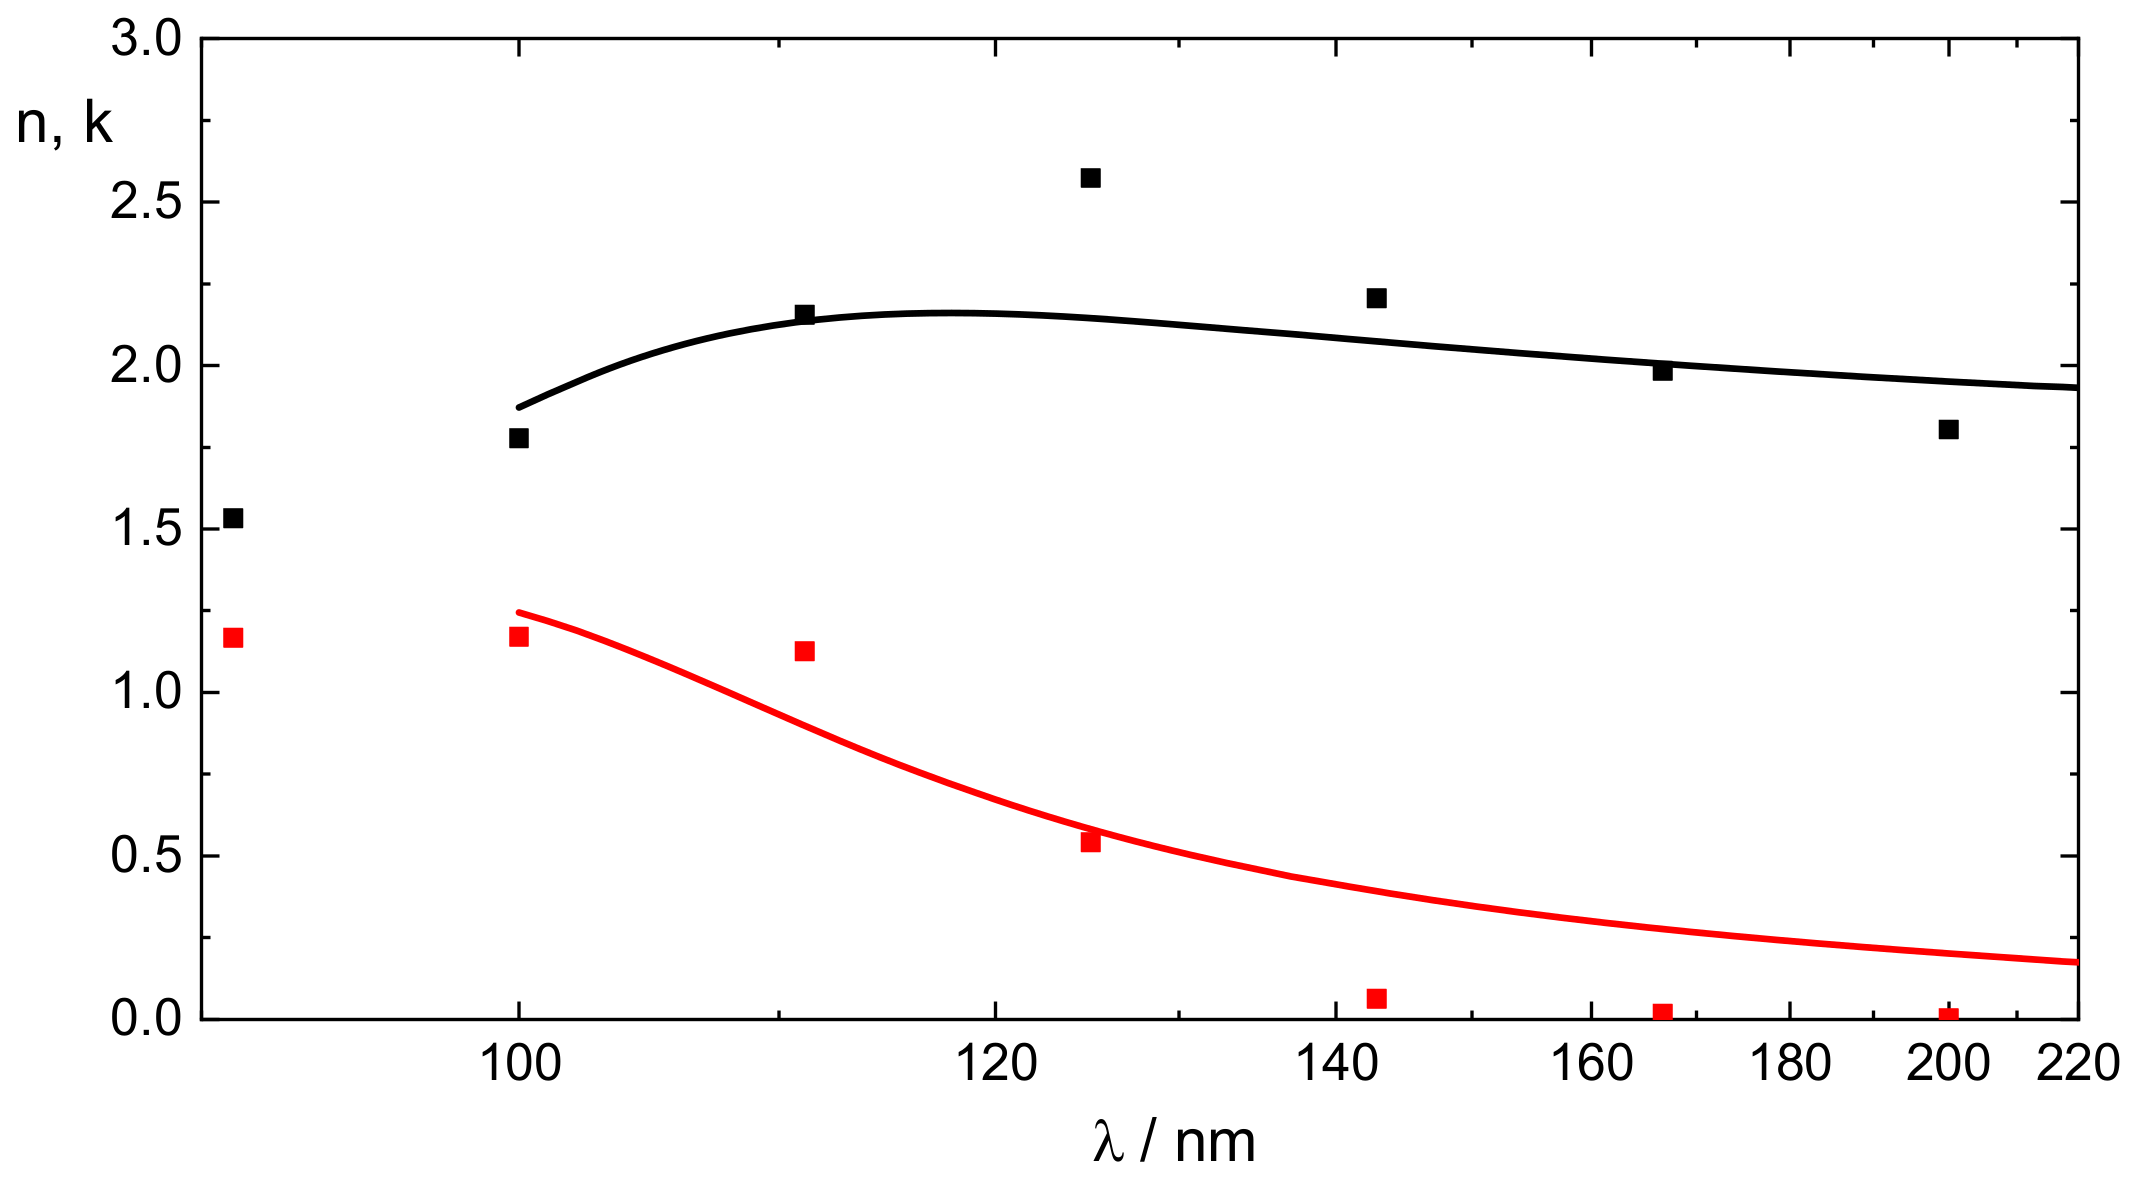
2.2.1. Aluminum
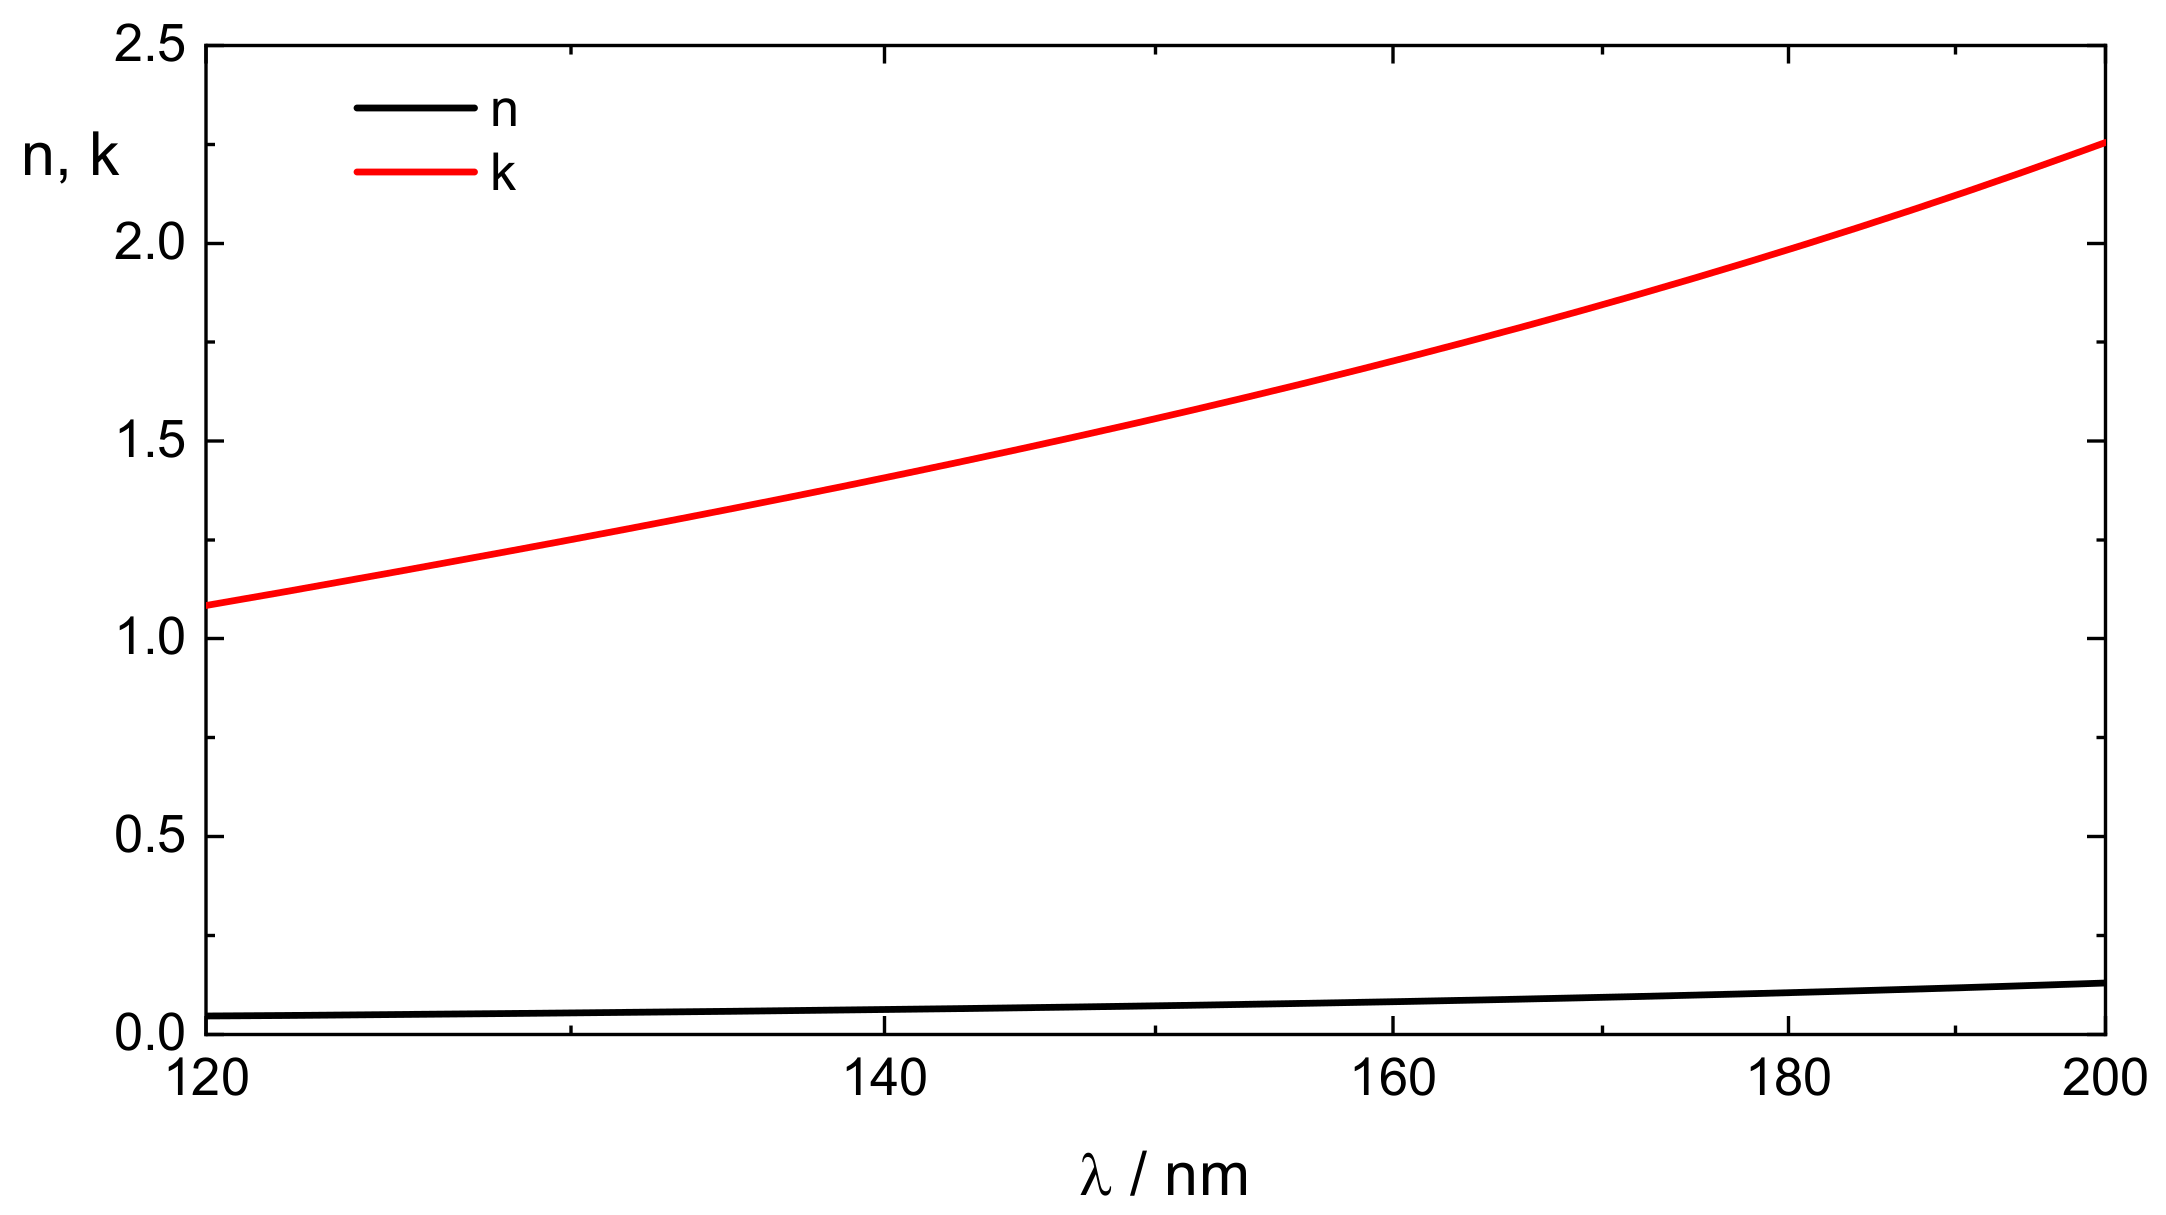
2.2.2. Aluminum Oxide
- The native aluminum oxide films are rather thin, so the determination of their optical constants from VUV reflection spectra of real aluminum surfaces appears unrealistic.
- The exact stoichiometry of the oxide is unclear. This makes it difficult to apply literature data of aluminum oxide to these overlayers. From a previous study [31] we have clear indications that the absorption losses of the native aluminum layer even in the near UV and VIS is considerably larger than would be expected from stoichiometric aluminum oxide. Therefore, in a pragmatic modelling approach, a set of simulated optical constants should be applied for modelling the native oxide layer. The challenge is to re-distribute a part of the oscillator strength relevant for stoichiometric alumina VUV absorptions into a broad absorption tail that reaches from the VUV down to the visible spectral region. This will provide the necessary UV absorptions without significantly violating the relevant sum rule [32].
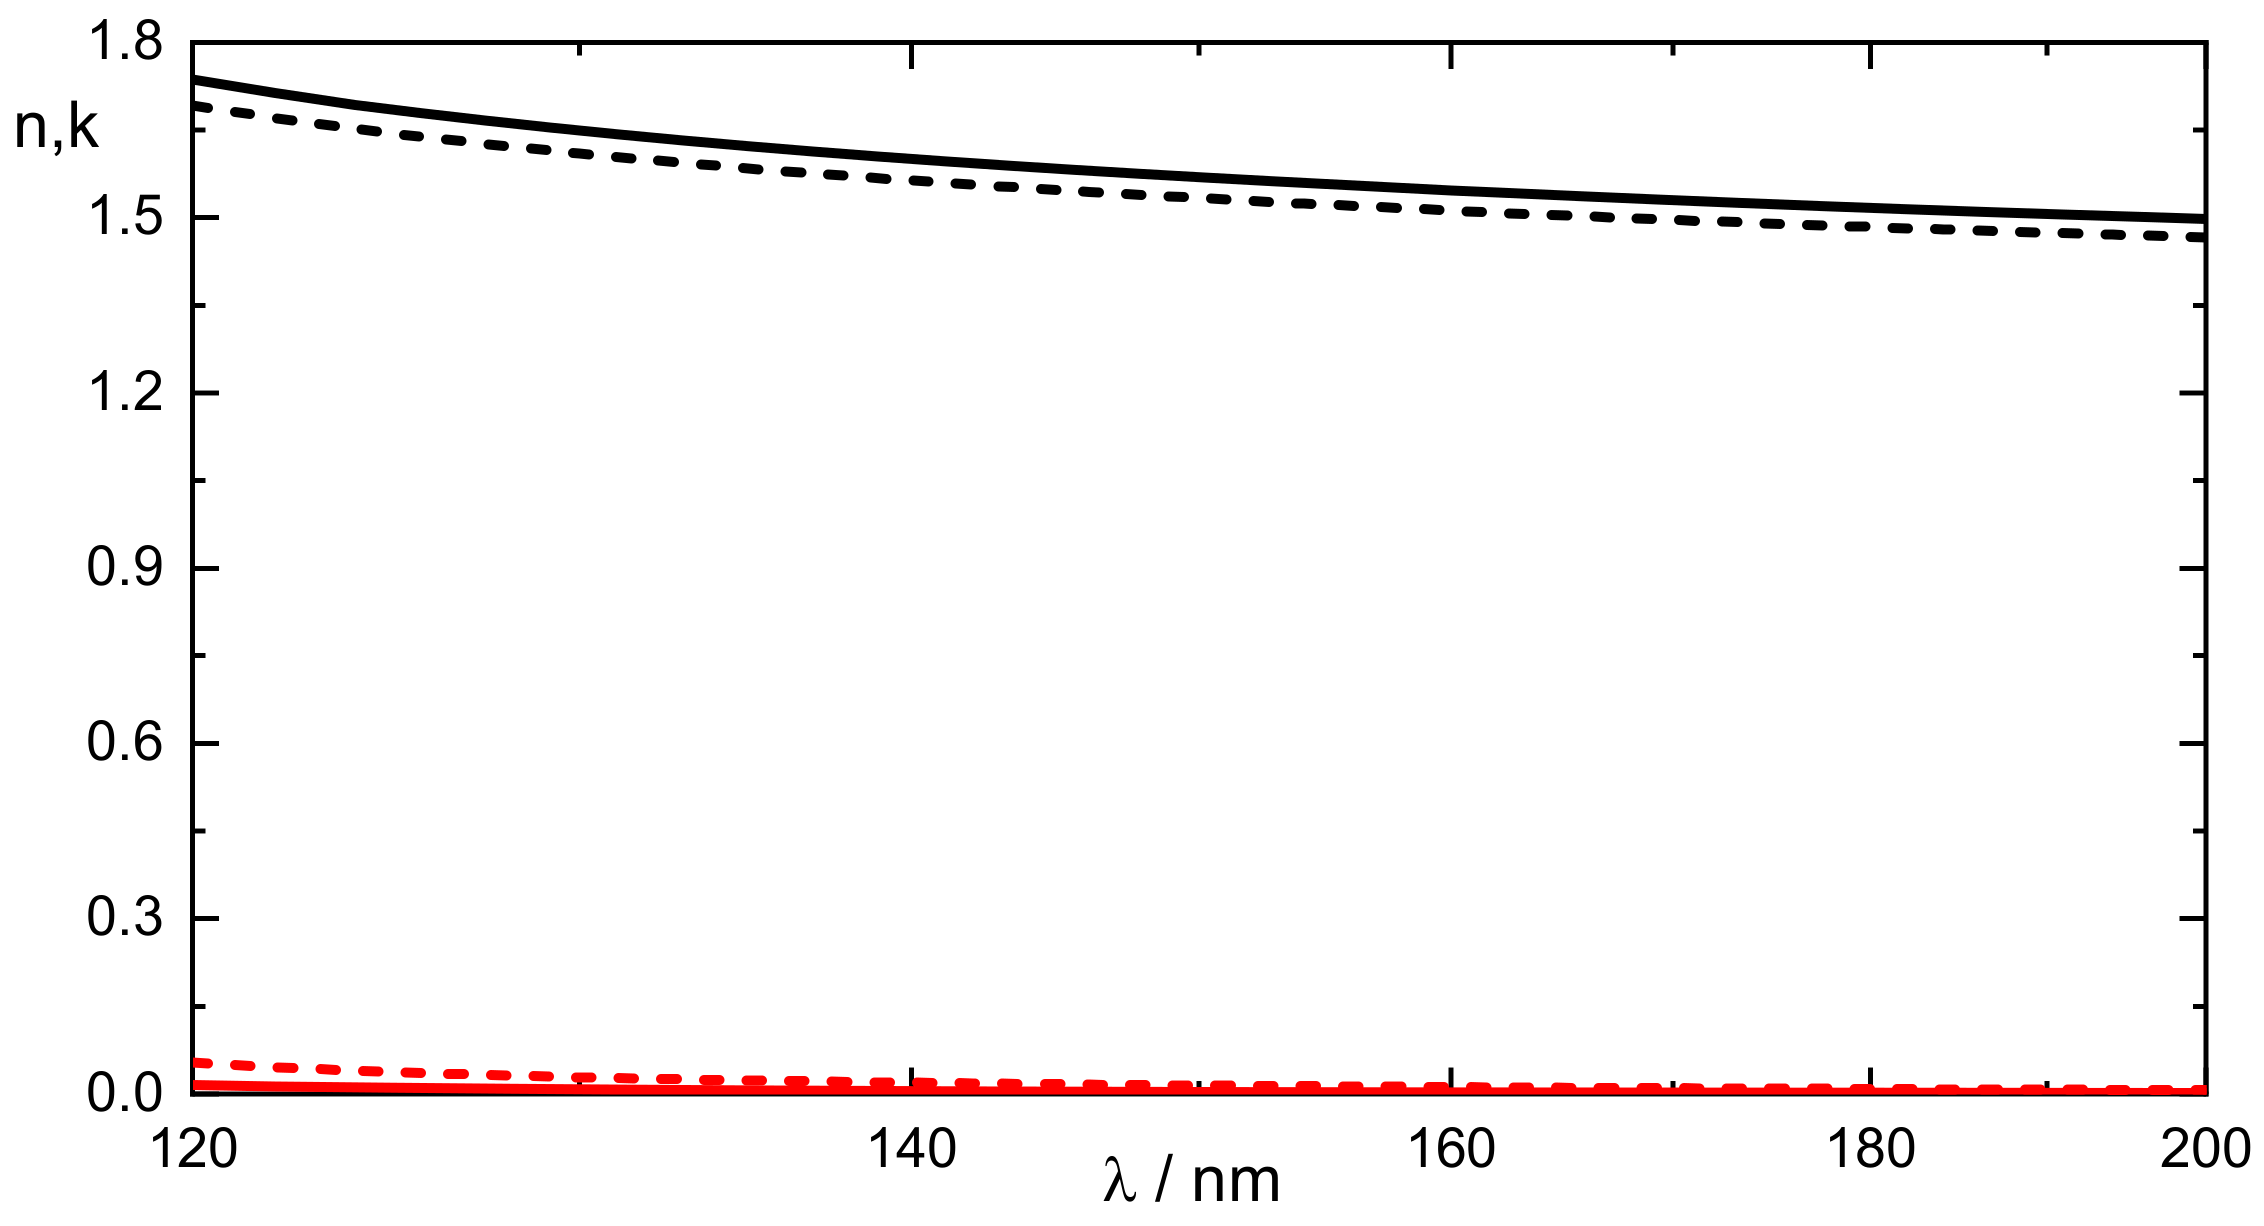
2.2.3. Magnesium Fluoride
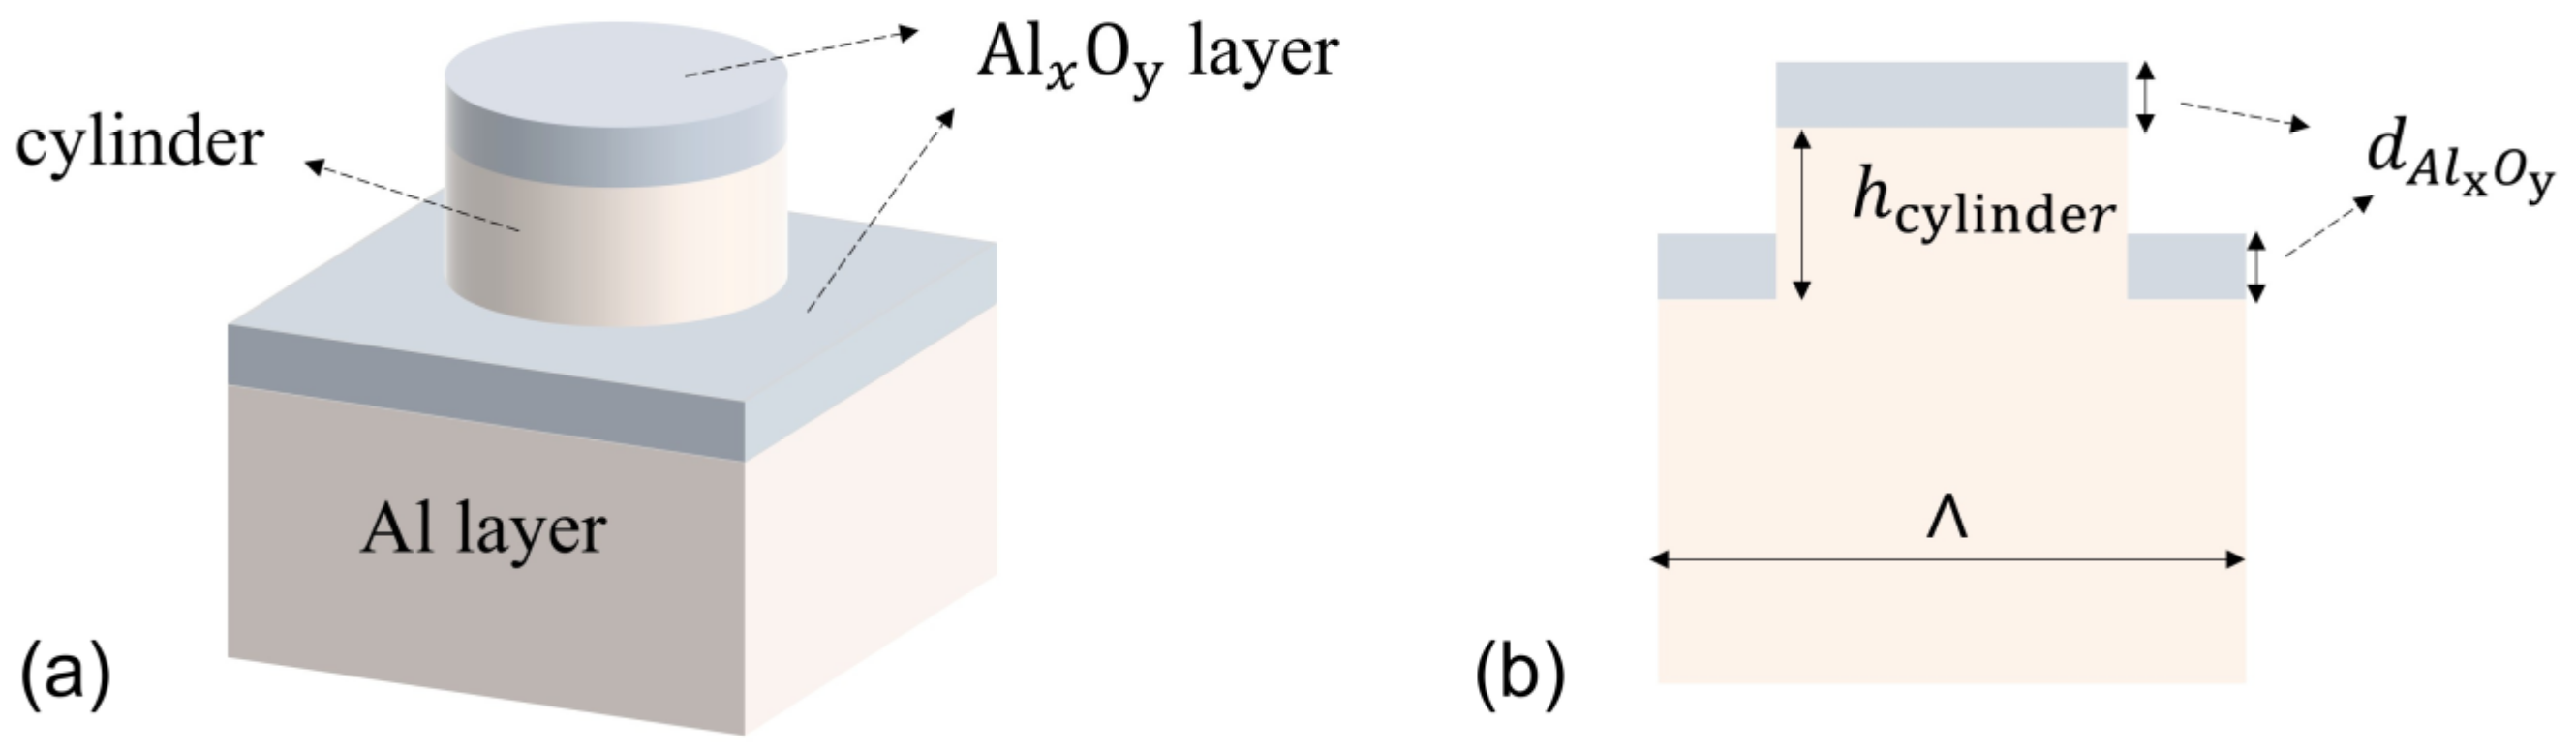
2.3. Surface Profile
2.3.1. RCWA Model
2.3.2. Relation of Model Systems to Real Systems
3. Results
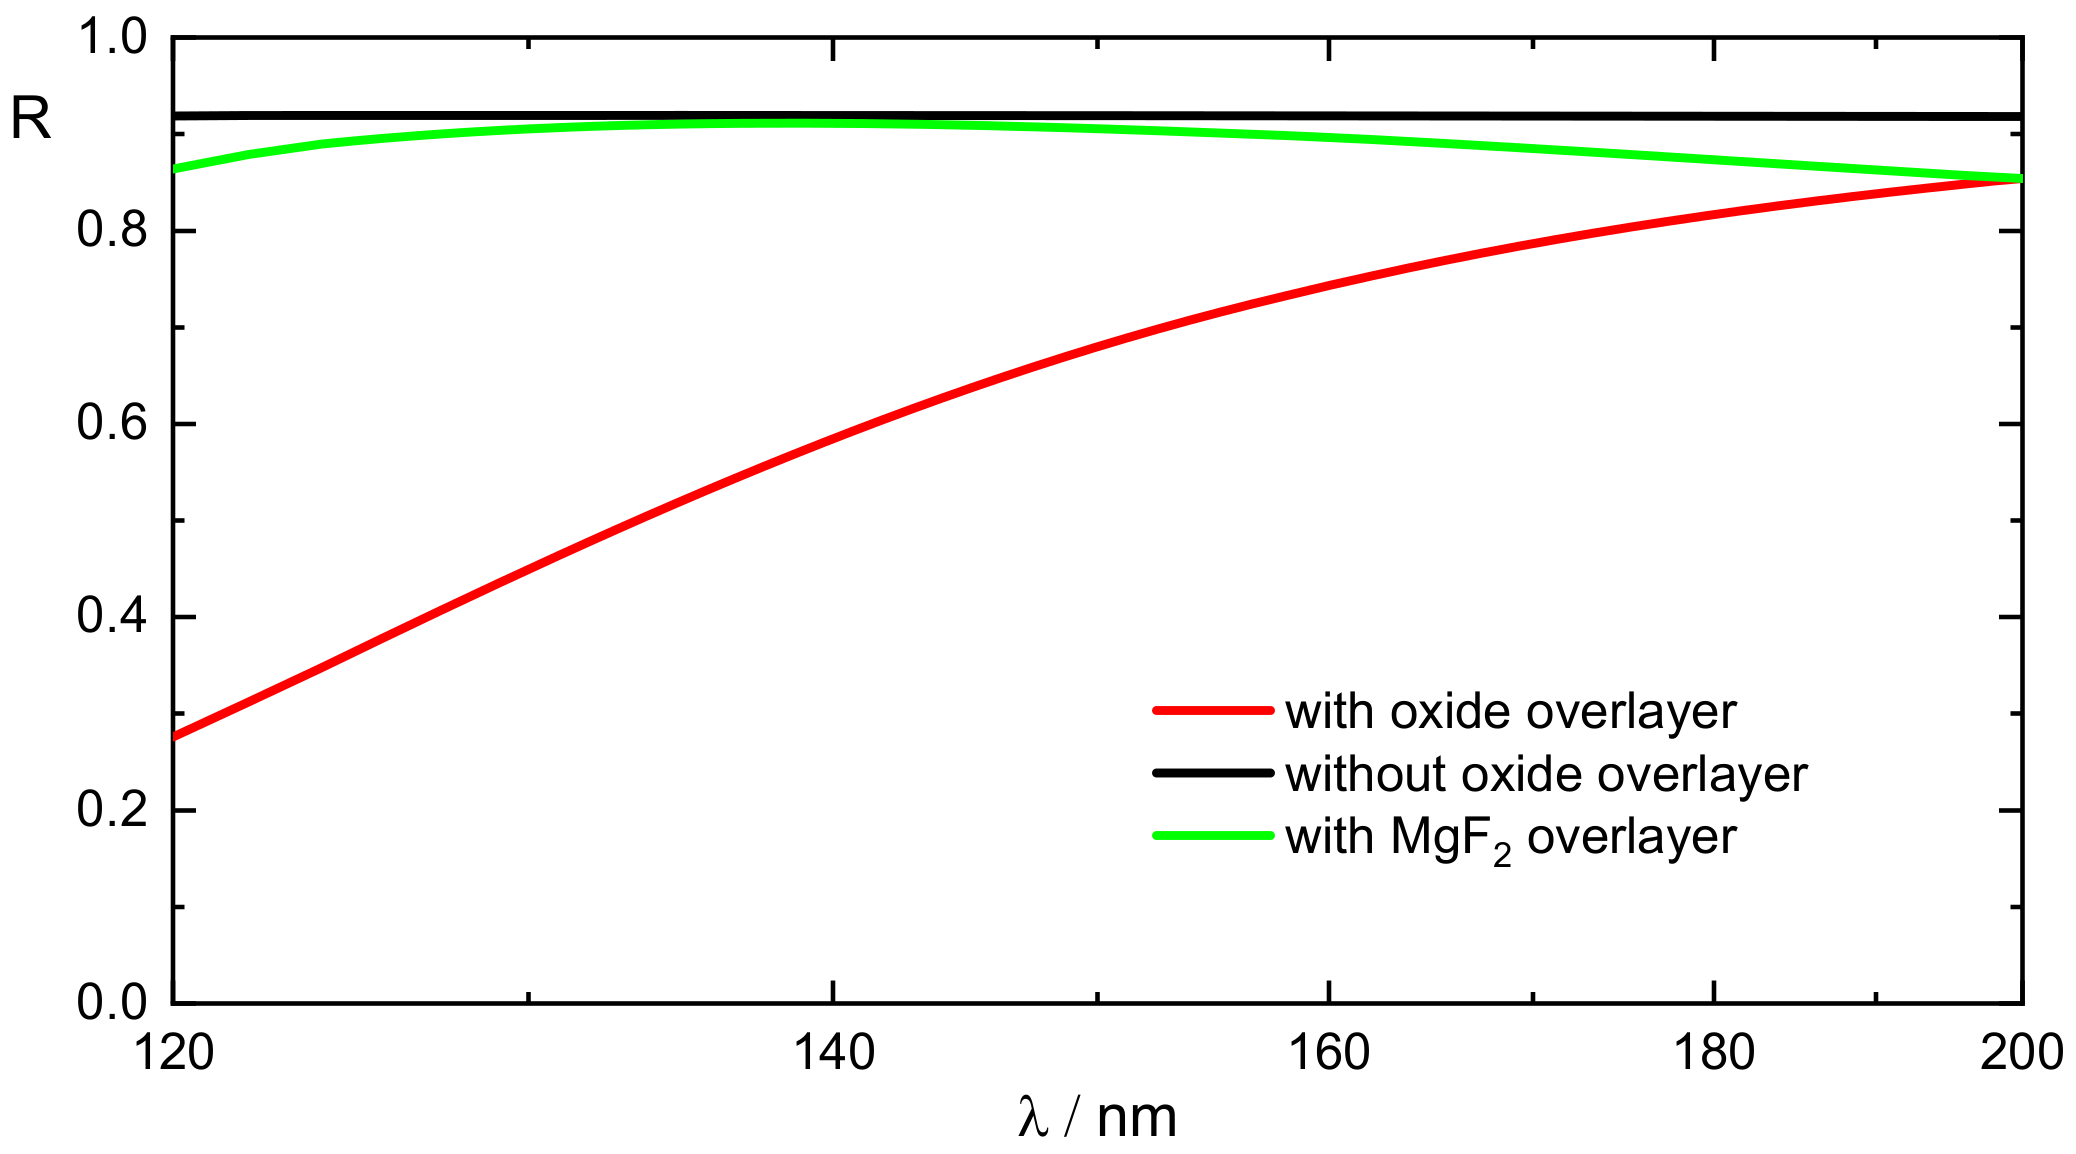
3.1. Smooth Layers
3.2. Rough Layers
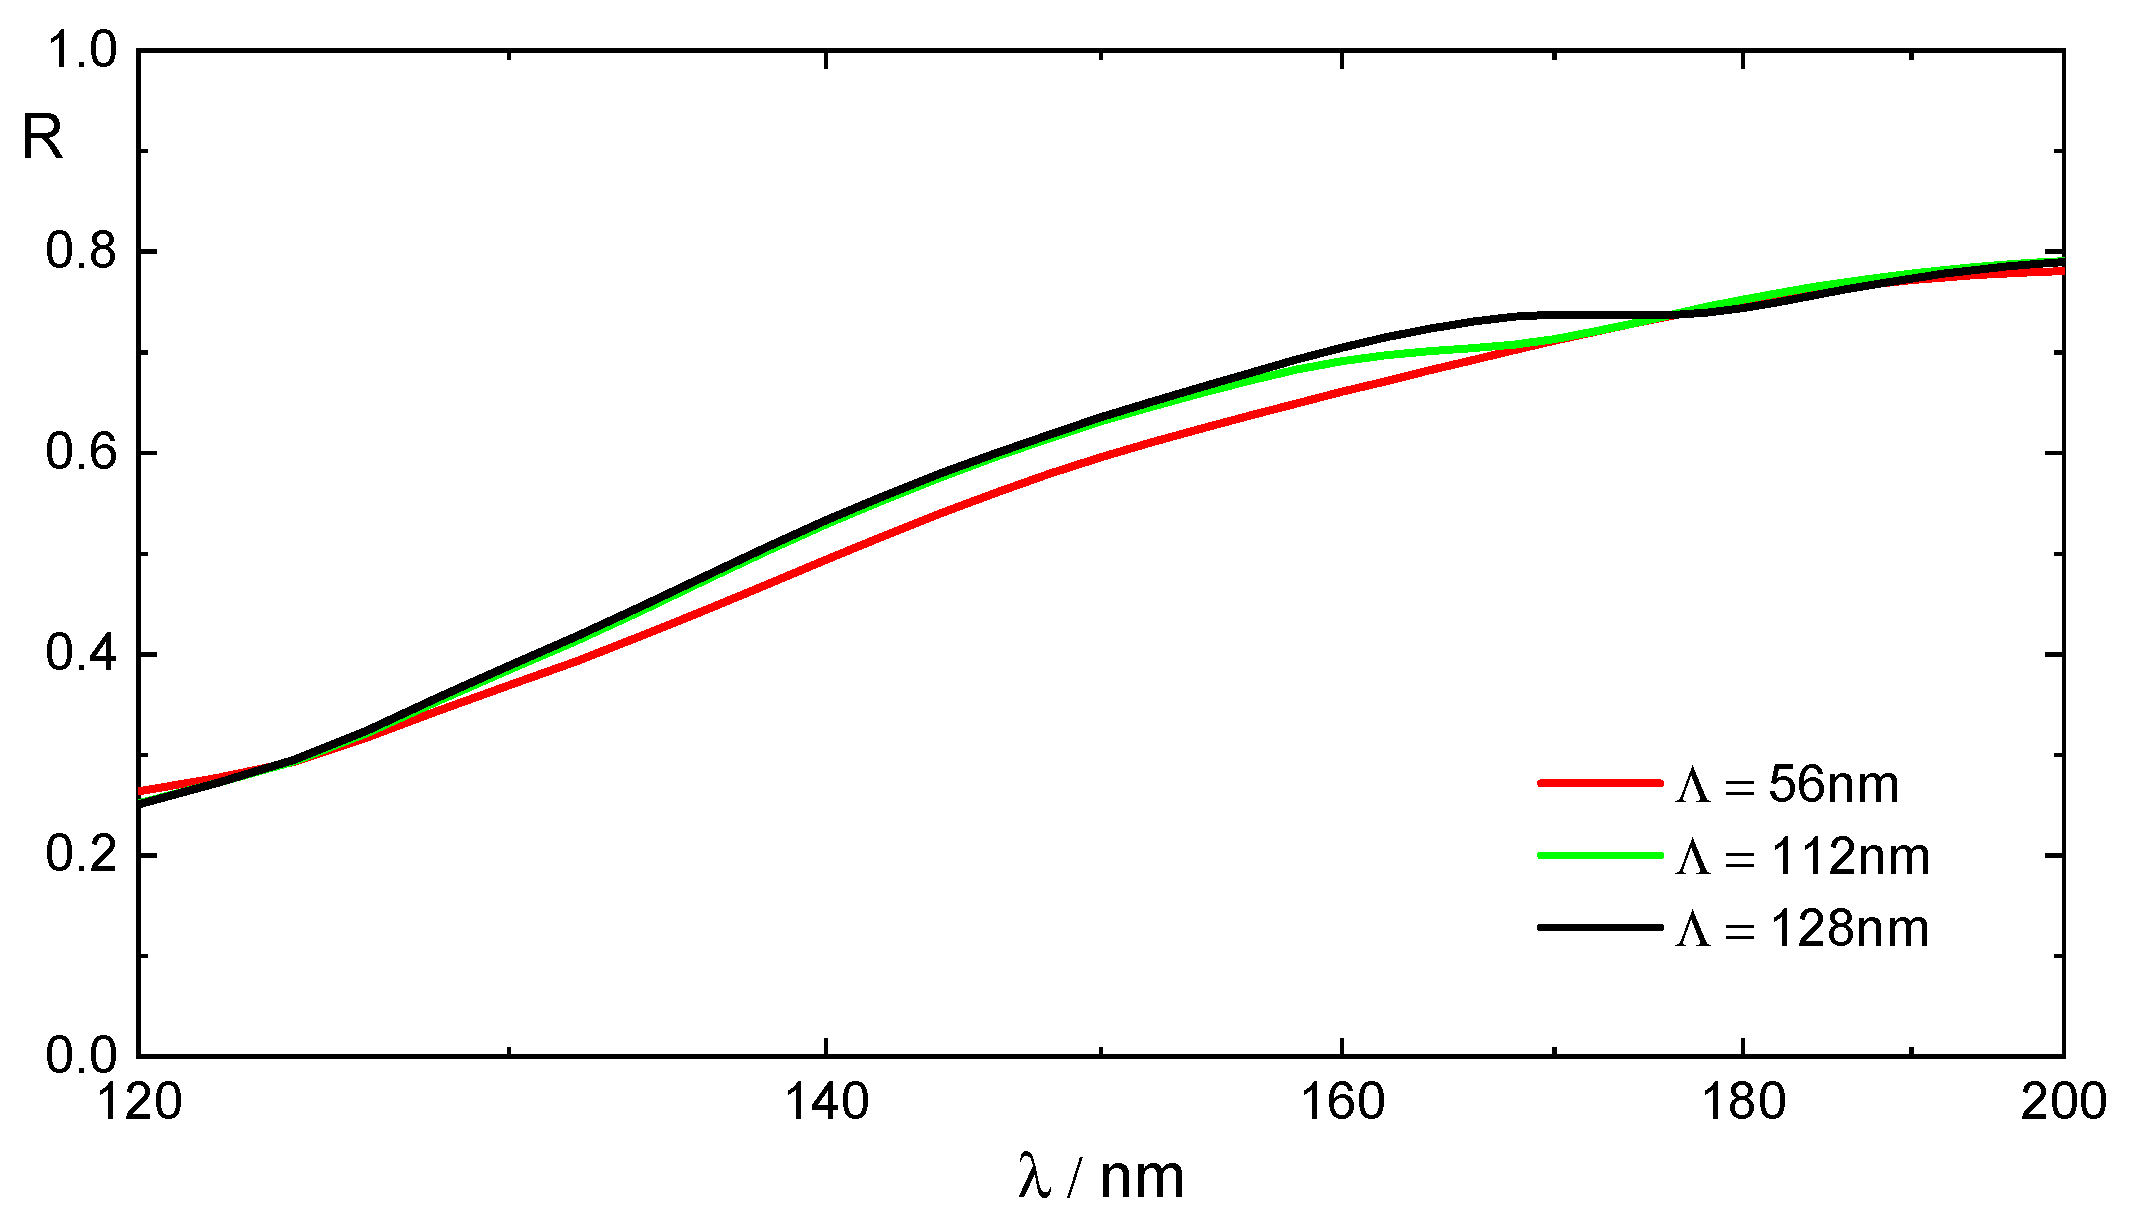
3.2.1. Effect of Increasing Period
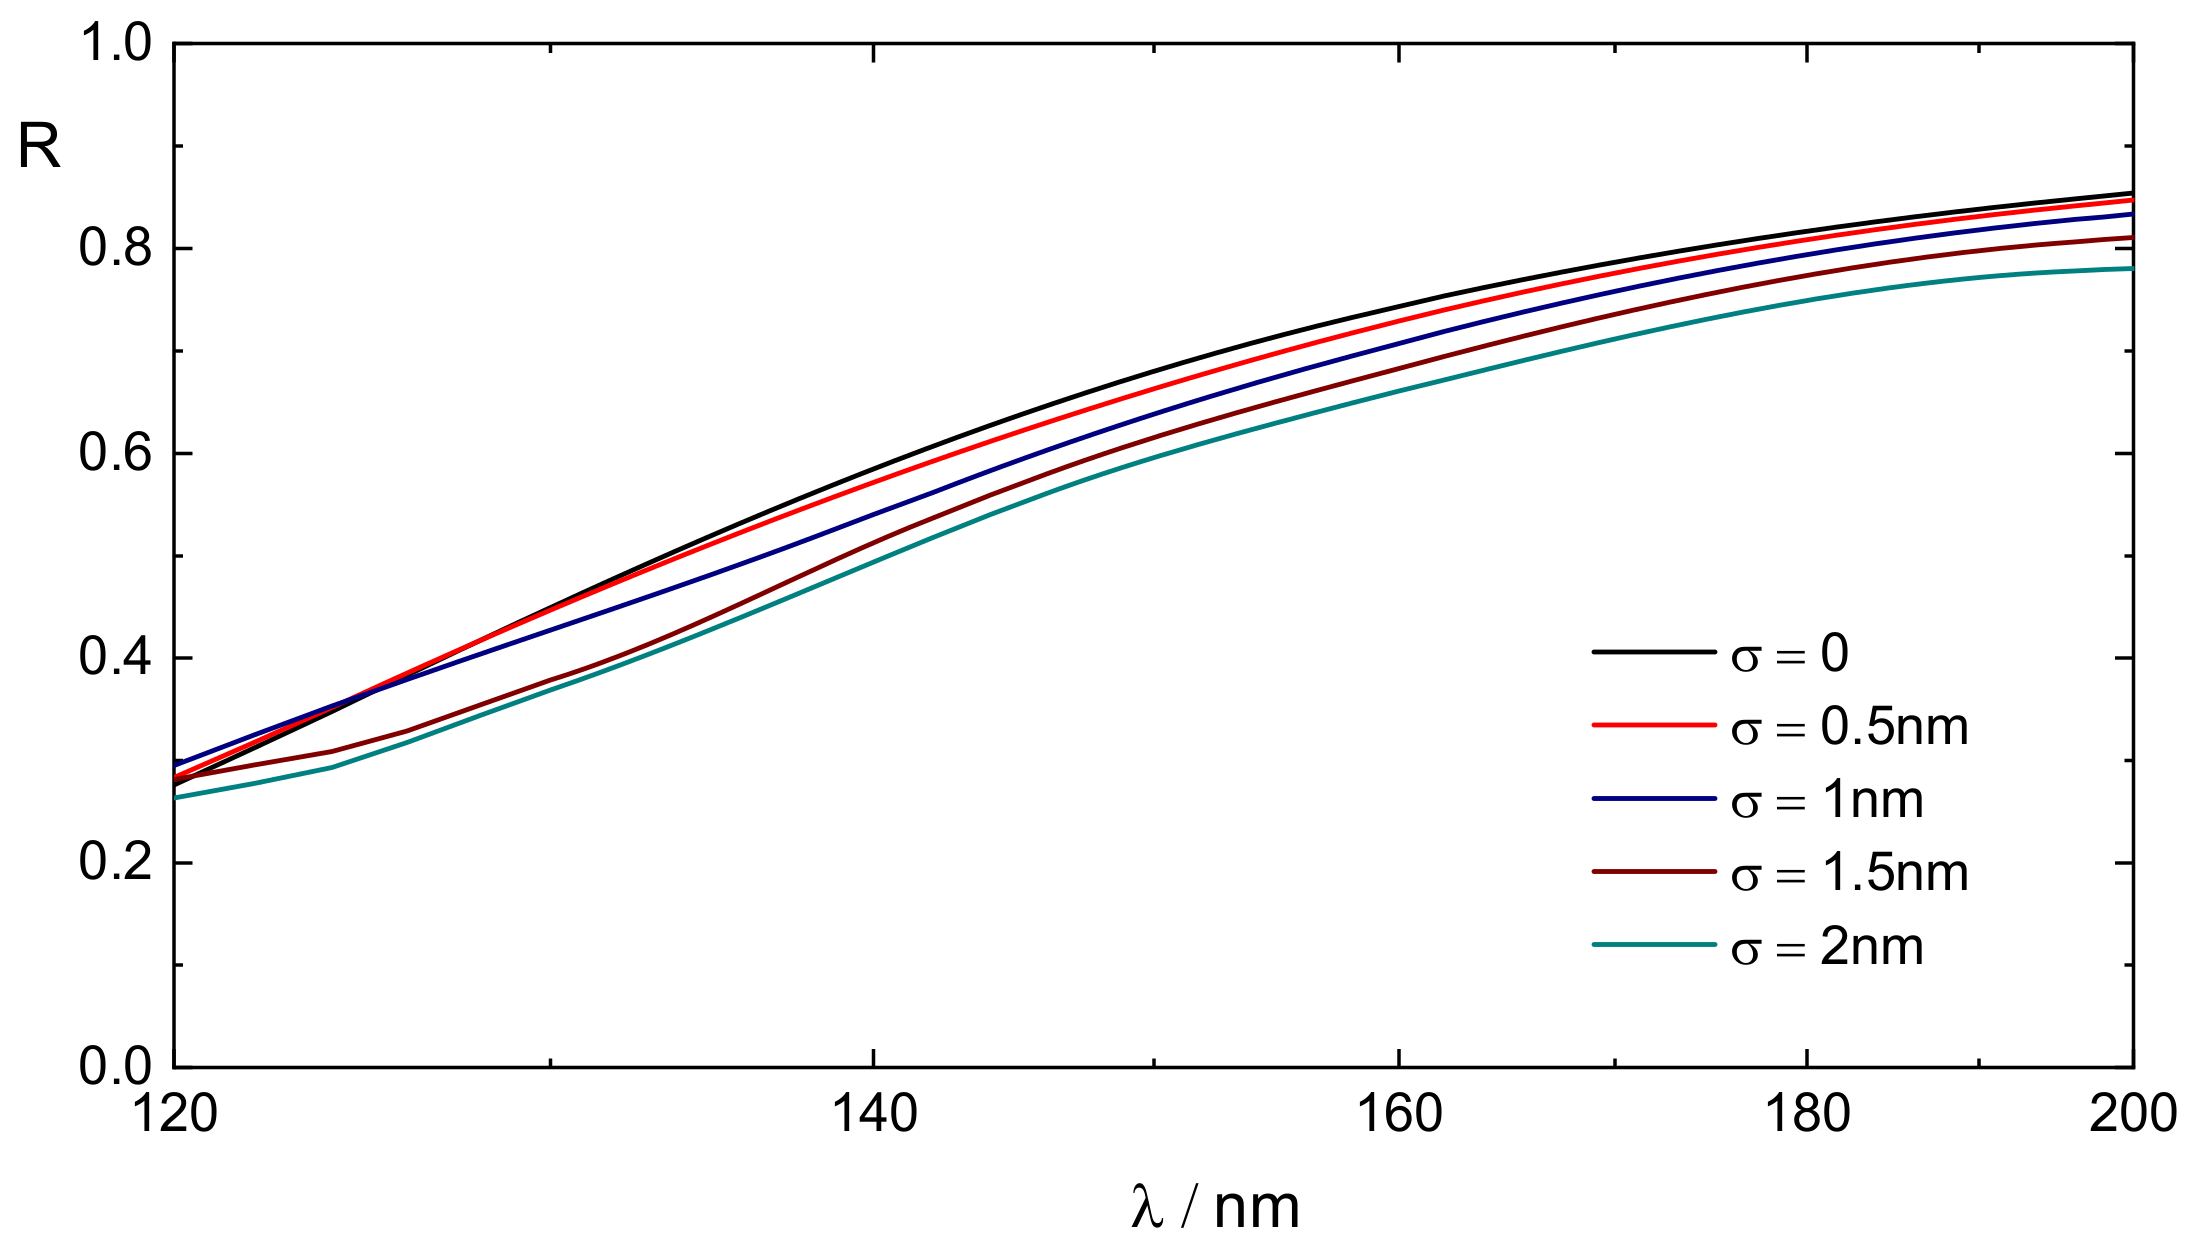
3.2.2. Effect of Increasing Rms Roughness
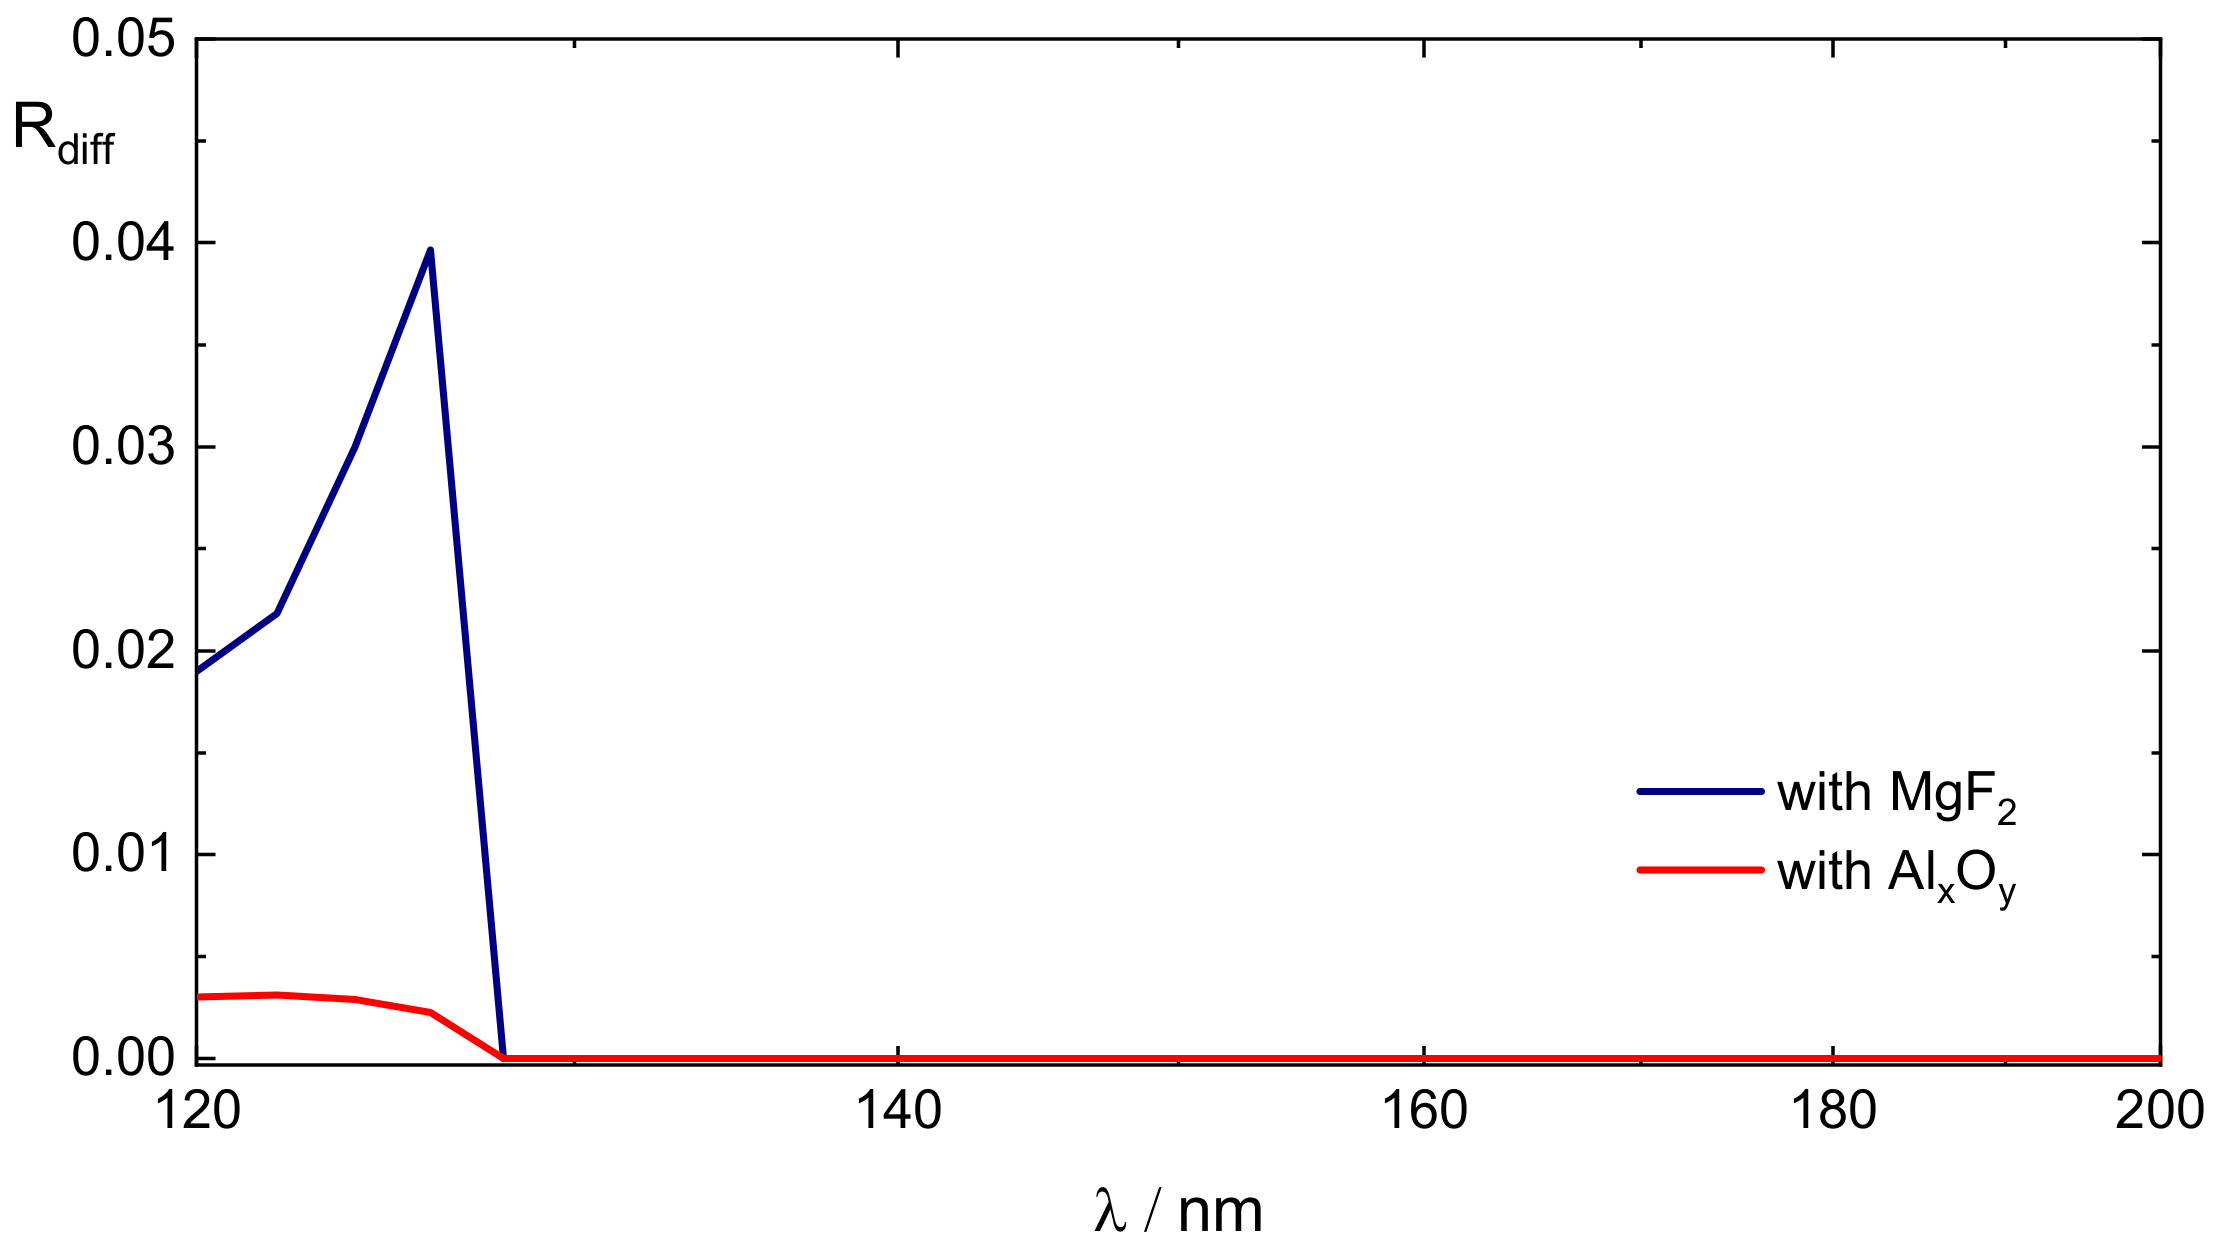
3.3. Propagating Diffracted Modes
4. Discussion
4.1. Comparison with Experiment and Limits of the Model
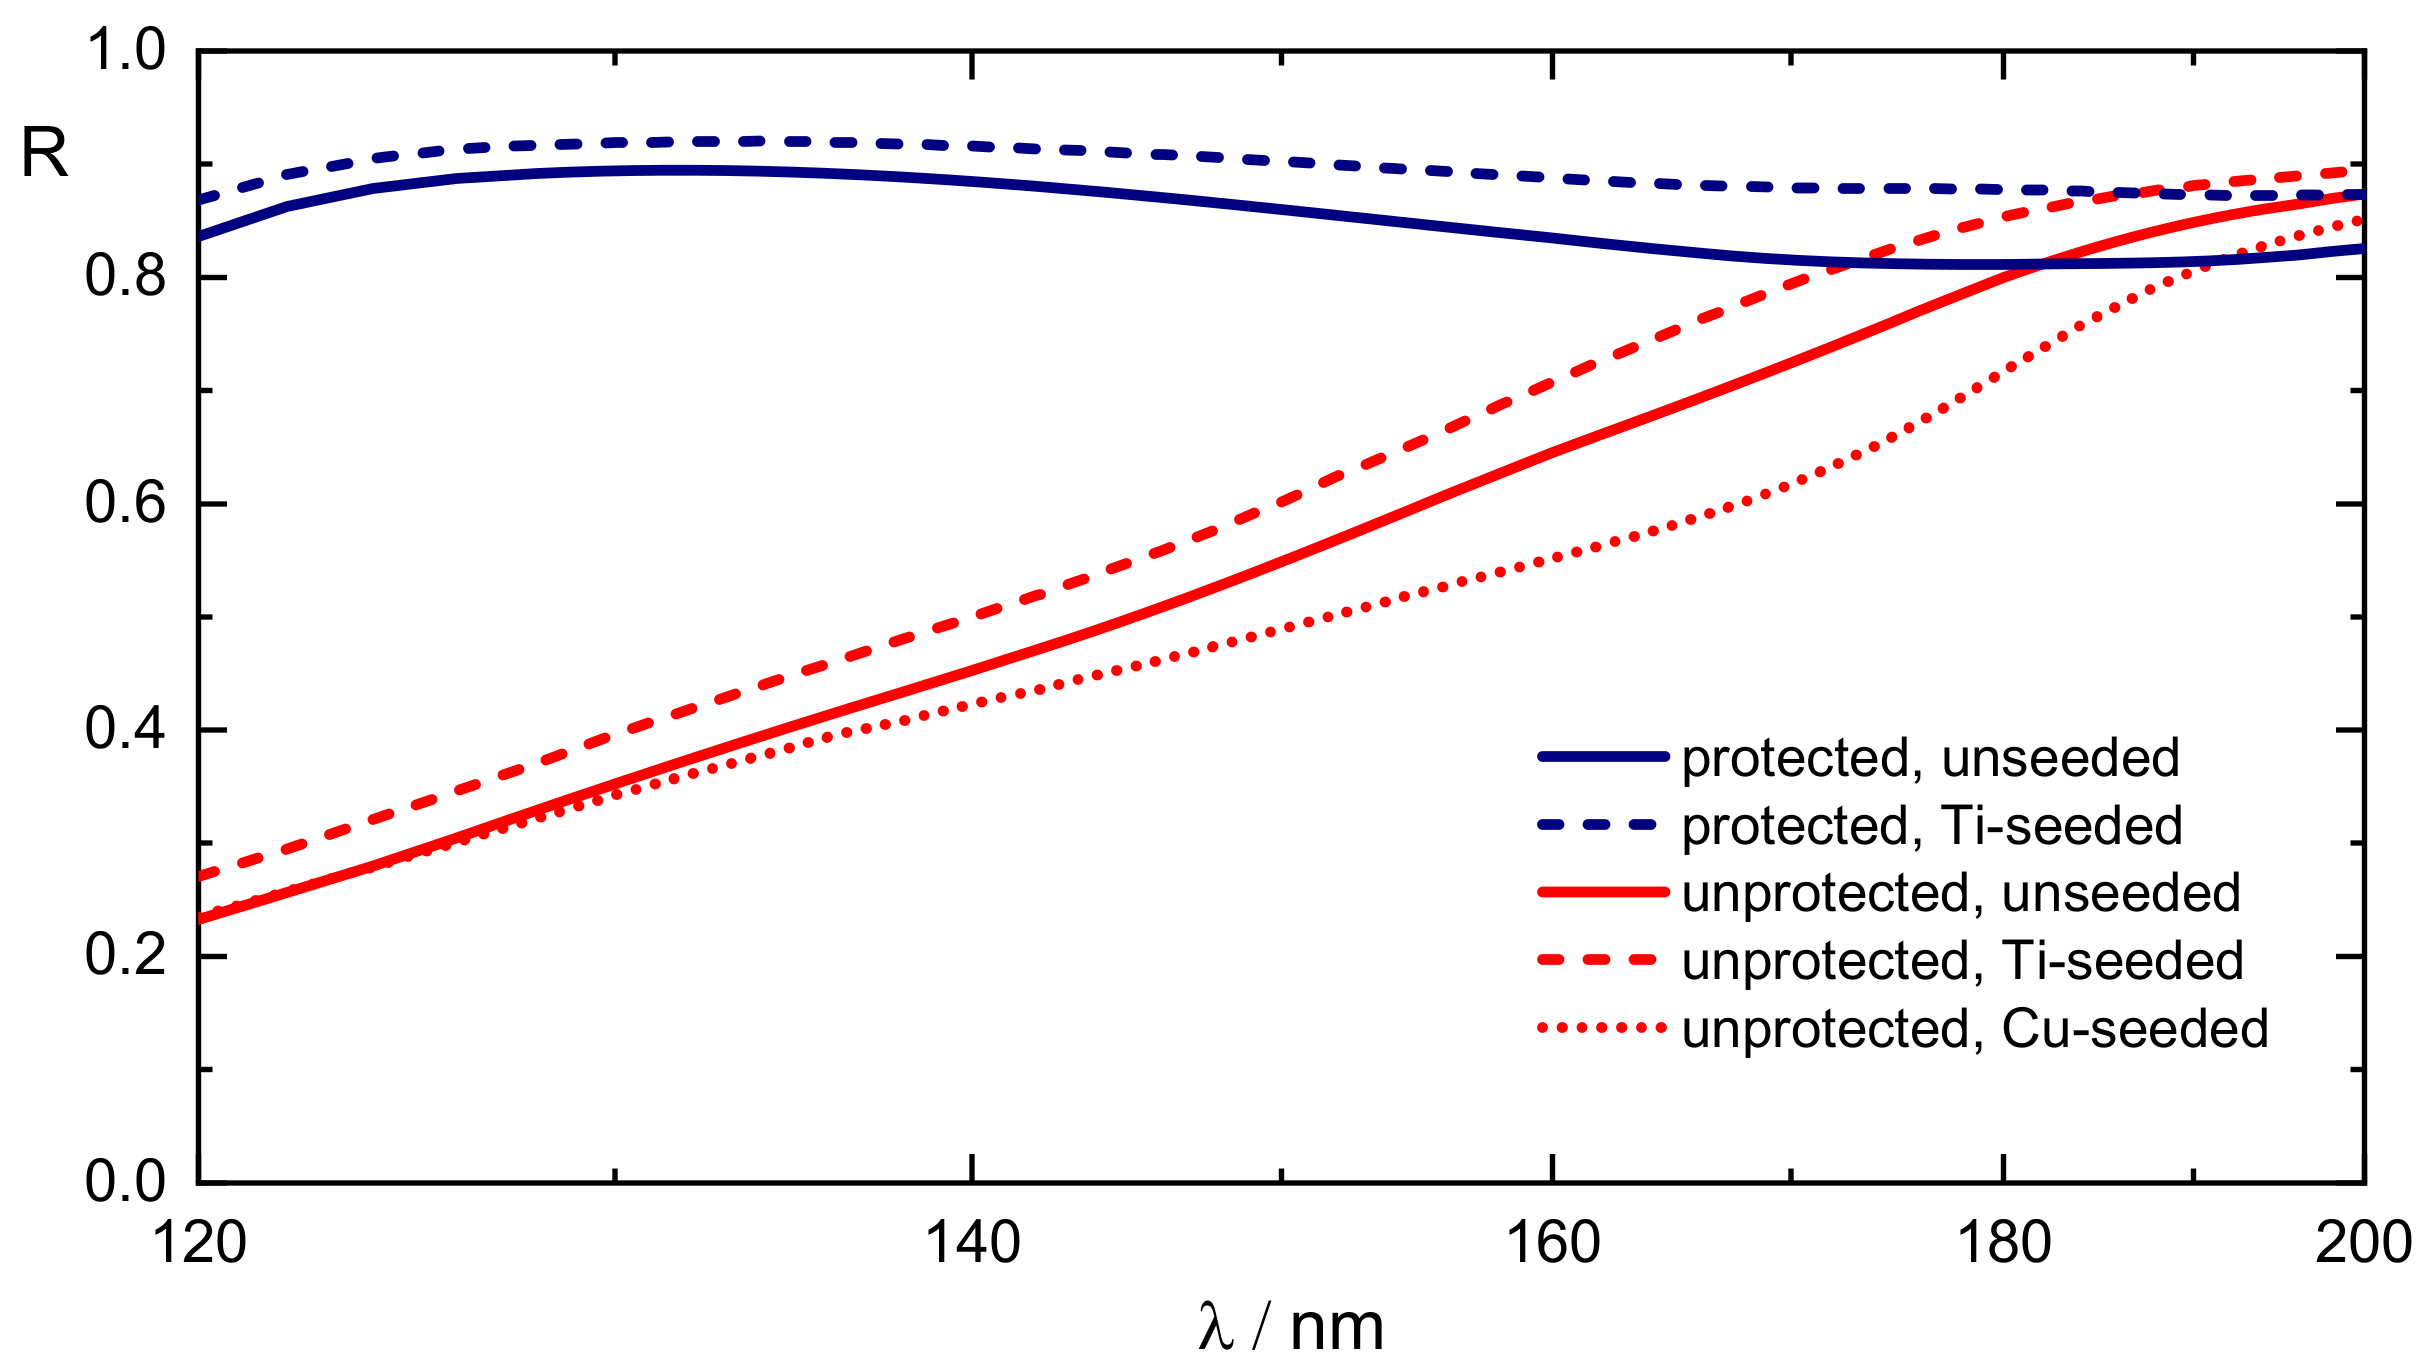
- There is a good qualitative agreement between the measured spectra and their calculated counterparts. In particular, the calculated reflectance ranking coincides with the measured one.
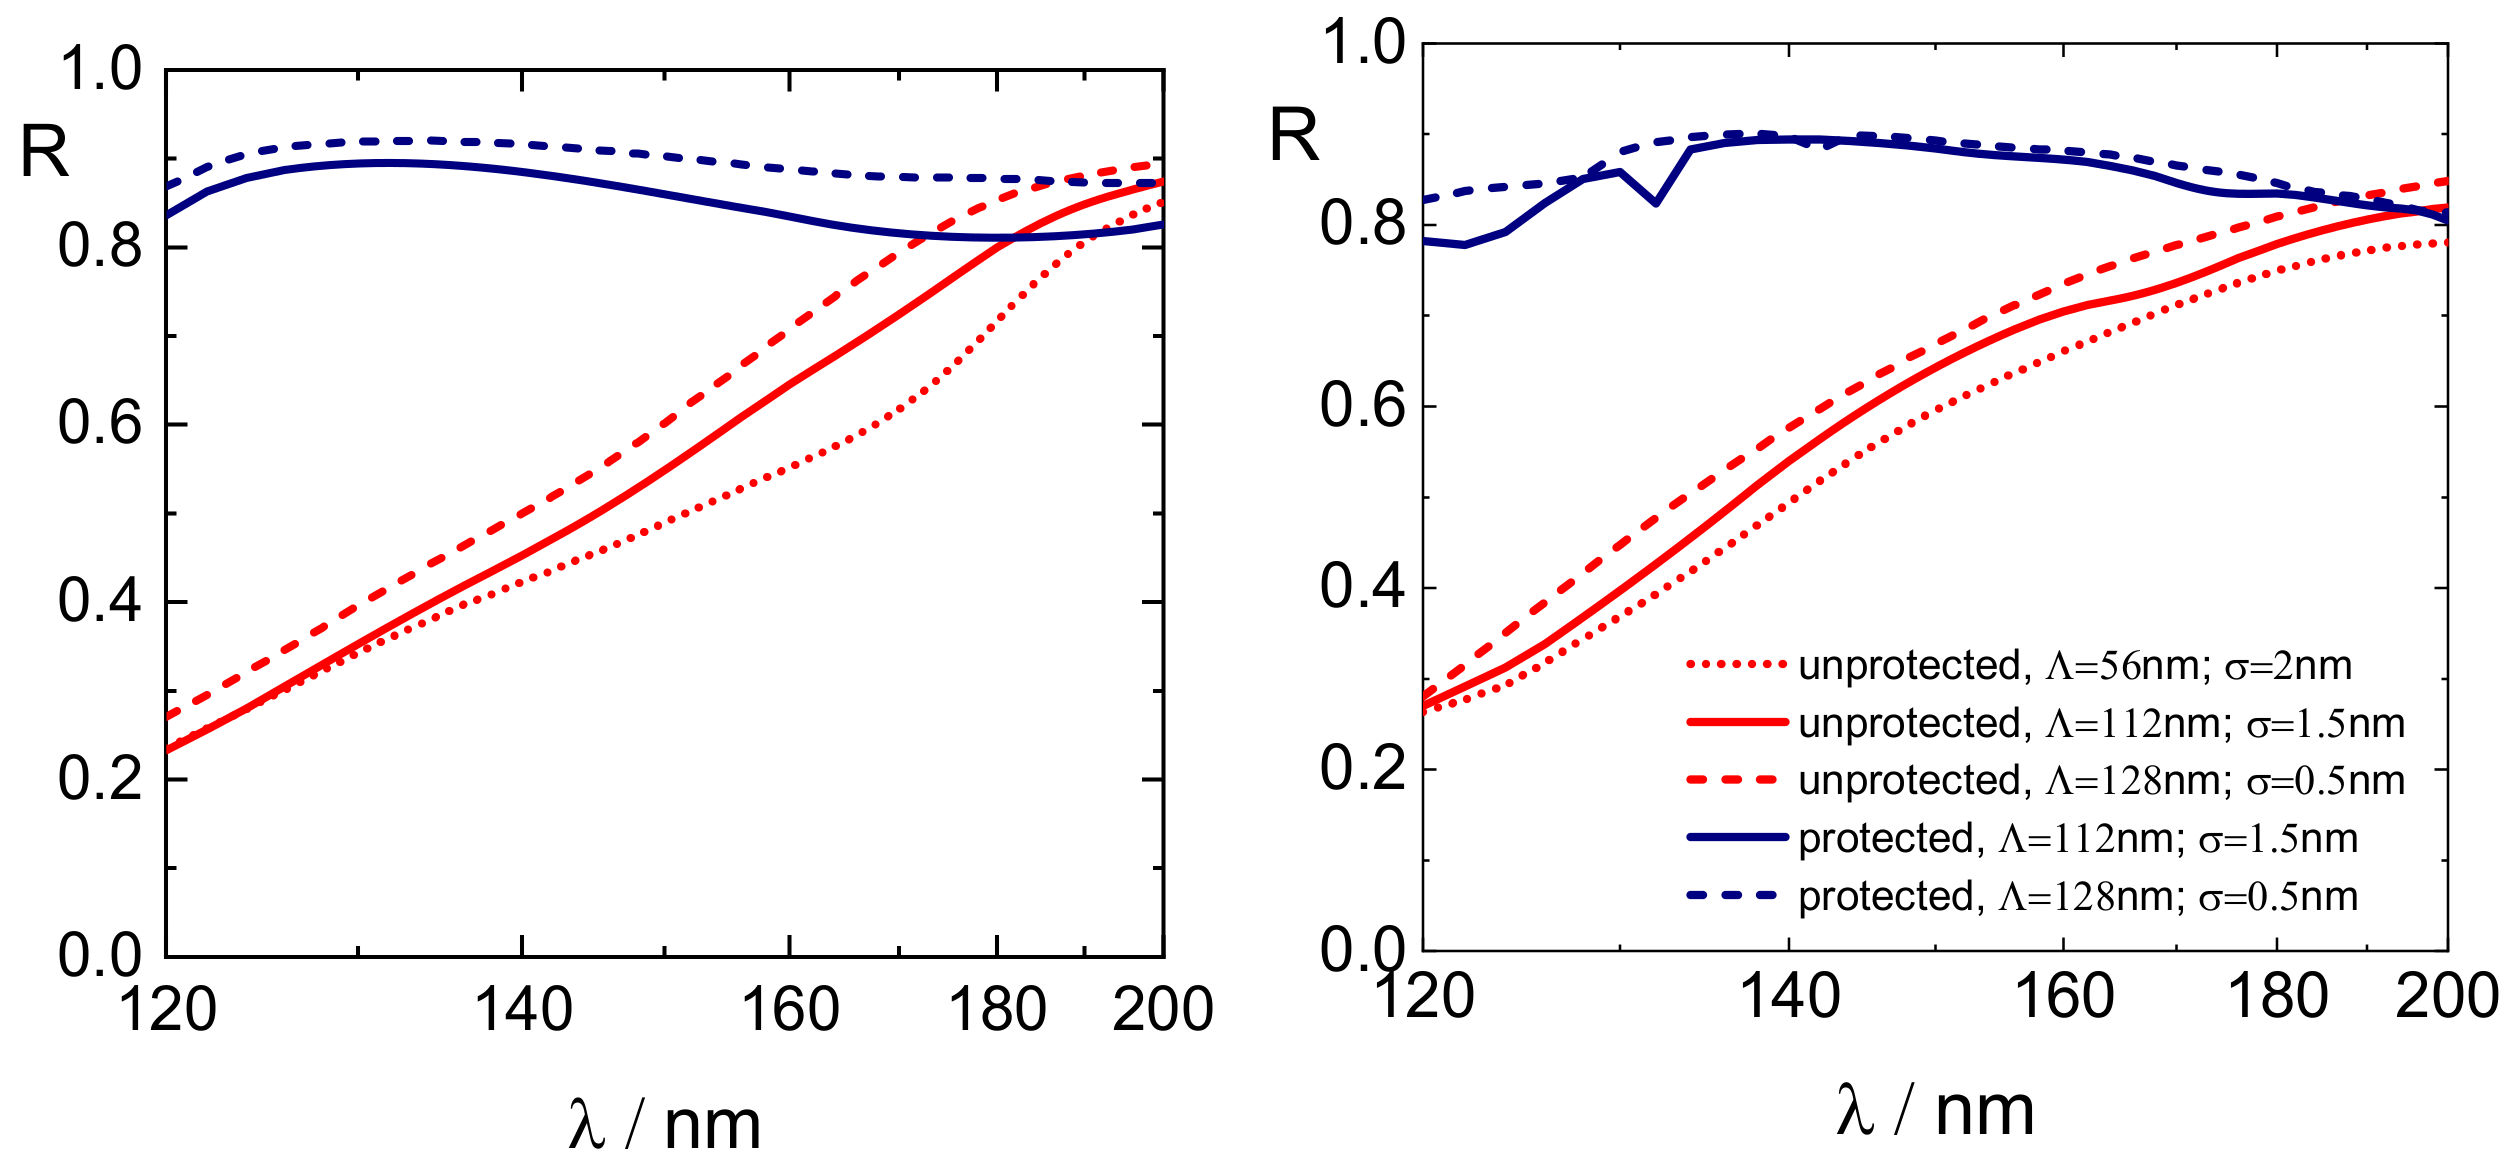
- There are clear differences when comparing specific spectral features. Thus, in one of the simulated spectra of a protected surface, we see a surface plasmon resonance around a wavelength of 132 nm, which is absent in the experimental spectra. We see a basic reason for this discrepancy in the highly idealized assumed surface structure, in particular the assumed strong periodicity, which results in an identical assumed size of all cylinders. In reality, due to the statistical distribution of the sizes of surface structure elements, such spectral features caused by surface plasmon excitation will smear out.
4.2. Spectrally Averaged VUV Reflectances
- The assumed strong periodicity does not allow for scatter losses when the wavelength is larger than the assumed period. This is in contrast to real stochastic surface profiles, which are expected to show scatter losses and therefore a somewhat smaller specular reflectance.
- The impossibility of modelling conformal coating with native alumina results in an underestimation of the amount of alumina in the detection volume when the cylinder height is larger than the assumed alumina thickness (compare Figure 5). Once the alumina is strongly absorbing in the VUV, this effect results in an additional overestimation of the reflectance in the case of unprotected layers when comparing with measured values. The discrepancy should increase with increasing roughness, which is indeed observed in Figure 11. In the case of our model surface, this effect is not so relevant for the quantitative results, because even in the worst-case scenario of the lowest period combined with the largest roughness of , the amount of pure aluminum surface merely constitutes 6.5% of the full surface. In real stochastic structures, however, the conformal alumina coating of all surface structures may result in a rather significant increase of the alumina amount in the detection volume, which gives a qualitative explanation to the measured larger reflectance losses when the surface roughness of unprotected layers is increased.
5. Summary
- The VUV normal incidence reflectance of protected and unprotected aluminum mirrors was calculated by the RCWA, assuming a two-dimensional periodic surface profile with regularly arranged cylinders with a height that is related to typical rms surface values of evaporated aluminum layers.
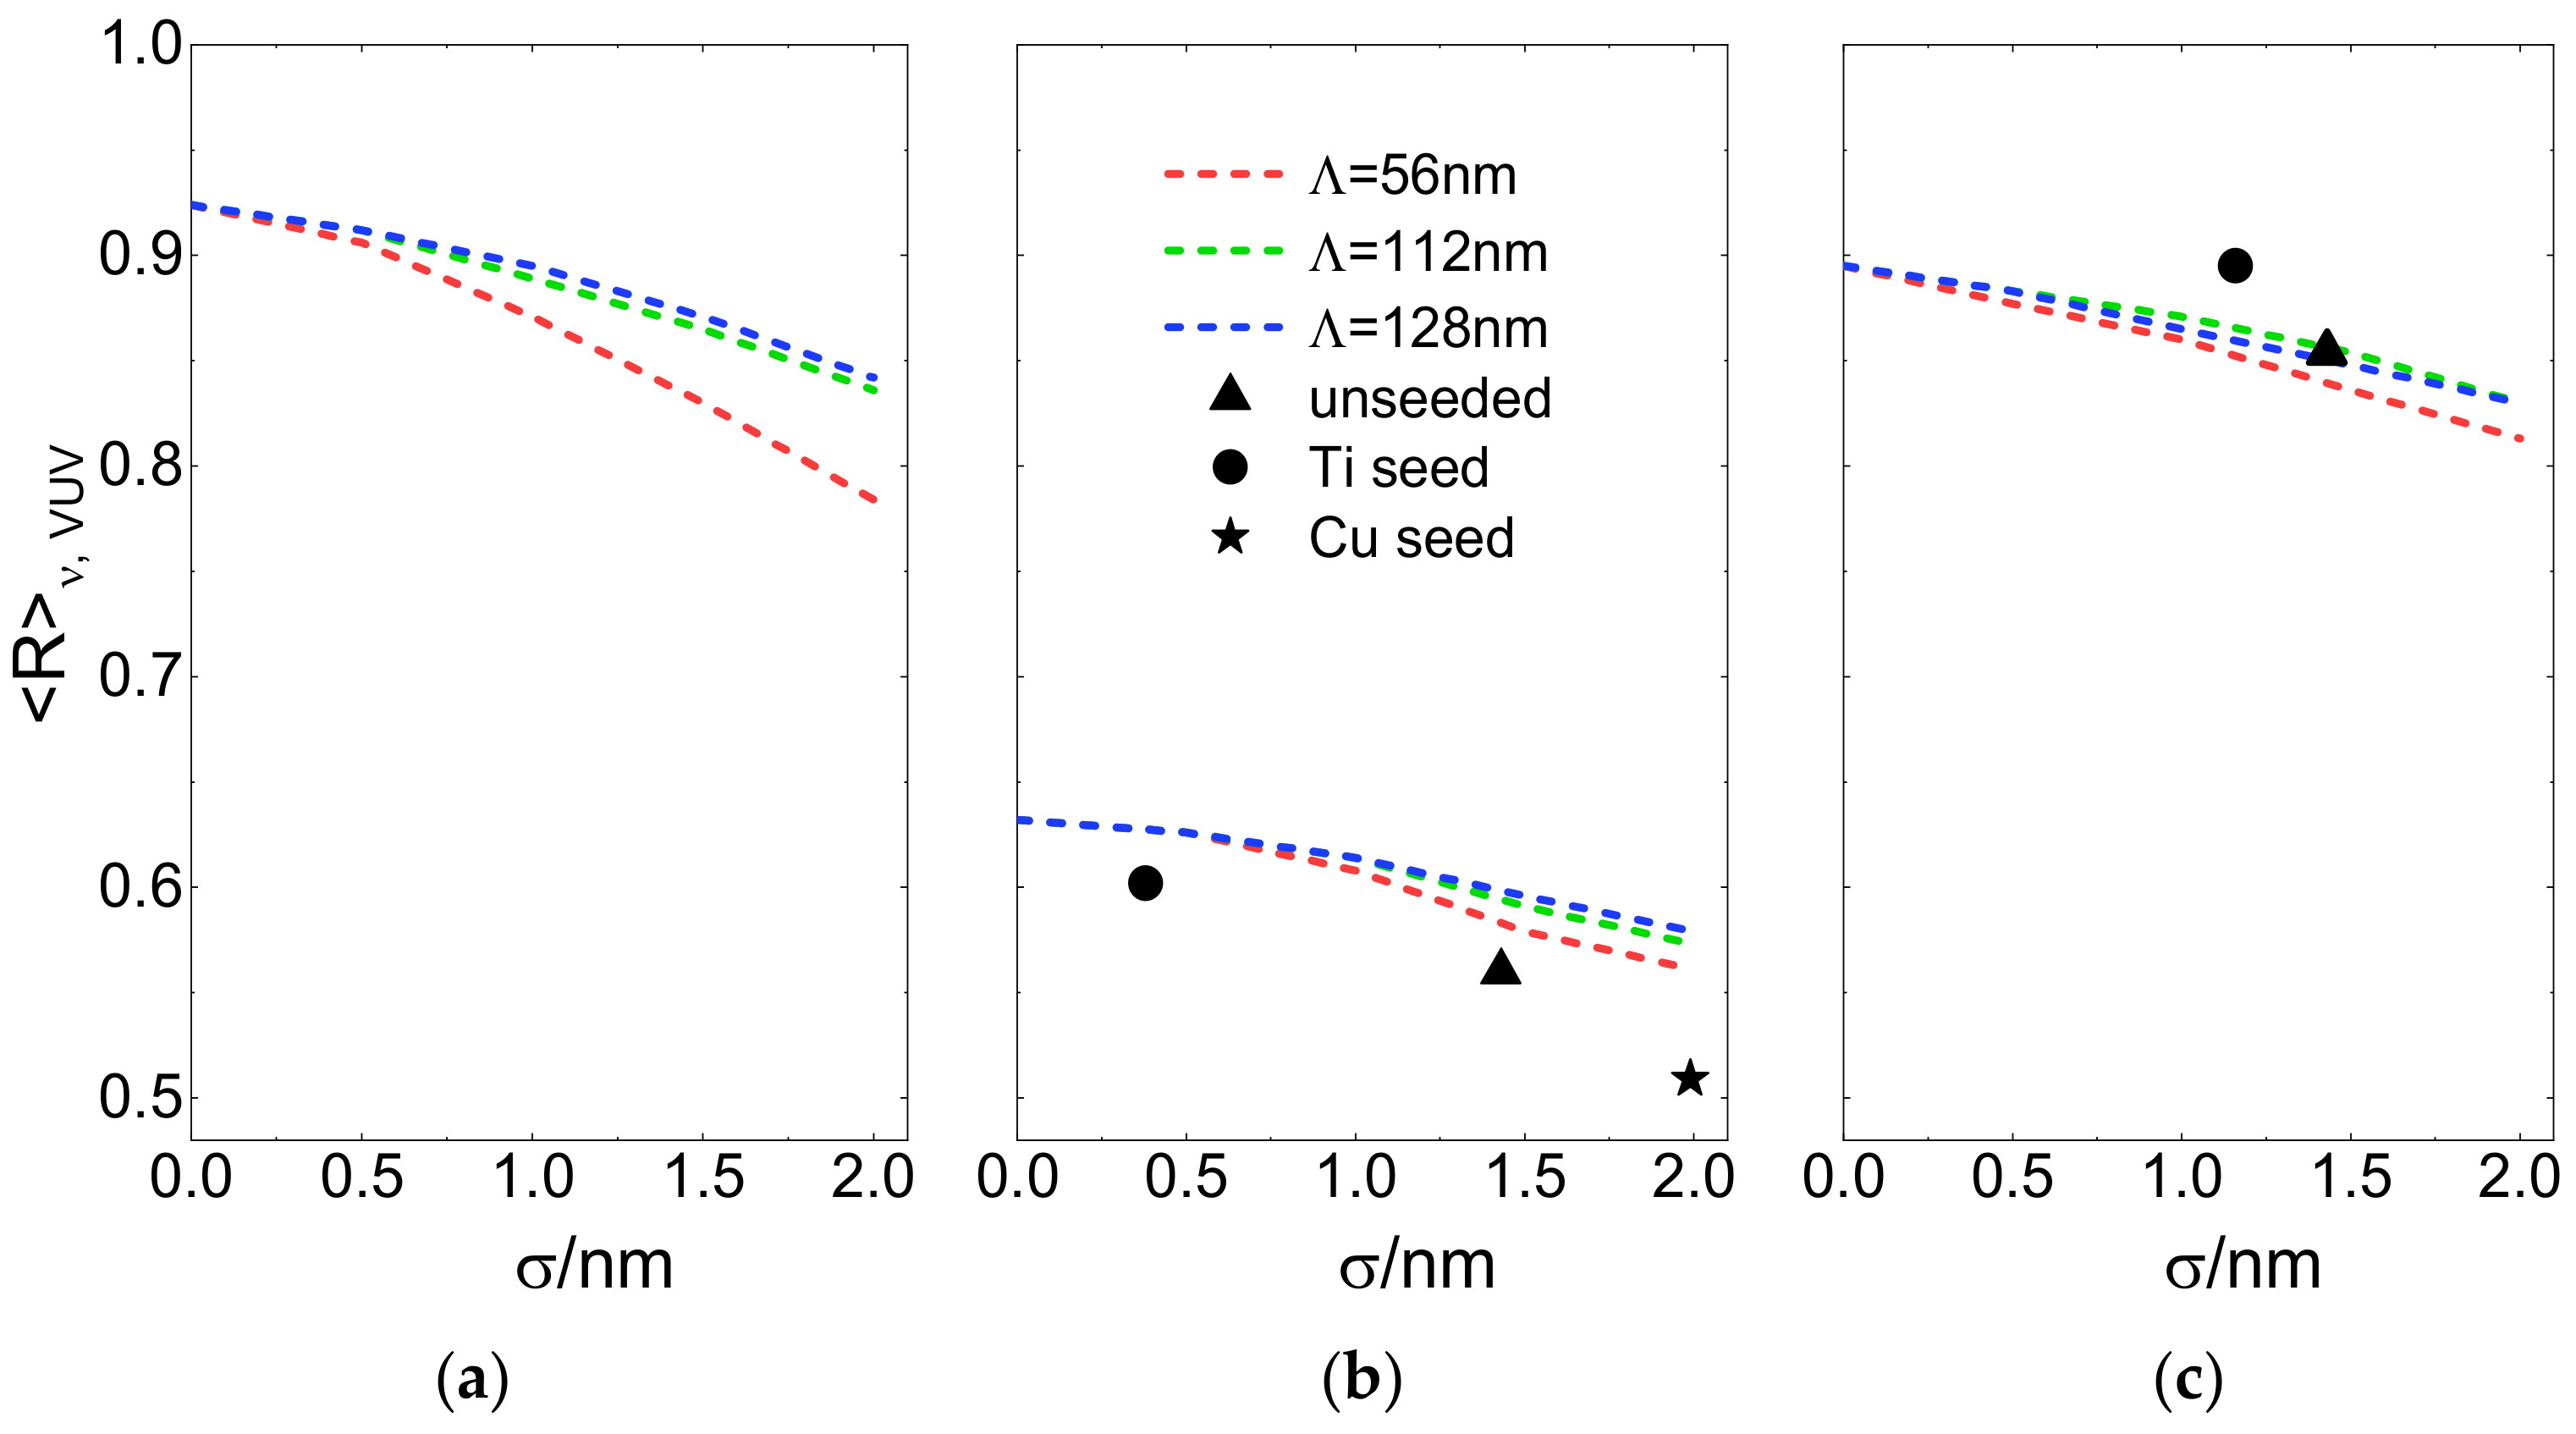
- MgF2-protected aluminum surfaces have an average measured VUV reflectance around 85%–90%, while unprotected films have an average reflectance around 50%–60%. This order of magnitude may be reproduced in the calculations when assuming that the unprotected films are covered by a 2.5 nm-thick native alumina layer. The loss in reflectance is therefore mainly attributed to absorption losses in the alumina overlayer.
- An increase in the rms surface roughness from 0 to 2 nm leads to an additional decrease in the average reflectance of around 10%. According to our calculations, these 10% are the optimization potential when maximizing the VUV reflectance by improving the surface quality, for example by applying seed layers.
Author Contributions
Funding
Institutional Review Board Statement
Informed Consent Statement
Data Availability Statement
Conflicts of Interest
References
- Hass, G.; Tousey, R. Reflecting Coatings for the Extreme Ultraviolet. J. Opt. Soc. Am. 1959, 49, 593. [Google Scholar] [CrossRef]
- Hunter, W.R.; Osantowski, J.F.; Hass, G. Reflectance of Aluminum Overcoated with MgF(2) and LiF in the Wavelength Region from 1600 A to 300 A at Various Angles of Incidence. Appl. Opt. 1971, 10, 540–544. [Google Scholar] [CrossRef] [PubMed]
- Hass, G. Filmed Surfaces for Reflecting Optics. J. Opt. Soc. Am. 1955, 45, 945. [Google Scholar] [CrossRef]
- Canfield, L.R.; Hass, G.; Waylonis, J.E. Further studies on MgF(2)-overcoated aluminum mirrors with highest reflectance in the vacuum ultraviolet. Appl. Opt. 1966, 5, 45–49. [Google Scholar] [CrossRef]
- Gutiérrez-Luna, N.; Perea-Abarca, B.; Espinosa-Yáñez, L.; Honrado-Benítez, C.; de Lis, T.; Rodríguez-de Marcos, L.V.; Aznárez, J.A.; Larruquert, J.I. Temperature Dependence of AlF3 Protection on Far-UV Al Mirrors. Coatings 2019, 9, 428. [Google Scholar] [CrossRef] [Green Version]
- Quijada, M.A.; Del Hoyo, J.; Gray, E.; Richardson, J.G.; Howe, A.; Rodriguez de Marcos, L.; Sheikh, D. Influence of evaporation rate and chamber pressure on the FUV reflectance and physical characteristics of aluminum films. In Proceedings of the UV/Optical/IR Space Telescopes and Instruments: Innovative Technologies and Concepts X, San Diego, CA, USA, 1–5 August 2021; Breckinridge, J.B., Stahl, H.P., Barto, A.A., Eds.; SPIE: Bellingham, WA, USA, 2021; p. 18, ISBN 9781510644762. [Google Scholar]
- Wilbrandt, S.; Stenzel, O.; Nakamura, H.; Wulff-Molder, D.; Duparré, A.; Kaiser, N. Protected and enhanced aluminum mirrors for the VUV. Appl. Opt. 2014, 53, A125–A130. [Google Scholar] [CrossRef] [PubMed]
- Stempfhuber, S.; Felde, N.; Schwinde, S.; Trost, M.; Schenk, P.; Schröder, S.; Tünnermann, A. Influence of seed layers on optical properties of aluminum in the UV range. Opt. Express 2020, 28, 20324–20333. [Google Scholar] [CrossRef] [PubMed]
- Hutcheson, E.T.; Hass, G.; Cox, J.T. Effect of Deposition Rate and Substrate Temperature on the Vacuum Ultraviolet Reflectance of MgF(2)- and LiF-Overcoated Aluminum Mirrors. Appl. Opt. 1972, 11, 2245–2248. [Google Scholar] [CrossRef]
- de Marcos, L.V.R.; Larruquert, J.I.; Méndez, J.A.; Gutiérrez-Luna, N.; Espinosa-Yáñez, L.; Honrado-Benítez, C.; Chavero-Royán, J.; Perea-Abarca, B. Optimization of MgF2-deposition temperature for far UV Al mirrors. Opt. Express 2018, 26, 9363–9372. [Google Scholar] [CrossRef]
- Fernández-Perea, M.; Larruquert, J.I.; Aznárez, J.A.; Pons, A.; Méndez, J.A. Vacuum ultraviolet coatings of Al protected with MgF(2) prepared both by ion-beam sputtering and by evaporation. Appl. Opt. 2007, 46, 4871–4878. [Google Scholar] [CrossRef]
- Adriaens, M.R.; Feuerbacher, B. Improved LiF and MgF(2) Overcoated Aluminum Mirrors for Vacuum Ultraviolet Astronomy. Appl. Opt. 1971, 10, 958–959. [Google Scholar] [CrossRef] [PubMed]
- Rodríguez-de Marcos, L.V.; Boris, D.; Del Hoyo, J.; Wheeler, V.; Woodward, J.; Richardson, G.; Walton, S.; Wollack, E.; Quijada, M. Advanced AlF3-passivated Aluminum mirrors for UV astronomy. In Proceedings of the Astronomical Optics: Design, Manufacture, and Test of Space and Ground Systems III, San Diego, CA, USA, 1–5 August 2021; Hallibert, P., Hull, T.B., Kim, D., Keller, F., Eds.; SPIE: Bellingham, WA, USA, 2021; p. 1, ISBN 9781510644786. [Google Scholar]
- Boris, D.R.; Rodriguez-de Marcos, L.V.; Del Hoyo, J.G.; Wheeler, V.D.; Walton, S.G.; Wollack, E.J.; Quijada, M.A. Plasma based production of AlF3-passivated aluminum mirrors for UVOIR astronomy. In Proceedings of the Space Telescopes and Instrumentation 2022: Ultraviolet to Gamma Ray, Montréal, QC, Canada, 17–23 July 2022; den Herder, J.-W.A., Nakazawa, K., Nikzad, S., Eds.; SPIE: Bellingham, WA, USA, 2022; p. 124, ISBN 9781510653436. [Google Scholar]
- Fronk, K.; Allred, D.D. Evidence that evaporated Al/AlF3 bilayer thin films stored in a 327 K oven for over 2500 h have not degraded. In Proceedings of the Space Telescopes and Instrumentation 2022: Ultraviolet to Gamma Ray, Montréal, QC, Canada, 17–23 July 2022; den Herder, J.-W.A., Nakazawa, K., Nikzad, S., Eds.; SPIE: Bellingham, WA, USA, 2022; p. 122, ISBN 9781510653436. [Google Scholar]
- Quijada, M.A.; Rodriguez de Marcos, L.V.; Del Hoyo, J.G.; Gray, E.; Wollack, E.J.; Brown, A. Advanced Al mirrors protected with LiF overcoat to realize stable mirror coatings for astronomical telescopes. In Proceedings of the Advances in Optical and Mechanical Technologies for Telescopes and Instrumentation V, Montréal, QC, Canada, 17–23 July 2022; Geyl, R., Navarro, R., Eds.; SPIE: Bellingham, WA, USA, 2022; p. 66, ISBN 9781510653573. [Google Scholar]
- Angel, D.W.; Hunter, W.R.; Tousey, R.; Hass, G. Extreme Ultraviolet Reflectance of LiF-Coated Aluminum Mirrors. J. Opt. Soc. Am. 1961, 51, 913. [Google Scholar] [CrossRef]
- Willers, G.; Hagendorf, C.; Naumann, V.; Holzlöhner, R.; Guisard, S. Soiling induced nano-defects on aluminum telescope mirror coatings. Appl. Opt. 2022, 61, 2727–2732. [Google Scholar] [CrossRef]
- Edmends, J.S.; Maldé, C.N.; Corrigan, S.J. Measurements of the far ultraviolet reflectivity of evaporated aluminum films under exposure to O2, H2O, CO and CO2. Vacuum 1990, 40, 471–475. [Google Scholar] [CrossRef]
- Li, S.; Wang, F.; Wang, Z.; Zhou, H.; Huo, T. Effect of humidity on the performance of Al/LiF/eMgF2 mirrors in the far ultraviolet spectrum. Opt. Eng. 2022, 61, 031205. [Google Scholar] [CrossRef]
- Oliveira, C.M.; Retherford, K.; Conard, S.J.; Barkhouser, R.H.; Friedman, S.D. Aging studies of LiF-coated optics for use in the far ultraviolet. In EUV, X-Ray, and Gamma-Ray Instrumentation for Astronomy X, Proceedings of the SPIE’s International Symposium on Optical Science, Engineering, and Instrumentation, Denver, CO, USA, 18 July 1999; Siegmund, O.H.W., Flanagan, K.A., Eds.; SPIE: Bellingham, WA, USA, 1999; pp. 52–60. [Google Scholar]
- Rydalch, T.; Lewis, D.M.; Allred, D.D. Stability of lithium fluoride thin films as a function of humidity and temperature. In Proceedings of the Advances in Optical and Mechanical Technologies for Telescopes and Instrumentation V, Montréal, QC, Canada, 17–23 July 2022; Geyl, R., Navarro, R., Eds.; SPIE: Bellingham, WA, USA, 2022; p. 207, ISBN 9781510653573. [Google Scholar]
- Ohl IV, R.G.; Barkhouser, R.H.; Conard, S.J.; Friedman, S.D.; Hampton, J.; Moos, H.W.; Nikulla, P.; Oliveira, C.M.; Saha, T.T. Performance of the Far Ultraviolet Spectroscopic Explorer mirror assemblies. In Instrumentation for UV/EUV Astronomy and Solar Missions, Proceedings of the International Symposium on Optical Science and Technology, San Diego, CA, USA, 30 July 2000; Fineschi, S., Korendyke, C.M., Siegmund, O.H.W., Woodgate, B.E., Eds.; SPIE: Bellingham, WA, USA, 2000; pp. 137–148. [Google Scholar]
- Liu, C.; Guo, Q.; Cao, G.; Ai, W.; Guan, Y. Vacuum ultraviolet high-reflectance aluminum mirrors on copper substrate for application in noble liquid time projection chamber. Vacuum 2022, 197, 110806. [Google Scholar] [CrossRef]
- Larruquert, J.I.; Honrado-Benítez, C.; Gutiérrez-Luna, N.; Ríos-Fernández, Á.; López-Reyes, P. Far UV-enhanced Al mirrors with a Ti seed film. Opt. Express 2021, 29, 7706–7712. [Google Scholar] [CrossRef]
- UNIGIT. Grating Solver Software. Available online: https://unigit.net (accessed on 15 December 2022).
- Quijada, M.A.; Rice, S.; Mentzell, E. Enhanced MgF2 and LiF over-coated Al mirrors for FUV space astronomy. In Modern Technologies in Space- and Ground-Based Telescopes and Instrumentation II, Proceedings of the SPIE Astronomical Telescopes + Instrumentation, Amsterdam, The Netherlands, 1 July 2012; Navarro, R., Cunningham, C.R., Prieto, E., Eds.; SPIE: Bellingham, WA, USA, 2012; p. 84502H. [Google Scholar]
- Quijada, M.A.; Del Hoyo, J.; Rice, S. Enhanced far-ultraviolet reflectance of MgF 2 and LiF over-coated Al mirrors. In Space Telescopes and Instrumentation 2014: Ultraviolet to Gamma Ray, Proceedings of the SPIE Astronomical Telescopes + Instrumentation, Montréal, QC, Canada, 22 June 2014; Takahashi, T., den Herder, J.-W.A., Bautz, M., Eds.; SPIE: Bellingham, WA, USA, 2014; p. 91444G. [Google Scholar]
- Stempfhuber, S. Entwicklung von Breitbandig Hochreflektierenden Aluminiumschichten im VUV-Bereich. Ph.D. Thesis, Friedrich Schiller Universität Jena, Jena, Germany.
- Shiles, E.; Sasaki, T.; Inokuti, M.; Smith, D.Y. Self-consistency and sum-rule tests in the Kramers-Kronig analysis of optical data: Applications to aluminum. Phys. Rev. B 1980, 22, 1612–1628. [Google Scholar] [CrossRef]
- Wilbrandt, S.; Stenzel, O.; Liaf, A.; Munzert, P.; Schwinde, S.; Stempfhuber, S.; Felde, N.; Trost, M.; Seifert, T.; Schröder, S. Spectrophotometric Characterization of Thin Semi-Transparent Aluminum Films Prepared by Electron Beam Evaporation and Magnetron Sputtering. Coatings 2022, 12, 1278. [Google Scholar] [CrossRef]
- Stenzel, O. The Physics of Thin Film Optical Spectra: An Introduction, 2nd ed.; Springer International Publishing: Cham, Switzerland, 2016; pp. 90–91. ISBN 978-3-319-21602-7. [Google Scholar]
- Hagemann, H.-J.; Gudat, W.; Kunz, C. Optical constants from the far infrared to the x-ray region: Mg, Al, Cu, Ag, Au, Bi, C, and Al2O3. J. Opt. Soc. Am. 1975, 65, 742. [Google Scholar] [CrossRef]
- He, J.Y. Modelling UV and VUV optical losses of rough aluminum films. Master’s Thesis, Friedrich Schiller Universität Jena, Jena, Germany, 2022. [Google Scholar]
- Jobst, P.J.; Stenzel, O.; Schürmann, M.; Modsching, N.; Yulin, S.; Wilbrandt, S.; Gäbler, D.; Kaiser, N.; Tünnermann, A. Optical properties of unprotected and protected sputtered silver films: Surface morphology vs. UV/VIS reflectance. Adv. Opt. Technol. 2014, 3, 91–102. [Google Scholar] [CrossRef]


| Seed Layer | Overlayer | Average Lateral Aluminum Grain Size/nm | Rms Surface Roughness/nm | |
|---|---|---|---|---|
| none | Native alumina | 112 | 1.43 | 0.56 |
| Protective MgF2 coating | 1.43 | 0.85 | ||
| Ti | Native alumina | 128 | 0.38 | 0.60 |
| Protective MgF2 coating | 1.16 | 0.90 | ||
| Cu | Native alumina | 56 | 1.99 | 0.51 |
| Λ/nm | Overlayer | Attributed System | |||||
| 0 | 1.039 | 2.078 | 3.177 | 4.156 | |||
| 0 | 0.5 | 1 | 1.5 | 2 | |||
| 56 | None | Theoretical reference | |||||
| 112 | |||||||
| 128 | |||||||
| 56 | 5 nm (1) MgF2 + 22.5 nm (2) MgF2 | Cu seeded protected (3) | |||||
| 112 | x | Unseeded protected | |||||
| 128 | x | Ti seeded protected | |||||
| 56 | 2.5 nm AlxOy | x | Cu seeded unprotected | ||||
| 112 | x | Unseeded unprotected | |||||
| 128 | x | Ti seeded unprotected | |||||
| σ/nm | Λ/nm | |||||
|---|---|---|---|---|---|---|
| 56 | 112 | 128 | ||||
| 0 | 0.919 | 0.924 | 0.919 | 0.924 | 0.919 | 0.924 |
| 0.5 | 0.904 | 0.906 | 0.909 | 0.912 | 0.909 | 0.912 |
| 1 | 0.869 | 0.871 | 0.887 | 0.889 | 0.890 | 0.895 |
| 1.5 | 0.820 | 0.830 | 0.857 | 0.865 | 0.862 | 0.871 |
| 2 | 0.764 | 0.784 | 0.821 | 0.836 | 0.829 | 0.842 |
| σ/nm | Λ/nm | |||||
|---|---|---|---|---|---|---|
| 56 | 112 | 128 | ||||
| 0 | 0.682 | 0.632 | 0.682 | 0.632 | 0.682 | 0.632 |
| 0.5 | 0.673 | 0.626 | 0.675 | 0.626 | 0.675 | 0.626 |
| 1 | 0.655 | 0.608 | 0.662 | 0.614 | 0.663 | 0.614 |
| 1.5 | 0.628 | 0.579 | 0.642 | 0.591 | 0.645 | 0.596 |
| 2 | 0.607 | 0.561 | 0.623 | 0.573 | 0.6275 | 0.579 |
| Experiment | ||||||
| 1.99 | 0.561 | 0.509 | - | - | - | - |
| 1.43 | - | - | 0.615 | 0.56 | - | - |
| 0.38 | - | - | - | - | 0.664 | 0.602 |
| σ/nm | Λ/nm | |||||
|---|---|---|---|---|---|---|
| 56 | 112 | 128 | ||||
| 0 | 0.888 | 0.895 | 0.888 | 0.895 | 0.888 | 0.895 |
| 0.5 | 0.871 | 0.877 | 0.877 | 0.883 | 0.877 | 0.883 |
| 1 | 0.851 | 0.86 | 0.863 | 0.871 | 0.863 | 0.865 |
| 1.5 | 0.832 | 0.836 | 0.848 | 0.854 | 0.846 | 0.848 |
| 2 | 0.812 | 0.813 | 0.8305 | 0.83 | 0.828 | 0.83 |
| Experiment | ||||||
| 1.16 | - | - | - | - | 0.892 | 0.895 |
| 1.43 | - | - | 0.844 | 0.854 | - | - |
Disclaimer/Publisher’s Note: The statements, opinions and data contained in all publications are solely those of the individual author(s) and contributor(s) and not of MDPI and/or the editor(s). MDPI and/or the editor(s) disclaim responsibility for any injury to people or property resulting from any ideas, methods, instructions or products referred to in the content. |
© 2023 by the authors. Licensee MDPI, Basel, Switzerland. This article is an open access article distributed under the terms and conditions of the Creative Commons Attribution (CC BY) license (https://creativecommons.org/licenses/by/4.0/).
Share and Cite
Stenzel, O.; Wilbrandt, S.; He, J.-Y.; Stempfhuber, S.; Schröder, S.; Tünnermann, A. A Model Surface for Calculating the Reflectance of Smooth and Rough Aluminum Layers in the Vacuum Ultraviolet Spectral Range. Coatings 2023, 13, 122. https://doi.org/10.3390/coatings13010122
Stenzel O, Wilbrandt S, He J-Y, Stempfhuber S, Schröder S, Tünnermann A. A Model Surface for Calculating the Reflectance of Smooth and Rough Aluminum Layers in the Vacuum Ultraviolet Spectral Range. Coatings. 2023; 13(1):122. https://doi.org/10.3390/coatings13010122
Chicago/Turabian StyleStenzel, Olaf, Steffen Wilbrandt, Jian-Ying He, Sven Stempfhuber, Sven Schröder, and Andreas Tünnermann. 2023. "A Model Surface for Calculating the Reflectance of Smooth and Rough Aluminum Layers in the Vacuum Ultraviolet Spectral Range" Coatings 13, no. 1: 122. https://doi.org/10.3390/coatings13010122