Article

Influence of Fin Thickness on the Thermal Performance and Selection of Coating Method for a Bus Duct Conductor

by
Mark Selvan
1,
Mohd Sharizal Abdul Aziz
1,*,
Mohd Arif Anuar Mohd Salleh
2,*,
Nurulakmal Mohd Sharif
3,
Chu Yee Khor
4,
Heng Pin Ong
5,
Mohd Remy Rozaini Mohd Arif Zainol
6,
Petrica Vizureanu
7,8,*,
Diana-Petronela Burduhos-Nergis
7 and
Andrei Victor Sandu
7,9,10
1
School of Mechanical Engineering, Engineering Campus, Universiti Sains Malaysia, Nibong Tebal 14300, Penang, Malaysia
2
Centre of Excellence Geopolymer and Green Technology, Universiti Malaysia Perlis (UniMAP), Kangar 01000, Perlis, Malaysia
3
School of Materials and Mineral Resources Engineering, Engineering Campus, Universiti Sains Malaysia, Nibong Tebal 14300, Penang, Malaysia, Malaysia
4
Faculty of Mechanical Engineering & Technology, Universiti Malaysia Perlis (UniMAP), Arau 02600, Perlis, Malaysia
5
Furutec Electrical Sdn. Bhd., MK13, Plot 89, Lorong Perindustrian Bukit Minyak 11, Kawasan Perindustrian Bukit Minyak, Simpang Ampat 14100, Penang, Malaysia
6
River Engineering and Urban Drainage Research Centre (REDAC), Universiti Sains Malaysia, Nibong Tebal 14300, Penang, Malaysia
7
Faculty of Materials Science and Engineering, Gheorghe Asachi Technical University of Iasi, Blvd. D. Mangeron 71, 700050 Iasi, Romania
8
Technical Sciences Academy of Romania, Dacia Blvd 26, 030167 Bucharest, Romania
9
Romanian Inventors Forum, Str. Sf. P. Movila 3, 700089 Iasi, Romania
10
National Institute for Research and Development in Environmental Protection INCDPM, Splaiul Independentei 294, 060031 Bucharest, Romania
*
Authors to whom correspondence should be addressed.
Coatings 2023, 13(1), 12; https://doi.org/10.3390/coatings13010012
Submission received: 17 November 2022 / Revised: 14 December 2022 / Accepted: 19 December 2022 / Published: 22 December 2022

Abstract

:
This paper studies the fin thickness variation effect on a bus duct conductor’s thermal performance and the nanocomposite coating method selection for the bus duct conductor’s heat sink. ANSYS FLUENT was used to create a numerical model resembling the experimental setup. The IEC 60439-1 and IEC 60439-2 standards were used to benchmark the experimental data. The results revealed that the “chimney effect” induces an increment of the hot air adjacent to the heat sink. A conspicuous increase in the total heat transfer rate and fin effectiveness was observed as the fin thickness was reduced. This study revealed that s1 = 1 mm was the best fin thickness with 1.254 fin effectiveness, 1.862 W of total heat transfer rate, and 17.5 Nusselt number. Additionally, various coating methods were examined experimentally to select the best nanocomposite coating for the bus duct conductor’s heat sink. The ultrasonic agitation was the best coating method, which resulted in the lowest average resistance (8.8 μΩ) and a better percentage of Ag (0.6%–2.5%) on the substrate surface. Thus, the current outcomes are expected to better comprehend the impact of fin thickness on thermal performance, as well as the selection of coating method for the bus duct conductor.

1. Introduction

Bus bar conductors are vital in large-scale power distribution systems. Bus bar conductors are frequently used to interconnect loads, transmission lines, and generators. Bus bars are commonly employed due to their wide range of interconnection options and superior thermal performance. In order to operate at maximum efficiency, the bus bar system is required to operate at a lower temperature; thus, its thermal performance is critical. This situation is due to the system’s current-carrying capacity, which is directly influenced by the conductor’s temperature. Numerous parameters affect the bus bar system’s thermal performance. However, the primary influencing parameters are the aluminum casing’s current amperage, thermal conductivity, layout, and cross-sectional area [1]. A bus bar system consists of an aluminum casing and a copper alloy conductor. Thermal fins are integrated into the bus bar casing design to improve the heat dissipation rate via natural convection. Thus, the thermal fin design must be optimized to increase the bus bar system’s thermal performance.
Conventional heat cooling methods have served faithfully for decades. However, they now face the limitation of their usefulness as the typical bus bar system generates much more heat flux. Thus, optimizing thermal fins for these systems has been a focus center. Several standard and uncommon methods have been investigated to enhance and optimize the thermal performance of thermal fins. Geometrical modification is essential in designing high-performance heat sinks. Geometry alteration could manipulate the fluid flow regime and influence the convective heat transfer rate. Some typical fin geometrical modifications are slots, interruptions, and perforations that enhance thermal performance [2].
One of the fascinating geometrical patterns is the fractal design. The fractal design of the plate-fin heat sinks substantially impacted thermal performance. Convective heat transfer rates increased by 43%–57% [3]. Hoi et al. conducted another exciting study on fractal grid-induced turbulence in a plate heat sink, using three fractal grids and iterations. They discovered all patterns increased the Nusselt number by 50%. Heat sinks can be retrofitted with winglet-style vortex generators to improve airflow, according to Dake and Majdalani [4]. The rotating vortices in the inter-fin spacing of the vortex generators increased air circulation.
Wu et al. [5] and Song et al. [6] conducted similar research on the effects of fin pitches and tube diameter with curved delta-winglet vortex generators. They discovered the curved delta-winglet vortex generator fin significantly enhanced heat transfer. The effects of dimpled surfaces on the efficiency of flat-plate heat transfer were examined by Vorayos et al. [7]. The Nusselt number increased by 26% when a surface with staggered dimples was used. The internal restructuring of a liquid-cooled heat sink was studied by Lee et al. [8]. To improve the heat sink’s thermal efficiency, they employed a topology optimization technique. Their research showed the heat sink’s cylindrical pin-fin structure with varying pitch greatly facilitates heat transfer. Culham and Muzychka [9] carried out similar studies as well.
The heat sink’s performance is significantly impacted by its orientation. Numerous eminent studies have examined the impact of heat sink orientation, particularly the impact of orientation on the rate of convective heat transfer [10,11,12]. Sparrow and Vemuri [11] investigated the heat transfer characteristics of three various orientations. They revealed the vertical fin array is the best among the three orientations. Similarly, Effendi and Kim [13] studied the influence of orientation. However, they used hollow and solid hybrid fins in their study. They discovered that a 45° angle produced the lowest thermal resistance for both fin types.
Fin height is one of the essential factors for a heat sink design. The heat transfer to the surroundings increases with the height of the fin. Lesser thermal performance was observed with shorter fins [14,15,16]. An increase in fin height significantly improved the heat sink thermal performance on a solar air heater [17]. The physical change in the heat sink design raised the surface area. Thus, the thermal performance is improved by increasing the fin length or decreasing the fin pitch [18]. Changing the fin density reduced the overall weight and improved the thermal performance of the natural convection-cooled heat sink [19]. The heat sink with fin array and varying heights reduced flow resistance to improve thermal performance. Flow resistances were lower, and local heat transfer coefficients were higher in fin arrays with more considerable height differences [20].
Low convective coefficient fin materials reduce fin thickness to channel radius. Fin efficiency was increased by using materials with high thermal conductivity, thick fins, and low fluid convective coefficient [21]. The effectiveness of the heat sink has been improved through a number of studies [22]. A plate-fin with a fillet profile heat sinks with symmetrical and corrugated half-round pins are well-functioned in parallel and impinging flow [23]. A 2 mm fin pitch increased the thermal efficiency of a semi-dimple vortex generator by 10% compared to a plain fin geometry.
There have been other attempts to use a graphene-silver hybrid nanofluid to improve the thermal performance of a micro-channel heatsink. As velocity or nanoparticle concentration increased, the heat sinks’ surface temperatures decreased [24]. Additionally, Hussain et al. [25] looked into how the fillet profile and flow direction affected the thermal performance of a plate-fin heat sink. The base temperature of plate heat sinks with a fillet exposed to parallel flow was lower than those without a fillet exposed to impinging flow. Similar results were reported by other researchers as well [26,27,28].
The coating material of the heat sink plays a critical role in enhancing the heat sink’s performance. Various coating materials, such as carbon materials and SiO2 [29], cupric oxide (CuO), silicon-based resin [30], carbon nanotube [31], copper-graphene [32], and phase-change materials [33], have been used on the coating of the heat sink surface. The heat sink coating can be achieved using the direct current electrodeposition technique, laser etching, and spraying. The studies [34,35,36,37,38,39] showed the enhancement of thermal performance in the coated heat sink compared to a plain heat sink. The coated layer enhances the heat dissipation performance and reduces the thermal resistance. Moreover, the coating thickness also influences the heat dissipation performance [40]. Therefore, applying the coating on the heat sink is significant in thermal management, especially for high-temperature electric and electronic devices.
The current study aims to investigate the effects of fin thickness on thermal performance and select the best nanocomposite coating method for the bus duct conductor’s heat sink. The first part of the study covers the thermal performance analysis, and the nanocomposite coating method selection is covered in the second part of the study. As far as the authors are aware, the study on the thermal performance and nanocomposite coating method selection for the bus duct conductor’s heat sink is still lacking and remains a research gap in the literature. The thermal performance is significantly impacted by the physical change in the heat sink and coating layer. As a result, different fin thicknesses in the heat sink of the bus duct conductor were taken into consideration in the first part of the current study. To ensure peak performance, the bus duct conductor’s housing was kept at a temperature of not more than 55 °C. To model and evaluate the bus duct conductor’s operational state, ANSYS FLUENT was used. An accurate numerical model was created and validated using the IEC 60439-1/2 experimental temperature readings. A more thermally effective bus duct conductor design would result from understanding the effects of geometry variations. In the second part of the study, the coating method was experimentally compared with various dispersion methods, including ultrasonic agitation, magnetic stirring, and argon gas agitation, to see which had the lowest contact resistance. The coated surface was examined using 3D atomic force microscopy (AFM) topography analysis, energy dispersive X-ray analysis (EDX), and field emission scanning electron microscopy (FESEM). The findings are expected to contribute a profound understanding of designing and selecting the best nanocomposite coating method for the industry’s bus duct conductor’s heat sink.

2. Materials and Methods

2.1. Mathematical Equations

In computational fluid dynamics, governing equations serve as a mathematical expression of the conservation laws of physics. The bus duct conductor’s surrounding convective heat transfer characteristics are obtained by solving these governing equations. Equation (1) describes the mass conservation equation. The rate of mass flux moving through the surface of a control volume is always equal to the rate of mass change inside that volume [29],
ρ u x + v y + w z = 0
where the fluid velocity V at any point is described by the local velocity components u, v, and w, which are functions of the point’s location as described by (x, y, z), and time (t) [40,41].
u t + u   u x + v u y + w u z = 1 ρ ρ x + v 2 u x 2 + v 2 u y 2 + v 2 u z 2  
v t + u   v x + v v y + w v z = 1 ρ ρ x + v 2 v x 2 + v 2 v y 2 + v 2 v z 2  
w t + u   w x + v w y + w w z = 1 ρ ρ x + v 2 w x 2 + v 2 w y 2 + v 2 w z 2  
The conservation of momentum in a fluid is described by the Navier-Stokes Equations (2)–(4), where v is the kinematic viscosity, and ρ is the fluid density [30,31,32,33].
The heat transfer rate from a surface at a particular temperature Ts to the surrounding medium at T is described by Newton’s law of cooling, as shown in Equation (5).
Q ˙ c o n v = h A s ( T s T )
where,
  • As = Heat transfer surface area
  • h = convection heat transfer coefficient
The fin equation can be created by taking into consideration a volume component of the extended surface (fin) with a length of Δ at a specific location x. The energy balance under steady-state conditions can be expressed as follows:
Q ˙ c o n d , x = Q ˙ c o n d , x + Δ x + Q ˙ c o n v
where,
Q ˙ c o n v = h p Δ x ( T T )
The result is obtained by substituting, dividing by Δx, and taking the limit of Δx as it approaches zero gives,
Q ˙ c o n d x + h p T s T = 0
Equation (8) produces the differential equation governing heat transfer in fins described in Equation (9) by substituting Fourier’s law into it.
x ( k A C T x ) h p T s T = 0
The conservation of energy is described in Equation (10). Local acceleration is indicated by the first term, whereas advection is indicated by the second, third, and fourth terms. The fifth, sixth, and seventh terms, where k is the thermal conductivity, and Cp is the specific heat capacity, describe the temperature flow of heat conduction.
T t + u   T x + v T y + w T z = k ρ C ^ p 2 T x 2 + k ρ C ^ p 2 T y 2 + k ρ C ^ p 2 T z 2

2.2. Computational and Experimental Method

2.2.1. Geometrical Model

In this study, the ANSYS FLUENT 2021R was used to numerically simulate the bus duct conductor. The design of the bus duct conductor and the geometry meshing make up the bulk of the pre-processing stage. After being created in ANSYS SpaceClaim, the geometry was imported into FLUENT for meshing. The pre-processing phase was completed, and the mesh geometry was then transferred to the FLUENT solution. The model was created using the experiment’s actual measurements of the AH Copper Bus Duct. Figure 1 shows the bus duct’s measurements and geometry.

2.2.2. Mesh Setup

Fluent Mesh was used to create mesh on the geometry, as shown in Figure 2. Poly-hexcore combines polyhedral elements with various meshes. The proximity size and curvature functions were enabled, and 0.0001473 m was set as a minimum surface mesh size with a growth rate of 1.2. Three boundary layers were included to enhance the fluid domain, each with a growth rate of 1.2 and a transition ratio of 0.272. Poly-hexcore cells with 0.0001473 m and 0.0047136 m as their minimum and maximum cell lengths filled the volume mesh, respectively. There were nearly 1.4 million elements in total.

2.2.3. Grid Independence Test

It is essential to run a grid independence test as part of any simulation study. This test demonstrates the simulation results are unaffected by grid elements. While a fine mesh might need more computational power, a coarse grid might produce inaccurate results. The best balance between the two aspects is thus determined by the grid independence test. The comparison of the independent results using the total heat transfer rate also reflected the conclusions of the numerical study.
The results of the grid independence test for various meshes are summarised in Table 1. A number of mesh sizes from coarse to fine were produced. With element sizes of 9.05 × 10⁵, 1.04 × 10⁶, 1.65 × 10⁶, 2.61 × 10⁶, and 3.64 × 10⁶ respectively, Mesh-A through Mesh-E were labeled as such. By contrasting each case with Case 5 (Mesh E), the discretization error was calculated. The outcomes showed Mesh D, with a 0.22% error, had the smallest discretization error. Until Mesh D, the overall heat transfer rate increased steadily, and the reading was nearly constant. This instance showed how to achieve grid independence and bring the discretization error down to a manageable level. As a result, Mesh D was chosen due to its accuracy and computing speed.

2.2.4. Boundary and Initial Conditions

The conductor, heat sink, and fluid domain are the three cell zones that make up the simulation model. Figure 3 shows the cell zones and boundary conditions. The heat sink is made of aluminum, which has an internal emissivity coefficient of 0.09 and a thermal conductivity of 202.4 W/mK. Additionally, the copper conductor’s thermal conductivity was also set at 387.6 W/mK, with its internal emissivity coefficient at 0.05. In the simulation domain, no forced convection mechanism was used; instead, the outlets were defined as 0 Pa (atmosphere pressure). The bus bar conductor was covered in an insulation layer made of polyester electric material. The copper conductor was covered in approximately 0.000125 mm-thin polyester electric with 0.14 W/mK thermal conductivity and 1.34 kJ/kg specific heat. In the fluid domain, the air was defined. The operating parameters were set to 30 °C, operating pressure of 101,325 Pa, and density of 1.225 kg/m3. An essential element of the simulation setup is the heat source. Because it involved heat and electricity, the thermal-electric analysis system was used to study the size of the heat source. For a single volumetric heat source, the heat loss of the bus bar (measured in Joules) was taken into account. Equations (11) and (12) were used to calculate the Joule losses.
P j o u l e = I 2 R
Q = P j o u l e V
R = ρ × L S
where,
  • Q = heat loss (W/m3)
  • V = volume of geometry (m3)
  • P = resistivity (kg⋅m3⋅s−3⋅A−2)
  • L = length (m)
  • S = cross-sectional area (m2)
  • R = electrical resistance (Ω)
The Joule losses are calculated as the sum of the electrical resistance for the conductor’s length times the current squared. The 1500 A current setting was used. Using a direct current to flow through the conductor and ignoring skin and proximity effects, a streamlined analytical calculation produced a Joule loss of 86,440.68 W/m3. Around 90,000 W/m3 of Joule loss was calculated by the ANSYS Thermal-Electric system, resulting in a 3.95% error.

2.2.5. Simulation Setup

The transient approach was taken into consideration because of the simulation’s significant temperature variations in the fluid domain. The mass contained within the domain determines how to simulate natural convection. A pressure-based solver and a realizable k-e model were used to predict the spreading rate of planar and spherical jets. With this model, better predictions of flows involving rotation and boundary layers subject to considerable pressure gradients, separation, and recirculation are more likely to be made. Both the fluid domain and the heat sink are involved in radiation heat transfer. The P1 radiation model was used in the simulation setup. It is appropriate for applications requiring large optical thicknesses and uses fewer computational resources.
The spatial discretization method used by the pressure-based solver, PRESTO!, is frequently used for natural convection, buoyancy-driven flows, and high Rayleigh number natural convection. To increase the accuracy of the results, the second-order upwind discrimination scheme was chosen to achieve higher-order accuracy at the cell faces. 9.81 m/s2 was chosen to enable gravitational acceleration in the positive-X direction. Using the standard initialization technique, the simulation’s starting temperature was set to 30 °C. In order to simulate heat transfer until steady-state with no temperature fluctuations on the heat sink, a time step size of 0.1 s and 20,000-time steps were selected. The flow chart for the current study’s simulation setup is shown in Figure 4.
Due to its reasonable calculation accuracy, low computing expense, and wide range of applications, the standard k-model is frequently used to apply flow calculations [42]. The model’s transport Equations (14) and (15) were derived from experimental data. The conventional k-Є model employs turbulence kinetic energy (k) and turbulence dissipation rate (Є). According to the k-epsilon model, the flow is entirely turbulent, and the influence of molecular viscosity is minimal.
    t ρ k + x i ρ k u i = x j µ + µ t σ k k x j + G k + G b ρ Є + S k + Y M
    t ρ Є + x i ρ Є u i = x j µ + µ t σ Є Є x j + C 1 Є Є k G k + C 3 Є G b C 2 Є Є 2 k ρ + S Є
The model constants are shown in Table 2.

2.2.6. Experimental Setup

The performance of a busbar trunking system (BTS) is assessed using the International Standard IEC 61439-6. This standard establishes one of the requirements for the temperature rise limit of various BTS components. The temperature rise limits can be confirmed using various techniques, such as an algebraic method or a laboratory test with current design guidelines. The laboratory test is performed in accordance with this standard’s comprehensive instructions. For instance, the ambient temperature during this test must range between 10 °C and 40 °C, with an average value of 35 °C over a 24-h period.
Most importantly, this chamber cannot have any forced airflow. Table 3 lists the temperature limits for the various BTS components. Once the ambient conditions of the lab have been reached, they must not be exceeded during the temperature rise.

2.2.7. Experimental Validation

Experimental Data

To ensure accuracy and robustness in any numerical investigation, the simulation setup must be validated using experimental data. Validation typically entails carrying out lab experiments while adhering to exact relevant standards related to the application of interest. The boundary conditions of the numerical model must be as close to those of the experimental setup as possible (Figure 5). Performance indicators between the numerical and experimental setups should differ as little as possible, with an average error of less than 10% [43]. The temperature at the end of the thermal heat sink served as the study’s main performance indicator. The temperature was measured using K-type thermocouples. Each bus duct conductor component’s temperature rise is shown in Figure 6. The casing’s highest recorded temperature was 84.8 °C.

Comparison between Experimental and Simulation Temperature Results

The fin tip temperature determined by the numerical solution reaches a steady-state value of 78.01 °C after 33.33 min. This demonstrates that the difference between the simulation and experimental data was quite small, at only 4.27%. This outcome demonstrated the current simulation is appropriate for expanding the investigation of the fin thickness effect and is capable of precisely predicting the thermal properties of the bus duct conductor. The simulation model calculated a total heat transfer rate of 1.937 W and a net convective surface heat transfer coefficient of 3.604 W/m2 K.

2.3. Fin Effectiveness and Fin Efficiency

2.3.1. Fin Effectiveness and Efficiency

Fin effectiveness is defined in Equation (6) as the simple ratio of the actual heat transfer rate from a fin to a surface without one. Engineers can assess a surface’s effectiveness by contrasting it with surfaces that have attached fins and surfaces that do not. Fin efficiency is a metric used to assess a thermal fin’s performance, as shown by Equations (14) and (15). To determine the maximum heat transfer rate, it is necessary to make the assumption that the base temperature of the entire fin surface is kept constant. Utilizing low-density and high-thermal conductivity materials can increase the effectiveness of fins.
Aluminum is thus frequently chosen as the material for thermal fin design. When the P/A ratio is high, thin fins offer excellent thermal performance and reduce the heat transfer coefficient. This shows that thermal fins operate more effectively in a gas than in a liquid. The effectiveness of thermal fins on electronic devices should be greater than 1 because doing so increases manufacturing costs. The effectiveness of thermal fins is typically greater than 2, whereas high-performance fins typically have an effectiveness greater than 5.
The efficiency of the fins is increased by using this material’s high thermal conductivity, and the P/A ratio and convective heat coefficient should be low. Fin effectiveness must fall between 0 and 1. Fin applications with values between 0.9 and 0.95 are the most effective. When designing a thermal fin, fin effectiveness and efficiency are two important design considerations [35]. Designers need to look into the best possible design to balance these factors.
η ε = q with   fin q without   fin
η f = q   fin q   max

2.3.2. Fin Effectiveness

Without thermal fins, the average temperature measured from the bus duct housing was 92.45 °C. However, as was already mentioned, the bus duct housing’s temperature with thermal fins is 79.97 °C. Unmistakably showing that thermal fins effectively lower the bus duct housing’s average temperature is a significant temperature difference of 5.33%. Without fins, the bus duct housing had a heat transfer rate of 1.7511 W. The original bus duct housing’s fin effectiveness was determined to be 1.055 using Equation (14).

2.3.3. Fin Efficiency

In order to calculate the effectiveness of thermal fins, Equation (15) was used. The thermal conductivity of the aluminum housing was set to infinite. The maximum heat transfer rate from the bus duct housing was discovered by simulating this circumstance. There was no temperature rise, as evidenced by the bus duct housing’s constant internal temperature. The maximum rate of overall heat transfer was 2.28058 W. The fin efficiency of the current geometry is 0.81 as a result.

2.4. Dispersion of AgNP (Silver Nanoparticles) in Sn Plating Bath

Three dispersion methods on the AgNP nanoparticle were considered in the current study. The coating parameters of AgNP on the Sn plate were set for all methods (ultrasonic agitation, magnetic stirring, and argon gas agitation). The experimental setup for each dispersion method is shown in Figure 7. Table 4 summarizes the parameters used in the experiments. The AgNP used in this study was nano-sized (10 nm and 100 nm).

3. Discussion

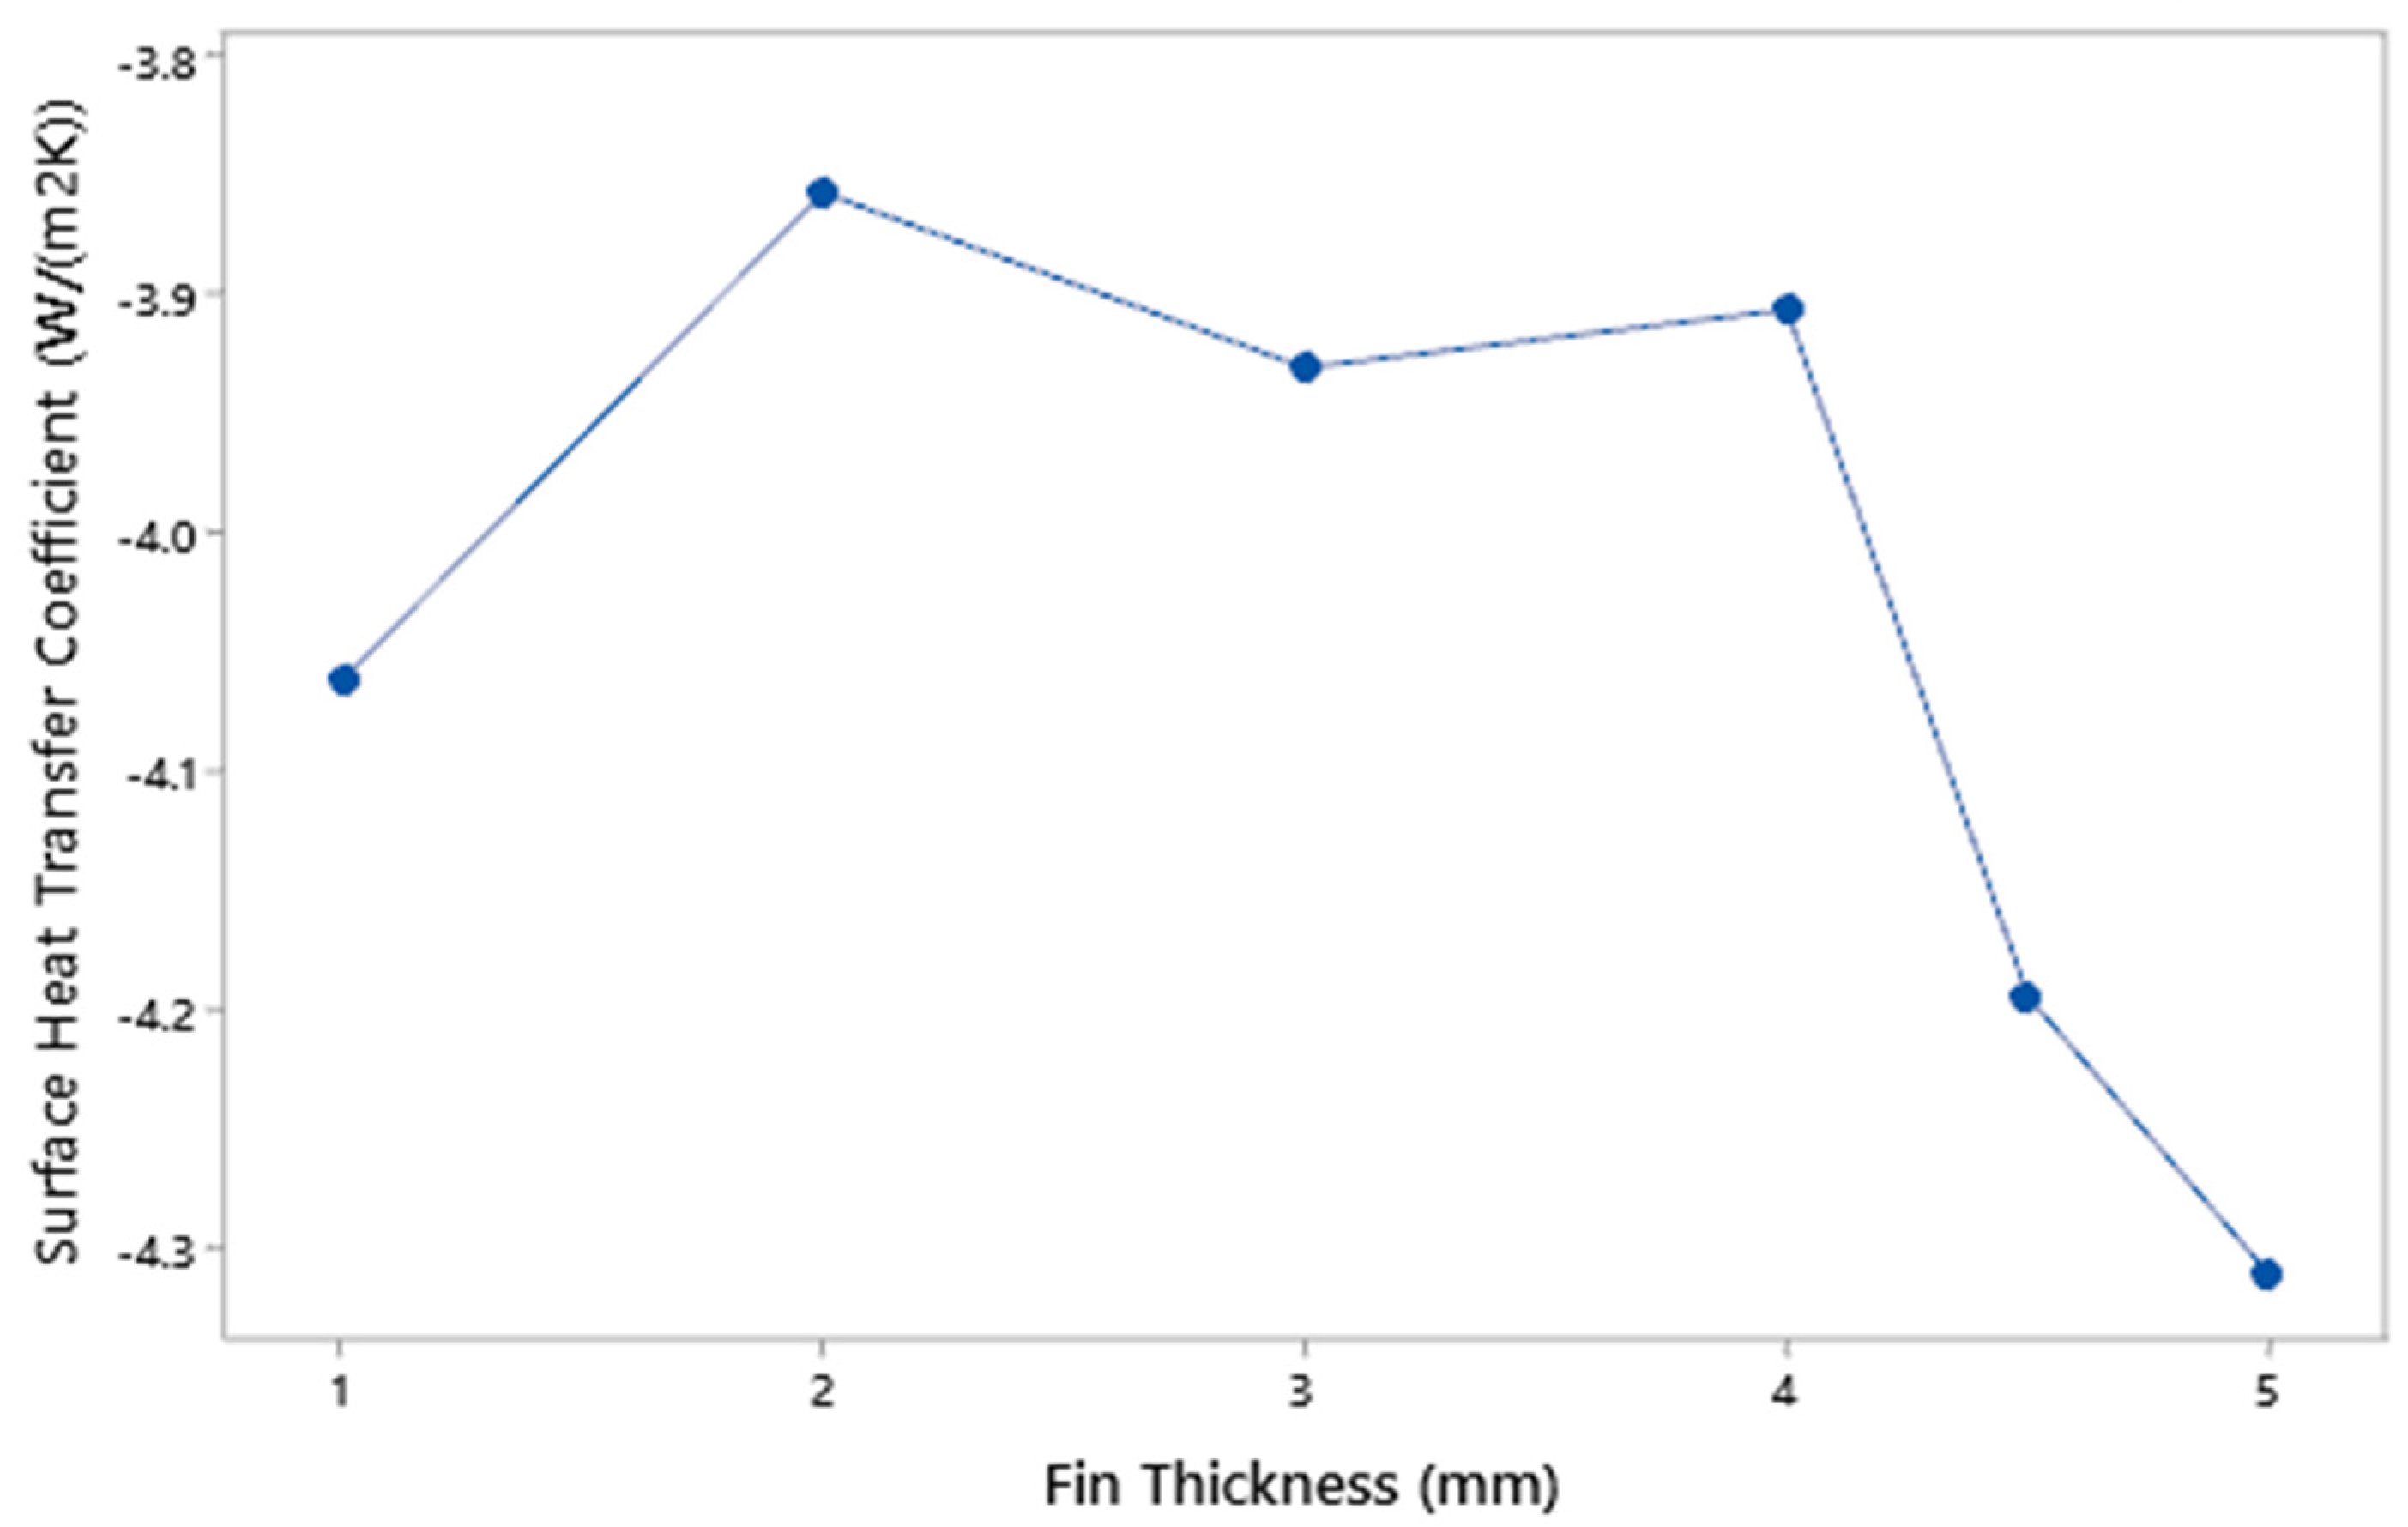
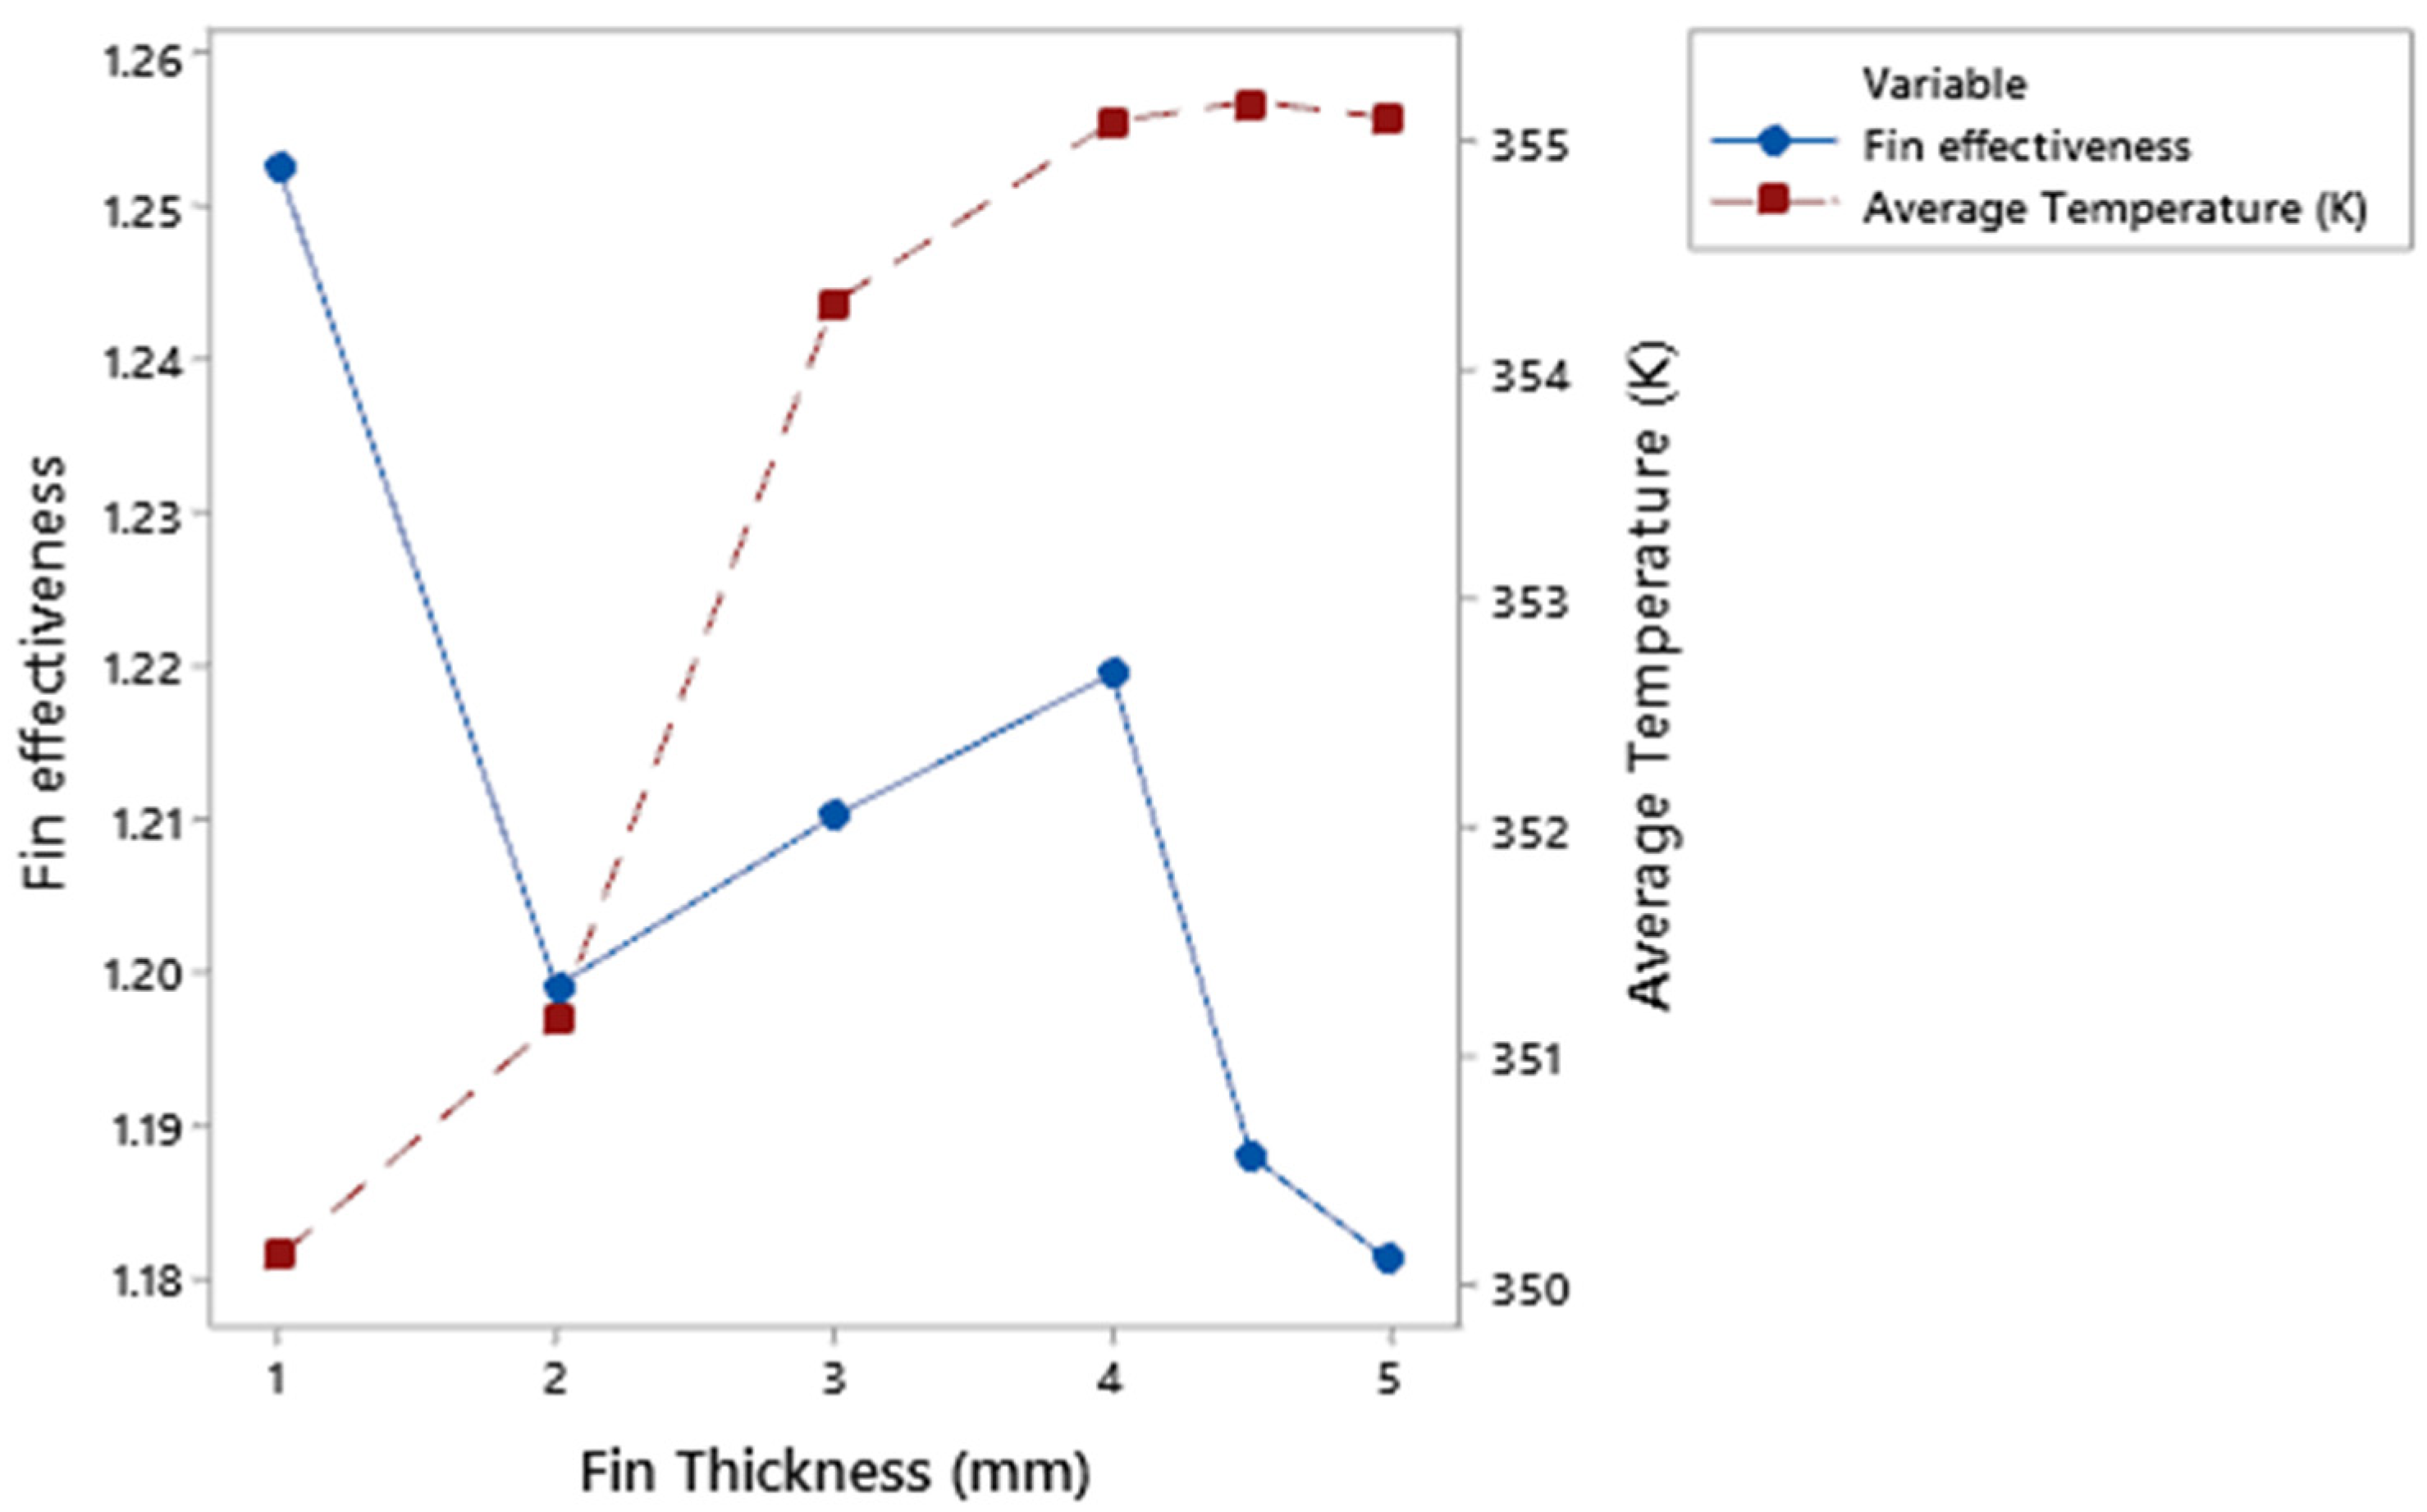
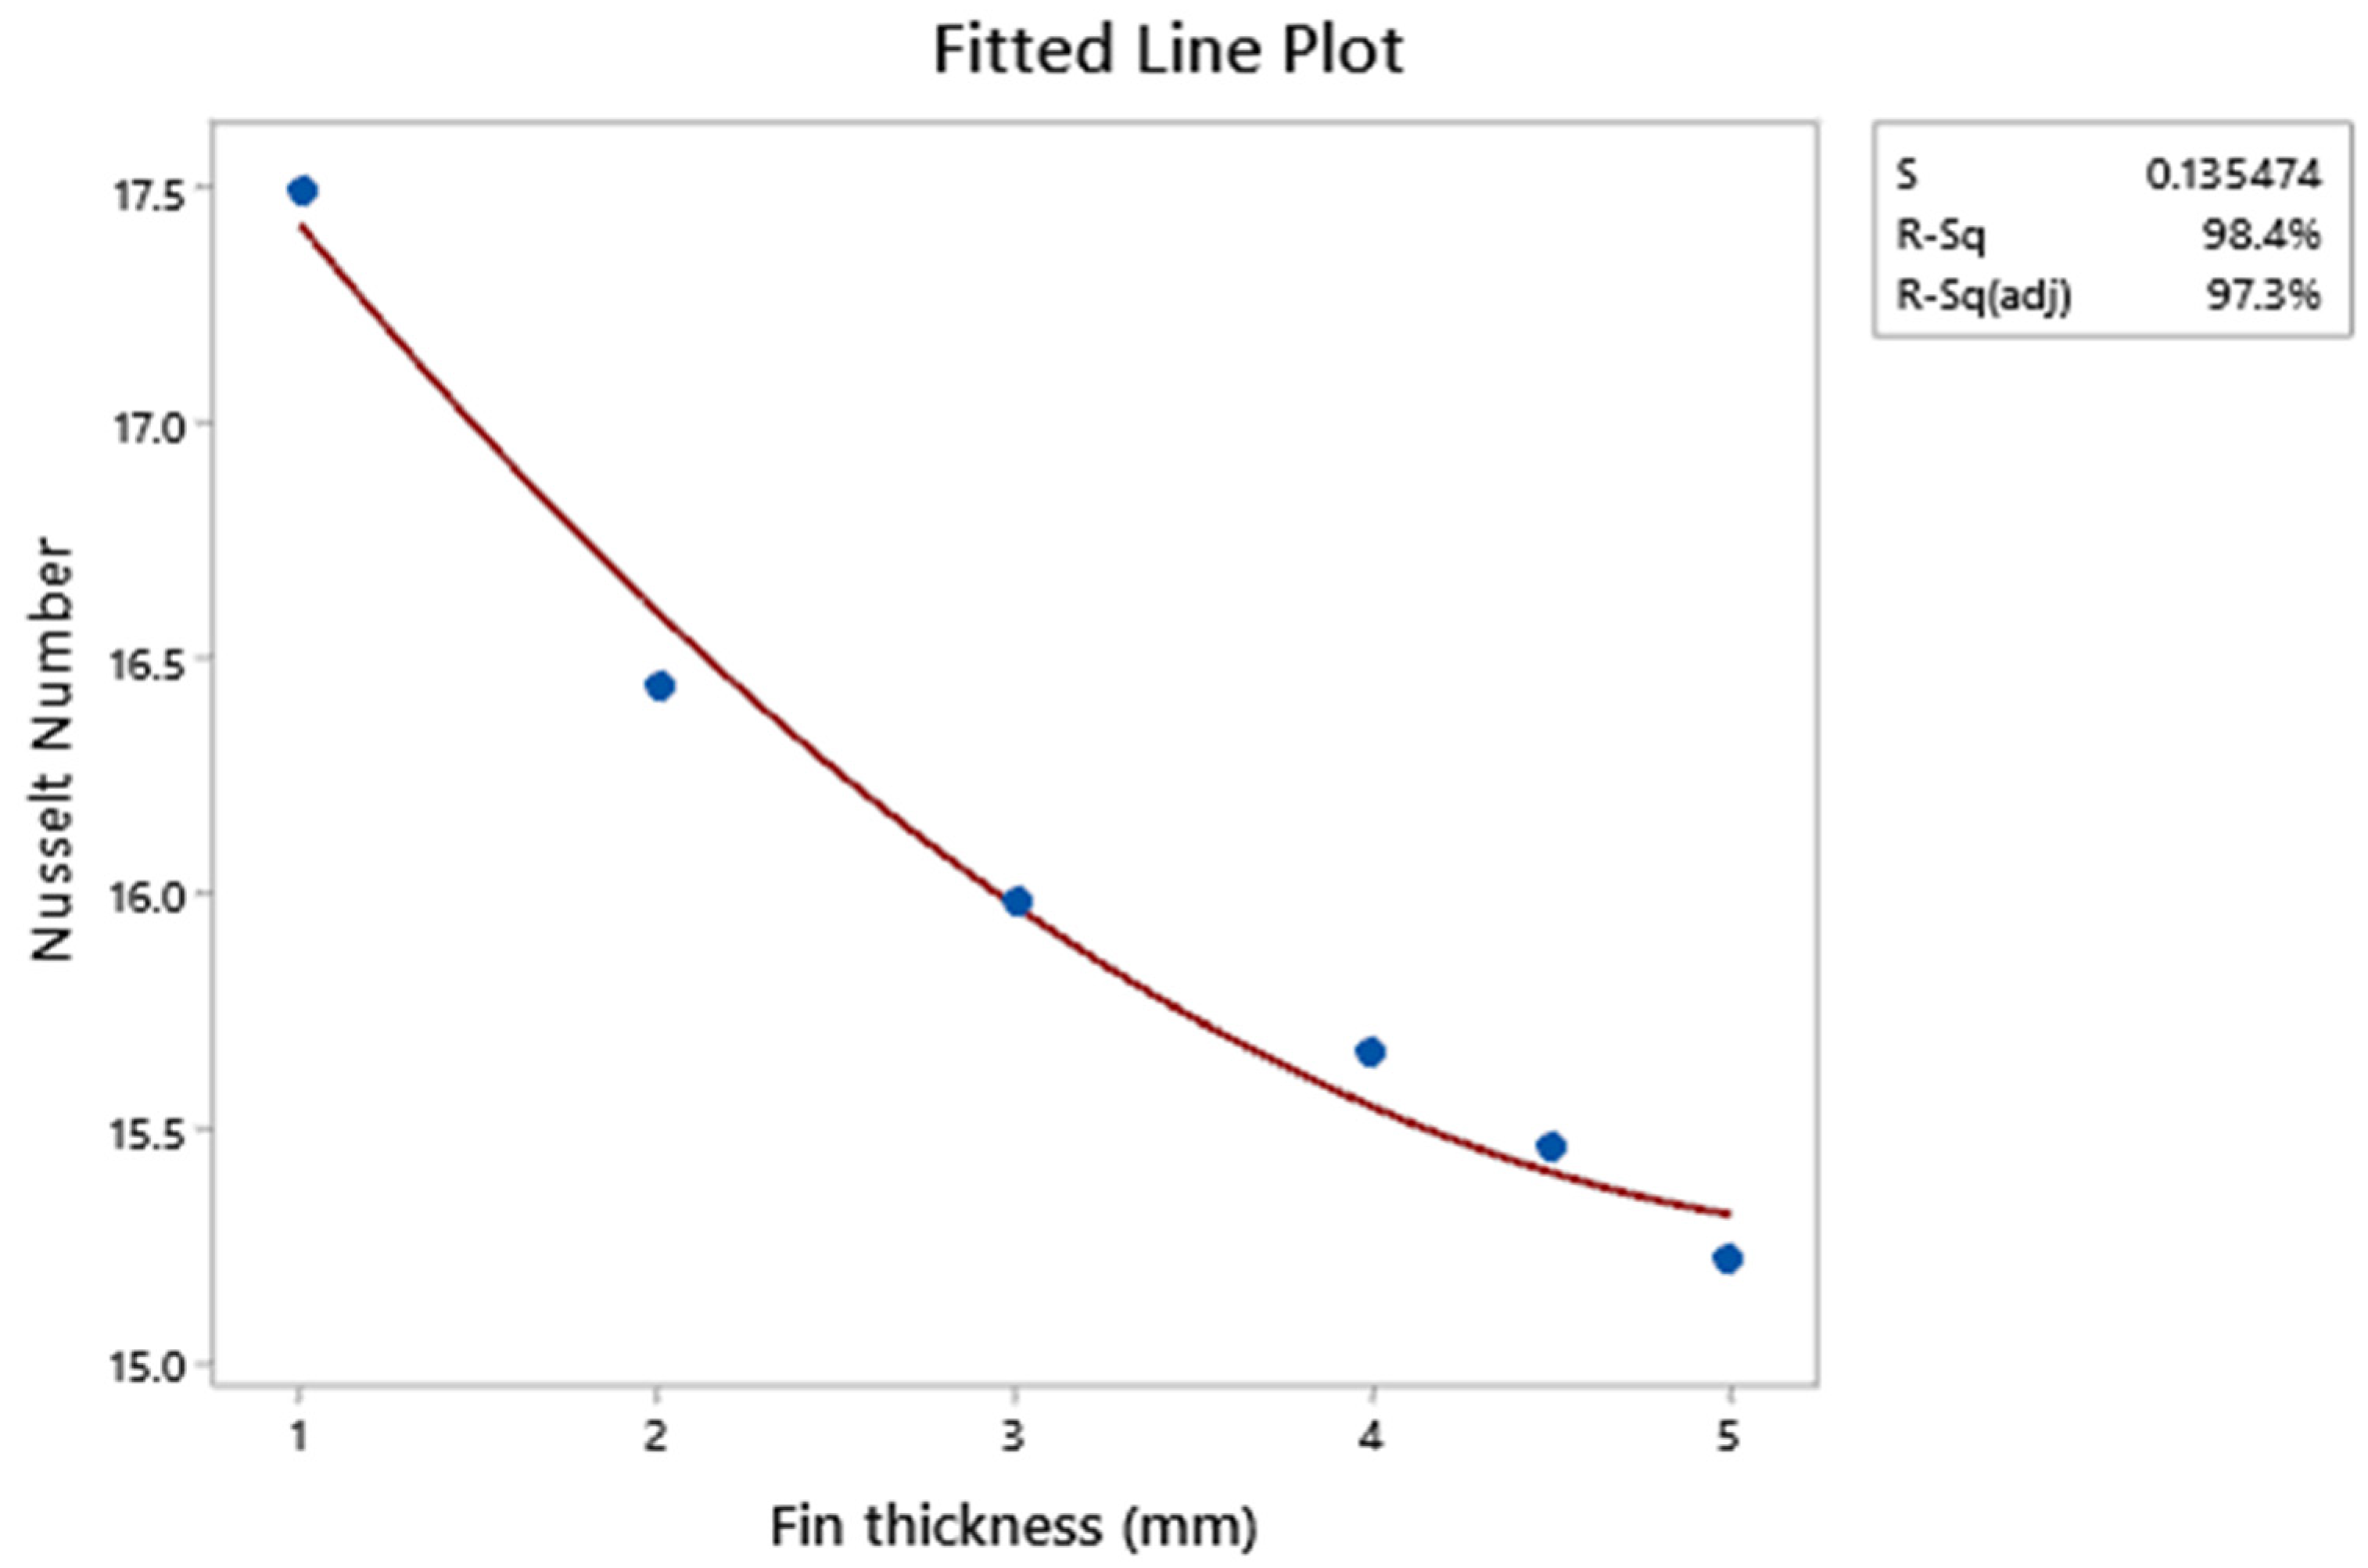
3.1. Fin Thickness (sn) Variation

To examine the effects of fin thickness variation, five sizes of the fin (s1 = 1.0 mm, s2 = 3.0 mm, s3 = 4.0 mm, s4 = 4.5 mm, and s5 = 5 mm) were used (Figure 8). In terms of thermal performance, thinner fins were predicted to perform better than thicker fins. The total heat sink fin count decreased as fin thickness rose from 1 mm to 5 mm. As a result, less surface area was exposed to the fluid around it overall. However, more cross-sectional area was present at the base of each thermal fin (Figure 9 and Figure 10).
The surface area exposed to the fluid region did not decrease noticeably when the fin thickness was increased from 1 mm to 3 mm compared to when the fin thickness was increased from 4 mm to 5 mm. As the fin thickness increased, two crucial physical changes were noticed: (i) the total surface area exposed to the fluid region and (ii) the cross-sectional area of the thermal fin base. These two physical modifications were the primary causes of the thermal performance variations.
The absolute thermal resistance of a single fin decreased as fin thickness increased (Figure 11), as the temperature difference between the fin’s base and tip increased (Figure 12). As a result, the heat flux increased from the base to the tip of each fin (Figure 13). The formulae of Equations (16) and (17) were used to calculate the thermal resistance and heat flux at the fin base.
R = L A K
q = K T x x
where,
  • ∅q = heat flux.
According to International Standard IEC 61439-6, the average temperature of the aluminum casing is the primary indicator of a bus duct system’s thermal performance. The average surface temperature of the casing rose as the fin thickness increased (Figure 10), suggesting that thicker fins perform less well thermally as a heat sink. This conclusion was supported by the Nusselt number, surface heat transfer coefficient (CTE), and fin effectiveness, as shown in Figure 14, Figure 15 and Figure 16. The findings showed that fins with a thickness of 5 mm have the lowest Nusselt number, surface CTE, and fin effectiveness.
The main heat transfer method from the bus bar casing to its surroundings is convective heat transfer. Convective heat transfer is influenced by a bus bar’s exposed surface area, the temperature difference between its surface and the fluid at a bulk temperature, the fluid’s velocity, and the heat flux. The effectiveness of convective heat transfer from the surface of the bus duct casing was assessed using the Nusselt number. The ratio of convection to conduction heat transfer across a fluid layer of thickness L is known as the Nusselt number (Nu).
Better convective heat transfer is indicated by a higher Nusselt number. The Nusselt number in this study ranged from 15.2 to 17.5. The highest Nu was produced by the 1 mm fin thickness (17.5). A higher Nu is found in thinner fins than thicker fins (Figure 14). This can be explained by the fact that thinner fins have a higher average convective heat transfer coefficient (Figure 15).
Air is an inefficient thermal conductor. The convective coefficient is affected by the thickness of the boundary layer of stagnant air molecules. These molecules are very similar to the air layer that acts as a blanket to insulate the fin surfaces, causing a choking effect. As a result, the metal effectively retains the heat, preventing efficient convective heat transfer. Table 5 displays the velocity contour of the fluid flow regime next to heat sinks with varying fin thicknesses.
According to the simulation, reducing the thickness of the fins enhances and improves the fluid flow regime around the fins. As the fins thin, the fluid flow adjacent to them develops from the tip to the base. This phenomenon demonstrates an improved heat dissipation mechanism in the surrounding environment. The flow’s "chimney effect" may increase the rate at which warm air is removed from the surface of the heat sink and replaced with cooler air.
In regression analysis, the regressor variable was fin thickness (Ft), and the response variable was Nusselt number (Fe). The coefficient of determination was 0.98, indicating a quadratic relationship between fin thickness and Nusselt number (Figure 17). Furthermore, Figure 18 shows the Nusselt number from the regression and simulation. The upper and lower limits (+/−1%) indicate the highest and lowest Nusselt number obtained from this study when the fin thickness varied from 1 mm to 5 mm. The Nusselt number can be estimated using Equation (18) within 1 mm to 5 mm fin thickness.
Nu = 18.44 − 1.120Ft + 0.09901(Ft)2

3.2. Analysis of Coated Sn-Plated Copper Substrate

The coated Sn-plated copper substrates were analyzed under different tests. Figure 19 shows the coating thickness on the selected substrates. Ultrasonic agitation and magnetic stirring produced a sample with the required thickness, and no exposed copper was observed. The gas agitation method achieved the required coating for Sn-plated Cu substrate sample when the same parameter was applied for 10 nm and 100 nm AgNP-Sn plating. However, the coating could not meet the thickness specification. This situation is attributed to the current decreasing during the gas agitation electroplating, thereby interrupting the ion charge movement in the plating bath.
The presence of Argentum (Ag) on the Sn-plated copper substrate demonstrated that nanoparticles of AgNP were successfully coated on the substrate surface. Table 6 summarizes the Ag wt% and average resistance for the coating experiments with different dispersion methods. The ultrasonic agitation method shows a higher Ag for cases 3–8. The increase in nanoparticle volume (from 1 mL to 3 mL) raises the Ag percentage. However, the size of the nanoparticles slightly influenced the Ag percentage when a similar volume was used in the experiment. In contrast, using a magnetic stirring method, the Ag percentage yielded a meager Ag percentage detected in the X-ray diffraction (XRD) results. The Ag percentage was not detected on the substrate surface when using argon gas agitation. In addition, the ultrasonic agitation-coated substrates have a lower average resistance than the gas agitation method. This result indicated that Ag’s presence reduces the copper substrate’s electrical resistance, reducing heat resistance [44,45]. The average resistance versus the weighted percentage of AgNP is plotted in Figure 20. Electrical resistance corresponds to thermal resistance. Thermal resistance is the ability of a material or object to resist the flow of heat and a temperature difference measurement. This property is crucial for the heat sink to ensure excellent heat dissipation and control the temperature of electrical and electronic devices. Higher thermal resistance blocked the heat flow through the metal, resulting in poor heat dissipation. Lower resistance is preferable to allow the heat to flow easily and dissipate from the heat source. Thus, the lowest average resistance was achieved using 2 mL 10 nm AgNP in the ultrasonic agitation coating process. A similar ultrasonic agitation process with 2 mL 10 nm AgNP was repeated in another 30 samples. The average resistance is 8.8 μΩ.
Some etching methods trials have revealed the distribution of the Ag dispersion (Figure 21). Elemental analysis can be performed on regions as small as a few nanometers when EDXA and electron microscopes are used together. The effect of the electron beam on the surface and its penetration into the particle’s depth produces X-rays which are defining features of the elements on and near the sample’s surface [46]. The EDX area scanning showed the presence of Ag in the area shown in samples #1 to #30. The EDX spectra of selected samples #1, #6, and #30 are shown in Figure 22. However, the Ag distribution is not visible because the Ag was embedded within the Sn matrix (Figure 21a–c). In addition, the 3D atomic force microscopy (AFM) topography evaluated the average roughness (Ra), and root means square (RMS) roughness of the coated sample (Figure 21d–f). A long ridge along the middle of Sample #15 may contribute to a high contact resistance value (10 μΩ) because the gap reduces the active contact area for current flow.

4. Conclusions

The influence of fin thickness variation and the nanocomposite coating selection was successfully studied. The experiment and simulation considered fin thickness sizes of s1 = 1.0 mm, s2 = 3 mm, s3 = 4.0 mm, s4 = 4.5 mm, and s5 = 5 mm. The best fin thickness size was s1 = 1 mm, which outperformed the other fin thicknesses in thermal performance with 1.254 fin effectiveness and 1.862 W of total heat transfer rate. The findings revealed that the average surface area reduces as the fin thickness increases. The Nusselt number for 1 mm fin thickness was 17.5. The results found that the Nusselt number drops quadratically until 15.2 when fin thickness increases. In addition, the reduced fin thickness enhanced the fluid flow near the fins. The “chimney effect” accelerates the warm air removal from the heat sink and replaces it with cooler air. This phenomenon indicates that heat dissipates more effectively into the surrounding region. Moreover, the ultrasonic agitation coating method yields the lowest average resistance (8.8 μΩ) and a better percentage of Ag on the substrate surface (0.6%–2.5%) than other methods. This finding indicated the successful coatings on the bus duct conductor’s heat sink. Therefore, the current results are expected to provide insight and be useful as a reference for the engineer and researcher in understanding the heat sink of the bus duct conductor.

Author Contributions

Writing original draft preparation: M.S.; Writing review and editing: M.S.A.A., D.-P.B.-N., P.V. and A.V.S.; Supervision: M.A.A.M.S. and N.M.S.; Funding acquisition: H.P.O.; Formal analysis: C.Y.K.; Conceptualization: M.R.R.M.A.Z., validation D.-P.B.-N. and A.V.S.; funds P.V. All authors have read and agreed to the published version of the manuscript.

Funding

The work is supported under Ministry of Higher Education under Fundamental Research Grant Scheme, FRGS (grant number FRGS/1/2020/TK0/USM/03/6).

Institutional Review Board Statement

Not applicable.

Informed Consent Statement

The informed consent was obtained from all individual participants included in the study.

Data Availability Statement

Not applicable.

Acknowledgments

The authors would also like to thank Universiti Sains Malaysia, Collaborative Research in Engineering, Science and Technology (CREST) and Gheorghe Asachi Technical University of Iasi (TUIASI) from the University Scientific Research Fund (FCSU) for providing technical support.

Conflicts of Interest

The authors declare no competing interest.

References

  1. Thirumurugaveerakumar, S.; Sakthivel, M.; Valarmath, S. Experimental and analytical study on the bus duct system for the prediction of temperature variations due to the fluctuation of load. J. Electr. Eng. Technol. 2014, 9, 2036–2041. [Google Scholar] [CrossRef] [Green Version]
  2. Dhaiban, H.T.; Hussein, M.A. The optimal design of heat sinks: A review. J. Appl. Comput. Mech. 2020, 6, 1030–1043. [Google Scholar] [CrossRef]
  3. Hoi, S.M.; The, A.L.; Ooi, E.H.; Chew, I.M.L.; Foo, J.J. Plate-fin heat sink forced convective heat transfer augmentation with a fractal insert. Int. J. Therm. Sci. 2019, 142, 392–406. [Google Scholar] [CrossRef]
  4. Dake, T.J.; Majdalani, J. Improving flow circulation in heat sinks using quadrupole vortices. In Proceedings of the ASME InterPack Conference, Beijing, China, 10–13 August 2009; Volume 2, pp. 463–470. [Google Scholar] [CrossRef] [Green Version]
  5. Wu, X.; Lin, Z.M.; Liu, S.; Su, M.; Wang, L.C.; Wang, L.B. Experimental study on the effects of fin pitches and tube diameters on the heat transfer and fluid flow characteristics of a fin punched with curved delta-winglet vortex generators. Appl. Therm. Eng. 2017, 119, 560–572. [Google Scholar] [CrossRef]
  6. Song, K.W.; Xi, Z.P.; Su, M.; Wang, L.C.; Wu, X.; Wang, L.B. Effect of geometric size of curved delta winglet vortex generators and tube pitch on heat transfer characteristics of fin-tube heat exchanger. Exp. Therm. Fluid Sci. 2017, 82, 8–18. [Google Scholar] [CrossRef]
  7. Vorayos, N.; Katkhaw, N.; Kiatsiriroat, T.; Nuntaphan, A. Heat transfer behavior of flat plate having spherical dimpled surfaces. Case Stud. Therm. Eng. 2016, 8, 370–377. [Google Scholar] [CrossRef] [Green Version]
  8. Lee, J.S.; Yoon, S.Y.; Kim, B.; Lee, H.; Ha, M.Y.; Min, J.K. A topology optimization based design of a liquid-cooled heat sink with cylindrical pin fins having varying pitch. Int. J. Heat Mass Transf. 2021, 172, 121172. [Google Scholar] [CrossRef]
  9. Culham, J.R.; Muzychka, Y.S. Optimization of plate fin heat sinks using entropy generation minimization. IEEE Trans. Compon. Packag. Technol. 2001, 24, 159–165. [Google Scholar] [CrossRef]
  10. Tari, I.; Mehrtash, M. Natural convection heat transfer from horizontal and slightly inclined plate-fin heat sinks. Appl. Therm. Eng. 2013, 61, 728–736. [Google Scholar] [CrossRef]
  11. Sparrow, E.M.; Vemuri, S.B. Orientation effects on natural convection/radiation heat transfer from pin-fin arrays. Int. J. Heat Mass Transf. 1986, 29, 359–368. [Google Scholar] [CrossRef]
  12. Jang, D.; Park, S.J.; Yook, S.J.; Lee, K.S. The orientation effect for cylindrical heat sinks with application to LED light bulbs. Int. J. Heat Mass Transf. 2014, 71, 496–502. [Google Scholar] [CrossRef]
  13. Effendi, N.S.; Kim, K.J. Orientation effects on natural convective performance of hybrid fin heat sinks. Appl. Therm. Eng. 2017, 123, 527–536. [Google Scholar] [CrossRef]
  14. Prajapati, Y.K. Influence of fin height on heat transfer and fluid flow characteristics of rectangular microchannel heat sink. Int. J. Heat Mass Transf. 2019, 137, 1041–1052. [Google Scholar] [CrossRef]
  15. Bhandari, P.; Prajapati, Y.K. Thermal performance of open microchannel heat sink with variable pin fin height. Int. J. Therm. Sci. 2021, 159, 106609. [Google Scholar] [CrossRef]
  16. Aldoori, W.H. The effect of fin height on forced convection heat transfer from rectangular fin array. Mater. Today Proc. 2021, 1–8. [Google Scholar] [CrossRef]
  17. Rahmani, E.; Moradi, T.; Fattahi, A.; Delpisheh, M.; Karimi, N.; Ommi, F.; Saboohi, Z. Numerical simulation of a solar air heater equipped with wavy and raccoon-shaped fins: The effect of fins’ height. Sustain. Energy Technol. Assess. 2021, 45, 101227. [Google Scholar] [CrossRef]
  18. Sertkaya, A.A.; Ozdemir, M.; Canli, E. Effects of pin fin height, spacing and orientation to natural convection heat transfer for inline pin fin and plate heat sinks by experimental investigation. Int. J. Heat Mass Transf. 2021, 177, 121527. [Google Scholar] [CrossRef]
  19. Lee, Y.J.; Kim, S.J. Thermal optimization of the pin-fin heat sink with variable fin density cooled by natural convection. Appl. Therm. Eng. 2021, 190, 116692. [Google Scholar] [CrossRef]
  20. Huang, X.; Shi, C.; Zhou, J.; Lu, X.; Xu, G. Performance analysis and design optimization of heat pipe sink with a variable height fin array under natural convection. Appl. Therm. Eng. 2019, 159, 113939. [Google Scholar] [CrossRef]
  21. Liu, S.; Huang, Y.; Wang, J. International Journal of Thermal Sciences Theoretical and numerical investigation on the fin effectiveness and the fin efficiency of printed circuit heat exchanger with straight channels. Int. J. Therm. Sci. 2018, 132, 558–566. [Google Scholar] [CrossRef]
  22. Kobus, C.J.; Oshio, T. Development of a theoretical model for predicting the thermal performance characteristics of a vertical pin-fin array heat sink under combined forced and natural convection with impinging flow. Int. J. Heat Mass Transf. 2005, 48, 1053–1063. [Google Scholar] [CrossRef]
  23. Freegah, B.; Hussain, A.A.; Falih, A.H.; Towsyfyan, H. CFD analysis of heat transfer enhancement in plate-fin heat sinks with fillet profile: Investigation of new designs. Therm. Sci. Eng. Prog. 2020, 17, 100458. [Google Scholar] [CrossRef]
  24. Bahiraei, M.; Heshmatian, S. Thermal performance and second law characteristics of two new microchannel heat sinks operated with hybrid nano fl uid containing graphene–silver nanoparticles. Energy Convers. Manag. 2018, 168, 357–370. [Google Scholar] [CrossRef]
  25. Hussain, A.A.; Freegah, B.; Khalaf, B.S.; Towsyfyan, H. Numerical investigation of heat transfer enhancement in plate-fin heat sinks: Effect of flow direction and fillet profile. Case Stud. Therm. Eng. 2019, 13, 100388. [Google Scholar] [CrossRef]
  26. Duan, Z.; Muzychka, Y.S. Pressure drop of impingement air cooled plate fin heat sinks. J. Electron. Packag. 2007, 129, 190–194. [Google Scholar] [CrossRef] [Green Version]
  27. Wong, K.C.; Indran, S. Impingement heat transfer of a plate fin heat sink with fillet profile. Int. J. Heat Mass Transf. 2013, 65, 1–9. [Google Scholar] [CrossRef]
  28. Li, H.Y.; Chen, K.Y. Thermal performance of plate-fin heat sinks under confined impinging jet conditions. Int. J. Heat Mass Transf. 2007, 50, 1963–1970. [Google Scholar] [CrossRef]
  29. Aziz, M.S.A.; Abdullah, M.Z.; Khor, C.Y.; Jalar, A.; Ani, F.C. CFD modeling of pin shape effects on capillary flow during wave soldering. Int. J. Heat Mass Transf. 2014, 72, 400–410. [Google Scholar] [CrossRef]
  30. Aziz, M.S.A.; Abdullah, M.Z.; Khor, C.Y.; Ani, F.C. Influence of pin offset in PCB through-hole during wave soldering process: CFD modeling approach. Int. Commun. Heat Mass Transf. 2013, 48, 116–123. [Google Scholar] [CrossRef]
  31. Aziz, M.S.A.; Abdullah, M.Z.; Khor, C.Y.; Jalar, A.; Ani, F.C.; Yan, N.; Cheok, C. Finite volume-based simulation of the wave soldering process: Influence of the conveyor angle on pin-through-hole capillary flow. Numer. Heat Transf. Part A Appl. 2016, 69, 295–310. [Google Scholar] [CrossRef]
  32. Rusdi, M.S.; Abdullah, M.Z.; Ishak, M.H.H.; Aziz, M.S.A.; Abdullah, M.K.; Rethinasamy, P. Three-dimensional CFD simulation of the stencil printing performance of solder paste. Int. J. Adv. Manuf. Technol. 2020, 108, 3351–3359. [Google Scholar] [CrossRef]
  33. Ishak, M.H.H.; Aziz, M.S.A.; Ismail, F.; Khor, C.Y.; Abdullah, M.Z.; Abas, M.A. Effect of filing level and fillet profile on pin-through hole solder joint. Int. J. Adv. Manuf. Technol. 2019, 102, 1467–1485. [Google Scholar] [CrossRef]
  34. Delgado, F.; Renedo, C.J.; Ortiz, A.; Fernández, I.; Santisteban, A. 3D thermal model and experimental validation of a low voltage three-phase busduct. Appl. Therm. Eng. 2017, 110, 1643–1652. [Google Scholar] [CrossRef] [Green Version]
  35. Zu, H.; Dai, W.; Li, Y.; Li, K.; Li, J. Analysis of enhanced heat transfer on a passive heat sink with high-emissivity coating. Int. J. Therm. Sci. 2021, 166, 106971. [Google Scholar] [CrossRef]
  36. Kim, D.; Lee, J.; Kim, J.; Choi, C.H.; Chung, W. Enhancement of heat dissipation of LED module with cupric-oxide composite coating on aluminum-alloy heat sink. Energy Convers. Manag. 2015, 106, 958–963. [Google Scholar] [CrossRef]
  37. Yildiz, O.; Lubna, M.M.; Ramesh, V.P.; Ozturk, M.; Bradford, P.D. Microporous vertically aligned CNT nanocomposites with tunable properties for use in flexible heat sinks. J. Sci. Adv. Mater. Devices 2022, 7, 100509. [Google Scholar] [CrossRef]
  38. Sainudeen, S.S.; Joseph, A.; Joseph, M.; Sajith, V. Heat transfer phenomena of copper-graphene nanocomposite coated aluminium heat spreaders: An interferometric study. Appl. Therm. Eng. 2022, 212, 118545. [Google Scholar] [CrossRef]
  39. Paramparambath, S.; Maurya, M.R.; Houkan, M.T.; Cabibihan, J.J.; Sadasivuni, K.K. Improvement of heat sink performance using paraffin/graphite/hydrogel phase change composite coating. Case Stud. Therm. Eng. 2022, 9, 102470. [Google Scholar] [CrossRef]
  40. Selvan, M.; Aziz, M.S.A.; Yu, K.H.; Nurulakmal, M.; Ong, H.; Khor, C. A study on the effect of fin pitch variation on the thermal performance of a bus duct conductor. Int. J. Therm. Sci. 2023, 184, 107938. [Google Scholar] [CrossRef]
  41. Selvan, M.; Aziz, M.S.A.; Nurulakmal, M.S.; Ong, H.P.; Khor, C.Y. Numerical study on the effect of fin length variation on the thermal performance of a bus duct conductor. Numer. Heat Transf. Part A Appl. 2022, 83, 116–133. [Google Scholar] [CrossRef]
  42. Standard k-ε Model. Available online: https://www.afs.enea.it/project/neptunius/docs/fluent/html/th/node58.htm (accessed on 10 October 2022).
  43. Zhang, Z.; Zhang, W.; Zhai, Z.J.; Chen, Q.Y. Evaluation of various turbulence models in predicting airflow and turbulence in enclosed environments by CFD: Part 2—Comparison with experimental data from literature. HVAC R Res. 2007, 13, 871–886. [Google Scholar] [CrossRef]
  44. Yu, H.; Li, L.; Zhang, Y. Silver nanoparticle-based thermal interface materials with ultra-low thermal resistance for power electronics applications. Scr. Mater. 2012, 66, 931–934. [Google Scholar] [CrossRef]
  45. Coetzee, D.; Venkataraman, M.; Militky, J.; Petru, M. Influence of Nanoparticles on Thermal and Electrical Conductivity of Composites. Polymers 2020, 12, 742. [Google Scholar] [CrossRef] [PubMed] [Green Version]
  46. Welker, R.W. Size Analysis and Identification of Particles; William Andrew Publishing: Norwich, NY, USA, 2011; pp. 179–213. [Google Scholar] [CrossRef]
Figure 1. Detailed dimension and geometrical setup of bus duct conductor.
Coatings 13 00012 g001
Figure 2. Mesh grid of the model and detail of three boundary layers around the heat sink.
Coatings 13 00012 g002
Figure 3. Boundary Conditions.
Coatings 13 00012 g003
Figure 4. Simulation setup flowchart.
Coatings 13 00012 g004
Figure 5. (a) Experimental setup with the surrounding air temperature measured with a K-Type thermocouple 1 m from the casing (b) Schematic diagram of the bus duct conductor and setup.
Coatings 13 00012 g005aCoatings 13 00012 g005b
Figure 6. The temperature rise at bus duct conductor parts.
Coatings 13 00012 g006
Figure 7. The experimental setup for three dispersion methods: (a) Ultrasonic agitation (b) magnetic agitation (c) Argon gas agitation.
Coatings 13 00012 g007
Figure 8. (a) Fin thickness of bus duct conductor casing heat sink (b) Thermal resistance network.
Coatings 13 00012 g008aCoatings 13 00012 g008b
Figure 9. Contour Plot of Temperature vs. No of fins, Fin thickness.
Coatings 13 00012 g009
Figure 10. Contour Plot of Surface Area vs. No of fins, Fin thickness.
Coatings 13 00012 g010
Figure 11. Thermal resistance for single fin vs. fin thickness (mm).
Coatings 13 00012 g011
Figure 12. Plot of Total Heat Transfer Rate, Delta temp between fin base and fin tip vs. fin thickness.
Coatings 13 00012 g012
Figure 13. Plot of heat flux vs. fin thickness (mm).
Coatings 13 00012 g013
Figure 14. Plot of Nusselt number vs. fin thickness.
Coatings 13 00012 g014
Figure 15. Plot of Heat Transfer Coefficient vs. fin thickness (mm).
Coatings 13 00012 g015
Figure 16. Plot of fin effectiveness vs. fin thickness.
Coatings 13 00012 g016
Figure 17. Fitted line plot for Nusselt number vs. fin thickness.
Coatings 13 00012 g017
Figure 18. Comparison between Nusselt number from regression EQT vs. simulation results.
Coatings 13 00012 g018
Figure 19. Coating layer using different dispersion methods: (a) Ultrasonic agitation (b) Magnetic stirring (c) Argon gas agitation (10 nm AgNP sample).
Coatings 13 00012 g019
Figure 20. Average resistance vs. the percentage of AgNP.
Coatings 13 00012 g020
Figure 21. FESEM and EDX Analysis of the Coated Sample: (ac) wt% Ag and (df) Ra and RMS value.
Coatings 13 00012 g021aCoatings 13 00012 g021b
Figure 22. EDX spectrum of selected samples (a) #1, (b) #6, and (c) #30.
Coatings 13 00012 g022aCoatings 13 00012 g022b
Table 1. Mesh independence test for different numbers of elements.
MeshABCDE
Element count906,3261,036,6631,635,3862,614,7133,641,119
Skewness level0.8420.8380.8020.8080.811
Total heat transfer rate (W)3.4443.4613.4853.4863.478
Deviation from case 5 (%)0.960.470.220.220.00
Computing Time (h)7.18.29.410.413.1
Table 2. Model constants.
ConstantValue
C1.44
C1.92
Cµ0.09
σ k 1.0
σ ϵ 1.3
Table 3. The temperature rise specifications of IEC 61439-6 used in the experiment.
Part NameTemperature Rise Limit (°C)Maximum Temperature Rise A (°C)Ambient Temperature B (°C)Total Absolute Temperature A + B (°C)
Conductor100.086.030.0116.0
Joint100.085.830.0115.8
Casing55.054.830.084.8
Table 4. Parameters used in the experiments.
ParameterDispersion Method
Ultrasonic AgitationMagnetic StirringArgon Gas Agitation
Current (A)2.02.02.0
Voltage (V)1.01.01.5
Solution (mL)6006001200
Time (minute)3.03.05.0
Specific inputU.S power:
50 Amp
Stirring speed: 200 rpmPressure:
2–3 Psi
Table 5. Velocity contour and vector for different fin thickness.
Fin Thickness (mm)Velocity Contour
1.0 mmCoatings 13 00012 i001
3.0 mmCoatings 13 00012 i002
4.0 mmCoatings 13 00012 i003
4.5 mmCoatings 13 00012 i004
5.0 mmCoatings 13 00012 i005
Table 6. Ag wt% and average resistance for different dispersion methods.
NoSpecimenDispersion MethodAg wt% from XRDAverage Resistance
(μΩ)
1Cu SubstrateN/A08
2Sn-plated Cu substrateUltrasonic08.67
31 mL 10 nm AgNP + Sn-plated Cu substrateUltrasonic0.68.67
41 mL 100 nm AgNP + Sn-plated Cu substrateUltrasonic0.57.33
52 mL 10 nm AgNP + Sn-plated Cu substrateUltrasonic1.16.00
62 mL 100 nm AgNP + Sn-plated Cu substrateUltrasonic1.27.33
73 mL 10 nm AgNP + Sn-plated Cu substrateUltrasonic2.38.67
83 mL 100 nm AgNP + Sn-plated Cu substrateUltrasonic2.58.67
91 mL 10 nm AgNP + Sn-plated Cu substrateMagnetic Stirring0.18.67
101 mL 100 nm AgNP + Sn-plated Cu substrateMagnetic Stirring0.18.67
111 mL 10 nm AgNP + Sn-plated Cu substrateGas Agitation09.33
121 mL 100 nm AgNP + Sn-plated Cu substrateGas Agitation09.33
Disclaimer/Publisher’s Note: The statements, opinions and data contained in all publications are solely those of the individual author(s) and contributor(s) and not of MDPI and/or the editor(s). MDPI and/or the editor(s) disclaim responsibility for any injury to people or property resulting from any ideas, methods, instructions or products referred to in the content.

