Article

Fabrication and Characterization of W-Substituted ZnFe2O4 for Gas Sensing Applications

by
Abdullah M. Al-Enizi
1,
Omar H. Abd-Elkader
2,*,
Shoyebmohamad F. Shaikh
1,
Mohd Ubaidullah
1,
Mohamed O. Abdelkader
3 and
Nasser Y. Mostafa
4,*
1
Department of Chemistry, College of Science, King Saud University, P.O. Box 2455, Riyadh 11451, Saudi Arabia
2
Department of Physics and Astronomy, College of Science, King Saud University, P.O. Box 2455, Riyadh 11451, Saudi Arabia
3
Department of Biochemistry, College of Science, King Saud University, P.O. Box 2455, Riyadh 11451, Saudi Arabia
4
Department of Chemistry, Faculty of Science, Suez Canal University, Ismailia 41522, Egypt
*
Authors to whom correspondence should be addressed.
Coatings 2022, 12(9), 1355; https://doi.org/10.3390/coatings12091355
Submission received: 16 August 2022 / Revised: 9 September 2022 / Accepted: 15 September 2022 / Published: 17 September 2022
(This article belongs to the Section Functional Polymer Coatings and Films)

Abstract

:
A sol–gel technique was successfully employed in creating pure and W-substituted zinc ferrite, with nominal compositions of ZnFe2−2xWxO4 (0.0 ≤ x ≤ 0.15). For the purposes of investigating the physical and chemical properties of the generated powders, several analytical techniques were used. In TEM images of all the compositions, mixed-shaped particles (cubic, spherical, and hexagonal) were observed. The crystallite size decreases from 82 nm (x = 0.0) to 32 nm (x = 0.15) with an increase in the W doping contents in the ZnFe2O4 lattice. The microstrain increases with increasing W doping content. Furthermore, the surface area of pure ZnFe2O4, 0.05 W-ZnFe2O4, 0.10 W-ZnFe2O4, and 0.15 W-ZnFe2O4 NPs were calculated as being 121.5, 129.1, 134.4 and 143.2 m2 g−1, respectively, with a mesoporous pore structure for all ferrite samples. The calculated BJH pore size distribution was within the range of 160 to 205 Å. All W-doped ZnFe2O4 samples show H-M loops with paramagnetic characteristics. The magnetization (M) directly increases by increasing the applied field (H) without achieving saturation up to 20 kA/m. For comparison, the magnetization at 20 kA/m gradually decreases with increasing W doping content. Among all the synthesized samples, the 0.15 W-ZnFe2O4 NPs demonstrated the highest sensitivity towards acetone gas at 350 °C.

1. Introduction

Magnetic spinel ferrites have received a lot of interest from academics because of their vast technological importance in many fields, such as magnetic recording, biomedicine, luminescent media, and gas sensors [1,2,3]. The oxygen anions are arranged in a cubic closed-packed lattice within the spinel’s face-centered cubic structure. The cubic spinel structure is characteristic of the ferrites that have the general chemical formula MFe2O4 (M = divalent metal ion, which can stand for Co, Mn, Ni, Zn, or Fe) [4]. The structure of spinels consist of one primary unit cell that is composed of eight sub-unit cells with a cubic (face-centered) structure. Each unit cell contains two different types of sites, which are designated as the tetrahedral (A) site, which accommodates divalent metal ions, and the octahedral (B) site, which accommodates trivalent Fe ions [5]. There is a total of 96 interstitial sites, with 64 of them being tetrahedral and 32 of them being octahedral. The oxygen atoms form a close-packed configuration in the spinel structure, and each unit cell is composed of 32 oxygen atoms. As seen, the closest neighbors for the tetrahedral (A) sites are four oxygen atoms, while the closest neighbors for the octahedral (B) sites are six oxygen atoms. Normal or inversed spinel types are based on the distribution of metals amongst these sites. A normal spinel occurs when the divalent metal ions completely sit on the A-site of the crystal, whereas inverse spinel is the term used when they occupy the B-site of the crystal [6]. On the contrary, a mixed or random spinel describes a situation in which metals are moderately present at both sites. It is possible, at least in theory, to utilize the crystal field stabilization energy and the ionic radius to make a prediction about the spinel ferrites’ favored distribution of different cations within the spinel’s [7]. Fe2+, Co2+, and Ni2+ have a potential to form inverse spinel structures at B sites, whereas Zn2+ and Mn2+ have a potential to form normal spinel structures at A sites [8].
A classic example of a normal spinel ferrite structure is that of zinc ferrite (ZnFe2O4). In this structure, all the nonmagnetic Zn2+ cations are located in the A sites, while all the magnetic Fe3+ cations are positioned in the B sites [9]. Thus, bulk ZnFe2O4 is frequently paramagnetic at ambient temperature. However, in cases of nanosized ZnFe2O4, ferrimagnetism has been observed at certain particle sizes, where Zn atoms are redistributed to both A and B sites [10]. This redistribution is strongly impacted by the preparation method of the materials. The physical properties of chemically synthesized ZnFe2O4 vary depending on the synthesis method, size, microstructure, and incorporation of foreign ions as doping. Synthesis of ferrites as nanomaterials may enhance some characteristics and reduce others [11,12]. In previous works [13,14,15], we found that doping ferrites affects the octahedral and tetrahedral sites’ preferences. The doped ions’ radii and contents, in addition to the processing methods, are important factors in controlling the sites’ preference. Additionally, the structural, electrical, and magnetic characteristics of ferrites are greatly impacted by the redistribution of foreign doped cations between the tetrahedral and octahedral sites [16,17,18].
Researchers from various institutions have synthesized metal-substituted zinc ferrite and investigated its gas sensor and magnetic properties. The composition of the ferrites as well as their structural and morphological properties are extremely important factors in determining the pragmatic industrial applications of ferrites [19]. Both the method of synthesis and the preparative parameters can influence the magnetic properties of toxic gas sensors. Additionally, the method of synthesis has an effect on the gas sensor’s ability to detect gases. Various investigations have given consideration to the fact that the practical properties of ferrites might be greatly altered by changes in site occupancies in ferrite lattices [20,21]. Multicomponent ferrites display a wide range of occupancies, which is one factor that contributes to their adaptability in many technological applications. Many investigators have tried to improve the sensing sensitivity of ferrites with cation doping. For example, Fu et al. [22] reported a one-step synthesis of W-doped Ni–Zn ferrites and investigated their magnetic, dielectric and gas sensing properties. Rani et al. used a simple co-precipitation method to manufacture pure and cobalt-substituted zinc ferrites and investigated their physical and gas sensing properties [23]. Madake et al. compared the crystalline and gas sensing characteristics of NixZn1-xFe2O4 (x = 0 to 0.5) thin films prepared via spray pyrolysis [24]. Xing et al. investigated the influence of tungsten as a foreign ion on the structure and magnetic characteristics of Mn–Zn mixed ferrites [25]. Srinivas et al. investigated the magnetic behavior of co-precipitated Ni–Zn ferrite nanoparticles and their potential use as gas sensors [26].
Several physical and chemical techniques, such as spray pyrolysis, combustion synthesis, chemical co-precipitation, traditional ceramic processes, and hydrothermal methods are used to create these nanomorphologies. These processes employ costlier equipment or time-consuming chemical synthesis stages with potentially harmful effects [27]. Among these, the sol–gel synthesis method possesses a number of advantages, including higher homogeneity, high purity, a low processing temperature, reproducibility, ease, low cost, and uniqueness in generating nanostructures with various dimensions [28]. ZnFe2O4 is useful in various technological applications, such as catalysts, imaging, actuators, pigments, and sensors. Moreover, insertion of doping agents may be an effective processing step in attempts to improve the technical properties of ferrite.
In the present investigation, we synthesized pure and W-substituted zinc ferrite. W-substituted zinc ferrite composites with different W (VI) ion compositions of the form ZnFe2-2xWxO4 (0.0 ≤ x ≤ 0.15) have been synthesized by using the sol–gel method. XRD, SEM, EDXA, VSM and FTIR were applied as the main tools to study the impact of tungsten insertion in the zinc ferrite lattice. Herein, the systematically studied parameters are the structure and the magnetic and gas sensing responses.

2. Materials and Methods

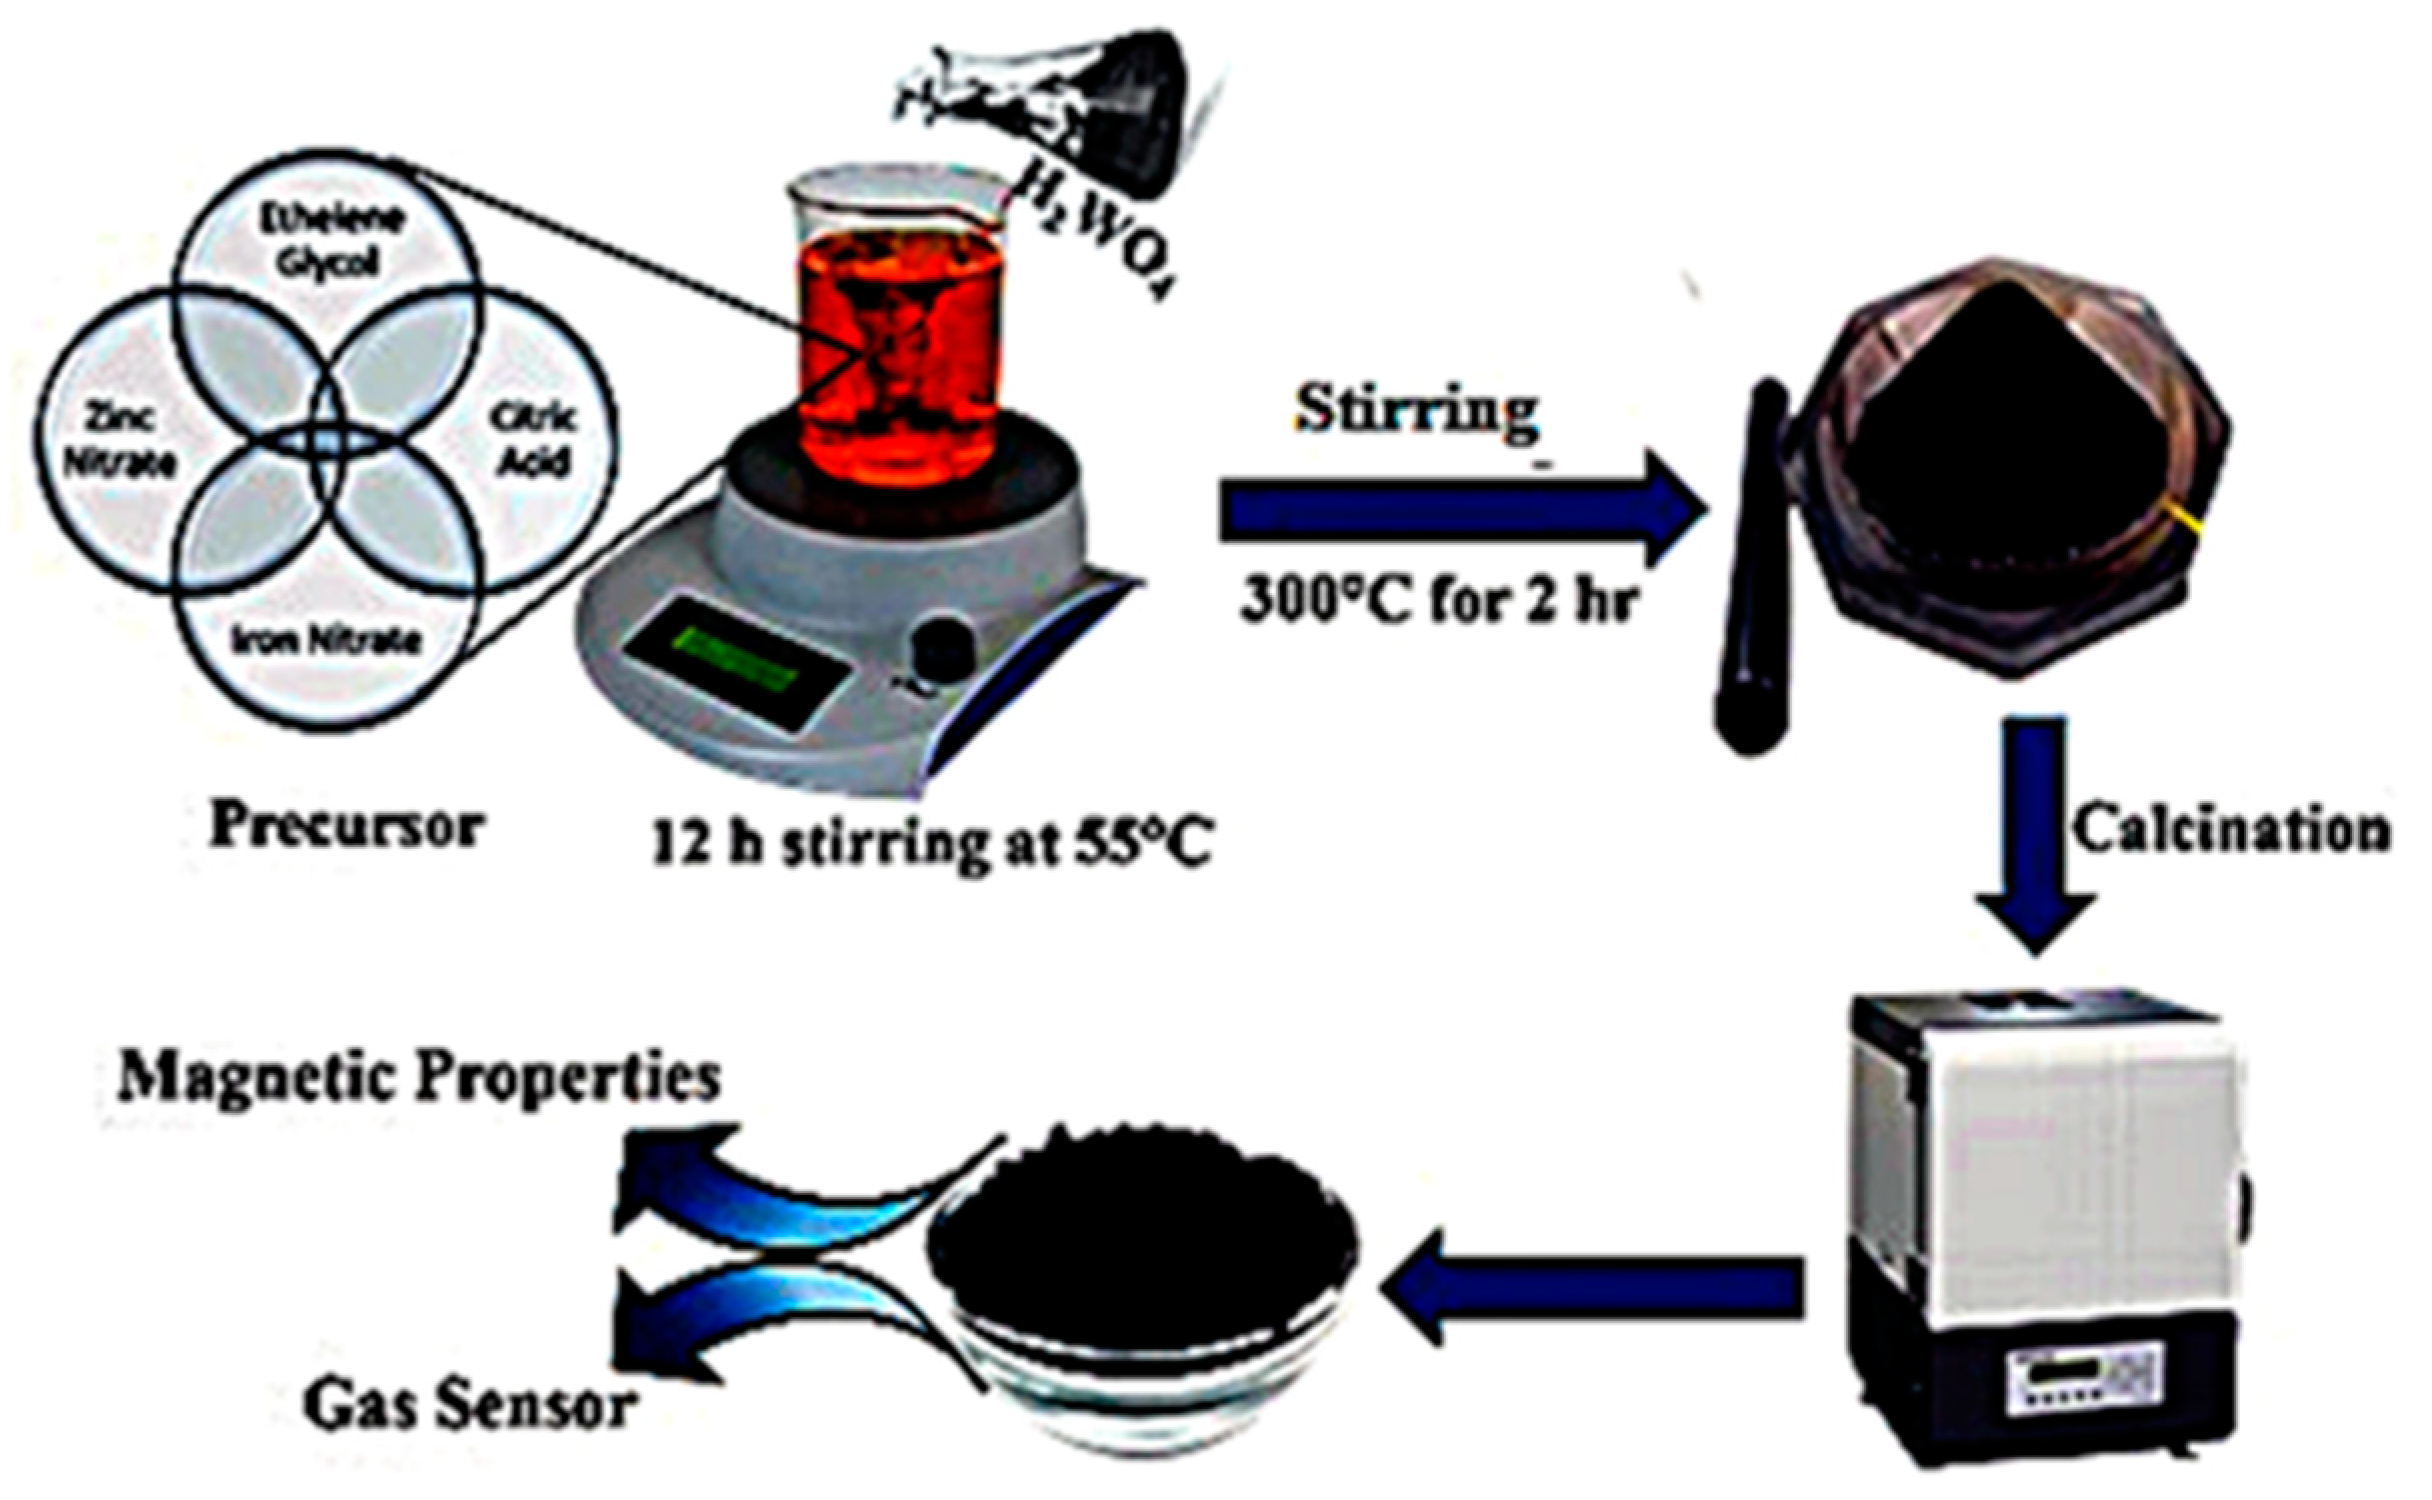
2.1. Synthesis Methods

The starting precursors for ferrite synthesis were zinc nitrate hexahydrate (Sigma Aldrich, St. Louis, MO, USA, 98%), iron (III) nitrate nonahydrate (Sigma Aldrich, 98%), citric acid (HOC (CO2H) (CH2CO2H)2, 99.5%), and ethylene glycol (SD fine-chem Ltd., Mumbai, Maharashtra, India). All the chemicals were used without any further purification. Single-phase ZnFe2O4 powder was formed via a globally accepted and laboratory-grade sol–gel method. During the synthesis, the W-doped ZnFe2O4 was (0.0 ≤ x ≤ 0.15) and citric acid was the chelating agent. Aqueous solutions of 0.1 M zinc nitrate hexahydrate and iron (III) nitrate nonahydrate were made using double-distilled water in a flask. Then, ethylene glycol (1.4 mL) was added to the solution. Afterward, 25 mL of 0.1 M iron (III) nitrate nonahydrate was added to the solution under constant stirring. After the solution became transparent, citric acid (0.11 mol) was added; after 3.5 h of stirring at room temperature, minor turbidity was noticed. After that, the solution has been stirred at 55 (± 5 °C) for 2 h to create a homogenous and viscous reaction mixture of metal ions. The resulting mixture was heated to 135 (± 5 °C) for 20 h to produce a viscous resin (i.e., polymeric gel), which was then burned at 300 °C in a muffle furnace for 2 h to aid in the poly-condensation reaction. As a result, the black powder was collected and utilized as a precursor to synthesize ZnFe2O4 nanoparticles as shown as in Figure 1.

2.2. Characterization Techniques

The powder was characterized with X-ray diffraction spectra (XRD, BRUKER D8 diffractometer, Billerica, MA, USA) to confirm the pure and W-substituted zinc ferrite phases. Fourier-transform infrared (FTIR) spectra were measured with a PerkinElmer (type 1430) spectrophotometer (Unit a Llantrisant CF72 United Kingdom) in the range from 400 to 4000 cm−1. The microstructure analysis was done by both SEM and TEM (JEOL JAX-840A, Tokyo, Japan) at 25,100 Kev. The elemental chemical compositions of the samples were examined with energy dispersive X-ray analysis (EDXA with element mapping capability, JEOL, Tokyo, Japan). The Delta kevex device attached to a JED-2200 Series SEM (JEOL, Tokyo, Japan) was used. Using the Micrometrics Gemini VII 2390 V1.03 (Microtrac, Alpharetta, GA, USA), a series of Brunauer–Emmett–Teller (BET) nitrogen adsorption isotherms at 77 K were used to measure the specific surface areas and pore size distributions of various ferrites. Utilizing a monochromatic Al Kα X-ray source and an Omicron E125 concentric hemispherical analyzer (Quantum Design, San Diego, CA, USA) in pulse count mode (1486.6 eV), X-ray photoelectron spectroscopy (XPS) spectra were recorded. Using a vibrating sample magnetometer (VSM) at room temperature and a maximum field of 20 kA/m, the materials’ magnetic properties were investigated (9600-1 LDJ, Weistron Co., Ltd., West Hollywood, CA, USA).

2.3. Gas Sensor Set-Up

The sensor response was measured using a laboratory-grade static gas sensing analyzer. The Keithley 6514 electrometer equipment was used to verify the variation in sensor resistance when exposed to specified gas molecules. A KUSB-488B cable was used to connect the Keithley instrument to the CPU. Pure and WSZF samples were crushed into ethanol. Before each measurement, they were pressed into discs 15 × 2.5 mm in diameter. The discs were then put on electrodes manufactured from stainless steel meshes and copper sheets. The sensor was heated by a heat supply inside a sealed environment. In air (RA), the sensor resistance was measured, and the gas was also tested (RG). The following formula is used to compute the sensor performance: Response (%) = (RA − RG) ÷ RA × 100, where RA is the sensor resistance in the absence of test gas and RG is the sensor resistance in the presence of the gas at the same temperature [29]. The sensor’s optimum working temperature was determined by measuring the sensor’s response vs. the temperature at 2000 ppm of various gases/vapors.

3. Results and Discussions

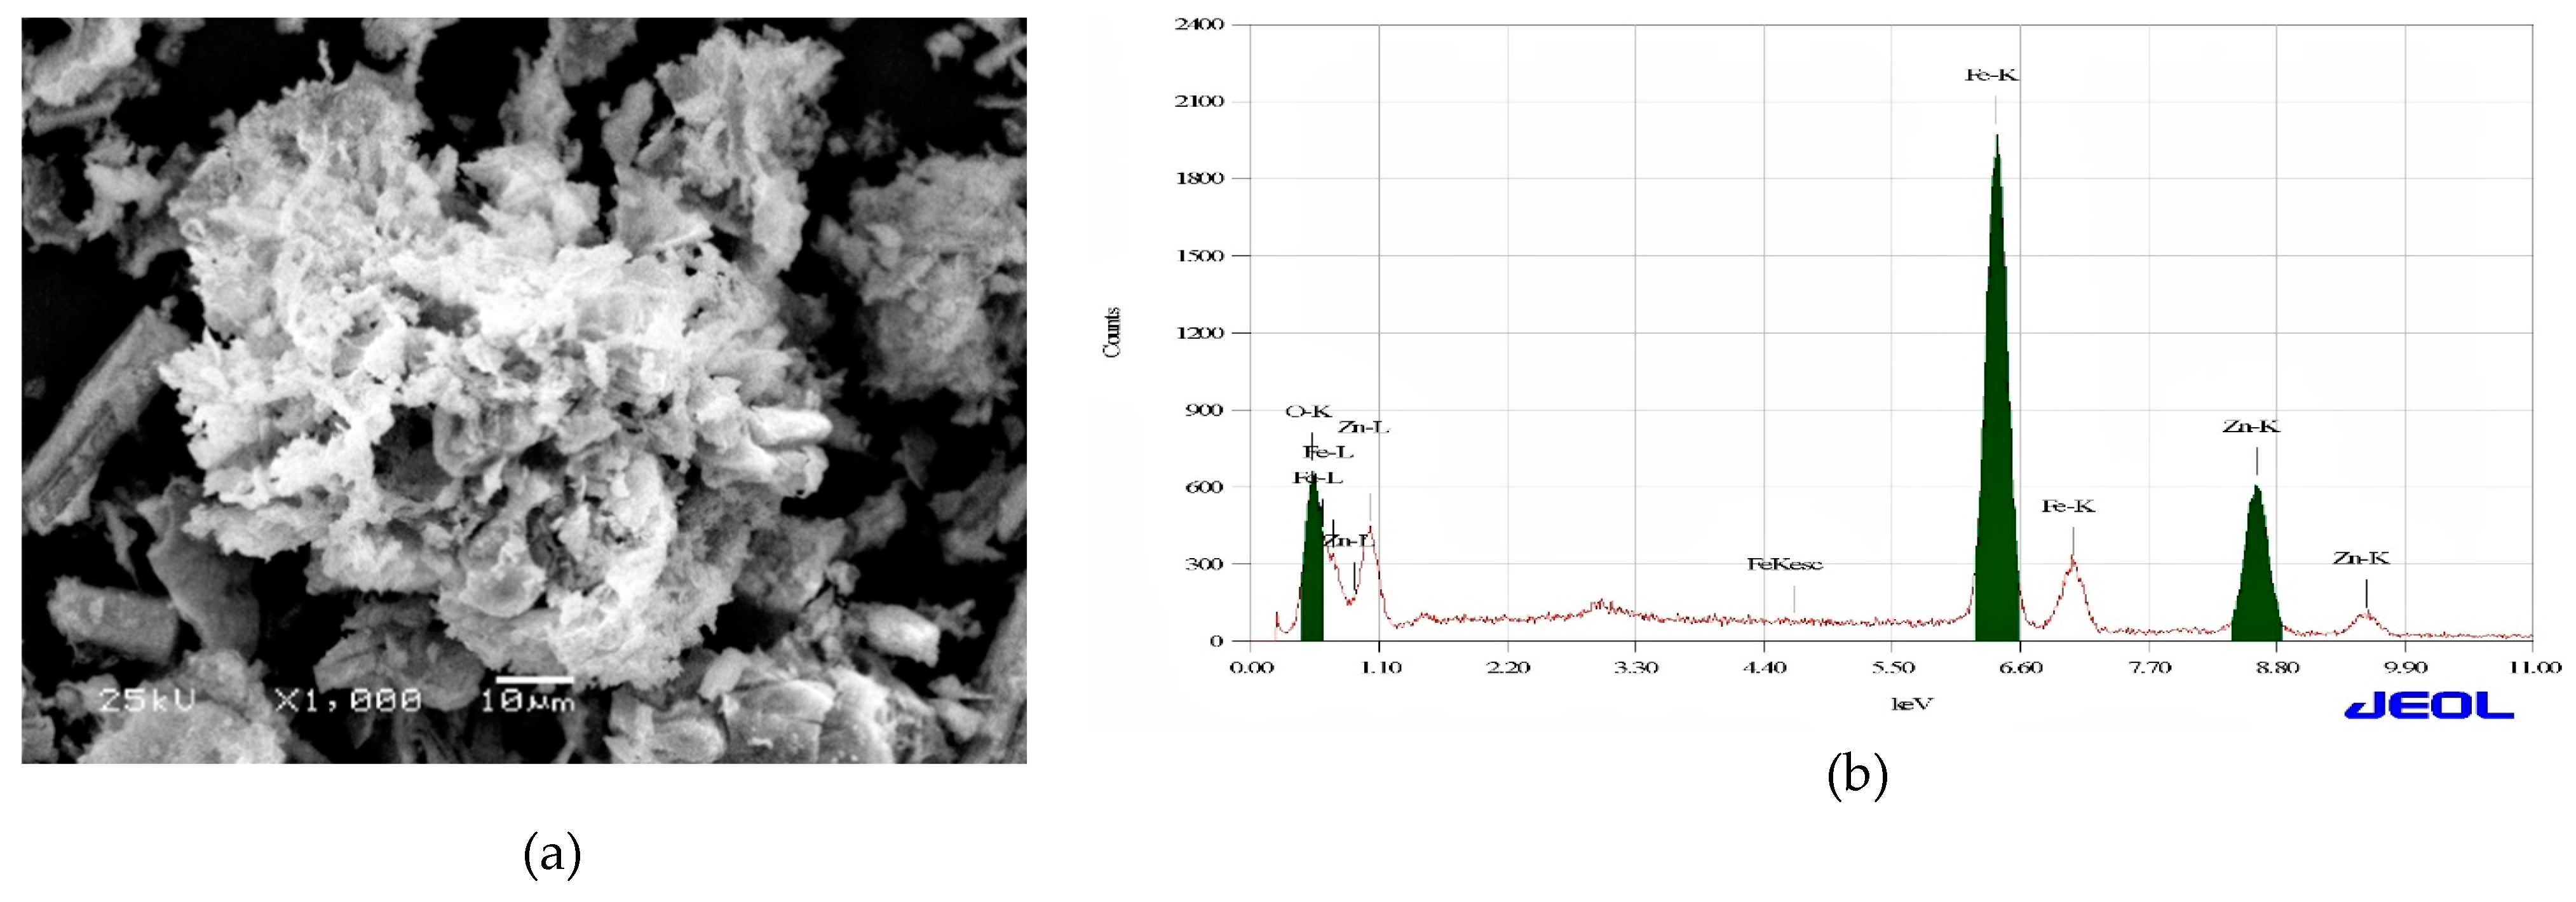
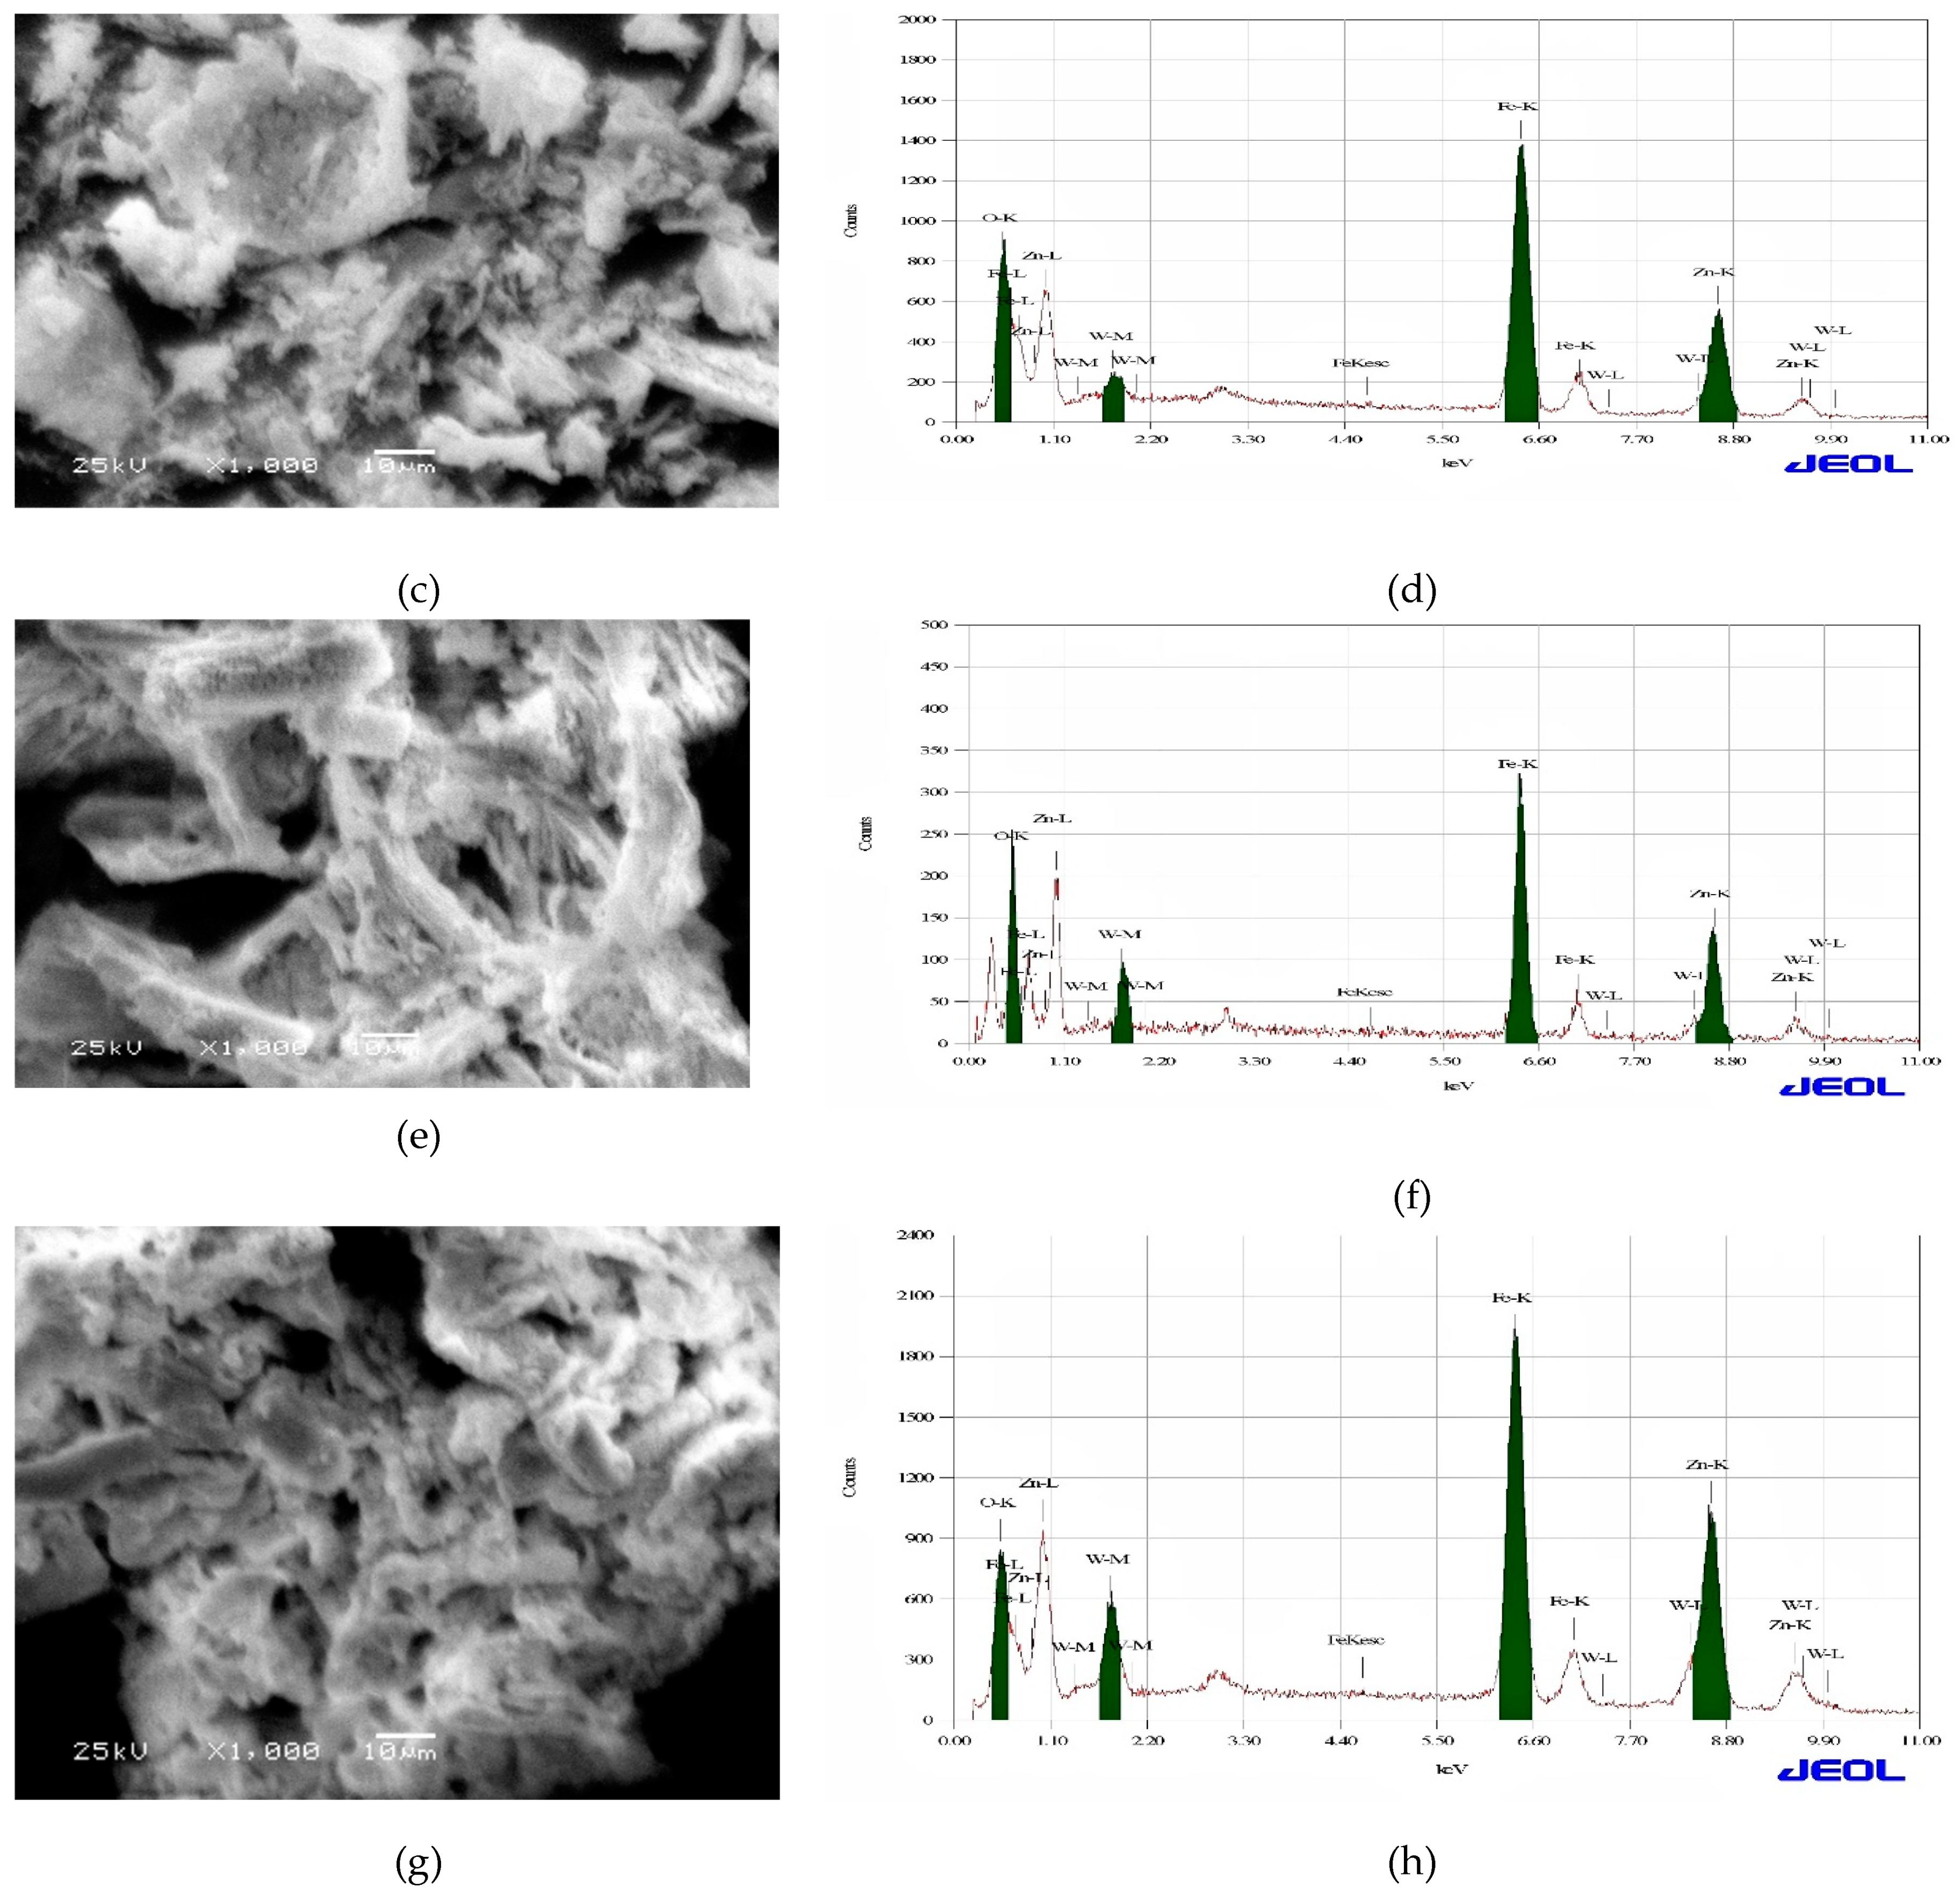
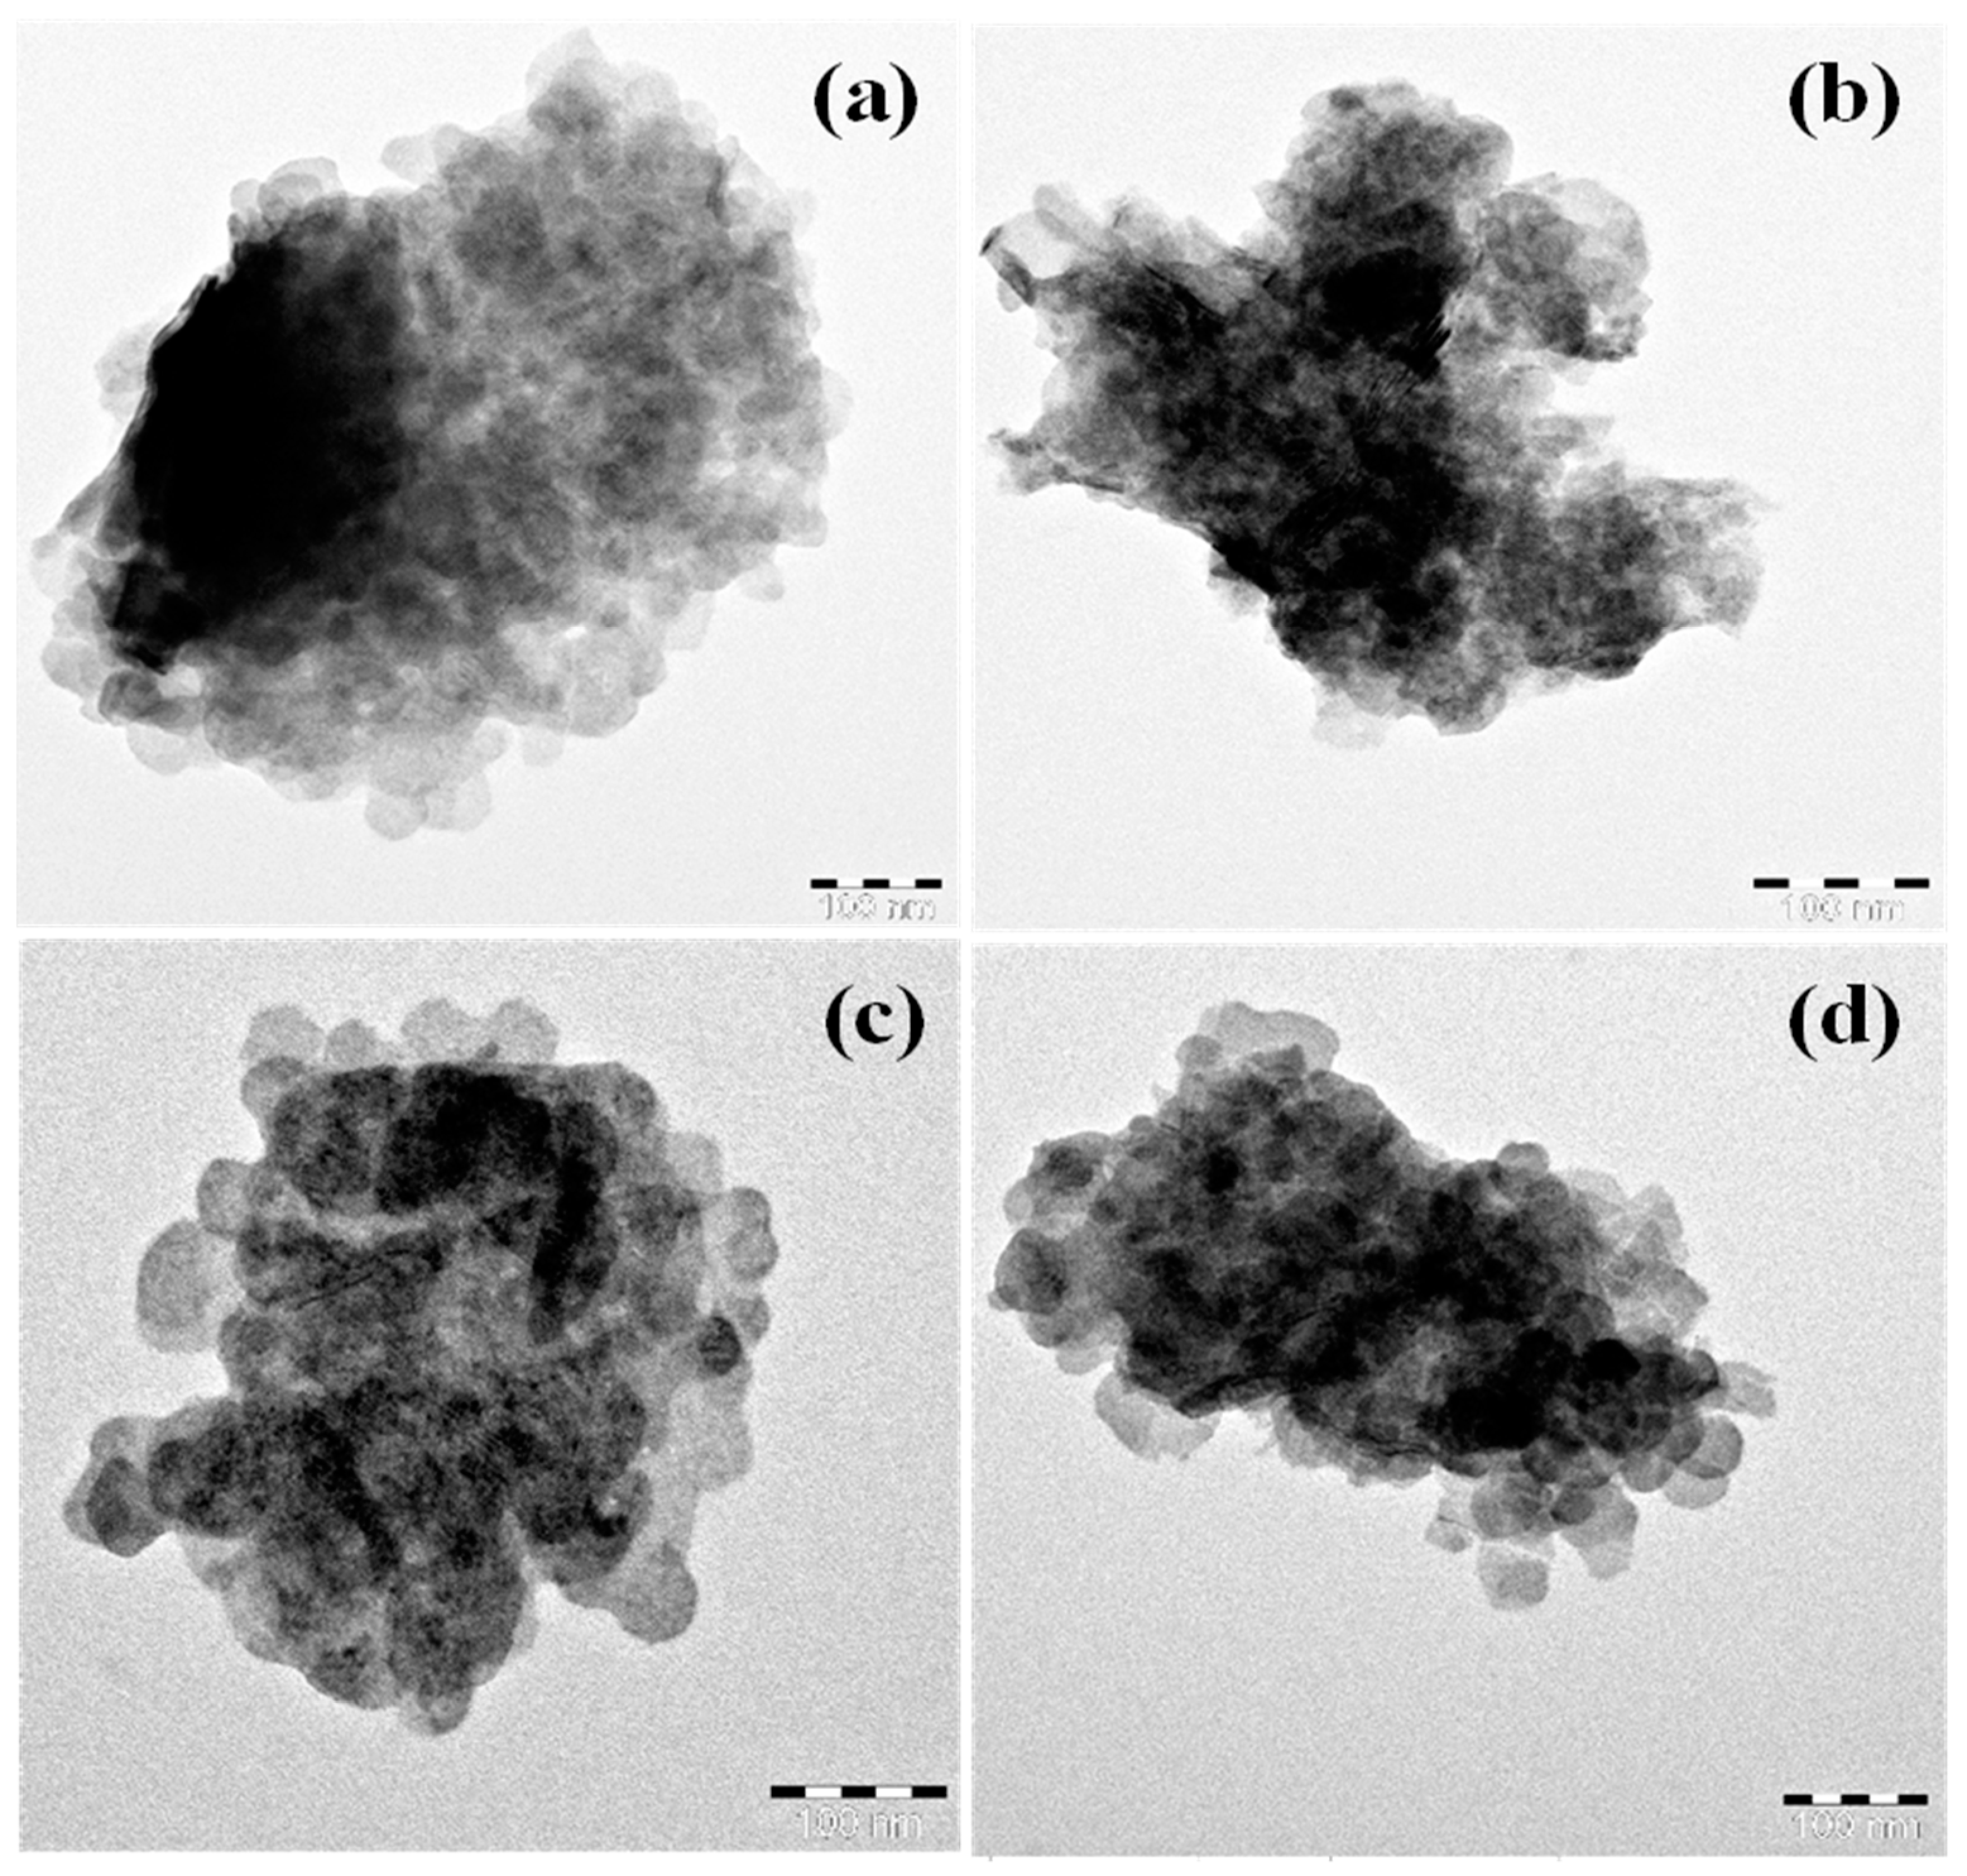
3.1. Structural Elucidation (SEM and TEM)
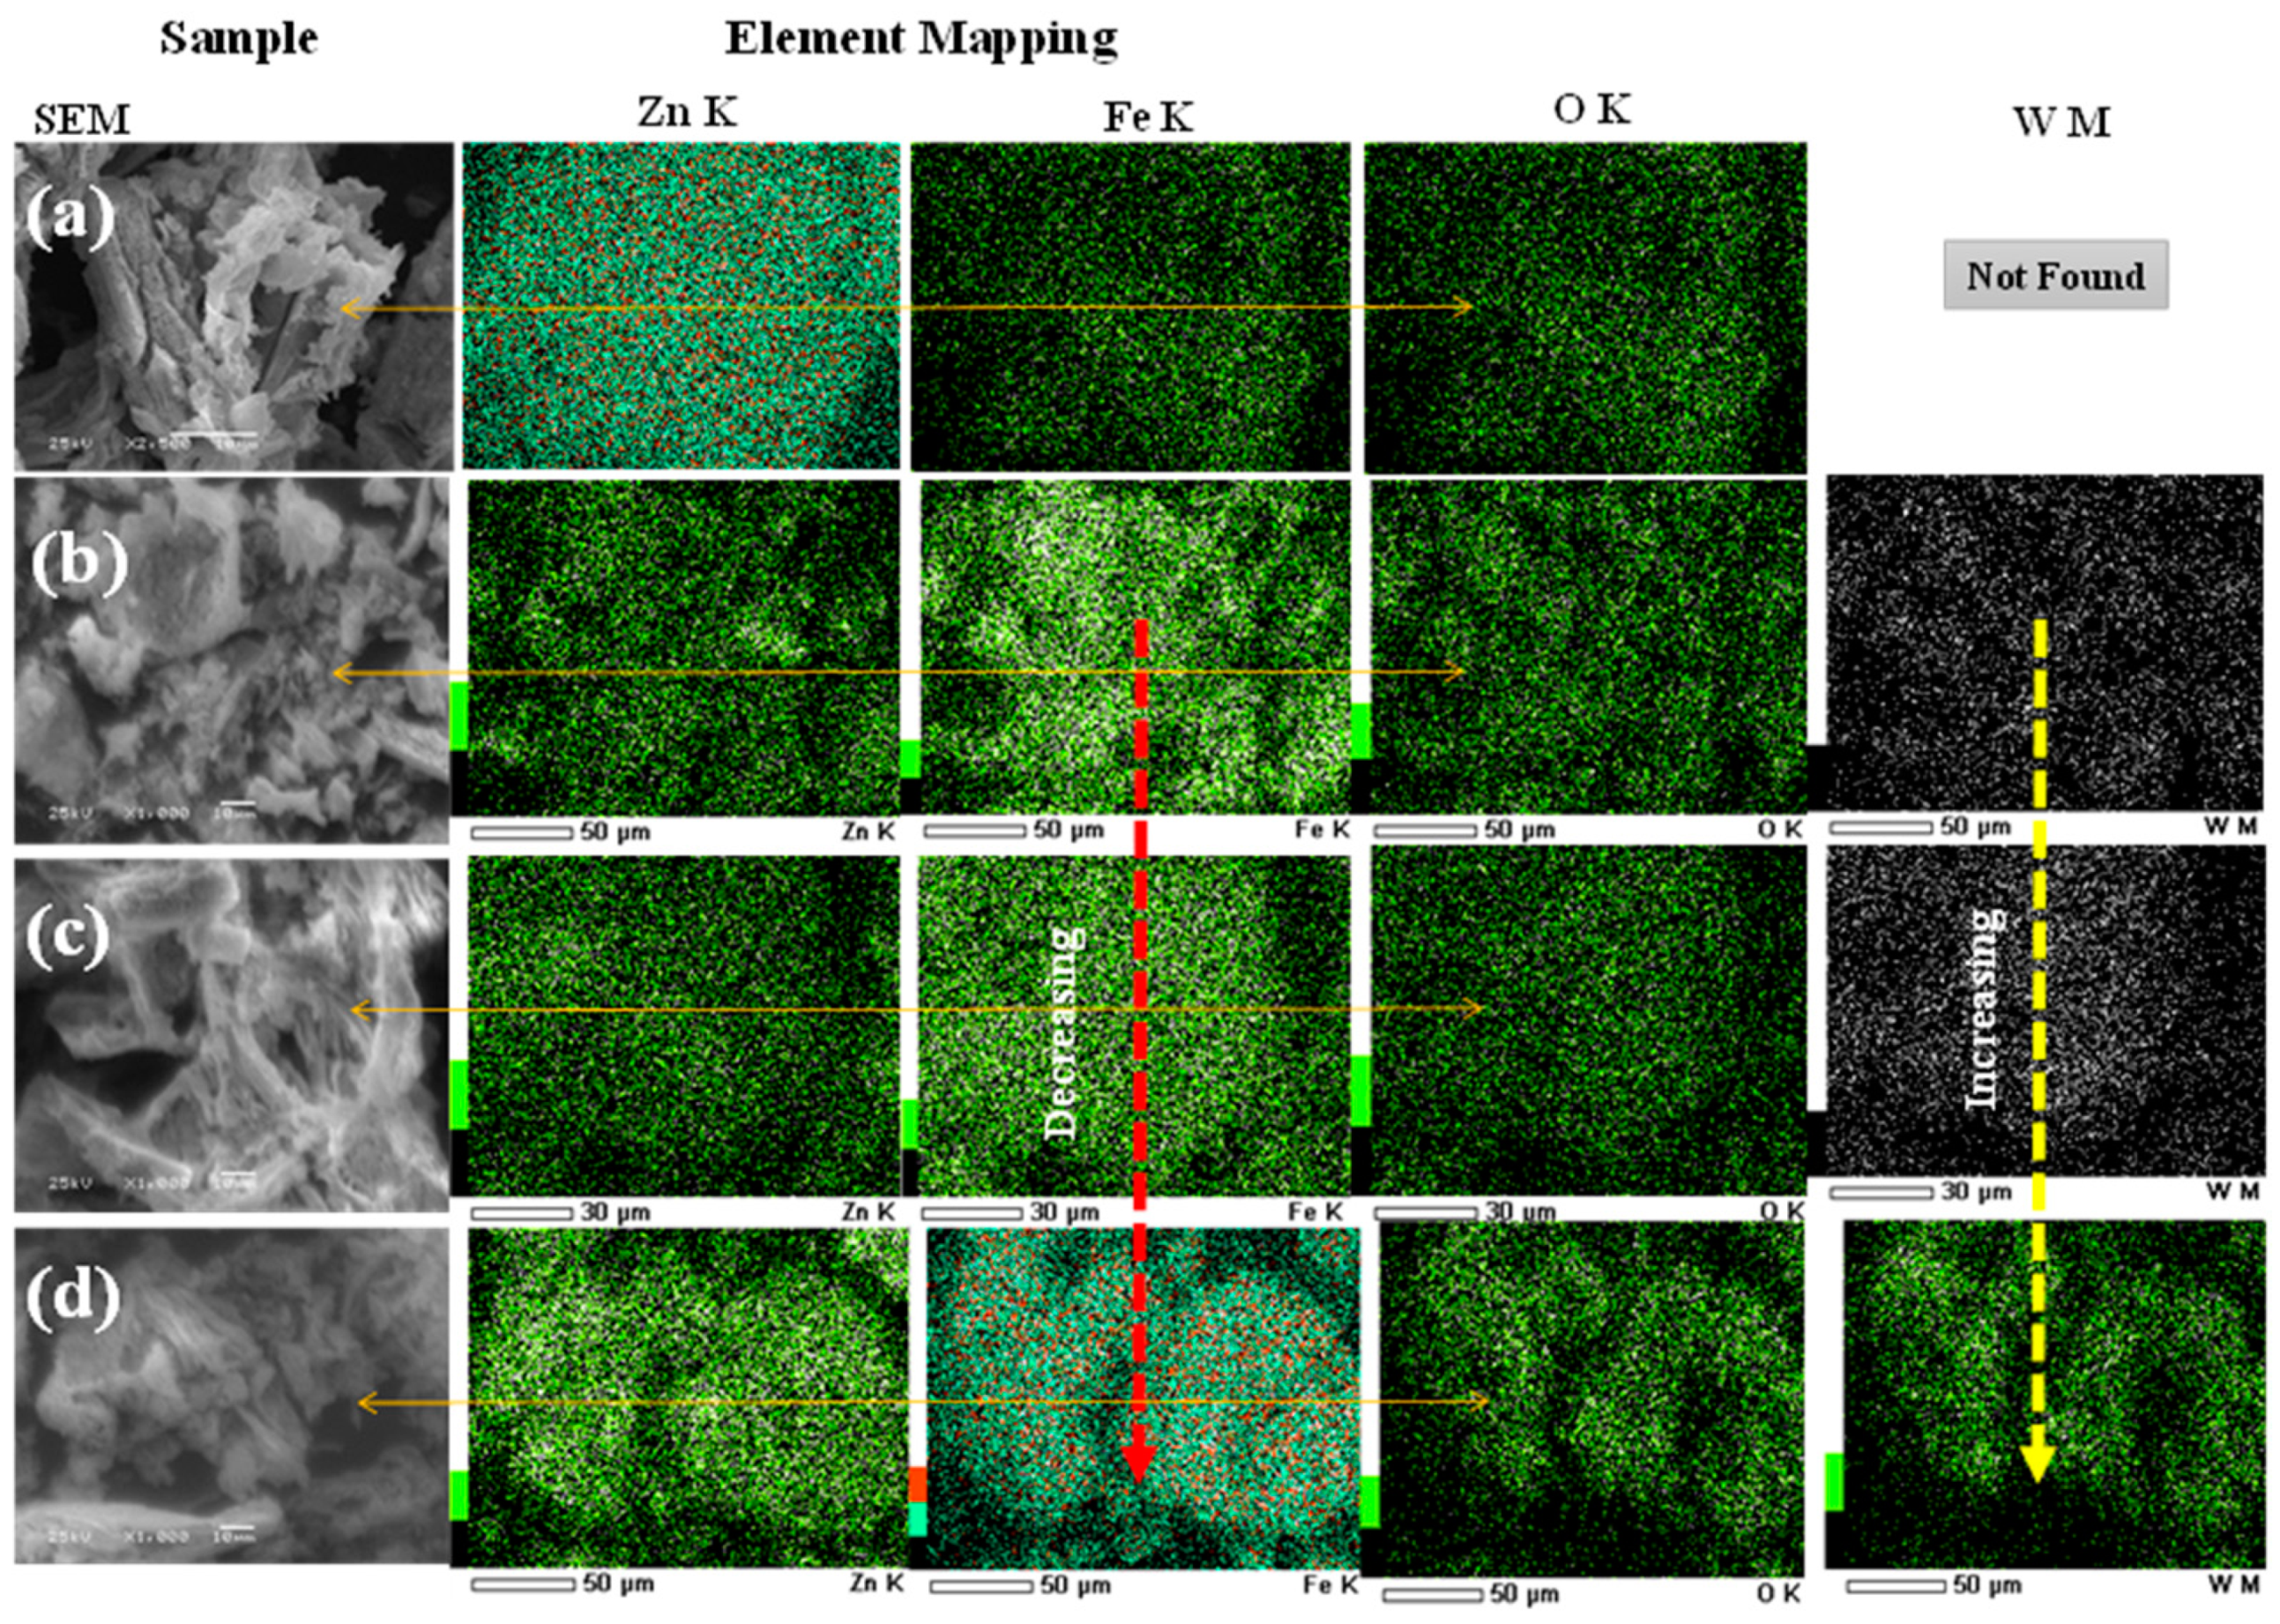
The microstructure of W-substituted ZnFe2O4 has been analyzed with the scanning electron microscopic technique for ZnFe2−2xWxO4 (0.0 ≤ x ≤ 0.15), as depicted in Figure 2. Energy-dispersive X-ray spectroscopy was also performed to analyze the elements present in ZnFe2−2xWxO4 (0.0 ≤ x ≤ 0.15), as exhibited in Figure 2.
SEM micrographs (Figure 2a,c,e,g) of ZnFe2O4 and W-substituted ZnFe2−2xWxO4 (0.0 ≤ x ≤ 0.15) showed an agglomerated morphology containing embedded nanoparticles of non-uniform size. Moreover, ZnFe2O4 exhibits a flower-like morphology, whereas W-substituted ZnFe2O4 showed an aggregated cotton-like morphology. The elemental detection by EDS is shown in Figure 2b,d,f,h. The EDS micrograph of ZnFe2O4 shows O, Zn and Fe elements, while the micrograph of W-substituted ZnFe2O4 exhibits O, W, Fe and Zn elements, as shown in Figure 2d,f,h. As the W substitution increases from 0.05 to 0.15, the intensity of the W peak increases in the EDS spectrum, which is a direct indication of the W-substitution in ZnFe2O4. The agglomeration of the nanoparticles seen in the SEM micrographs is due to their magnetic behavior and to the Vander Waals’ dipole–dipole interactions between the nanoparticles [30].

Elemental Mapping

Elemental mapping of ZnFe2O4 and W-substituted (0.0 ≤ x ≤ 0.15) ZnFe2O4 was exhibited in Figure 3a–d. The mapping micrograph of pure ZnFe2O4 showed Zn, Fe and O elements, which indicated the formation of zinc ferrite (ZnFe2O4) nanoparticles. Moreover, the mapping micrographs of W-substituted zinc ferrite are exhibited in Figure 3b–d, which clearly show the presence of tungsten homogeneously distributed in the zinc ferrite matrix.
The TEM micrographs show the agglomerated nanoparticles of the prepared zinc ferrite and W-substituted ZnFe2O4, as depicted in Figure 4a–d. Mixed-shape particles (cubic, spherical and hexagonal) were observed in TEM micrographs for all compositions. The average particle sizes were calculated as being 87, 75, 62 and 40 nm for ZnFe2O4, ZnW0.05Fe1.95O4, ZnW0.1Fe1.90O4, and ZnW0.15Fe1.85O4, respectively. The strongly agglomerated ferrite nanoparticles result from the cohesive force between magnetic nanoparticles during crystallization, which occurs when crystallites grow close to each other.

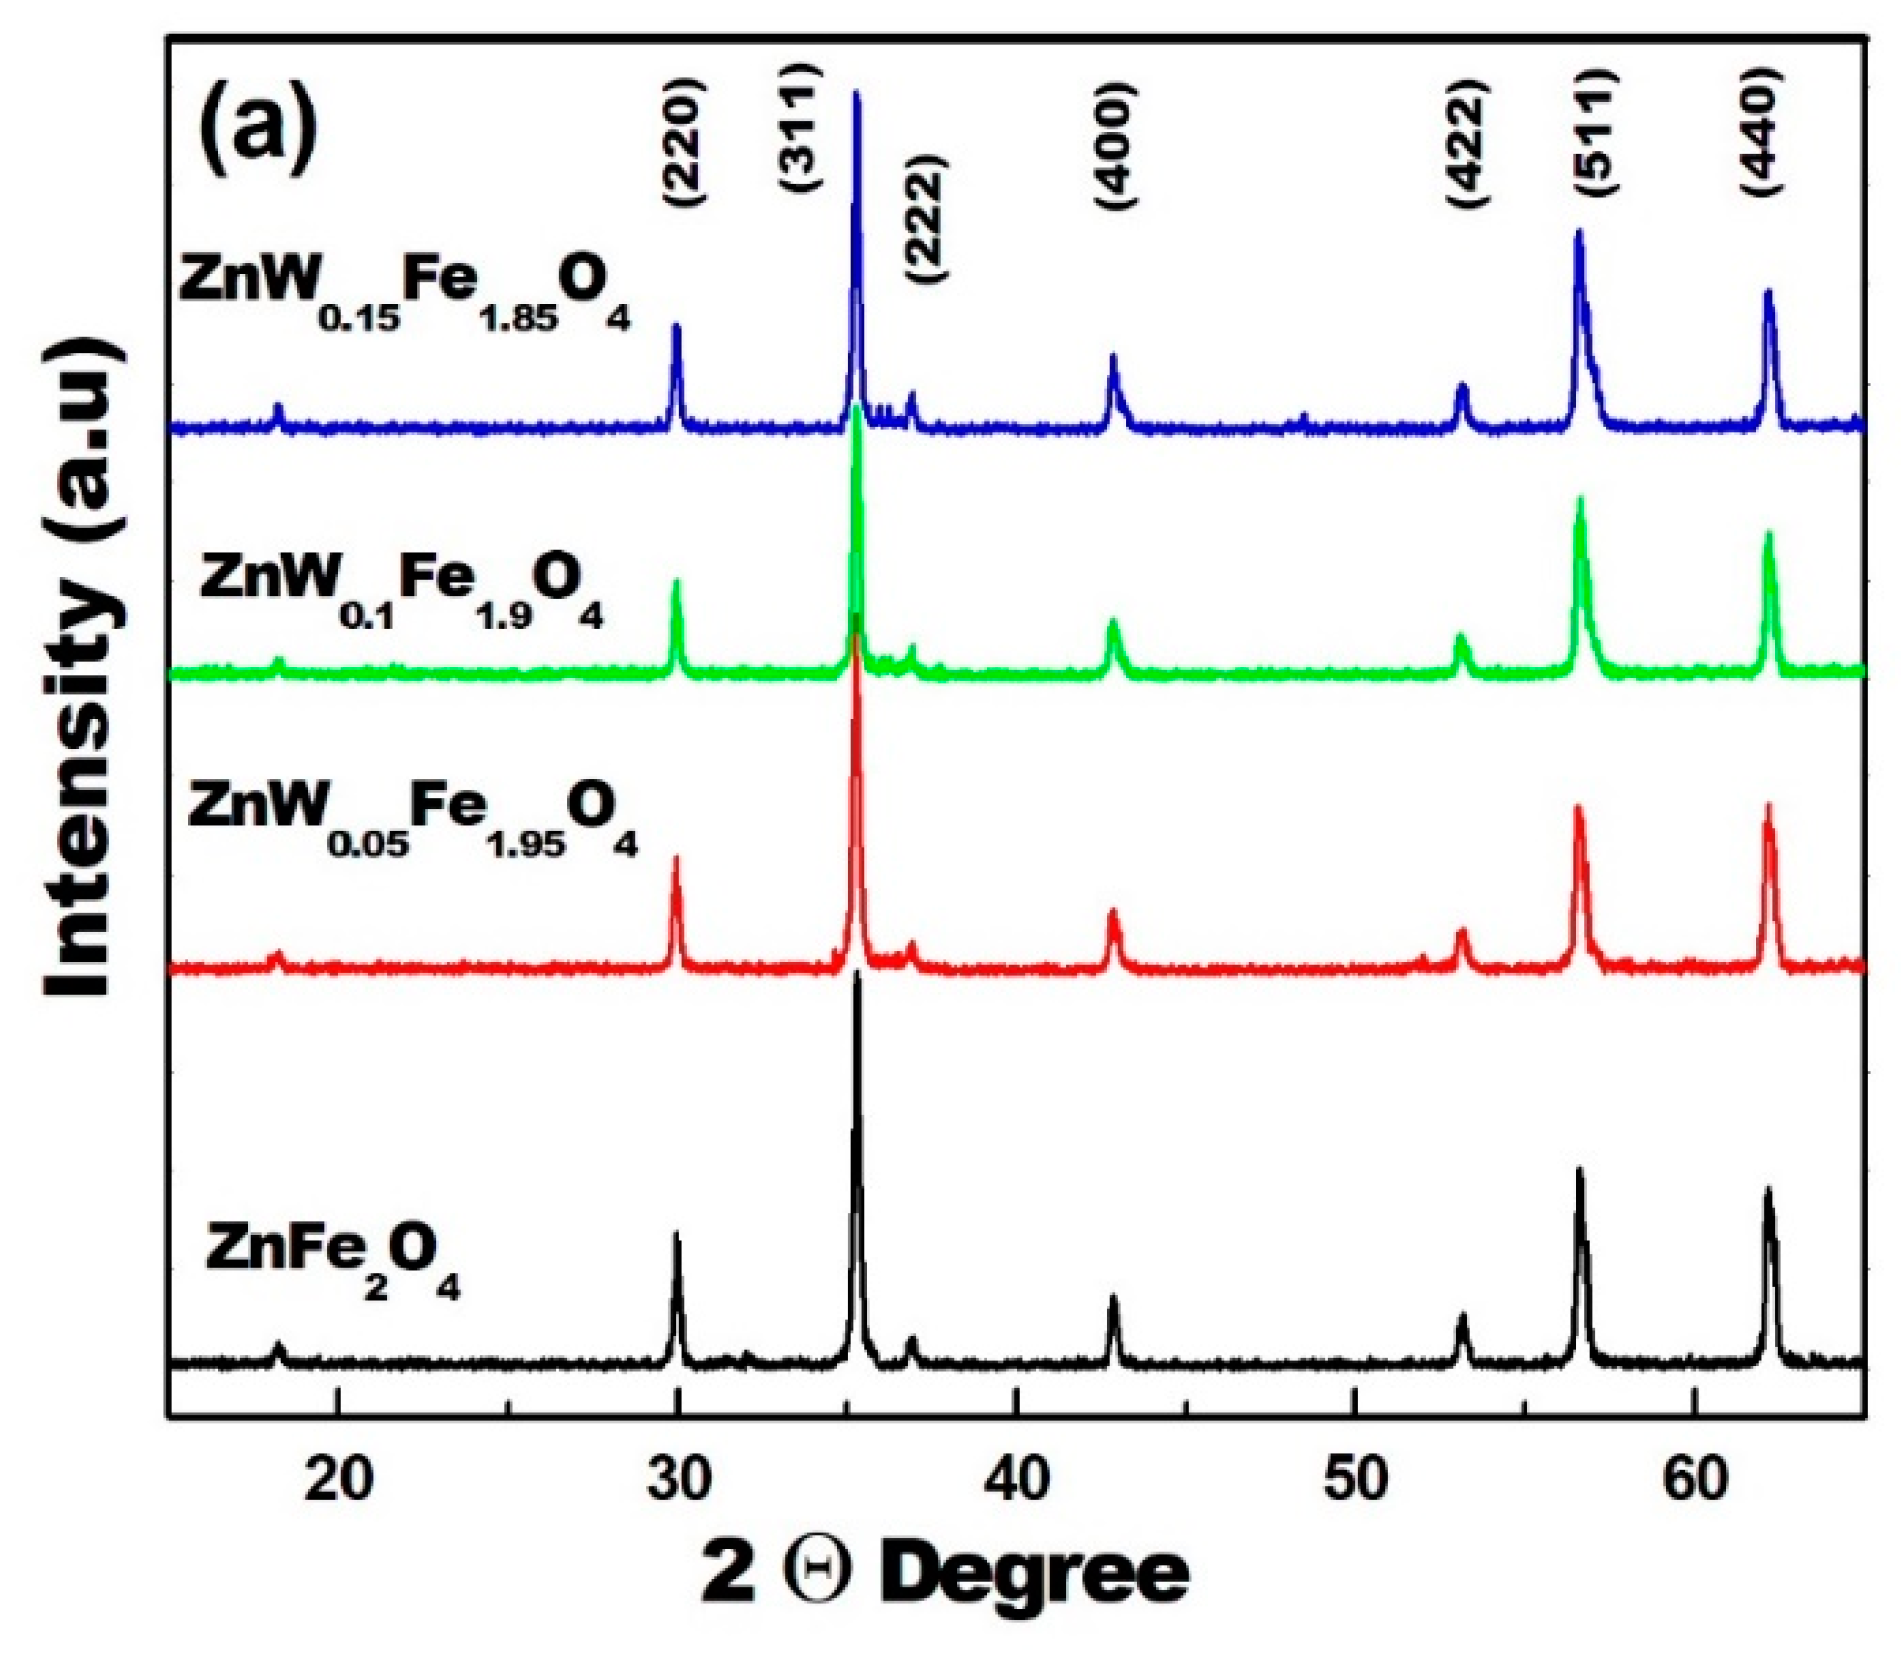
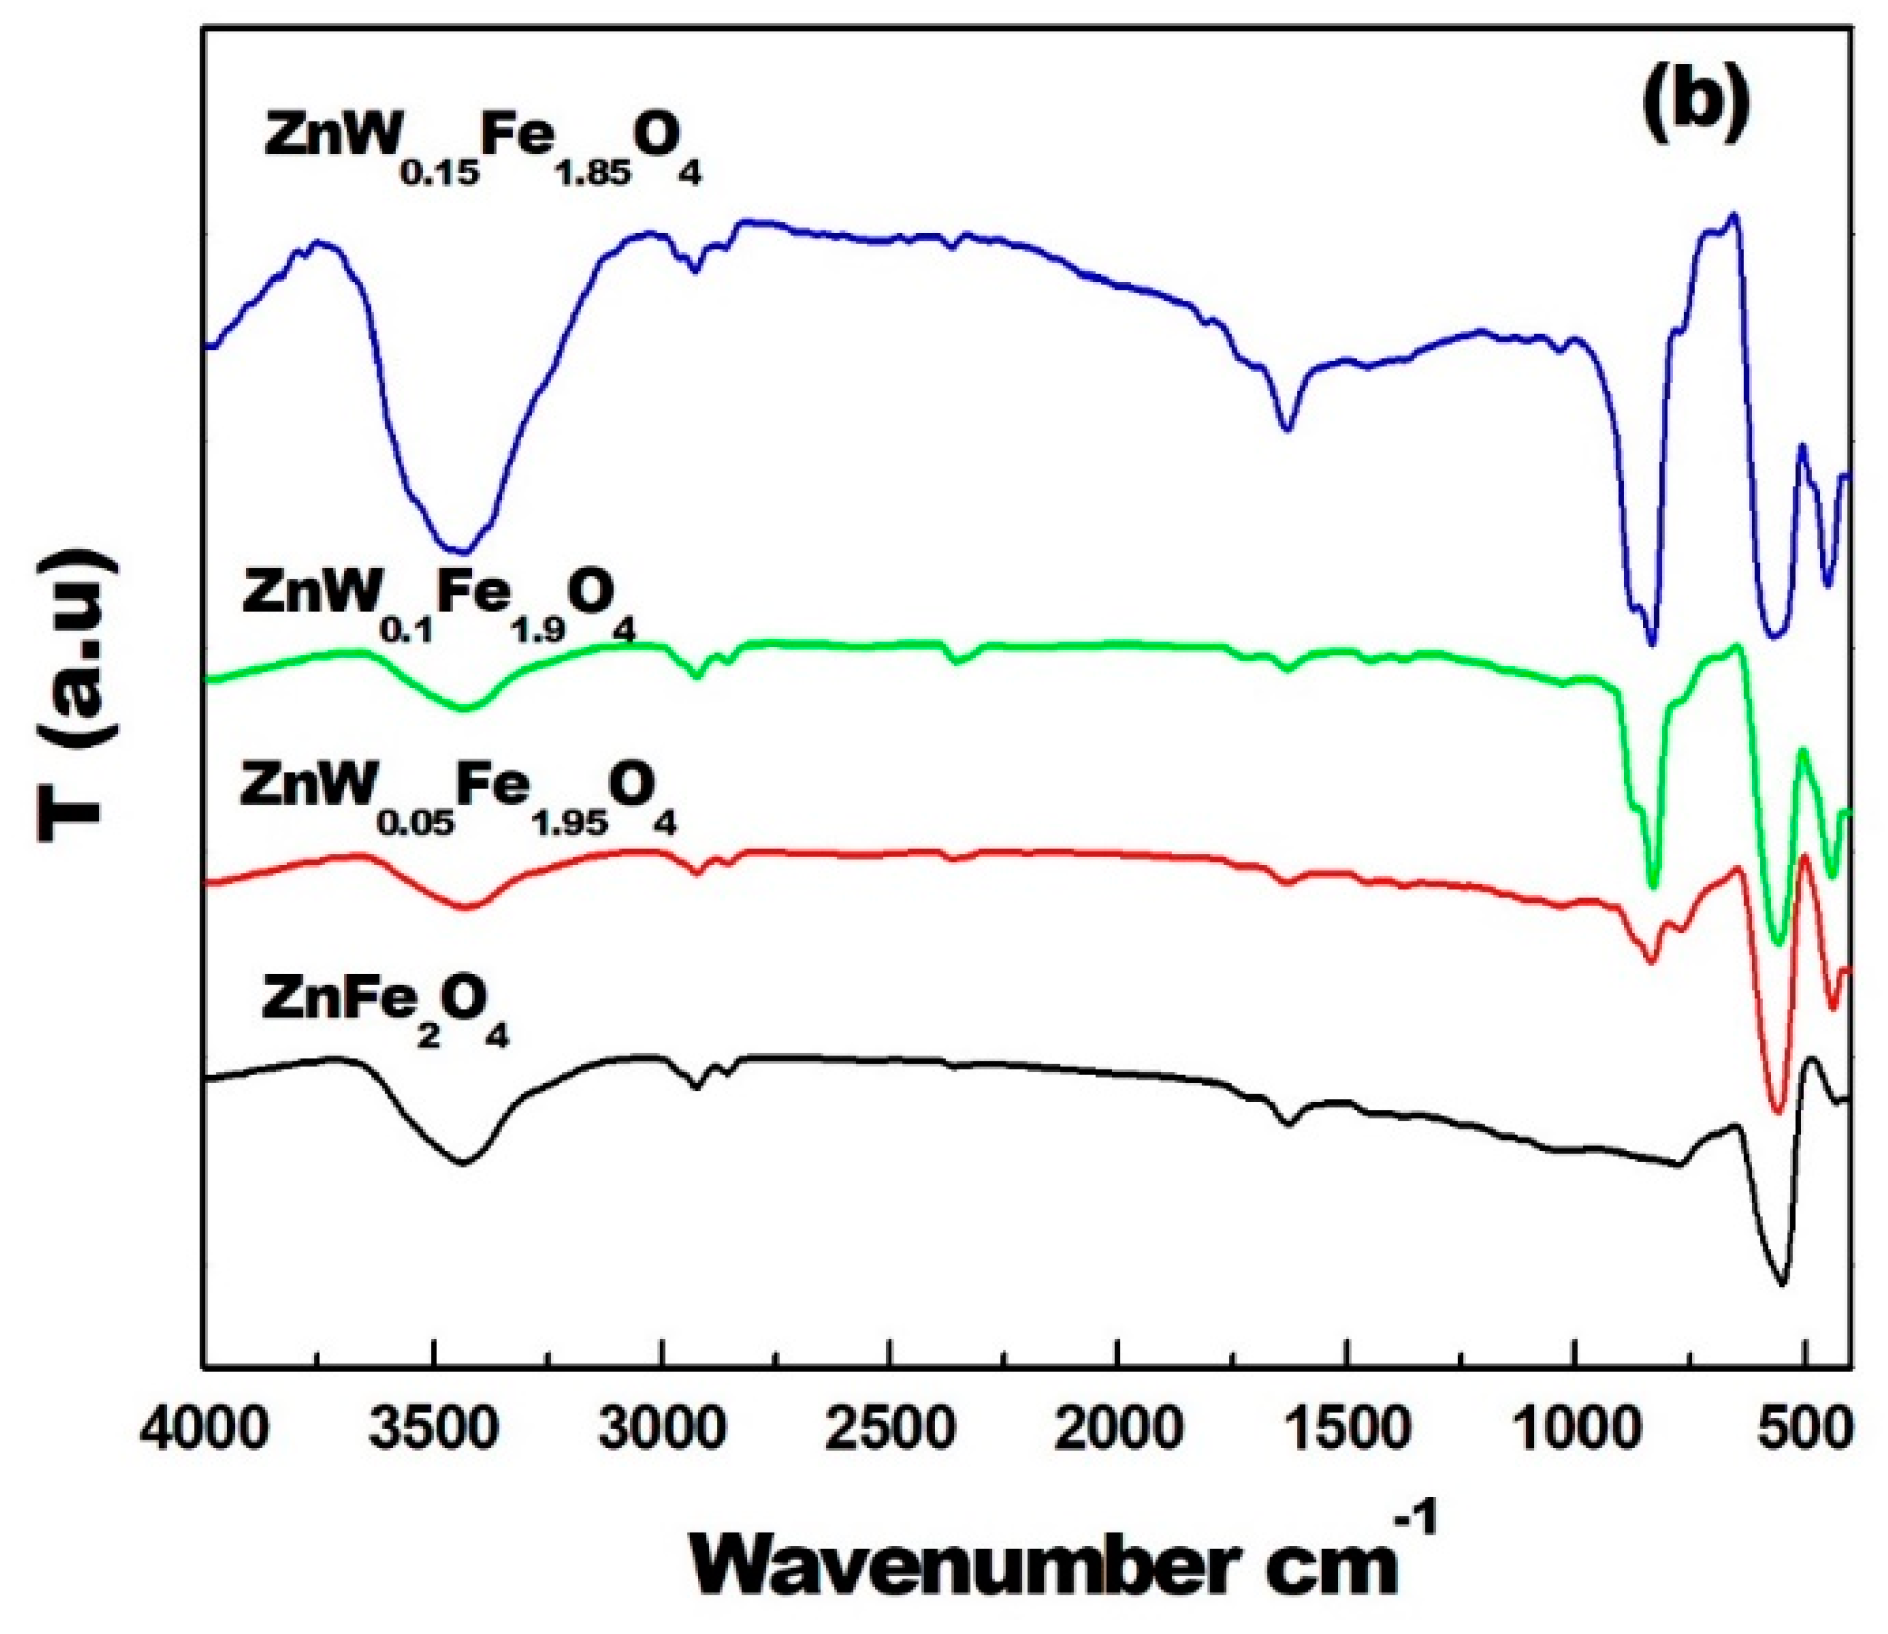
3.2. Powder X-ray Diffraction and Fourier-Transform Infrared Spectroscopy

The powder X-ray diffraction method was used to determine the phase and purity of the as-prepared pure and the W-substituted samples, as shown in Figure 5a. The XRD patterns of ZnFe2O4 and W-substituted ZnFe2−2xWxO4 were perfectly matched with the PDF No. 01-082-1042 of cubic spinel zinc ferrite; no secondary phase(s) and impurity peak(s) were detected in the XRD patterns. The ZnFe2O4 sample shows two minute peaks at around 2θ = 35°, which cannot be identified as any Zn or Fe oxides. The current ferrite samples were processed at 300 °C for 2 h and there is an absence of any hump in the XRD patterns, thus we do not expect the presence of any amorphous phases. It was noted that on increasing the substitution of W in the ZnFe2O4 lattice site, there was a broadening in diffraction patterns which resulted from the reduction in particle size. The variation in the lattice constant a (Å) with W doping was examined and patterns were fitted using the X’Pert High Score Plus software (Table 1). The lattice constant slightly increases with insertion of W in the ZnFe2O4 lattice up to x = 0.1, due to replacement of Fe+3 (small ionic radii; 0.55 Å) with W+6 (large ionic radii; 0.60 Å) in the octahedral position; see Table 2. Upon doping with x = 0.15, the decreases in the lattice constant may be due to replacement of both Zn+2 (ionic radii; 0.60 Å) and Fe+3 (ionic radii; 0.49 Å) with W+6 (ionic radii; 0.42) in the tetrahedral positions. The average crystallite size (nm) and microstrain (ε) for all samples were obtained by fitting the FWHM of each peak to the Williamson-Hall Equation (1)
β cos θ = 0.98 λ D + 4 ε sin θ  
where D denotes the size of the crystallite, λ is the X-ray wavelength, and θ is the Bragg angle. The W–H technique details were provided in our most recent article [11]. Table 1 also contains the results of the average crystallite size and microstrain. The crystallite size decreases from 82 nm (x = 0.0) to 32 nm (x = 0.15) with an increase of the W-doping contents of the ZnFe2O4 lattice. The microstrain increases with increasing W doping.
FTIR spectra of the pure ZnFe2O4 and W-substituted ZnFe2−2xWxO4 (0.0 ≤ x ≤ 0.15) NPs were exhibited in Figure 5b. All samples demonstrate a broad band centered at 3495 cm−1, which is present due to the -OH group in adsorbed water [11]. This water band is due to surface moisture being absorbed during the samples’ processing and handling. The stretching vibration of metal–oxygen bonds in a tetrahedral coordination appears at 510–620 cm−1, and it relates to metal ions in the A-site sublattice. This band exists at 585 cm−1 in pure ZnFe2O4 and shows a red shift upon W insertion in the ferrite lattice, reaching 614 cm−1 in the sample with 0.15% doping. The octahedral M–O stretching appears at low frequencies between 400–500 cm−1 [32]. The main bands of the WO4−2 group appear in the 980–680 cm−1 spectral region. The tungstate vibration bands O–W–O appear at 875 and 833 cm−1, and increase in intensity with increasing tungsten insertion in the ferrite lattice [33].

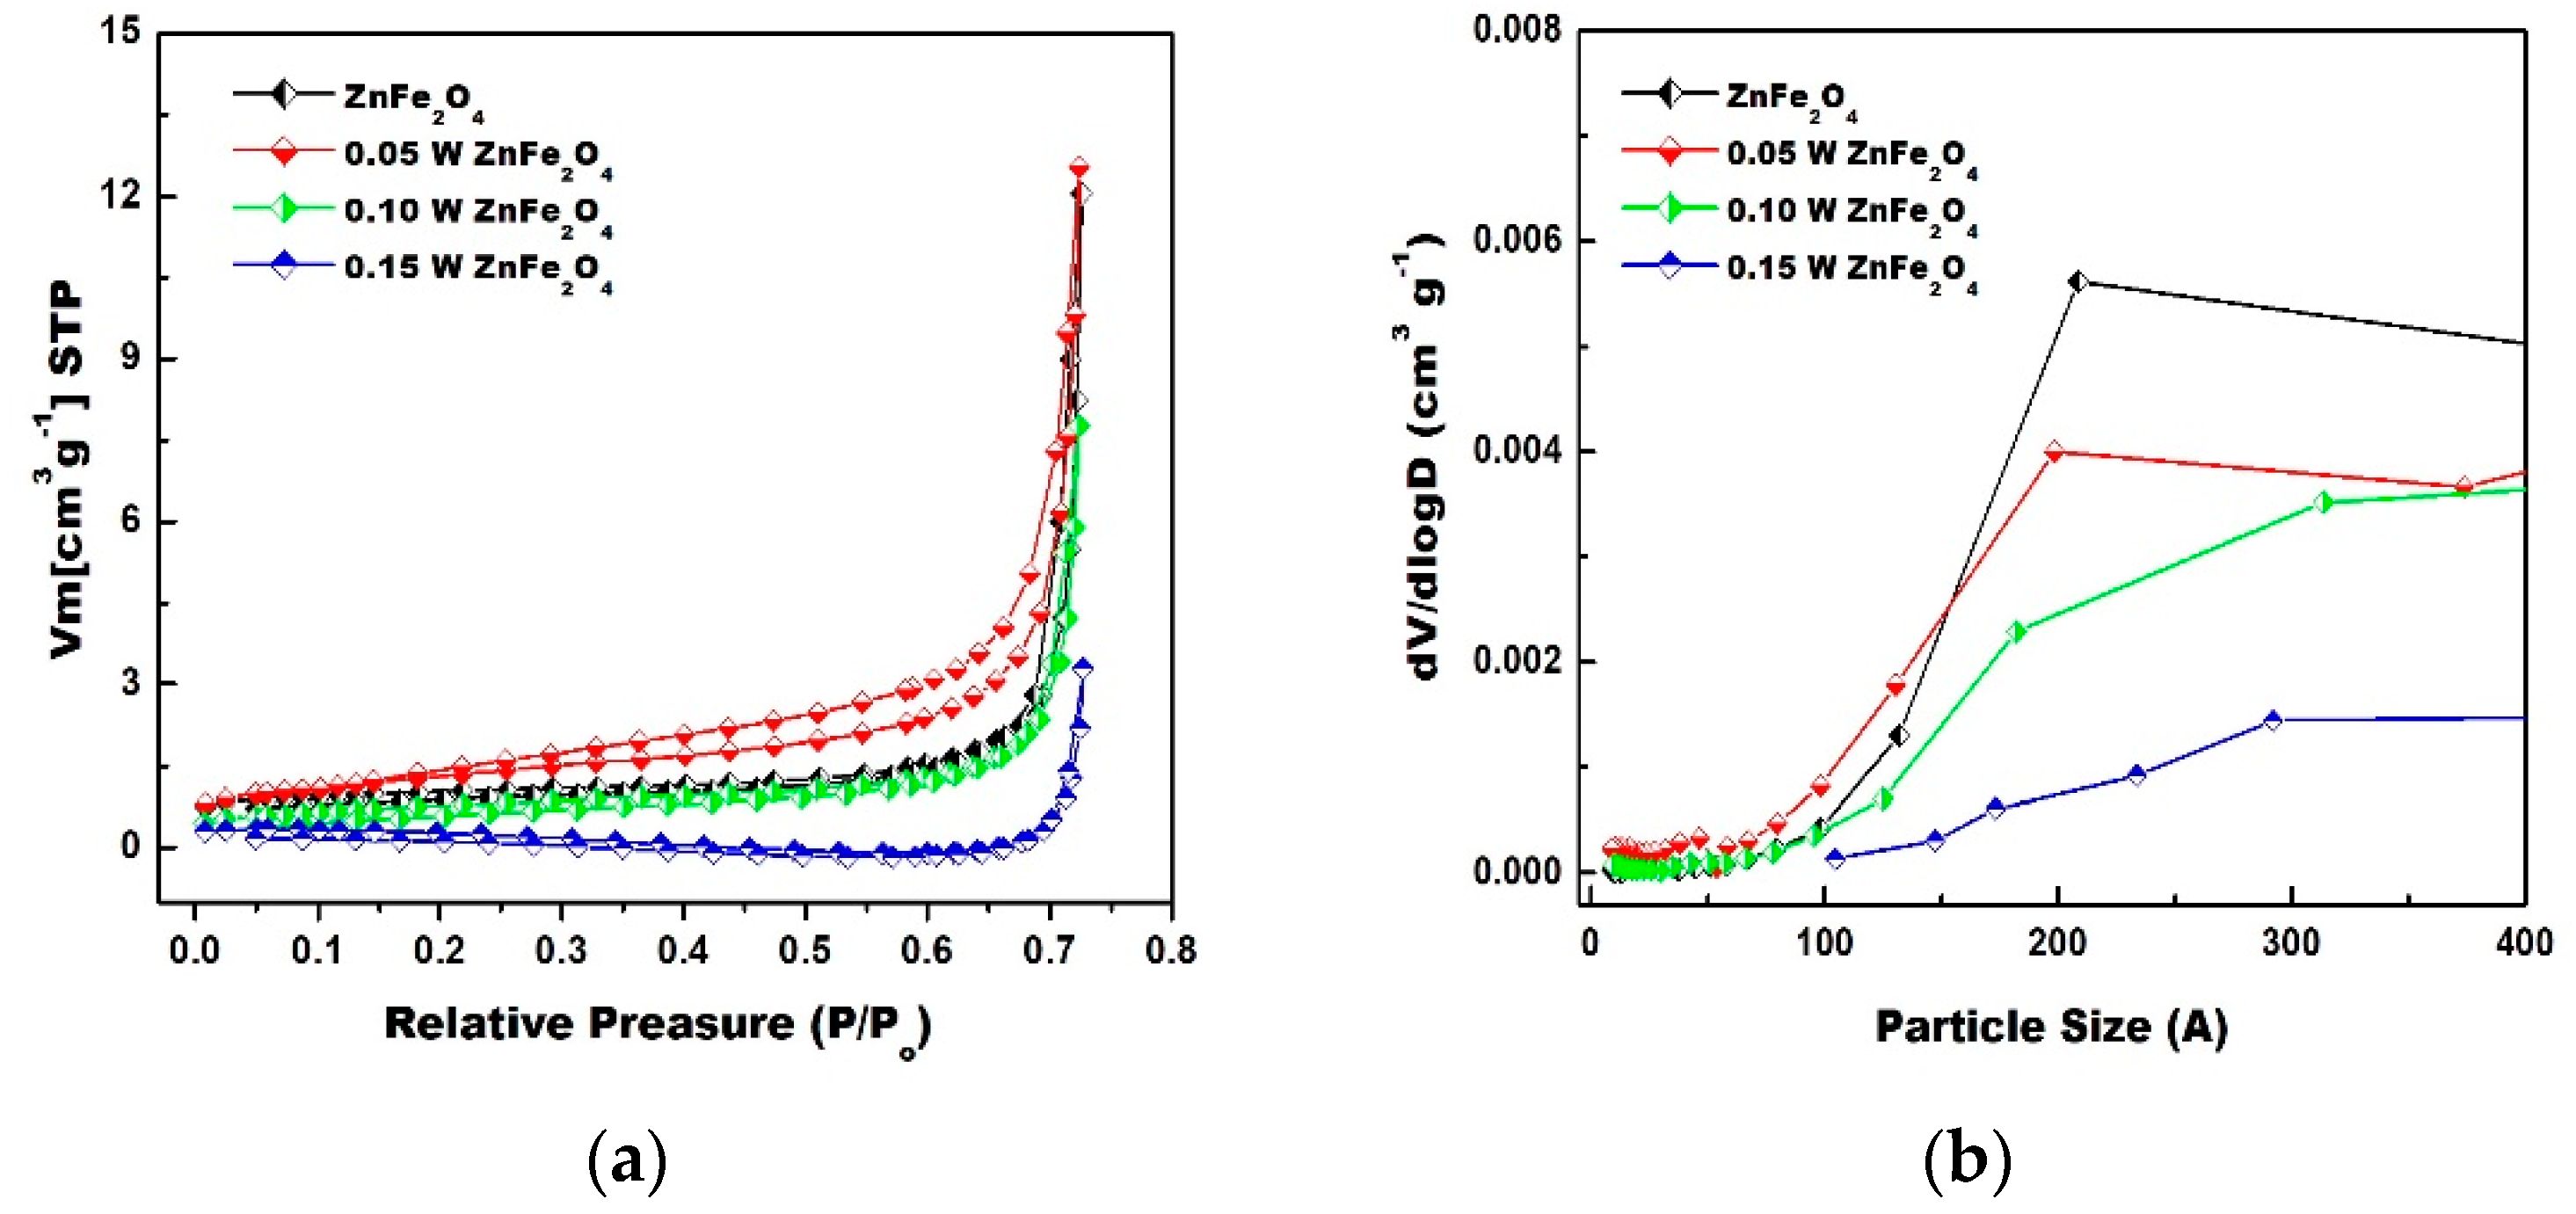
3.3. Surface Area and Porosity Analysis

The surface area and pore size of the pure ZnFe2O4 and W-substituted ZnFe2−2xWxO4 (0.0 ≤ x ≤ 0.15) NPs were assessed by a BET surface analyzer at 77 K. The relative pressure (P/P0) was in the range of 0.05 to 0.35. The surface area of the ZnFe2O4, ZnW0.05Fe1.95O4, ZnW0.1Fe1.90O4, and ZnW0.15Fe1.85O4 NPs were calculated as being 121.5, 129.1, 134.4 and 143.2 m2 g−1, respectively. The nitrogen adsorption–desorption hysteresis displays typical type IV isotherms with H3 loops for all ferrite samples. This demonstrated that all samples have a mesoporous microstructure system, as shown in Figure 6a. The computed BJH pore size distribution is shown in Figure 6b, showing that the pore size distributions fall between 160 and 205 Å.

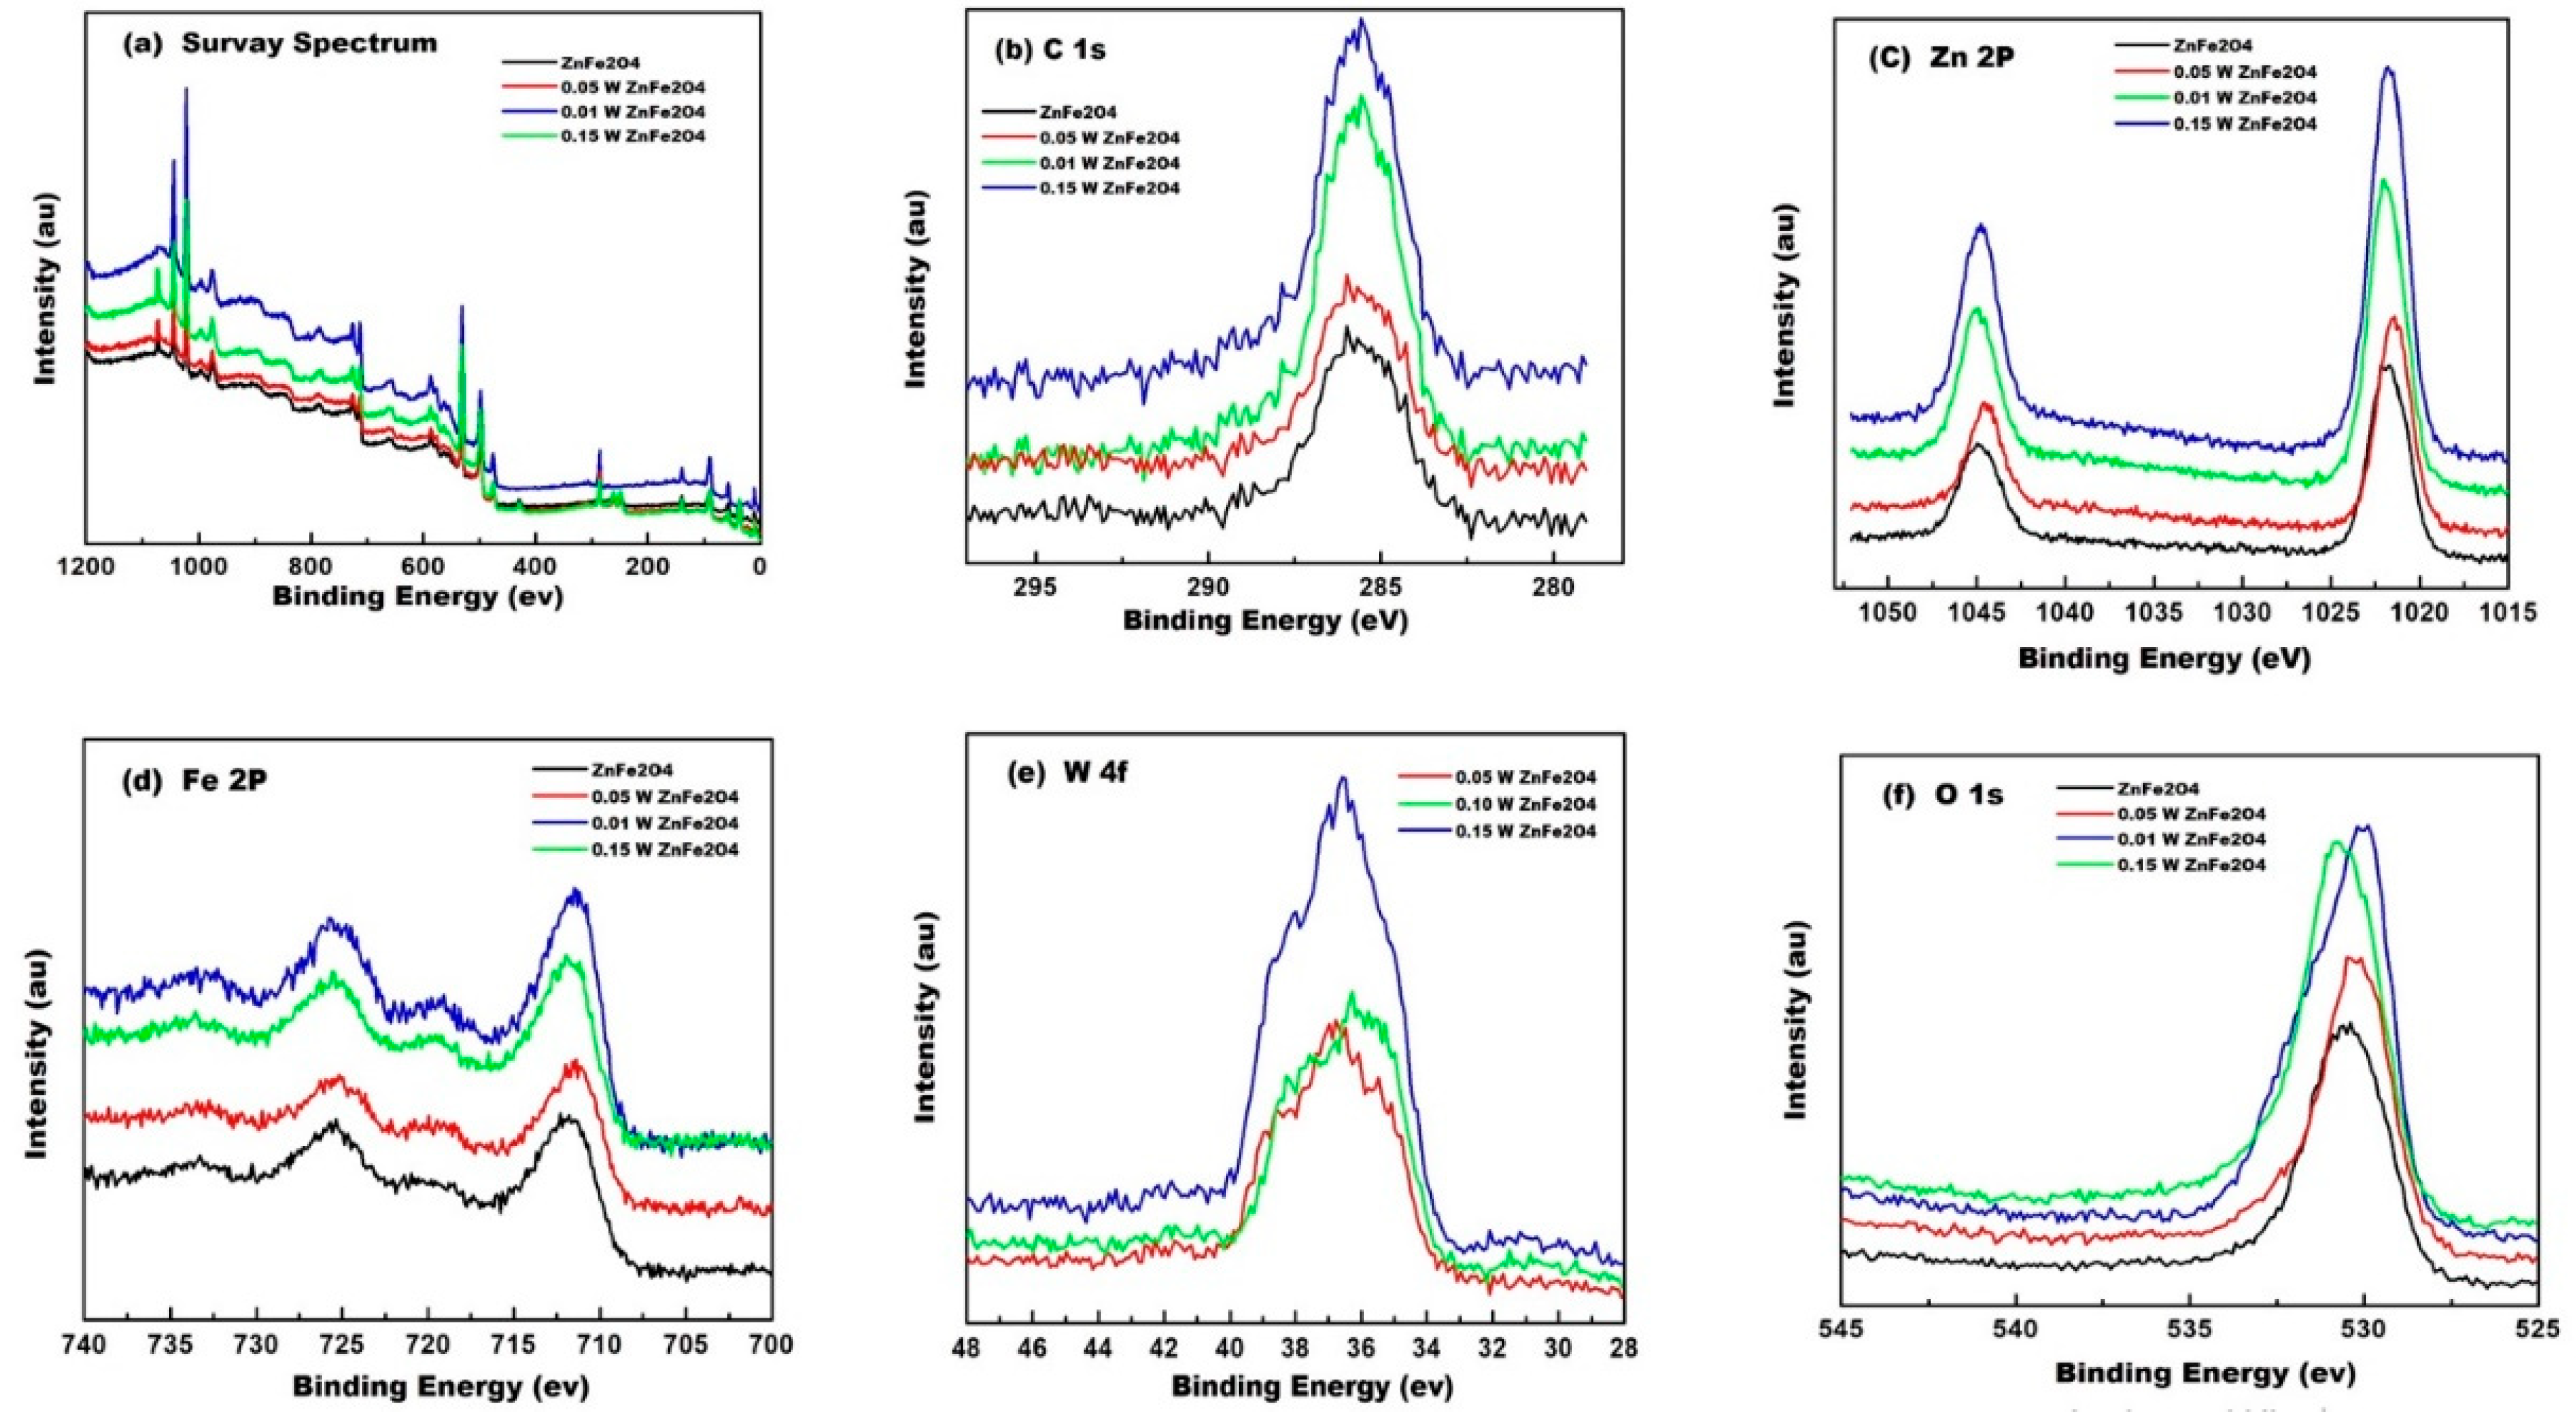
3.4. X-ray Photoelectron Spectroscopy

The chemical state and various species present in the pure ZnFe2O4 and W-substituted ZnFe2−2xWxO4 (0.0 ≤ x ≤ 0.15) NPs were analyzed by XPS techniques through binding energy estimation as shown in Figure 7a–f. The survey spectrum (Figure 7a) shows the presence of different elements (C, Zn, Fe, W and O) in the pure ZnFe2O4 and W-substituted ZnFe2−2xWxO4 (0.0 ≤ x ≤ 0.15) NPs. Moreover, in the pure ZnFe2O4, only Zn, Fe and O were recorded. The binding energies of the ZnFe2O4 and W-substituted ZnFe2O4 NPs were calibrated to the C1s (Figure 7b) peak as a reference (~286 eV) [34]. The deconvolution of Zn2p showed two split peaks at binding energies of 1045.1 and 1022.3 eV, which belong to Zn2p3/2 and Zn2p1/2, respectively, as shown in Figure 7c [35]. Figure 7d depicts the average binding energy values of Fe2p marked at the peaks originating at 723.1 and 711.5 eV, which could be indicative of the presence of Fe 2p1/2 and Fe 2p3/2 doublets [36]. The XPS spectra of W-doped ferrites (Figure 7e) demonstrated two W-4f split peaks at binding energies of 37.6 and 35.7 eV, which correspond to 4f5/2 and 4f7/2 [37]. The XPS spectrum explains the origin of oxygen vacancies, with the primary peak being at the high-resolution O1s peak, which have binding energies of 530.3 and 530.3 eV, respectively, as shown in Figure 7f [38]. The XPS results coincide well with the XRD studies of ZnFe2O4 and W-substituted ZnFe2O4 nanoparticles, which confirm the formation of pure ZnFe2O4 and W-substituted ZnFe2O4 structures free from any type of impurities and a mixed phase.

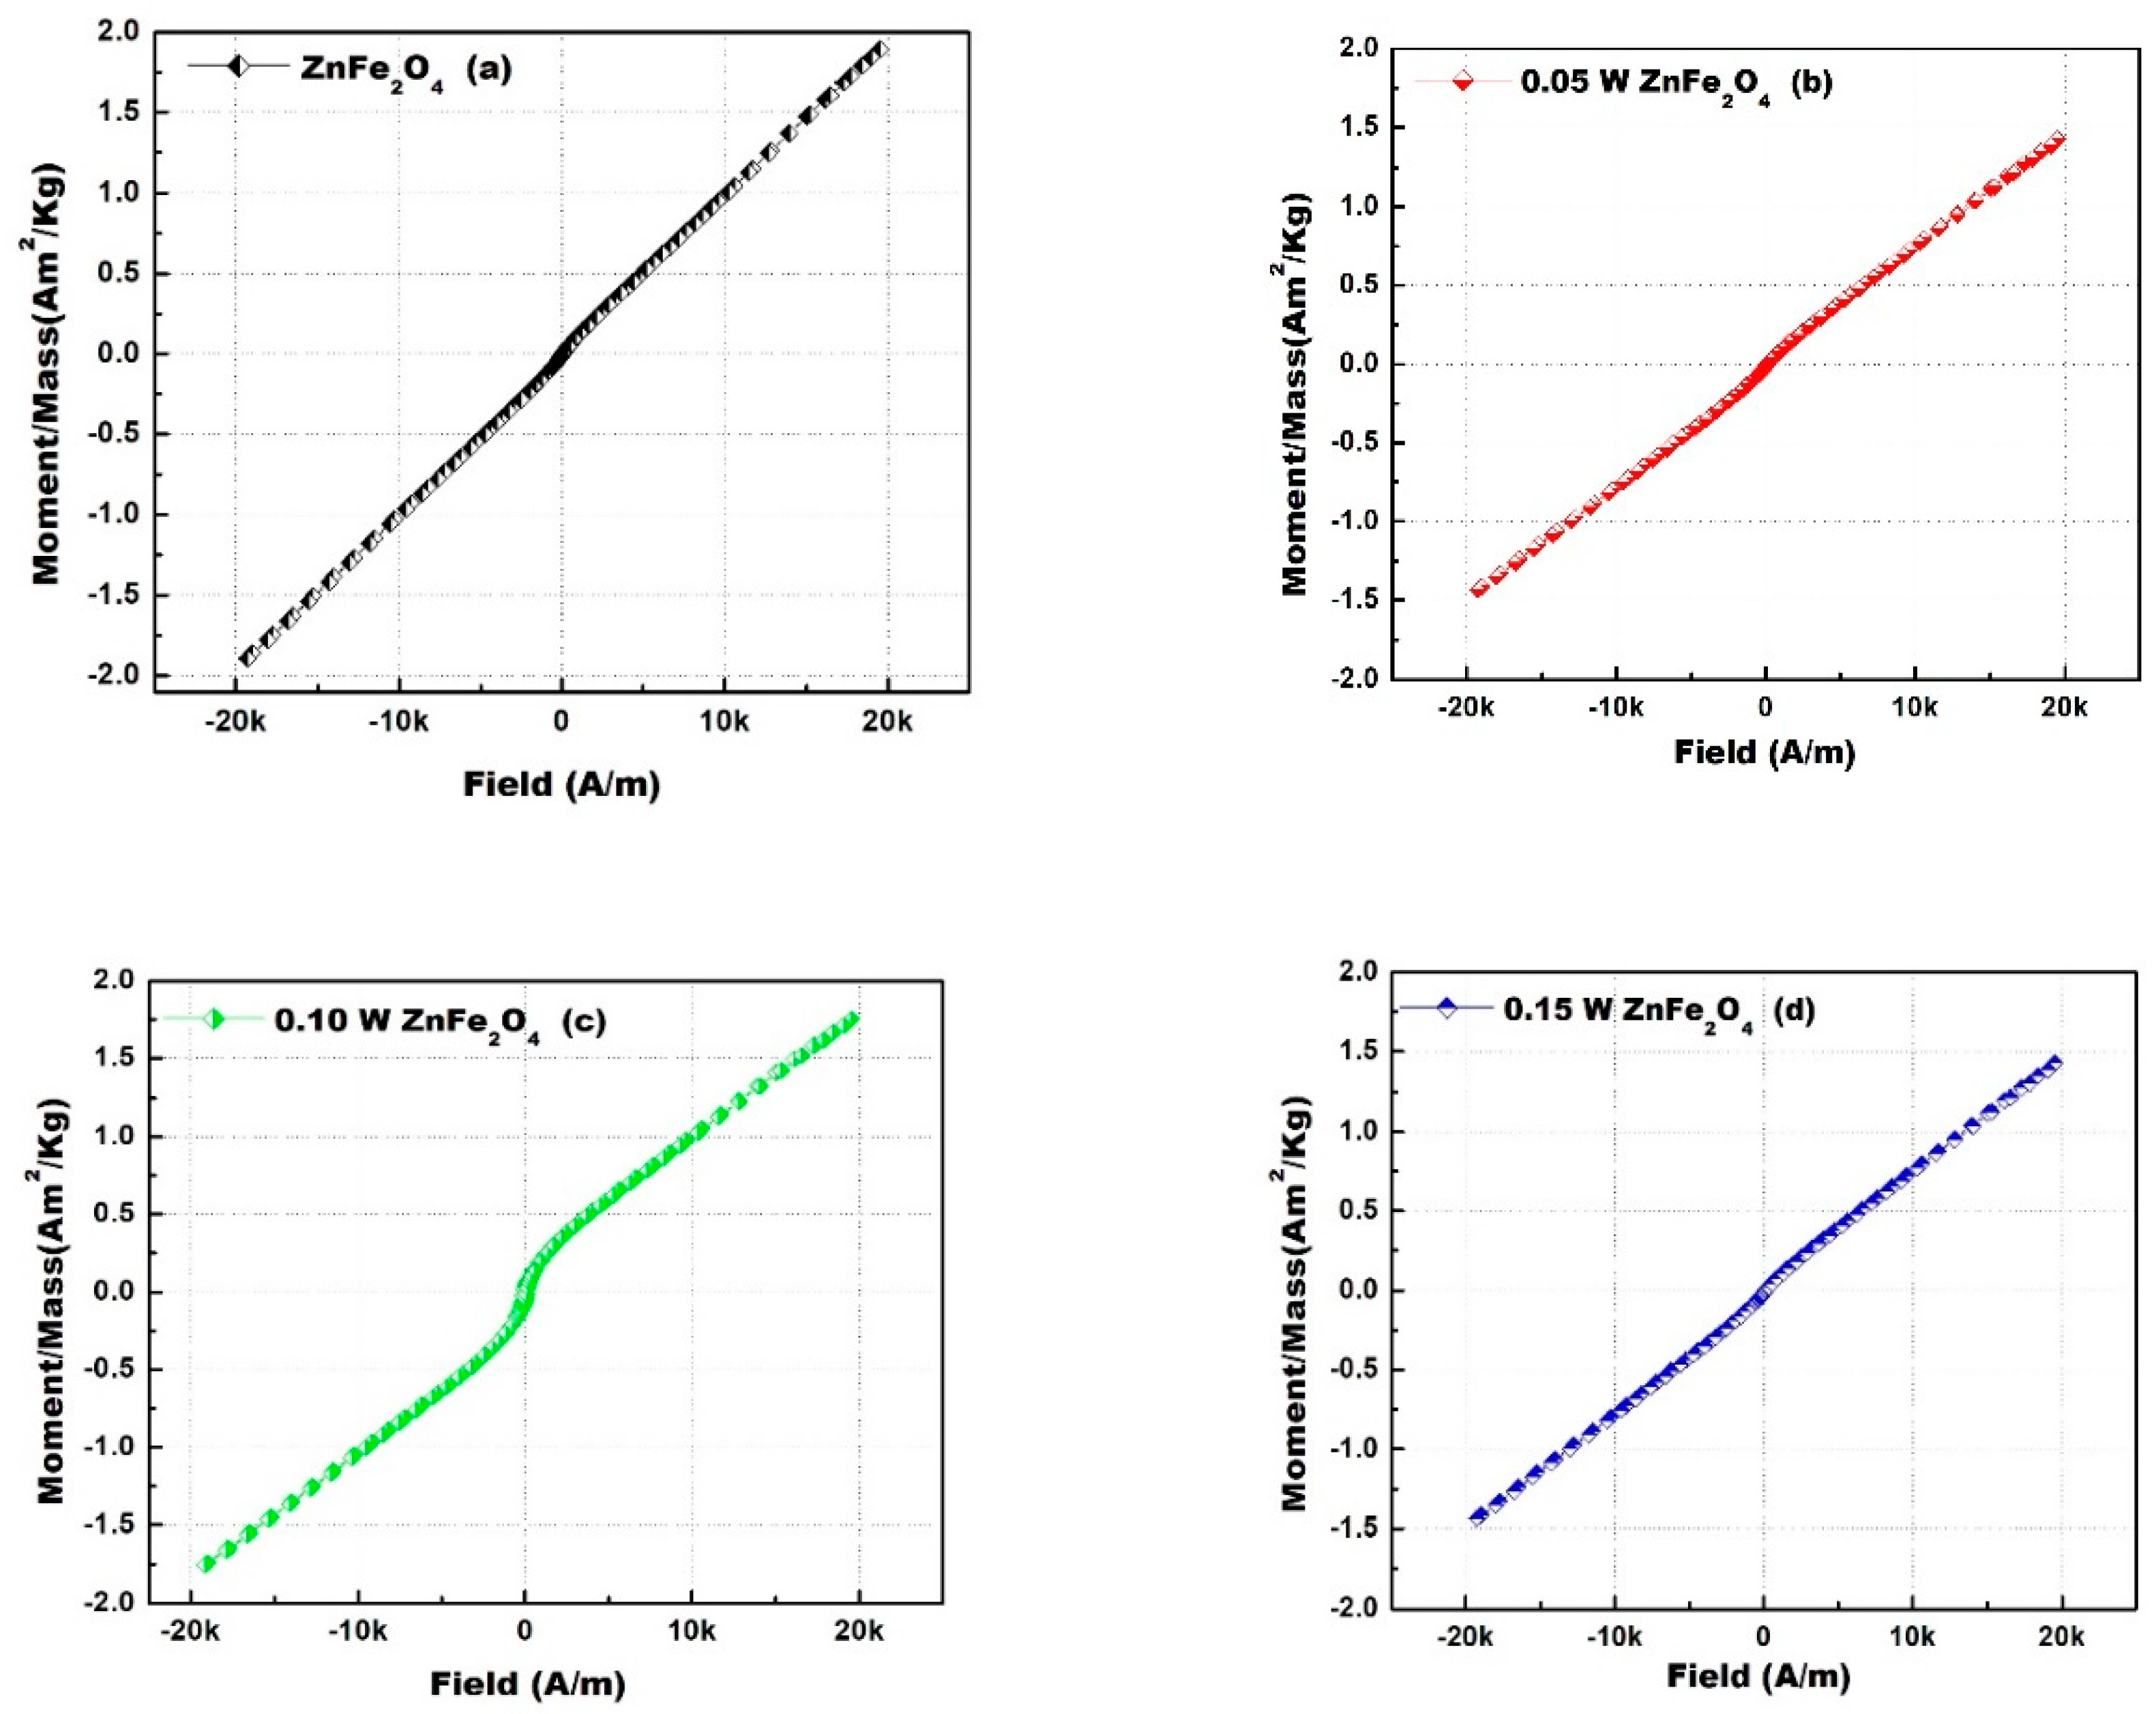
3.5. Magnetic Properties (VSM)

The impact of tungsten insertion on the magnetic properties of the zinc ferrite host lattice was investigated. The recordings of the H-M hysteresis loops using VSM at room temperature are displayed in Figure 8a–d. The H-M loops do not show any hysteresis, remanence or coercivity, and all samples do not achieve any saturation even at the highest applied magnetic field (20 kA/m). This is the behavior of typical superparamagnetic materials, indicating that the ZnFe2O4 present is normal spinel-type ferrite [39]. All W-doped ZnFe2O4 samples show H-M loops with paramagnetic characteristics. The magnetization (M) directly increases as the applied field (H) increases, without achieving saturation up to 20 kA/m. For comparison, the magnetization at 20 kA/m (Table 3) decreases gradually with increasing W doping; 1.9921, 1.8901, 1.7535 and 1.4308 Am2/kg for ZnFe2O4 samples with x = 0.00, 0.05, 0.10 and 0.15, respectively. The decrease in magnetization at a constant field with increasing doping level can be justified by both a reduction in particle size and the cations’ redistribution among the tetrahedral and octahedral positions. The latter effect is induced by W doping. Cobos et.al. [40] found that ZnFe2O4 prepared at high temperatures consists of mainly normal spinel with minimum cation inversion and shows paramagnetic behavior at room temperature.

4. Gas Sensor

4.1. Sensor Mechanism

Spinel ferrites such as zinc ferrite are potential candidates for use in the production of new sensing materials. The Oــ2 ion is one of the surface components of zinc ferrite in the cube (face-centered) orientation. The most evident deep-level and surface defects are the oxygen vacancies, which play a central role in sensing toxic gases. Similarly, the Zn2+ interstitials in the crystalline structure of Zn2+Fe3+O4 are also vital for gas sensor applications. Despite there being various gas sensing mechanisms, all of them involve the interactions of the target gas with the solid sensor interface. In the air, the oxygen from the atmosphere adsorbs on the sensor surface and captures an electron from the sensor bulk. These can be represented according to the following equations:
O 2   ( gas ) O 2   ( ads )
O 2   ( ads ) + e O 2   ( ads )
This creates an electron-deficient region under the surface. The depth of the electron-deficient region is controlled by the density of the adsorbed oxygen molecules. When the sensed gas interacts with O2− on the surface it may reduce or oxidize oxygen species and affect the electron depletion layer, and the conductivity changes. Similarly, the oxygen anions are adsorbed on the ZnFe2O4 surface in ambient air, forming a depletion region on the surface. Temperature plays a significant role in determining the forms that oxygen anions take. The oxygen anions primarily consist of O2−. When the operating temperature is less than 147 °C, as the temperature continues to rise O2− will undergo a transformation that results in O according to the following equation:
O 2   ( ads ) + 2 e   2 O 2 ( ads )
At temperatures higher than 397 °C, the oxygen anions undergo a chemical change that results in the formation of O2−. This reduces the number of electrons in the depletion layer of the semiconductor sensor and if the sensor is n-type, the sensor’s resistance will increase. When a reducing gas is adsorbed on the sensor surface, it interacts with the surface oxygen ions according to the following equations:
G   ( gas ) G   ( ads )
G   ( ads ) + O GO + e
The electron depletion layer will increase, and the sensor resistance will decrease. For example, the acetone sensing mechanism involves reduction of the surface oxygen ion according to the following equation:
C 3   H 6   O   + 8 O   3 CO 2 + 3 H 2 O + 8 e
Hence, the gas sensing mechanism depends on the oxygen and gas adsorption/desorption activity on the surface, which is in turn greatly affected by the surface area and defects. Thus, we expected that zinc ferrite with high amounts of surface defects due to high-valent cation doping would be an excellent material for reducing gas sensors [41]. Zinc ferrite’s low oxygen adsorption energy facilitates reactions with reducing gases, resulting in a very good sensor response.

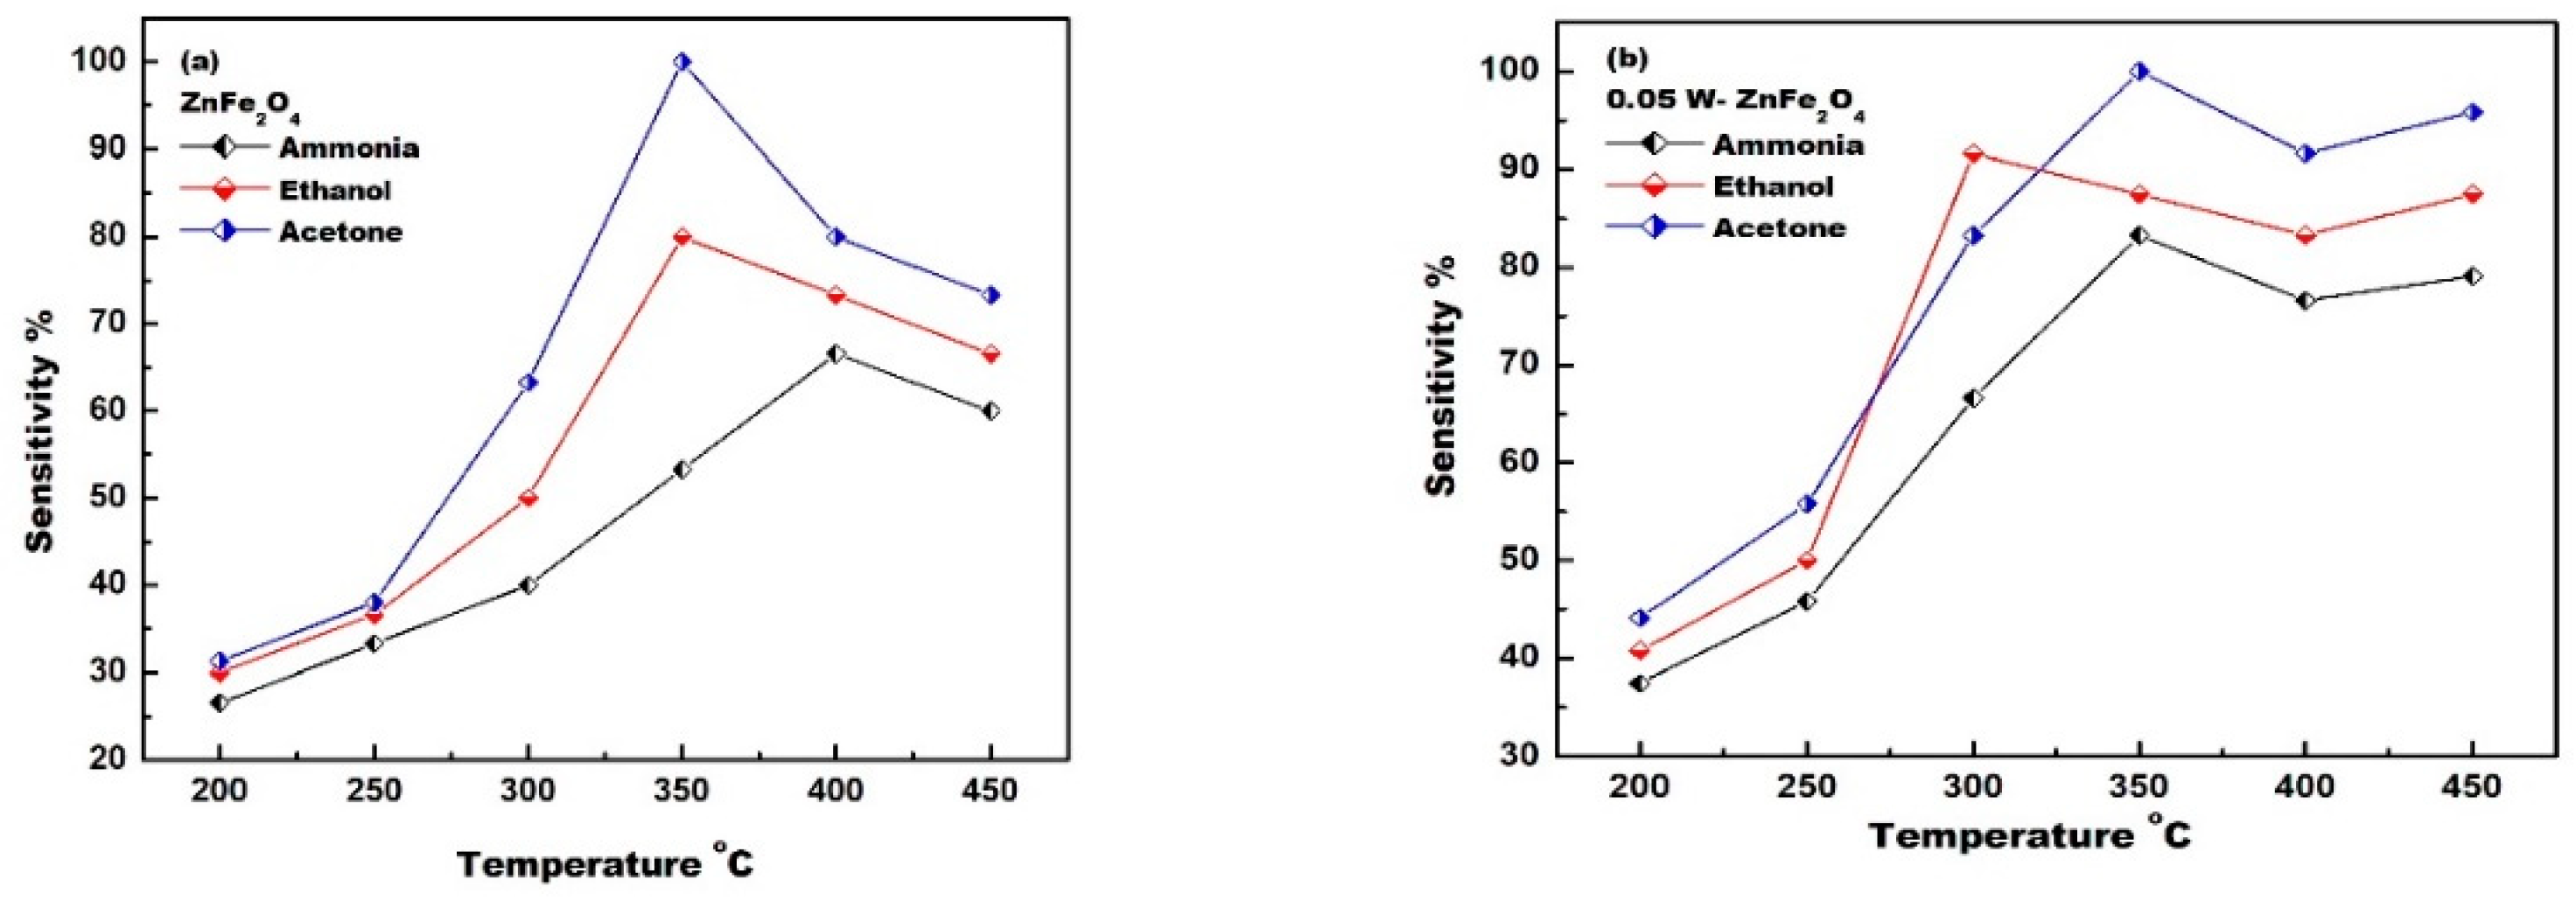
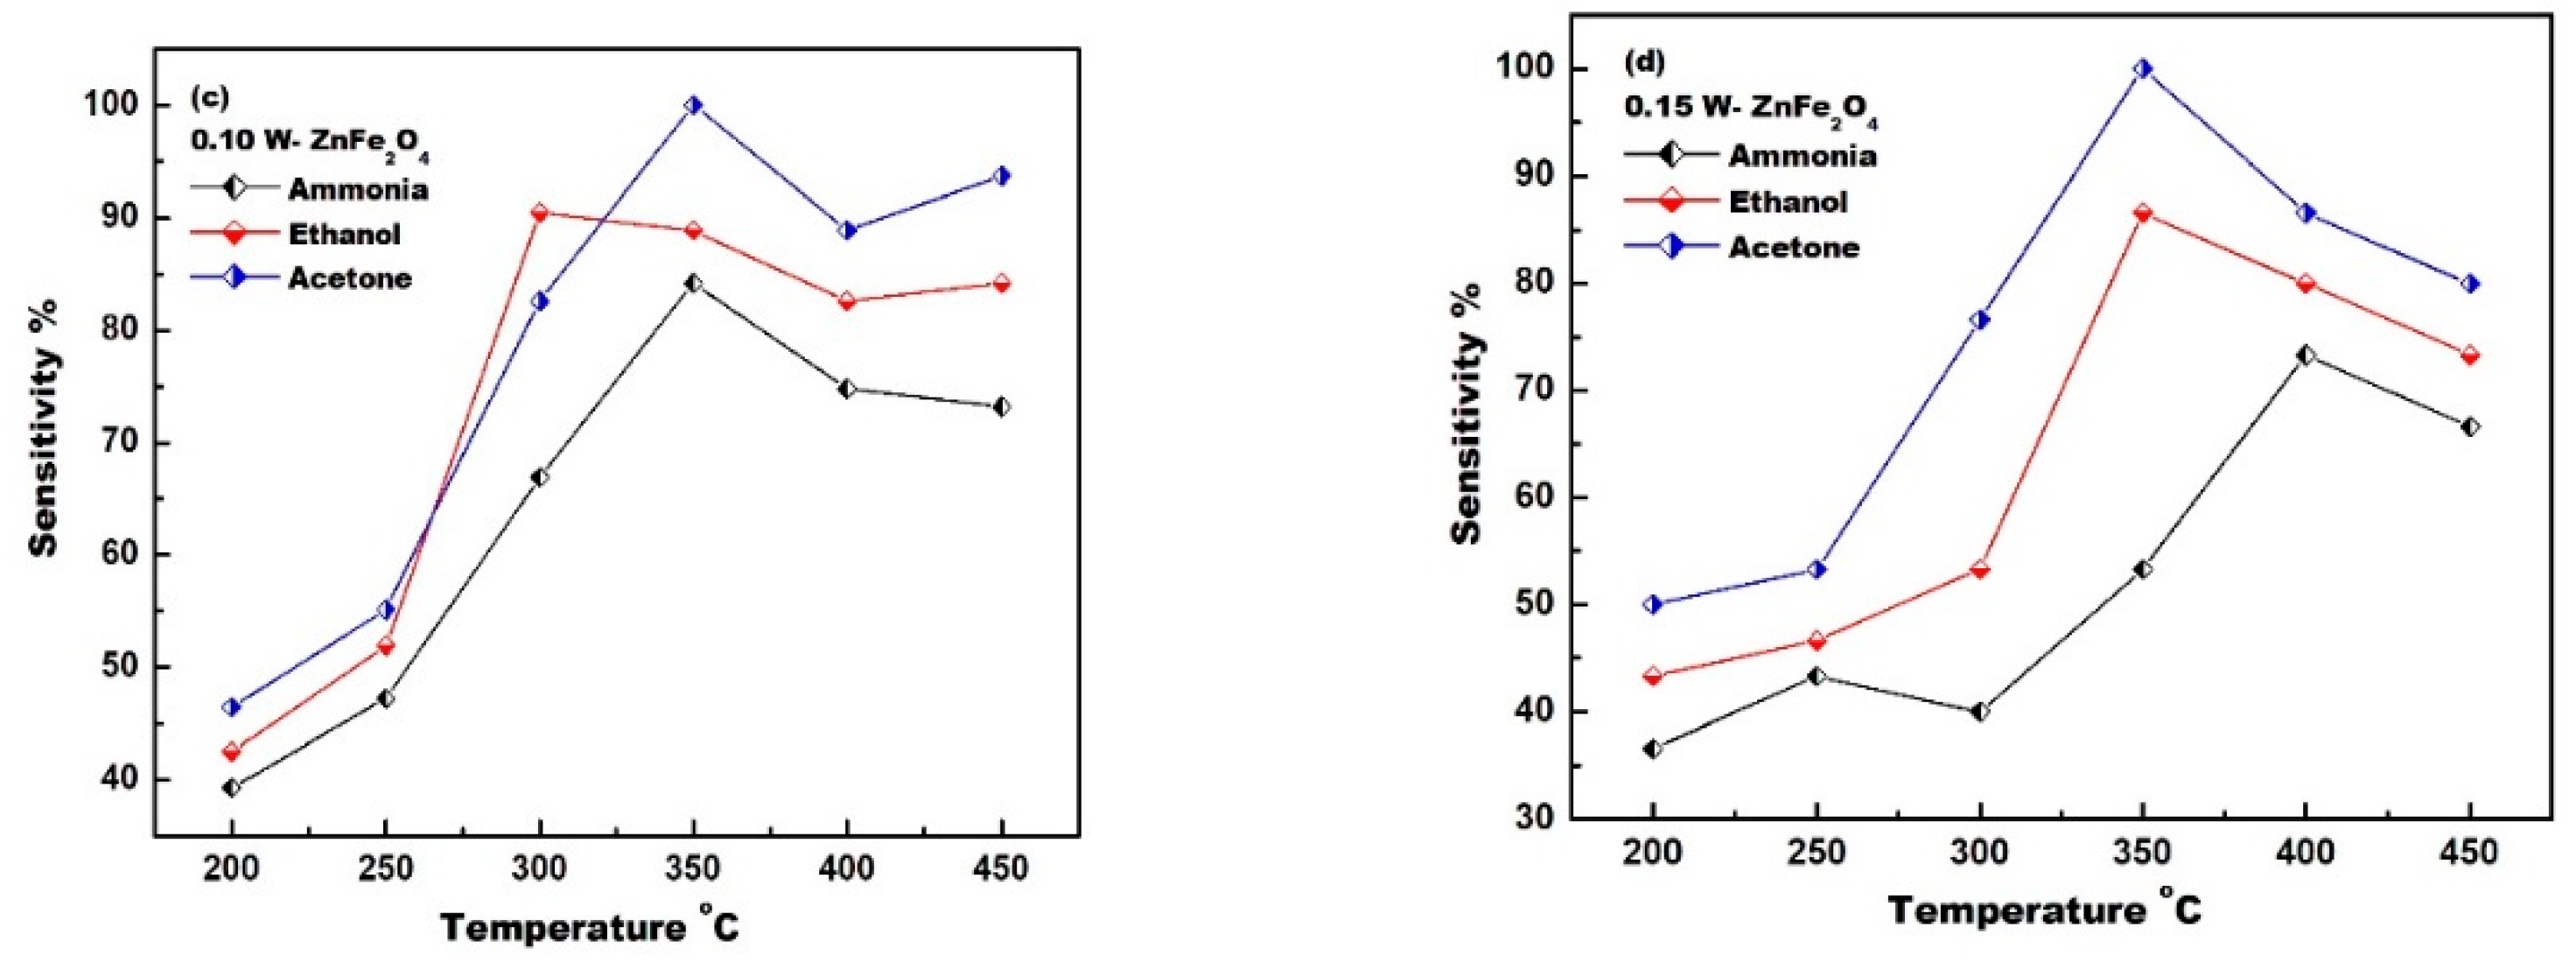
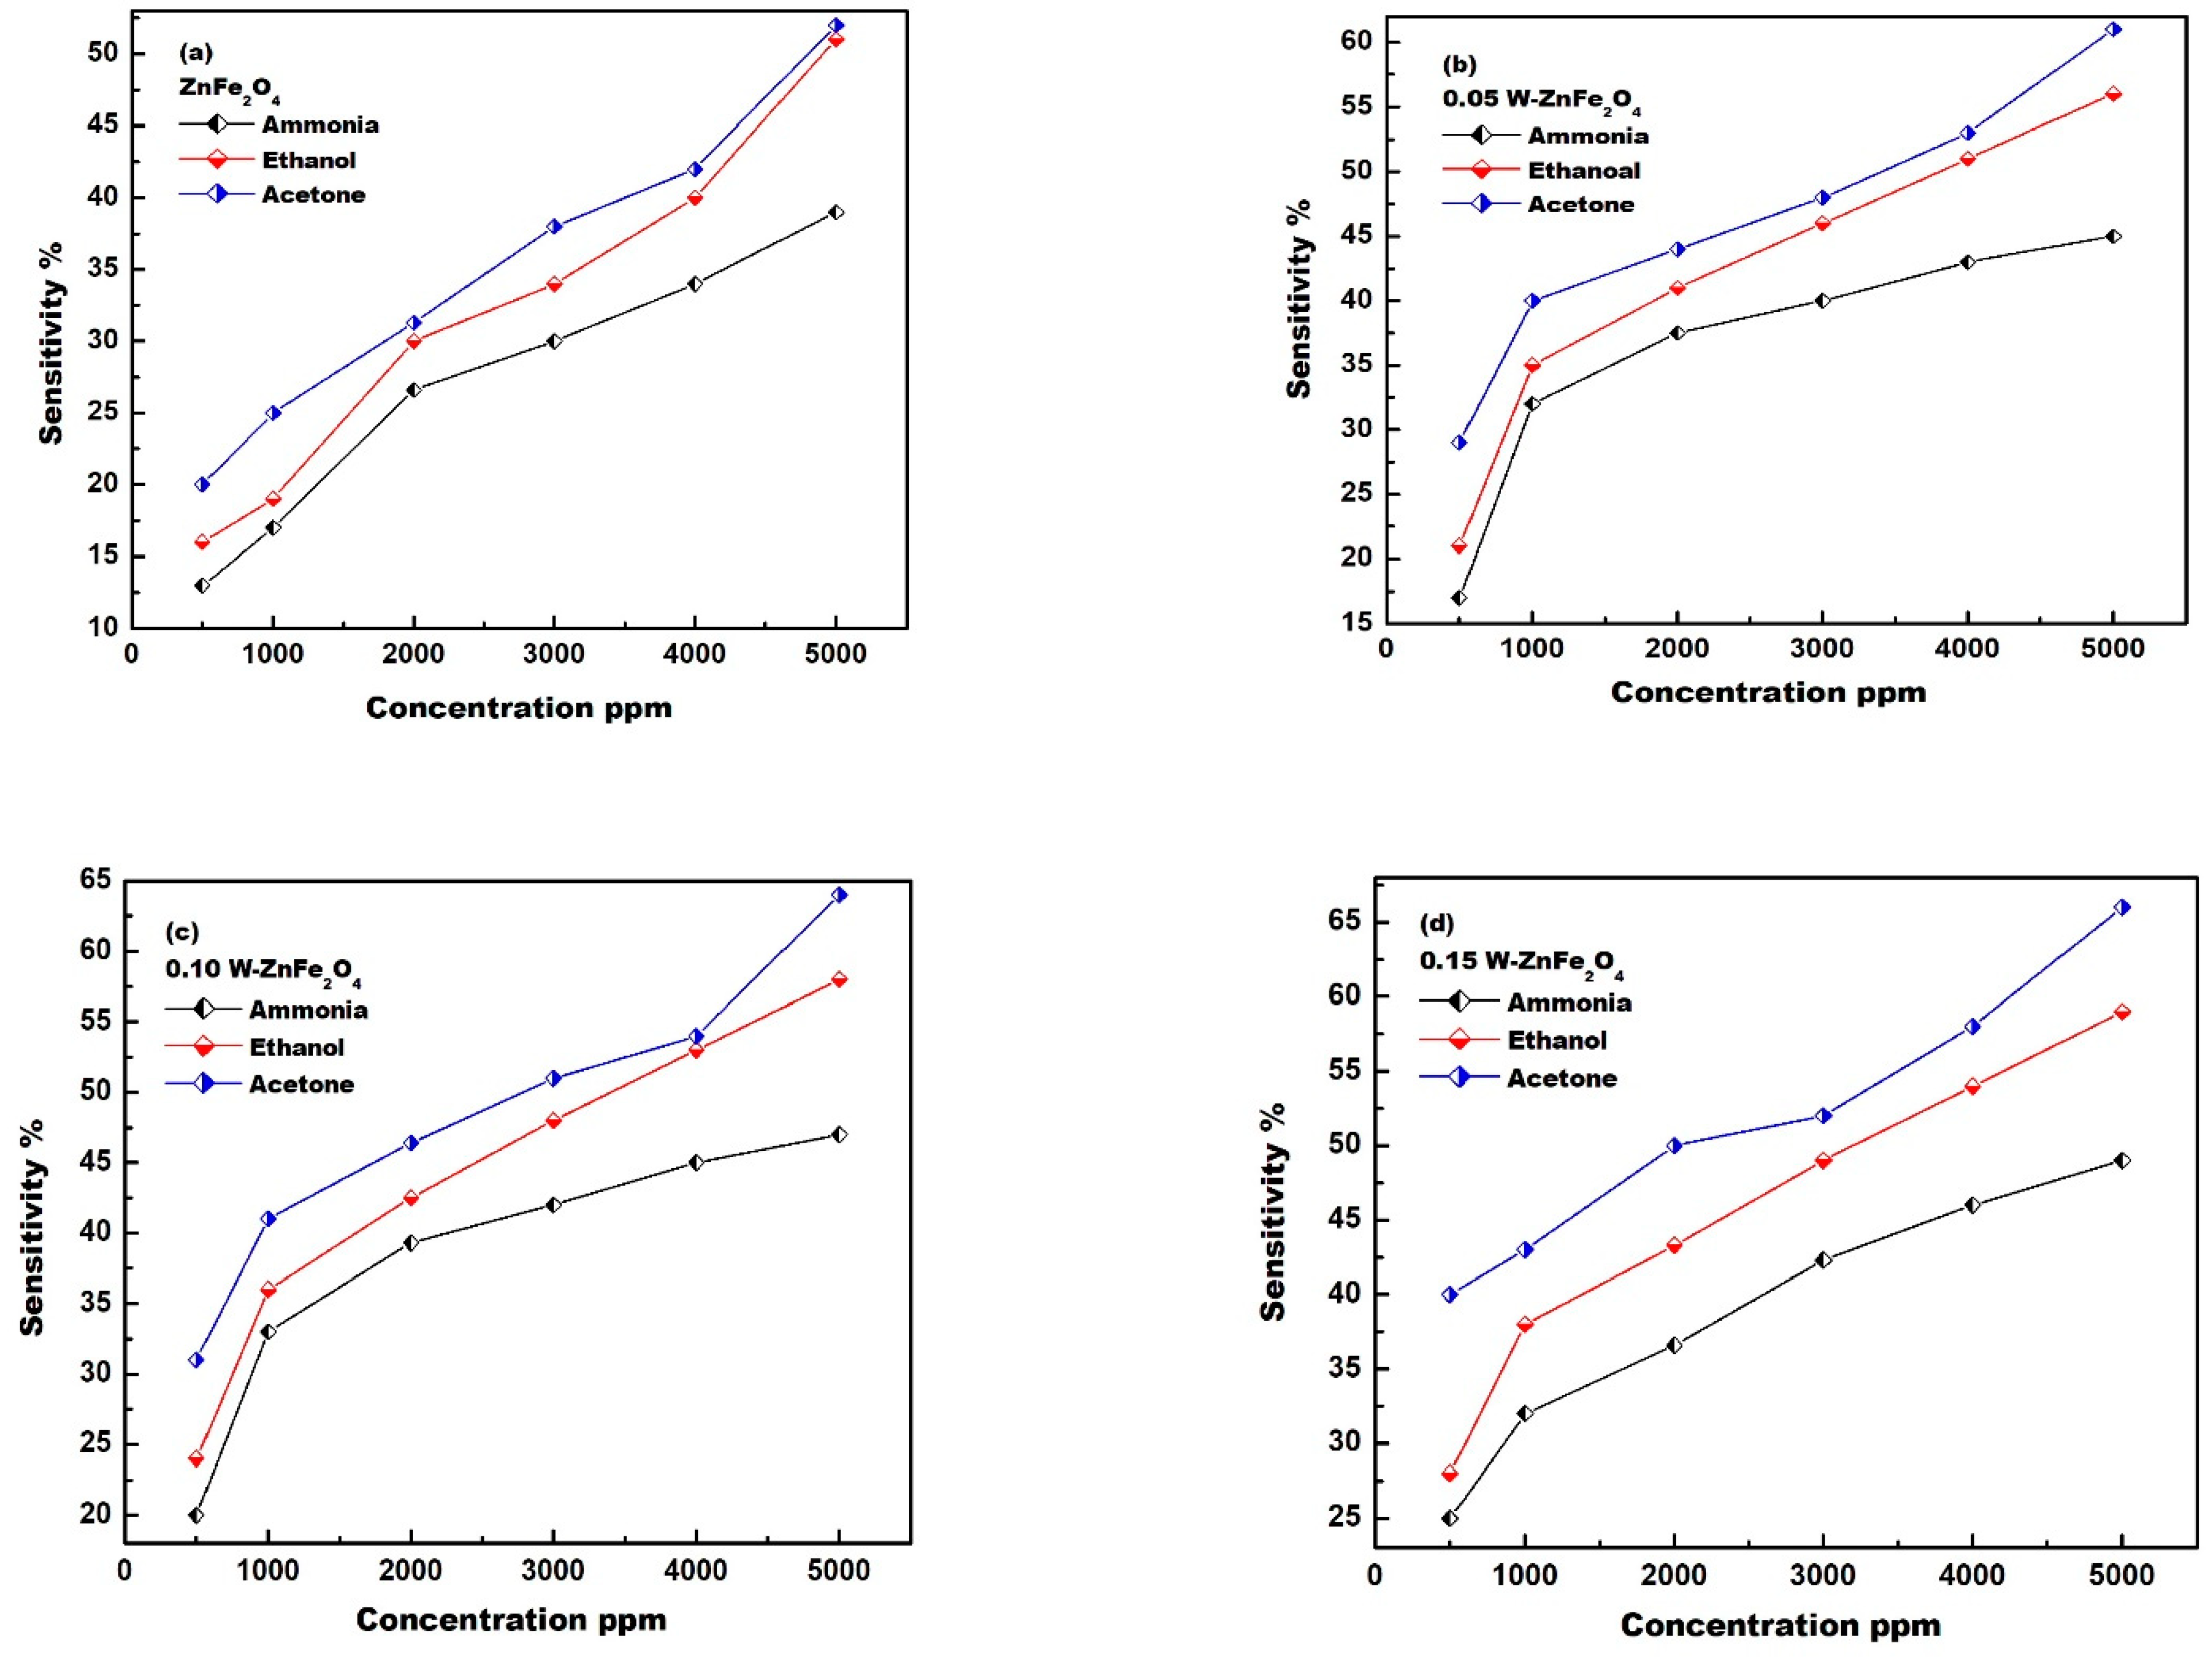
4.2. Gas Sensor Measurement

The fabricated nanostructures were exposed to ethanol, acetone, and ammonia at a concentration of 2000 ppm, at temperatures ranging from 200 to 450 °C. The channel resistance of the sensors was measured before and after the exposure to the test gas. Figure 9a–d exhibit the sensor responses of pure ZnFe2O4, 0.05 W-ZnFe2O4, 0.10 W-ZnFe2O4, and 0.15 W-ZnFe2O4 with the different tested gases—acetone, ethanol, and ammonia—at the optimum operating temperature of 350 °C. Acetone shows the highest sensitivity response as compared with other gases. Among all the synthesized samples, 0.15 W-ZnFe2O4 NPs demonstrated the highest sensitivity towards acetone gas at 350 °C. The high sensitivity of this sample is due to it having the highest amount of defects and the highest surface area. These defects are created because every W (VI) ion replaces two Fe (III) ions in the host lattice, creating one empty site. The high surface area and the high amount of defects enhance the gas adsorption by offering more active sites, thus boosting the sensitivity. Sutka and Doebelin found that non-stoichiometry in ZnFe2O4 increases gas responsiveness and sensitivity [42].
Figure 10a–d reveal the sensitivity of pure ZnFe2O4, ZnW0.05Fe1.95O4, ZnW0.1Fe1.90O4, and ZnW0.15Fe1.85O4 to ammonia, ethanol, and acetone at different concentrations. The sensor responses improve when the gas concentrations are raised. For each of the ZnFe2O4 compositions, the highest sensitivity was to acetone. Moreover, ZnW0.15Fe1.85O4 samples show maximum sensitivity towards acetone in comparison with ethanol and ammonia.

5. Conclusions

Pure and W-substituted zinc ferrite with a nominal composition of ZnFe2−2xWxO4 (0.0 ≤ x ≤ 0.15) were synthesized via a sol–gel method. ZnFe2O4 and W-substituted ZnFe2−2xWxO4 (0.0 ≤ x ≤ 0.15) showed the agglomerated morphology with embedded nanoparticles and non-uniform size. Mixed-shape particles (cubic, spherical and hexagonal) were observed in TEM micrographs for all compositions. The crystallite size decreases from 82 nm (x = 0.0) to 32 nm (x = 0.15) with an increase in the W doping contents of the ZnFe2O4 lattice. The microstrain increases with increasing W doping content. Moreover, the BET surface areas of ZnFe2O4, ZnW0.05Fe1.95O4, ZnW0.1Fe1.90O4, and ZnW0.15Fe1.85O4 NPs were calculated as being 121.5, 129.1, 134.4 and 143.2 m2 g−1, respectively, whereas the BJH pore size distribution ranged from 160 to 205 Å, which also confirms the meso-porosity.
Among all the synthesized samples, ZnW0.15Fe1.85O4 NPs demonstrated the highest sensitivity towards acetone gas at 350 °C.

Author Contributions

Conceptualization, N.Y.M. and O.H.A.-E.; methodology, S.F.S., M.U. and O.H.A.-E.; software, O.H.A.-E.; validation, N.Y.M. and O.H.A.-E.; formal analysis, N.Y.M., O.H.A.-E. and A.M.A.-E.; investigation, N.Y.M. and O.H.A.-E.; inquiry, N.Y.M.; resources, N.Y.M., A.M.A.-E. and O.H.A.-E.; data curation, S.F.S., M.U. and M.O.A.; writing—original preparation of the draft, N.Y.M. and O.H.A.-E.; writing—review and editing, N.Y.M. and O.H.A.-E.; visualization, N.Y.M. and O.H.A.-E.; supervision, N.Y.M. and O.H.A.-E.; project administration, A.M.A.-E. and O.H.A.-E.; funding acquisition, O.H.A.-E. All authors have read and agreed to the published version of the manuscript.

Funding

This project was funded by the National Plan for Science, Technology and Innovation (MAARIFAH), King Abdulaziz City for Science and Technology, Kingdom of Saudi Arabia, Award Number (13- ADV 1478-02).

Institutional Review Board Statement

Not applicable.

Informed Consent Statement

Not applicable.

Data Availability Statement

The data presented in this study are available on request to the corresponding author.

Acknowledgments

The authors would like to extend their sincere appreciation to the National Plan for Science, Technology and Innovation (MAARIFAH), King Abdulaziz City for Science and Technology, Kingdom of Saudi Arabia, Award Number (13- ADV 1478-02).

Conflicts of Interest

The authors declare no conflict of interest.

References

  1. Dippong, T.; Levei, E.A.; Cadar, O. Recent Advances in Synthesis and Applications of MFe2O4 (M = Co, Cu, Mn, Ni, Zn) Nanoparticles. Nanomaterials 2021, 11, 1560. [Google Scholar] [CrossRef] [PubMed]
  2. Luchechko, A.; Zhydachevskyy, Y.; Ubizskii, S.; Kravets, O.; Popov, A.I.; Rogulis, U.; Elsts, E.; Bulur, E.; Suchocki, A. Afterglow, TL and OSL Properties of Mn2+-Doped ZnGa2O4 Phosphor. Sci. Rep. 2019, 9, 9544. [Google Scholar] [CrossRef] [PubMed]
  3. Lushchik, A.; Feldbach, E.; Kotomin, E.A.; Kudryavtseva, I.; Kuzovkov, V.N.; Popov, A.I.; Seeman, V.; Shablonin, E. Distinctive Features of Diffusion-Controlled Radiation Defect Recombination in Stoichiometric Magnesium Aluminate Spinel Single Crystals and Transparent Polycrystalline Ceramics. Sci. Rep. 2020, 10, 7810. [Google Scholar] [CrossRef]
  4. Beji, Z.; Hanini, A.; Smiri, L.S.; Gavard, J.; Kacem, K.; Villain, F.; Grenèche, J.-M.; Chau, F.; Ammar, S. Magnetic Properties of Zn-Substituted MnFe2O4 Nanoparticles Synthesized in Polyol as Potential Heating Agents for Hyperthermia. Evaluation of Their Toxicity on Endothelial Cells. Chem. Mater. 2010, 22, 5420–5429. [Google Scholar] [CrossRef]
  5. Rana, K.; Thakur, P.; Sharma, P.; Tomar, M.; Gupta, V.; Thakur, A. Improved Structural and Magnetic Properties of Cobalt Nanoferrites: Influence of Sintering Temperature. Ceram. Int. 2015, 41, 4492–4497. [Google Scholar] [CrossRef]
  6. Thakur, P.; Taneja, S.; Chahar, D.; Ravelo, B.; Thakur, A. Recent Advances on Synthesis, Characterization and High Frequency Applications of Ni-Zn Ferrite Nanoparticles. J. Magn. Magn. Mater. 2021, 530, 167925. [Google Scholar] [CrossRef]
  7. Cross, W.B.; Affleck, L.; Kuznetsov, M.V.; Parkin, I.P.; Pankhurst, Q.A. Self-Propagating High-Temperature Synthesis of Ferrites MFe2O4 (M = Mg{,} Ba{,} Co{,} Ni{,} Cu{,} Zn); Reactions in an External Magnetic Field. J. Mater. Chem. 1999, 9, 2545–2552. [Google Scholar] [CrossRef]
  8. Grimes, R.W.; Anderson, A.B.; Heuer, A.H. Predictions of Cation Distributions in AB2O4 Spinels from Normalized Ion Ener-gies. J. Am. Chem. Soc. 1989, 111, 1–7. [Google Scholar] [CrossRef]
  9. Blanco-Gutiérrez, V.; Torralvo-Fernández, M.J.; Sáez-Puche, R. Magnetic Behavior of ZnFe2O4 Nanoparticles: Effects of a Solid Matrix and the Particle Size. J. Phys. Chem. C. 2010, 114, 1789–1795. [Google Scholar] [CrossRef]
  10. Jang, J.; Nah, H.; Lee, J.-H.; Moon, S.H.; Kim, M.G.; Cheon, J. Critical Enhancements of MRI Contrast and Hyperthermic Ef-fects by Dopant-Controlled Magnetic Nanoparticles. Angew. Chem. Int. Ed. 2009, 48, 1234–1238. [Google Scholar] [CrossRef]
  11. Abd-Elkader, O.; Al-Enizi, A.M.; Shaikh, S.F.; Ubaidullah, M.; Abdelkader, M.O.; Mostafa, N.Y. The Structure, Magnetic, and Gas Sensing Characteristics of W-Substituted Co-Ferrite Nanoparticles. Crystals. 2022, 12, 393. [Google Scholar] [CrossRef]
  12. El-Shobaky, G.A.; Turky, A.M.; Mostafa, N.Y.; Mohamed, S.K. Effect of Preparation Conditions on Physicochemical, Surface and Catalytic Properties of Cobalt Ferrite Prepared by Coprecipitation. J. Alloys Compd. 2010, 493, 415–422.e16. [Google Scholar] [CrossRef]
  13. Heiba, Z.K.; Mostafa, N.Y.; Abd-Elkader, O.H. Structural and Magnetic Properties Correlated with Cation Distribution of Mo-Substituted Cobalt Ferrite Nanoparticles. J. Magn. Magn. Mater. 2014, 368, 246–251. [Google Scholar] [CrossRef]
  14. Hemeda, O.M.; Mostafa, N.Y.; Abd Elkader, O.H.; Ahmed, M.A. Solubility limits in Mn–Mg ferrites system under hydrothermal conditions. J. Magn. Magn. Mater. 2014, 364, 39–46. [Google Scholar] [CrossRef]
  15. Mohsen, Q.; Abd-Elkader, O.H.; Farouk, A.E.A.; Hassan, H.M.A.; Mostafa, N.Y. Influence of Tungsten Substitution on Structure, Optical, Vibrational and Magnetic Properties of Hydrothermally Prepared NiFe2O4. Appl. Phys. A Mater. Sci. Process. 2021, 127, 296. [Google Scholar] [CrossRef]
  16. Hemeda, O.M.; Mostafa, N.Y.; Abd Elkader, O.H.; Hemeda, A.; Tawfik, A. Electrical and Morphological Properties of Magnetocaloric Nano ZnNi Ferrite. J. Magn. Magn. Mater. 2015, 394, 96–104. [Google Scholar] [CrossRef]
  17. Mostafa, N.Y.; Hessien, M.M.; Shaltout, A.A. Hydrothermal Synthesis and Characterizations of Ti Substituted Mn-Ferrites. J. Alloys Compd. 2012, 529, 29–33. [Google Scholar] [CrossRef]
  18. Mostafa, N.Y.; Zaki, Z.; Hessien, M.M.; Shaltout, A.A.; Alsawat, M. Enhancing Saturation Magnetization of Mg Ferrite Nanoparticles for Better Magnetic Recoverable Photocatalyst. Appl. Phys. A Mater. Sci. Process 2018, 124, 12. [Google Scholar] [CrossRef]
  19. Manikandan, A.; Kennedy, L.J.; Bououdina, M.; Vijaya, J.J. Synthesis, Optical and Magnetic Properties of Pure and Co-Doped ZnFe2O4 Nanoparticles by Microwave Combustion Method. J. Magn. Magn. Mater. 2014, 349, 249–258. [Google Scholar] [CrossRef]
  20. Mostafa, N.Y.; Zaki, Z.I.; Heiba, Z.K. Structural and Magnetic Properties of Cadmium Substituted Manganese Ferrites Prepared by Hydrothermal Route. J. Magn. Magn. Mater. 2013, 329, 71–76. [Google Scholar] [CrossRef]
  21. Salem, B.I.; Hemeda, O.M.; Henaish, A.M.A.; Mostafa, N.Y.; Mostafa, M. Modified Copper Zinc Ferrite Nanoparticles Doped with Zr Ions for Hyperthermia Applications. Appl. Phys. A Mater. Sci. Process 2022, 128, 264. [Google Scholar] [CrossRef]
  22. Fu, X.; Ge, H.; Xing, Q.; Peng, Z. Effect of W Ion Doping on Magnetic and Dielectric Properties of Ni–Zn Ferrites by “One-Step Synthesis”. Mater. Sci. Eng. B 2011, 176, 926–931. [Google Scholar] [CrossRef]
  23. Rani, B.J.; Ravi, G.; Yuvakkumar, R.; Ganesh, V.; Ravichandran, S.; Thambidurai, M.; Rajalakshmi, A.P.; Sakunthala, A. Pure and Cobalt-Substituted Zinc-Ferrite Magnetic Ceramics for Supercapacitor Applications. Appl. Phys. A 2018, 124, 511. [Google Scholar] [CrossRef]
  24. Madake, S.B.; Patil, A.R.; Pedanekar, R.S.; Narewadikar, N.A.; Thorat, J.B.; Rajpure, K.Y. The Influence of Nickel Substitu-tion on the Structural and Gas Sensing Properties of Sprayed ZnFe2O4 Thin Films. J. Mater. Sci. Mater. Electron. 2022, 33, 6273–6282. [Google Scholar] [CrossRef]
  25. Xing, Q.K.; Peng, Z.J.; Wang, C.B.; Fu, Z.Q.; Fu, X.L. Doping Effect of W6+ Ions on Microstructural and Magnetic Properties of Mn-Zn Ferrites. Key Eng. Mater. 2012, 512, 1408–1411. [Google Scholar] [CrossRef]
  26. Srinivas, C.; Ranjith Kumar, E.; Tirupanyam, B.V.; Singh Meena, S.; Bhatt, P.; Prajapat, C.L.; Chandrasekhar Rao, T.V.; Sastry, D.L. Study of Magnetic Behavior in Co-Precipitated Ni–Zn Ferrite Nanoparticles and Their Potential Use for Gas Sensor Applications. J. Magn. Magn. Mater. 2020, 502, 166534. [Google Scholar] [CrossRef]
  27. Zhang, J.; Song, J.-M.; Niu, H.-L.; Mao, C.-J.; Zhang, S.-Y.; Shen, Y.-H. ZnFe2O4 Nanoparticles: Synthesis, Characterization, and Enhanced Gas Sensing Property for Acetone. Sens. Actuators B Chem. 2015, 221, 55–62. [Google Scholar] [CrossRef]
  28. Owens, G.J.; Singh, R.K.; Foroutan, F.; Alqaysi, M.; Han, C.-M.; Mahapatra, C.; Kim, H.-W.; Knowles, J.C. Sol–Gel Based Materials for Biomedical Applications. Prog. Mater. Sci. 2016, 77, 1–79. [Google Scholar] [CrossRef]
  29. Chuan Lim, E.W.; Feng, R. Agglomeration of Magnetic Nanoparticles. J. Chem. Phys. 2012, 136, 124109. [Google Scholar] [CrossRef]
  30. Jangam, K.; Patil, K.; Balgude, S.; Patange, S.; More, P. Magnetically Separable Zn1−xCo0.5xMg0.5xFe2O4 Ferrites: Stable and Efficient Sunlight-Driven Photocatalyst for Environmental Remediation. RSC Adv. 2020, 10, 42766–42776. [Google Scholar] [CrossRef]
  31. Rumble, J.R. CRC Handbook of Chemistry and Physics, 97th ed.; Haynes, W.M., Lide, D.R., Bruno, T.J., Eds.; Taylor & Francis Group, CRC Press: Boca Raton, FL, USA, 2017; p. 2088. [Google Scholar]
  32. Song, F.; Shen, X.; Xiang, J.; Song, H.-J. Formation and Magnetic Properties of MSr Ferrite Hollow Fibers via Organic Gel-Precursor Transformation Process. Mater. Chem. Phys. 2010, 120, 213–216. [Google Scholar] [CrossRef]
  33. Abozaid, R.; Lazarevic, Z.; Radojevic, V.; Rabasovic, M.; Sevic, D.; Rabasovic, M.; Romcevic, N. Characterization of Neo-dymium Doped Calcium Tungstate Single Crystal by Raman, IR and Luminescence Spectroscopy. Sci. Sinter. 2018, 50, 445–455. [Google Scholar] [CrossRef]
  34. Al-Enizi, A.M.; Ubaidullah, M.; Ahmed, J.; Ahamad, T.; Ahmad, T.; Shaikh, S.F.; Naushad, M. Synthesis of NiOx@NPC Composite for High-Performance Supercapacitor via Waste PET Plastic-Derived Ni-MOF. Compos. Part B Eng. 2020, 183, 107655. [Google Scholar] [CrossRef]
  35. Ubaidullah, M.; Al-Enizi, A.M.; Shaikh, S.; Ghanem, M.A.; Mane, R.S. Waste PET Plastic Derived ZnO@NMC Nanocompo-site via MOF-5 Construction for Hydrogen and Oxygen Evolution Reactions. J. King Saud Univ.-Sci. 2020, 32, 2397–2405. [Google Scholar] [CrossRef]
  36. Peng, D.-L.; Sumiyama, K.; Oku, M.; Konno, T.; Wagatsuma, K.; Suzuki, K. X-Ray Diffraction and X-Ray Photoelectron Spectra of Fe-Cr-N Films Deposited by DC Reactive Sputtering. J. Mater. Sci. 1999, 34, 4623–4628. [Google Scholar] [CrossRef]
  37. Shaikh, S.F.; Ghule, B.G.; Shinde, P.V.; Raut, S.D.; Gore, S.K.; Ubaidullah, M.; Mane, R.S.; Al-Enizi, A.M. Continuous Hydrothermal Flow-Inspired Synthesis and Ultra-Fast Ammonia and Humidity Room-Temperature Sensor Activities of WO3 Nanobricks. Mater. Res. Express. 2020, 7, 15076. [Google Scholar] [CrossRef]
  38. Gawas, S.G.; Verenkar, V.M.S. Selective Sensing of Oxidizing Gases on Co-Ni-Zn Ferrite: Mechanism and Response Characteristics. Mater. Sci. Eng. B 2021, 265, 114948. [Google Scholar] [CrossRef]
  39. Singh, J.P.; Dixit, G.; Srivastava, R.C.; Agrawal, H.M.; Reddy, V.R.; Gupta, A. Observation of Bulk Like Magnetic Ordering Below the Blocking Temperature in Nanosized Zinc Ferrite. J. Magn. Magn. Mater. 2012, 324, 2553–2559. [Google Scholar] [CrossRef]
  40. Cobos, M.A.; De la Presa, P.; Llorente, I.; García-Escorial, A.; Hernando, A.; Jiménez, J.A. Effect of Preparation Methods on Magnetic Properties of Stoichiometric Zinc Ferrite. J. Alloys Compd. 2020, 849, 156353. [Google Scholar] [CrossRef]
  41. Li, W.; Wu, X.; Chen, J.; Gong, Y.; Han, N.; Chen, Y. Abnormal N-p-n Type Conductivity Transition of Hollow ZnO/ZnFe2O4 Nanostructures during Gas Sensing Process: The Role of ZnO-ZnFe2O4 Hetero-Interface. Sens. Actuators B Chem. 2017, 253, 144–155. [Google Scholar] [CrossRef]
  42. Šutka, A.; Döbelin, N. Study of Defects by Rietveld Technique and Gas Response of Excess-Iron Zinc Ferrite. J. Jpn. Soc. Powder Powder Metall. 2014, 61, S81–S84. [Google Scholar] [CrossRef] [Green Version]
Figure 1. Synthesis of pure ZnFe2O4 and W-substituted ZnFe2-2xWxO4 (0.0 ≤ x ≤ 0.15) nanoparticles via a sol–gel method.
Coatings 12 01355 g001
Figure 2. SEM and EDS micrographs of (a,b) ZnFe2O4, (c,d) ZnW0.05Fe1.95O4, (e,f) ZnW0.1Fe1.90O4, and (g,h) ZnW0.15Fe1.85O4.
Coatings 12 01355 g002aCoatings 12 01355 g002b
Figure 3. EDS mapping micrographs of (a) ZnFe2O4, (b) ZnW0.05Fe1.95O4, (c) ZnW0.1Fe1.90O4, and (d) ZnW0.15Fe1.85O4.
Coatings 12 01355 g003
Figure 4. TEM micrographs of (a) ZnFe2O4, (b) ZnW0.05Fe1.95O4, (c) ZnW0.1Fe1.90O4, and (d) ZnW0.15Fe1.85O4.
Coatings 12 01355 g004
Figure 5. X-ray diffraction patterns (a) and FTIR (b) of ZnFe2O4, ZnW0.05Fe1.95O4, ZnW0.1Fe1.90O4, and ZnW0.15Fe1.85O4.
Coatings 12 01355 g005aCoatings 12 01355 g005b
Figure 6. Nitrogen adsorption–desorption isotherm (a) and BJH pore size distribution (b), graphs of ZnFe2O4, ZnW0.05Fe1.95O4, ZnW0.1Fe1.90O4, and ZnW0.15Fe1.85O4.
Coatings 12 01355 g006
Figure 7. High resolution XPS spectra of ZnFe2O4, ZnW0.05Fe1.95O4, ZnW0.1Fe1.90O4, and ZnW0.15Fe1.85O4. (a) survey spectrum, (b) C1s, (c) Zn2p, (d) Fe2p, (e) W4f, and (f) O1s.
Coatings 12 01355 g007
Figure 8. H-M hysteresis loops of (a) ZnFe2O4, (b) ZnW0.05Fe1.95O4, (c) ZnW0.1Fe1.90O4, and (d) ZnW0.15Fe1.85O4.
Coatings 12 01355 g008
Figure 9. Ferrite sensor sensitivity to ammonia, ethanol, and acetone at different temperatures (gas concentration of 2000 ppm); (a) ZnFe2O4, (b) ZnW0.05Fe1.95O4, (c) ZnW0.1Fe1.90O4, and (d) ZnW0.15Fe1.85O4.
Coatings 12 01355 g009aCoatings 12 01355 g009b
Figure 10. Gas sensitivity % at different gas concentrations (ppm) of (a) ZnFe2O4, (b) ZnW0.05Fe1.95O4, (c) ZnW0.1Fe1.90O4, and (d) ZnW0.15Fe1.85O4.
Coatings 12 01355 g010
Table 1. Cell dimension a (Å), crystallite size (nm) and microstrain (ε) of the ZnWxFe2−2xO4 system.
Parameterx = 0.0x = 0.05x = 0.1x = 0.15
a (Å)8.437(2)8.438(4)8.443(3)8.435(4)
Size (nm)82.3973.0558.3132.56
Strain (ε) ×10−32.322.894.536.78
Table 2. Ionic radii (Å) of cations in tetrahedral and octahedral positions [31].
Metal CationA-Sites (Tetrahedral)B-Sites (Octahedral)
Zn2+0.600.74
Fe3+0.490.55
W6+0.420.60
Table 3. The magnetization of the ZnWxFe2−2xO4 samples at 20 kA/m.
SamplesZnFe2O40.05 W0.10 W0.15 W
Ms (Am2/kg)1.99211.89011.75351.4308
Publisher’s Note: MDPI stays neutral with regard to jurisdictional claims in published maps and institutional affiliations.

