Article

Characteristics of Vibration Waves Measured in Concrete Lining of Excavated Tunnel during Blasting in Adjacent Tunnel

1
School of Civil Engineering, Changsha University of Science & Technology, Changsha 410014, China
2
Oulu Mining School, University of Oulu, 90014 Oulu, Finland
3
School of Civil Engineering, Central South University, Changsha 410075, China
*
Author to whom correspondence should be addressed.
Coatings 2022, 12(7), 954; https://doi.org/10.3390/coatings12070954
Submission received: 24 May 2022 / Revised: 19 June 2022 / Accepted: 29 June 2022 / Published: 5 July 2022
(This article belongs to the Special Issue Science and Technology of Pavement Coatings Materials)

Abstract

:
The effect of a blasting vibration from an excavating tunnel on an adjacent excavated tunnel is of great importance for the stability and security of twin tunnels. Due to the relatively small distance between the tunnel face of the excavating tunnel and the concrete lining of the excavated tunnel, the impact of blasting could be significant and should be considered in a practical project. In order to control the blasting scales during the excavation of one tunnel and minimize the effect of blasting on the adjacent one, research based on field-blasting tests performed on twin tunnels is presented in this study. The particle velocities on the concrete lining of the excavating tunnel caused by blasting from the adjacent excavated tunnel were measured and analysed during six rounds of blasts. According to the measured vibration waves, it was clear that the peak particle velocity (PPV) from each blast was always induced by cut blasting, therefore, the maximum vibration due to each blast was mainly dependent on cut blasting. The measured maximum PPV for all the blasts was 15.55 cm/s, corresponding to a maximum tensile stress of 1.44 MPa observed on the concrete lining, which was smaller than the tensile strength of the concrete lining, in accordance with the one-dimensional elastic-wave theory. Moreover, the attenuation of the vibration waves varied in different regions, and they could be utilized to demonstrate the impact characteristics of the blasting; e.g., the particle velocities in the region along the excavating direction were 1.12 to 1.79 times larger than those in the region opposite to the excavating direction, and the difference increased with the increasing distance to the blasting source. The particle velocities on the side of the excavated tunnel close to the excavating tunnel were larger than those on the other side of the excavated tunnel. However, the particle velocities of the two aforementioned regions were similar when the distance between the measuring point and the blasting source was more than 6 m in the longitudinal direction of the tunnels. Furthermore, the measured vibration waves could be used to evaluate and improve the blast designs of tunnelling with the drill-and-blast method.

1. Introduction

Rock blasting is a widely used method in hard rock tunnelling [1,2]. Unfortunately, blasting may have an adverse effect on the lining of adjacent tunnels. For example, the linings of Chushou tunnel in Japan [3], LocooColio highway tunnel in Italy [4], Pingkou tunnel in China, and Xiangshuigou tunnel in China [5] were all damaged by blasting during excavation. Since the tunnel lining is usually made of concrete and plays an important role in the safety of the tunnel [6], it is necessary to evaluate the dynamic responses of tunnels subjected to blasting vibration [7]. Therefore, in twin-tunnel construction, it is necessary to control the blast scale in the “excavating tunnel” so that the blast-induced vibrations in the lining of the adjacent tunnel are well-controlled under the critical level at which the lining is damaged.
The effect of blasting on neighbouring structures during tunnelling has been studied by many researchers through field experiments and numerical simulations, and the PPV and vibration waves were commonly adopted as effective factors to analyse the blast impact and evaluate the blast design [8,9,10,11,12,13,14]. By measuring the ground motions close to the surface of concrete structures during the construction of the upper Gotvand Dam, Nateghi [15] formulated an empirical relationship between the scaled distance and the PPV. Guo [16] investigated the influence of the excavation of a roadway via blasting on adjacent roadways and found that the influence depended on the cross section of the excavated roadway. Wang [17] investigated the damage to concrete arches caused by tunnel blasting. Nakano [3] measured the blast vibrations and the cracks on the shotcrete lining of the first tunnel during the construction of twin tunnels. They found that cracks appeared on the shotcrete lining as soon as the vibration velocity exceeded 70 cm/s. Ansell [18] reported that shotcrete could withstand a vibration velocity of 0.5 m/s without being seriously damaged, and that young shotcrete without reinforcement could also survive high vibrations without being seriously damaged, according to in situ tests. Zhang [6] studied the effects of blasting on fresh concrete in a laboratory and found that the blast-induced vibrations increased the strength of the fresh concrete within the first 1–2 d, and that, thereafter, the vibrations caused cracks in the fresh concrete and reduced its strength. Xia [19] analysed the damage to the surrounding rock and the lining system under different blast loads via field measurements and numerical simulation. They observed that the rock damage around the tunnels increased linearly with respect to the PPV of the existing tunnel. According to a numerical analysis, Ahmed and Ansell [9] concluded that blasting should be avoided during the first 12 h after shotcreting. Using a hybrid finite–discrete element method and a database containing field-measurement data, Mitelman and Elmo [10] found that a higher rock strength increases the tunnel resistance to the load but decreases the attenuation. According to the results of wave analysis and acoustic tests, Zeng [20] proposed that the bedrock-damage zone can be controlled by restricting the explosive charge per delay.
In addition to the aforementioned studies, numerous guidelines and standards for vibration control have been proposed in many countries for blasting operations in tunnelling [21,22,23,24,25,26,27].
Previous studies have mostly focused on the adverse effects of blasting on nearby structures, especially the shotcrete lining; few have focused on the concrete lining. This is mainly because the temporary support (e.g., shotcrete) is often projected shortly after blasting and is strongly influenced by blasting. Nonetheless, the temporary lining can be used to reduce the vibrations and protect the concrete lining. Furthermore, the concrete lining can be built a considerable distance behind the tunnel face and has no definite vibration criterion. However, in the construction of twin tunnels, the concrete lining in one tunnel is inevitably affected by blasting in the other tunnel, because the pillar between the twin tunnels is often small. Therefore, the concrete lining affected by blasting should be studied in order to control the blast scale and guarantee the stability of the twin tunnels, and the researching findings from the present study could be beneficial to the formulization of blasting-control standards for twin tunnels.
According to the foregoing background, the Hengshan tunnels were investigated during tunnelling: the particle velocities in the concrete lining of the excavated tunnel were measured at various distances from the blasting source in the excavating tunnel. Using the measured vibration waves, their characteristics were studied, including the PPV of each blast and the attenuation of the waves. The maximum tensile stress in the concrete lining was estimated using the stress-wave theory, and the possibility of evaluating blast designs by using the measured vibration waves in tunnelling was discussed. Finally, a field investigation on the concrete lining was performed. The research framework was shown in Figure 1.

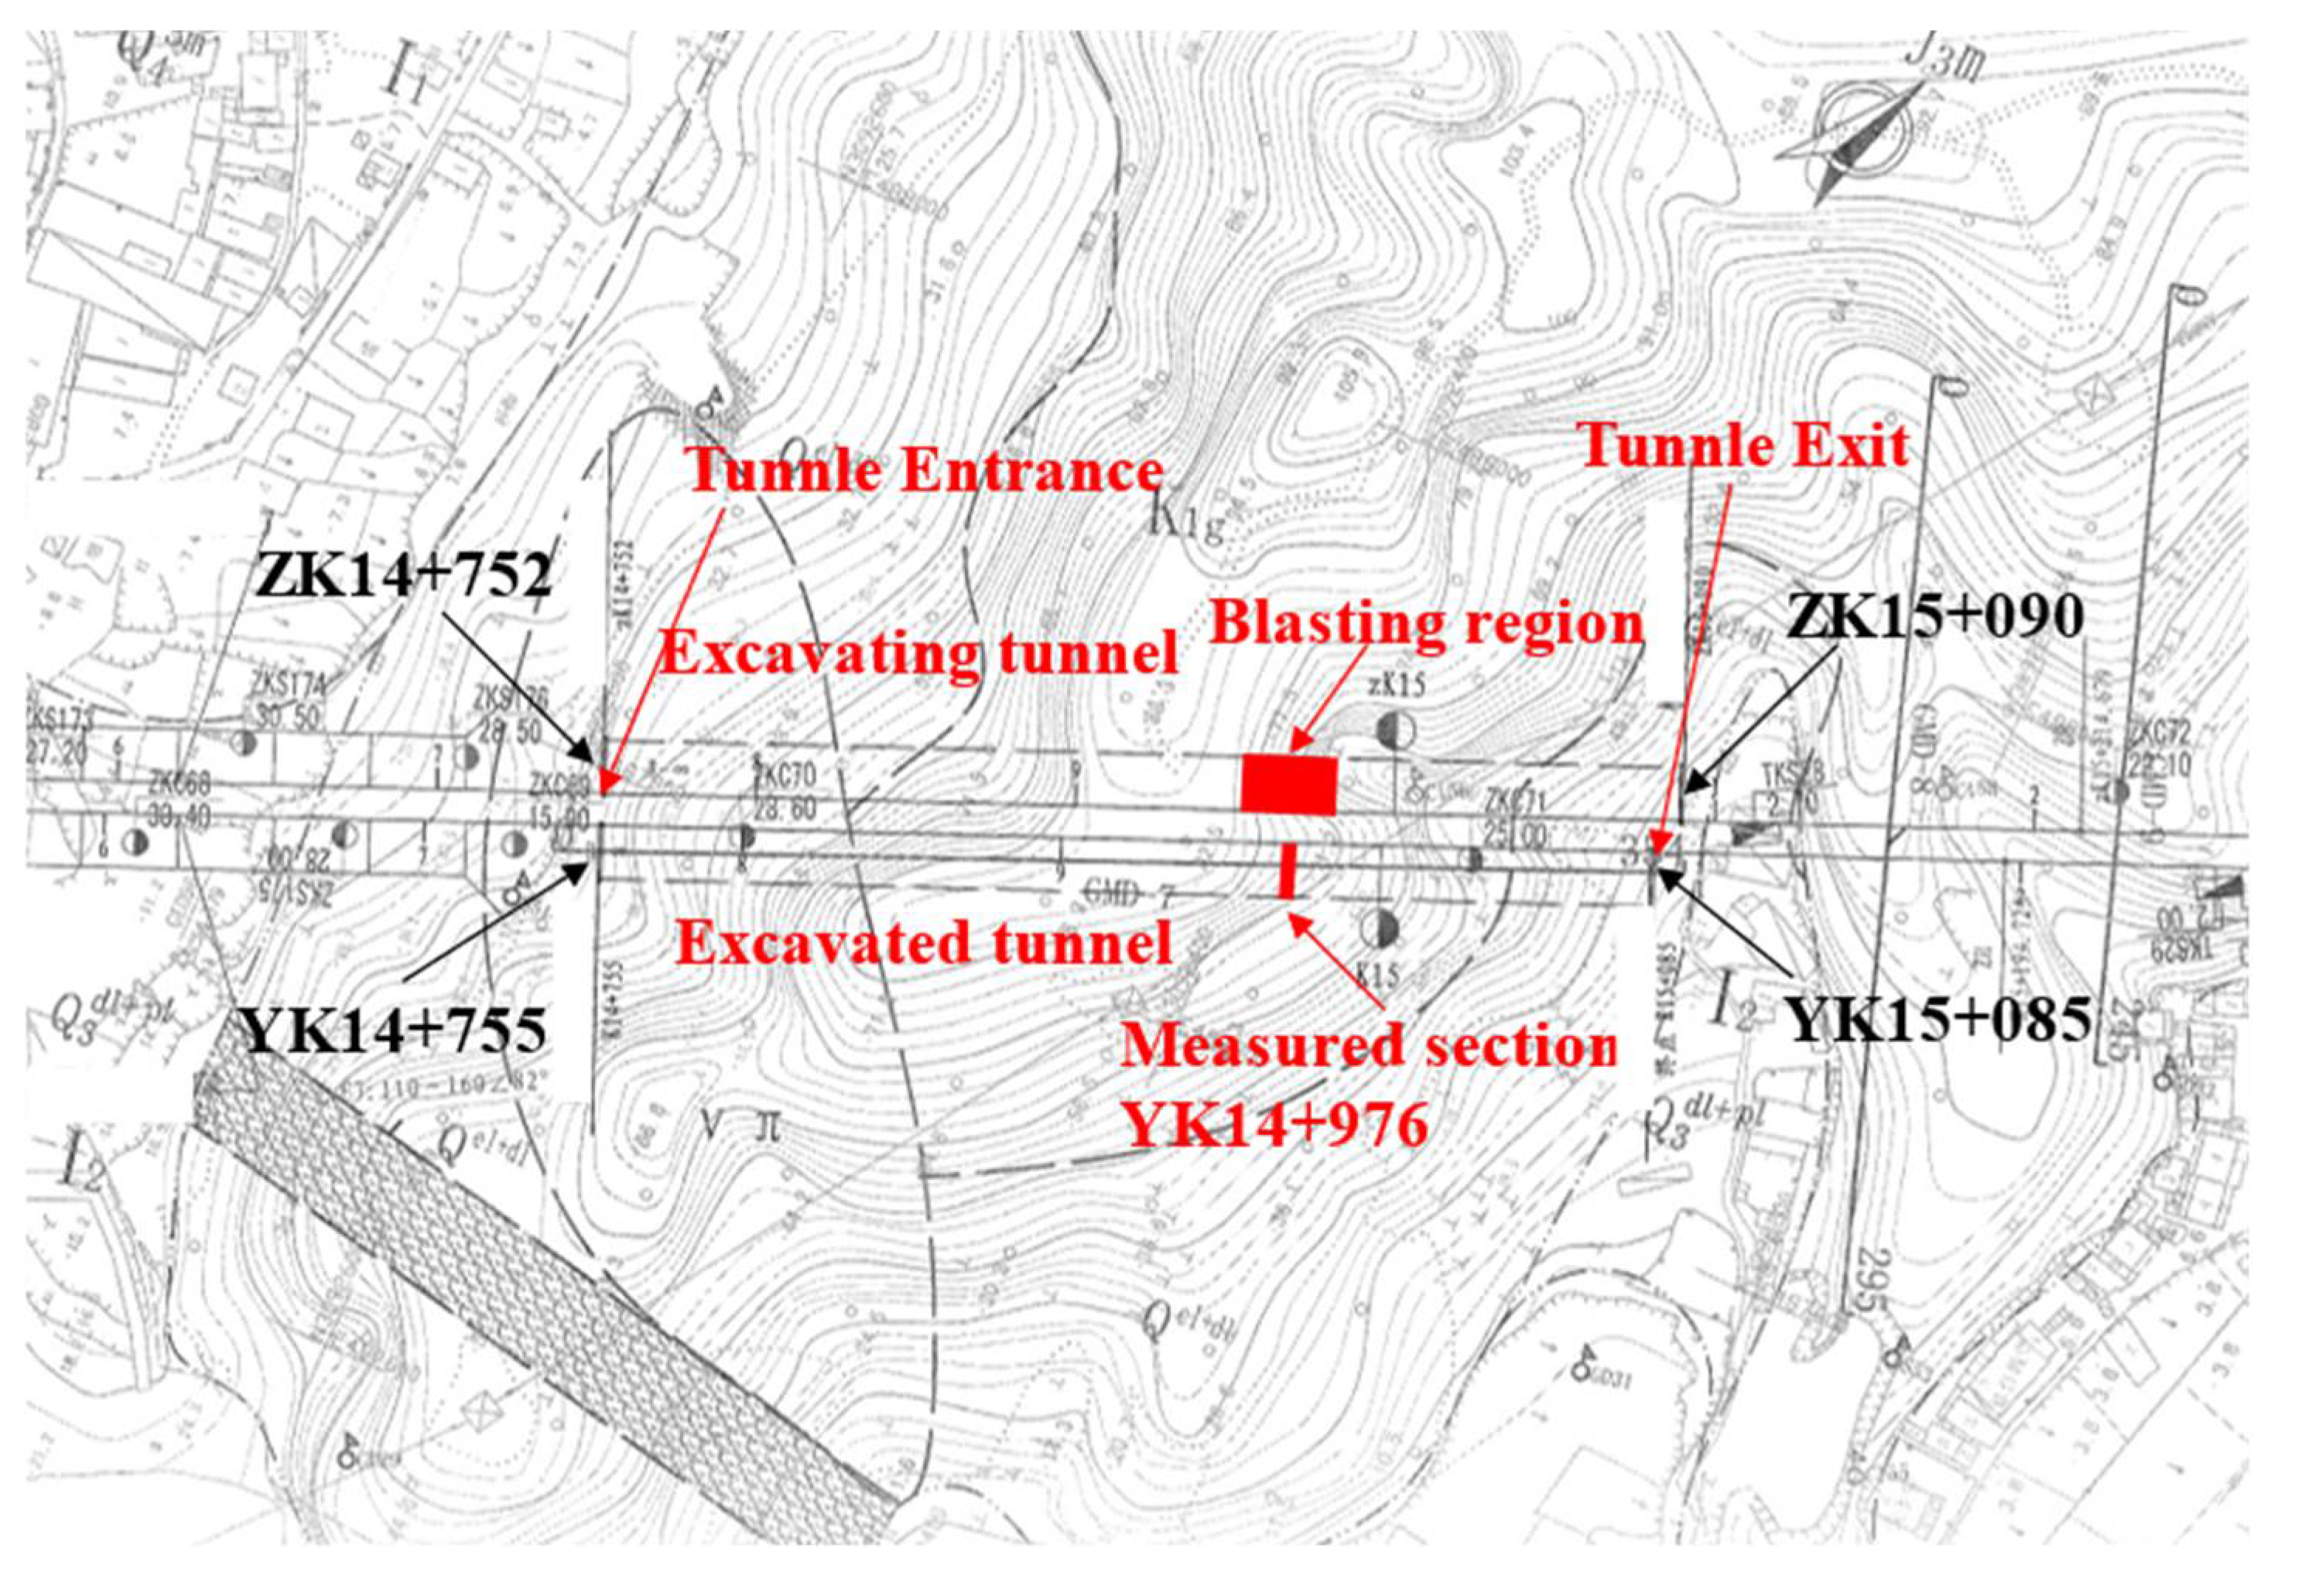
2. Location and Geology of Hengshan Tunnels

The Hengshan tunnels consist of twin tunnels. One tunnel was excavated earlier than the other one. In this study, the previously excavated tunnel is called the “excavated tunnel,” and the other tunnel is called the “excavating tunnel.” These twin tunnels are located in southwestern China, and the length of the excavating tunnel was 338 m, starting at the coordinate of ZK14 + 752 and ending at ZK15 + 090, while the length of the excavated tunnel was 330 m, starting at YK14 + 775 and ending at YK15 + 085. The pillar between the twin tunnels was 8–14 m in width (Figure 2). Both tunnels were excavated from their exits to their entrances. The excavated tunnel was excavated with the full-face method, while the excavating tunnel was excavated with the bench method. The purpose of using different excavating methods for those two tunnels was to reduce the blasting effect of the excavating tunnel on the excavated tunnel. Since the tunnel excavated later would exhibit a much more significant impact on the formerly excavated one, so, the bench method, which is relatively more conservative, was used for the construction. The excavated tunnel was excavated 30–35 m ahead of the excavating tunnel to minimize the interaction between the tunnels as much as possible, but there were still stability and security concerns related to the blast-induced vibrations during the construction of the tunnels.
The lithology of the upper strata of the tunnels was gravel soil, while that of the lower strata was felsite porphyry and sandstone. The overburden in the main part of the tunnels was greater than that at the entrances and exits, and the maximum overburden (approximately 53 m) was located in the main part. The rock mass in the main part of the tunnels was classified as intact rock (class III [25]), and the rock masses surrounding the entrances and exits of the tunnels were classified as poor intact rock (classes IV and V).
The tunnels were designed bidirectional, with six lanes, and the designed vehicle speed was 100 km/h. A composite lining was used in the tunnels, which consisted of a temporary support, waterproof layer, and concrete lining. Figure 3 shows the support parameters of the main part of the tunnel in the class III rock mass, where the vibration velocities were measured. The blue line in Figure 3 represents the C15 shotcrete, which had a thickness of 15 cm and a steel mesh with 6 mm in diameter. The red line in Figure 3 represents the ethylene-vinyl acetate (EVA) waterproof layer, which was 1 mm in thickness. The bold black line in Figure 3 represents the C30 concrete lining, which was 45 cm in thickness.

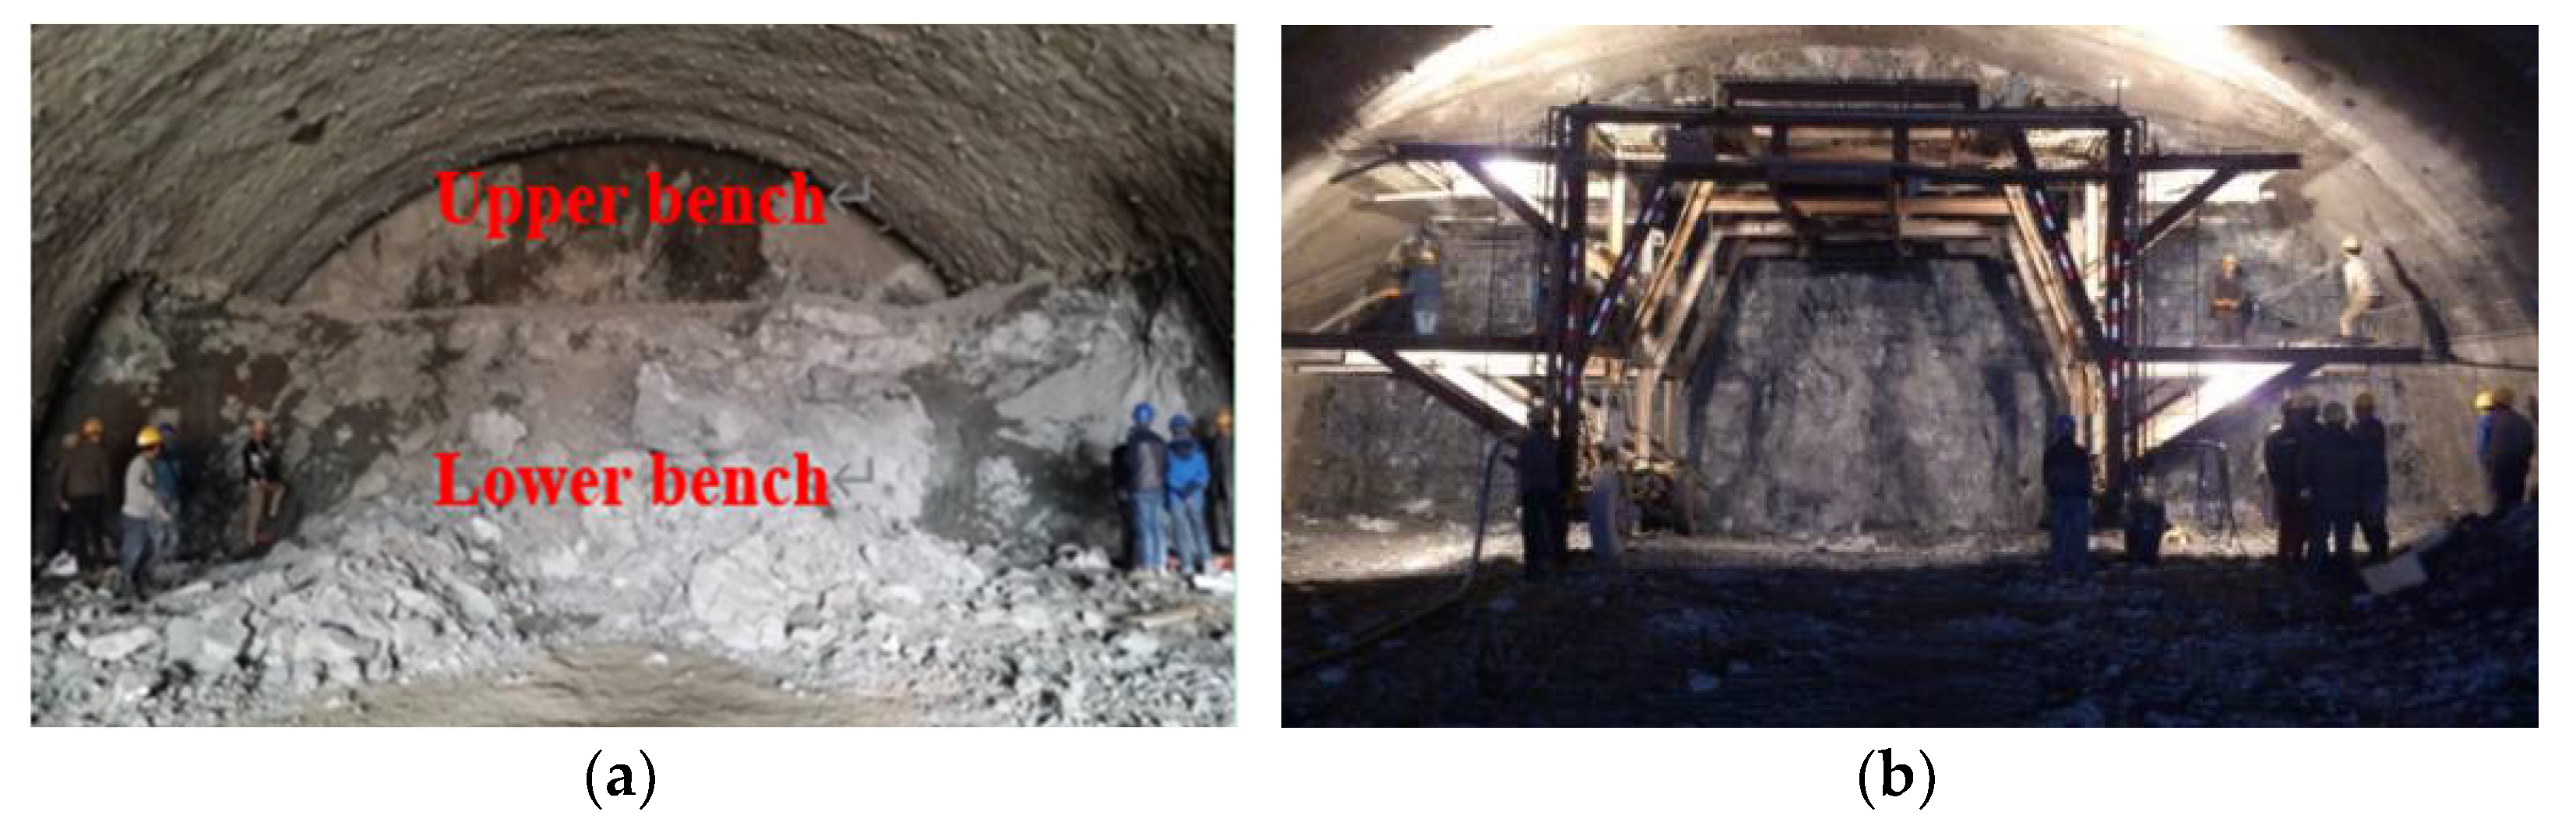
3. Methods of Excavation and Measurement
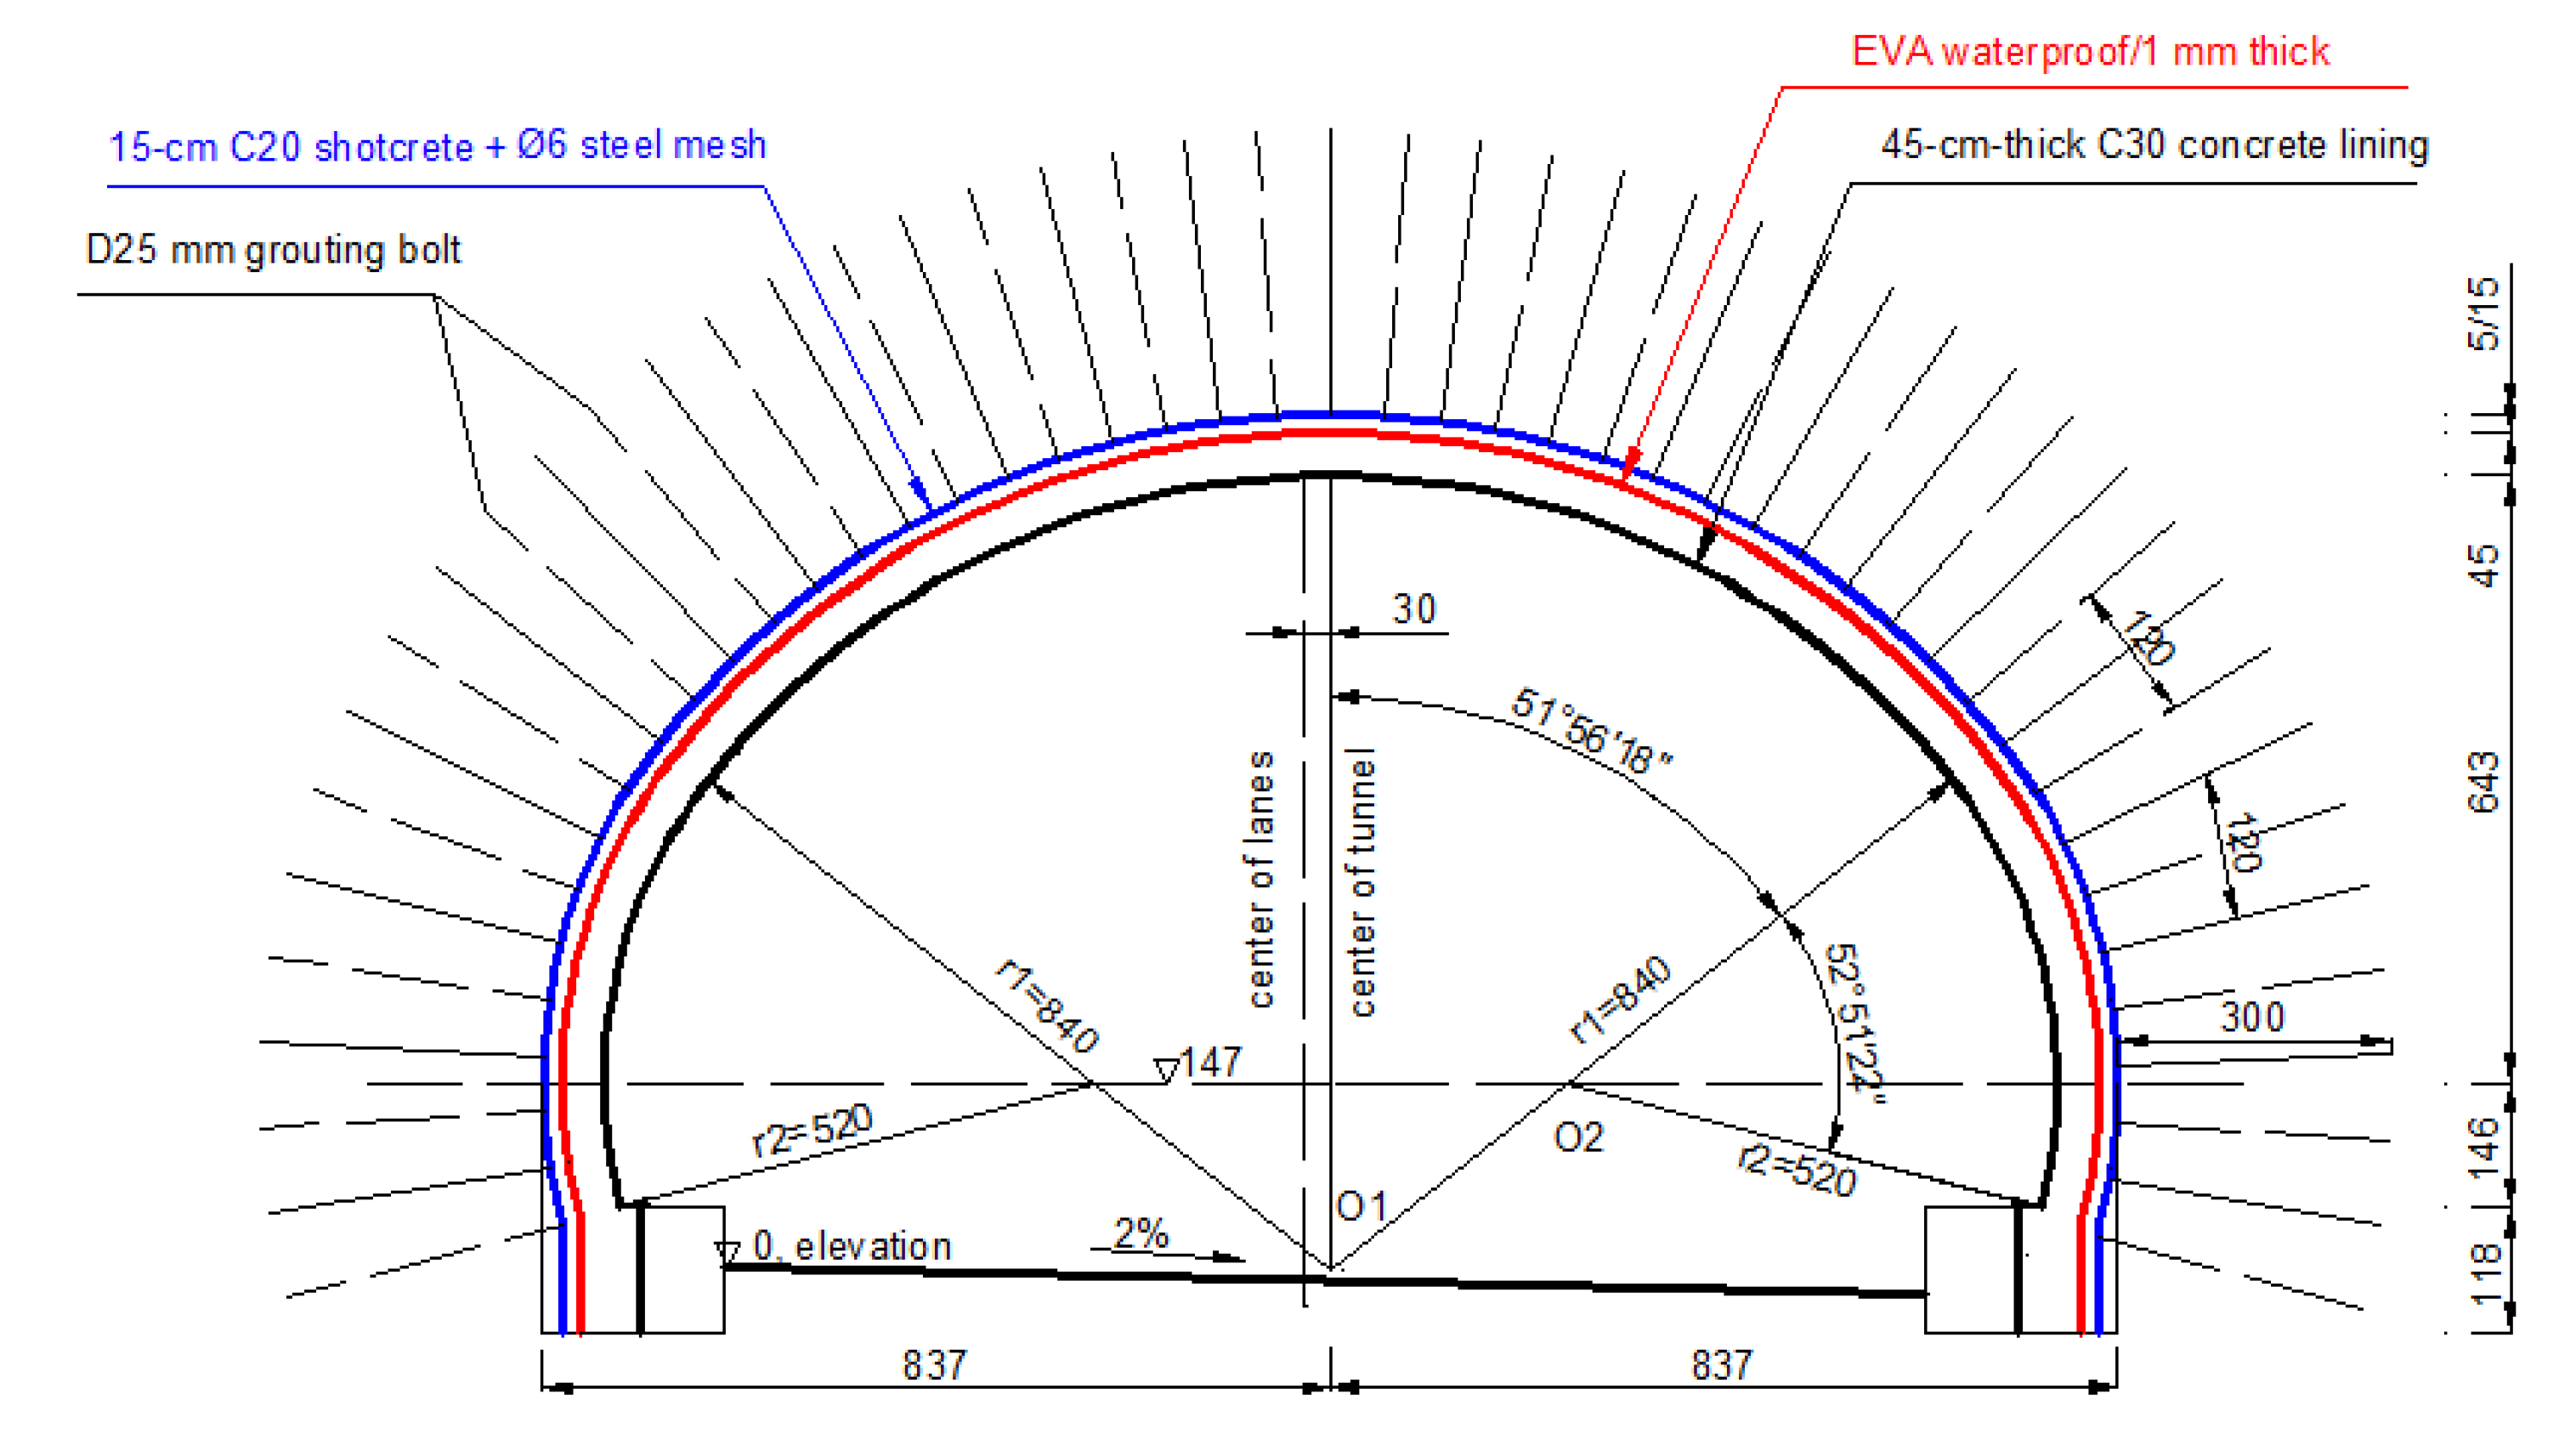
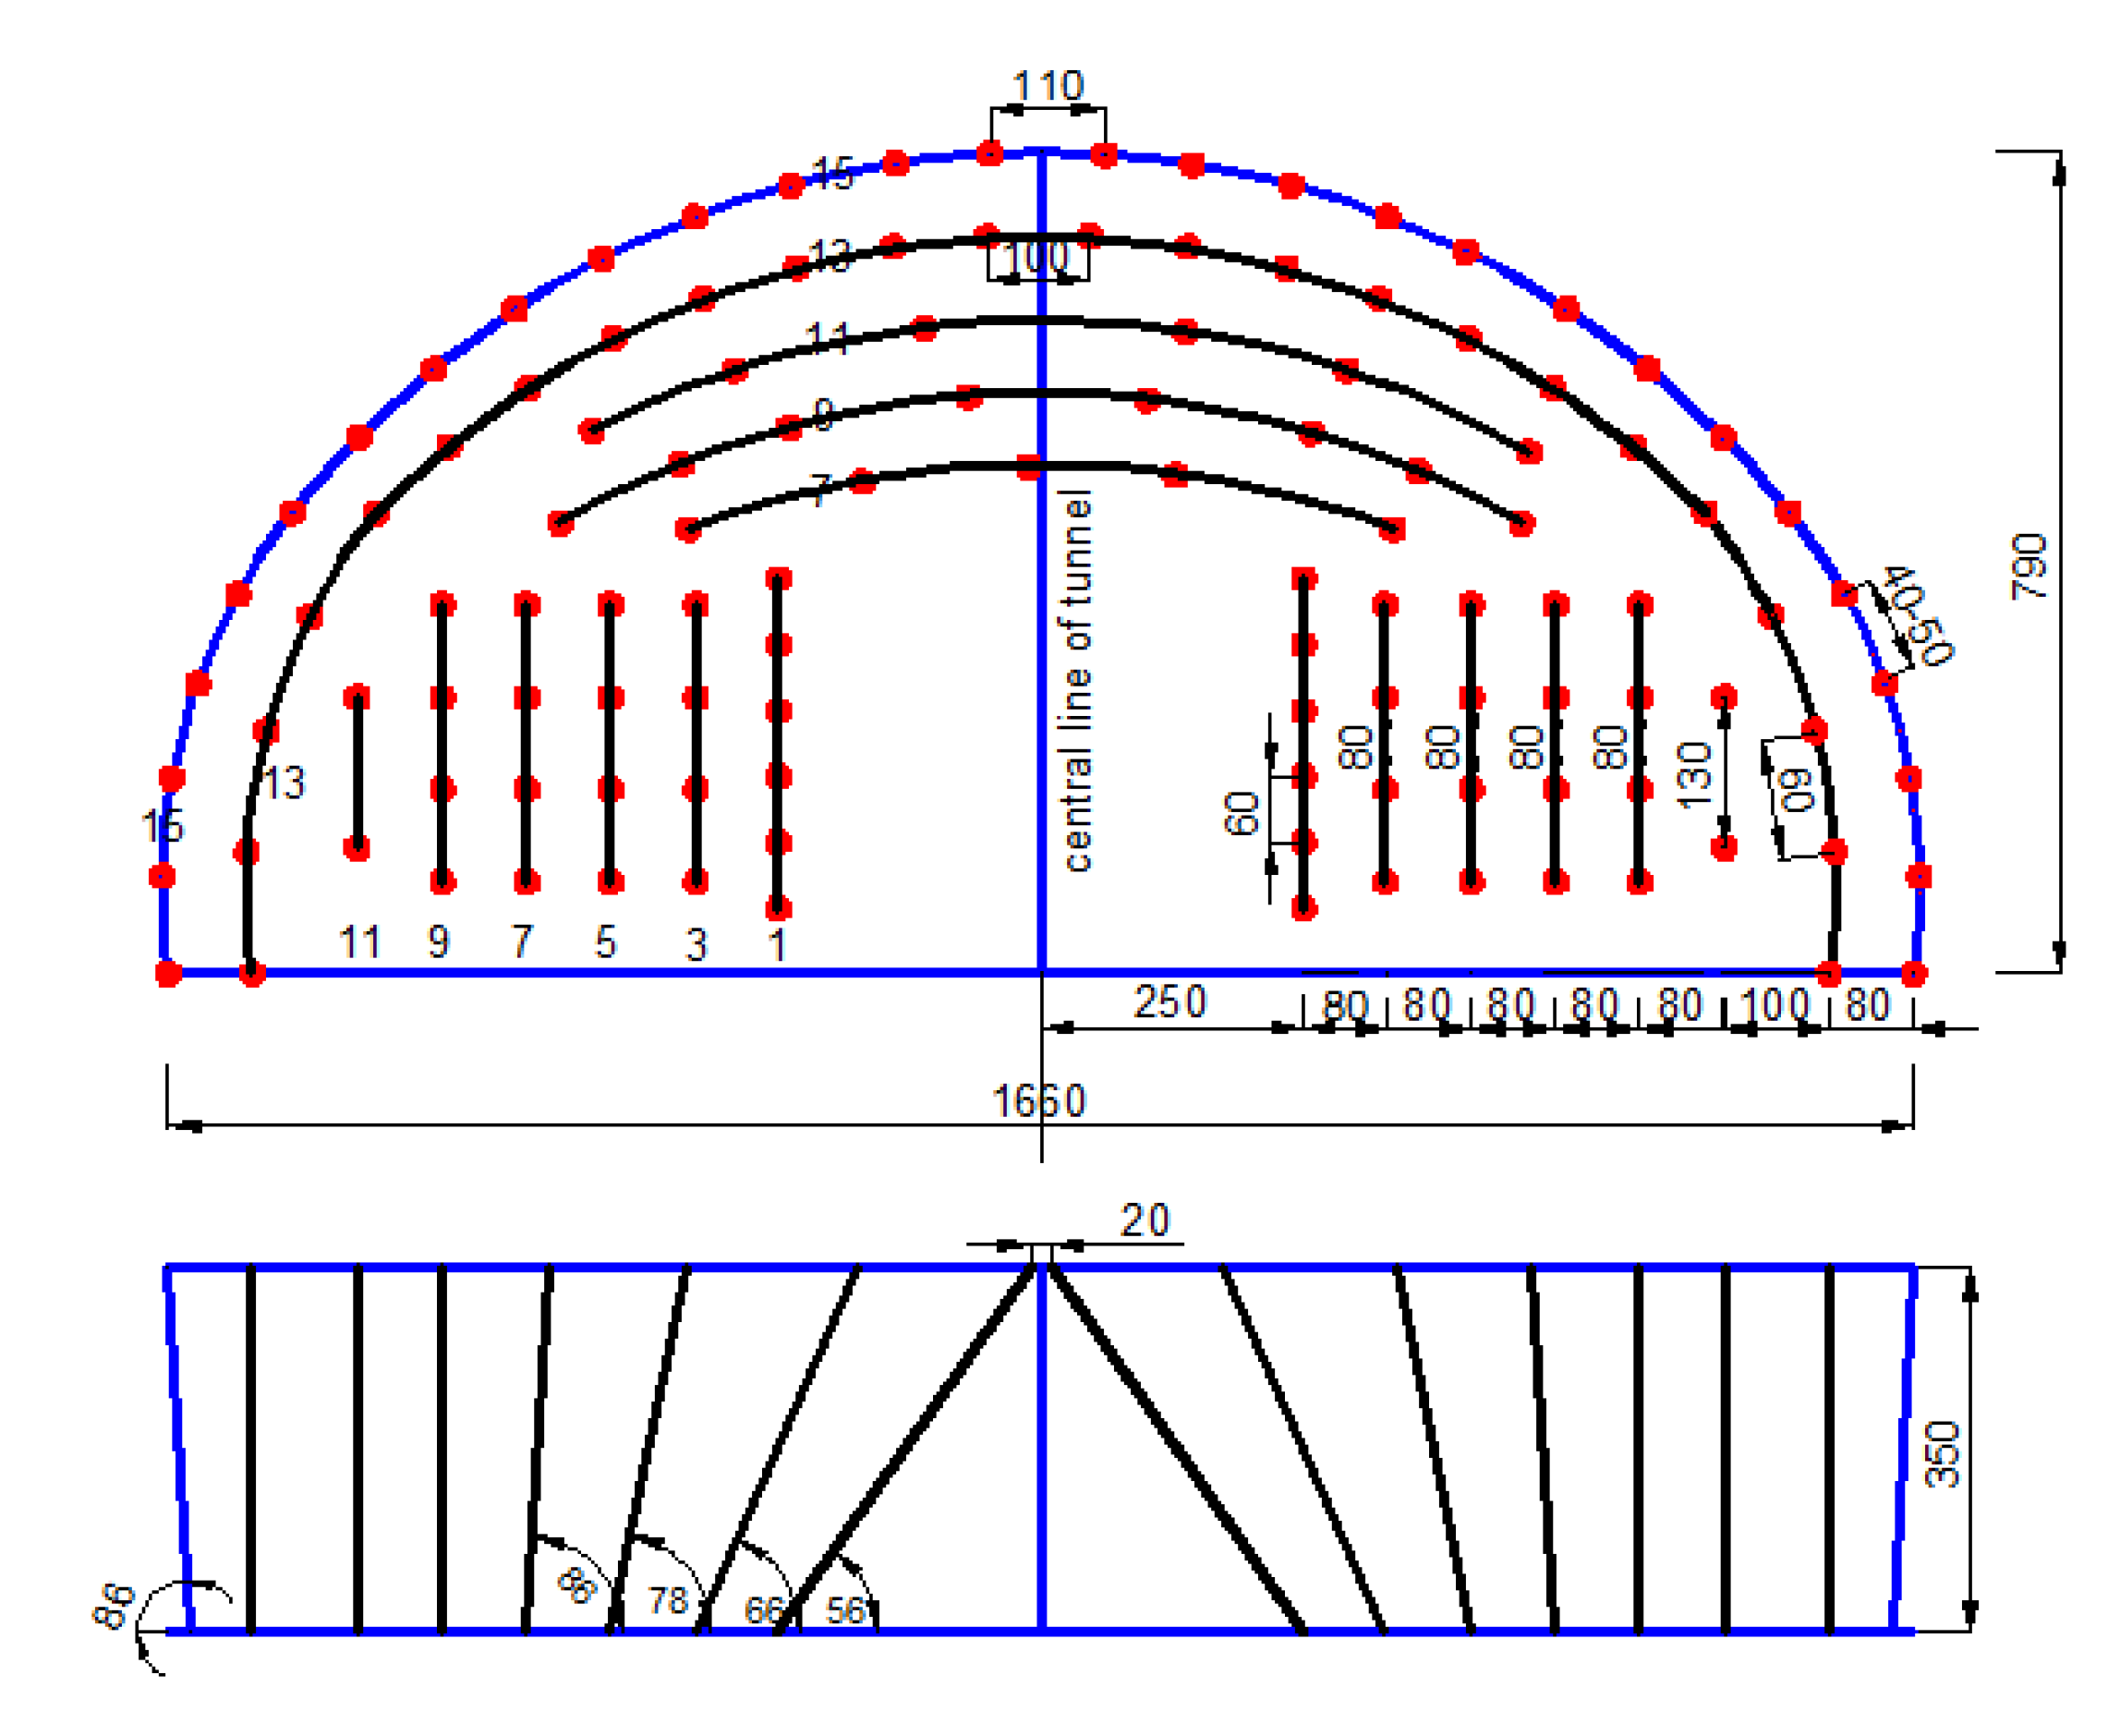
Considering that blast-induced vibrations are influenced by the charge length per delay (as well as the charge weight per delay and the distance from the blast to the point of interest) [28,29,30,31,32,33,34], the excavating tunnel was excavated with the bench method to reduce the charge length per delay and the effect on the twin tunnel by firing fewer holes simultaneously. The full-face-excavation method was used for the excavated tunnel because this tunnel was excavated prior to the excavating one.

3.1. Blast Design

The blasting bench of the excavating tunnel is shown in Figure 4. The parameters of the blast design are presented in Table 1 and Figure 5. There was a total of 118 blastholes in the cross section, including 12 cut holes. All the blastholes excluding the cut holes were 3 m in length and 42 mm in diameter, and they were fired by non-electric detonators with seven different delay times. A proper and different delay time for each blast could not only improve the efficiency of the blast but also reduce the impact of blast on the stability of the tunnel. The explosive was emulsion with a diameter of 32 mm, a length of 200 mm, a velocity of detonation of 3400 m/s, and a density of 1100 kg/m3.
The numerals in Figure 5 on the left part of the tunnel are the detonator numbers, and the rest of the numerals either represent a length (in cm) or an angle (in degrees) for the blasting arrangement.

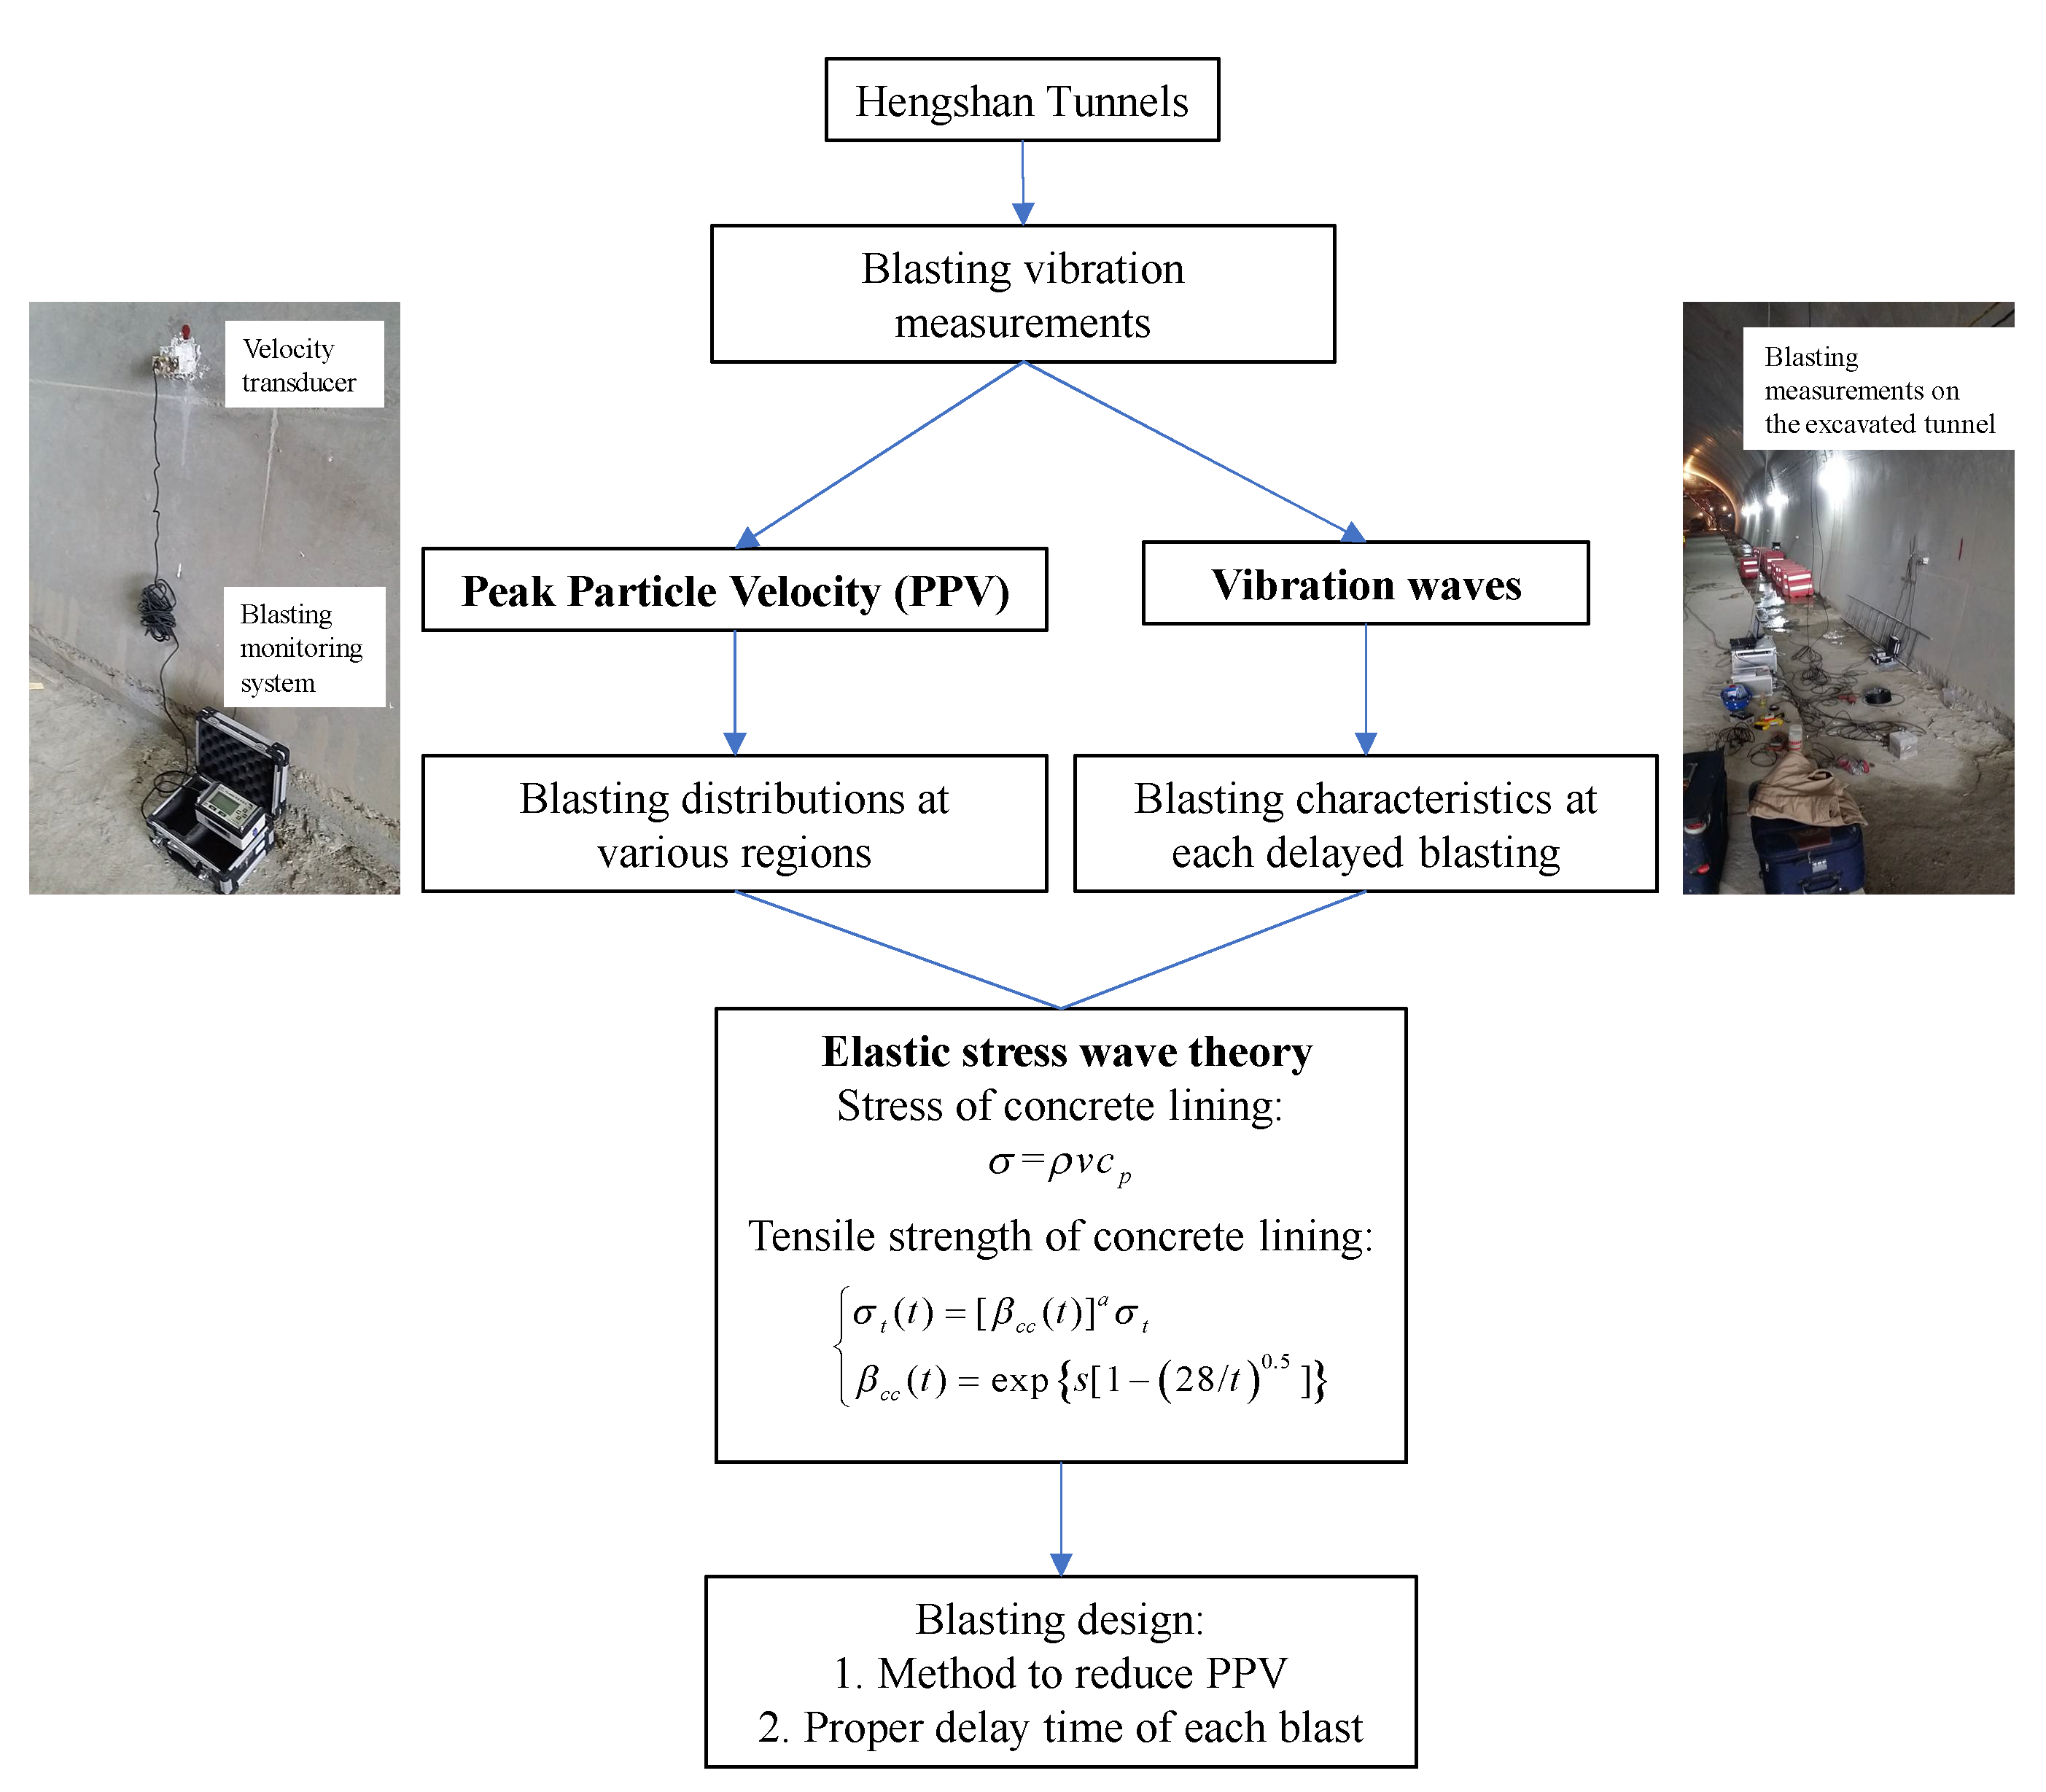
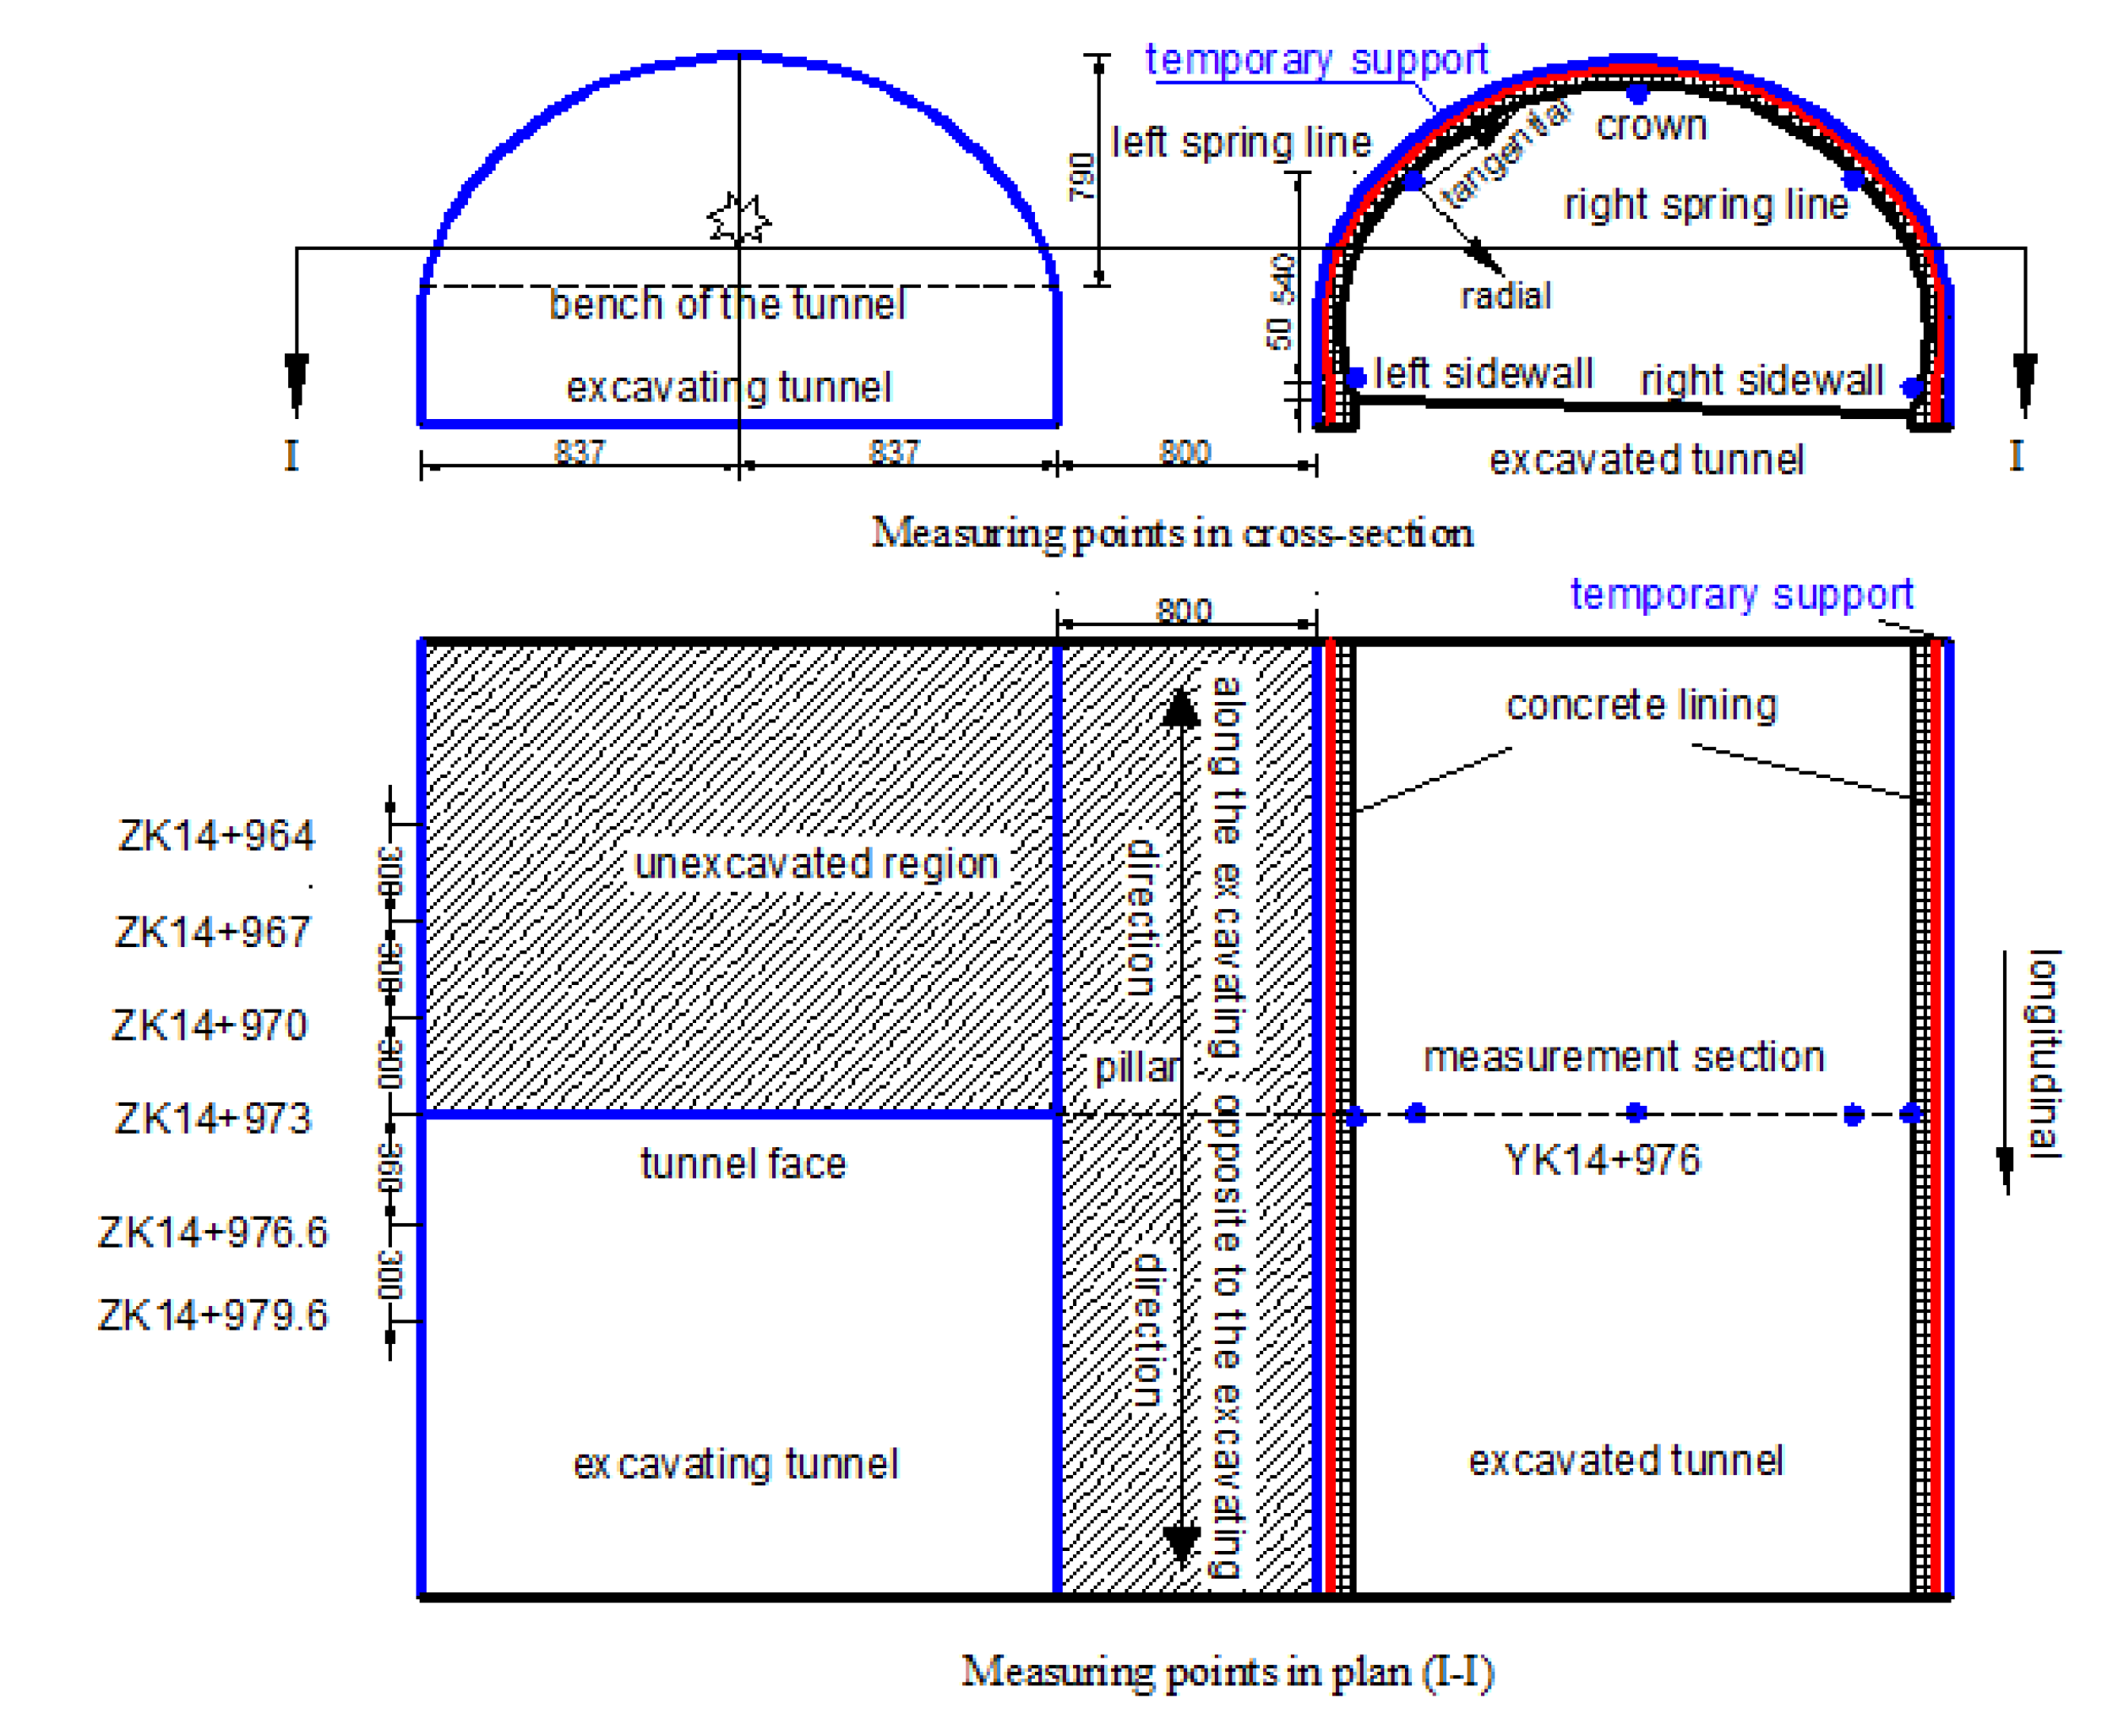
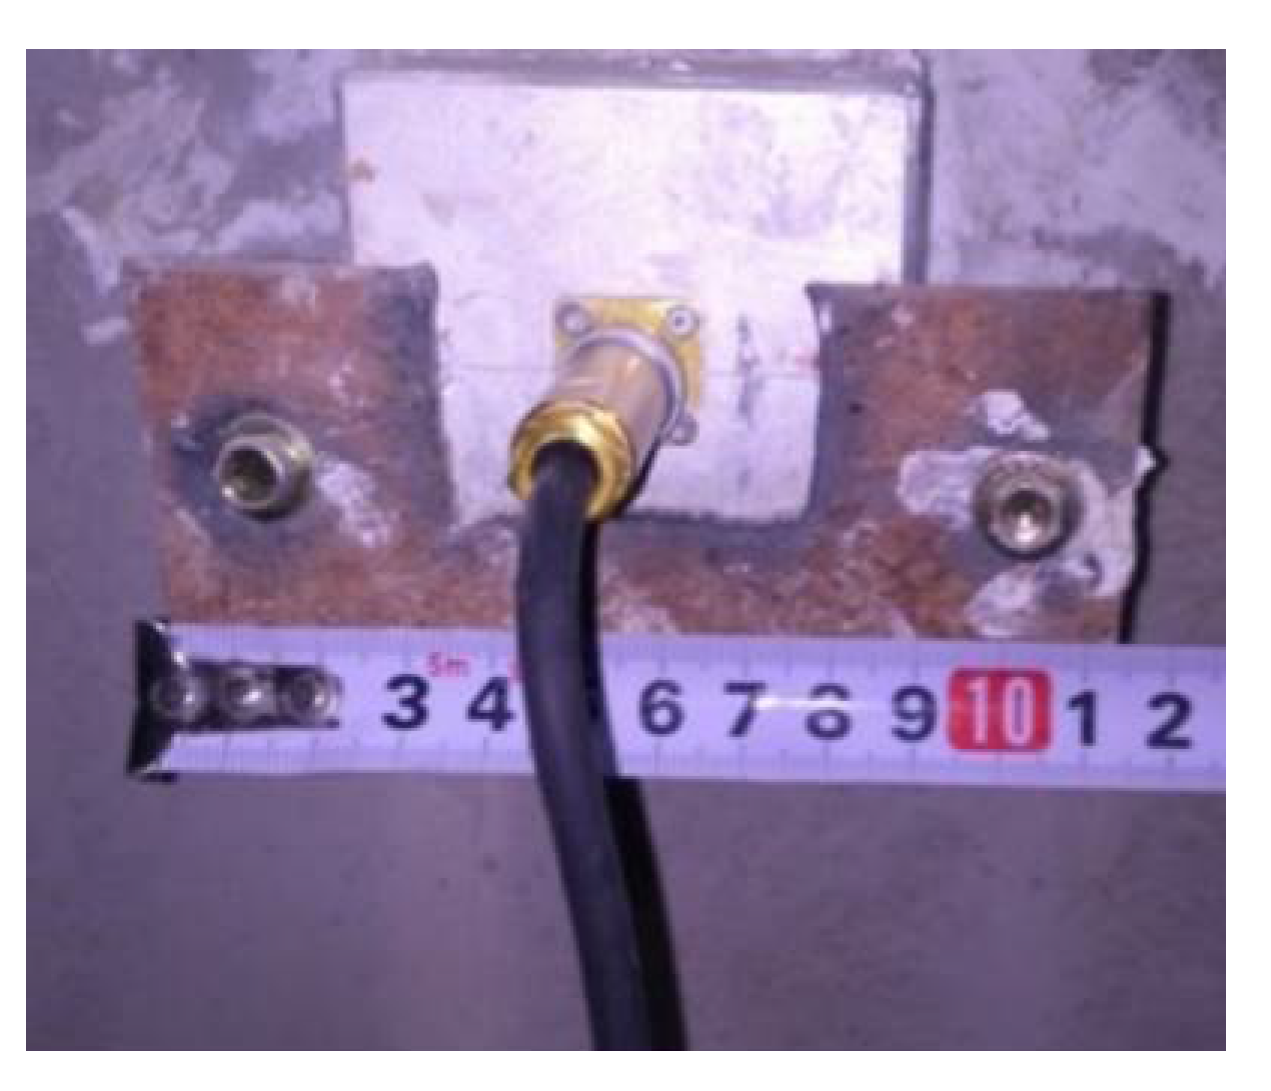
3.2. Vibration Measurement

To investigate the effect of blasting in the excavating tunnel on the excavated one, the particle velocities in the concrete lining were measured via five TC-4850 seismographs and analysed via software. When the excavating tunnel was excavated from ZK14 + 979 to ZK14 + 964, YK14 + 976 was selected as the measurement section corresponding to the middle section of excavation region, as shown in Figure 6. The measurement section was chosen at this location is because the condition of the surrounding rock in this section was relatively strong, and, thus, a more significant impact could be caused by blasting in this area.
In order to study the vibration of the different concrete lining’s points, there were five measuring points in the measurement section: left spring line, left sidewall, crown, right spring line, and right sidewall. A total of 87 groups of particle-velocity data in three directions from the six-round blasts were obtained. Sections YK14 + 976 and ZK14 + 973 were situated at the same cross section. All the transducer locations are shown in Figure 6.
Each seismograph was connected to a transducer to record the particle velocities from three mutually perpendicular directions, corresponding to the radial, longitudinal, and tangential components. All the transducers were mounted on the concrete lining by an attachment device, and gesso was used to fill the gap between the concrete lining and the transducers (as shown in Figure 7).

4. Results and Discussion

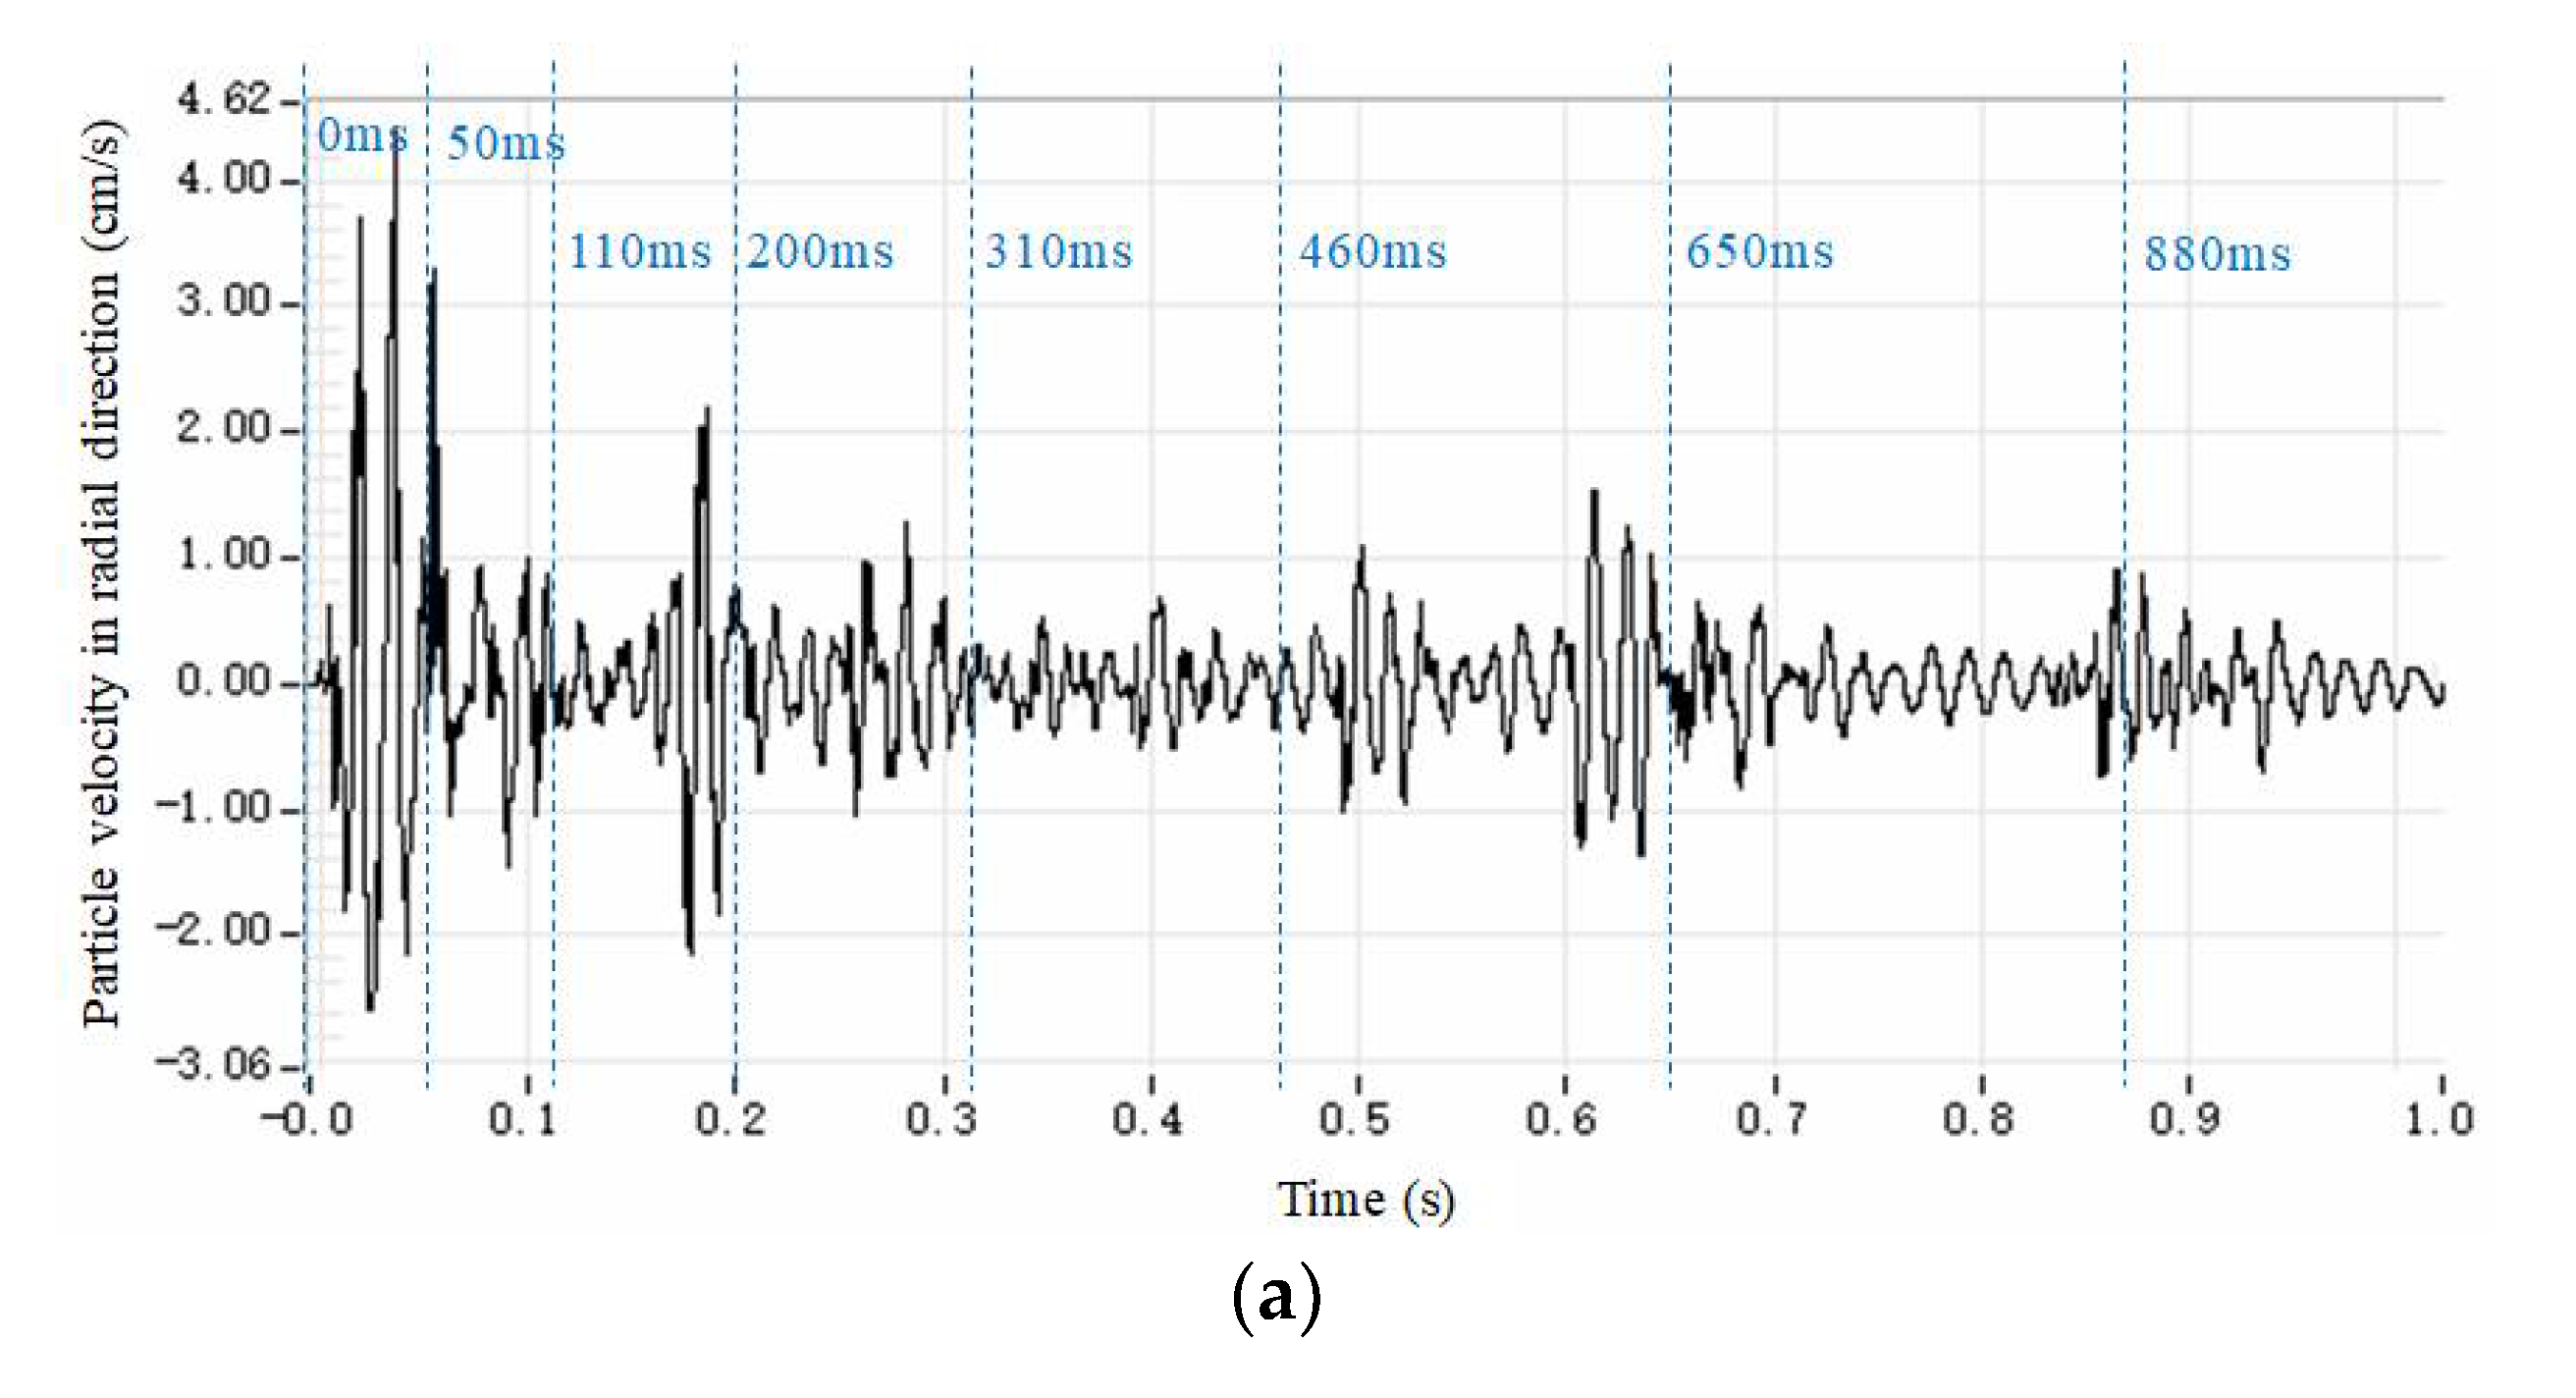
4.1. Measured Vibration Waves

Part of the measured vibration waves from the six blasts are presented in Figure 8, representing the basic characteristics of all the measured waves from the six blasts. Additionally, the PPVs for all the delays from the six blasts are presented in Table 2. Figure 8 indicates the many interesting characteristics of the measured waves. For instance, the PPV of each blast arose from the first delay (detonator number 1); the detonators had a marked initiation error; a misfire was indicated by the measured waves; and the maximum PPV from all six blasts was 15.5 m/s. These will be discussed in further detail in the following sections.
Figure 8a shows radial particle-vibration velocities at the left spring line when the blast source was ZK14 + 964 (dominant frequency: 76.19 Hz); Figure 8b shows radial particle velocities at the right spring line when the blast source was ZK14 + 964 (dominant frequency: 83.33 Hz); Figure 8c shows tangential particle-vibration velocities at the right sidewall when the blast source was ZK14 + 964 (dominant frequency: 145.46 Hz); Figure 8d shows radial particle velocities at the left spring line when the blast source was ZK14 + 979.6 (dominant frequency: 59.7 Hz); Figure 8e shows radial particle velocities at the left spring line when the blast source was ZK14 + 976.6 (dominant frequency: 74.76 Hz); Figure 8f shows longitudinal particle velocities at the crown when the blast source was ZK14 + 973 (dominant frequency: 137.93 Hz); and Figure 8g shows tangential particle velocities at the right sidewall when the blast source was ZK14 + 973 (dominant frequency: 142.86 Hz).

4.2. Maximum Particle Velocity and Its Source

As mentioned previously, Figure 8 indicates that the PPV for each round of blasts was caused by the cut blasting. These results are more clearly shown in Figure 9. It was observed that cut blasting always yielded the highest particle velocity among all the delays of each blast. For example, for blast yielding, a maximum particle velocity of 15.5 cm/s, related to delay No. 15, only caused a velocity of 4 cm/s. However, the latter was far more explosive than the former. The main reason for this significant difference in particle velocity is that the blastholes in cut blasting have only one free surface, which is the face of the tunnel, whereas those for other delay numbers have at least two free surfaces [35]. This difference also shows that the confinement of the cut holes was higher than that of the other holes. The results indicate that the maximum vibration from one round of blasts may depend on the cut blasting. Accordingly, to avoid damage to the tunnel lining, cut blasting should be well-designed.

4.3. Maximum Tensile Stress in Concrete Lining

Assume that the propagation of the blast-caused stress wave to the concrete lining can be simplified into a one-dimensional (1D) elastic-wave problem, where the S-wave and other waves are neglected and only the P-wave perpendicular to the surface of the lining is considered. In this case, the stress in the lining can be calculated using Equation (1), according to the 1D elastic-stress-wave theory [35,36].
σ = ρ v c p
Here, σ is the stress (Pa), ρ is the density of the concrete lining (kg/m3), ν is the particle velocity (m/s), and cp is the velocity of the P-wave in the concrete (m/s). Since ρ = 2310 kg/m3, cp = 4000 m/s, and the measured maximum velocity is ν = 15.55 cm/s, Equation (1) can be written as
σ = ρ v c p = 2310   kg / m 3 × 4000   m / s   × 0.1555   m / s = 1.44   MPa
This value is smaller than the tensile strength of the concrete lining, i.e., 2.01 MPa [37]. The analytical result indicates that the concrete lining should be free of damage. However, the tensile strength of concrete varies with respect to the age of the concrete. According to [38], the tensile strength of concrete at different maturities can be calculated using Equation (2).
{ σ t ( t ) = [ β c c ( t ) ] a σ t β c c ( t ) = exp { s [ 1 ( 28 / t ) 0.5 ] }
Here, σt(t) is the tensile strength of the concrete at an age of t days, σt is the mean axial tensile strength of the concrete, s is a coefficient that depends on the cement type (equal to 0.25 for cement of normal early strength). a is 1 for t < 28 d and 2/3 for t ≥ 28 d. According to Equation (2), the tensile strength of C30 concrete is 1.57, 1.81, and 1.93 MPa at 7, 14, and 21 d, respectively. This analysis indicates that blasting must be forbidden for 7 d after the concrete lining is built. To ensure the safety of the tunnels, it is better to avoid blasting for 21 d.
A field inspection was performed before and after each round of blasts. The results indicated that there were no new cracks or spalling on the surface of the concrete lining after each blast; i.e., the concrete lining was in a safe state. This result is consistent with the foregoing estimation of the maximum tensile stress in the concrete lining, indicating that the 1D elastic-wave theory can be used to estimate the maximum tensile stress.

4.4. Attenuation of Blast Vibration Waves

When the excavating tunnel was excavated from ZK14 + 964 to ZK14 + 979, the measuring positions were at the left sidewall, left spring line, crown, right spring line, and right sidewall of the right tunnel. The measurement section was YK14 + 976, and it was located at the same cross section as ZK14 + 973. In the following analysis, only the resultant particle velocities are considered. The central point of the middle section of each advance is defined as the blasting source of the blast.
To determine the characteristics of the attenuation of the measured vibration waves, we used the following charge-weight-scaling laws [39,40,41]:
{ v = a ( K ) b K = x / Q
where K is the scaled-charge weight, x is the distance from the blasting position to the measuring point, Q is the charge weight per delay, and a and b are site-specific constants. According to Equation (3) and the measured velocities, the relationship between the PPV and the scaled-charge weight is shown in Figure 10. This figure indicates that the PPV generally decreases with the increase in the distance. However, the regression shows a large degree of scattering, meaning that the charge-weight-scaling laws are not suitable for describing the attenuation of vibration waves. This result is consistent with that of Xia [42].
According to the measured vibrations shown in Figure 11, the particle velocities at the left of the excavated tunnel and at the right of excavated tunnel are compared when the distance between the measuring point and the blasting source in the longitudinal direction varies in the range of ZK14 + 967 to ZK14 + 979.6. The ratio of the particle velocity from the left spring line to that from the right spring line is 1.1–2.0, and the ratio from the left sidewall to the right sidewall is 1.1–1.5. This result is reasonable because the left measuring points of the excavated tunnel are closer to the blasting source than the right measuring points of the excavated tunnel. The particle velocity from the left measuring points is similar to that from the right measuring points, when the measuring points are >6 m from the blasting source in the longitudinal direction.
As shown in Figure 6, the section of ZK14 + 973 is defined as the coordinate origin. The attenuation of the particle velocity differs between the region along the excavating direction and the region opposite to the excavating direction. The excavating tunnel was excavated in the region opposite to the excavating direction (from ZK14 + 980 to ZK14 + 973), and YK14 + 976 was located in the region against the unexcavated part of the excavating tunnel. Similarly, the excavating tunnel was excavated in the region along the excavating direction (from ZK14 + 973 to ZK14 + 964), and YK14 + 976 was in the region against the excavated region of the excavating tunnel.
To further study the particle velocities, the data for measuring points with nearly the same distance to the blasting position in Table 2 were examined, as shown in Figure 11.
Figure 11 shows that the particle velocities in the region of the right tunnel along the excavating direction were mostly 1.12–1.79 times higher than those in the region of the right tunnel opposite to the excavating direction. On average, they differed by a factor of 1.46, and the difference generally increased with the distance to the blasting position. For example, at ZK14 + 976.6 and ZK14 + 970, for which the distance to the blasting position was 3.6 and 3 m in the longitudinal direction, respectively, the ratio of the PPV in the region along the excavating direction to that in the region opposite to the excavating direction was 1.07, 1.12, and 1.47, corresponding to the measuring point of the left spring line, crown, and right spring line, respectively. However, at ZK14 + 979.6 and ZK14 + 967, for which the distance was 6.6 and 6 m in the longitudinal direction, respectively, the ratio of the PPV was 1.4, 1.21, and 1.79, corresponding to the measuring point of the left spring line, crown, and right spring line, respectively.

4.5. Misfire and Initiation Error of Detonators

Comparing the actual initiation times with the designed times reveals that the actual initiation times of the non-electric detonators are not accurate, and the maximum delay error may be as large as 100 ms. For example, the designed initiation time of detonator No. 13 is 650 ms, but the actual detonation time could be approximately 550 ms, or the holes at 650 ms might have not been fired and the holes at 460 ms could be fired with a 100-ms delay (see Figure 8d).
The waves in Figure 8a–c indicate that all the delays might have been ignited successfully, although the actual initiation times are not exactly equal to the planned times. However, there is no wave surrounding 460 ms in Figure 8d–g, meaning that the No. 11 detonators were not fired at all. This is also indicated by Table 2, where the particle velocities caused by the No. 11 detonators are zero for the five-round blasts.

5. Discussion

5.1. Cut Blasting

Our measurements show that cut blasting always causes the maximum vibration. This is consistent with the measurements of Hinzen [43], who reported that the seismic efficiency (ratio of seismic energy to total explosive energy) was as high as 25% in cut holes and only 1% in perimeter holes. The main reason for this is that cut blasting has fewer free surfaces than the blasting of other holes, and the amplitude of a vibration wave decreases with the increase in free surfaces, with the burden, charge weight, and other parameters being constant [35]. Therefore, it is better to decrease the charge weight of cut blasting or create additional free surfaces to reduce the vibration velocity. For example, in the blasting of the Hengshan tunnels, the 12 cut holes can be divided into two delays for reducing the PPV.

5.2. Recommendations for the Blast Design

The blast design has a direct influence on the productivity and construction cost of drill-and-blast tunnels [44]. The vibration waves can be used as an effective method to evaluate the blast design. For example, three problems arose from the waves measured in this study. First, there was a superposition of the waves caused by the No. 1 detonators and the No. 3 detonators. Second, the No. 11 detonators were not fired in the case of the five-round blasts. Third, the interval time of the two final delays was too long.
Cut holes are intended to create a sufficient free surface and swelling space for the blastholes outside the cut holes. The delay time between cut holes and the immediately following blastholes should be long enough to allow the fragments from the cut holes to be thrown out, before the fragments from the immediately following holes start to move. Otherwise, if the delay time is insufficient, the moving fragments from the former are jammed by the fragments from the latter [35]. However, the delay time between the cut holes and the second delay holes in the Hengshan tunnels is too short and should be increased.
The second problem is the misfiring of the No. 11 detonators. This is a significant problem in production because it can lead to undesirable results such as poor fragmentation and contaminated air and groundwater [45]. The main reason for the misfiring of the No. 11 detonators is the inaccurate positioning of the blastholes with the No. 11 detonators, which resulted in a reduction in the actual burden for these detonators. In this case, the blastholes initiated by the No. 11 detonators had probably been broken by the holes previously initiated with the No. 9 detonators. Evidently, the accurate positioning of the blastholes is crucial in rock drilling. From the measured waves, the interval time of the last two delays is approximately 250 ms, which is too long. This interval time should be reduced so that the total vibration time can be reduced.

6. Conclusions

In order to control the blasting scales during the excavation of one tunnel and minimize the effect of blasting on an adjacent one, research based on the field-blasting tests performed on twin tunnels is presented in this study. The particle velocities on the concrete lining of the excavating tunnel caused by the blasting from the adjacent excavated tunnel were measured and analysed during six rounds of blasts. The following conclusions could be drawn.
  • It was clearly observed that the PPV from each round of blasts was always induced by cut blasting, mainly because of the quantity of free surfaces of the excavating tunnel, as well as the confinement. Therefore, vibration control should focus on the design of the cut blasting. For example, the cut holes could be divided into two or three delays to reduce the vibration velocity on the concrete lining.
  • The maximum tensile stress in the concrete lining calculated using the stress-wave theory was adopted to evaluate the damage of the concrete lining under blasting. The measured PPV from the six blasts was 15.55 cm/s; according to this value, the maximum tensile stress calculated using the stress-wave theory is 1.44 MPa, which is smaller than the tensile strength of the concrete lining, indicating that the concrete lining was free of damage. This is consistent with the results of field inspections, which revealed that there were no cracks or spalling in the lining after each blast.
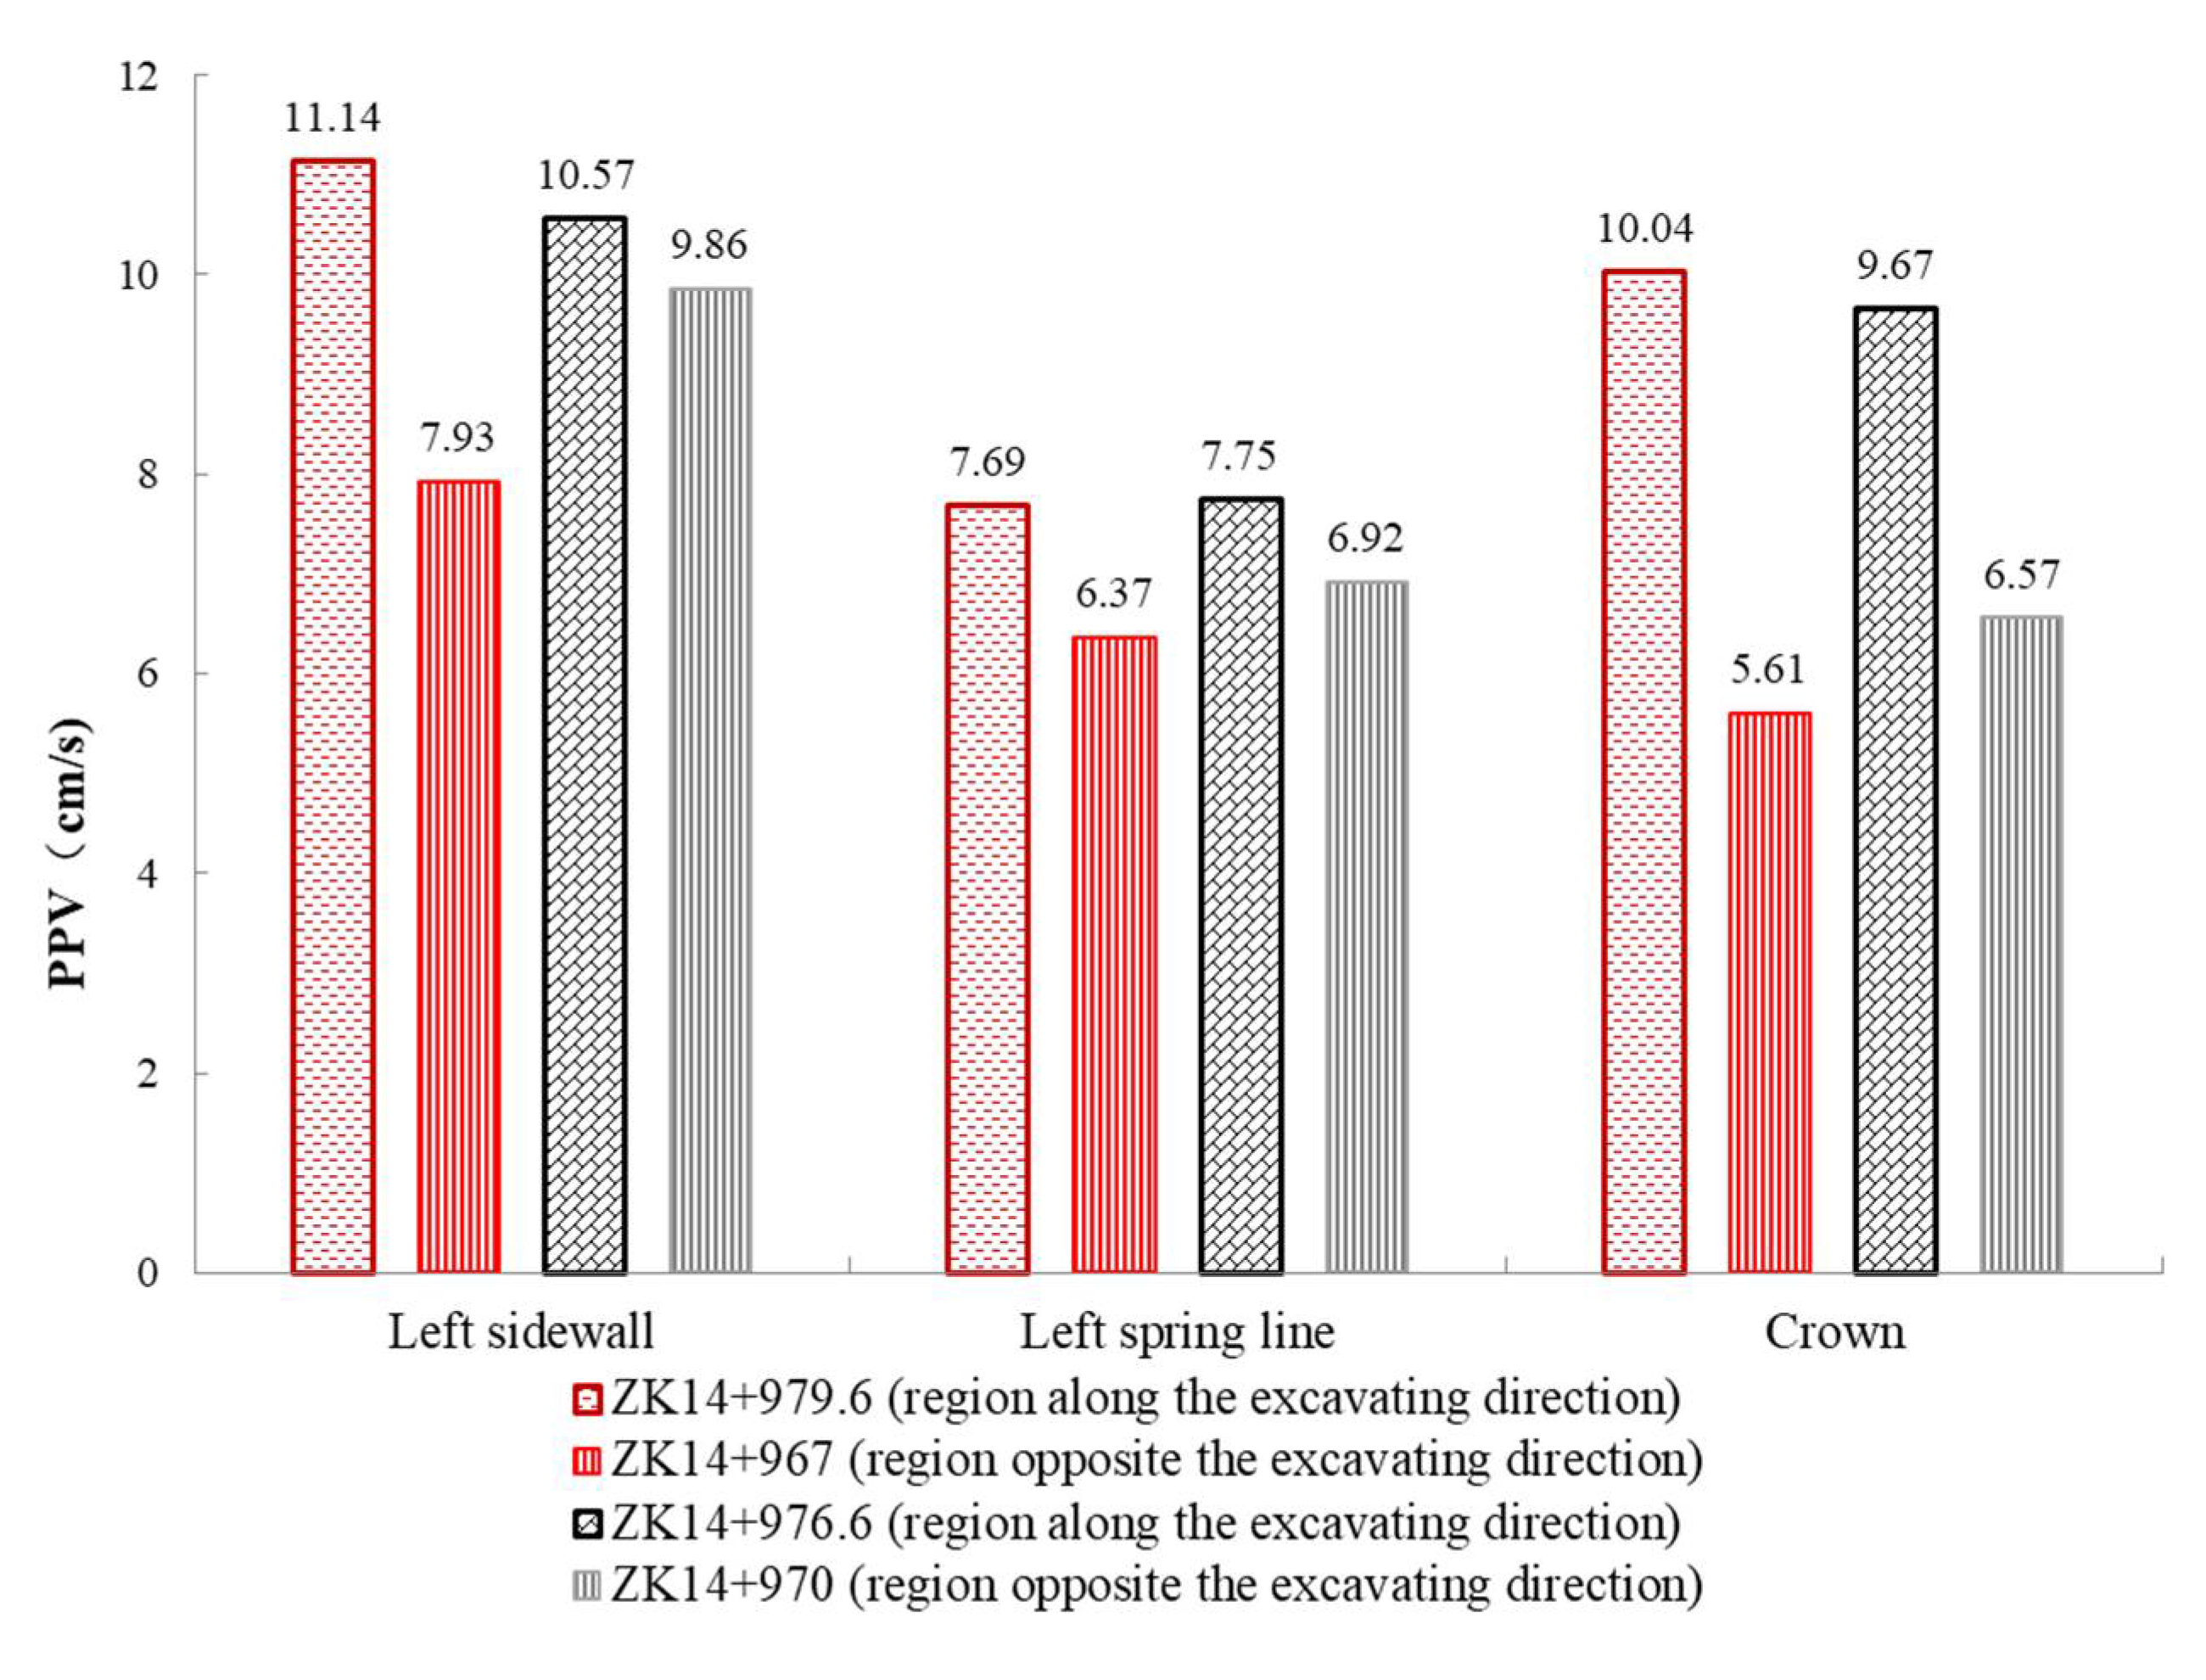
  • The particle velocities in the region of the excavated tunnel along the excavating direction were larger than those in the region of the excavated tunnel opposite to the excavating direction. Besides, the particle velocities in the region close to the excavating runnel were larger than those in the region at the opposite side of the excavated tunnel. However, the particle velocities of the two aforementioned regions were similar when the distance between the measuring point and the blasting source was more than 6 m in the longitudinal direction of the tunnels. Accordingly, the region close to the blasting position in the excavating tunnel should be carefully considered in the construction of tunnels.
  • Based on the analyses of the vibration waves, the particle velocities caused by blasting could be reduced by modifying the charge weight of each blast or creating additional free surfaces, and the delay time for each blast could also be optimized to avoid the superposition of the waves. Therefore, the blasting impact from the excavating tunnel could be minimized.

Author Contributions

Conceptualization, Q.Z. and Z.Z.; methodology, C.W.; software, J.Y.; validation, J.Y.; formal analysis, Q.Z.; investigation, Z.W.; resources, C.W.; data curation, Z.W.; writing—original draft preparation, Q.Z.; writing—review and editing, Z.Z.; visualization, C.W.; supervision, Z.Z.; project administration, J.Y.; funding acquisition, J.Y. All authors have read and agreed to the published version of the manuscript.

Funding

This work was supported by the National Nature Science Foundation of China (Grant Nos. 51508038, 51274049 and 51908065) and the Key Disciplines Research Funds for the Changsha University of Science and Technology (Grant No. 13ZDXK11).

Institutional Review Board Statement

Not applicable.

Informed Consent Statement

Not applicable.

Data Availability Statement

Not applicable.

Acknowledgments

The support provided by the China Scholarship Council (CSC) during the visit by the first author to the University of Oulu is acknowledged.

Conflicts of Interest

The authors declare no conflict of interest.

References

  1. Nateghi, R. Evaluation of blast induced ground vibration for minimising negative effects on surrounding structures. Soil Dyn. Earthq. Eng. 2012, 43, 133–138. [Google Scholar] [CrossRef]
  2. Yi, C.; Sjöberg, J.; Johansson, D. Numerical modelling for blast-induced fragmentation in sublevel caving mines. Tunn. Undergr. Space Technol. 2017, 68, 167–173. [Google Scholar] [CrossRef]
  3. Nakano, K.I.; Okada, S.; Furukawa, K.; Nakagawa, K. Vibration and cracking of tunnel lining due to adjacent blasting. Doboku Gakkai Ronbunshu 1993, 1993, 53–62. (In Japanese) [Google Scholar] [CrossRef] [Green Version]
  4. Li, S.C.; Li, K.X.; Lei, G.; Sun, G.F. Study of blasting vibration and deformation control for metro construction beneath existing metro tunnel in short distance. Rock Soil Mech. 2014, 35, 284–289. (In Chinese) [Google Scholar]
  5. Wang, M.N.; Pan, X.M.; Zhang, C.M.; Wen, X.D.; Wang, K.K. Study of blasting vibration influence on close-spaced tunnel. Rock Soil Mech. 2004, 25, 412–414. (In Chinese) [Google Scholar]
  6. Zhang, C.; Hu, F.; Zou, S. Effects of blast induced vibrations on the fresh concrete lining of a shaft. Tunn. Undergr. Space Technol. 2005, 20, 356–361. [Google Scholar] [CrossRef]
  7. Yu, H.; Yuan, Y.; Yu, G.; Liu, X. Evaluation of influence of vibrations generated by blasting construction on an existing tunnel in soft soils. Tunn. Undergr. Space Technol. 2014, 43, 566–599. [Google Scholar] [CrossRef]
  8. Wu, C.S.; Li, J.X.; Chen, X.; Xu, Z.P. Blasting in twin tunnels with small spacing and its vibration control. In tunneling and underground space technology. Underground space for sustainable urban development. In Proceedings of the 30th ITA-AITES World Tunnel Congress Singapore; 2004; Volume 19, pp. 4–5. [Google Scholar]
  9. Ahmed, L.; Ansell, A. Vibration vulnerability of shotcrete on tunnel walls during construction blasting. Tunn. Undergr. Space Technol. 2014, 42, 105–111. [Google Scholar] [CrossRef]
  10. Mitelman, A.; Elmo, D. Modelling of blast-induced damage in tunnels using a hybrid finite-discrete numerical approach. J. Rock Mech. Geotech. Eng. 2014, 6, 565–573. [Google Scholar] [CrossRef] [Green Version]
  11. Zhang, Z.X. Blast-induced dynamic rock fracture in the surfaces of tunnels. Int. J. Rock Mech. Min. Sci. 2014, 71, 217–223. [Google Scholar] [CrossRef]
  12. Zhong, D.W.; He, L.; Cao, P.; Zhang, K. Blasting vibration time-holding analysis and delay time optimization of millisecond blasting. Explos. Shock Waves 2016, 36, 703–709. [Google Scholar]
  13. Ding, X.; Weng, Y.; Zhang, Y.; Xu, T.; Wang, T.; Rao, Z.; Qi, Z. Stability of large parallel tunnels excavated in weak rocks: A case study. Rock Mech. Rock Eng. 2017, 50, 2443–2464. [Google Scholar] [CrossRef]
  14. Tian, X.X.; Song, Z.P.; Wang, J.B. Study on the propagation law of tunnel blasting vibration in stratum and blasting vibration reduction technology. Soil Dyn. Earthq. Eng. 2019, 126, 105813. [Google Scholar] [CrossRef]
  15. Nateghi, R. Prediction of ground vibration level induced by blasting at different rock units. Int. J. Rock Mech. Min. Sci. 2011, 48, 899–908. [Google Scholar] [CrossRef]
  16. Guo, D.; Zhou, B.; Liu, K.; Yang, R.; Yan, P. Dynamic caustics test of blast load impact on neighboring different cross-section roadways. Int. J. Min. Sci. Technol. 2016, 26, 803–808. [Google Scholar] [CrossRef]
  17. Wang, P.; Jiang, M.; Zhou, J.; Wang, B.; Feng, J.; Chen, H.; Fan, H.; Jin, F. Spalling in concrete arches subjected to shock wave and CFRP strengthening effect. Tunn. Undergr. Space Technol. 2018, 74, 10–19. [Google Scholar] [CrossRef]
  18. Ansell, A. In situ testing of young shotcrete subjected to vibrations from blasting. Tunn. Undergr. Space Technol. 2004, 19, 587–596. [Google Scholar] [CrossRef]
  19. Xia, X.; Li, H.B.; Li, J.C.; Liu, B.; Yu, C. A case study on rock damage prediction and control method for underground tunnels subjected to adjacent excavation blasting. Tunn. Undergr. Space Technol. 2013, 35, 1–7. [Google Scholar] [CrossRef]
  20. Zeng, Y.; Li, H.; Xia, X.; Liu, B.; Zuo, H.; Jiang, J. Blast-induced rock damage control in Fangchenggang nuclear power station, China. J. Rock Mech. Geotech. Eng. 2018, 10, 914–923. [Google Scholar] [CrossRef]
  21. AS 2187.2; Explosives—Storage, Transport and Use-Use of Explosives. Standards Australia: Sydney, Australia, 2006.
  22. British Standards Institution. Evaluation and Measurement for Vibration in Buildings: Guide to Damage Levels from Groundborne Vibration; BSI: London, UK, 1993; Volume 7385. [Google Scholar]
  23. ISI. IS-6922; Criteria for Safety and Design of Structures Subjected to Underground Blast. Indian Standard Institute: New Delhi, India, 1973.
  24. Ouchterlony, F.; Olsson, M.; Bergqvist, I. Towards new swedish recommendations for cautious perimeter blasting. Fragblast 2002, 6, 235–261. [Google Scholar] [CrossRef] [Green Version]
  25. Ministry of Communications of the People’s Republic of China. Code for Design of Road Tunnel; China Communication Press: Beijing, China, 2004. (In Chinese)
  26. General Administration of Quality Supervision, Inspection and Quarantine of the People’s Republic of China. Safety Regulations for Blasting; China Water Power Press: Beijing, China, 2014. (In Chinese)
  27. Abdelkader, E.M.; Al-Sakkaf, A.; Elshaboury, N.; Alfalah, G. Hybrid grey wolf optimization-based gaussian process regression model for simulating deterioration behavior of highway tunnel components. Processes 2021, 10, 36. [Google Scholar] [CrossRef]
  28. Spathis, A.T.; Wheatley, M.G. Dynamic pressure measured in a water-filled hole adjacent to a short explosive charge detonated in rock. Blasting Fragm. 2016, 10, 33–41. [Google Scholar]
  29. Zhang, Z.X. Failure of hanging roofs in sublevel caving by shock collision and stress superposition. J. Rock Mech. Geotech. Eng. 2016, 8, 886–895. [Google Scholar] [CrossRef]
  30. Zhang, Z.X.; Naarttijärvi, T. Reducing ground vibrations caused by underground blasts in LKAB Malmberget mine. Fragblast 2005, 9, 61–78. [Google Scholar] [CrossRef]
  31. Venkatesh, H.S. Influence of total charge in a blast on the intensity of ground vibrations—Field experiment and computer simulation. Fragblast 2005, 9, 127–138. [Google Scholar] [CrossRef]
  32. Blair, D.; Minchinton, A. On the damage zone surrounding a single blasthole. Fragblast 1997, 1, 59–72. [Google Scholar] [CrossRef]
  33. Yugo, N.; Shin, W. Analysis of blasting damage in adjacent mining excavations. J. Rock Mech. Geotech. Eng. 2015, 7, 282–290. [Google Scholar] [CrossRef] [Green Version]
  34. Wang, X.; Li, J.; Zhao, X.; Liang, Y. Propagation characteristics and prediction of blast-induced vibration on closely spaced rock tunnels. Tunn. Undergr. Space Technol. 2022, 123, 104416. [Google Scholar] [CrossRef]
  35. Zhang, Z.X. Rock Fracture and Blasting: Theory and Applications; Butterworth-Heinemann: Oxford, UK, 2016. [Google Scholar]
  36. Kolsky, H. Stress Waves in Solids; Courier Corporation: Chelmsford, MA, USA, 1963; Volume 1098. [Google Scholar]
  37. Ministry of Housing and Urban-Rural Development of the People’s Republic of China (MOHURD). Code for Design of Concrete Structures; GB50010-2010; China Building Industry Press: Beijing, China, 2010. (In Chinese)
  38. Bamforth, P.; Chisholm, D.; Gibbs, J.; Harrison, T. Properties of Concrete for Use in Eurocode 2; The Concrete Centre: Surrey, UK, 2008. [Google Scholar]
  39. Spathis, A.T. A brief review of the measurement, modelling and management of vibrations produced by blasting. In Proceedings of the 9th International Symposium on Rock Fragmentation by Blasting, Granada, Spain, 13–17 August 2009; pp. 1–11. [Google Scholar]
  40. Siskind, D.E. Vibrations from Blasting; International Society of Explosives Engineers (ISEE): Cleveland, OH, USA, 2000. [Google Scholar]
  41. Spathis, A.T. A scaled charge weight superposition model for rapid vibration estimation. Fragblast 2006, 10, 9–31. [Google Scholar] [CrossRef]
  42. Xia, X.; Li, H.; Liu, Y.; Yu, C. A case study on the cavity effect of a water tunnel on the ground vibrations induced by excavating blasts. Tunn. Undergr. Space Technol. 2018, 71, 292–297. [Google Scholar] [CrossRef]
  43. Hinzen, K.G. Comparison of seismic and explosive energy in five smooth blasting test rounds. Int. J. Rock Mech. Min. Sci. 1998, 35, 957–967. [Google Scholar] [CrossRef]
  44. Zare, S.; Bruland, A. Comparison of tunnel blast design models. Tunn. Undergr. Space Technol. 2006, 21, 533–541. [Google Scholar] [CrossRef]
  45. Zhang, Z.X. Increasing ore extraction by changing detonator positions in LKAB Malmberget mine. Fragblast 2005, 9, 29–46. [Google Scholar] [CrossRef]
Figure 1. Research framework.
Coatings 12 00954 g001
Figure 2. Topographic plan and locations of the twin tunnels.
Coatings 12 00954 g002
Figure 3. Design of the tunnel in the class III rock mass.
Coatings 12 00954 g003
Figure 4. Blasting bench of the excavating tunnel. (a) The bench method; (b) The full-face method.
Coatings 12 00954 g004
Figure 5. Blast plan of the excavating tunnel.
Coatings 12 00954 g005
Figure 6. Locations of measuring points (unit:cm).
Coatings 12 00954 g006
Figure 7. Transducer for the vibration measurements.
Coatings 12 00954 g007
Figure 8. Particle velocities measured at YK14 + 976 for different blast sources. The dashed lines show the planned initiation times of the detonators. (a) Particle virbation velocities at left spring line in radial direction; (b) Particle velocities at right spring line in radial direction; (c) Particle virbation velocities at right sidewall in tangential direction; (d) Particle velocities at left spring line in radial direction; (e) Particle velocities at left spring line in radial direction; (f) Particle velocities at crown in longitudianl direction; (g) Particle velocities at right sidewall in tangential direction.
Coatings 12 00954 g008aCoatings 12 00954 g008bCoatings 12 00954 g008c
Figure 9. Maximum reluctant particle velocity for each delay in different blasts. (a) Maximum particle velocity vs. detonator number (delay time) when the blast source was ZK14 + 976.6; (b) maximum particle velocity vs. detonator number (delay time) when the blast source was ZK14 + 973; (c) maximum particle velocity vs. detonator number (delay time) when the blast source was ZK14 + 970.
Coatings 12 00954 g009
Figure 10. Relationship between the PPV and the scaled-charge weight.
Coatings 12 00954 g010
Figure 11. Comparison of the particle velocities measured at YK14 + 976 as the vibration waves from four blasts propagated through regions along the excavating direction and opposite to the excavating direction.
Coatings 12 00954 g011
Table 1. Parameters of each blast.
Detonator NumberDelay Time (ms)Quantity of BlastholesCharge per Blasthole (kg)Total Charge (kg)
10122.631.2
35082.620.8
511082.620.8
7200132.633.8
9310162.641.6
11460112.628.6
13650102.828.0
1365022.65.2
1365010220.0
1588026252.0
1588022.55.0
Total charge of each blast (kg)287
Table 2. Maximum particle velocity for every delay.
Blasting PositionMeasuring PositionMaximum Particle Velocity for Every Delay (cm/s)
//No. 1No. 3No. 5No. 7No. 9No. 11No. 13No. 15
ZK14 + 979.6Left sidewall10.683.533.863.512.26/3.131.30
+979.6Left spring line11.144.785.925.115.40/2.881.59
+979.6Crown7.692.513.862.473.74/3.141.08
+979.6Right spring line10.043.104.973.854.33/4.771.94
+979.6Right sidewall6.201.903.703.182.91/3.581.54
ZK14 + 976.6Left sidewall10.245.104.904.604.20/3.903.40
+976.6Left spring line10.555.805.273.566.29/6.434.54
+976.6Crown7.753.555.152.284.54/5.794.16
+976.6Right spring line9.675.065.233.324.73/5.934.38
+976.6Right sidewall6.222.154.874.203.73/3.072.80
ZK14 + 973Left sidewall10.764.975.893.835.65/5.836.62
+973Left spring line15.553.176.046.117.65/3.544.00
+973Crown10.303.495.755.494.40/2.803.70
+973Right spring line12.123.555.105.575.11/4.023.38
+973Right sidewall5.332.743.312.033.34/3.542.52
ZK14 + 970Left sidewall5.442.762.601.542.78/3.991.46
+970Left spring line9.865.014.563.104.62/3.224.86
+970Crown6.922.323.501.554.52/3.244.47
+970Right spring line6.574.393.702.523.90/3.173.30
+970Right sidewall4.772.502.042.052.43/2.612.20
ZK14 + 967Left sidewall6.392.603.102.824.63/4.712.16
+967Left spring line7.932.853.142.733.09/3.322.16
+967Crown6.371.522.131.541.90/2.481.68
+967Right spring line5.613.202.051.882.57/2.591.56
+967Right sidewall3.801.781.541.581.70/1.811.86
ZK14 + 964Left sidewall4.521.932.472.762.502.672.921.91
+964Left spring line5.192.042.192.611.761.702.421.80
+964Crown////////
+964Right spring line4.512.392.002.401.261.082.061.42
+964Right sidewall3.041.321.902.231.350.981.291.17
Publisher’s Note: MDPI stays neutral with regard to jurisdictional claims in published maps and institutional affiliations.

