Article

Mid-Infrared HgTe Colloidal Quantum Dots In-Situ Passivated by Iodide

1
Key Laboratory of Advanced Functional Materials, Ministry of Education, Faculty of Materials and Manufacturing, Beijing University of Technology, Beijing 100124, China
2
Key Laboratory of Opto-Electronics Technology, Ministry of Education, Faculty of Information Technology, Beijing University of Technology, Beijing 100124, China
*
Author to whom correspondence should be addressed.
Coatings 2022, 12(7), 1033; https://doi.org/10.3390/coatings12071033
Submission received: 30 May 2022 / Revised: 3 July 2022 / Accepted: 13 July 2022 / Published: 21 July 2022
(This article belongs to the Special Issue Advances in Nanostructured Thin Films and Coatings)

Abstract

:
Today, colloidal quantum dots (CQDs) have received wide attention due to their properties of tunable infrared absorption. For example, HgTe colloidal quantum dots have shown excellent optical absorption (absorption coefficient α > 104 cm−1), spectral absorption tunability covering the entire infrared atmospheric window, and even the terahertz (THz). However, the efficient surface passivation of HgTe CQDs was limited by the highly sterically hindered long-chain organic ligands. Here, we demonstrate a new method to synthesize monodisperse mid-infrared HgTe CQDs, and the preparation process of the Hg precursor solution is optimized. With I in-situ passivated on the surfaces, the spherical HgTe quantum dots are successfully synthesized with the tunability size from 8 to 15 nm. The noise current density of the photoconductive device is as low as 10−11 A·Hz−1/2 at 130 K with a frequency of 1 Hz.

1. Introduction

Mid-infrared photodetectors based on inorganic semiconductor materials, such as HgCdTe [1], III–V AlGaAs/GaAs epitaxial quantum dot [2,3], and InAs/GaInSb Type II superlattices [4,5], can achieve higher sensitivity and faster speed. However, these materials are achieved by epitaxial growth on lattice-matched substrates by molecular beam epitaxy or chemical vapor deposition, which leads to high costs [6,7]. Colloidal quantum dots (CQDs) have attracted extensive attention due to their liquid-phase synthesis and processing which greatly reduces the cost [8], tunable optical bandgap [9,10], and surface ligand-regulated doping [11]. As a semimetal [12], the bandgap of HgTe can be tuned from 1.5 eV for quantum confinement effect to virtually zero [13], and the absorption spectrum can be tuned over the entire infrared spectral range.
There have been many advances in the synthesis methods of metal sulfide colloidal quantum dots. Previously, the aqueous phase method and the epitaxial growth method were widely used [14,15,16,17]. In 1993, Bawendi et al. used thermal injection technology to synthesize nanocrystals in the organic phase for the first time [18], creating a new direction for the synthesis of colloidal quantum dots (CQDs) in organic solvents. Compared with the aqueous phase method, this method has a shorter process time, better size control, and higher quantum yield [19]. With the developments of recent years, hot injection technology has gradually become the preferred method for the synthesis of CQDs [20,21]. Nowadays, HgTe CQDs have been used for near-infrared, mid-infrared, and long-wave infrared detection [21,22,23,24,25,26,27]. Among these different synthetic methods, good size-tunable mid-infrared colloidal quantum dots have been obtained by using HgCl2 and Te in tri-n-octylphosphine (TOPTe) as raw materials to react in long-chain amine organic coordination solvents [26], with narrow photoluminescence (PL) peaks and full width at a half-maximum often less than 500 cm−1. However, there are still two problems for the synthesis of HgTe CQDs. Firstly, the surface stabilities are so weak when amines are worked as ligands that they easily fall off during the centrifugal purification stage, leading to the agglomeration of quantum dots. Meanwhile, thiols have strong binding energies with the Hg sites on the surface of HgTe CQDs [28], and this is difficult to achieve in the subsequent surface modification process. Secondly, during the synthesis stage of CQDs, good colloid dispersion can be achieved by the utilization of long-chain organic molecules as ligands, but these long-chain organic molecules have great steric hindrance due to the influence of their own volume [29,30]. After binding on the surface of quantum dots, the space of adjacent passivation sites is not sufficient to meet the entry of new organic molecules, resulting in incomplete passivation with numerous dangling bands on the surfaces of CQDs. Trap states would be formed for the reaction at these sites with water or oxygen before the process of the subsequent ligand exchange to achieve surface chemical modification and efficient passivation, which would decrease the performance of the devices. Thus, it is necessary to find a synthetic method to achieve effective surface passivation as well as good colloidal stability.
Beyond the long organic chains, halide ions are also utilized as surface ligands. In 2012, the Sargent group introduced metal halides (CdCl2 dissolved in TDPA and oleylamine) during the synthesis process, and realized that the halide ions passivated CQDs, achieving better surface defect state passivation. This also sparked a new idea for ligand engineering [29]. In 2014, Zhijun Ning studied the effect of different halide ions’ passivation of CQDs and proved that the passivation of I had protected the surface against the attack of oxygen more effectively [31]. The test established that CQDs passivated by I had a lower defect density compared with those passivated by other halide ions. By far, CQDs passivation by I is still the best passivation method. Moreover, the studies regarding the noises of CQDs photodetectors passivated by halide ions have been reported. In previous studies, using 1-ethyl-3-methylimidazolium iodide (EMII) and tetrabutylammonium iodide (TBAI) as the raw material for ligand exchange could achieve the surface passivation effect of I, the density of trap states is significantly reduced, and the noise current density of the fabricated junction device was as low as 10−11 A·Hz−1/2 at room temperature [32]. With the development of synthesis technology, I passivation can also be achieved during the synthesis of CQDs. Matthew C. Beard’s group demonstrated that PbI2 can be used as a raw material for the synthesis of in-situ passivated PbS CQDs [33]. Subsequently, the WanLi Ma group realized a one-step preparation of PbS CQDs ink passivated by I, using PbI2 to synthesize in-situ passivated PbS CQDs. The devices preparation process has been greatly simplified while maintaining performance [34]. These studies fully demonstrate that halide ions, especially I, can be used as ligands to achieve good surface passivation.
Here, we use HgI2 as the Hg source to realize the idea of I surface passivation during the synthesis process, for the soft base I bound strongly to the soft acid Hg2+ [35]. It is, however, difficult to break the strong binding energy of Hg–I to form a monomer for the reaction during the preparation of the precursor solution, therefore we mainly researched the preparation temperatures during this process. The strong Hg–I bond was successfully destroyed, and the I coated HgTe CQDs were synthesized. At the same time, bis(trimethylsilyl) telluride (TMSTe) is utilized as a Te source for its high reactivity so that it will not be coated on the surface of quantum dots as a ligand and limit the reactivity of another monomer [36]. As a result, I in-situ passivated HgTe CQDs were successfully synthesized with the size tunability from 8 to 15 nm. Furthermore, a photoconductive device was fabricated achieving good detection under 2000 nm light by lowering the temperature, and the noise of this device was as low as 10−11 A·Hz−1/2 at 130 K with the frequency of 1 Hz.

2. Materials and Methods

2.1. Material Synthesis

CAS number: Mercury iodide (7783-30-4), bis(trimethylsilyl)telluride (4551-16-0), Oleylamine (112-90-3), Tetrachloroethylene (127-18-4), n-Hexane (110-54-3), Methanol anhydrous (67-56-1), Ethanol absolute (64-17-5).
For Hg precursor solution, 4 mL oleylamine was taken, injected into a three-necked flask, degassed at 155 °C for 3 h to remove water and absorbed CO2, then cooled to room temperature under N2 atmosphere, and stored in a glove box. 45.4 mg HgCl2 (0.1 mmol) was dissolved in 4 mL of oleylamine in a 100 mL three-necked flask. Under the Schlenk line, the Hg precursor solution was degassed at room temperature for 20 min, and then it was degassed at 140 °C for another 1 h. Later, the temperature was lowered to the injection temperature of 120 °C, with N2 introduced, and the temperature was maintained for 20 min until the temperature was stable. For Te precursor solution, 14 μL TMSTe (0.05 mmol) and 0.5 mL hexane were mixed in a 10 mL glass vial in a glove box and removed by a syringe. When it was injected into the flask at 120 °C, the clear solution immediately turned black, the growth temperature was controlled at the same time as the timing was started, and the temperature was selected between 115–120 °C. The reaction was quenched by injection of 15 mL of tetrachloroethylene (TCE). The size of the quantum dots is controlled by controlling the injection temperature and growth time. After the reaction, it was purified with methanol, and the volume ratio of methanol to tetrachloroethylene was 2:1. After precipitation, it was rinsed three times with anhydrous ethanol, and finally dispersed in TCE and stored in a glove box.

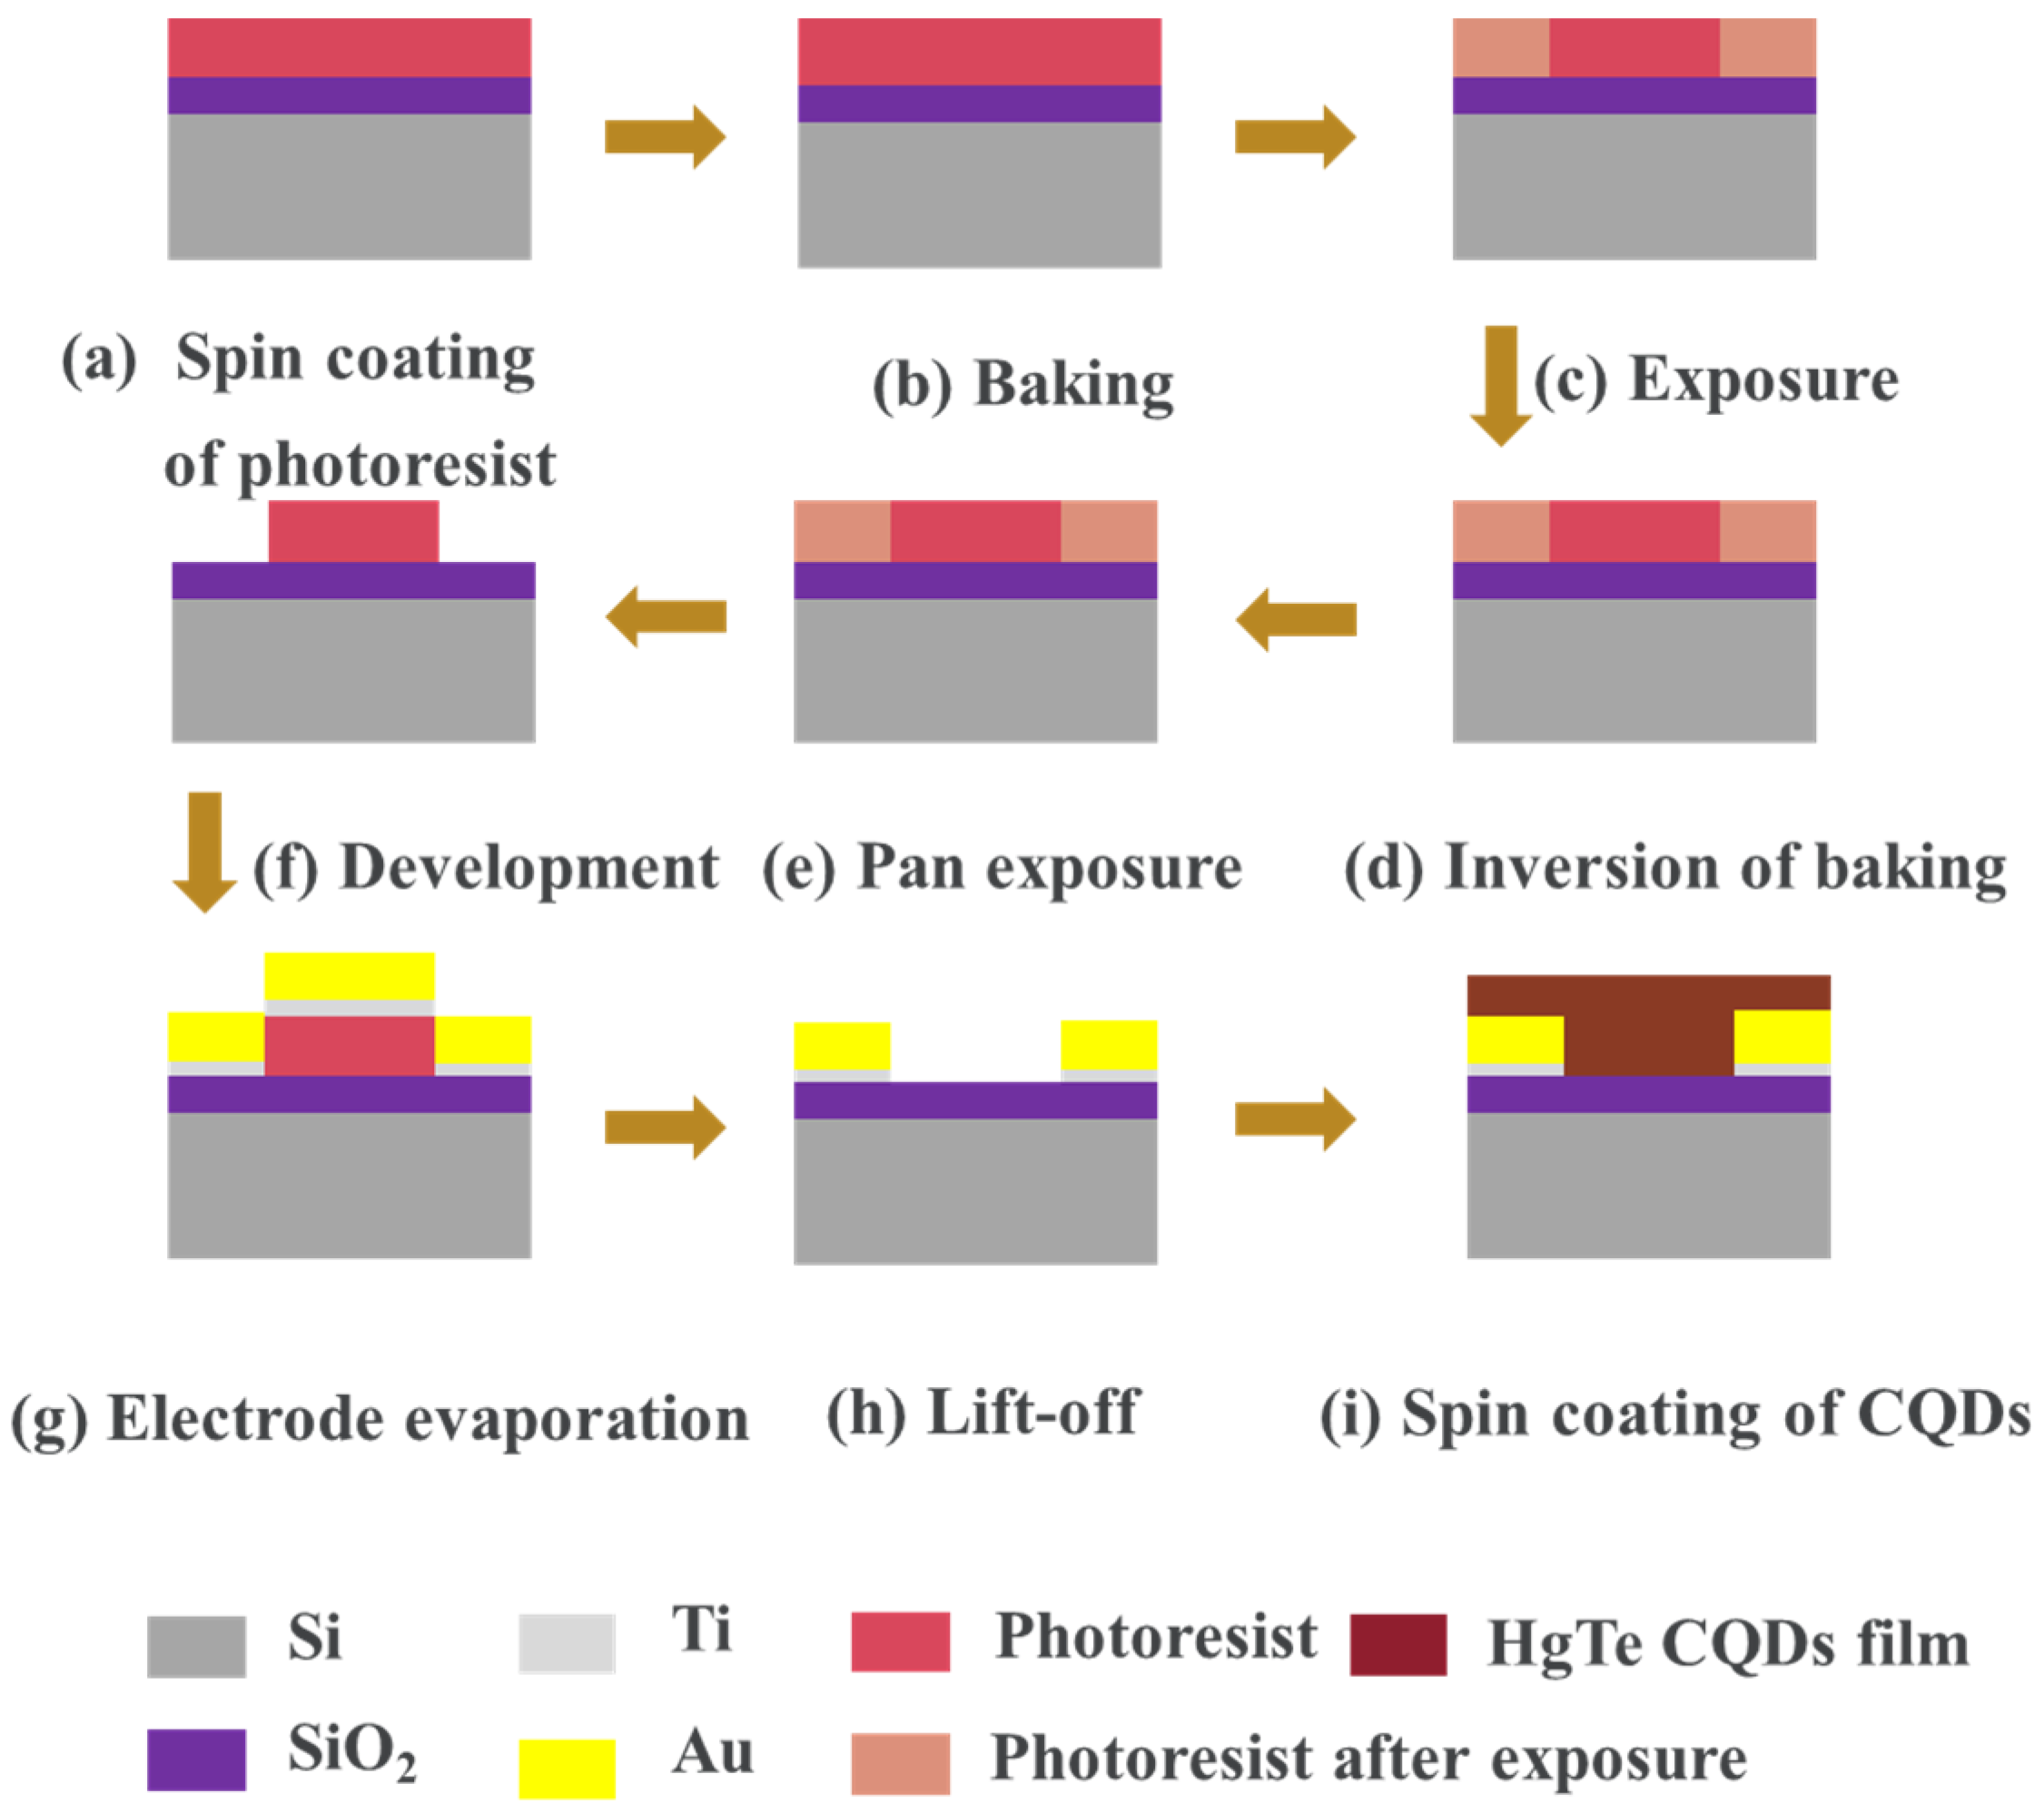
2.2. Device Preparation

Si/SiO2 slices were cut into 0.7 cm × 0.7 cm and cleaned by acetone, anhydrous ethanol, and deionized water. The photoresist AZ5214 was spined onto the silicon wafer at a speed of 500 r.p.m. 10 s and 4000 r.p.m. 50 s, and baked on a baking tray at 110 °C for 3 min to ensure that the photoresist was fully dry. The silicon wafer was exposed to UV light for 1.2 s with an MJB4 mask. The silicon wafer was then placed in a drying oven at 125 °C for 2 min 8 s. After it was taken out, a pan-exposure was performed for 22 s under UV light. The exposed silicon wafer was placed into the developer for 39 s and rinsed with deionized water for 10 s. The substrate was cleaned under oxygen plasma and dried for 5 min to remove excess developer. The electrodeposition method was by electron beam evaporation. Firstly, 10 nm Ti was steamed and plated as the adhesion layer, and then 70 nm Au was deposited. The lift-off was operated in acetone for 1 h, and washed by ethanol and deionized water. HgTe QDs were dispersed in the solvent configured to 25 mg/mL, and filtered by 0.45 μm filter on the substrate. Subsequently, the substrate was rotated at 2000 r.p.m. 30 s and baked on the baking tray at 40 °C for 30 s. Later, the QDs film was treated by EDT solution for solid matching exchange. After 20 s, it was cleaned with anhydrous ethanol for 5 times, and then baked on the baking tray for 30 s. The above steps were repeated 15 times to obtain ~ 200 nm HgTe CQDs film. The length and width of the channel were 55 and 9 μm, respectively.

2.3. Characterization

Transmission electron microscope (TEM) images were taken from SU9000 FE-STEM (Hitachi, Tokyo, Japan) and JEM-2100F(Nippon electronics, Tokyo, Japan) transmission electron microscope at 30, 200 kV. The nanocrystal samples for TEM were obtained by depositing these solutions onto ultrathin carbon-coated copper TEM grids. X-ray diffraction (XRD) patterns were carried out on a Bruker D8 ADVANCE diffractometer (Bruker, Karlsruhe, Germany) with Cu radiation. The absorption spectra of HgTe CQDs were measured in the transmission mode by Fourier-transform infrared (FTIR) spectrometer, where the CQDs were dropped on a CaF2 substrate. FTIR spectra were acquired using Fischer Nicolet iS50 (Thermo fisher, Boston, MA, USA). X-ray photoelectron spectroscopy (XPS) patterns were carried out on a Thermo Scientific Escalab 250Xi (Thermo scientific, Boston, MA, USA). The HgTe CQDs films for XPS test were made by drop-coating onto Si/SiO2 substrate. A semiconductor analyzer Agilent B1500A (Agilent, Santa Clara, CA, USA) was used to measure the optoelectronic responses of the devices. The light source was a supercontinuum light source (SuperKExtreme, NKT Photonics, Berlin, Germany) coupled with a monochromator (SOL instrument, MS 2004i, Belarus).

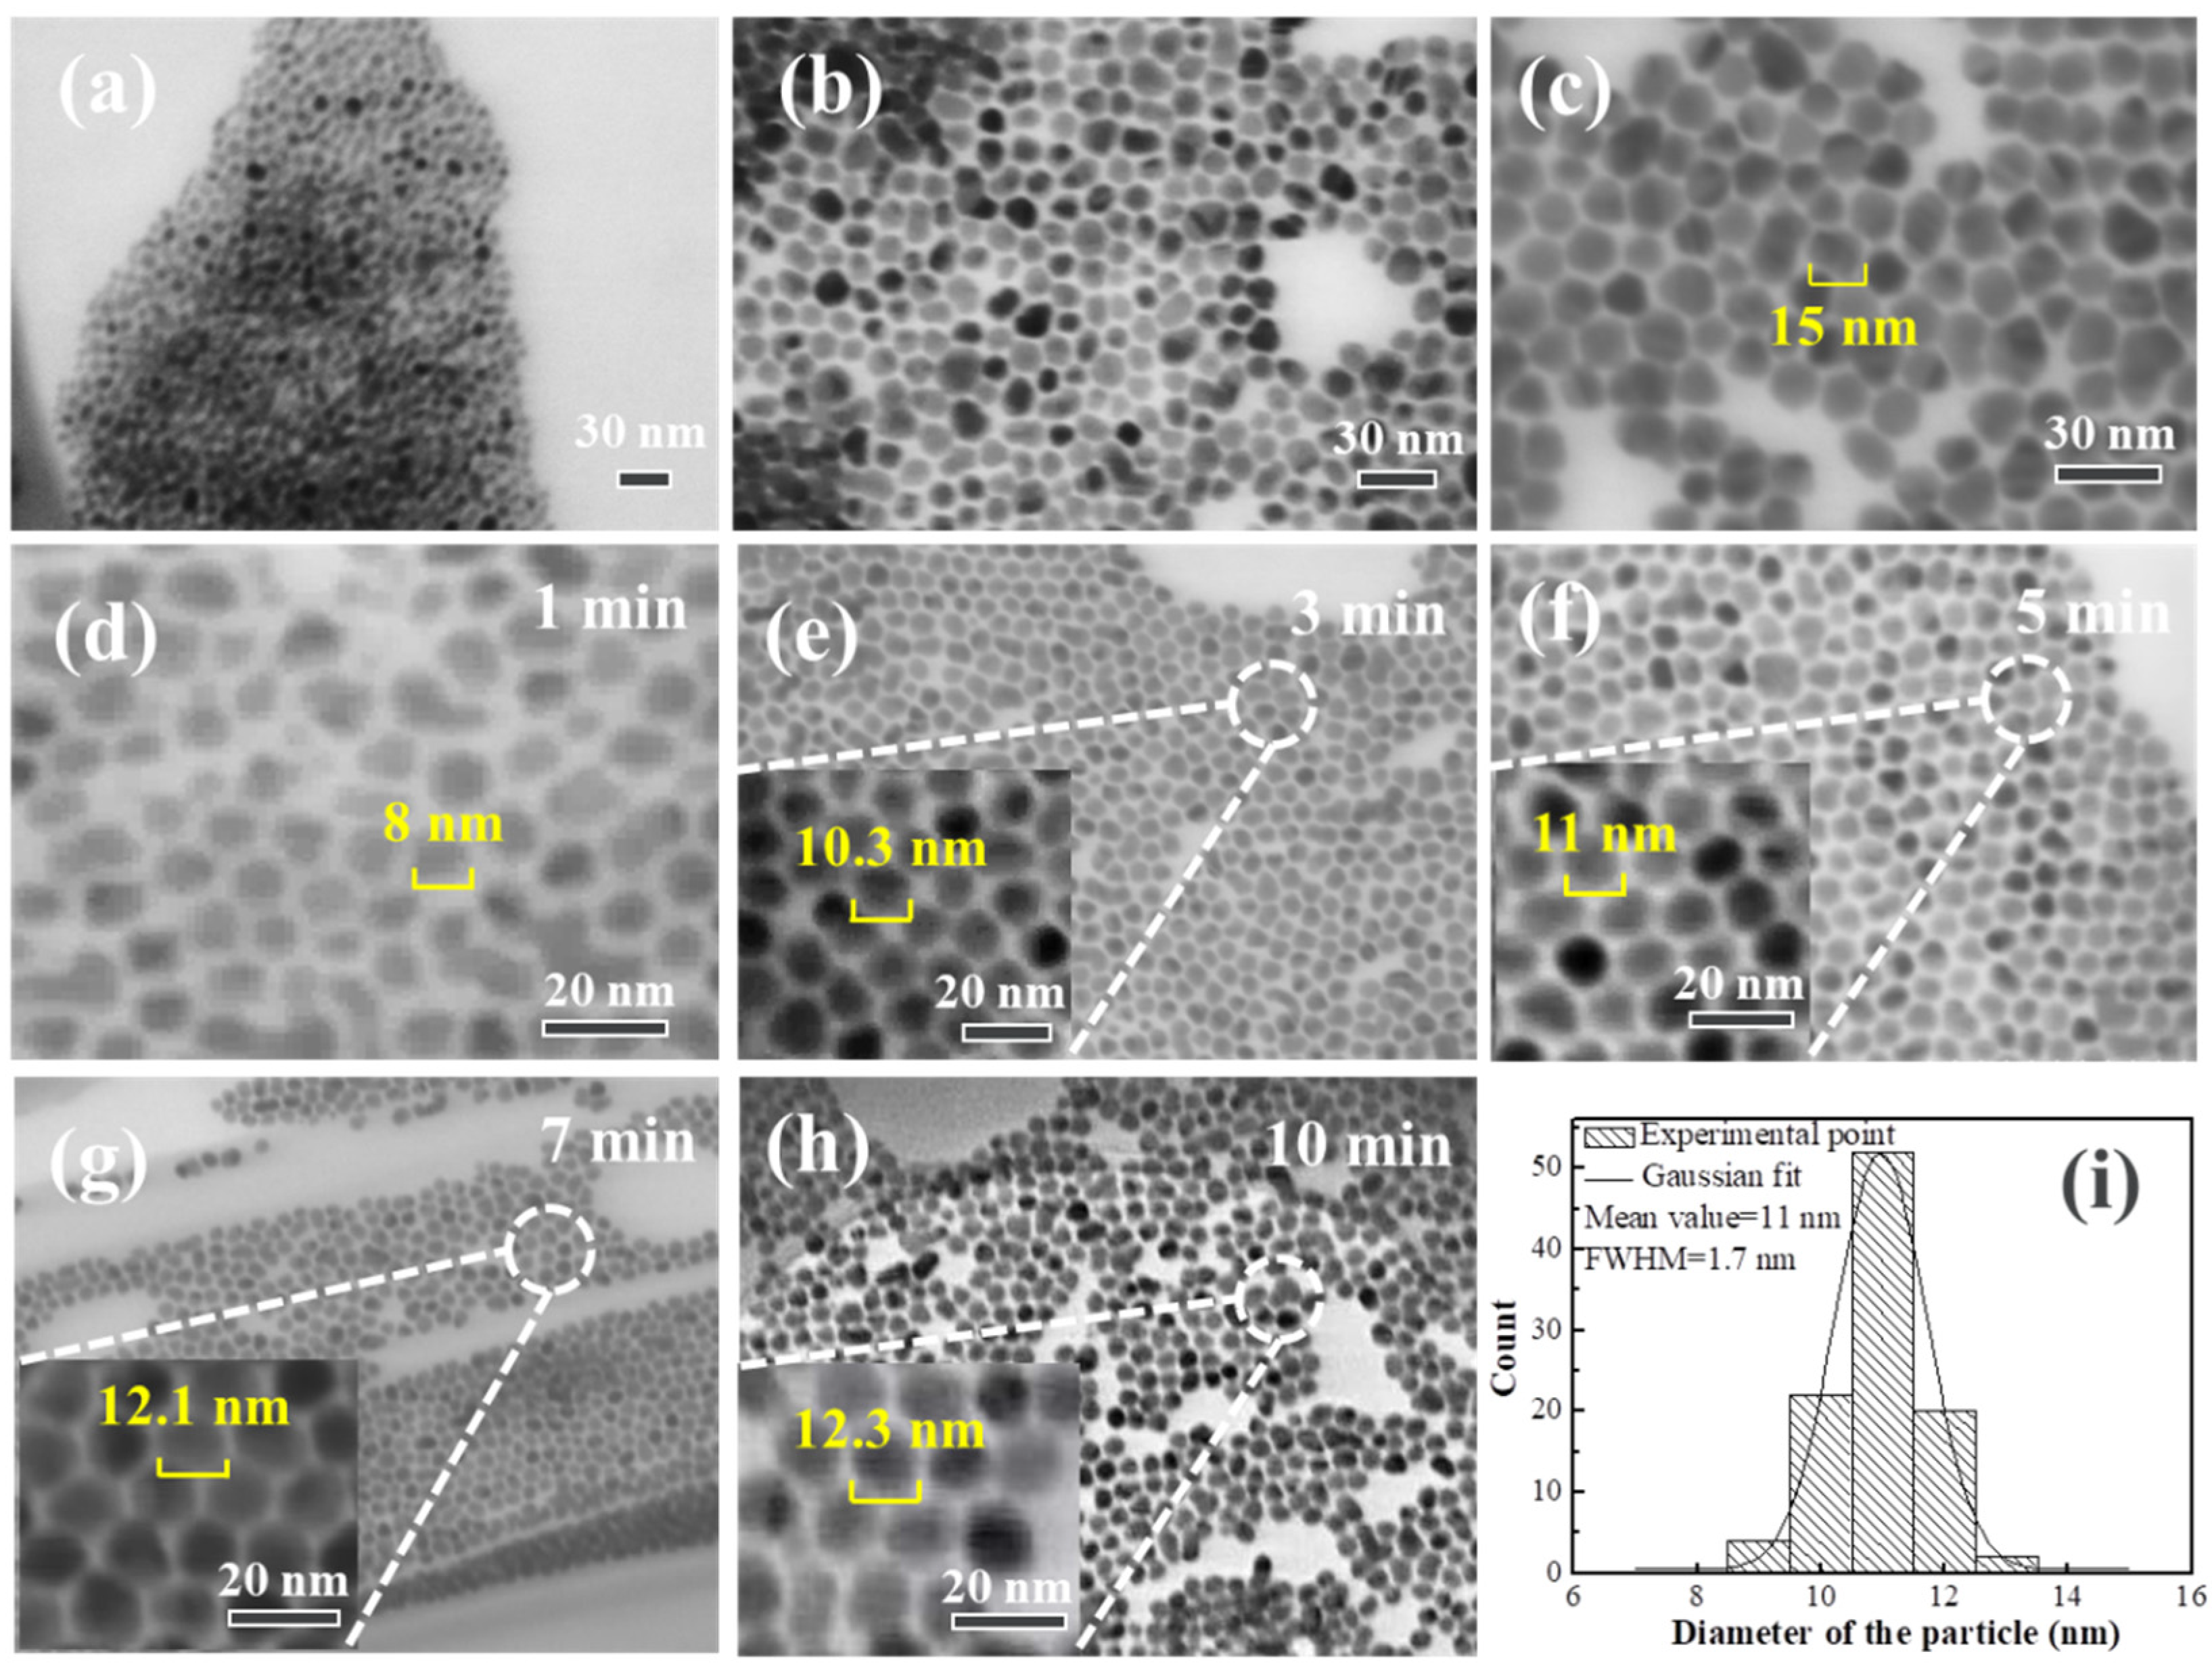
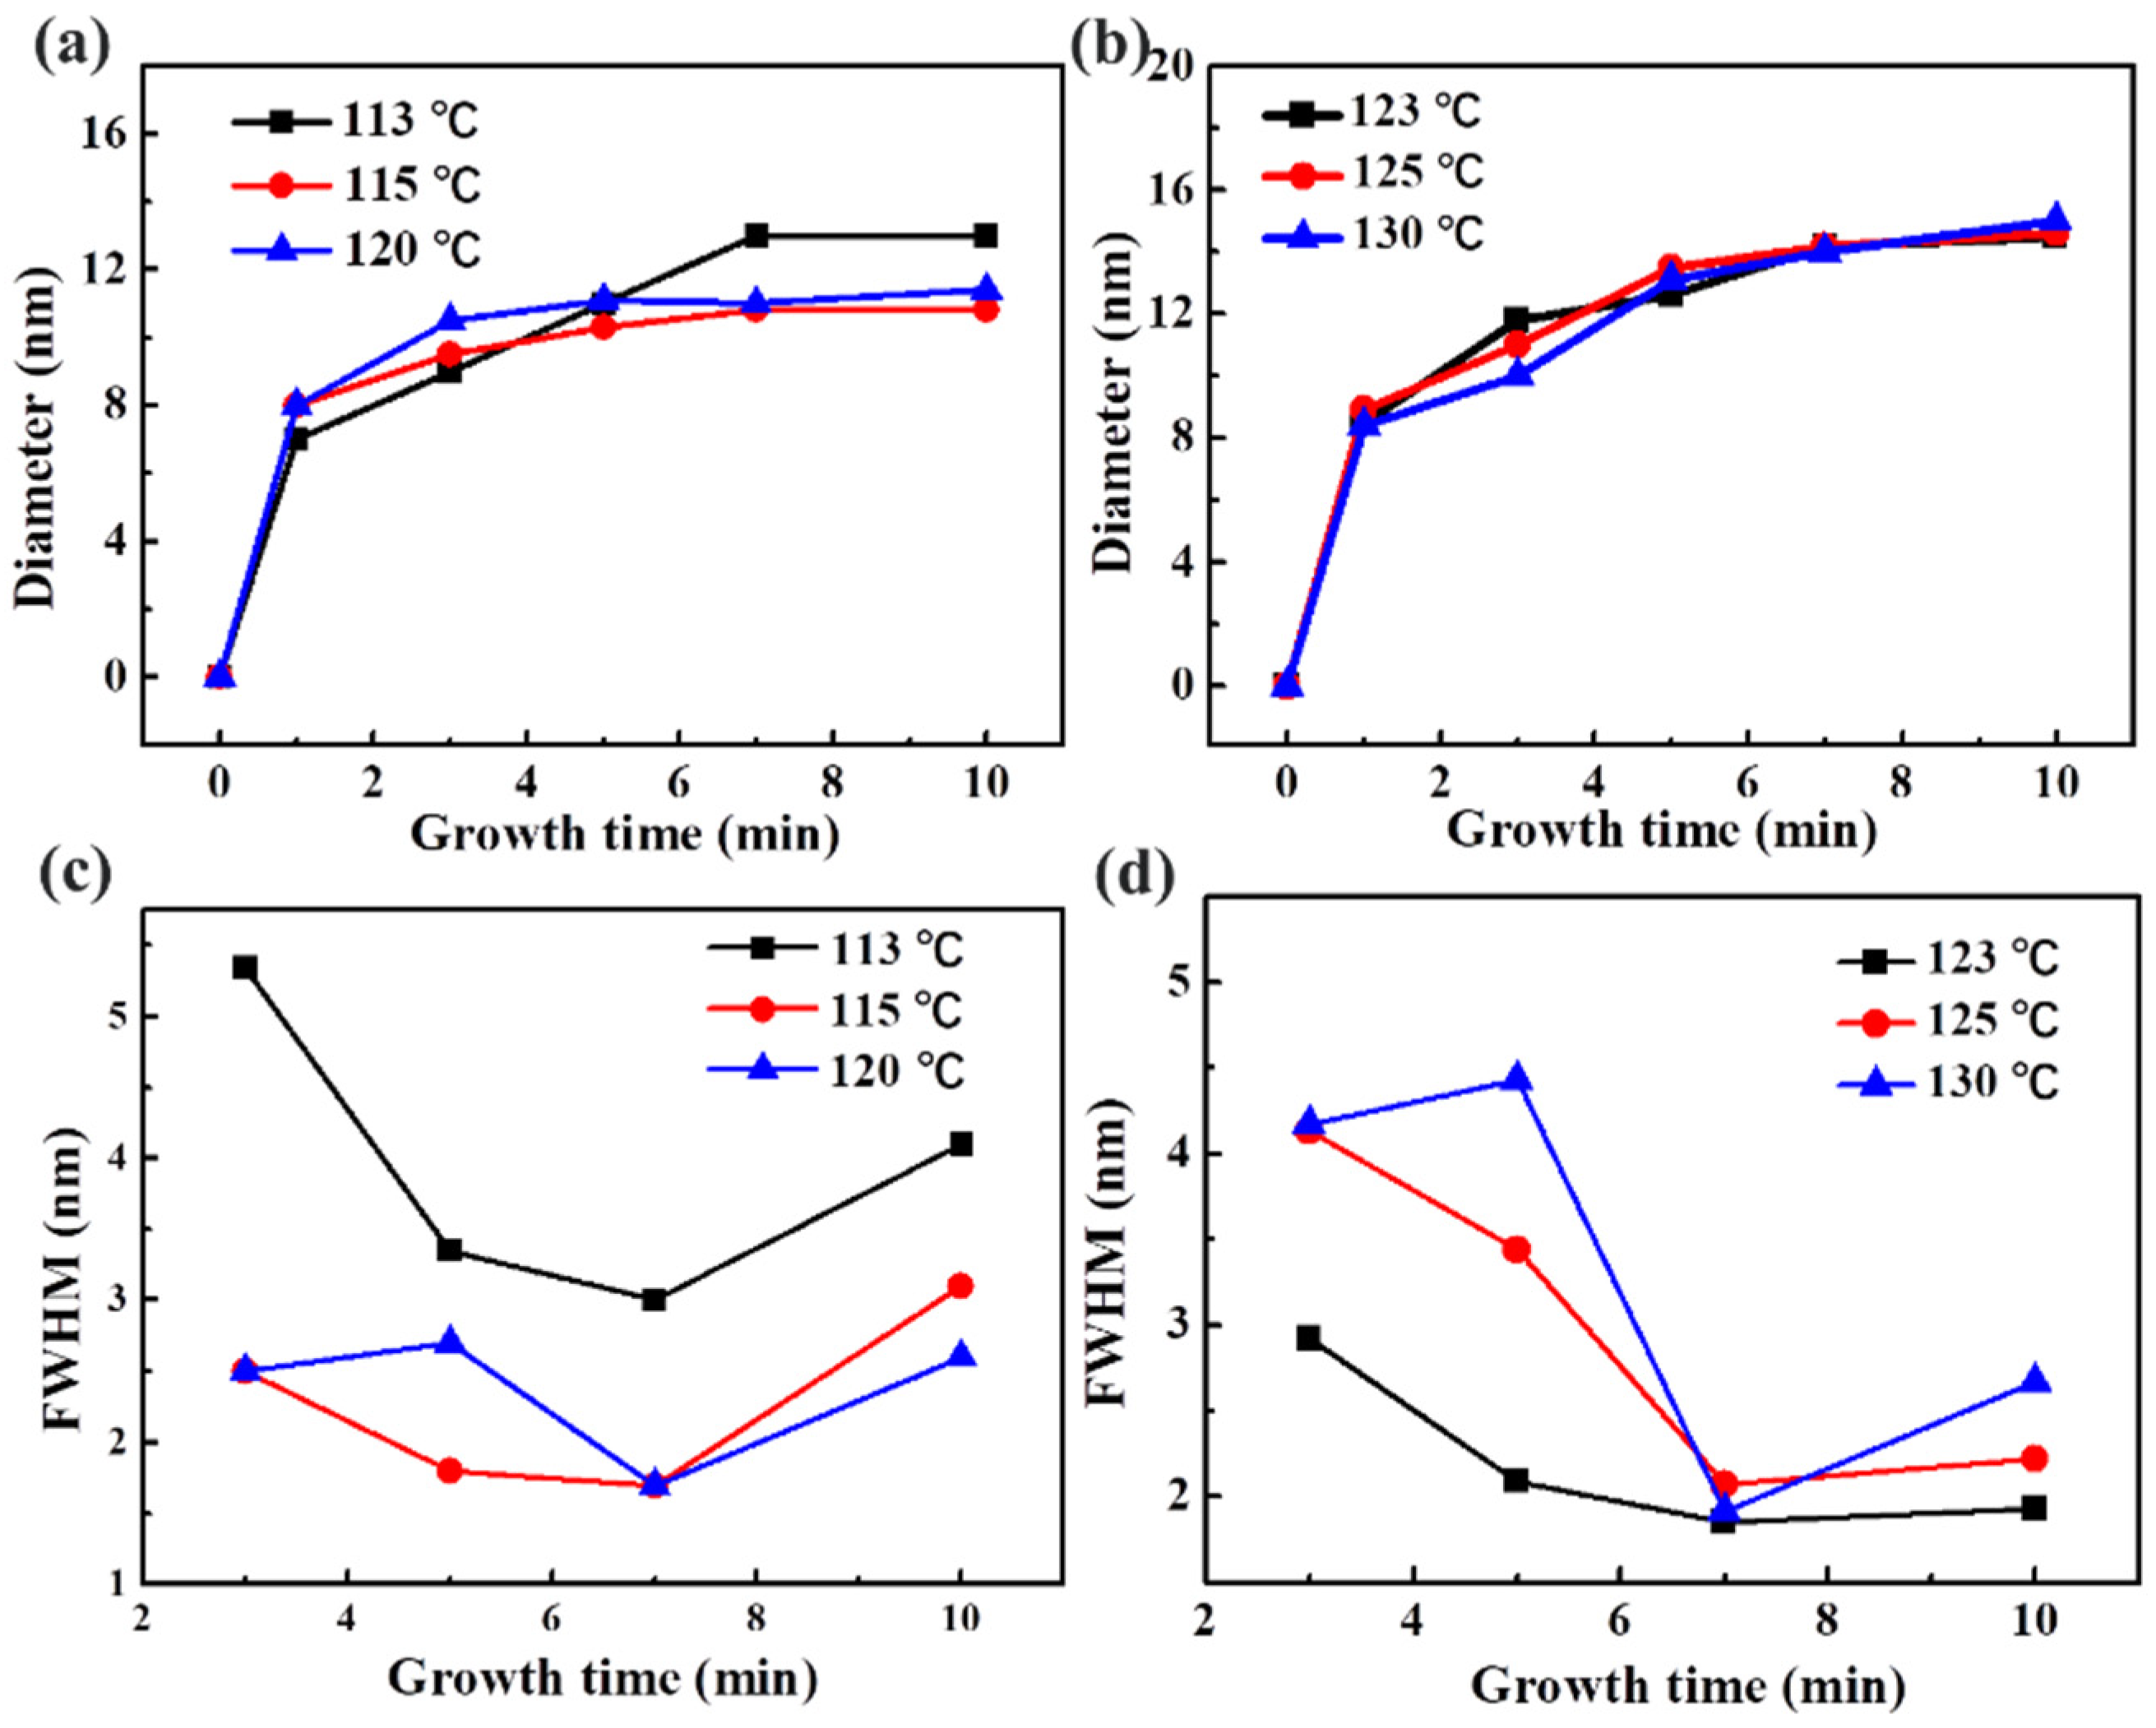
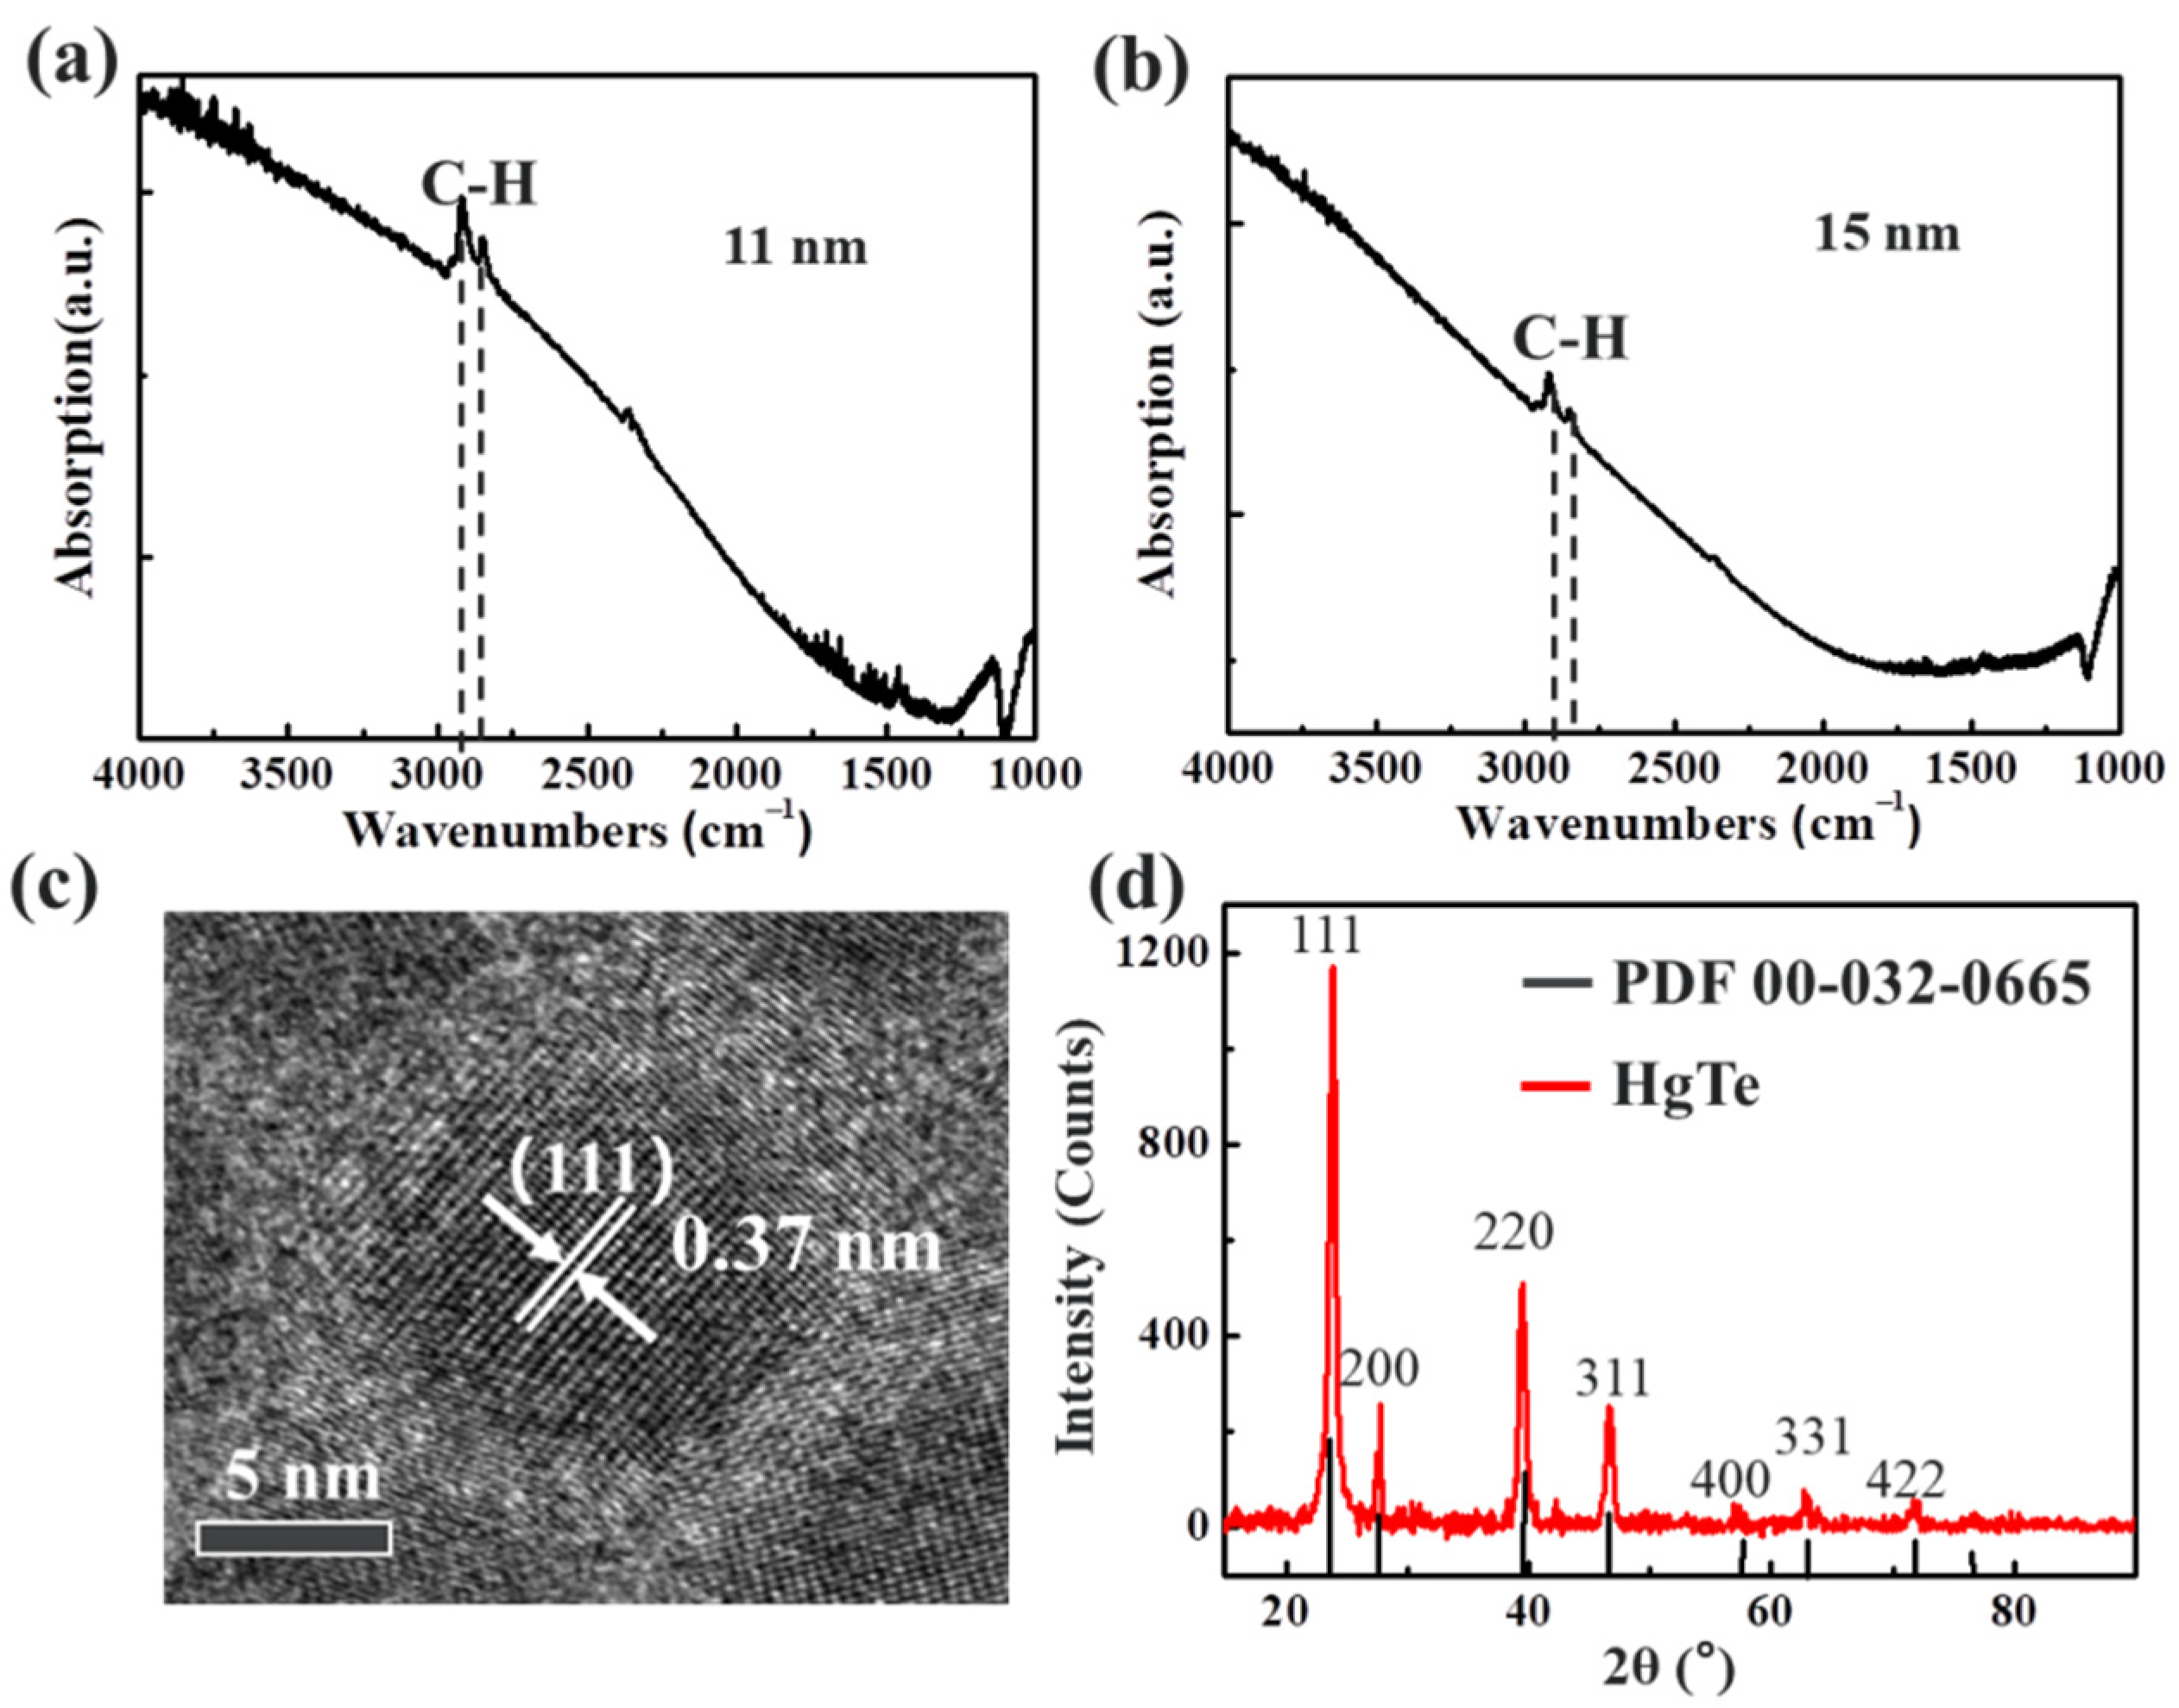
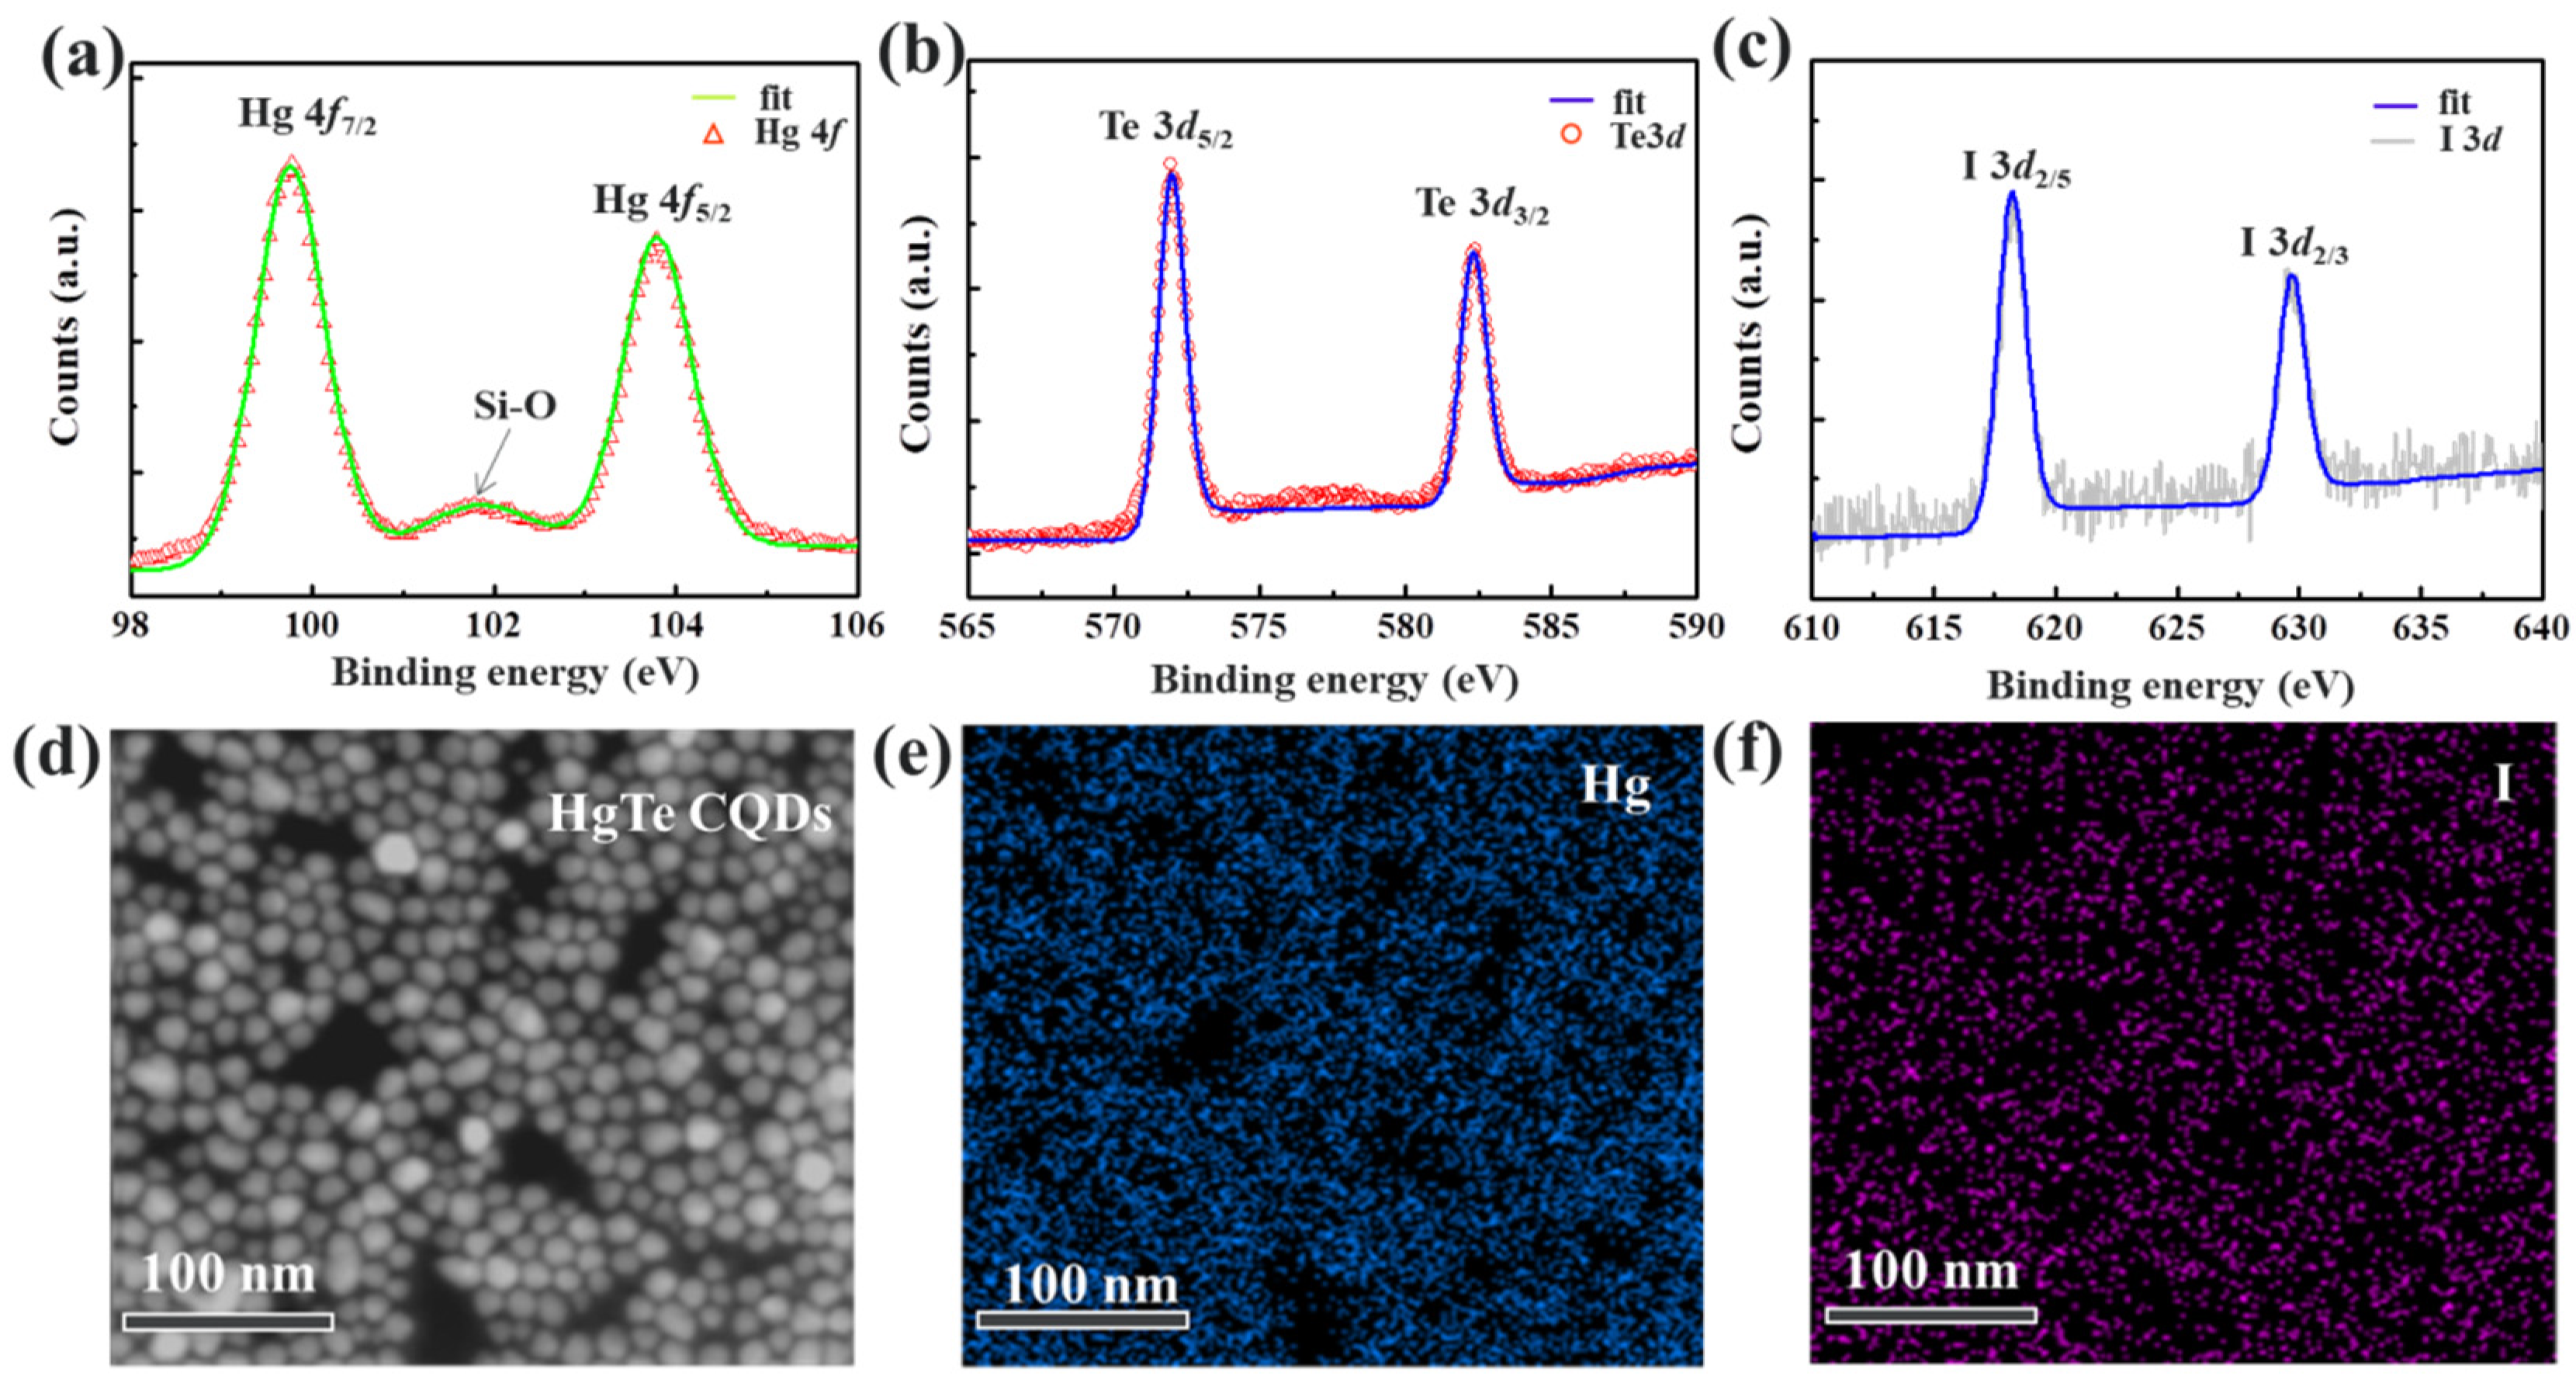
3. Results and Discussion

The main raw materials used in the preparation of HgTe CQDs are HgI2, TMSTe and oleylamine, and oleylamine is used as the solvent for the reaction. We prepare HgTe CQDs using a 2:1 stoichiometric ratio of HgI2 and TMSTe, and the excess Hg precursor acts as a ligand to bind to the surface Te sites, which is beneficial to the stability of the quantum dots [35]. The injection temperature, as one of the most important factors during hot injection reaction process, has been studied first in this work. Comparing the previous works with Hg precursors fabricated by HgCl2, the temperature of the Hg monomer formed by HgI2 could be calculated. Previous studies have shown that the dissociation energy of HgCl 2 Hg 2 + + 2 Cl is 445.18 kJ/mol, and the dissociation energy of HgI 2 Hg 2 + + 2 I is 559.3 kJ/mol [37,38]. The energy required for dissociating 0.1 mmol of Hg source is 44.52 J and 55.93 J, respectively, and the temperature required for HgI2 is calculated using HgCl2. As a coordinating solvent, oleylamine assumes that all the energy it absorbs is dissociated as HgCl2. According to the calculation formula of specific heat capacity [39,40]
Q = CmΔT,
where C is the specific heat capacity of oleylamine, m is the mass of oleylamine, and ΔT is the temperature change. According to the previous research, when HgCl2 is used as raw material, ΔT is 80 °C, m is 4 g, and C is calculated to be 0.139. When it is brought into the HgI2 system to calculate ΔT, the solution obtained is that ΔT is ~100 °C, so the dissociation energy HgI2 temperature is therefore set at ~120 °C.
Considering to the previous reported method, the particle sizes of mid-infrared HgTe CQDs should be controlled at about 7–12 nm [10], and the injection temperature is determined at 120 °C. For the preparation of the precursor, we dissolve HgI2 in oleylamine, degassed at room temperature for 20 min, and then it is heated to 100 °C for 1 h to remove soluble impurities such as water and CO2. The change of the quantum dots’ particle size is observed by increasing the injection temperature which is set at 120, 130, and 140 °C, respectively. It is found that the size distribution of quantum dots changed significantly at different injection temperatures, and we initially speculated that the reaction process is hindered by the strong binding energy of Hg–I at lower temperatures. With the increasing temperature, the influence of the size distribution by Hg–I binding energy gradually weakened. Figure 1a–c shows the distribution of HgTe CQDs at different injection temperatures, and the size distribution of quantum dots gradually decreases with the increase of injection temperature. We conclude that Hg–I can be destroyed at 140 °C to form stable Hg precursors solution. However, the size of the synthesized quantum dots gradually increased, and the particle size could reach 15 nm at the injection temperature of 140 °C. As shown in Figure 1c, the particle size could not be controlled within the range of 7–12 nm. Therefore, we propose a way to increase the preparation temperature of the precursor solution and reduce the injection temperature. We increase the preparation temperature of the precursor solution from the original 100 to 140 °C, and then reduce the injection temperature to 120 °C under N2 atmosphere. HgTe CQDs of different sizes are obtained by controlling different growth temperatures and growth time. Figure 1d–h shows the TEM images of the morphology of quantum dots changing with the growth time at 120 °C and the growth temperature at 120 °C. Figure 1i is a histogram of diameters for 100 quantum dots with a growth time of 7 min.
We also discuss the effect of different growth time and growth temperature on particle size and size distribution. Figure 2a,b shows the relationship between particle size and growth time at different growth temperatures. We can clearly see that these reactions at different temperatures have completed the processes of explosive nucleation and rapid growth within the first minute. With the extension of time, the particle size tends to a stable value. We counted the size distribution histograms of grains at different growth temperatures, the details of which are shown in Supplementary Figure S1. From the statistics of the change of the peak width at half maximum with the growth time, it can be seen that the full wide at half maximum (FWHM) reaches the minimum when the reaction is carried out for 7 min. The size distribution at this time is the smallest, and the HgTe CQDs are the most uniform (Figure 2c,d). Among them, at the growth temperature of 113 °C, the size of the colloidal quantum dots increases significantly after the first minute. We speculate that this is due to the lower reaction temperature, the re-formation of Hg–I bonds, the reduction of the concentration of precursors formed by Hg and ligands, and the remaining monomer concentration also decreased. As a result, the ligand concentration increases, while the reactivity of the monomer and the number of nucleation would be suppressed. Finally, the formation of large-sized quantum dots is promoted, which is consistent with the previous report [41].
The synthesis of HgTe CQDs satisfies the LaMer’s model and the Oswald ripening process [42,43]. It can be seen from the figure that it is divided into three stages: explosive nucleation, grain growth, and ripening. The size of CQDs increases with the growth time, and all particle sizes tend to be consistent, which is in line with the general law of grain growth, and also in line with the law of Oswald ripening process. However, as the growth time continues to prolong, the small grains will dissolve, and due to the concentration gradient of the solute in the solution, they will diffuse to the surroundings of the large grains again, and the relatively large grains will continue to grow, causing the FWHM to continue to enlarge [44]. Comparing Figure 2a,b, the injection temperature increases from 120 to 130 °C, and the particle size increases significantly under the same growth time. According to the nucleation growth theory, the increase of the injection temperature will lead to the formation of the ligand and Hg2+ complex, meaning that as the monomer concentration decreases, the nucleation amount would decrease in the explosive nucleation stage [41,45]. The diffusion and deposition rate of the monomer in the solution to the crystal nucleus will become faster. Therefore, the size of the HgTe CQDs was larger at the growth time.
Figure 3a,b shows the FTIR absorption spectrum of 11 nm, 15 nm. It can be seen that the CQDs obtained by the improved synthesis method have obvious absorption peaks, and the cut-off wavelength can reach 5 μm. However, in the spectrum, the C–H peak between 2800 and 2900 cm−1 can still be observed, indicating that the oleylamine long-chain ligand is still partially retained, and only part of the I in this synthesis method has been in-situ passivated.
In order to analyze the crystal structure of HgTe CQDs, high resolution TEM (HRTEM) and XRD have been tested. HRTEM images and XRD data are shown in Figure 3c,d. The XRD test results (Figure 3d) show distinct peaks corresponding to the zinc-blende structure, which are consistent with the previous literature reports [26], indicating the existence of HgTe CQDs and the preparation method without changing the HgTe crystal structure. The spherical particles display lattice spacing of 0.37 nm. Figure 3c shows TEM images of crystal planes, consistent with the separation between (111) planes with a 6.46 Å lattice constant of zinc-blende HgTe [46]. We observed the XRD diffraction pattern and found that the peak intensity of the (111) face is much larger than that of other peak positions, and it is very sharp, and the relative peak intensity is about 2.4 times higher than that of the (220) plane, indicating that this synthesis method tends to retain (111) planes due to the slow growth of the facets. A considerable number of (111) planes are retained in the synthesized spherically shaped HgTe CQDs [47].
To ascertain the surface chemistry of the HgTe CQDs, we conduct XPS measurement. It can be seen from Supplementary Figure S2 that all the peaks mainly belong to C, O, Si, Hg, Te, and I elements. Among them, the characteristic peaks of Si and O are due to the contamination caused by the attachment of debris of the sample substrate to the surface. From the measured spectra in Figure 4a–c, 99.78 and 103.78 eV correspond to the peak positions of Hg 4f7/2 and Hg 4f5/2, respectively, and 571.98 and 582.38 eV correspond to the peak positions of Te 3d5/2 and Te 3d3/2, which fully verify the existence of HgTe. The I 3d peaks are also established in these results. The Hg/I of 11 nm HgTe CQDs calculated by XPS is 0.23, which indicates the coating of I on the surface of the quantum dots. In order to compare the surface chemical properties of HgTe CQDs with different particle sizes, XPS tests are also performed on HgTe CQDs with a particle size of 15 nm. The experimental results show that the peak positions of Hg 4f and Te 3d do not change, but the results show that the ratio of I/Hg drops to 0.17 and the Hg/Te ratio is 1.08, which are mainly due to the increase of the size of the HgTe CQDs. The Hg/Te ratio gradually tends to 1, and the proportion of Hg sites on the surface coordinated to I gradually decreases, resulting in a decrease in the Hg/I ratio. The XPS results are shown in Table 1.
In order to observe the coating effect of I on the surface of HgTe CQDs more intuitively, the results of EDX spectrum are shown in Figure 4d–f. The distribution of each colloidal quantum dot can be seen from the electronic image, as shown in Figure 4d. The brighter area is the area in which HgTe CQDs are distributed, and the darker area is the copper grids and the carbon grids area attached to the copper grids with no HgTe CQDs. Among them, Hg and I elements are marked with two different colors of blue and pink, respectively, as shown in Figure 4e,f. Comparing the electron image and the element distribution map, it can be clearly seen by observing the blue marks that the particles in the electron image are indeed composed of Hg elements, and the distributions of these two elements are the same as that in the electron image. The particle distribution remains the same. For the I element marked in pink, it can be seen that the distribution follows the distribution of HgTe CQDs, confirming the conclusion that I coated on the HgTe CQDs surface. Figure S4 shows the EDX surface total spectrum.
To test the detection ability of the prepared HgTe CQDs, a photoconductive detector is prepared. The process of device fabrication is shown in Figure 5. The idea size of the quantum dot for photodetection is ~11 nm. The schematic diagram of the device is shown in Figure 6a, and the I–t curve is tested under the light of 2000 nm, as shown in Figure 6b. At room temperature, the optical signal is relatively weak, and the noise signal is large, which drowns out the optical signal. In order to reduce the noise signal, the operating temperature of the device was lowered and the performance changes are observed. The temperature is lowered to 230, 180, 130, and 80 K, respectively, and the I–t curve of the device under 2000 nm illumination is tested, as shown in Figure 6c–f. When the temperature decreased from room temperature to 230 K, the photo-response signal did not change significantly. The photocurrent is small and the noise signal is large. When the temperature is dropped to 180 K and below, there is an obvious photo-response, and the photocurrent also increases significantly with the noise signal dropped.
For devices, especially photoconductive devices, the recovery time is longer than the response time. This is a common phenomenon, mainly due to the existence of defect states on the surface of CQDs. The photo-generated carriers generated by the device under light irradiation are trapped by the defect states, so that recovery time would be longer than the response time due to the increased de-capture process [48,49,50].
As shown in Figure 7a, different photocurrents are normalized to discuss the relation between the photocurrent and temperature. The results show that no matter what wavelength of light is irradiated, the photocurrent increases significantly during the temperature change from 300 to 180 K, while the photocurrent changes little or decreases from 180 to 80 K. According to the transport mechanism of quantum dots at room temperature, between quantum dots and quantum dots, carriers are transported from one point to another by hopping, or in a local area, carriers pass through by the ways of tunneling and transmit to adjacent quantum dots. With the decrease of temperature, the direct tunneling barrier of QDs will be reduced due to thermal shrinkage or the phase transition of ligands in the early stage [51]. Subsequently, when the temperature drops, the carrier skip transfer will be affected by thermal activation [51,52]. The low temperature causes the slow of the carrier skip transfer and the thermally activated hopping transport, so that the mobility would be decreased. This mechanism proves that when the temperature decreases from 300 to 180 K, the ligand phase transition and thermal shrinkage of the film play a major role, and the photocurrent increases significantly. When the temperature decreases below 130 K, the thermally activated hopping transport is inhibited and the photocurrent decreases.
The noise currents in the low and medium frequency regions (2π << 1) are shown in Figure 7b, ~10−11 A·Hz−1/2. For the noise in the low and middle frequency regions, the random capture and emission of carriers by the trap center will cause the fluctuation of the number of carriers in the device, resulting in 1/f noise [53]. It is well known that after photo-generated carriers are generated, trap states emerging due to surface passivation problems will capture photo-generated carriers, resulting in an increase in 1/f noise current. Compared to previous studies [48,54,55,56], as shown in Table 2, the reduction of the noise current in the mid-low frequency region also confirms the reduction of trap states on the surface of the quantum dots, which again demonstrates the improvement of the surface properties.

4. Conclusions

In summary, we use HgI2 as the Hg source to synthesize mid-infrared HgTe CQDs. By optimizing the preparation process of the precursor solution, the stable formation of the Hg precursor solution breaks the Hg–I strong bond to the HgTe CQDs synthesis process. The adjustment of 8–15 nm size is realized with the I in-situ passivated on the surfaces. A photoconductive device is prepared, which can achieve good detection under 2000 nm light by lowering the temperature, and the noise of the photoconductive device is as low as 10−11 A·Hz−1/2 at 130 K with the frequency of 1 Hz. Furthermore, this work opens up a new idea for the synthesis of HgTe CQDs and one-step preparation of inks. However, the HgTe CQDs prepared in this paper are only partially coated on the surface of the quantum dots as ligands, and there are still many oleylamine molecules as ligands to disperse the quantum dots. For example, PbS and PbSe CQDs have made innovations in the synthesis methods in recent years. The one-step hot injection synthesis of I full-coated CQDs ink can be achieved, the carrier mobility is significantly increased, and the defect state density is also significantly reduced. Therefore, future preparation methods also need to be further studied, considering the organic reaction mechanism and acid-base synthesis environment to promote the progress of the reaction and the coating of I. For devices, especially junction devices, the current band structure of HgTe CQDs ~ 10 nm particle size is still not well matched with materials, and the study of homojunction energy band structures still underdeveloped. The dark current cannot be effectively reduced, so the selection of complementary materials for the mid-infrared HgTe heterojunction will also be an important direction for future research.

Supplementary Materials

The following supporting information can be downloaded at: https://www.mdpi.com/article/10.3390/coatings12071033/s1, Figure S1: TEM images and histogram of as-prepared HgTe CQDs sampled under 113 °C at 1 min, 3 min, 5 min, 7 min, 10 min reaction time, Scale bar, 20 nm. Histogram of diameters for 100 particles; Figure S2: TEM images and histogram of as-prepared HgTe CQDs sampled under 115 °C at 1 min, 3 min, 5 min, 7 min, 10 min reaction time, Scale bar, 20 nm. Histogram of diameters for 100 particles; Figure S3: XPS overview for a thin film of I in situ passivated HgTe CQDs deposited on a Si/SiO2 substrate; Figure S4: EDX surface total spectrum of I in situ passivated HgTe CQDs film.

Author Contributions

Conceptualization, P.W.; methodology, Z.L.; formal analysis, Z.L.; investigation, R.D.; resources, W.G. and D.D.; data curation, J.L.; writing—original draft preparation, Z.L., H.Y. and Y.Z. All authors have read and agreed to the published version of the manuscript.

Funding

This work was financially supported by the National Natural Science Foundation of China (NSFC, Grant Nos. 61874137, 61922005, and U1930105) and the Natural Science Foundation of Beijing Municipality, China (Grant No. JQ20027).

Institutional Review Board Statement

Not applicable.

Informed Consent Statement

Not applicable.

Data Availability Statement

Not applicable.

Conflicts of Interest

The authors declare no conflict of interest.

References

  1. Mynbaev, K.D.; Ivanov-Omskiĭ, V.I. Doping of epitaxial layers and heterostructures based on HgCdTe. Semiconductors 2006, 40, 1–21. [Google Scholar] [CrossRef]
  2. Schneider, H.; Liu, H.C. Quantum Well Infrared Photodetectors: Physics and Applications; Springer: Berlin, Germany, 2006. [Google Scholar]
  3. Levine, B.F. Quantum-well infrared photodetectors. J. Appl. Phys. 1993, 74, R1–R81. [Google Scholar] [CrossRef]
  4. Mailhiot, C.; Smith, D.L. Long-wavelength infrared detectors based on strained InAs–Ga1xInxSb type-II superlattices. J. Vac. Sci. Technol. 1989, 7, 445–449. [Google Scholar] [CrossRef]
  5. Brown, G.J.; Szmulowicz, F.; Mahalingam, K.; Houston, S.; Wei, Y.; Gin, A.; Razeghi, M. Recent advances in InAs/GaSb superlattices for very long wavelength infrared detection. In Proceedings of the Quantum Sensing: Evolution and Revolution from Past to Future, San Jose, CA, USA, 27–30 January 2003; Volume 4999, pp. 457–466. [Google Scholar]
  6. Lhuillier, E.; Keuleyan, S.; Liu, H.; Guyot-Sionnest, P. Mid-IR colloidal nanocrystals. Chem. Mater. 2013, 25, 1272–1282. [Google Scholar] [CrossRef]
  7. Rogalski, A.; Antoszewski, J.; Faraone, L. Third-generation infrared photodetector arrays. J. Appl. Phys. 2009, 105, 4. [Google Scholar] [CrossRef] [Green Version]
  8. Sargent, E.H. Colloidal quantum dot solar cells. Nat. Photon. 2012, 6, 133–135. [Google Scholar] [CrossRef]
  9. Moreels, I.; Justo, Y.; De Geyter, B.; Haustraete, K.; Martins, J.C.; Hens, Z. Size-tunable, bright, and stable PbS quantum dots: A surface chemistry study. ACS Nano 2011, 5, 2004–2012. [Google Scholar] [CrossRef]
  10. Allan, G.; Delerue, C. Tight-binding calculations of the optical properties of HgTe nanocrystals. Phys. Rev. B 2012, 86, 165437. [Google Scholar] [CrossRef]
  11. Brown, P.R.; Kim, D.; Lunt, R.R.; Zhao, N.; Bawendi, M.G.; Grossman, J.C.; Bulovic, V. Energy level modification in lead sulfide quantum dot thin films through ligand exchange. ACS Nano 2014, 8, 5863–5872. [Google Scholar] [CrossRef]
  12. Green, M.; Mirzai, H. Synthetic routes to mercury chalcogenide quantum dots. J. Mater. Chem. C 2018, 6, 5097–5112. [Google Scholar] [CrossRef]
  13. Izquierdo, E.; Robin, A.; Keuleyan, S.; Lequeux, N.; Lhuillier, E.; Ithurria, S. Strongly confined HgTe 2D nanoplatelets as narrow near-infrared emitters. J. Am. Chem. Soc. 2016, 138, 10496–10501. [Google Scholar] [CrossRef] [PubMed] [Green Version]
  14. Allison, L.B.; Nathan, D.J. Growth mechanisms in nanocrystalline lead sulfide by stopped-flow kinetic analysis. J. Phys. Chem. C 2009, 113, 20246–20251. [Google Scholar]
  15. Rogach, A.L.; Harrison, M.T.; Kershaw, S.V.; Kornowski, A.; Burt, M.G.; Eychmüller, A.; Weller, H. Colloidally prepared CdHgTe and HgTe quantum dots with strong near-infrared luminescence. Phys. Status Solidi B 2001, 224, 153–158. [Google Scholar] [CrossRef]
  16. Yang, J.; Zhou, Y.; Zheng, S.; Liu, X.; Qiu, X.; Tang, Z.; Kim, J.W. Self-reorganization of CdTe nanoparticles into near-infrared Hg1−xCdxTe nanowire networks. Chem. Mater. 2009, 21, 3177–3182. [Google Scholar] [CrossRef]
  17. Wang, S.B.; Hu, B.; Liu, C.C.; Yu, S.H. Syringe pump-assisted synthesis of water-soluble cubic structure Ag2Se nanocrystals by a cation-exchange reaction. J. Colloid Interface Sci. 2008, 325, 351–355. [Google Scholar] [CrossRef]
  18. Murray, C.B.; Norris, D.J.; Bawendi, M.G. Synthesis and characterization of nearly monodisperse CdE (E = sulfur, selenium, tellurium) semiconductor nanocrystallites. J. Am. Chem. Soc. 1993, 115, 8706–8715. [Google Scholar] [CrossRef]
  19. Stephen, V.K.; Andrei, S.S.; Andrey, L.R. Narrow bandgap colloidal metal chalcogenide quantum dots: Synthetic methods, heterostructures, assemblies, electronic and infrared optical properties. Chem. Soc. Rev. 2013, 42, 3033–3087. [Google Scholar]
  20. Hunhee, L.; Donghun, K.; Min-Jae, C.; Edward, H.S.; Yeon, S.J.; Jin, Y.K. Suppressing interfacial dipoles to minimize open-circuit voltage loss in quantum dot photovoltaics. Adv. Energy Mater. 2019, 9, 1901938. [Google Scholar]
  21. Li, L.S.; Wang, H.; Liu, Y.; Lou, S.; Wang, Y.; Du, Z. Room temperature synthesis of HgTe nanocrystals. J. Colloid Interf. Sci. 2007, 308, 254–257. [Google Scholar] [CrossRef]
  22. Ackerman, M.M.; Tang, X.; Guyot-Sionnest, P. Fast and sensitive colloidal quantum dot mid-wave infrared photodetectors. ACS Nano 2018, 12, 7264–7271. [Google Scholar] [CrossRef]
  23. Guyot-Sionnest, P.; Roberts, J.A. Background limited mid-infrared photodetection with photovoltaic HgTe colloidal quantum dots. Appl. Phys. Lett. 2015, 107, 253104. [Google Scholar] [CrossRef]
  24. Tang, X.; Lai, K.W.C. Graphene/HgTe quantum-dot photodetectors with gate-tunable infrared response. ACS Appl. Nano Mater. 2019, 2, 6701–6706. [Google Scholar] [CrossRef]
  25. Kovalenko, M.V.; Kaufmann, E.; Pachinger, D.; Roither, J.; Huber, M.; Stangl, J.; Hesser, G.; Schäffler, F.; Heiss, W. Colloidal HgTe nanocrystals with widely tunable narrow band gap energies: From telecommunications to molecular vibrations. J. Am. Chem. Soc. 2006, 128, 3516–3517. [Google Scholar] [CrossRef] [PubMed]
  26. Keuleyan, S.; Lhuillier, E.; Guyot-Sionnest, P. Synthesis of colloidal HgTe quantum dots for narrow mid-IR emission and detection. J. Am. Chem. Soc. 2011, 133, 16422–16424. [Google Scholar] [CrossRef]
  27. Keuleyan, S.E.; Guyot-Sionnest, P.; Delerue, C.; Allan, G. Mercury telluride colloidal quantum dots: Electronic structure, size-dependent spectra, and photocurrent detection up to 12 μm. ACS Nano 2014, 8, 8676–8682. [Google Scholar] [CrossRef]
  28. Green, M. The nature of quantum dot capping ligands. J. Mater. Chem. 2010, 20, 5797–5809. [Google Scholar] [CrossRef]
  29. Ip, A.H.; Thon, S.M.; Hoogland, S.; Voznyy, O.; Zhitomirsky, D.; Debnath, R.; Sargent, E.H. Hybrid passivated colloidal quantum dot solids. Nat. Nanotechnol. 2012, 7, 577–582. [Google Scholar] [CrossRef]
  30. Wang, R.; Shang, Y.; Kanjanaboos, P.; Zhou, W.; Ning, Z.; Sargent, E.H. Colloidal quantum dot ligand engineering for high performance solar cells. Energy Environ. Sci. 2016, 9, 1130–1143. [Google Scholar] [CrossRef]
  31. Ning, Z.; Voznyy, O.; Pan, J.; Hoogland, S.; Adinolfi, V.; Xu, J.; Sargent, E.H. Air-stable n-type colloidal quantum dot solids. Nat. Mater. 2014, 13, 822–828. [Google Scholar] [CrossRef]
  32. Gong, W.; Wang, P.; Deng, W.; Zhang, X.; An, B.; Li, J.; Sun, Z.; Dai, D.; Liu, Z.; Li, J.; et al. Limiting factors of detectivity in near-infrared colloidal quantum dot photodetectors. ACS Appl. Mater. Interfaces 2022, 14, 25812–25823. [Google Scholar] [CrossRef]
  33. Zhang, J.; Gao, J.; Miller, E.M.; Luther, J.M.; Beard, M.C. Diffusion-controlled synthesis of PbS and PbSe quantum dots with in situ halide passivation for quantum dot solar cells. ACS Nano 2014, 8, 614–622. [Google Scholar] [CrossRef] [PubMed]
  34. Wang, Y.; Liu, Z.; Huo, N.; Li, F.; Gu, M.; Ling, X.; Ma, W. Room-temperature direct synthesis of semi-conductive PbS nanocrystal inks for optoelectronic applications. Nat. Commun. 2019, 10, 5136. [Google Scholar] [CrossRef] [PubMed] [Green Version]
  35. Pearson, R.G. Hard and soft acids and bases. J. Am. Chem. Soc. 1963, 85, 3533–3539. [Google Scholar] [CrossRef]
  36. Shen, G.; Chen, M.; Guyot-Sionnest, P. Synthesis of nonaggregating HgTe colloidal quantum dots and the emergence of air-stable n-doping. J. Phys. Chem. Lett. 2017, 8, 2224–2228. [Google Scholar] [CrossRef]
  37. Hay, P.J.; Wadt, W.R.; Kahn, L.R.; Bobrowicz, F.W. A binitio studies of AuH, AuCl, HgH and HgCl2 using relativistic effective core potentials. J. Chem. Phys. 1978, 69, 984–997. [Google Scholar] [CrossRef]
  38. Kim, T.K.; Lorenc, M.; Lee, J.H.; Russo, M.L.; Kim, J.; Cammarata, M.; Ihee, H. Spatiotemporal reaction kinetics of an ultrafast photoreaction pathway visualized by time-resolved liquid X-ray diffraction. Proc. Natl. Acad. Sci. USA 2006, 103, 9410–9415. [Google Scholar] [CrossRef] [Green Version]
  39. Zhou, S.Q.; Ni, R. Measurement of the specific heat capacity of water-based Al2O3 nanofluid. Appl. Phys. Lett. 2008, 92, 093123. [Google Scholar] [CrossRef]
  40. Wang, B.X.; Zhou, L.P.; Peng, X.F. Surface and size effects on the specific heat capacity of nanoparticles. Int. J. Thermophys. 2006, 27, 139–151. [Google Scholar] [CrossRef]
  41. Yu, W.W.; Peng, X. Formation of high-quality CdS and other II–VI semiconductor nanocrystals in noncoordinating solvents: Tunable reactivity of monomers. Angew. Chem. Int. Edit. 2002, 41, 2368–2371. [Google Scholar] [CrossRef]
  42. Wang, S.; McGuirk, C.M.; d’Aquino, A.; Mason, J.; Mirkin, C. Metal–organic framework nanoparticles. Adv. Mater. 2018, 30, 1800202. [Google Scholar] [CrossRef]
  43. Voorhees, P.W. The theory of Ostwald ripening. J Stat. Phys. 1985, 38, 231–252. [Google Scholar] [CrossRef] [Green Version]
  44. Goubet, N.; Jagtap, A.; Livache, C.; Martinez, B.; Portalès, H.; Xu, X.; Lobo, R.; Dubertret, B.; Lhuillier, E. Terahertz HgTe nanocrystals: Beyond confinement. J. Am. Chem. Soc. 2018, 140, 5033–5036. [Google Scholar] [CrossRef] [PubMed] [Green Version]
  45. Whitehead, C.B.; OÖZkar, S.; Finke, R.G. LaMer’s 1950 model for particle formation of instantaneous nucleation and diffusion-controlled growth: A historical look at the model’s origins, assumptions, equations, and underlying sulfur sol formation kinetics data. Chem. Mater. 2019, 31, 7116–7132. [Google Scholar] [CrossRef]
  46. Chu, J. HgTe: Lattice parameter. Landolt Börnstein 2009, 44, 206. [Google Scholar]
  47. Inoue, M.; Hirasawa, I. The relationship between crystal morphology and XRD peak intensity on CaSO4·2H2O. J. Cryst. Growth. 2013, 380, 169–175. [Google Scholar] [CrossRef] [Green Version]
  48. Mengyu, C.; Haipeng, L.; Nema, M.A.; Ye, Z.; Zhen, W.; Wei, R.; Stephen, V.K.; Andrey, L.R.; Ni, Z. Mercury telluride quantum dot based phototransistor enabling high-sensitivity room-temperature photodetection at 2000 nm. ACS Nano 2017, 11, 5614–5622. [Google Scholar]
  49. Chao, X.; Feng, Y. Enhanced performance of perovskite/organic-semiconductor hybrid heterojunction photodetectors with electron trapping effect. J. Mater. Chem. C 2018, 6, 1338–1342. [Google Scholar]
  50. Dolatyari, M.; Rostami, A.; Mathur, S.; Klein, A. Trap engineering in solution processed PbSe quantum dots for highspeed MID-infrared photodetectors. J. Mater. Chem. C 2019, 7, 5658–5669. [Google Scholar] [CrossRef]
  51. Loef, R.; Houtepen, A.J.; Talgorn, E.; Schoonman, J.; Goossens, A. Temperature dependence of electron transport in CdSe quantum dot films. J. Phys. Chem. C 2009, 113, 15992–15996. [Google Scholar] [CrossRef]
  52. Ju, T.; Graham, R.L.; Zhai, G.; Rodriguez, Y.W.; Breeze, A.J.; Yang, L.; Carter, S.A. High efficiency mesoporous titanium oxide PbS quantum dot solar cells at low temperature. Appl. Phys. Lett. 2010, 97, 043106. [Google Scholar] [CrossRef]
  53. Mitin, V.; Reggiani, L.; Varani, L. Generation-recombination noise in semiconductors. In Noise and Fluctuations Control in Electronic Devices; American Scientific Publishers: Stevenson Ranch, CA, USA, 2002; pp. 11–30. [Google Scholar]
  54. Keuleyan, S.; Lhuillier, E.; Brajuskovic, V.; Guyot-Sionnest, P. Mid-infrared HgTe colloidal quantum dot photodetectors. Nat. Photon. 2011, 5, 489–493. [Google Scholar] [CrossRef]
  55. Chen, M.; Lan, X.; Tang, X.; Wang, Y.; Hudson, M.H.; Talapin, D.; Guyot-Sionnest, P. High carrier mobility in HgTe quantum dot solids improves mid-IR photodetectors. ACS Photon. 2019, 6, 2358–2365. [Google Scholar] [CrossRef]
  56. Martinez, B.; Rmade, J.; Livache, C.; Goubet, N.; Chu, A.; Gréboval, C.; Qu, J.; Watkins, W.L.; Becerra, L.; Dandeu, E.; et al. HgTe nanocrystal inks for extended short-wave infrared detection. Adv. Optical Mater. 2019, 7, 1900348. [Google Scholar] [CrossRef]
Figure 1. TEM images of the injection temperature at 110 °C (a), 120 °C (b), and 130 °C (c) for 10 min, respectively. Scale bar, 30 nm; TEM images of as-prepared HgTe CQDs sampled under 120 °C at 1 min (d), 3 min (e), 5 min (f), 7 min (g), 10 min (h) growth time, scale bar, 20 nm; (i) Histogram of diameters for 100 particles.
Coatings 12 01033 g001
Figure 2. When the injection temperature is 120 °C (a) and 130 °C (b), the relationship between particle size and growth time at different growth temperatures; when the injection temperature is 120 °C (c) and 130 °C (d), the relationship between FWHM and growth time at different growth temperatures.
Coatings 12 01033 g002
Figure 3. Absorption spectra of 11 nm (a), 15 nm (b) HgTe CQDs; (c) HRTEM image of HgTe CQDs; (d) XRD spectrum with labeled bulk HgTe diffraction angles.
Coatings 12 01033 g003
Figure 4. Hg 4f (a), Te 3d (b), I 3d (c) XPS spectra of HgTe CQDs; EDX spectrum of HgTe CQDs, (d) electron image, (e) Hg element distribution map, (f) I element distribution map.
Coatings 12 01033 g004
Figure 5. Flow chart of device fabrication.
Coatings 12 01033 g005
Figure 6. (a) Schematic diagram of the structure of the HgTe CQDs photoconductive device; I–t diagrams of the devices at 300 K (b), 230 K (c), 180 K (d), 130 K (e), and 80 K (f) under 2000 nm illumination, respectively.
Coatings 12 01033 g006
Figure 7. (a) The relationship between photocurrent and temperature of the device at 2000 nm; (b) spectra of noise current density with different operating temperature.
Coatings 12 01033 g007
Table 1. XPS results of different HgTe CQDs films.
HgTe CQDPeakBinding Energy (eV)Atomic Concentration (%)Hg:Te Atomic RatioI:Hg Atomic Ratio
11 nmHg 4f99.2246.81.110.23
Te 3d57242.3
I 3d618.3610.9
15 nmHg 4f99.6847.21.080.17
Te 3d572.1744.9
I 3d618.227.9
Table 2. Spectra of noise current density of HgTe CQD photodetectors.
Modeλcutoff (μm)Operating Temperature (K)Frequency (Hz)Noise Current Density (A·Hz1/2)Ref.
Photoconductor4.5270 K10~7 × 10⁹[54]
4298 K10~1010[55]
5280 K10~1011This work
Phototransistor2.5298 K10~1011[48]
2.5Room temperature10~4 × 10¹²[56]
Publisher’s Note: MDPI stays neutral with regard to jurisdictional claims in published maps and institutional affiliations.

