
Detection of Biofilm Formation on Material Surfaces by Ag+ Coating

 ,
,  , , ,
, , ,
Abstract
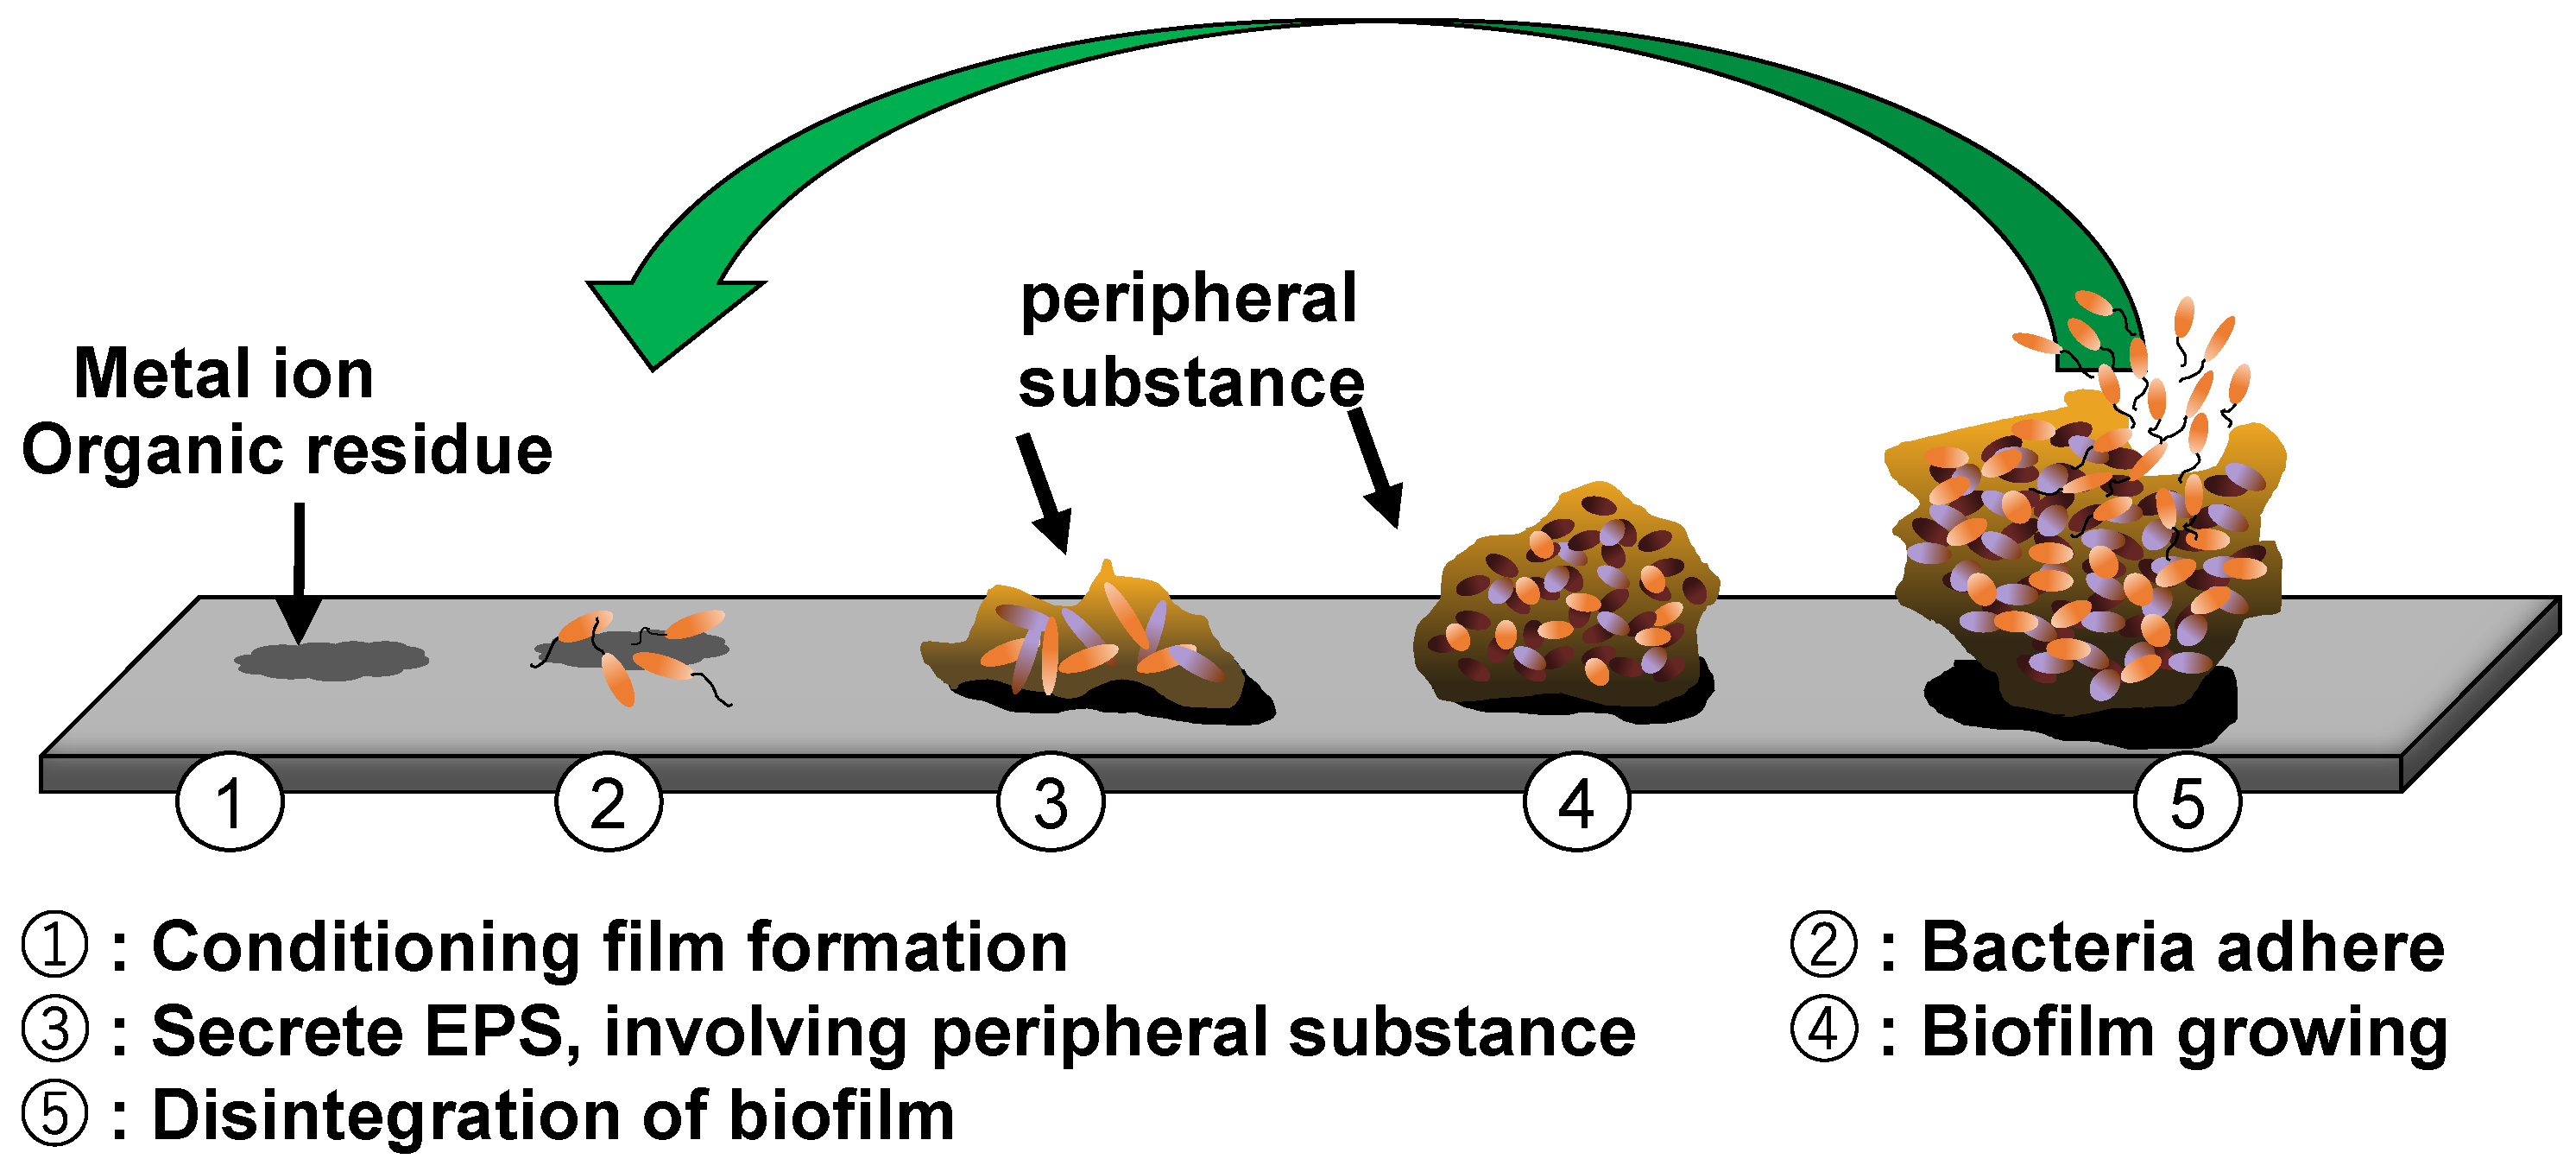
:1. Introduction
2. Materials and Methods
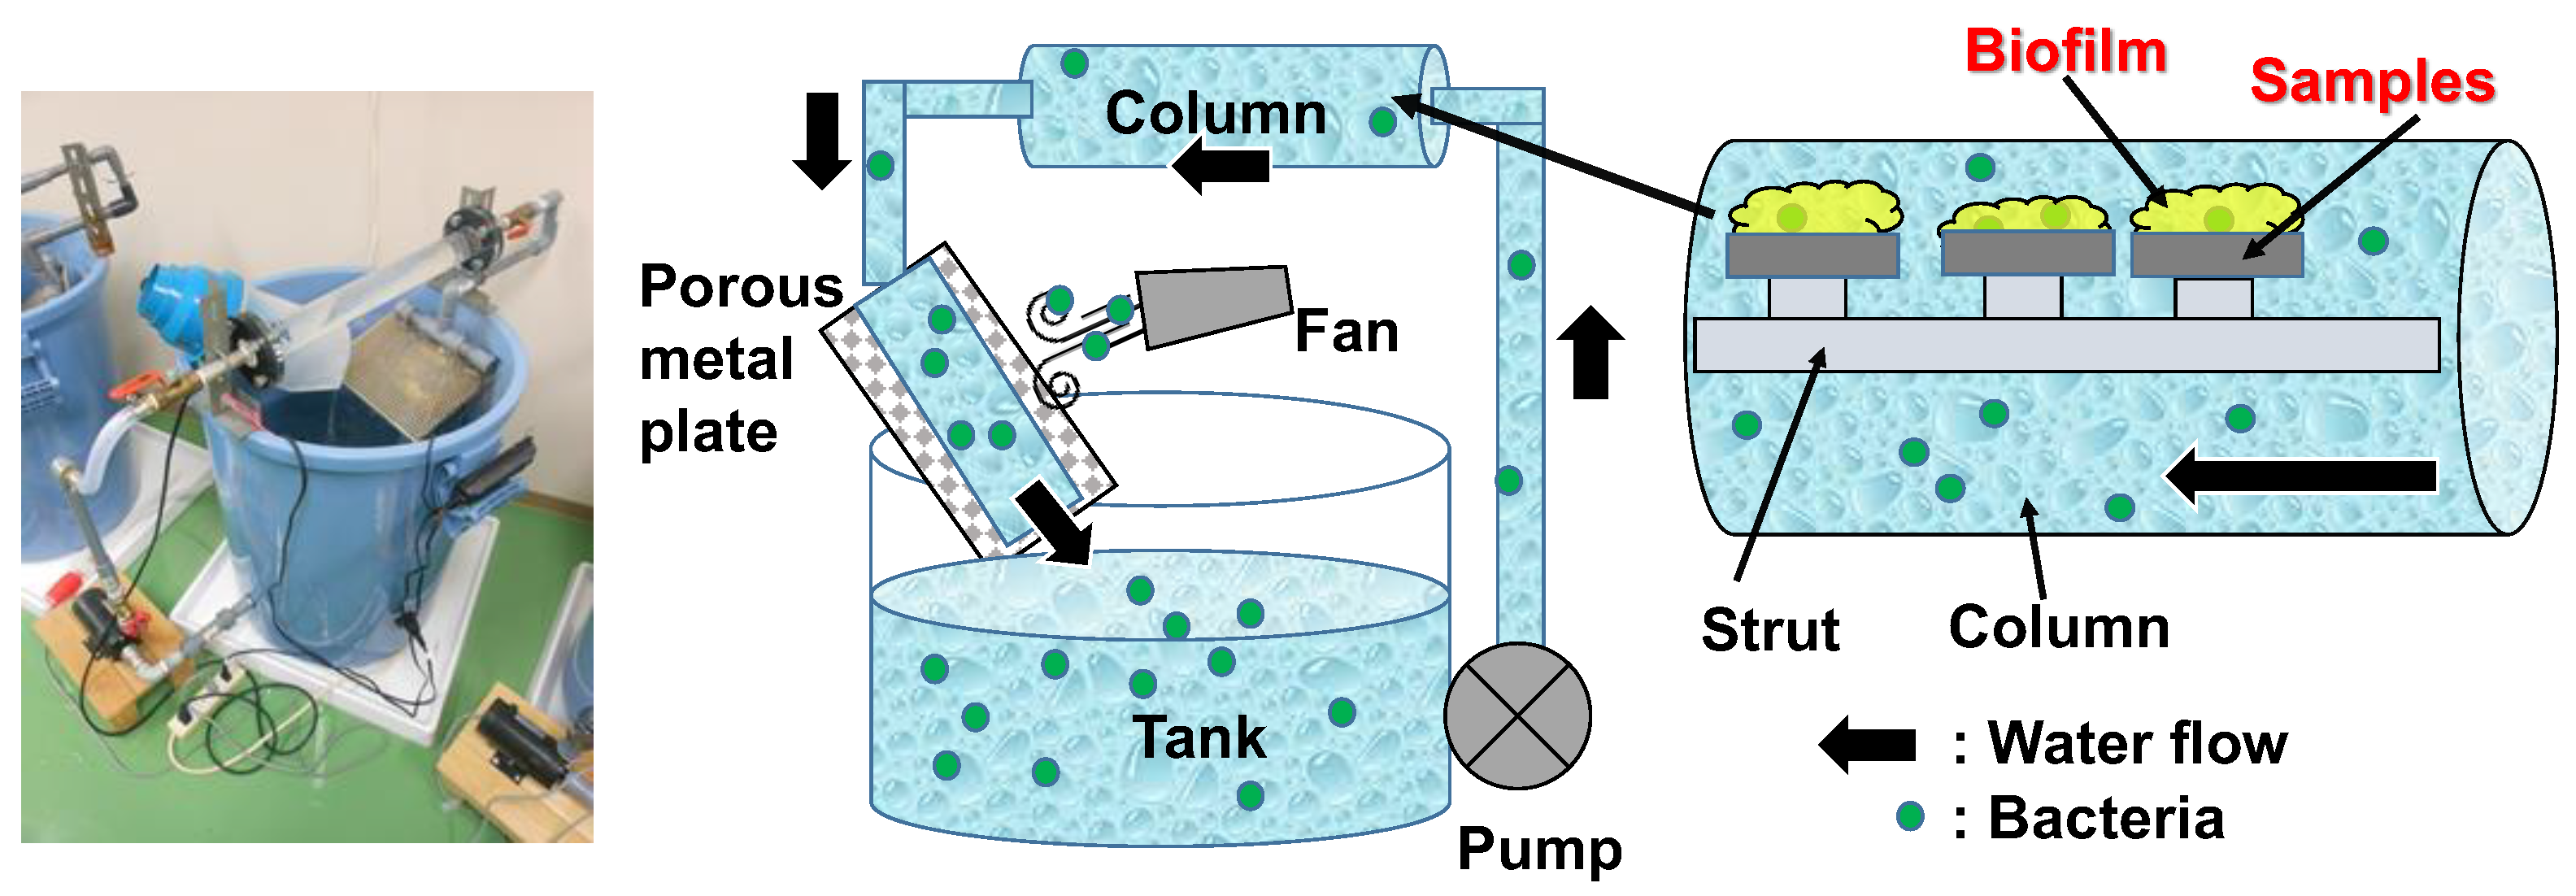
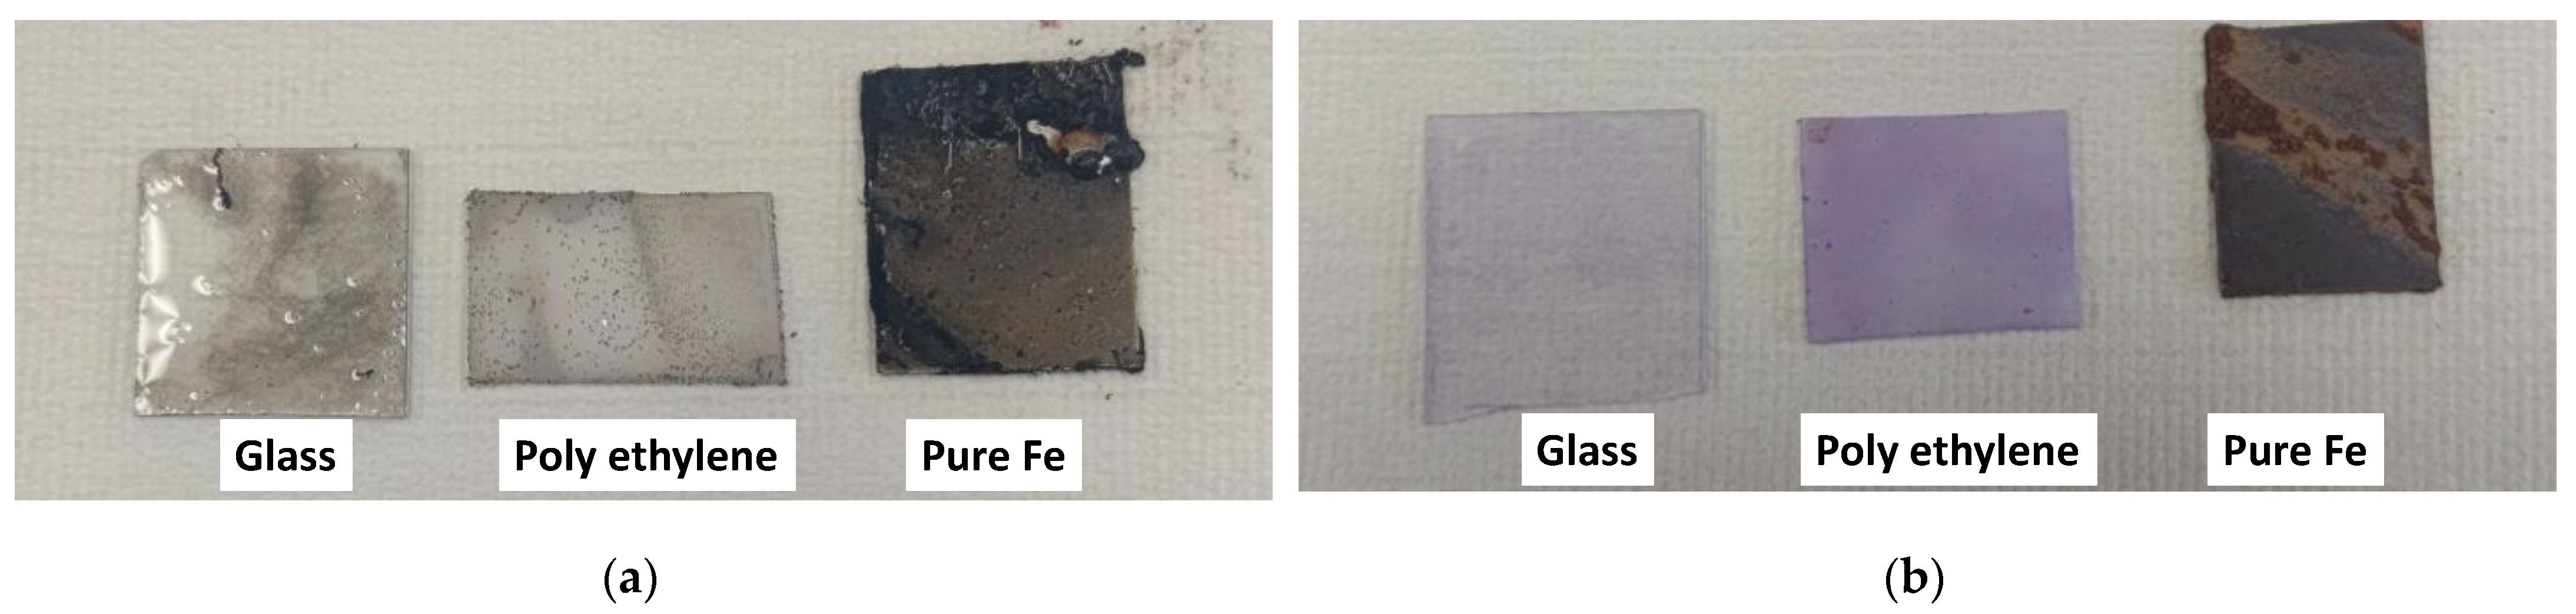
2.1. Biofilm Formation Experiment
2.2. Evaluation of Biofilm Formation
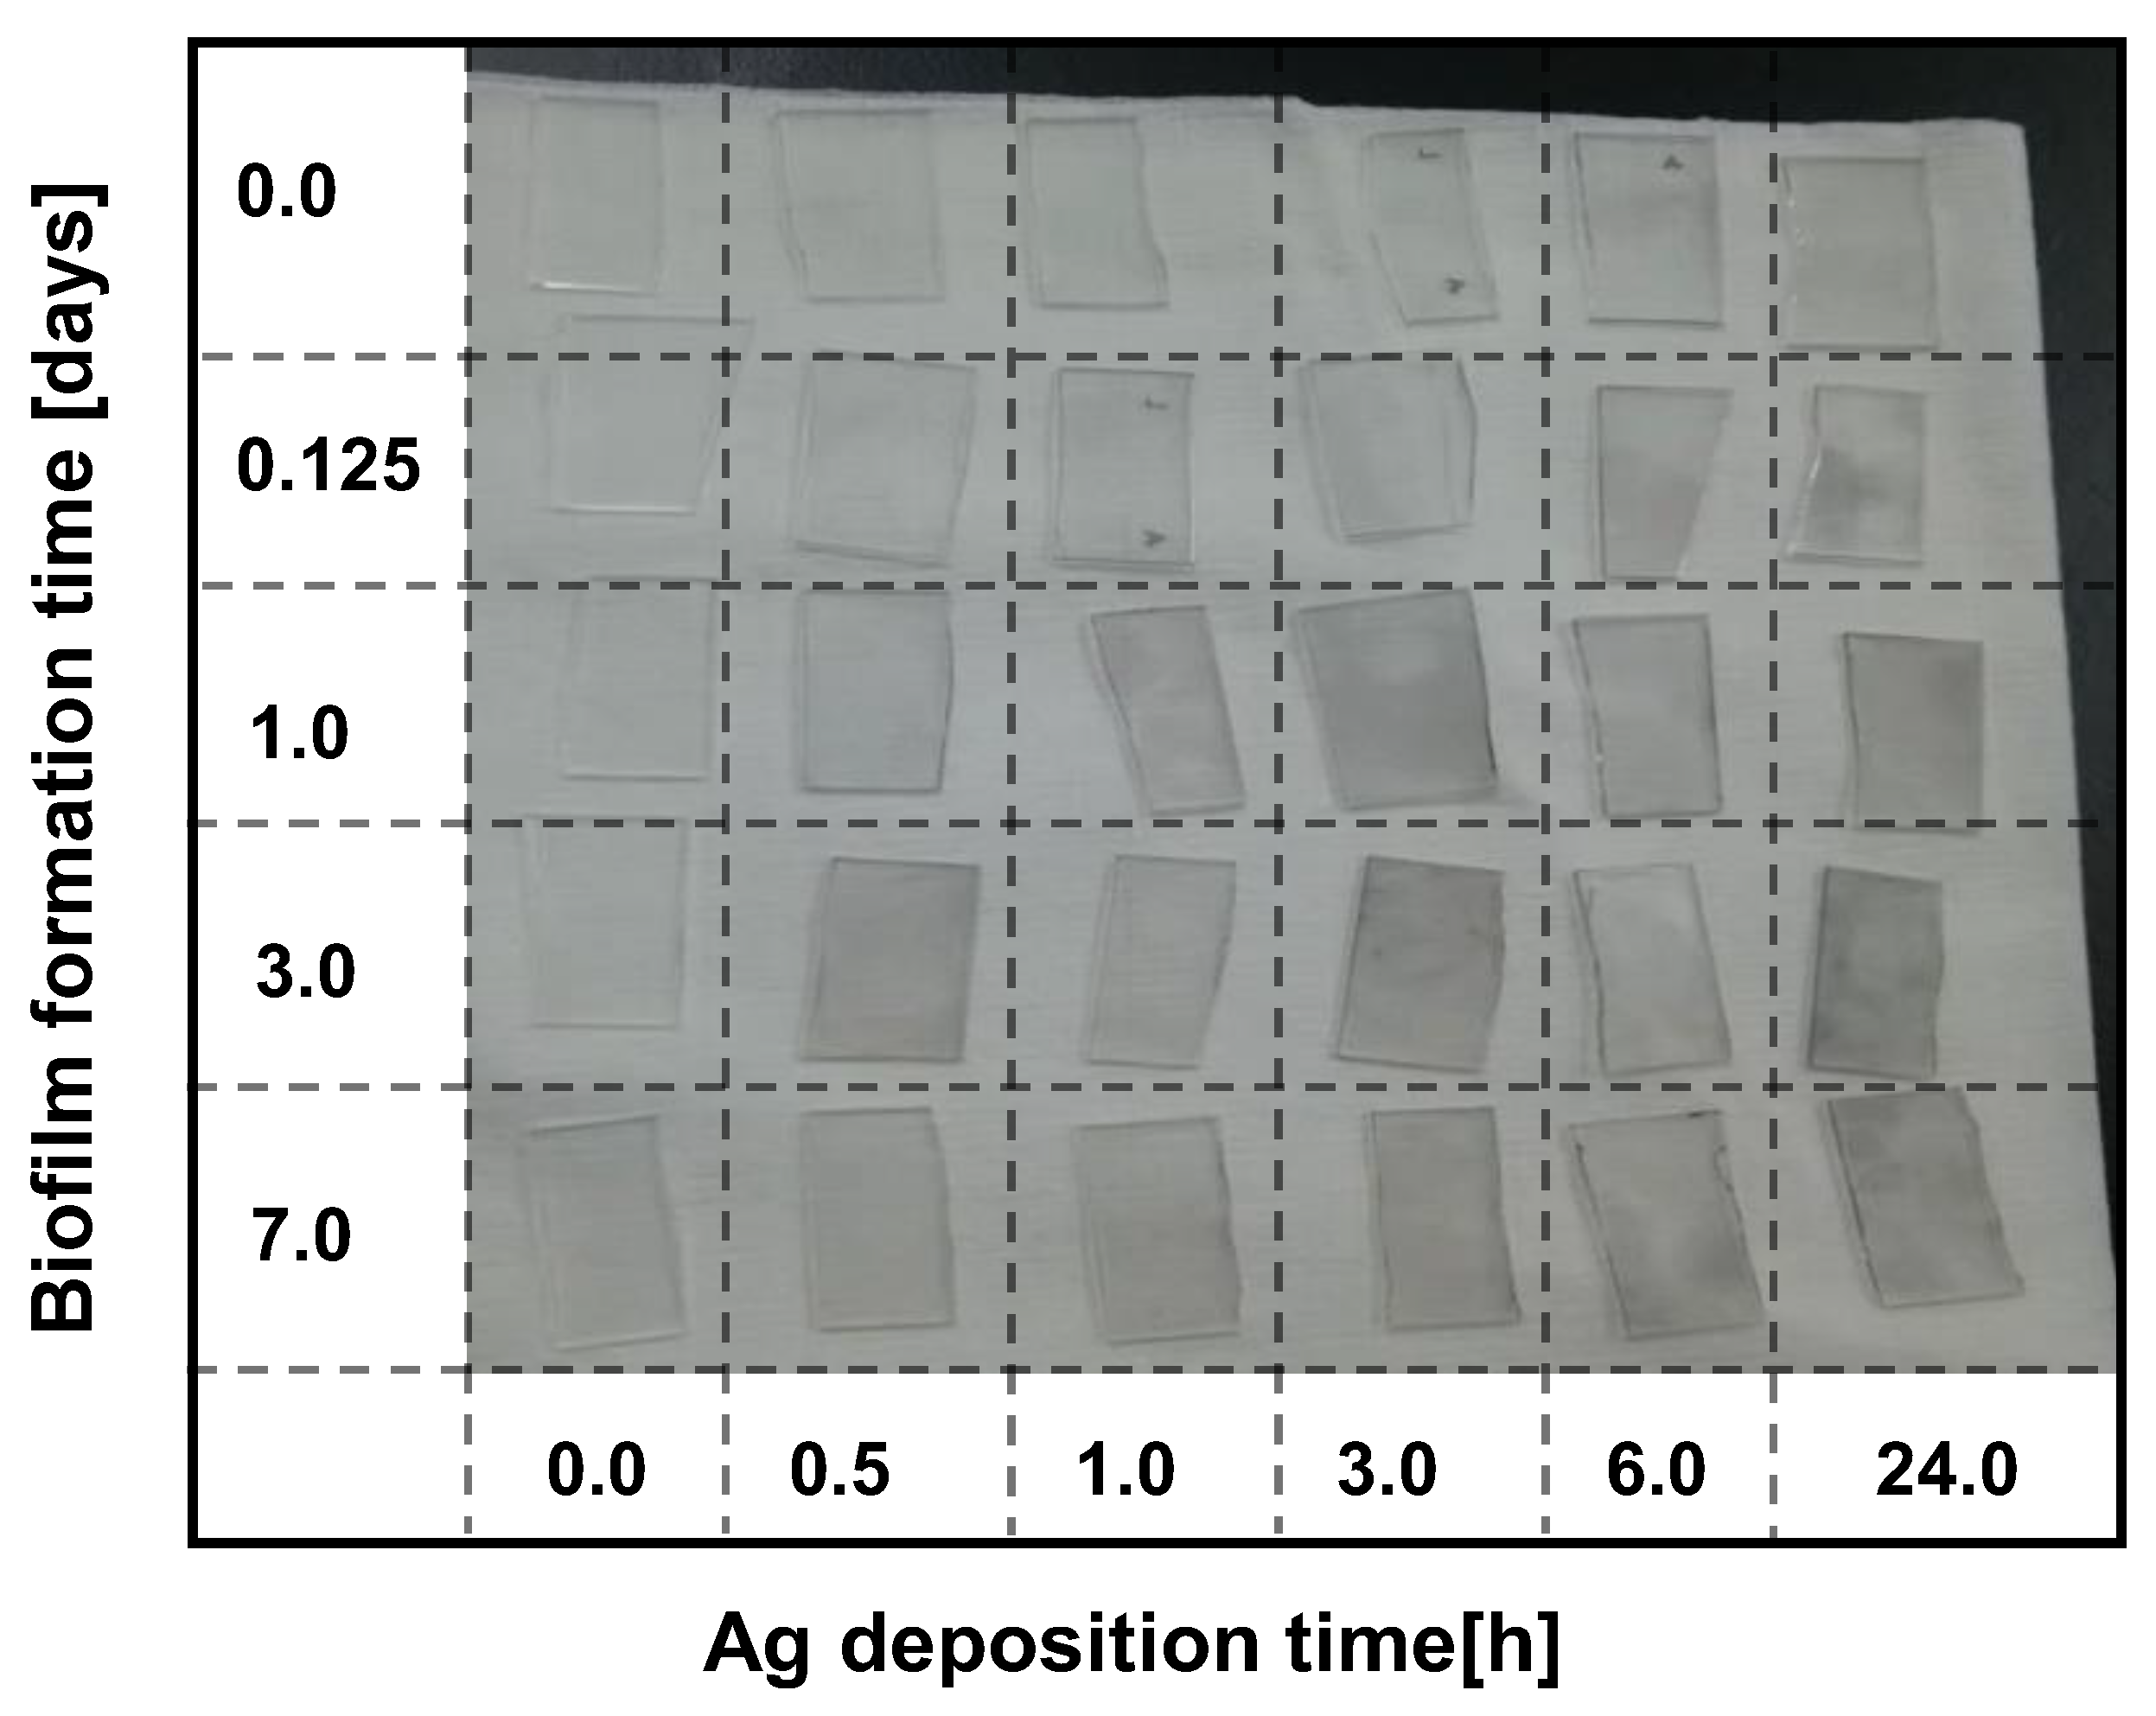
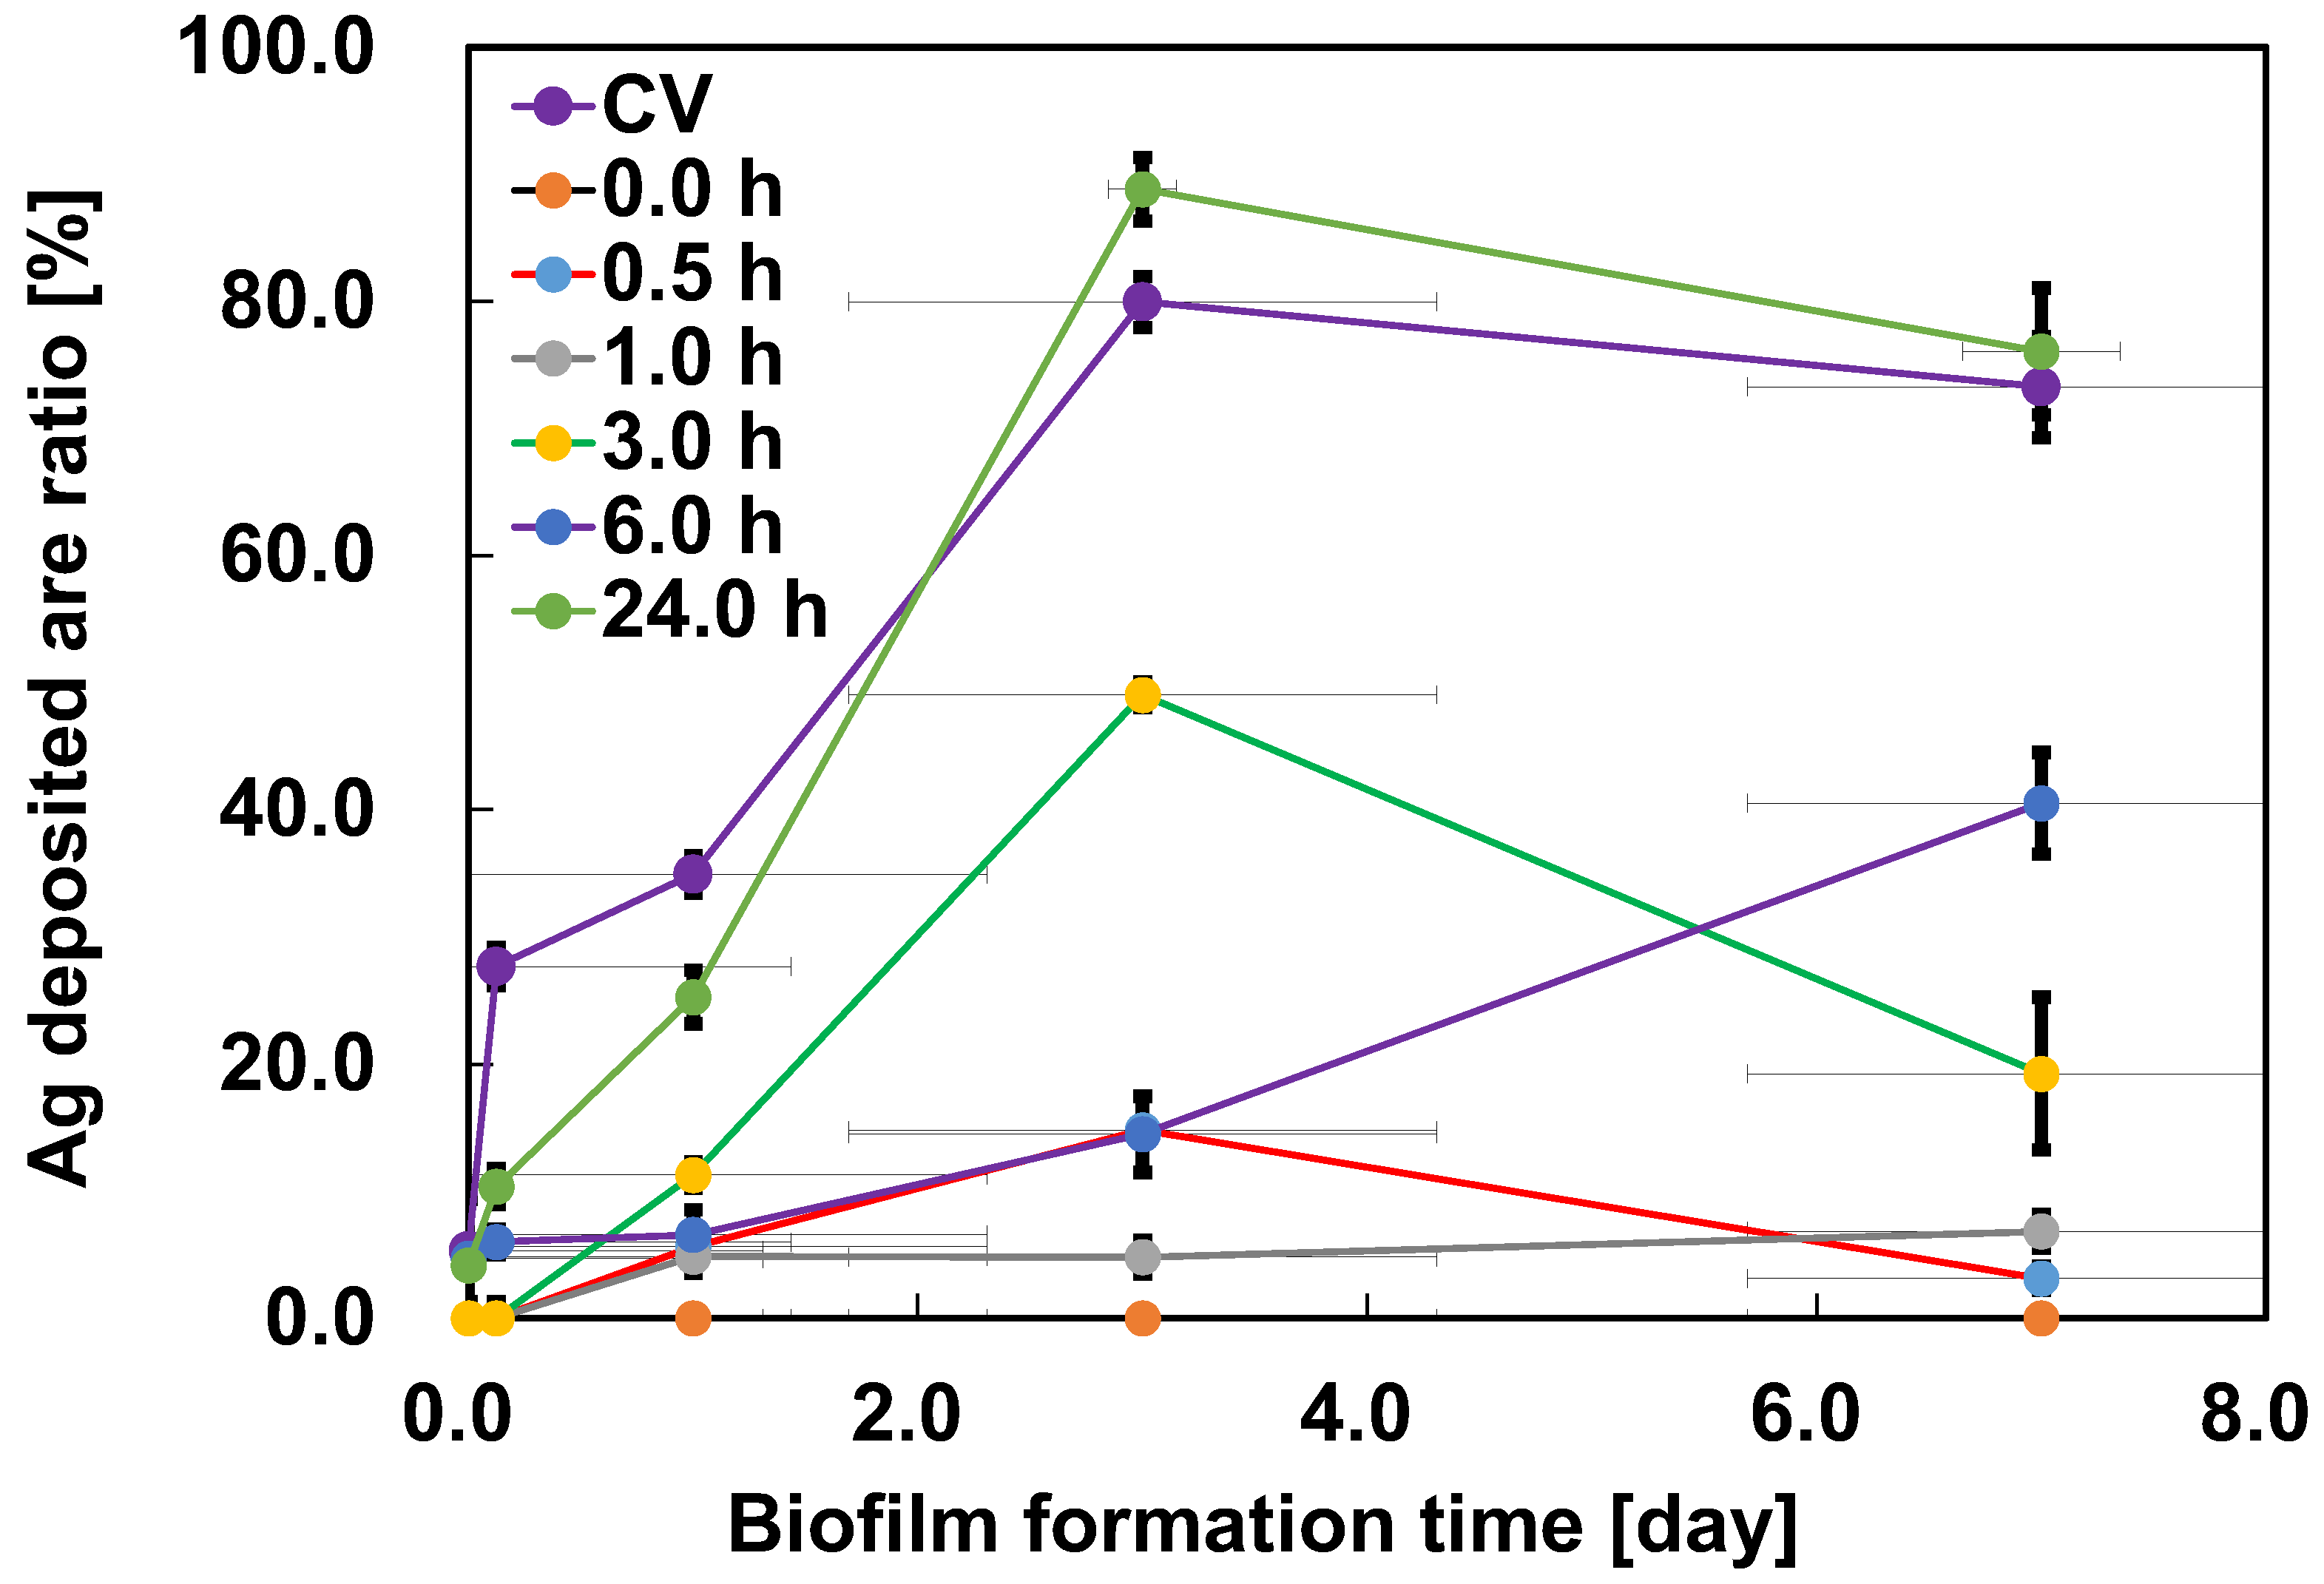
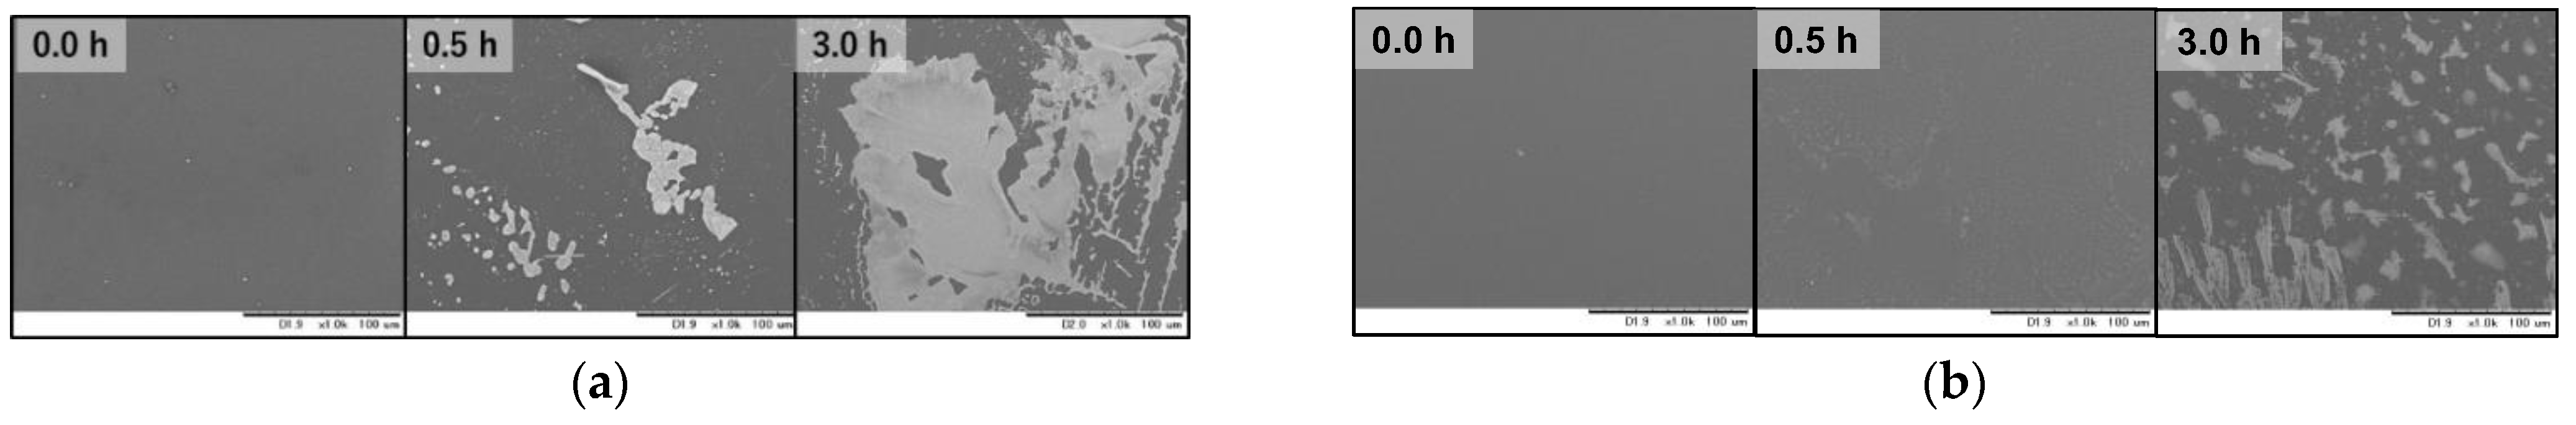
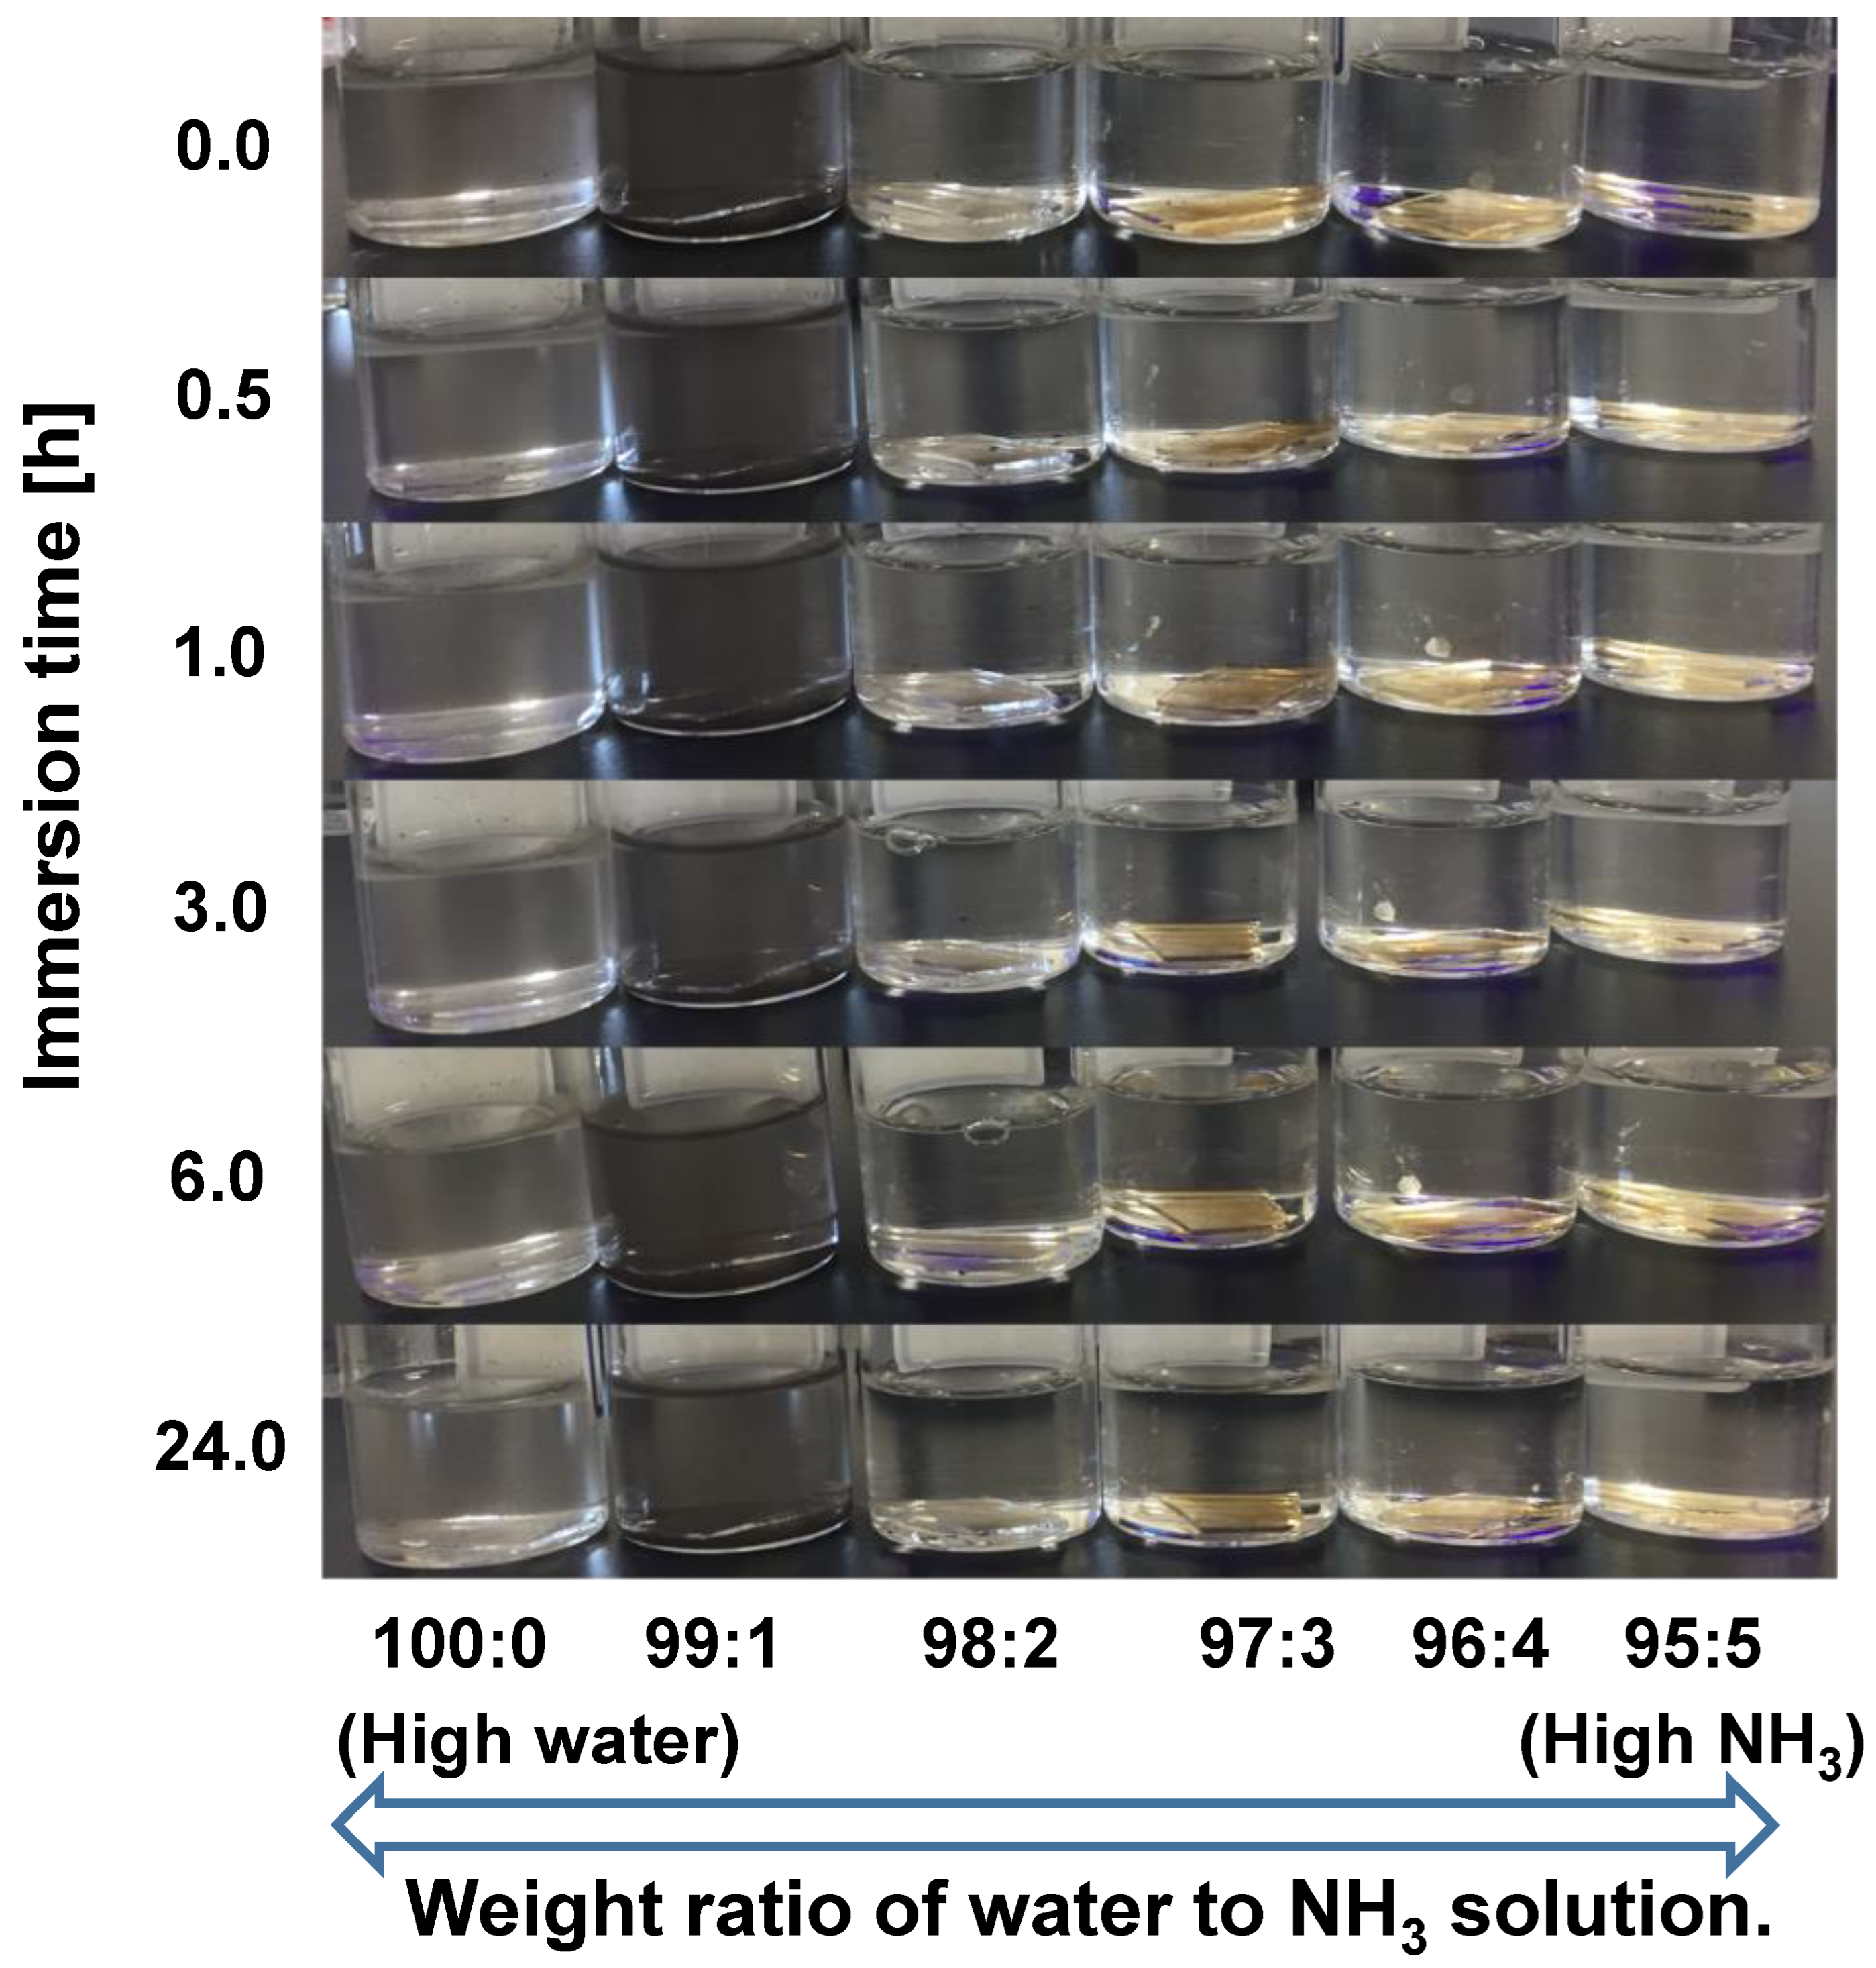
3. Results and Discussion
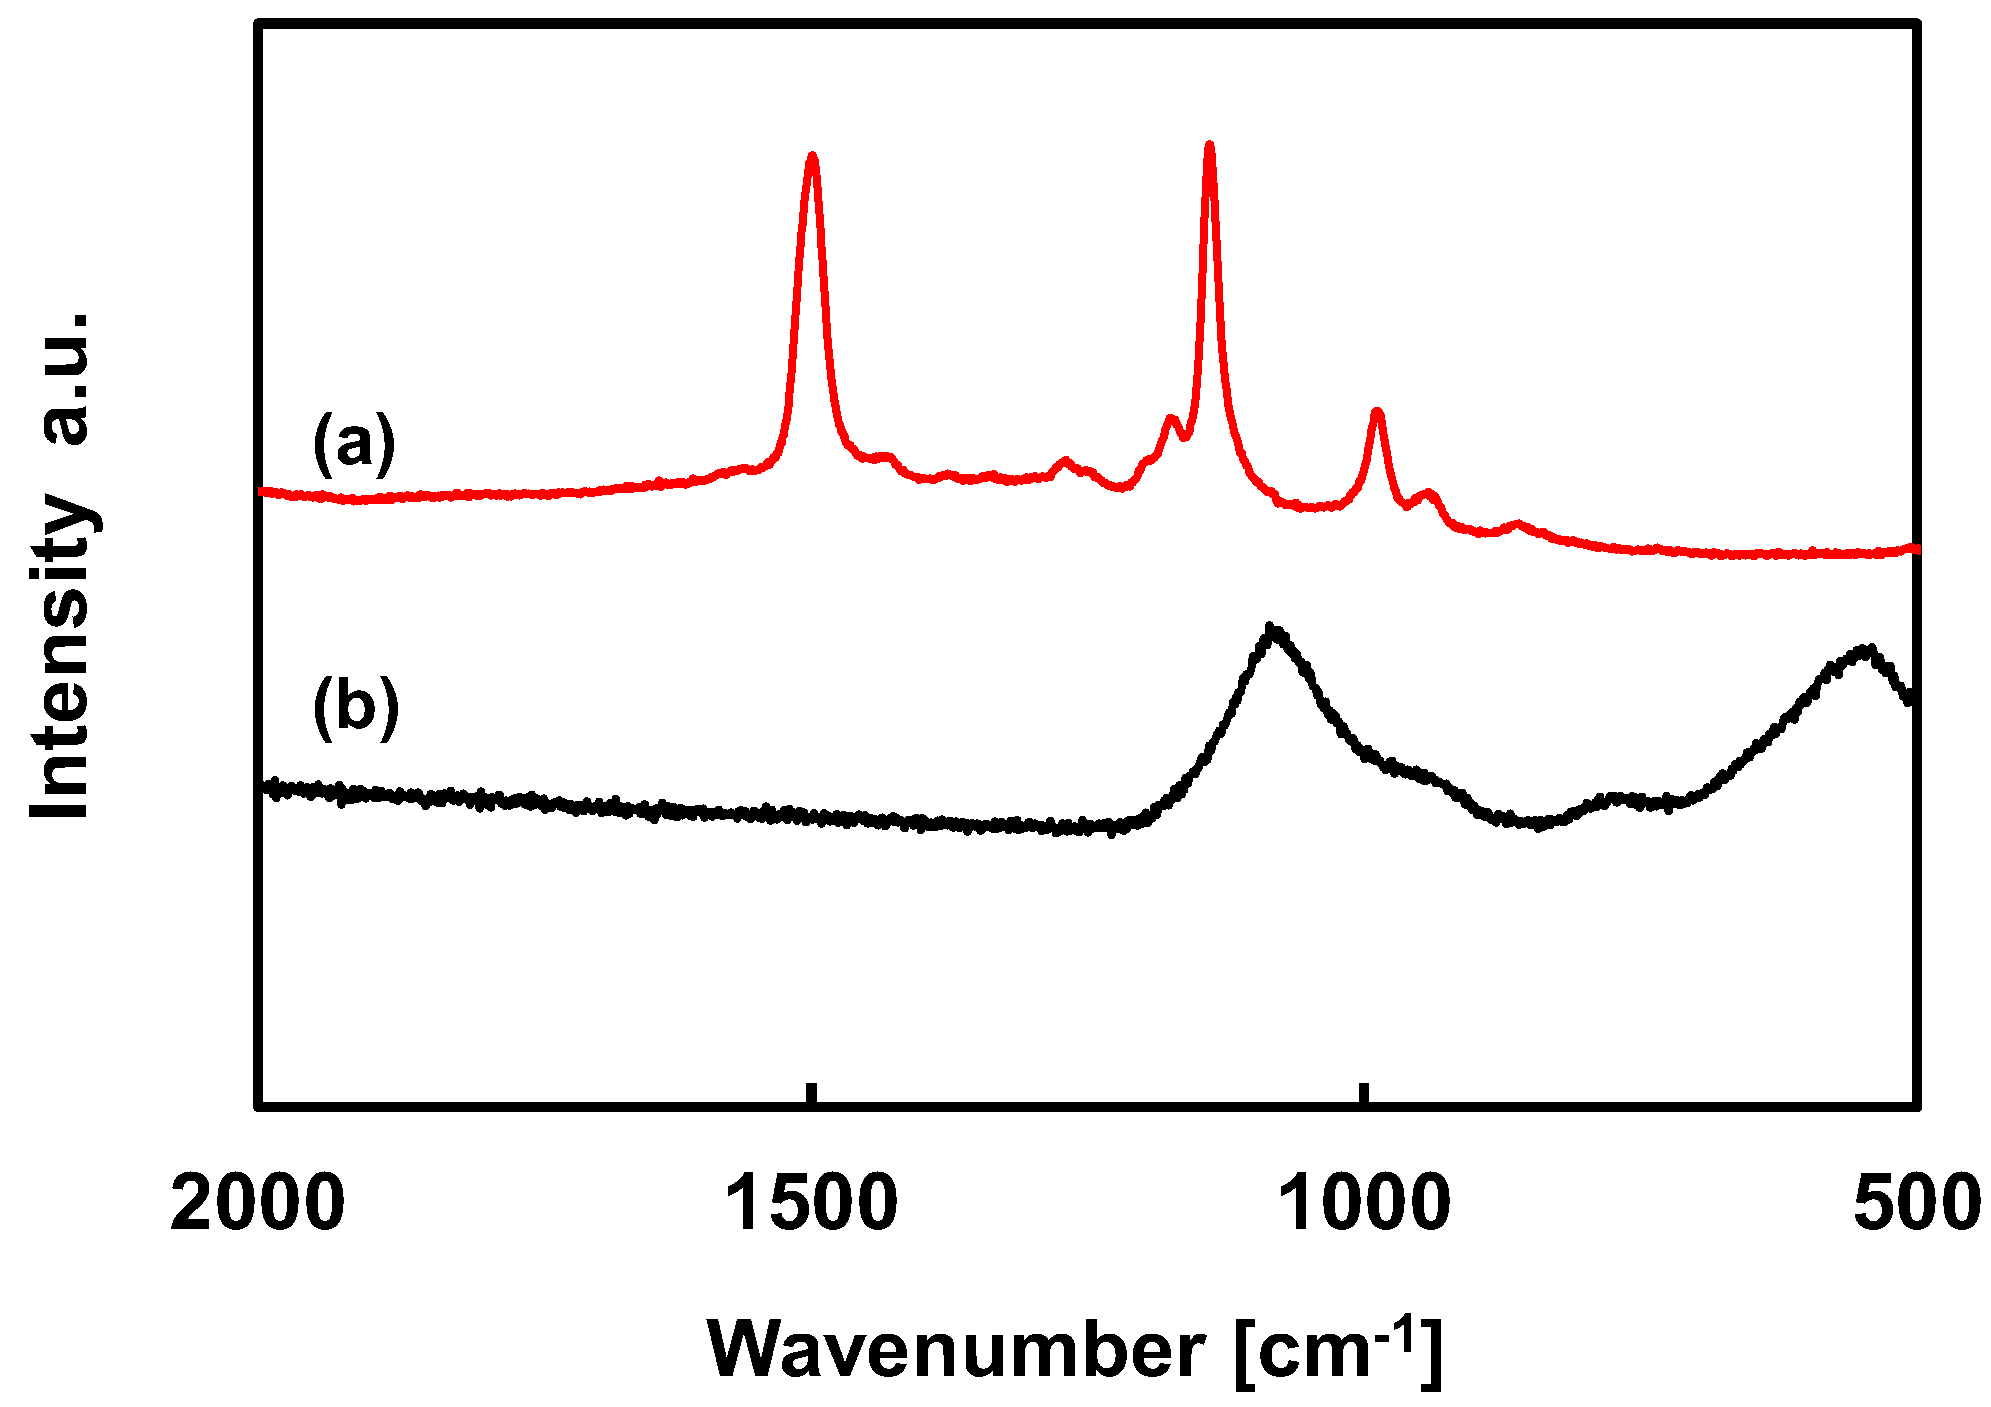
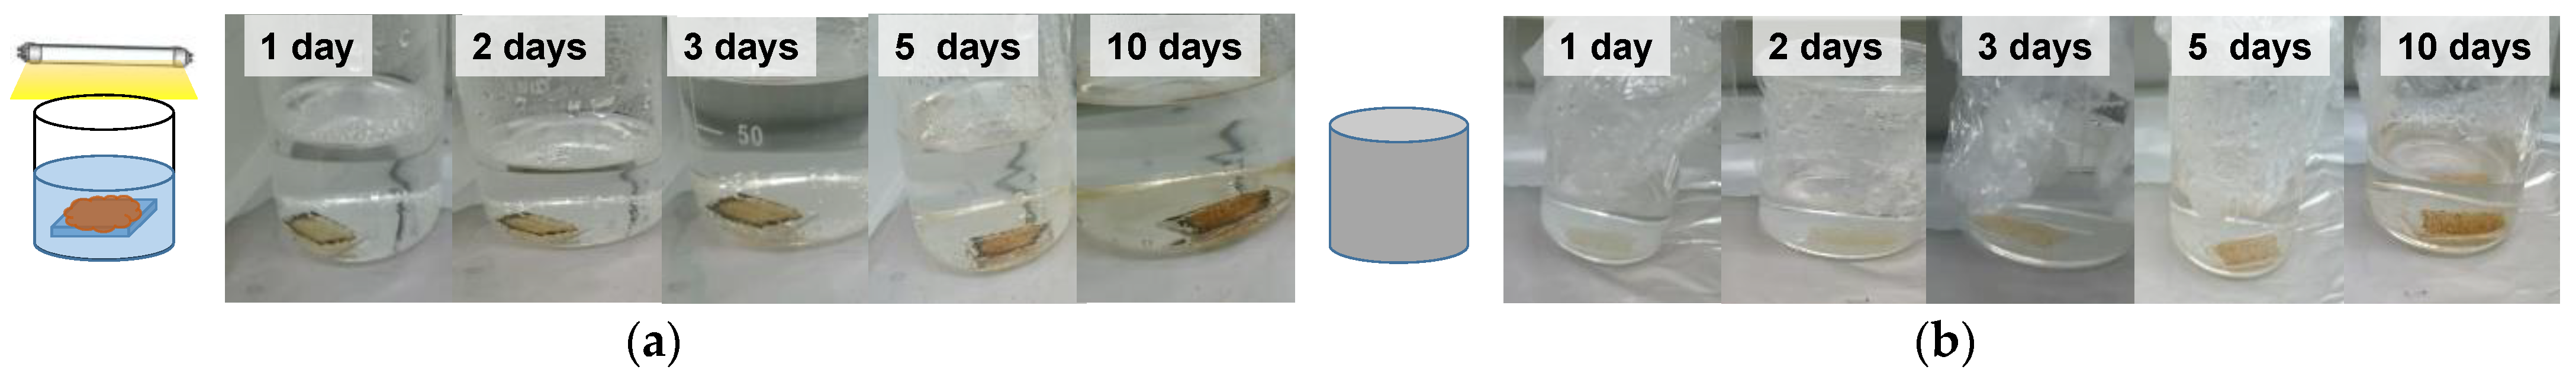
3.1. Investigation of the Ag Deposited by the Effect of Light Irradiation
3.2. Validation of Ag+ Reduction Reaction Method for Quantitative Evaluation of Biofilm
3.3. Approaches to Suppress ion Exchange Effects
4. Conclusions
Author Contributions
Funding
Institutional Review Board Statement
Informed Consent Statement
Data Availability Statement
Conflicts of Interest
References
- Costerton, J.W.; Lewandowski, Z.; Caldwell, D.E.; Korber, D.R.; Lappin-Scott, H.M. Microbial biofilms. Annu. Rev. Microbiol. 1995, 49, 711–745. [Google Scholar] [CrossRef]
- Costerton, J.W.; Stewart, P.S.; Greenberg, E.P. Bacterial Biofilms: A Common Cause of Persistent Infections. Science 1999, 284, 1318–1322. [Google Scholar] [CrossRef] [Green Version]
- Characklis, W.G. Biofilm processes. In Biofilms; Characklis, W.G., Marshall, K.C., Eds.; John Wiley & Sons: New York, NY, USA, 1990; pp. 195–231. [Google Scholar]
- Kougo, T.; Yamamoto, Y.; Naiki, A.; Ogino, Y.; Kanzaki, T.; Kanematsu, H.; Ikigai, H.; Itoh, H. Proposal for evaluation to Biofilm formation on Metal Oxide in atmospheric exposure type circulation water system. KOSEN KIYO NIT SUZUKA College 2013, 44, 81–83. [Google Scholar]
- Flemming, H.C. Biofouling in water systems-cases, causes, and countermeasures. Appl. Microbiol. Biotechnol. 2002, 59, 629–640. [Google Scholar] [CrossRef]
- Ofek, I.; Doyle, R.J. Bacterial Adhesion to Cells and Tissues; Chapman & Hall: New York, NY, USA, 1994. [Google Scholar]
- Lorite, G.S.; Rodrigues, C.M.; de Souza, A.A.; Kranz, C.; Mizaikoff, B.; Cotta, M.A. The role of conditioning film formation and surface chemical changes on Xylella fastidiosa adhesion and biofilm evolution. J. Colloid Interface Sci. 2011, 359, 289–295. [Google Scholar] [CrossRef] [Green Version]
- Larimer, C.; Winder, E.; Jeters, R.; Prowant, M.; Nettleship, I.; Addleman, R.S.; Bonheyo, G.T. A method for rapid quantitative assessment of biofilms with biomolecular staining and image analysis. Anal. Bioanal. Chem. 2015, 408, 999–1008. [Google Scholar] [CrossRef]
- Birjiniuk, A.; Billings, N.; Nance, E.; Hanes, J.; Ribbeck, K.; Doyle, R.S. Single particle tracking reveals spatial and dynamic organization of the Escherichia coli biofilm matrix. New J. Phys. 2014, 17, 030401. [Google Scholar]
- Vyas, N.; Sammons, R.; Addison, O.; Dehghani, H.; Walmsley, A.D. A quantitative method to measure biofilm removal efficiency from complex biomaterial surfaces using SEM and image analysis. Sci. Rep. 2016, 6, 32694. [Google Scholar] [CrossRef] [Green Version]
- Lee, A.; Park, S.; Yoo, J.; Kang, J.; Lim, J.; Seo, Y.; Kim, B.; Kim, G. Detecting Bacterial Biofilms Using Fluorescence Hyperspectral Imaging and Various Discriminant Analyses. Sensors 2021, 21, 2213. [Google Scholar] [CrossRef]
- Funari, R.; Shen, Q.A. Detection and Characterization of Bacterial Biofilms and Biofilm-Based Sensors. ACS Sens. 2022, 7, 347–357. [Google Scholar] [CrossRef]
- Surman, S.; Walker, J.; Goddard, D.; Morton, L.; Keevil, C.; Weaver, W.; Skinner, A.; Hanson, K.; Caldwell, D.; Kurtz, J. Comparison of microscope techniques for the examination of biofilms. J. Microbiol. Methods 1996, 25, 57–70. [Google Scholar] [CrossRef]
- Pourhajibagher, M.; Bahador, A. Synergistic biocidal effects of metal oxide nanoparticles-assisted ultrasound irradiation: Antimicrobial sonodynamic therapy against Streptococcus mutans biofilms. Photodiagn. Photodyn. Ther. 2021, 35, 102432–102443. [Google Scholar] [CrossRef]
- Wang, J.; Li, G.; Yin, H.; An, T. Bacterial response mechanism during biofilm growth on different metal material substrates: EPS characteristics, oxidative stress and molecular regulatory network analysis. Environ. Res. 2020, 185, 109451–109461. [Google Scholar] [CrossRef]
- Arenas-Vivo, A.; Amariei, G.; Aguado, S.; Rosal, R.; Horcajada, P. An Ag-loaded photoactive nano-metal organic framework as a promising biofilm treatment. Acta Biomater. 2019, 97, 490–500. [Google Scholar] [CrossRef]
- Dykas, M.M.; Desai, S.K.; Patra, A.; Motapothula, M.R.; Poddar, K.; Kenney, L.J.; Venkatesan, T. Identification of Biofilm Inhibitors by Screening Combinatorial Libraries of Metal Oxide Thin Films. ACS Appl. Mater. Interfaces 2018, 10, 12510–12517. [Google Scholar] [CrossRef]
- Kröpfl, K.; Záraya, G.; Vladár, P.; Mages, M.; Ács, É. Study of biofilm formation by total-reflection X-ray fluorescence spectrometry. Microchem. J. 2003, 75, 133–137. [Google Scholar] [CrossRef]
- Schmitt, J.; Flemming, H.-C. FTIR-spectroscopy in microbial and material analysis. Int. Biodeterior. Biodegrad. 1998, 41, 1–11. [Google Scholar] [CrossRef]
- Sano, K.; Kanematsu, H.; Kogo, T.; Hirai, N.; Tanaka, T. Corrosion and biofilm for a composite coated iron observed by FTIR-ATR and Raman spectroscopy. Trans. Inst. Met. Finish. 2016, 94, 139–145. [Google Scholar] [CrossRef]
- Chao, Y.; Zhang, T. Surface-enhanced Raman scattering (SERS) revealing chemical variation during biofilm formation: From initial attachment to mature biofilm. Anal. Bioanal. Chem. 2012, 404, 1465–1475. [Google Scholar] [CrossRef] [Green Version]
- Horiue, H.; Sasaki, M.; Yoshikawa, Y.; Toyofuku, M.; Shigeto, S. Raman spectroscopic signatures of carotenoids and polyenes enable label-free visualization of microbial distributions within pink biofilms. Sci. Rep. 2020, 10, 7704–7710. [Google Scholar] [CrossRef]
- Wang, J.; Rong, H.; Zhang, C. Evaluation of the impact of dissolved oxygen concentration on biofilm microbial community in sequencing batch biofilm reactor. J. Biosci. Bioeng. 2018, 125, 532–542. [Google Scholar] [CrossRef]
- Ripa, R.; Shen, A.Q.; Funari, R. Detecting Escherichia coli Biofilm Development Stages on Gold and Titanium by Quartz Crystal Microbalance. ACS Omega 2020, 5, 2295–2302. [Google Scholar] [CrossRef] [Green Version]
- Kretzschmar, J.; Harnisch, F. Electrochemical impedance spectroscopy on biofilm electrodes—Conclusive or euphonious? Curr. Opin. Electrochem. 2021, 29, 100757. [Google Scholar] [CrossRef]
- Wilson, C.; Lukowicz, R.; Merchant, S.; Valquier-Flynn, H.; Caballero, J.; Sandoval, J.; Okuom, M.; Huber, C.; Brooks, T.D.; Wilson, E.; et al. Quantitative and Qualitative Assessment Methods for Biofilm Growth: A Mini-review. Res. Rev. J. Eng. Technol. 2017, 6, 1–42. [Google Scholar]
- Christensen, G.D.; Simpson, W.A.; Younger, J.J.; Baddour, L.M.; Barrett, F.F.; Melton, D.M.; Beachey, E.H. Adherence of coagulase-negative staphylococci to plastic tissue culture plates: A quantitative model for the adherence of staphylococci to medical devices. J. Clin. Microbiol. 1985, 22, 996–1006. [Google Scholar] [CrossRef] [Green Version]
- Pedersen, K. Method for Studying Microbial Biofilms in Flowing-Water Systems. Appl. Environ. Microbiol. 1982, 43, 6–13. [Google Scholar] [CrossRef] [Green Version]
- Rayner, J.; Veeh, R.; Flood, J. Prevalence of microbial biofilms on selected fresh produce and household surfaces. Int. J. Food Microbiol. 2004, 95, 29–39. [Google Scholar] [CrossRef]
- Erlandsen, S.L.; Kristich, C.J.; Dunny, G.M.; Wells, C.L. High-resolution Visualization of the Microbial Glycocalyx with Low-voltage Scanning Electron Microscopy: Dependence on Cationic Dyes. J. Histochem. Cytochem. 2004, 52, 1427–1435. [Google Scholar] [CrossRef]
- Tong, C.; Derek, C. Biofilm formation of benthic diatoms on commercial polyvinylidene fluoride membrane. Algal Res. 2021, 55, 102260–102271. [Google Scholar] [CrossRef]
- Sun, P.; Hui, C.; Khan, R.A.; Du, J.; Zhang, Q.; Zhao, Y.-H. Efficient removal of crystal violet using Fe3O4-coated biochar: The role of the Fe3O4 nanoparticles and modeling study their adsorption behavior. Sci. Rep. 2015, 5, 12638. [Google Scholar] [CrossRef] [Green Version]
- Dil, E.A.; Ghaedi, M.; Ghaedi, A.; Asfaram, A.; Jamshidi, M.; Purkait, M.K. Application of artificial neural network and response surface methodology for the removal of crystal violet by zinc oxide nanorods loaded on activate carbon: Kinetics and equilibrium study. J. Taiwan Inst. Chem. Eng. 2016, 59, 210–220. [Google Scholar] [CrossRef]
- Brião, G.; Jahn, S.; Foletto, E.; Dotto, G. Adsorption of crystal violet dye onto a mesoporous ZSM-5 zeolite synthetized using chitin as template. J. Colloid Interface Sci. 2017, 508, 313–322. [Google Scholar] [CrossRef]
- Russell, A.D.; Hugo, W.B. Antimicrobial Activity and Action of Silver. Prog. Med. Chem. 1994, 31, 351–370. [Google Scholar]
- Liau, S.Y.; Read, D.C.; Pugh, W.J.; Furr, J.R.; Russell, A.D. Interaction of silver nitrate with readily identifiable groups: Relationship to the antibacterial action of silver ions. Lett. Appl. Microbiol. 1997, 25, 279–283. [Google Scholar] [CrossRef]
- Kanematsu, H.; Kudara, H.; Kanesaki, S.; Kogo, T.; Ikigai, H.; Ogawa, A.; Hirai, N. Application of a Loop-Type Laboratory Biofilm Reactor to the Evaluation of Biofilm for Some Metallic Materials and Polymers such as Urinary Stents and Catheters. Materials 2016, 9, 824. [Google Scholar] [CrossRef] [Green Version]
- Ogawa, A.; Noda, M.; Kanematsu, H.; Sano, K. Application of bacterial 16S rRNA gene analysis to a comparison of the degree of biofilm formation on the surface of metal coated glasses. Mater. Technol. Adv. Perform. Mater. 2015, 30, B61–B65. [Google Scholar]
- Wang, M.; Cheng, J.; Li, M.; He, F. Raman spectra of soda–lime–silicate glass doped with rare earth. Phys. Rev. B Condens. Matter 2011, 406, 3865–3869. [Google Scholar] [CrossRef]


| Analysis Method | Range | Cost | Special Equipment Required | Quantitative/Qualitative |
|---|---|---|---|---|
| Dye staining | wide | low | not | depend on substrate |
| FT-IR, Raman | small | high | yes | high reliability |
| Microscope | small | high | yes | high reliability |
| Electro Chemical | wide | high | yes | high reliability |
| Ag deposited method | wide | low | not | this study will reveal |
Publisher’s Note: MDPI stays neutral with regard to jurisdictional claims in published maps and institutional affiliations. |
© 2022 by the authors. Licensee MDPI, Basel, Switzerland. This article is an open access article distributed under the terms and conditions of the Creative Commons Attribution (CC BY) license (https://creativecommons.org/licenses/by/4.0/).
Share and Cite
Kogo, T.; Sugi, K.; Kanematsu, H.; Kai, H.; Ogawa, A.; Hirai, N.; Takahashi, T.; Kato, T. Detection of Biofilm Formation on Material Surfaces by Ag+ Coating. Coatings 2022, 12, 1031. https://doi.org/10.3390/coatings12071031
Kogo T, Sugi K, Kanematsu H, Kai H, Ogawa A, Hirai N, Takahashi T, Kato T. Detection of Biofilm Formation on Material Surfaces by Ag+ Coating. Coatings. 2022; 12(7):1031. https://doi.org/10.3390/coatings12071031
Chicago/Turabian StyleKogo, Takeshi, Kazufumi Sugi, Hideyuki Kanematsu, Hotaka Kai, Akiko Ogawa, Nobumitsu Hirai, Toshiyuki Takahashi, and Takehito Kato. 2022. "Detection of Biofilm Formation on Material Surfaces by Ag+ Coating" Coatings 12, no. 7: 1031. https://doi.org/10.3390/coatings12071031