Article

First-Principles Study on the Adsorption and Dissociation Behavior of H2 on the Surface of a Plutonium–Gallium System

1
College of Nuclear Science and Technology, Naval University of Engineering, Wuhan 430000, China
2
College of Vocational and Continuing Education, Yunnan University, Kunming 650000, China
*
Authors to whom correspondence should be addressed.
Coatings 2022, 12(7), 1019; https://doi.org/10.3390/coatings12071019
Submission received: 30 May 2022 / Revised: 20 June 2022 / Accepted: 15 July 2022 / Published: 19 July 2022

Abstract

:
In order to understand the mechanism of hydrogen interaction on the surface of a plutonium–gallium system, the adsorption and dissociation behaviors of hydrogen molecules on the surface of a plutonium–gallium system were studied using the first-principles approach. The results show that the physical adsorption of hydrogen molecules occurs on the surface with a small degree of interaction; the most stable adsorption configuration is hollow-site parallel adsorption (H-b-hor1). During adsorption, charge transfer occurs mainly in the first atomic layer, and the density of states and surface function does not change significantly before and after adsorption. When the hydrogen molecule overcomes the energy barrier of 4.96 eV, it dissociates into two hydrogen atoms chemisorbed on the surface, which reduces the energy of the whole system by 1.95 eV. The essence of the hydrogen atom–surface interaction is that the 1s orbital of the hydrogen atom hybridizes with the 4s and 4p orbitals of the gallium atom and the 6s, 7s, and 6d orbitals of the plutonium atom to form a chemical bond.

1. Introduction

Plutonium is a highly radioactive and toxic fissile nuclear material that has an important role in energy and defense [1]. It is located between the light actinides, which contain outlying 5f electrons, and the heavy actinides, which contain localized 5f electrons, and has extremely complex electronic properties, with exotic f–f electron interactions and significant relativistic interactions [2,3]. Plutonium is chemically very reactive and readily interacts with a variety of reactive gases in air, such as H2, O2, CO2, N2, and CO [4,5,6]. This can cause significant changes in the nuclear and mechanical properties of plutonium materials, which can affect the ultimate performance of the application [7]. Therefore, ensuring the continued effectiveness of plutonium materials requires a deeper understanding of the nature and structure of plutonium [8]. Plutonium has a melting point of 913 K, and six stable phases exist in the range from absolute zero to the melting point [9]. Plutonium has the best mechanical and machinability properties [2] and is therefore of great interest. The phase transition of plutonium metal not only shows complex relationships at different temperatures but is also very sensitive to chemical doping. The doping of gallium elements can increase the temperature stability of δ plutonium while significantly improving the flexibility and ductility of the metal, which plays a significant role in the processing, storage, and application of plutonium materials, so most of the practical applications are plutonium–gallium alloys. In this paper, the surface of the plutonium–gallium system is the surface of plutonium doped with gallium elements.
Due to the radioactivity and high toxicity of plutonium materials, experimental studies of the materials face many challenges, and the main research on plutonium materials is currently focused on simulation studies. In terms of surface adsorption, the adsorption behavior of gases such as H2, O2, CO2, CO, and H2O on the surface of δ plutonium has been investigated using the first principles approach based on density flooding theory. The study shows that the adsorption of H2 and H2O on the surface of plutonium belongs to physical adsorption, and the adsorption of O2, CO, and CO2 on the surface of plutonium belongs to chemical adsorption [10]. In the study of plutonium–gallium systems, Sadigh et al. [11] investigated the structural and thermodynamic properties of δ-phase Pu-Ga alloys using a plane-wave pseudopotential method based on spin-polarized (SP) density generalized theory (DFT), and the results showed that all structural properties and most thermodynamic properties of δ-phase Pu-Ga alloys with low Ga content could be successfully calculated by considering spin polarization effects. Luo Wenhua [12] et al. used the full-potential linearized augmented plane wave (FPLAW) method to calculate the equilibrium structure, electronic structure, and heat of formation of alloying elements such as Ga and Pu compounds under generalized gradient approximation (GGA) + spin-orbit coupling (SOC) + SP conditions, and the results demonstrated Pu and alloying elements. The hybridization between atomic orbitals depends on the competition between 6d and 5f of Pu atoms, p of alloyed atoms and 6d of Pu atoms, and the s and p orbital hybridization of alloyed atoms.
The above studies on surface adsorption problems mainly focus on a pure plutonium surface, while most of the practical applications are plutonium–gallium alloys. The studies on plutonium–gallium alloys mainly focus on structural properties, while the studies related to surface adsorption of plutonium–gallium systems are less prominent. Adsorption is the primary condition for surface corrosion to occur, and corrosion caused by hydrogen is an important factor affecting the long-term storage of plutonium materials. In this paper, the first-principles method based on density generalized theory is used to study the adsorption and dissociation behavior of hydrogen on the surface of plutonium–gallium systems, analyze the interaction of hydrogen with the surface of the plutonium–gallium system in terms of adsorption energy, Bader charge, differential charge density, the density of states and work function, calculate the potential barrier of hydrogen dissociation adsorption, reveal the mechanism of interaction, and provide the theoretical basis for the study of surface corrosion of the plutonium–gallium system. This will provide a theoretical basis for studying the surface corrosion of plutonium–gallium systems.

2. Calculation Methods and Models

2.1. Calculation Method

All calculations were performed using the first-principles-based VASP [13,14] (Vienna ab-initio simulation package) software. The valence electron wave function was expanded with a projector augmented wave (PAW) [15,16] expansion and the exchange-correlation generalized gradient approximation (GGA) [17]. The conjugate gradient method was used to optimize the structure. The Monkhorst–Pack method was used to pick k points. The exchange-correlation generalization was handled by the Perdew–Burke–Ernzerhof (PBE) approximation in the framework of generalized gradient approximation (GGA). The inner electrons and nuclei were replaced by first-principles pseudopotentials, where the valence electrons of Pu are described by 6s2 6p6 6d2 5f4 7s2, Ga by 4s2 4p1, and H by 1s1. The Monkhorst–Pack [18] (MP) scheme was used to sample within the integrable Brillouin zone. All calculations take into account spin polarization effects. Due to the small size of the surface model, many-body effects and delocalized electrons were not considered. After testing, adding dispersion correction had little effect on the calculation results. To ensure the consistency of energy calculation parameters, all calculations did not take into account the van der Waals force correction.
The absolute value of adsorption energy directly responds to the heat absorbed or released by the adsorption reaction, and it is generally believed that the more heat released by adsorption, the more stable the adsorption. The adsorption energy Eads is calculated as:
E ads = E T E A E B
where ET is the energy of the optimized adsorption configuration, EA is the energy of the adsorption molecule separately optimized before adsorption, EB is the energy of the surface of the plutonium–gallium system separately optimized before adsorption, and each energy on the right side of the equation is optimized in the same way and with the same precision.

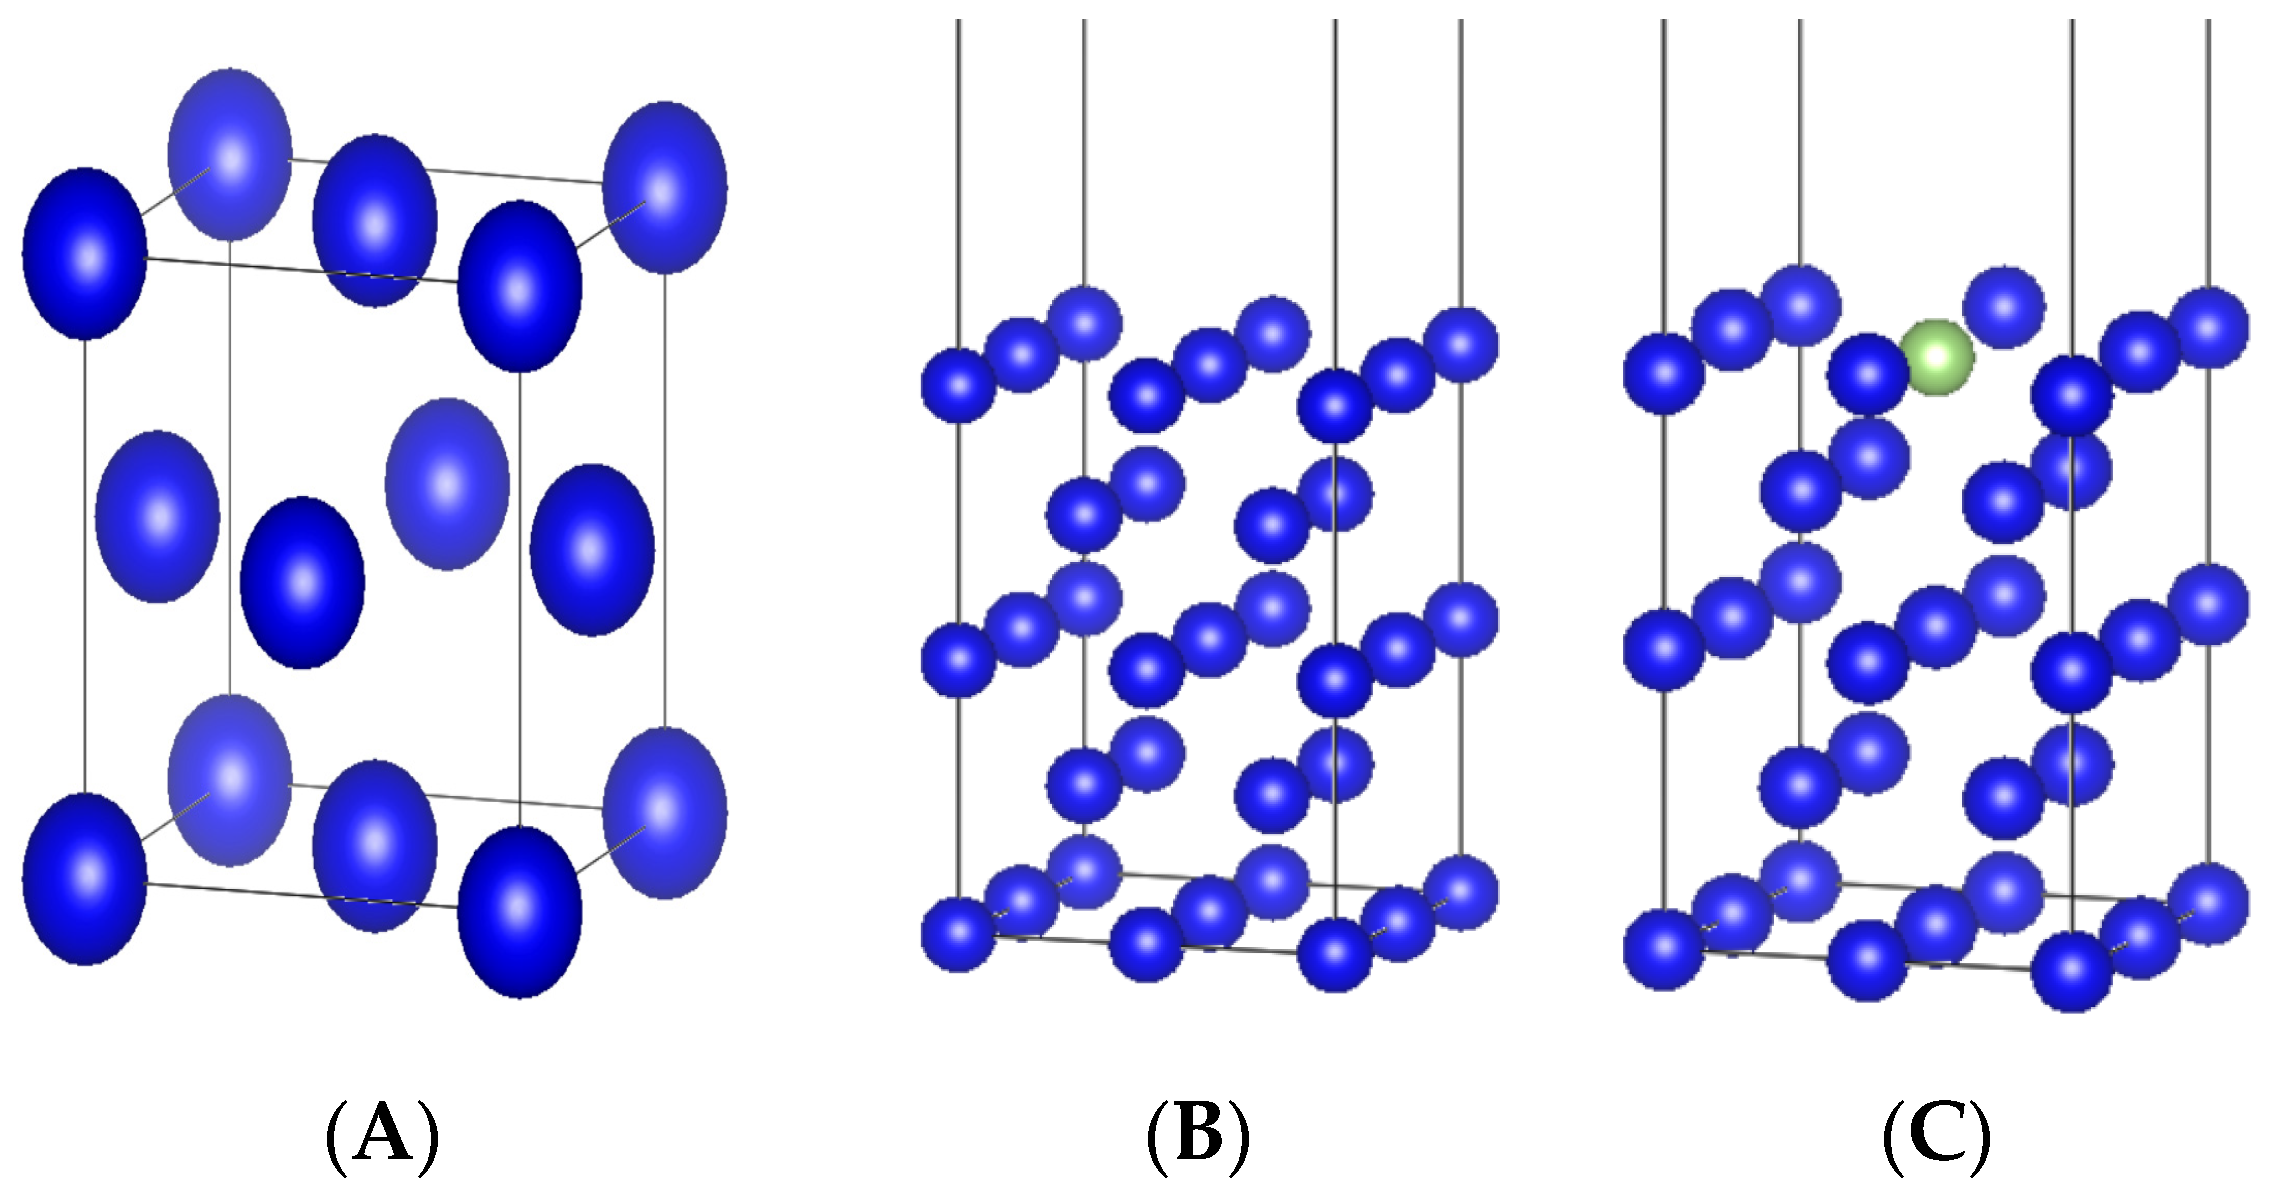
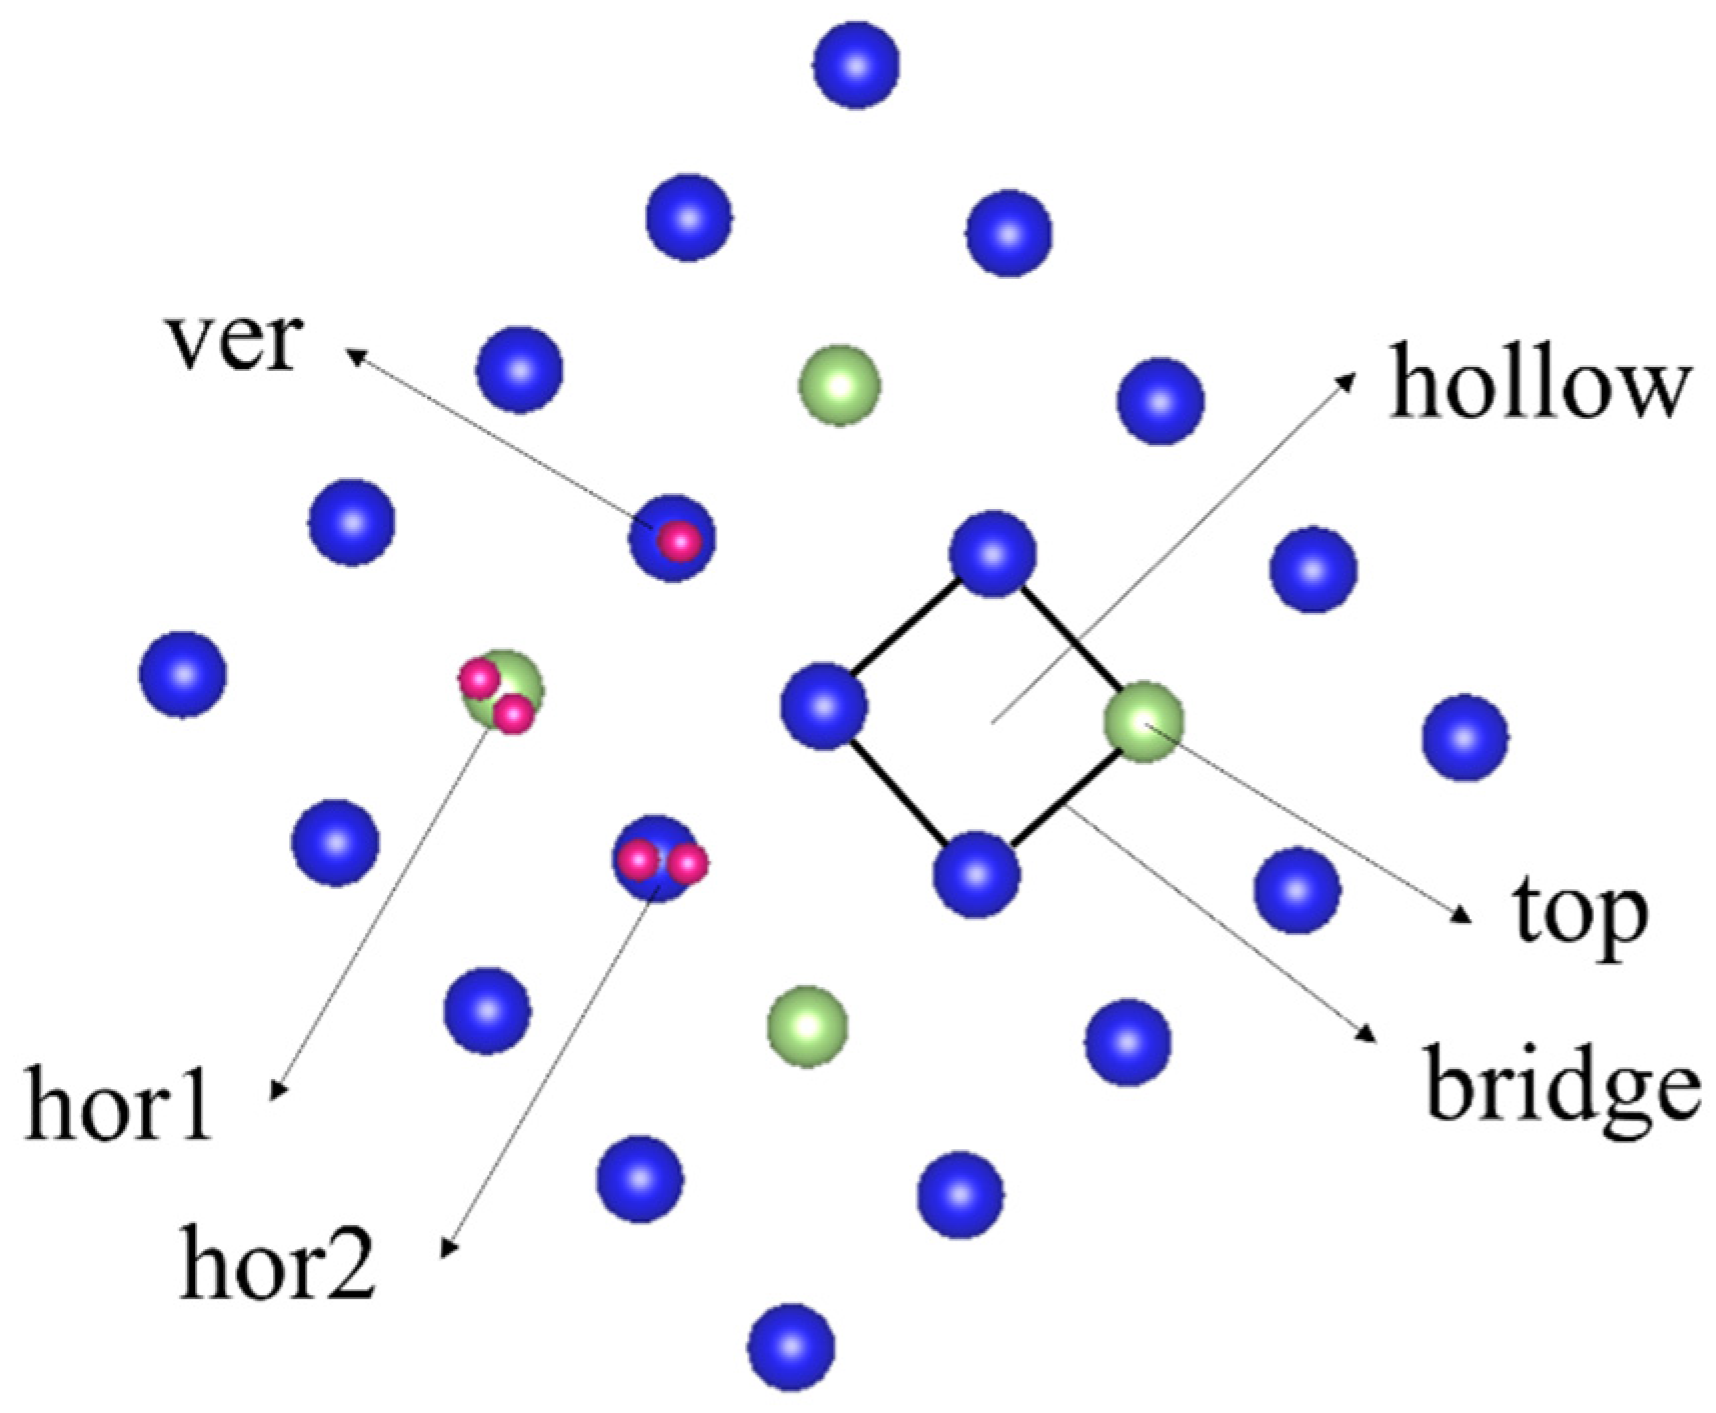
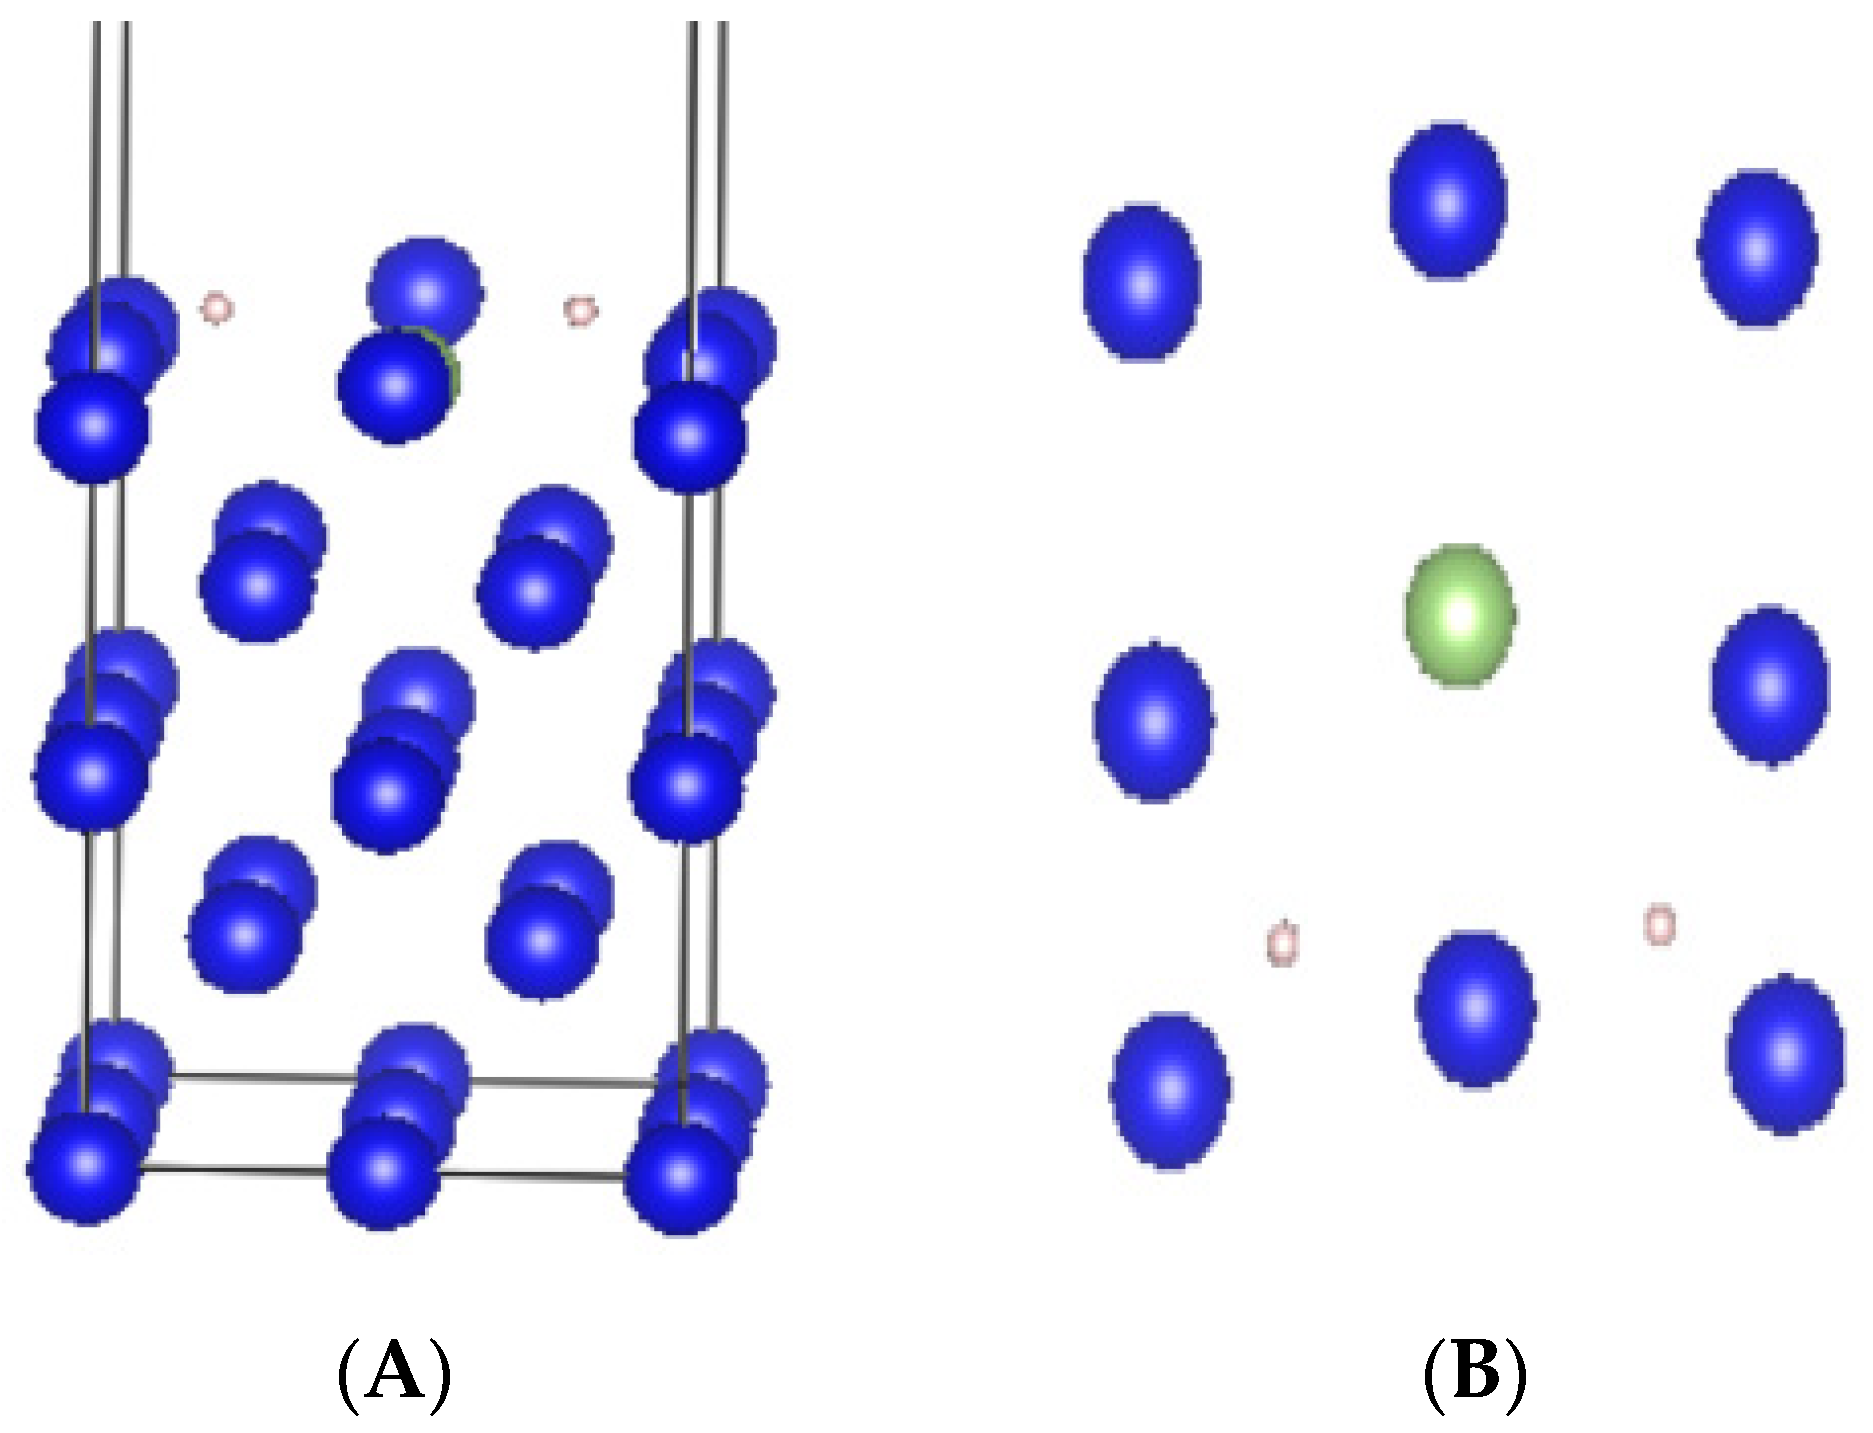
2.2. Computational Models

The crystal structure of δ-Pu metal was face-centered cubic (fcc) with space group code Fm-3m. The experimental values of the lattice constants were a = b = c = 4.637 Å [19] and α = β = γ = 90°, the optimized lattice constant was calculated as a = b = c = 4.776 Å, α = β = γ = 90°, volume V = 108.9489 Å3, and the bulk phase energy E = −54.731 eV. The error between the lattice constant and the experimental value was 2.9%, which was in good agreement, and the results of single-cell optimization are shown in Figure 1A. The optimized single cell was faceted, and the surface model was used to establish the crystallographic surface model of δ-Pu using the (100) surface. The atomic structure of 5 layers was selected, and the thickness of the vacuum layer was set to 15 Å. The structure of the crystal surface is shown in Figure 1B. The surface-most atoms had a large influence on the surface properties, and four different doping models with different gallium atomic contents were established by substituting different numbers of gallium atoms on the surface-most of the doped δ-Pu(100). The doping form with the smallest and most stable surface energy, i.e., gallium atoms doped with substituted surface-most plutonium atoms, was obtained using the calculation, as shown in Figure 1C.
In the construction of the adsorption model, a hydrogen molecule was placed on the surface of an optimized plutonium–gallium system containing 19 plutonium atoms and 1 gallium atom with a coverage of 0.25. The bond length of H-H in H2 was 0.7372 Å. The adsorption molecules were placed on the bridge, hollow, and top positions of the plutonium–gallium system. The molecules in each adsorption position were considered three adsorption directions: adsorption molecules are perpendicular to the surface (ver); adsorption molecules are parallel to the surface and parallel to the crystal axis (with hor1); adsorption molecules are parallel to the surface and parallel to the diagonal of the crystal axis (with hor2). There were nine initial adsorption configurations of H2 on the surface of the plutonium–gallium system, as shown in Figure 2. For example, H-h-ver in H represents the adsorption of hydrogen molecules, h indicates that the initial adsorption position is centroidal (hollow), and ver indicates that the gas molecules are placed perpendicular to the surface.

3. Results and Discussion

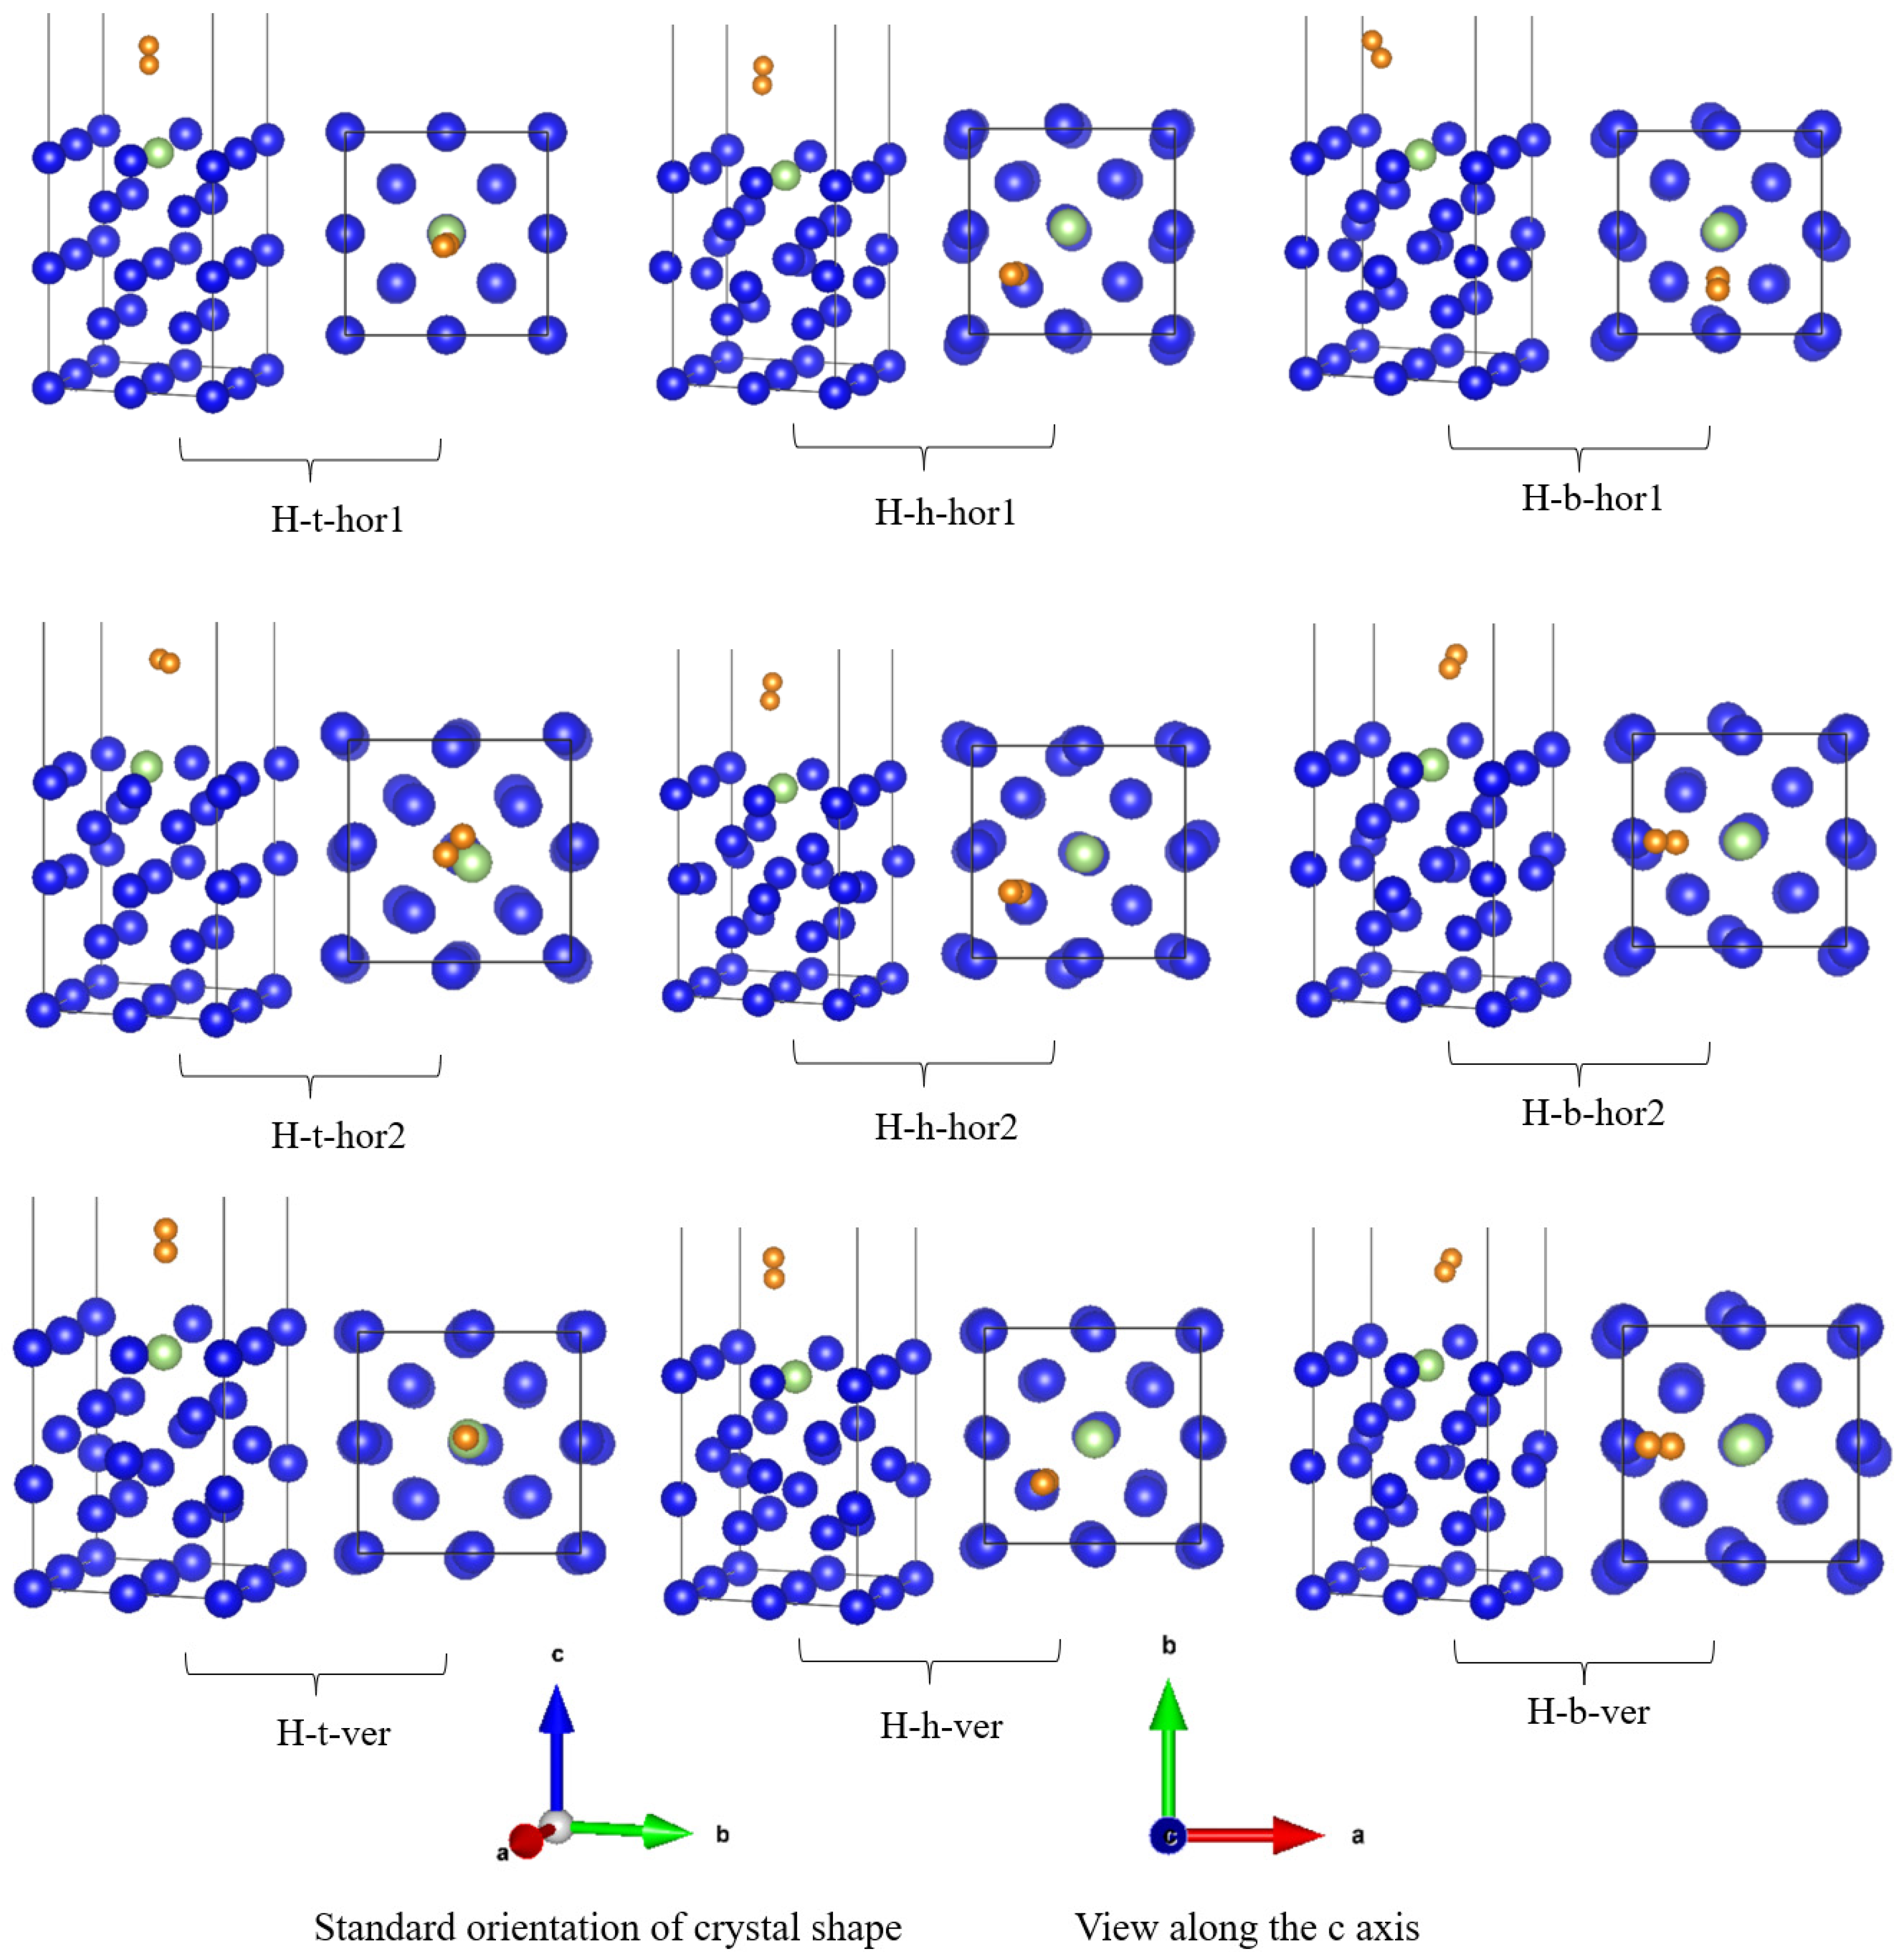
3.1. Adsorption Conformation and Adsorption Energy

The nine initial adsorption configurations of H2 on the surface of the plutonium–gallium system were optimized, and the optimized results are shown in Figure 3; the optimized structural parameters and energy data are shown in Table 1. From the optimized results, it can be seen that all hydrogen molecules were stably adsorbed on top of the plutonium–gallium surface, and none of them were dissociated. No matter how the hydrogen was placed, the hydrogen molecules formed a certain angle with the surface, and it can be considered that the angle of parallel placement of hydrogen molecules had no effect on the final stable adsorption conformation. Observing the surface of the plutonium–gallium system, the relative position of each atom in the surface layer changed little, and the surface of the plutonium–gallium system did not undergo reconfiguration. The initial hydrogen molecule H-H bond length was 0.7372 Å. After the adsorption of hydrogen molecules, the H-H bond length did not change to a large extent, indicating that the hydrogen molecules interacted with the surface to a small extent.
The magnitude of adsorption energy reflects the stability of adsorption. The adsorption energies of the nine stable adsorption configurations were small, all in the range of −1.4901 eV–0.3725 eV, and the distances of hydrogen molecules on the surface were above 2 Å. Among all the adsorption configurations, the distance between hydrogen atoms and surface atoms in the H-b-hor2 configuration was the closest, at 3.1307 Å. Combined with the optimization results analysis, it can be concluded that the adsorption of H2 molecules on the surface of the plutonium–gallium system was physical adsorption. Observing the adsorption energy parameters at three different initial positions, the adsorption energy of the hydrogen molecule was greater at the hollow position than at the other two positions. At the same position, the adsorption energy was greater for parallel placement than for perpendicular placement. The order of stability of their adsorption was hollow position > bridge position > top position, parallel placement of hydrogen molecules > vertical placement, and the most stable adsorption configuration was hole position parallel adsorption (H-b-hor1).
In general, when hydrogen molecules approached the surface of the plutonium–gallium system, they did not dissociate at first but instead physically adsorbed into the surface in molecular form.

3.2. Bader Charge Analysis

The adsorption reaction of hydrogen on the surface of the plutonium–gallium system was accompanied by the transfer of charge between the gas molecules and the surface atoms of the plutonium–gallium system. Bader charge analysis quantitatively represented the amount of charge transfer and analyzed the surface charge transfer. Table 2 show the amount of charge transferred by atoms of each layer and atoms of adsorbed gases for each stable configuration. Analysis of the data in the table shows that the hydrogen molecules charged during the adsorption process, and the net charge increases between 0.01 e and 0.03 e, which is a small amount of charge transfer, indicating a small degree of interaction between the hydrogen and the surface atoms, with almost no chemical bonding. Comparing the adsorption energy of each configuration, the hole–site adsorption with larger adsorption energy corresponds to a correspondingly larger amount of electron transfer. In general, the larger the amount of charge transfer, the more exothermic the adsorption process is and the greater the adsorption intensity. In all configurations of stable adsorption, the first layer of atoms on the surface of the plutonium–gallium system generally loses charge, and its loss of charge is greater than the loss of charge of the inner layer of atoms, indicating that hydrogen molecules mainly interact with the first layer of atoms on the surface. In general, the flow of electrons is mainly transferred from the surface to the hydrogen molecules, and the amount of transfer is small.

3.3. Electronic Structure Analysis

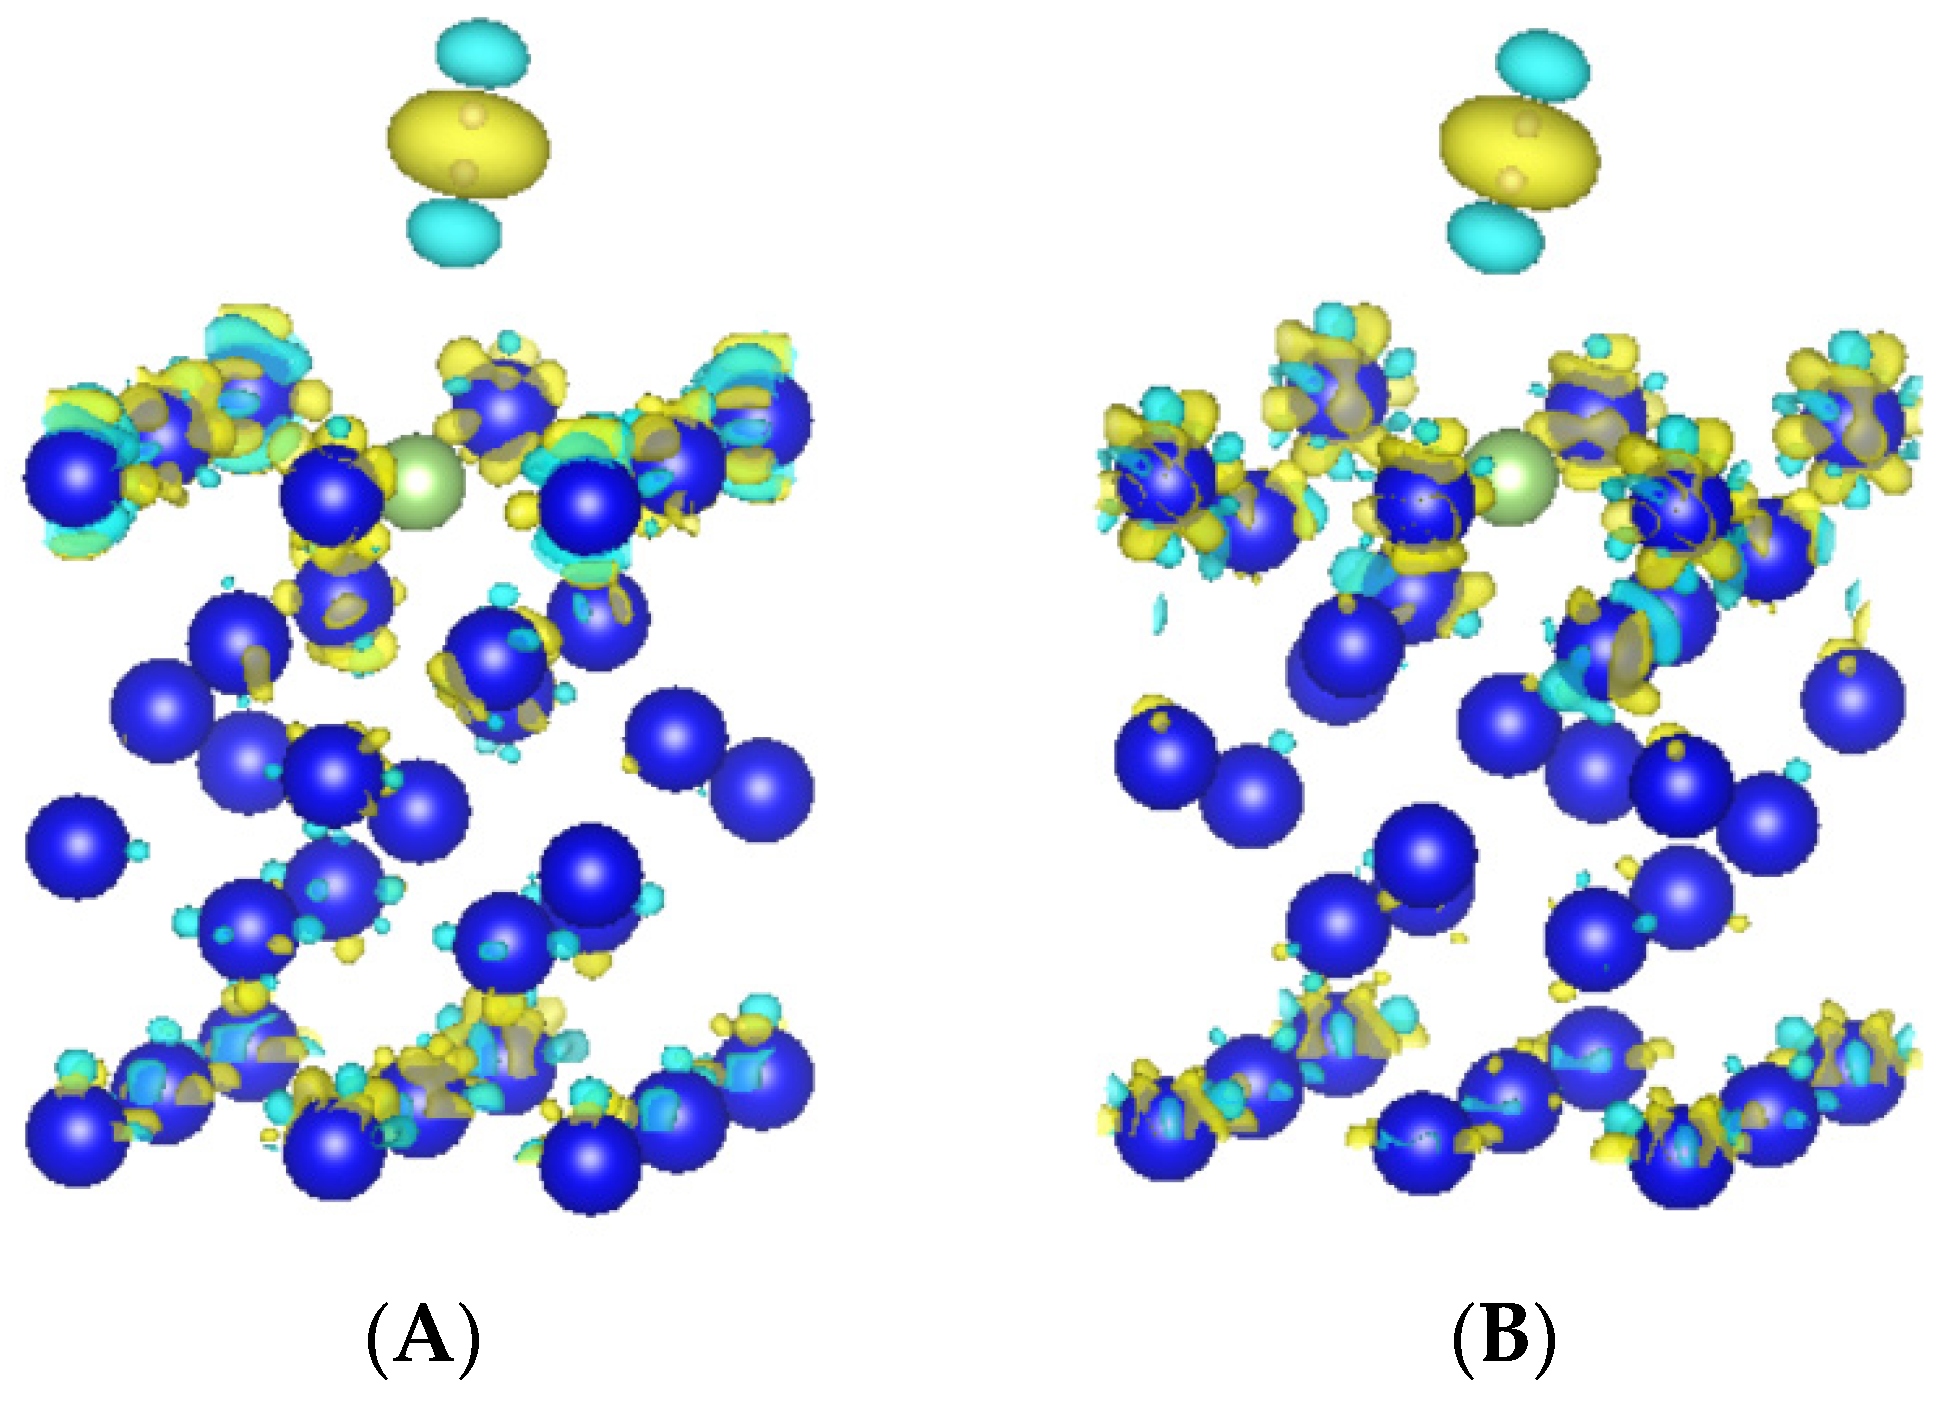
3.3.1. Differential Charge Density Analysis

The differential charge density is the difference between the charge density after bonding and the atomic charge density at the corresponding point. By calculating and analyzing the differential charge density, the properties of charge movement during bonding and bonding electron coupling, as well as the direction of bonding polarization, can be clearly obtained, which helps us to understand the process of adsorption.
Differential charge density.
Δ ρ = ρ A + B ρ A ρ B
where Δ ρ is the differential charge density value, ρ A + B is the charge density value of the adsorbed configuration, ρ A is the charge density value of the adsorbed hydrogen molecules, and ρ B is the charge density of the adsorbed plutonium–gallium system surface.
Through the calculation, we obtained the differential charge density diagrams of two adsorption configurations, as shown in Figure 4. From the diagrams, we can see that the two stable adsorption configurations have less charge density on one side of the hydrogen molecule near the surface and more charge density on the other side, and the charge density of atoms on the surface of the plutonium–gallium system changes mainly in the first layer of atoms on the surface, which is consistent with the conclusion of the calculated Bader charge transfer amount. In general, the hydrogen adsorption distance on the surface of the plutonium–gallium system is large, the degree of interaction is small, and there is no obvious bonding effect.

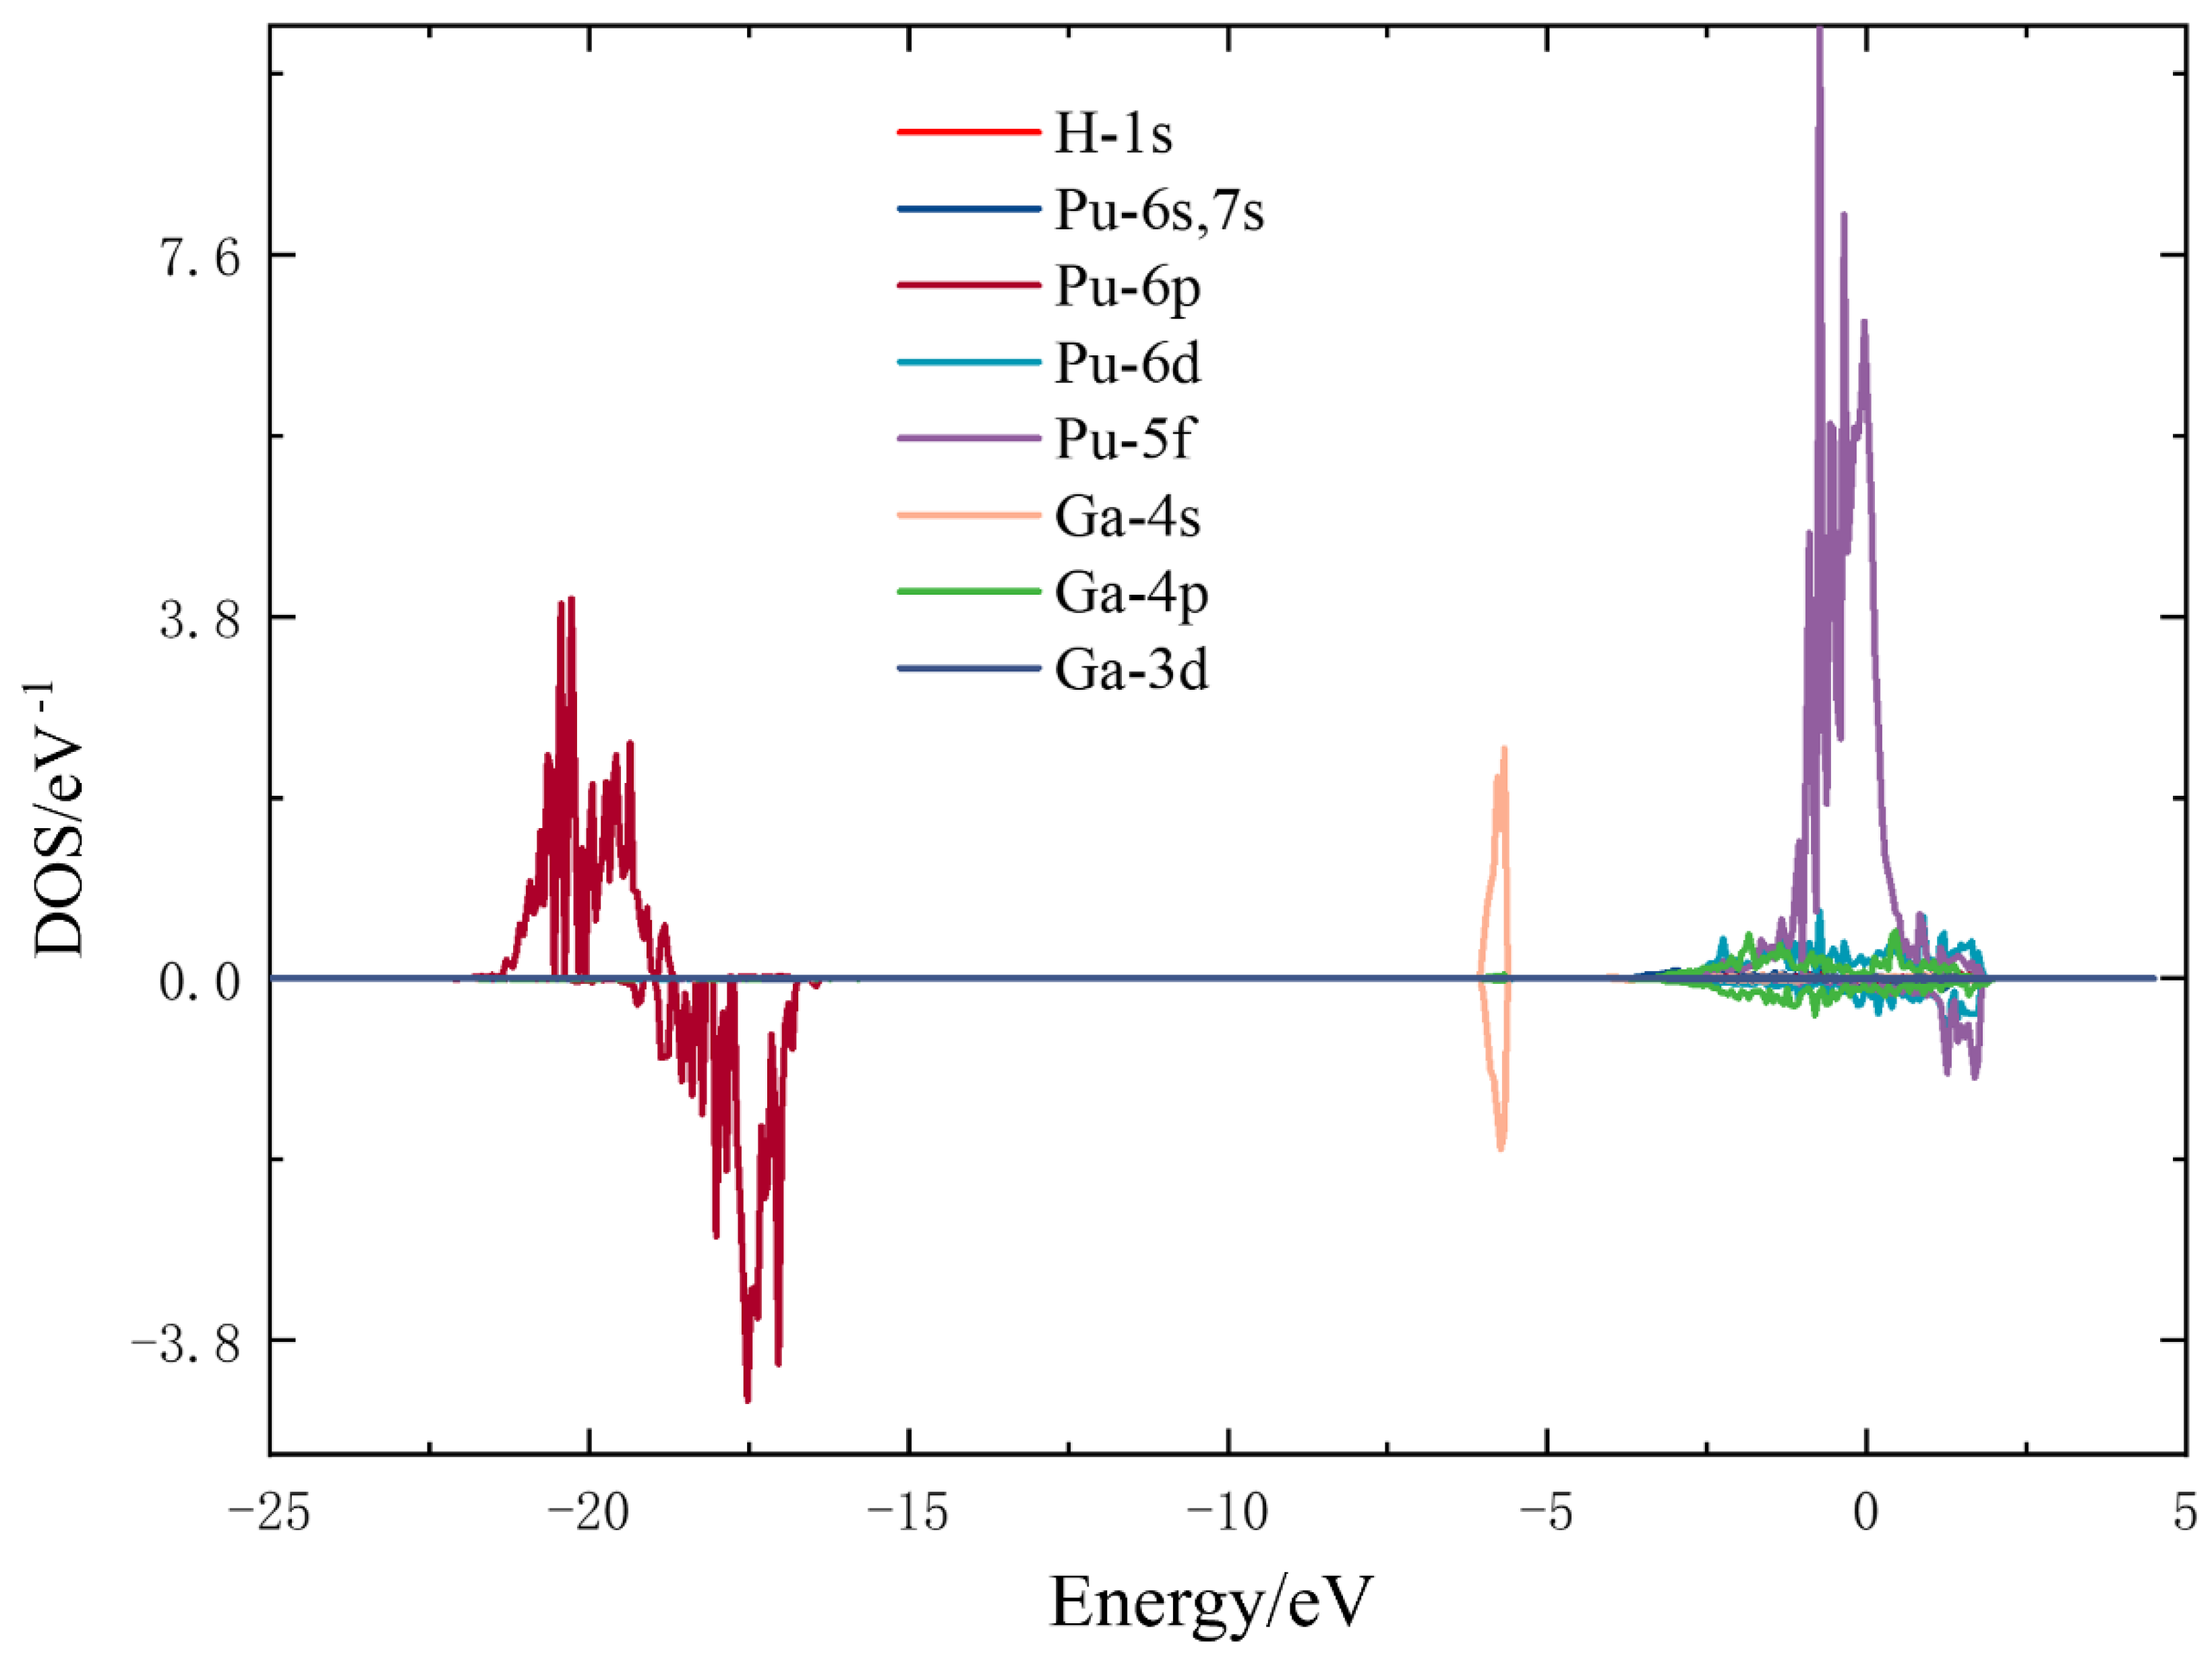
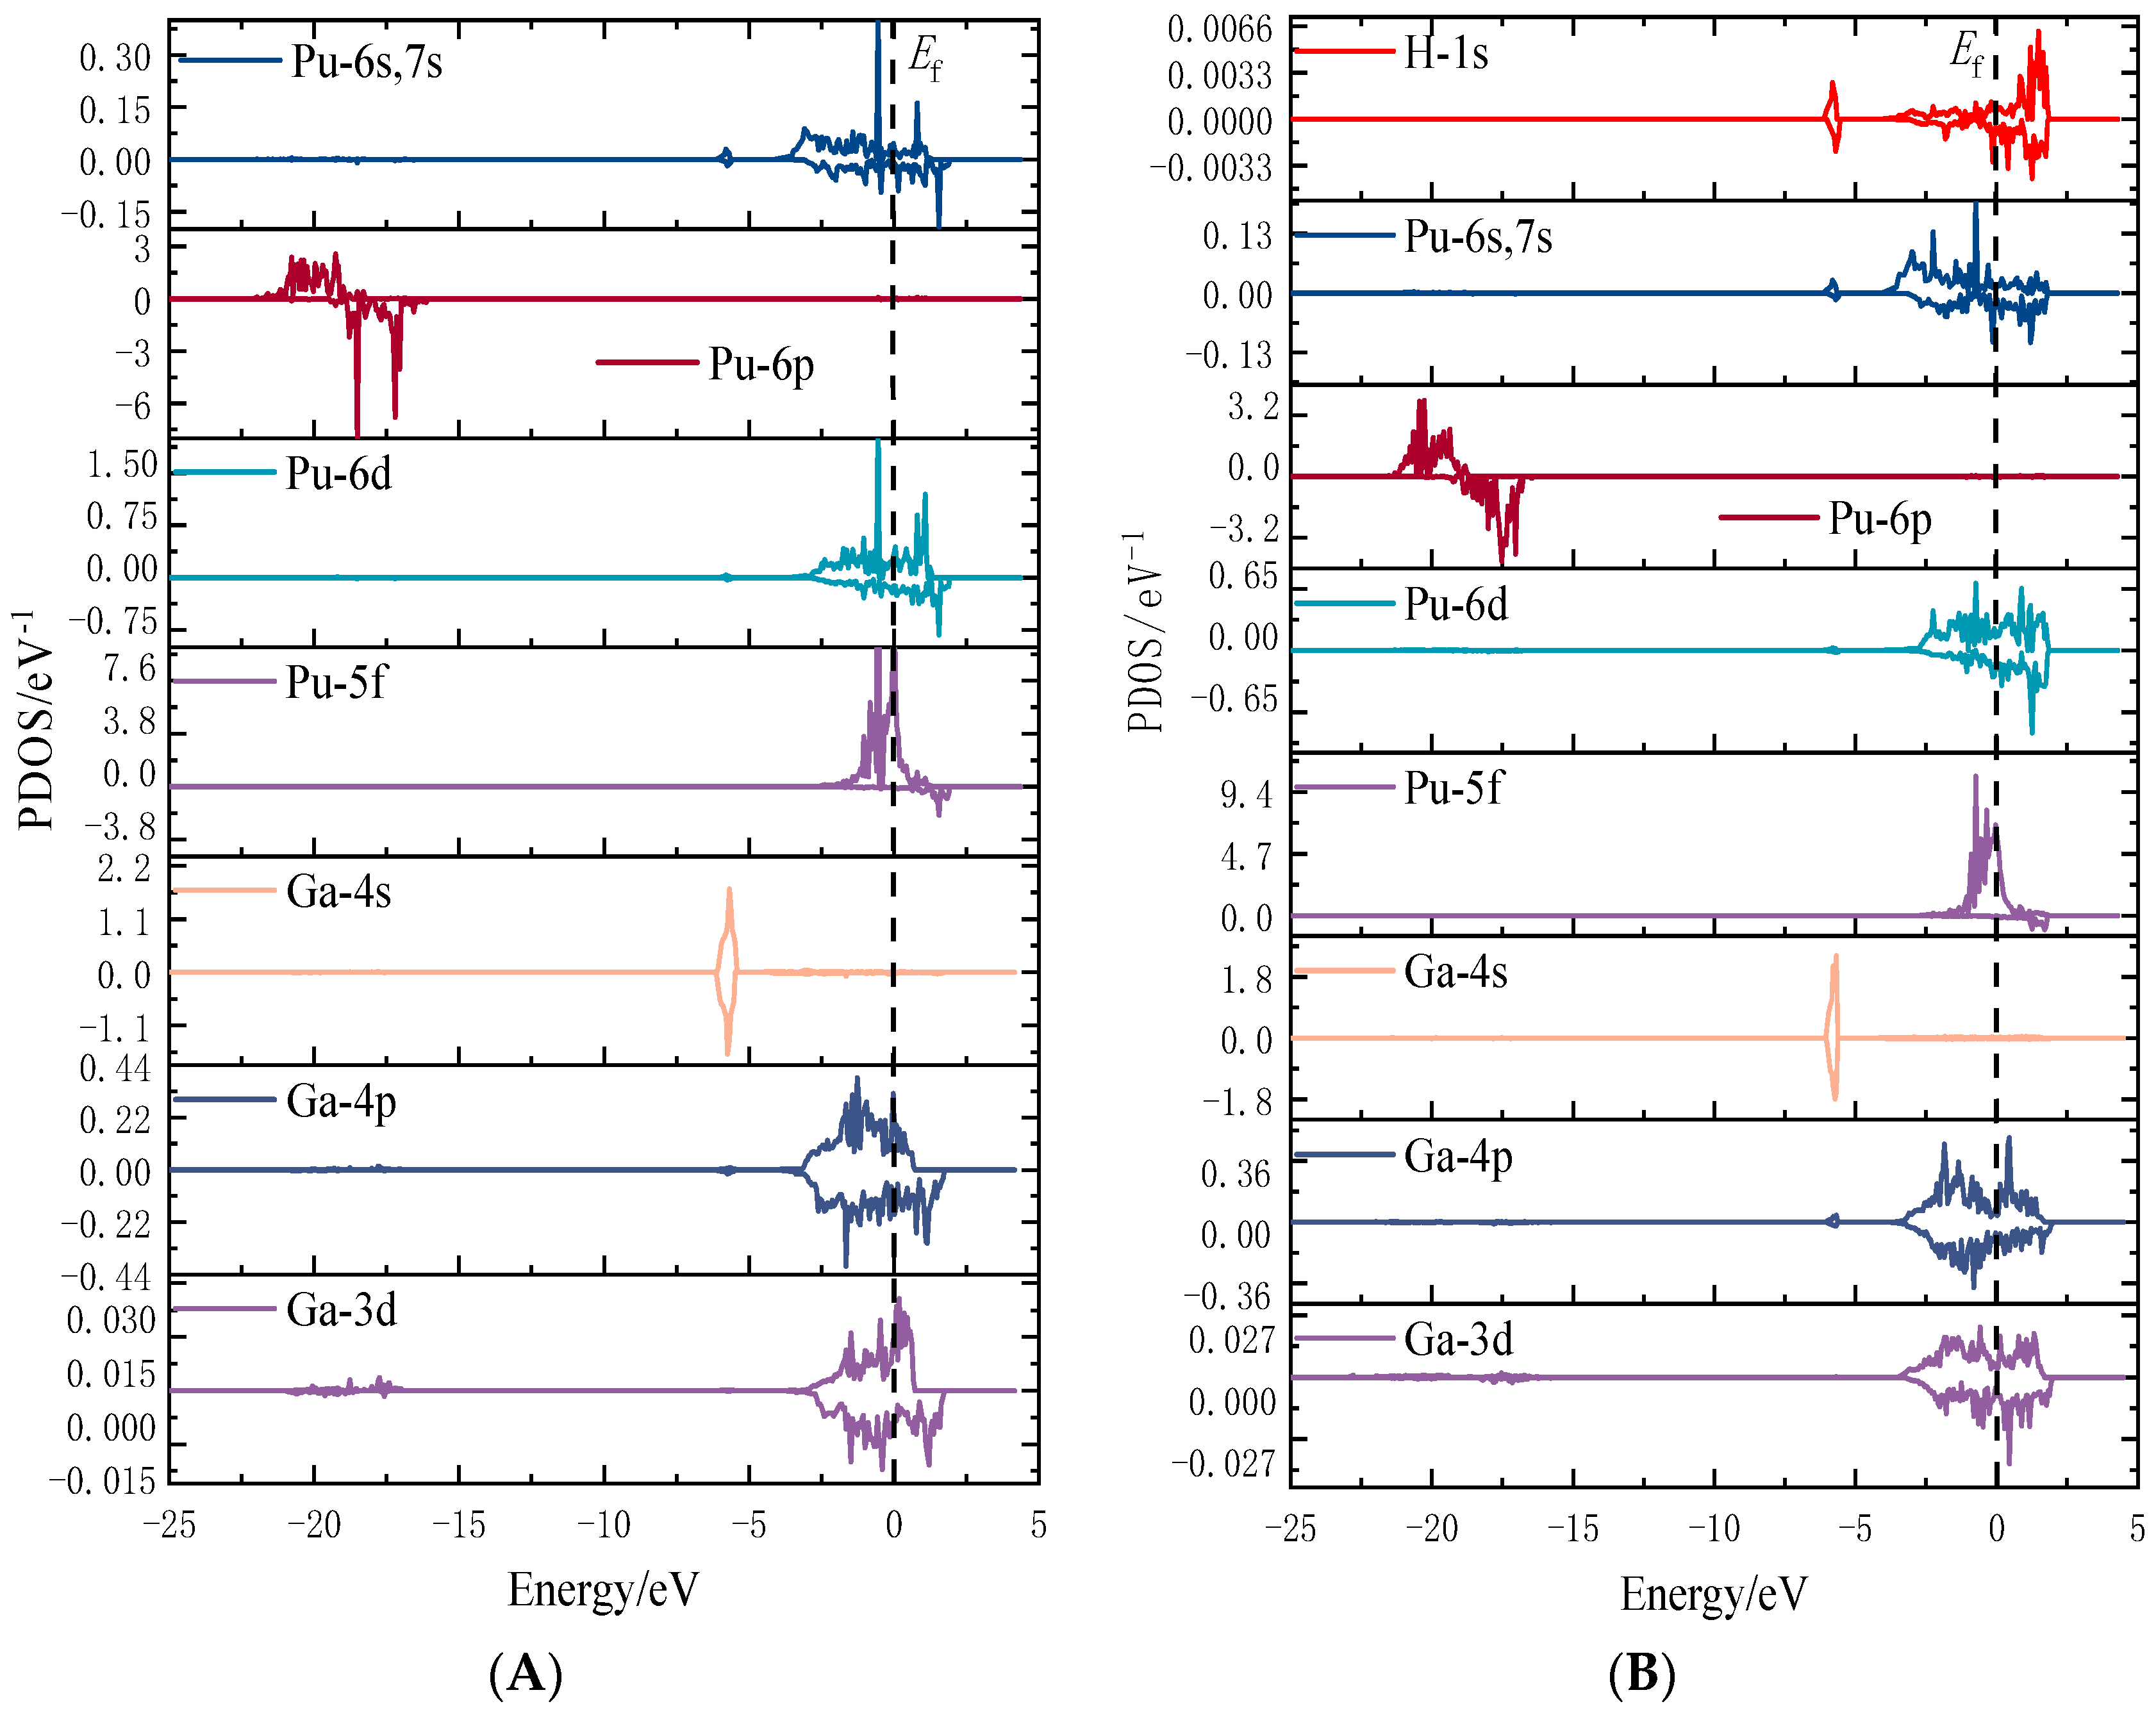
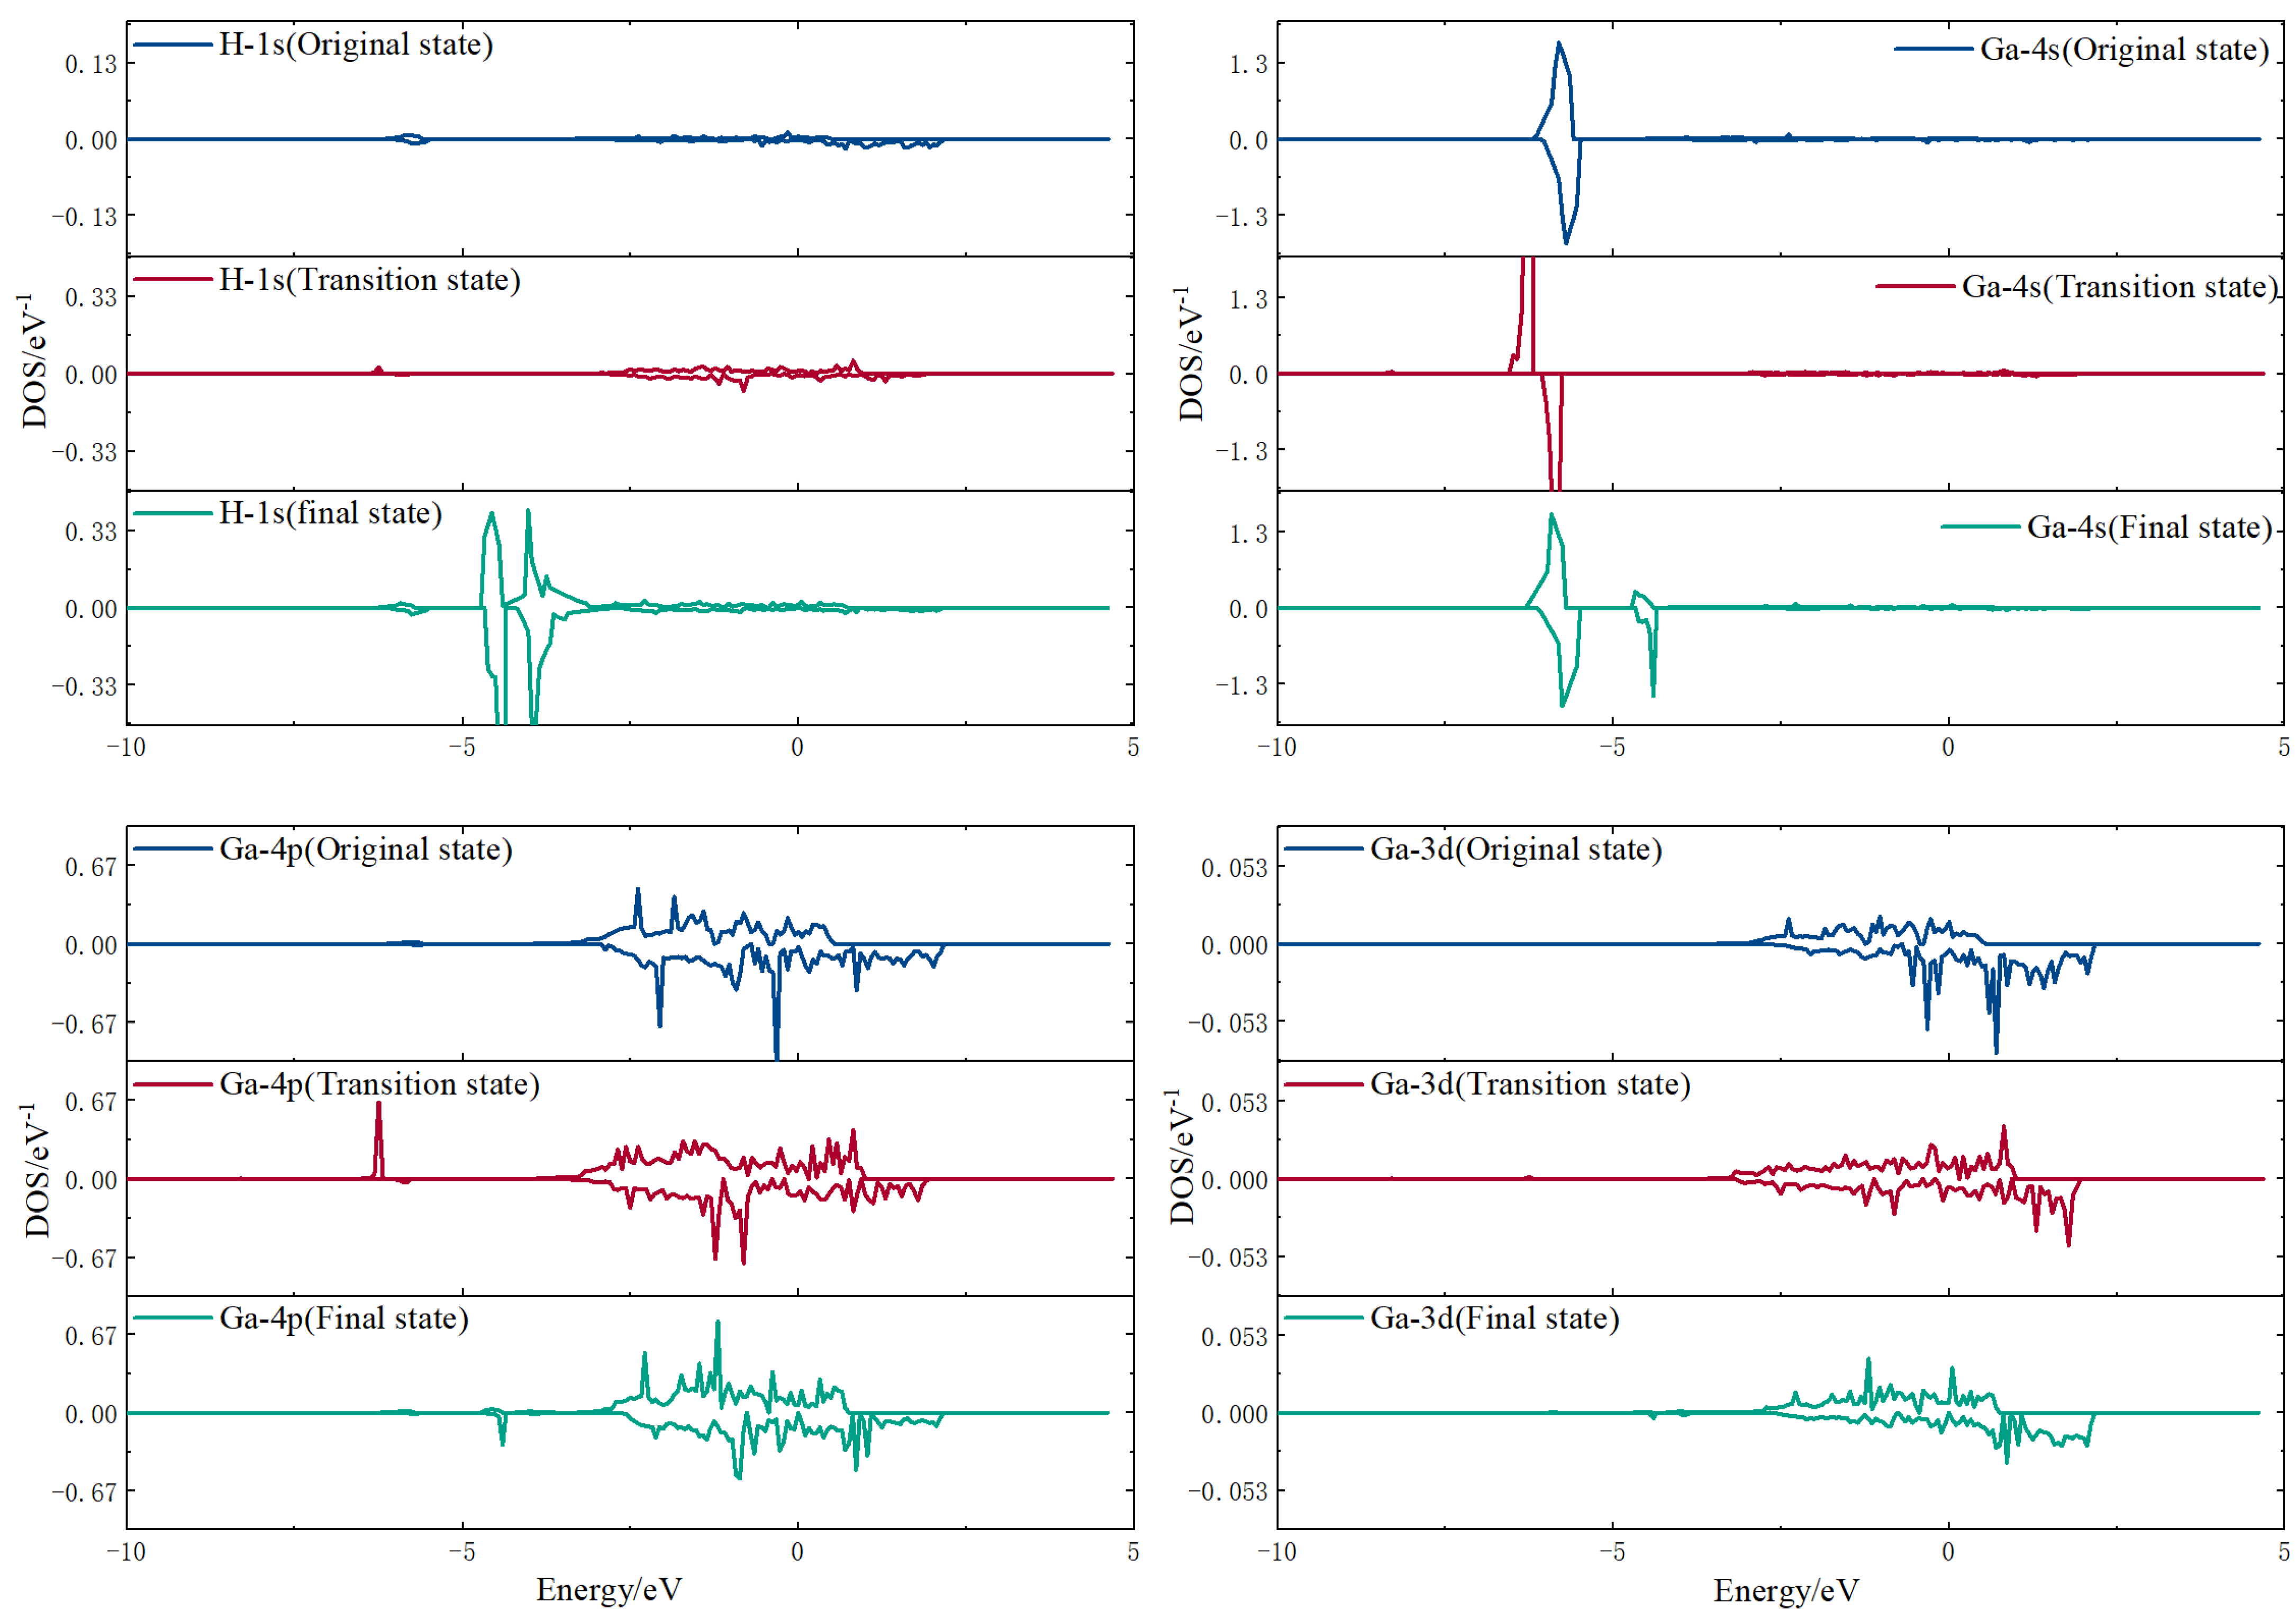
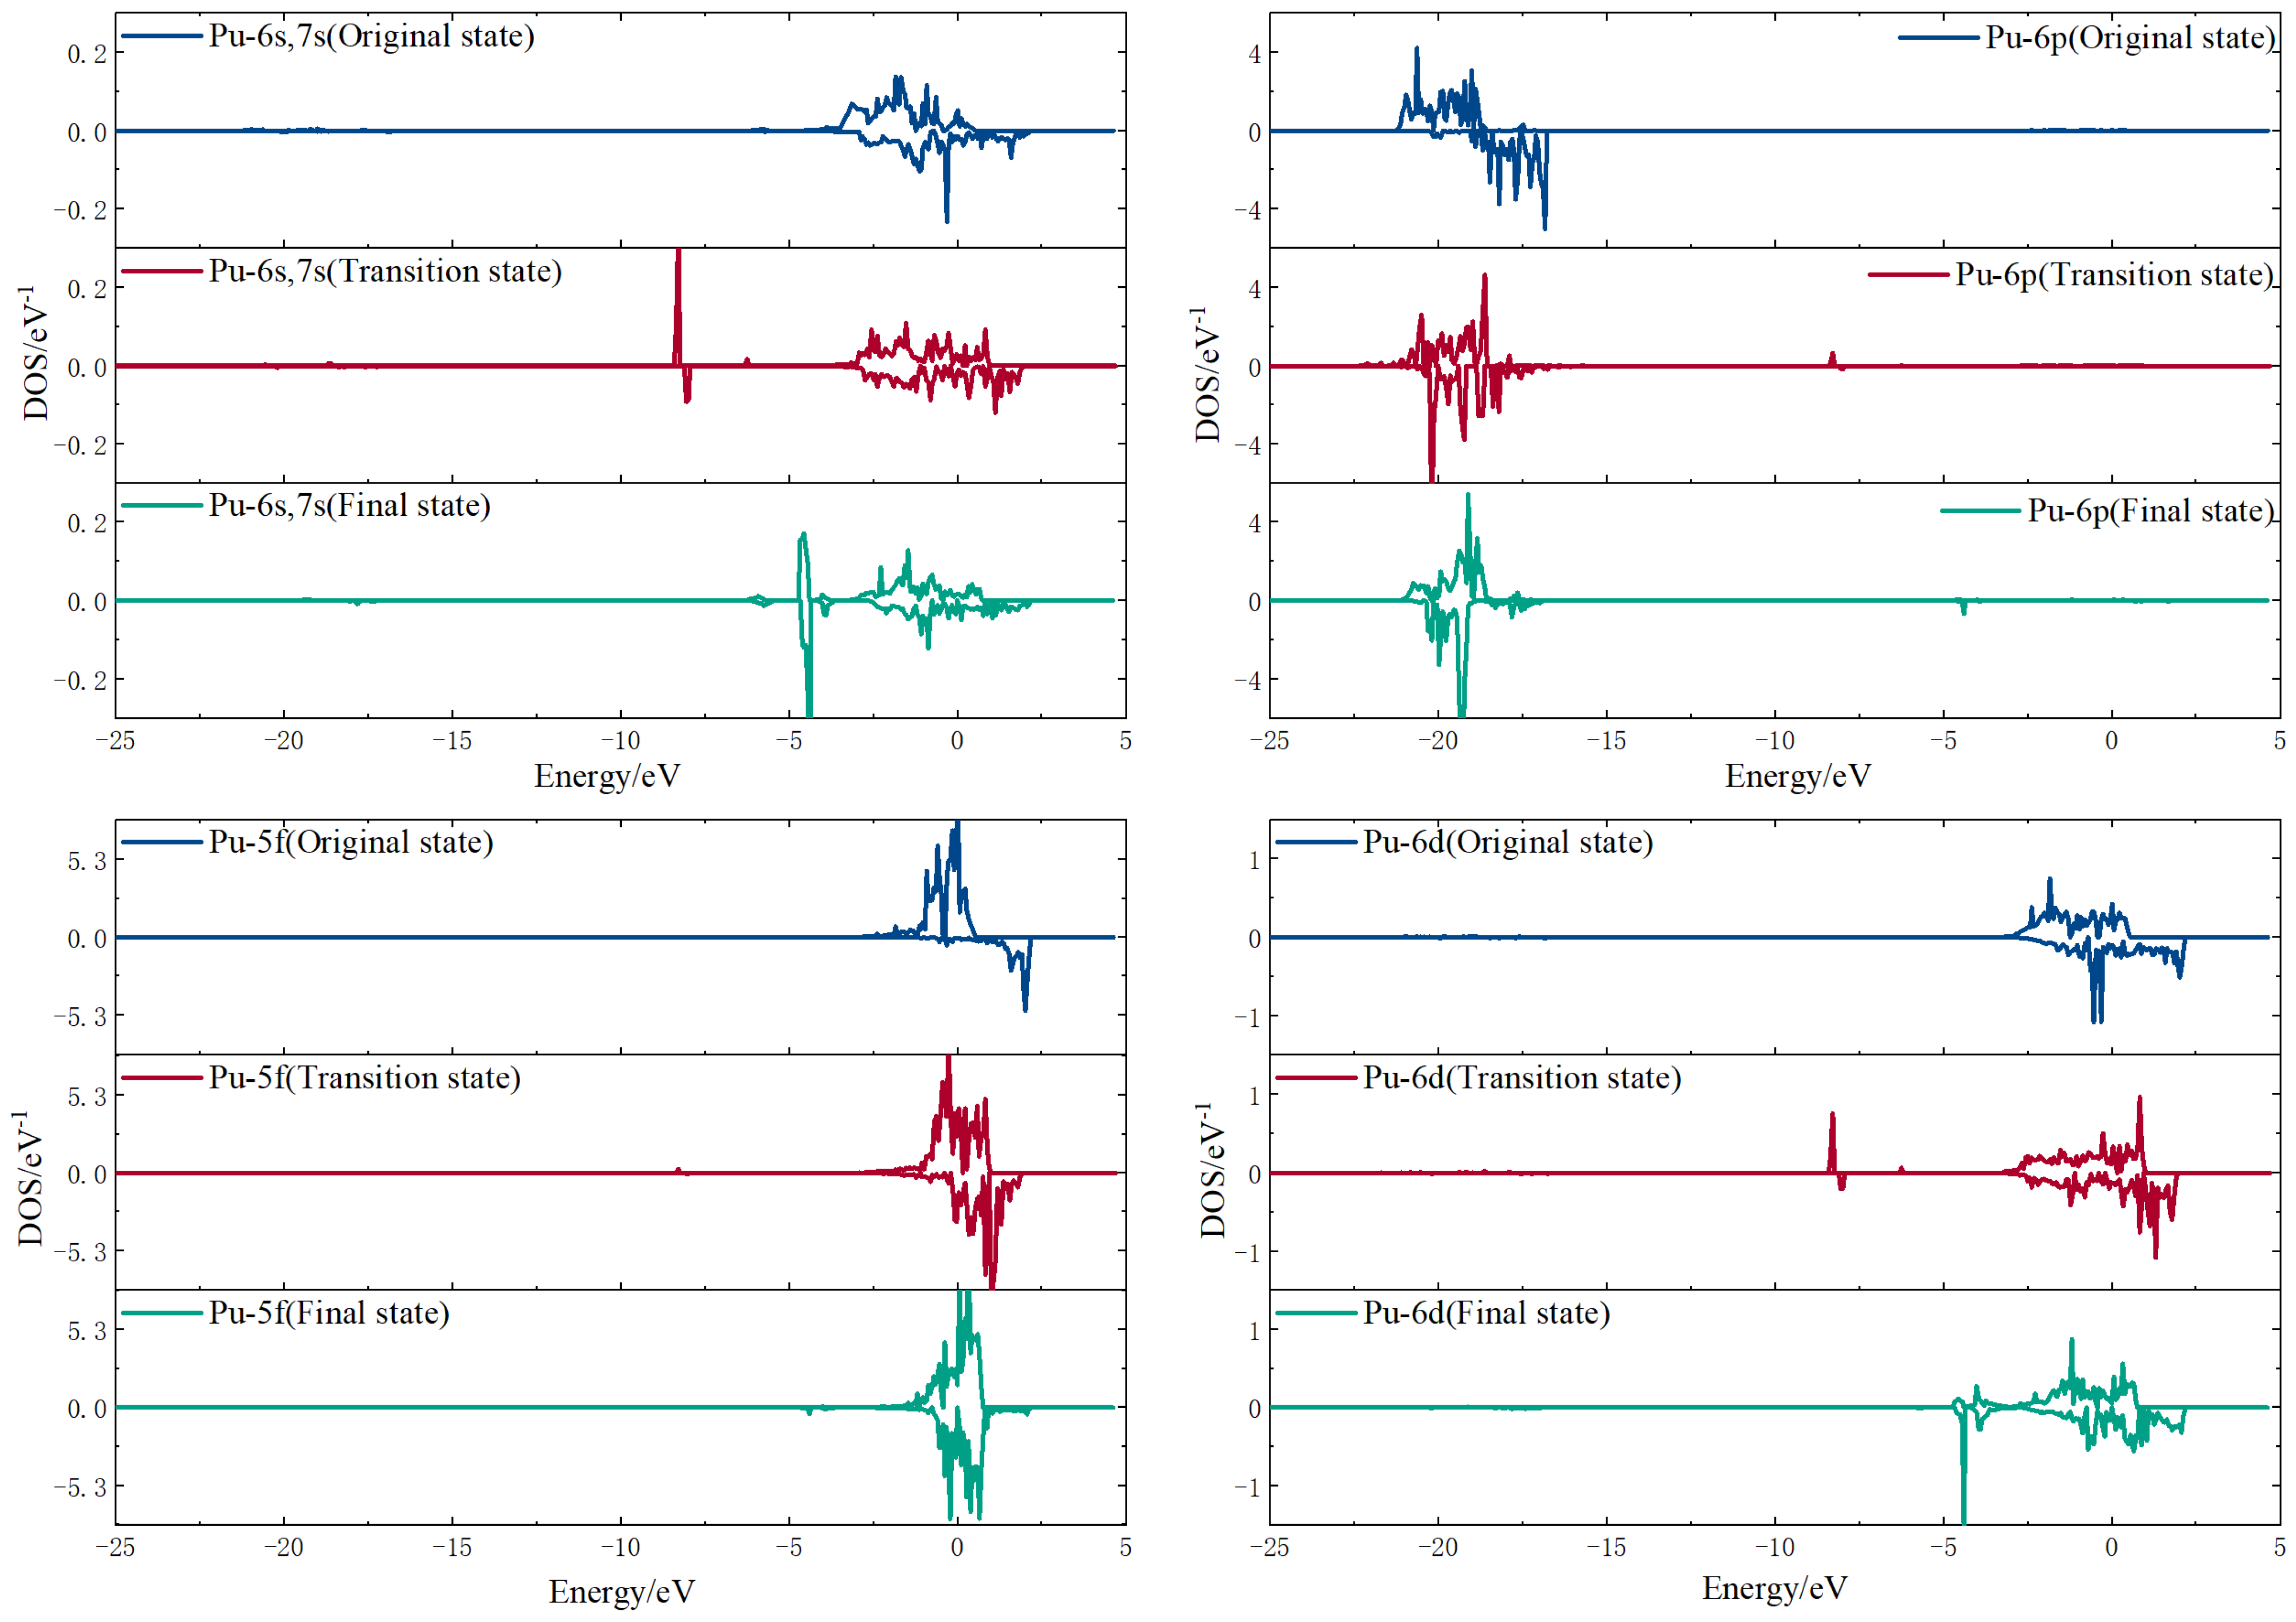
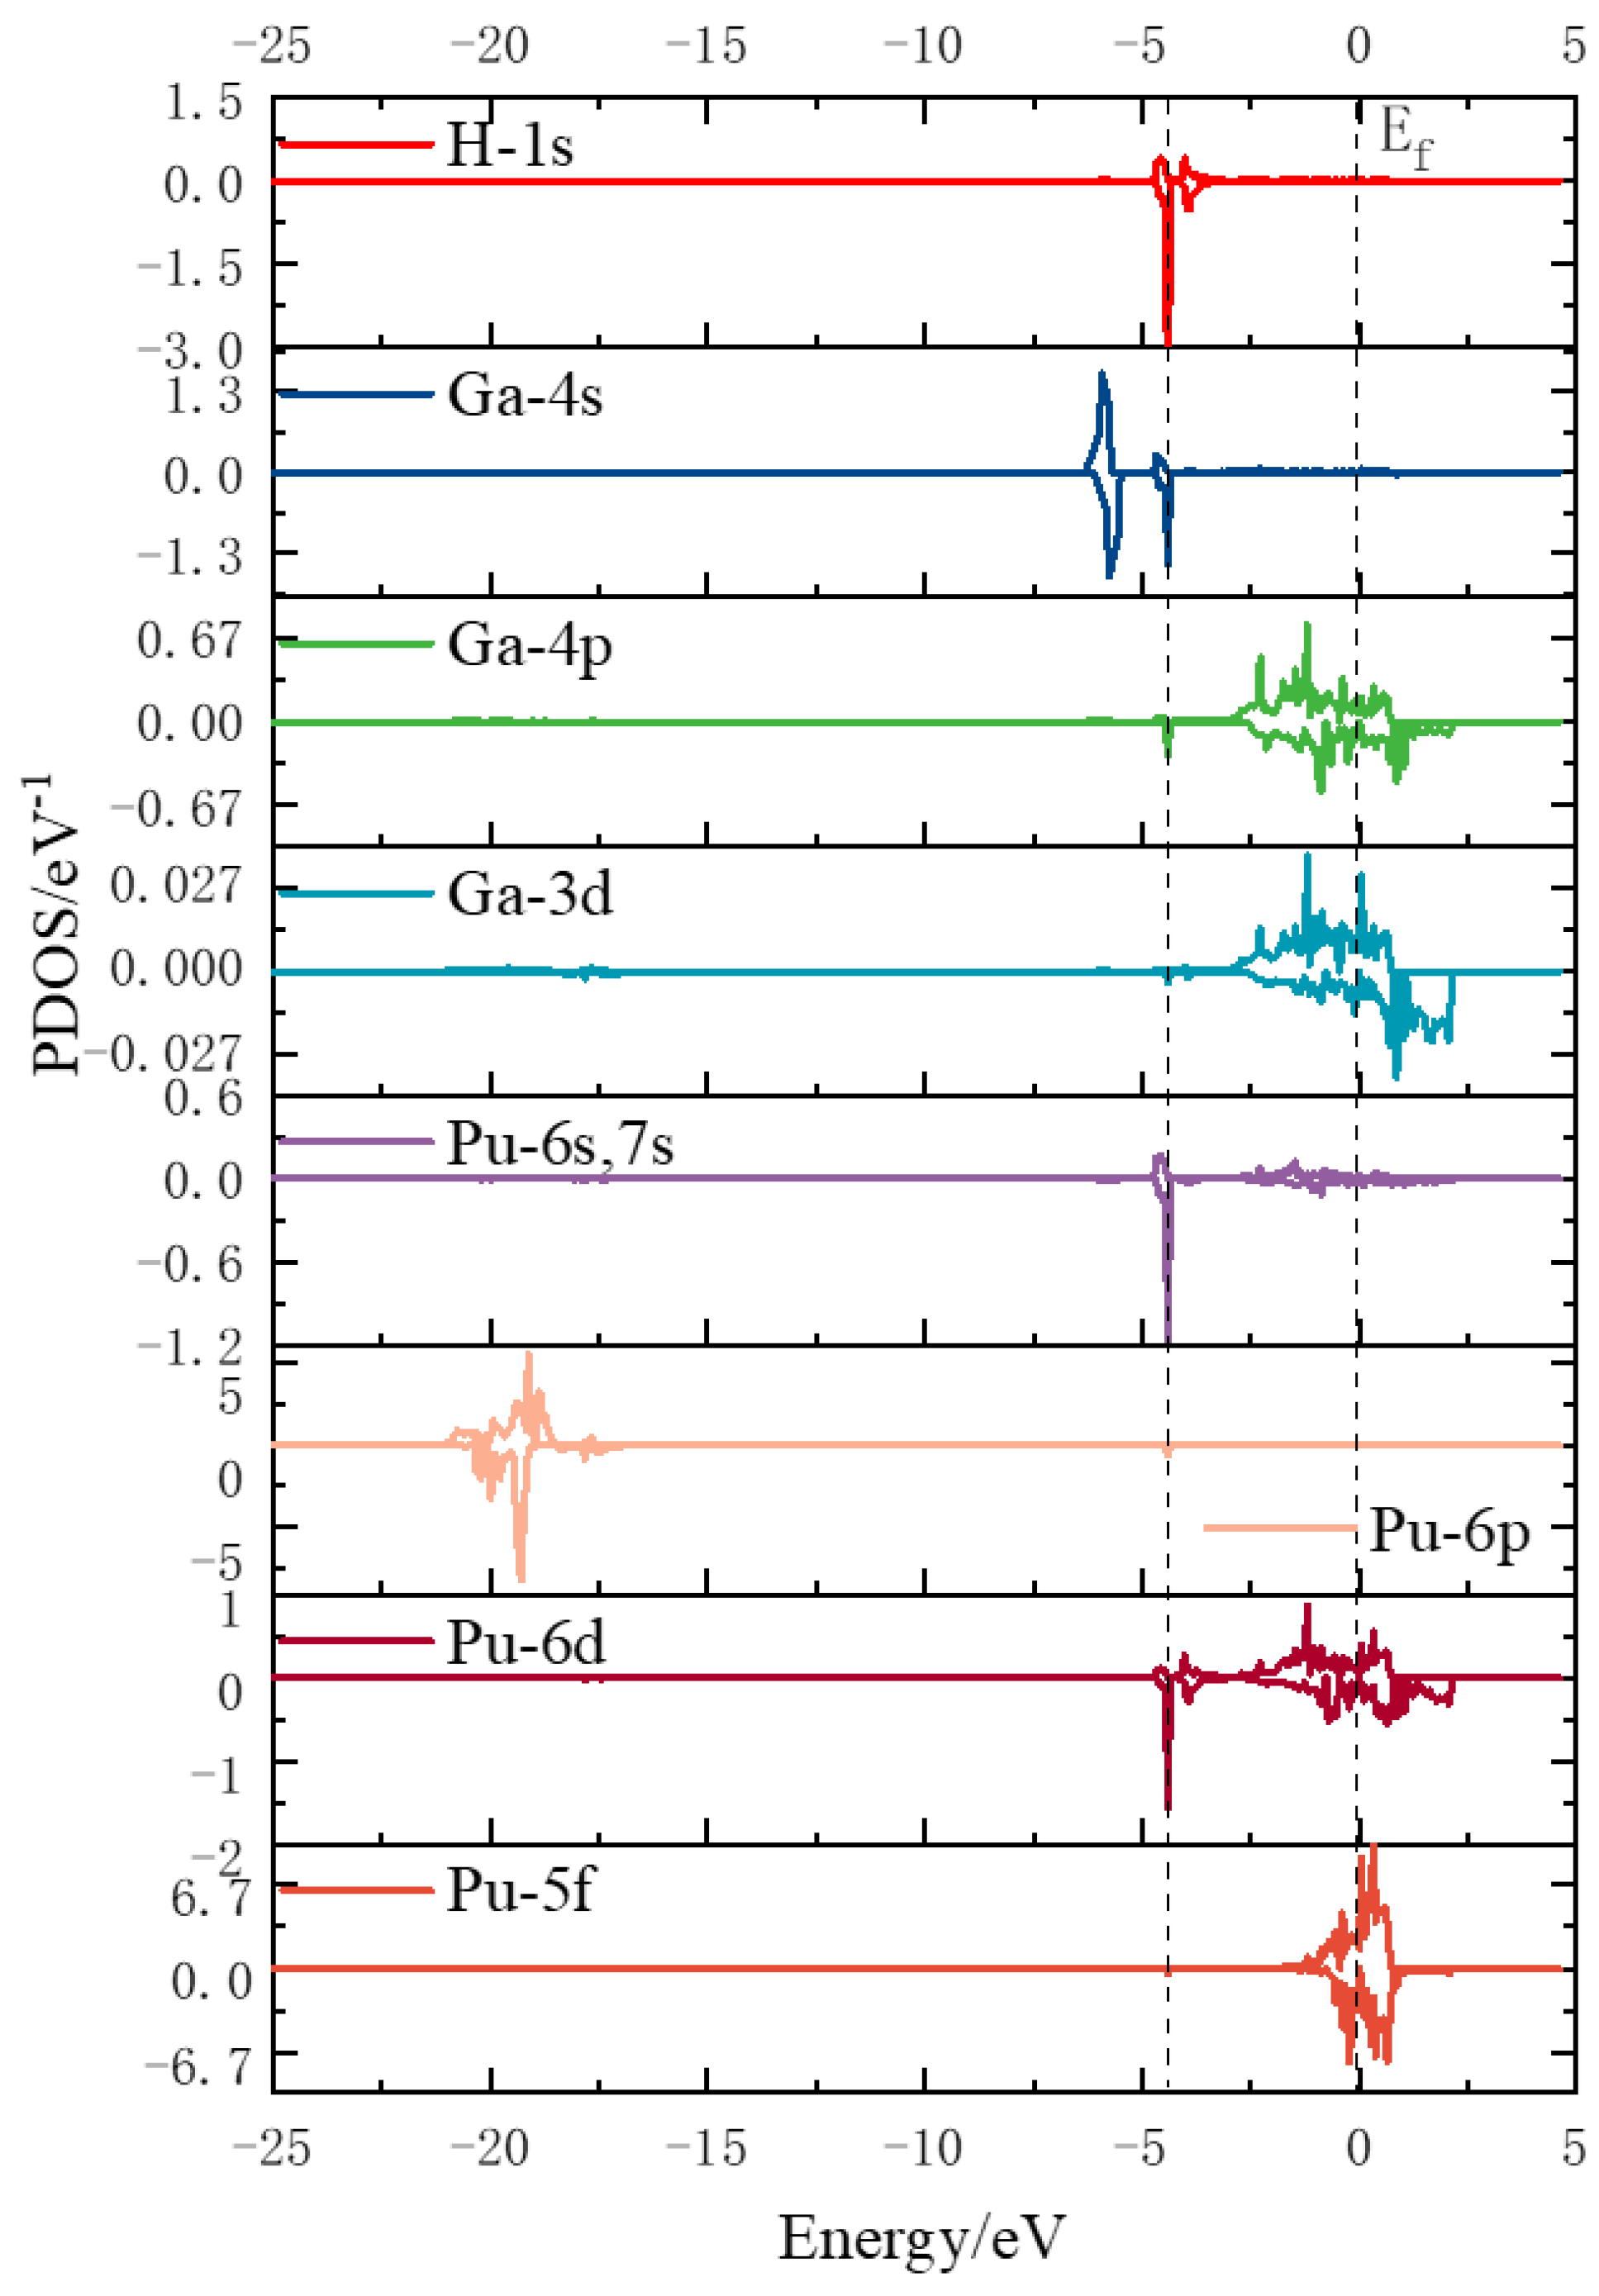
3.3.2. Electron Density of States Analysis

To further investigate the microscopic interactions between hydrogen atoms and surface atoms of the plutonium–gallium system, the most stable configuration for hydrogen adsorption (H-h-hor1) was selected, and its density of states was calculated and analyzed. The split-wave density of states is shown in Figure 5, where a hydrogen atom and the nearest plutonium and gallium atoms are selected.
Analyzing the density of states of the stable adsorption configuration H-h-hor1, it can be seen that the density of states information is mainly distributed around −22 eV–12 eV and −7 eV–5 eV, and the intensity of the 5f orbital peak of plutonium atoms near the Fermi energy level is larger and dominant. The density of states of hydrogen atoms is distributed near the Fermi energy level, and the intensity of their peaks is small, as can be seen in Figure 6B, which is 100 times different from the intensity of the peaks of other atoms and can be presumed to be weakly interacting with the surface. By comparing the density of fractional states between the clean surface and adsorbed surface, Pu-6p orbitals and Ga-4s orbitals are far away from the Fermi energy level, and the change of electronic states before and after is not obvious. The Ga-4p orbital near the Fermi energy level shows a weak spike change and overlaps with the electronic state of the hydrogen atom, indicating that the 1s orbital of the hydrogen molecule interacts with the 4p orbital of the gallium atom. It can also be seen that the 6d orbital of the plutonium atom also shows a weak spike change and the surface 6d orbital is also involved in the interaction with the hydrogen molecule. In general, when physisorption occurs, the hydrogen molecules interact with the surface to a weak extent, the density of states does not change significantly before and after adsorption, and no new density of states peaks are generated.

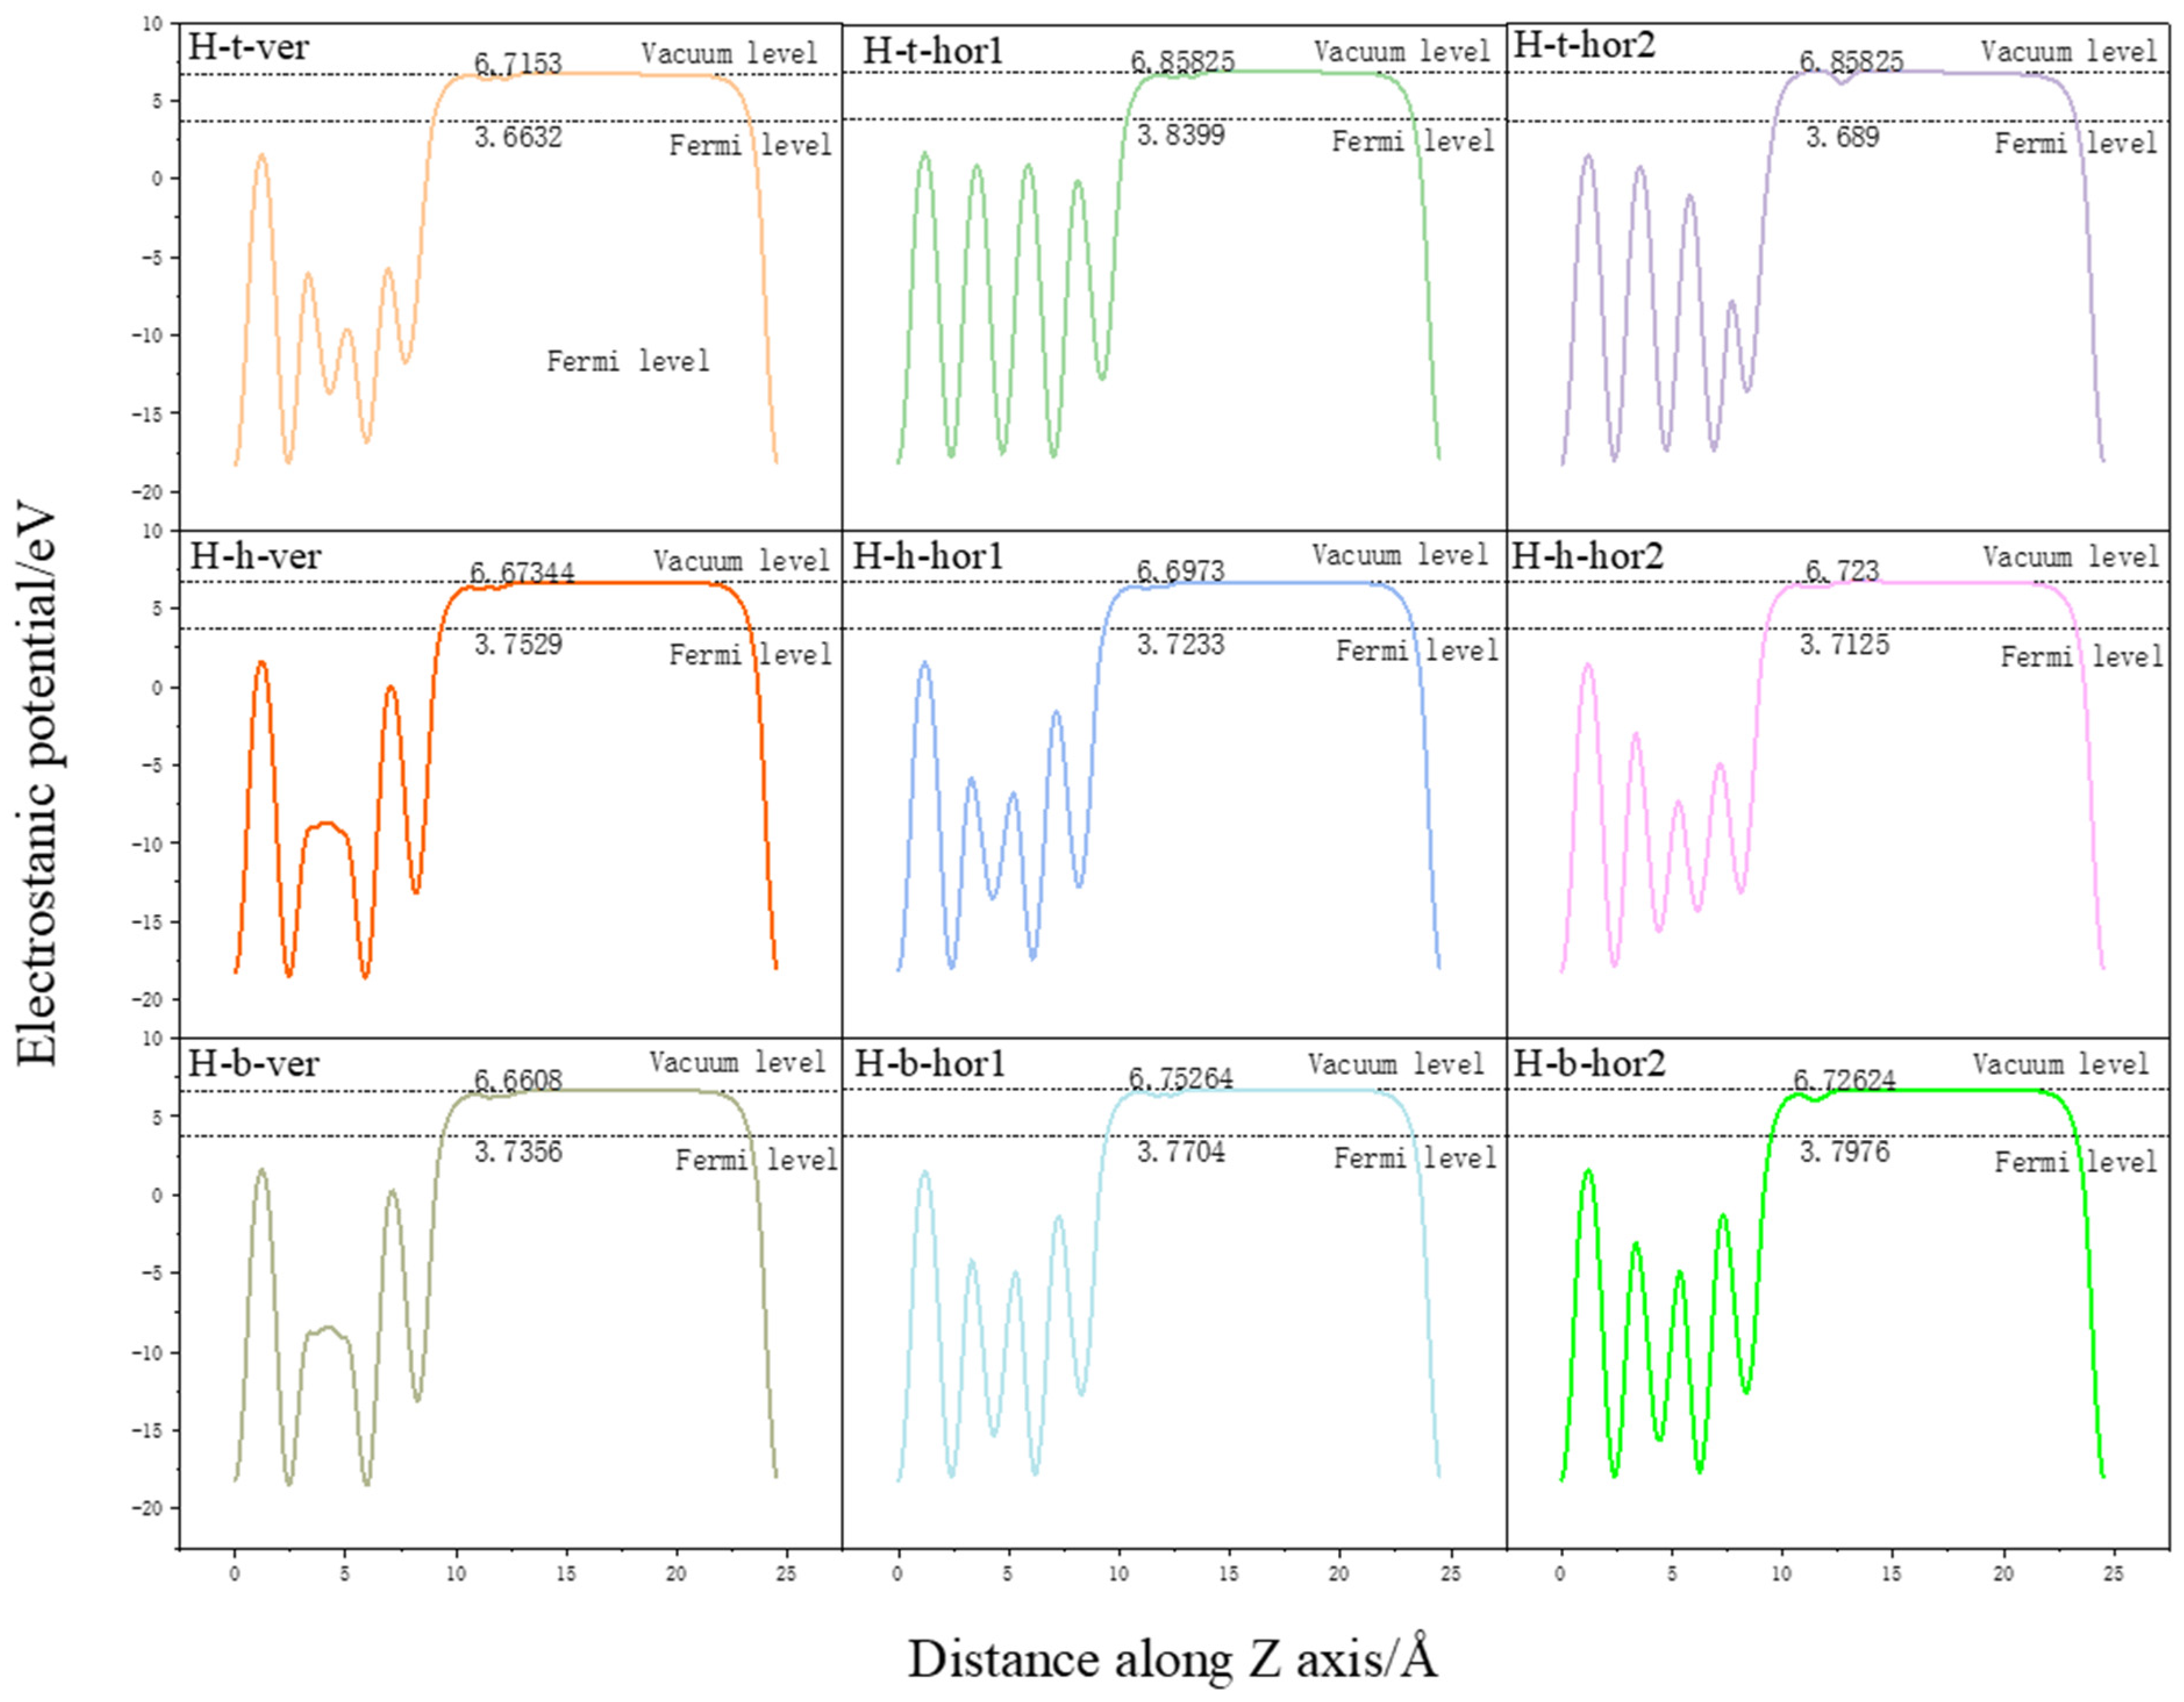
3.4. Surface Power Function Analysis

The work function, also known as the work function, is the minimum energy required to move an electron from the interior of a solid to the surface. It is the energy difference between the vacuum electrostatic potential and the Fermi energy level at an infinite distance from the outside of the metal and represents the ability of electrons to escape to the surface of the metal, calculated as follows.
Φ   = E vacuum   -   E fermi
where Φ, Evacuum, and EFermi denote the work function, vacuum level, and Fermi level, respectively, in eV.
We analyzed the changes in the surface work function of the pure Pu–Ga system and the surface work function before and after the adsorption of hydrogen molecules, and the calculated results are shown in Table 3. The work functions of each configuration are shown in Figure 7. There is no experimental data available regarding the surface function of Pu, and the work function of its neighboring element uranium is in the range of 3.63 eV–3.90 eV [20]. Wei Hongyuan et al. [21] calculated the work function for the bare surface of δ-Pu(100) as 4.365 eV, and Atta-Fynn et al. [4] calculated the work function of the δ-Pu(111) slab as 3.39 eV. The surface work function of the Pu–Ga system calculated in this paper is 2.9895 eV based on the substitution of the δ-Pu surface doped with certain Ga atoms, and the obtained surface work function is 2.9895 eV. Considering the different calculation methods and calculation models, the above work function calculation differences are reasonable. After the adsorption of hydrogen molecules, the surface function changed to a certain extent. The adsorption of a more stable hole–site adsorption surface function increased to a certain extent, while the surface function of other adsorption configurations decreased, but the changes were small, all within 0.1 eV. The reason for the change is due to the charge transfer between hydrogen molecules and the surface of the plutonium–gallium system; electrons are transferred from the surface of the plutonium–gallium system to hydrogen molecules, thus forming a surface dipole moment from the surface to hydrogen molecules, which is the fundamental reason for the change of surface function. The small amount of electron transfer from hydrogen molecules to the surface leads to a small change in the surface function.

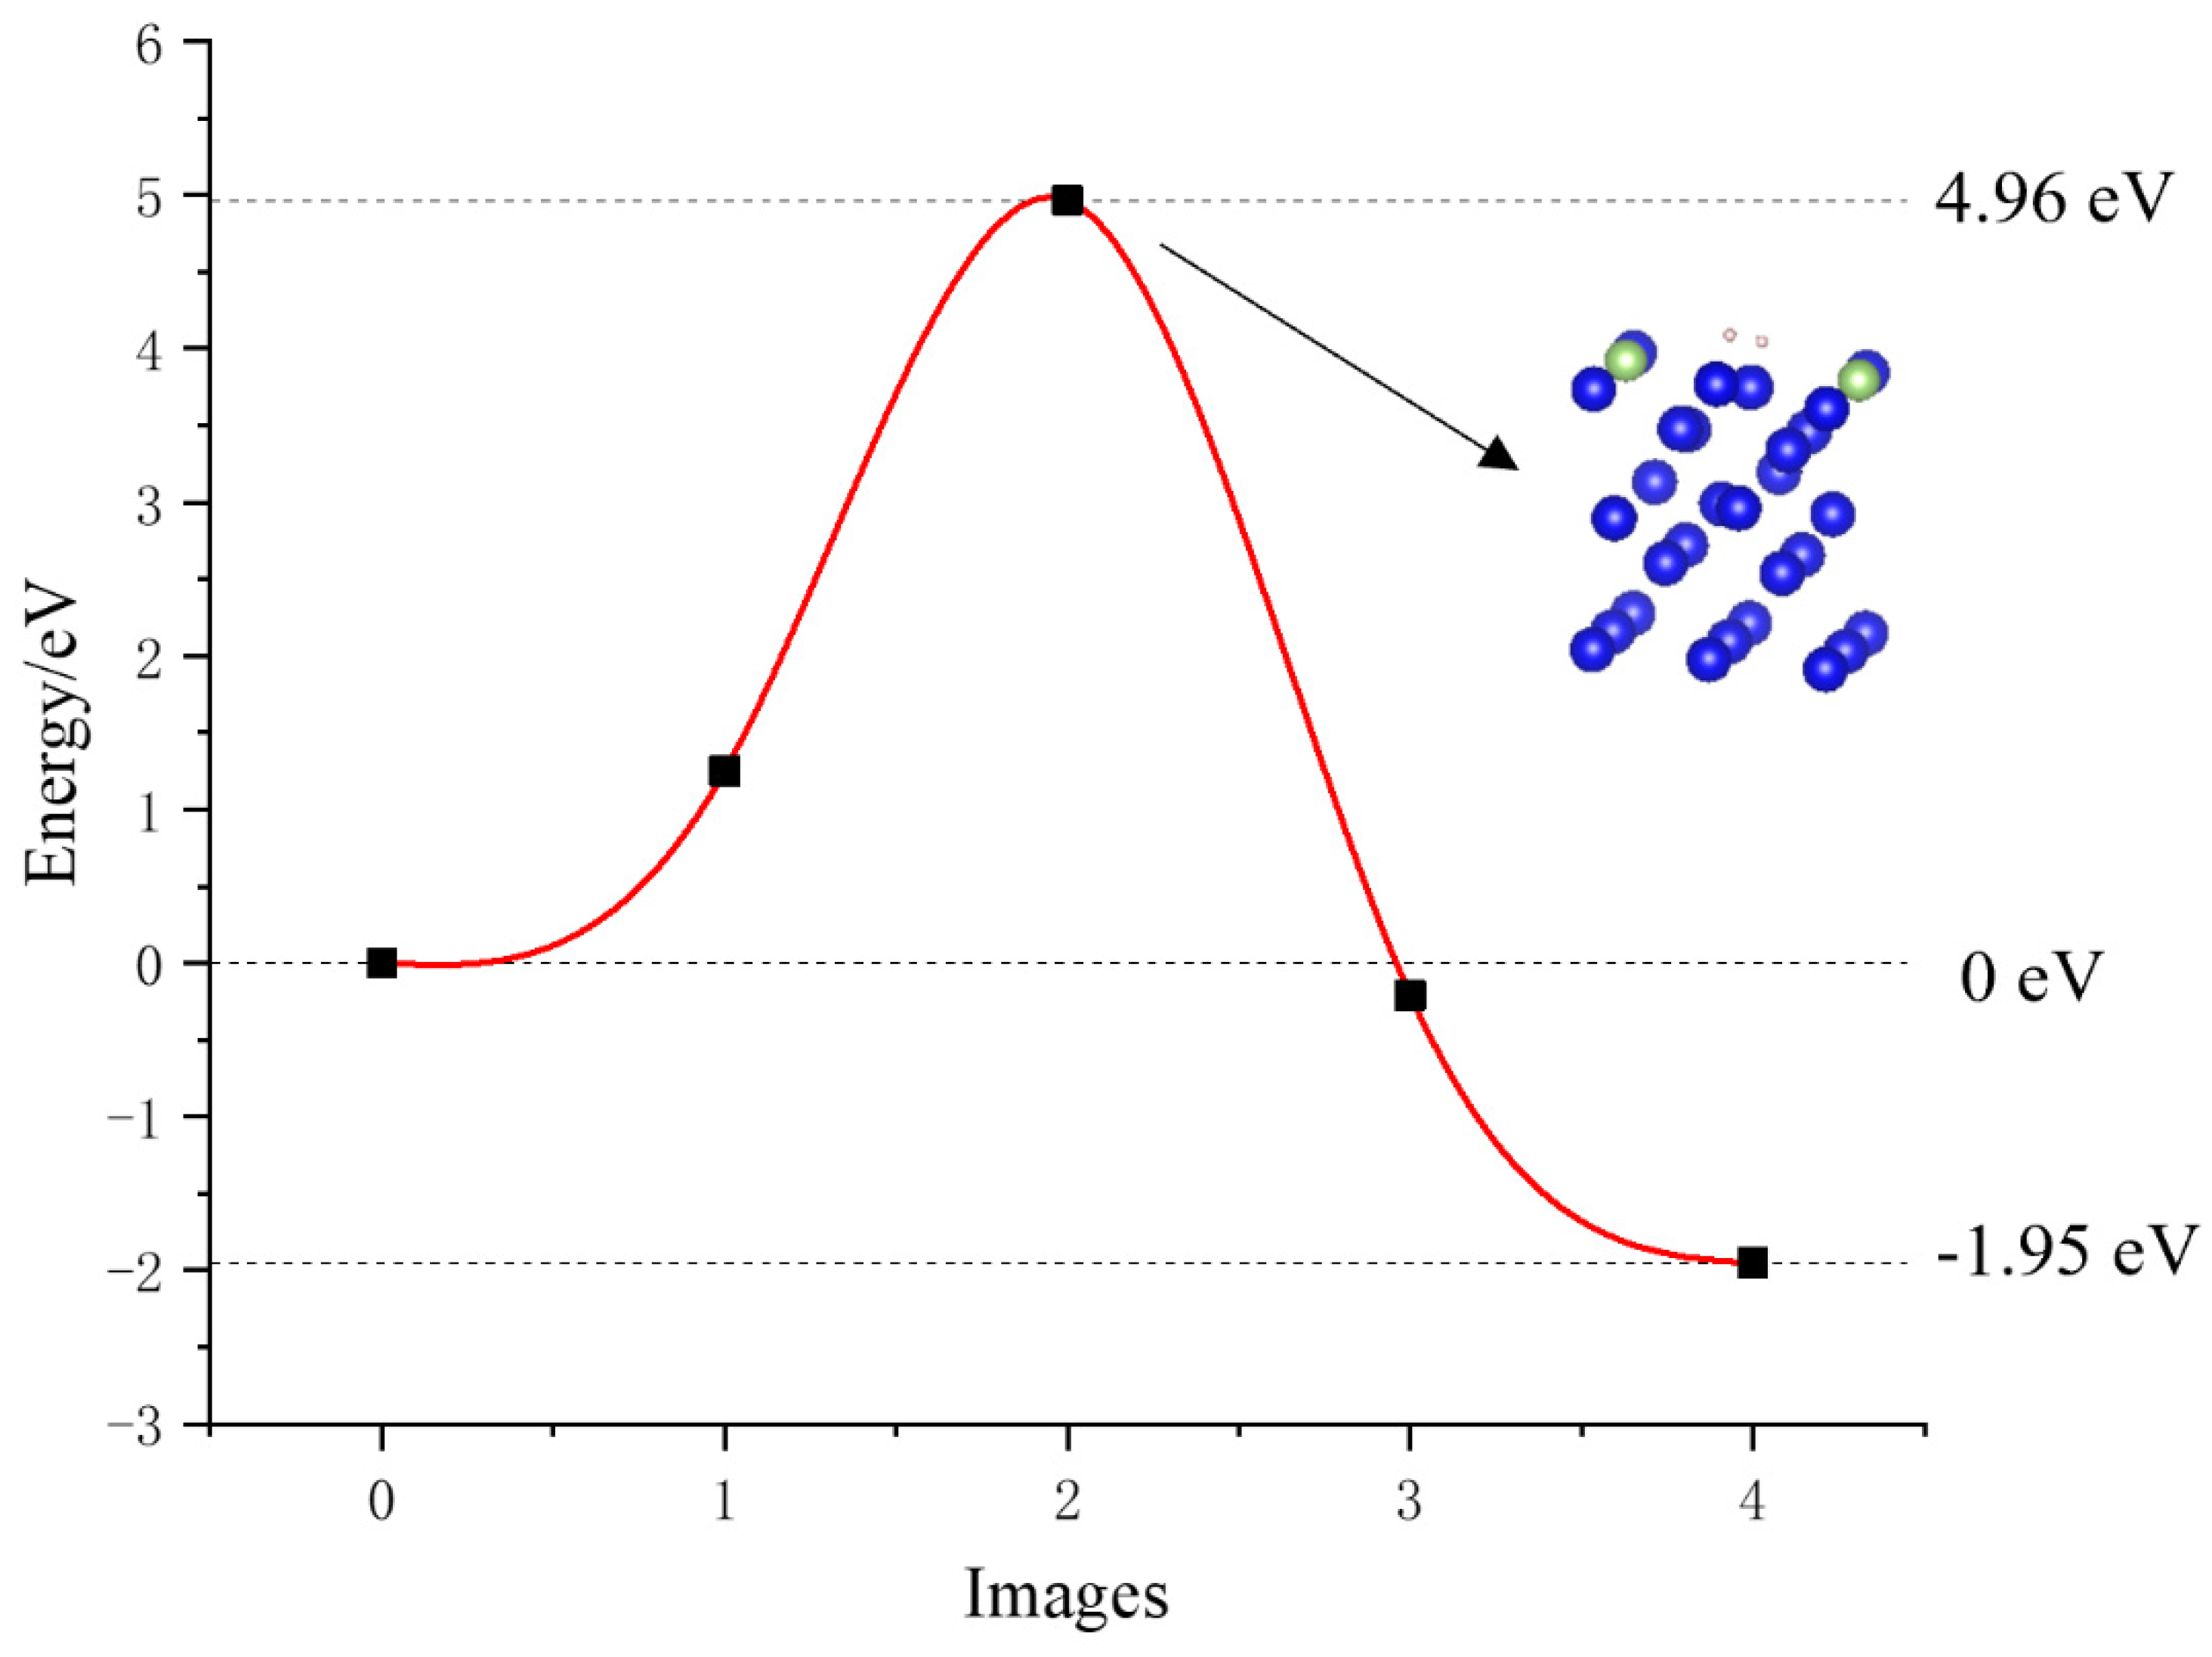
3.5. Dissociation of Hydrogen on the Surface of the Plutonium–Gallium System

As can be seen from the above analysis, the adsorption of hydrogen on the plutonium–gallium system is physical adsorption; the H–H bond of the hydrogen molecule is not broken, and no new chemical bond is formed with the surface. In practice, hydrogen can cause hydrogen etching on the surface, the essence of which is the dissociation of hydrogen molecules into hydrogen atoms to form chemisorption with the surface; therefore, it is important to study the dissociation of hydrogen on the plutonium–gallium system. Based on the transition state search [22,23] algorithm performed, the transition state and dissociation potential were finally obtained.
The stable adsorption conformation H-h-ver was selected as the initial conformation for the dissociative adsorption of hydrogen molecules. On the basis of this stable conformation, the distance between the two hydrogen atoms in the hydrogen molecule was artificially expanded. Then, the structure was optimized, and the optimized conformation showed that the two hydrogen atoms were no longer combined but adsorbed onto the surface separately. This conformation was the final state for the dissociative adsorption of hydrogen, as shown in Figure 8.
The calculated minimum energy path of hydrogen molecules on the surface of the plutonium–gallium system is shown in Figure 9. The hydrogen molecule is first cleaved into two hydrogen atoms, a process that requires energy across 4.96 eV, and then the two cleaved hydrogen atoms are, respectively, chemisorbed on the surface, which reduces the energy of the whole system by 1.95 eV. From the dissociation process, the H–H bond length in the hydrogen molecule gradually increases, and the transition state in which the H–H bond length increases from 0.757 Å to 0.959 Å. By the end state, the two hydrogen atoms are completely dissociated, and the distances to the nearest plutonium atom are 2.239 Å and 2.241 Å, respectively, while the distance between the two hydrogen atoms is 2.629 Å at this time, indicating that the hydrogen atoms are stably adsorbed on the surface, and strong interactions occur.
To further study the dissociation process of hydrogen molecules on the surface, the density of states of the initial, transition, and final states were calculated by selecting a hydrogen atom and the nearest plutonium and gallium atoms, respectively. The comparative diagrams of the density of states for the three states are shown in Figure 10 and Figure 11.
For the hydrogen atom, the intensity of the initial state density peak is small, and the intensity of the peak increases in the transition state. Two significant spikes appear at −4 eV in the 1s orbitals of the hydrogen atom at the end state, while the density of the electronic states near the Fermi energy level decreases compared to the transition state. For the gallium atom, its 4s orbital and 4p orbital both form a spike at −4 eV, and its 3d orbital does not change much before and after, indicating that the H1s-Ga4s-Ga4p orbital hybridization between the hydrogen atom and the gallium atom creates a chemical bond with strong interaction. For the plutonium atom, its 6p and 5f electronic density of state does not change much, and there is only a weak peak at −4 eV, while its 6s, 7s, and 6d orbitals produce an obvious sharp peak at −4 eV. This indicates that the hydrogen and plutonium atoms are mainly hybridized by the H1s-Pu6s and 7s-Pu6d orbitals to form stable chemical bonds. Figure 12 show the fractional wave density of states after the dissociation of hydrogen molecules, which can visualize the orbital hybridization of hydrogen atoms with the surface. The 1s orbital of the hydrogen atom interacts with the 4s and 4p orbitals of the gallium atom to create a chemical bond. The 1s orbital of the hydrogen atom interacts with the 6s, 7s, and 6d orbitals of the plutonium atom to produce a chemical bond.

4. Conclusions

In this paper, the adsorption and dissociation behaviors of H2 molecules on the surface of a plutonium–gallium system were calculated using the first-principles approach. The calculation results show that:
The hydrogen molecules interact with the surface to a lesser extent, and the stability of their adsorption is in the order of hollow position > bridge position > top position. The hydrogen molecules are placed parallel > perpendicular and the most stable adsorption configuration is hole–site parallel adsorption (H-b-hor1). Bader charge analysis shows that hydrogen molecules mainly interact with the first layer of atoms on the surface. The flow of electrons is mainly transferred from the surface to the hydrogen molecules, and the amount of transfer is small. The electron density of states before and after adsorption do not change significantly, and no new density of states peaks are generated. The surface power function shows a certain increase in the adsorption power function of the more stable adsorption holes and a certain decrease in the surface power function of the other adsorption configurations, but the changes are small, all within 0.1 eV.
When the hydrogen molecule overcomes the energy barrier of 4.96 eV, the hydrogen molecule first cleaves into two hydrogen atoms, and then the two cleaved hydrogen atoms are chemisorbed on the surface separately, which reduces the energy of the whole system by 1.95 eV. Analyzing the density of states after dissociation, the 1s orbital of the hydrogen atom hybridizes with the 4s and 4p orbitals of the gallium atom and the 6s, 7s, and 6d orbitals of the plutonium atom to form chemical bonding. The hydrogen atom adsorbs on the surface of the plutonium–gallium system in the form of chemisorption.

Author Contributions

Writing—original draft, L.L.; writing—review and editing, M.Z.; investigation, H.H.; supervision, T.L.; resources, H.S.; visualization, B.X. All authors have read and agreed to the published version of the manuscript.

Funding

This research received no external funding.

Institutional Review Board Statement

Not applicable.

Informed Consent Statement

Informed consent was obtained from all subjects involved in the study.

Data Availability Statement

Not applicable.

Conflicts of Interest

The authors declare no conflict of interest.

References

  1. Li, G. Nuclear Fuel; Wu, S., Ed.; Chemical Industry Press: Beijing, China, 2007; p. 526. [Google Scholar]
  2. Hecker, S.S. Plutonium—An Element Never at Equilibrium. Metall. Mater. Trans. A 2008, 39, 1585–1592. [Google Scholar] [CrossRef]
  3. Shim, J.H.; Haule, K.; Kotliar, G. Fluctuating valence in a correlated solid and the anomalous properties of δ-plutonium. Nature 2007, 446, 513–516. [Google Scholar] [CrossRef] [PubMed] [Green Version]
  4. Atta-Fynn, R.; Ray, A.K. A first principles study of the adsorption and dissociation of CO2 on the δ-Pu (111) surface. Eur. Phys. J. B Condens. Matter Complex Syst. 2009, 70, 171–184. [Google Scholar] [CrossRef]
  5. Goldman, N.; Morales, M.A. A First-Principles Study of Hydrogen Diffusivity and Dissociation on δ-Pu (100) and (111) Surfaces. J. Phys. Chem. C 2017, 121, 17950–17957. [Google Scholar] [CrossRef]
  6. Qi, C.B.; Wang, T.; Li, R.S.; Wang, J.T.; Qin, M.A.; Tao, S.H. First-principles study of co-adsorption behavior of O2 and CO2 molecules on δ-Pu(100) surface. Chin. Phys. B 2021, 30, 026601. [Google Scholar] [CrossRef]
  7. Cooper, N.G. Challenges in plutonium science. Los Alamos Sci. 2000, 26, 24–28. [Google Scholar]
  8. Hecker, S.S.; Martz, J.C. Aging of Plutonium and Its Alloys. Los Alamos Sci. 2000, 26, 238–243. [Google Scholar]
  9. Wick, O.J. Plutonium Handbook: A Guide to the Technology, 1st ed.; Gordon & Breach Science Publishers: Philadelphia, PA, USA, 1967; p. 2. [Google Scholar]
  10. Qi, C.; Wang, T.; Tao, S.; Qin, M. Research progress on surface corrosion of plutonium and its compounds. Rare Met. Mater. Eng. 2021, 6, 2008–2016. [Google Scholar]
  11. Sadigh, B.; Wolfer, W.G. Gallium stabilization of δ-Pu: Density-functional calculations. Phys. Rev. B 2005, 72, 205122. [Google Scholar] [CrossRef]
  12. Luo, W.; Meng, D.; Li, G.; Chen, H. Electronic Structure and Formation Heat of Pu3M and PuM3 (M = Ga, In, Sn and Ge) Compounds. Acta Phys.Chim. Sin. 2008, 24, 388–392. [Google Scholar] [CrossRef]
  13. Kresse, G.; Hafner, J. Ab initio molecular dynamics for open-shell transition metals. Phys. Rev. B 1993, 48, 13115–13118. [Google Scholar] [CrossRef] [PubMed]
  14. Kresse, G.G.; Furthmüller, J.J. Efficient Iterative Schemes for Ab Initio Total-Energy Calculations Using a Plane-Wave Basis Set. Phys. Rev. B 1996, 54, 11169. [Google Scholar] [CrossRef] [PubMed]
  15. Blochl, P.E. Projector augmented-wave method. Phys. Rev. B 1994, 50, 17953–17979. [Google Scholar] [CrossRef] [Green Version]
  16. Kresse, G.; Joubert, D. From ultrasoft pseudopotentials to the projector augmented-wave method. Phys. Rev. B 1999, 59, 1758–1775. [Google Scholar] [CrossRef]
  17. Perdew, J.P.; Burke, K.; Ernzerhof, M. Generalized Gradient Approximation Made Simple. Phys. Rev. Lett. 1996, 77, 3865. [Google Scholar] [CrossRef] [Green Version]
  18. Monkhorst, H.J.; Pack, J.D. Special points for Brillouin-zone integrations. Phys. Rev. B 1976, 13, 5188–5192. [Google Scholar] [CrossRef]
  19. Jomard, G.; Bottin, F.; Geneste, G. Water adsorption and dissociation on the PuO2(110) surface. J. Nucl. Mater. 2014, 451, 28–34. [Google Scholar] [CrossRef]
  20. Hao, Y.G.; Eriksson, O.; Fernando, G.W.; Cooper, B.R. Surface electronic structure of gamma -uranium. Phys. Rev. B 1993, 47, 6680–6684. [Google Scholar] [CrossRef]
  21. Wei, H.; Hu, R.; Xiong, X.; Wang, G.; Song, H.; Luo, S. A first-principles study of H2 adsorption on δ-Pu(100) surface. J. Mol. Sci. 2010, 26, 5. [Google Scholar]
  22. Henkelman, G.; Jónsson, H. Improved tangent estimate in the nudged elastic band method for finding minimum energy paths and saddle points. J. Chem. Phys. 2000, 113, 9978–9985. [Google Scholar] [CrossRef] [Green Version]
  23. Henkelman, G.; Uberuaga, B.P.; Jónsson, H. A climbing image nudged elastic band method for finding saddle points and minimum energy paths. J. Chem. Phys. 2000, 113, 9901–9904. [Google Scholar] [CrossRef] [Green Version]
Figure 1. (A) Single-cell structure. (B) Surface model. (C) Plutonium–gallium system model. δ-Pu single-cell structure, δ-Pu(100) surface model, and plutonium–gallium system model.
Coatings 12 01019 g001
Figure 2. Different initial adsorption configurations of H2 on the surface of the plutonium–gallium system (top view).
Coatings 12 01019 g002
Figure 3. Stable adsorption configurations of H2 on the surface of plutonium–gallium system after optimization (for each configuration, the standard view is on the left and the c-axis view is on the right). H: hydrogen molecule; t: top position; h: hollow position; b: bridge position.
Coatings 12 01019 g003
Figure 4. Differential charge density of H-t-hor and H-b-ver configurations. (A) H-h-hor1. (B) H-b-ver. Note: The electron density equivalent surface is 6 e/nm3; yellow indicates an increase in charge density, and gray indicates a decrease in charge density.
Coatings 12 01019 g004
Figure 5. Fractional wave density of states for the H-h-hor1 configuration.
Coatings 12 01019 g005
Figure 6. Fractional density of hydrogen gas molecules after adsorption on the surface of the plutonium–gallium system. (A) Fractional density of pure surface (B) Fractional density of hydrogen after adsorption.
Coatings 12 01019 g006
Figure 7. Variation of electrostatic potential along Z-axis for various configurations.
Coatings 12 01019 g007
Figure 8. Final-state configuration of hydrogen molecules after dissociative adsorption. (A) standard orientation of crystal shape (B) top view.
Coatings 12 01019 g008
Figure 9. Minimum energy pathway for hydrogen dissociation.
Coatings 12 01019 g009
Figure 10. Variation of density of states of hydrogen and gallium atoms.
Coatings 12 01019 g010
Figure 11. Plutonium Atomic Density of State Variation.
Coatings 12 01019 g011
Figure 12. Density of fractional wave states after dissociation of hydrogen molecules.
Coatings 12 01019 g012
Table 1. Structural parameters and energy data of the adsorption configuration of H2 on the surface of the plutonium–gallium system. (H1 and H2 represent two atoms of the hydrogen molecule).
Adsorption ConformationAdsorption Energy Eads (eV)Hydrogen Atomic Spacing RH-H (Å)Hydrogen Atom to Surface Nearest Atom DistanceNearest Distance of Hydrogen Atom to Surface
h(H1-Pu/Ga) (Å)h(H2-Pu/Ga) (Å)h(H1-Surface) (Å)h(H2-Surface) (Å)
H-tver−0.59720.75363.5184.25783.28074.0175
hor1−0.38740.75413.44794.2022.98863.7426
hor2−0.70160.75083.96534.00073.87413.9125
H-hver−0.49850.75563.97954.45672.97043.7011
hor1−1.49010.75463.87424.52082.98393.7277
hor2−0.90920.75373.65644.18323.03310.6979
H-bver−0.37250.75223.80694.25283.40914.0641
hor1−1.29540.75213.62484.37573.5184.214
hor2−0.90140.75673.13073.2872.82013.2091
Table 2. Net charge distribution after optimization of each adsorption configuration (Q1 and Q2 represent the amount of charge transferred between the two hydrogens. Qtotal = Q1 + Q2. Q1st, Q2nd, Q3rd, Q4th, and Q5th represent the total amount of transferred charge of atoms at the 1–5 layers on the surface).
ConfigurationAdsorption of Atoms in MoleculesTotal Number of Charges in Each Layer
Q1Q2QtotalQ1stQ2ndQ3rdQ4thQ5th
H20.0148−0.01480-----
Exposed surfaces---−0.0049−0.03760.15730.1914−0.3061
H-tver0.01190.00740.0193−0.28040.27470.1492−0.0859−0.0772
hor10.0420−0.01490.0271−0.2298−0.02200.09030.04960.0847
hor20.0203−0.00690.0133−0.34270.3256−0.0634−0.12040.1874
H-hver0.0382−0.00090.0372−0.1972−0.18120.6584−0.2145−0.1027
hor10.0646−0.02860.0359−0.16880.03290.2225−0.046−0.0765
hor20.02860.00550.0341−0.26940.28830.0458−0.0822−0.0169
H-bver0.01350.01170.0252−0.1566−0.16530.7305−0.2923−0.1416
hor10.01240.01130.0238−0.10180.02010.1106−0.0043−0.0485
hor20.02850.00610.0346−0.14040.12590.0261−0.05330.0068
Table 3. Variation of surface work function for different adsorption configurations (ΔΦ).
Adsorption ConformationVacuum Energy Level/eVFermi Energy Level/eVPower Letter/eVΔΦ/eV
H-t-ver6.71533.66323.05210.0626
H-t-hor16.86623.83993.02630.0368
H-t-hor26.86893.68903.07990.0903
H-h-ver6.68363.75292.9307−0.0588
H-h-hor16.69733.72332.9740−0.0155
H-h-hor26.72303.71253.01050.0210
H-b-ver6.66083.73562.9252−0.0642
H-b-hor16.74783.77042.9774−0.0120
H-b-hor26.71383.79762.9162−0.0733
Pure Surface6.78163.79212.9895-
Publisher’s Note: MDPI stays neutral with regard to jurisdictional claims in published maps and institutional affiliations.

