
Fabrication of Carboxylated Carbon Nanotube Buckypaper Composite Films for Bovine Serum Albumin Detection

 and
and 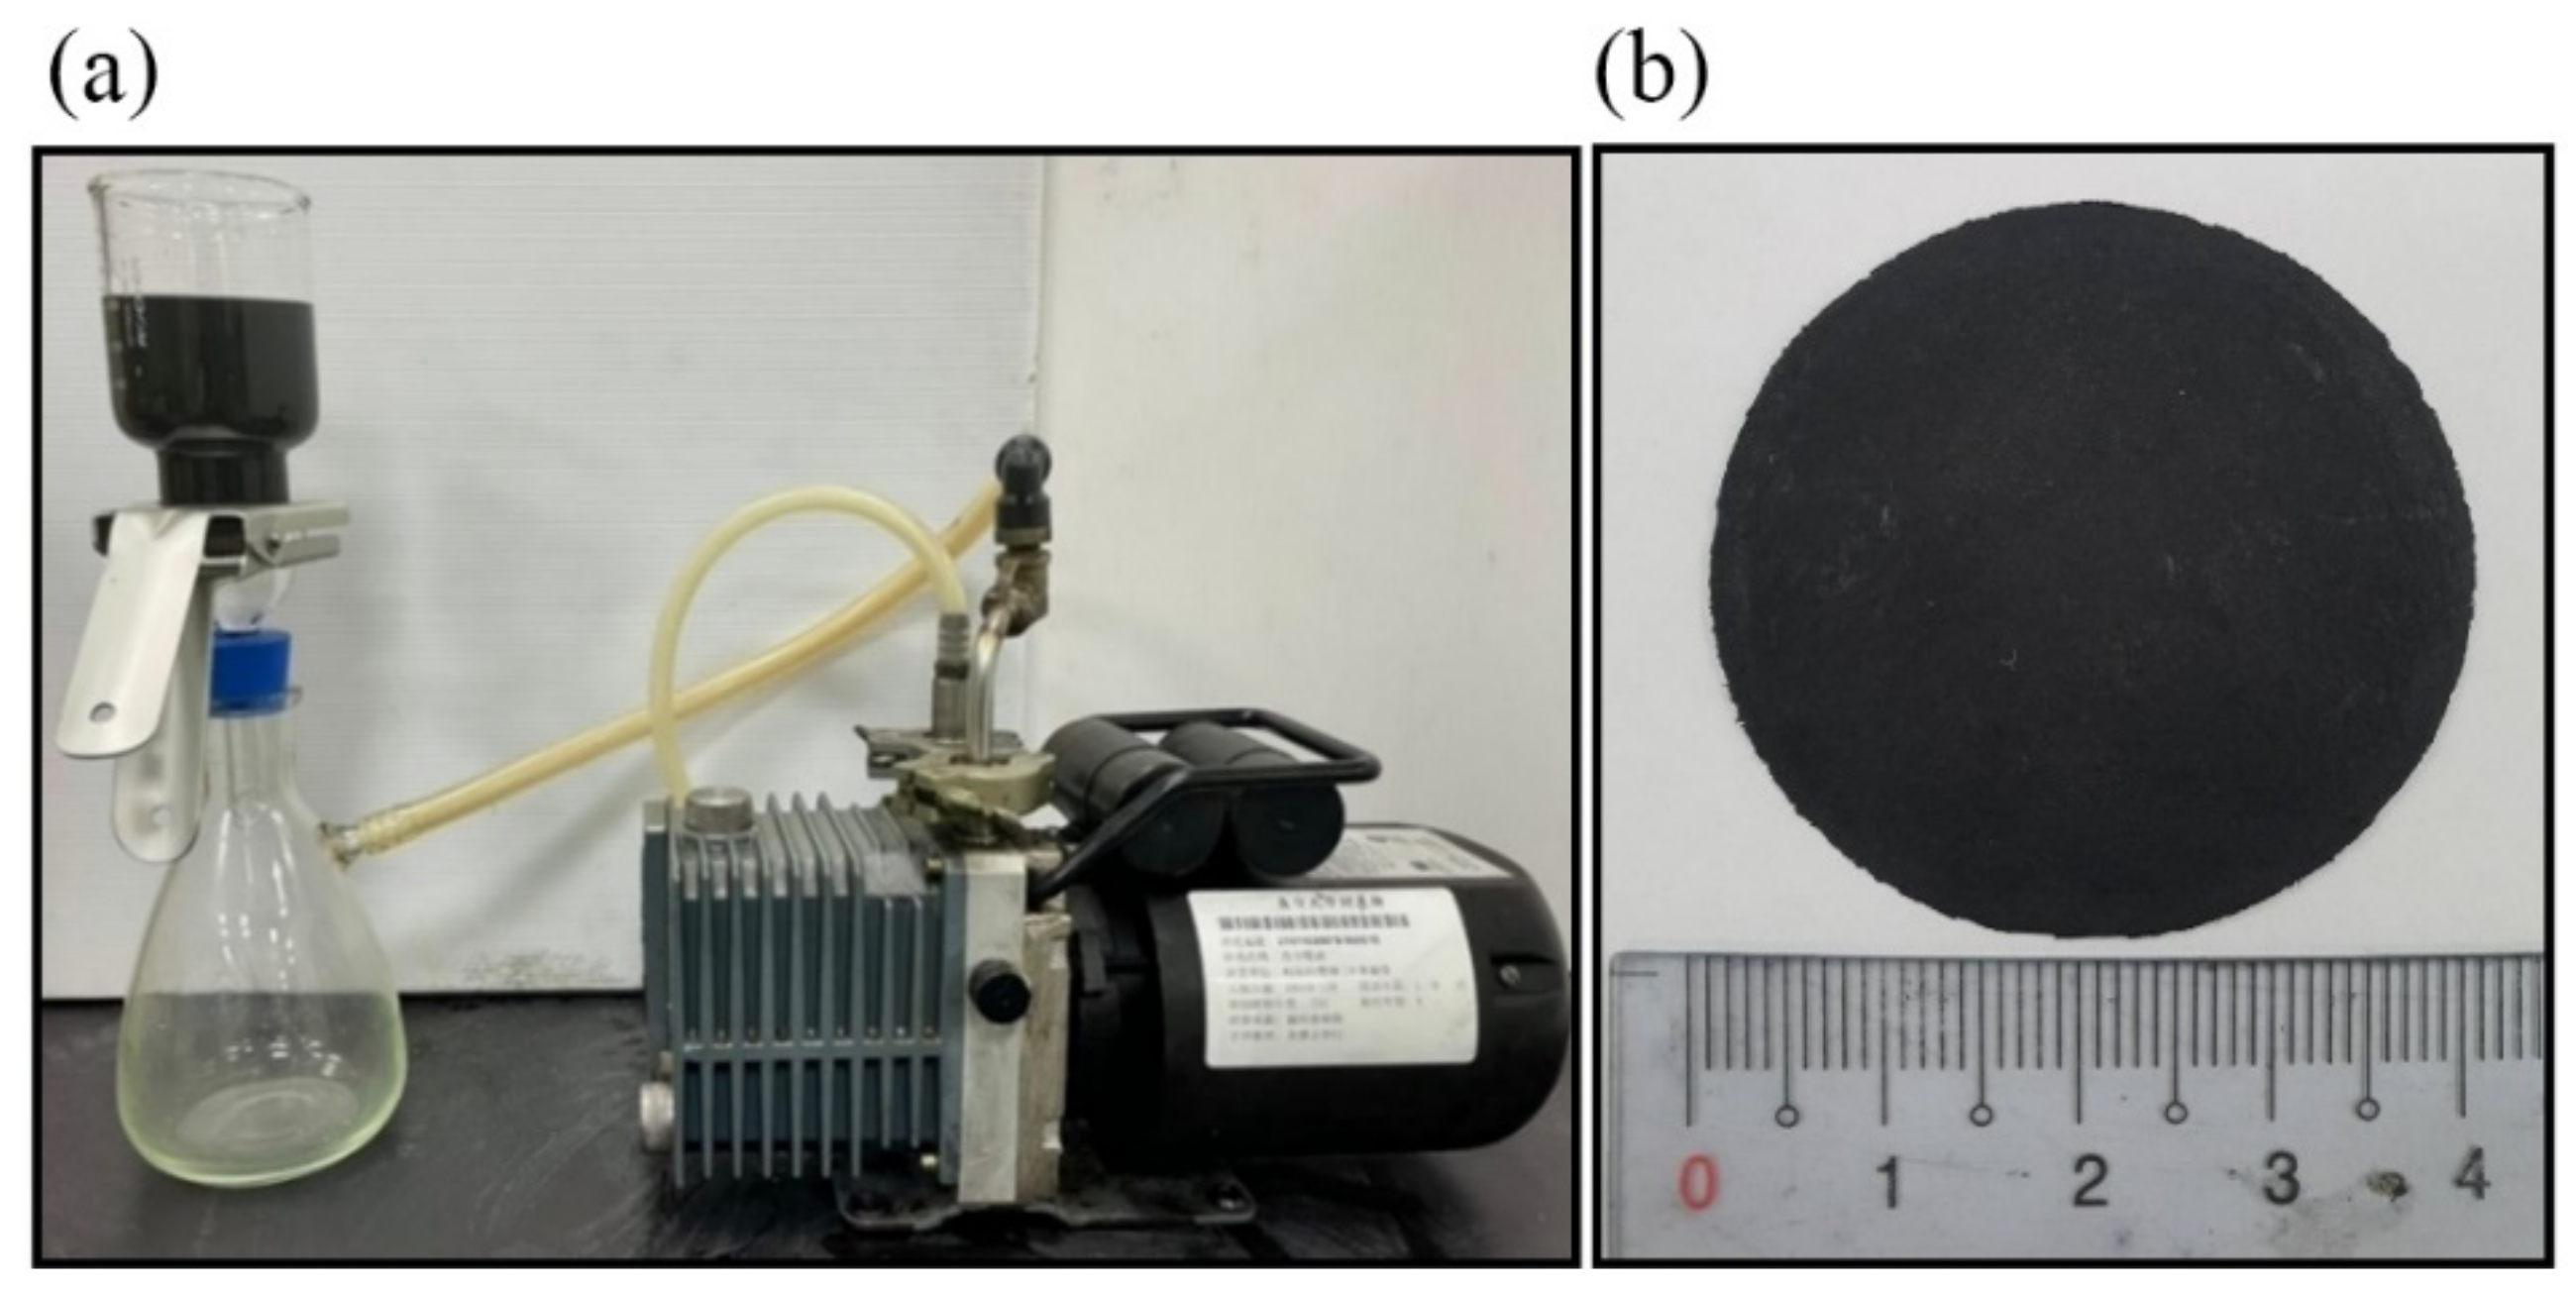
Abstract
:1. Introduction
2. Materials and Methods
2.1. Fabrication of Buckypaper Film
2.2. Modification of Buckypaper Film
2.3. Addition of Bovine Serum Albumin (BSA)
2.4. Characterization
2.4.1. Contact Angle Measurement
2.4.2. Electrochemical Measurement
2.4.3. Functional Group Detection
2.4.4. Observation of Microstructure
3. Results and Discussion
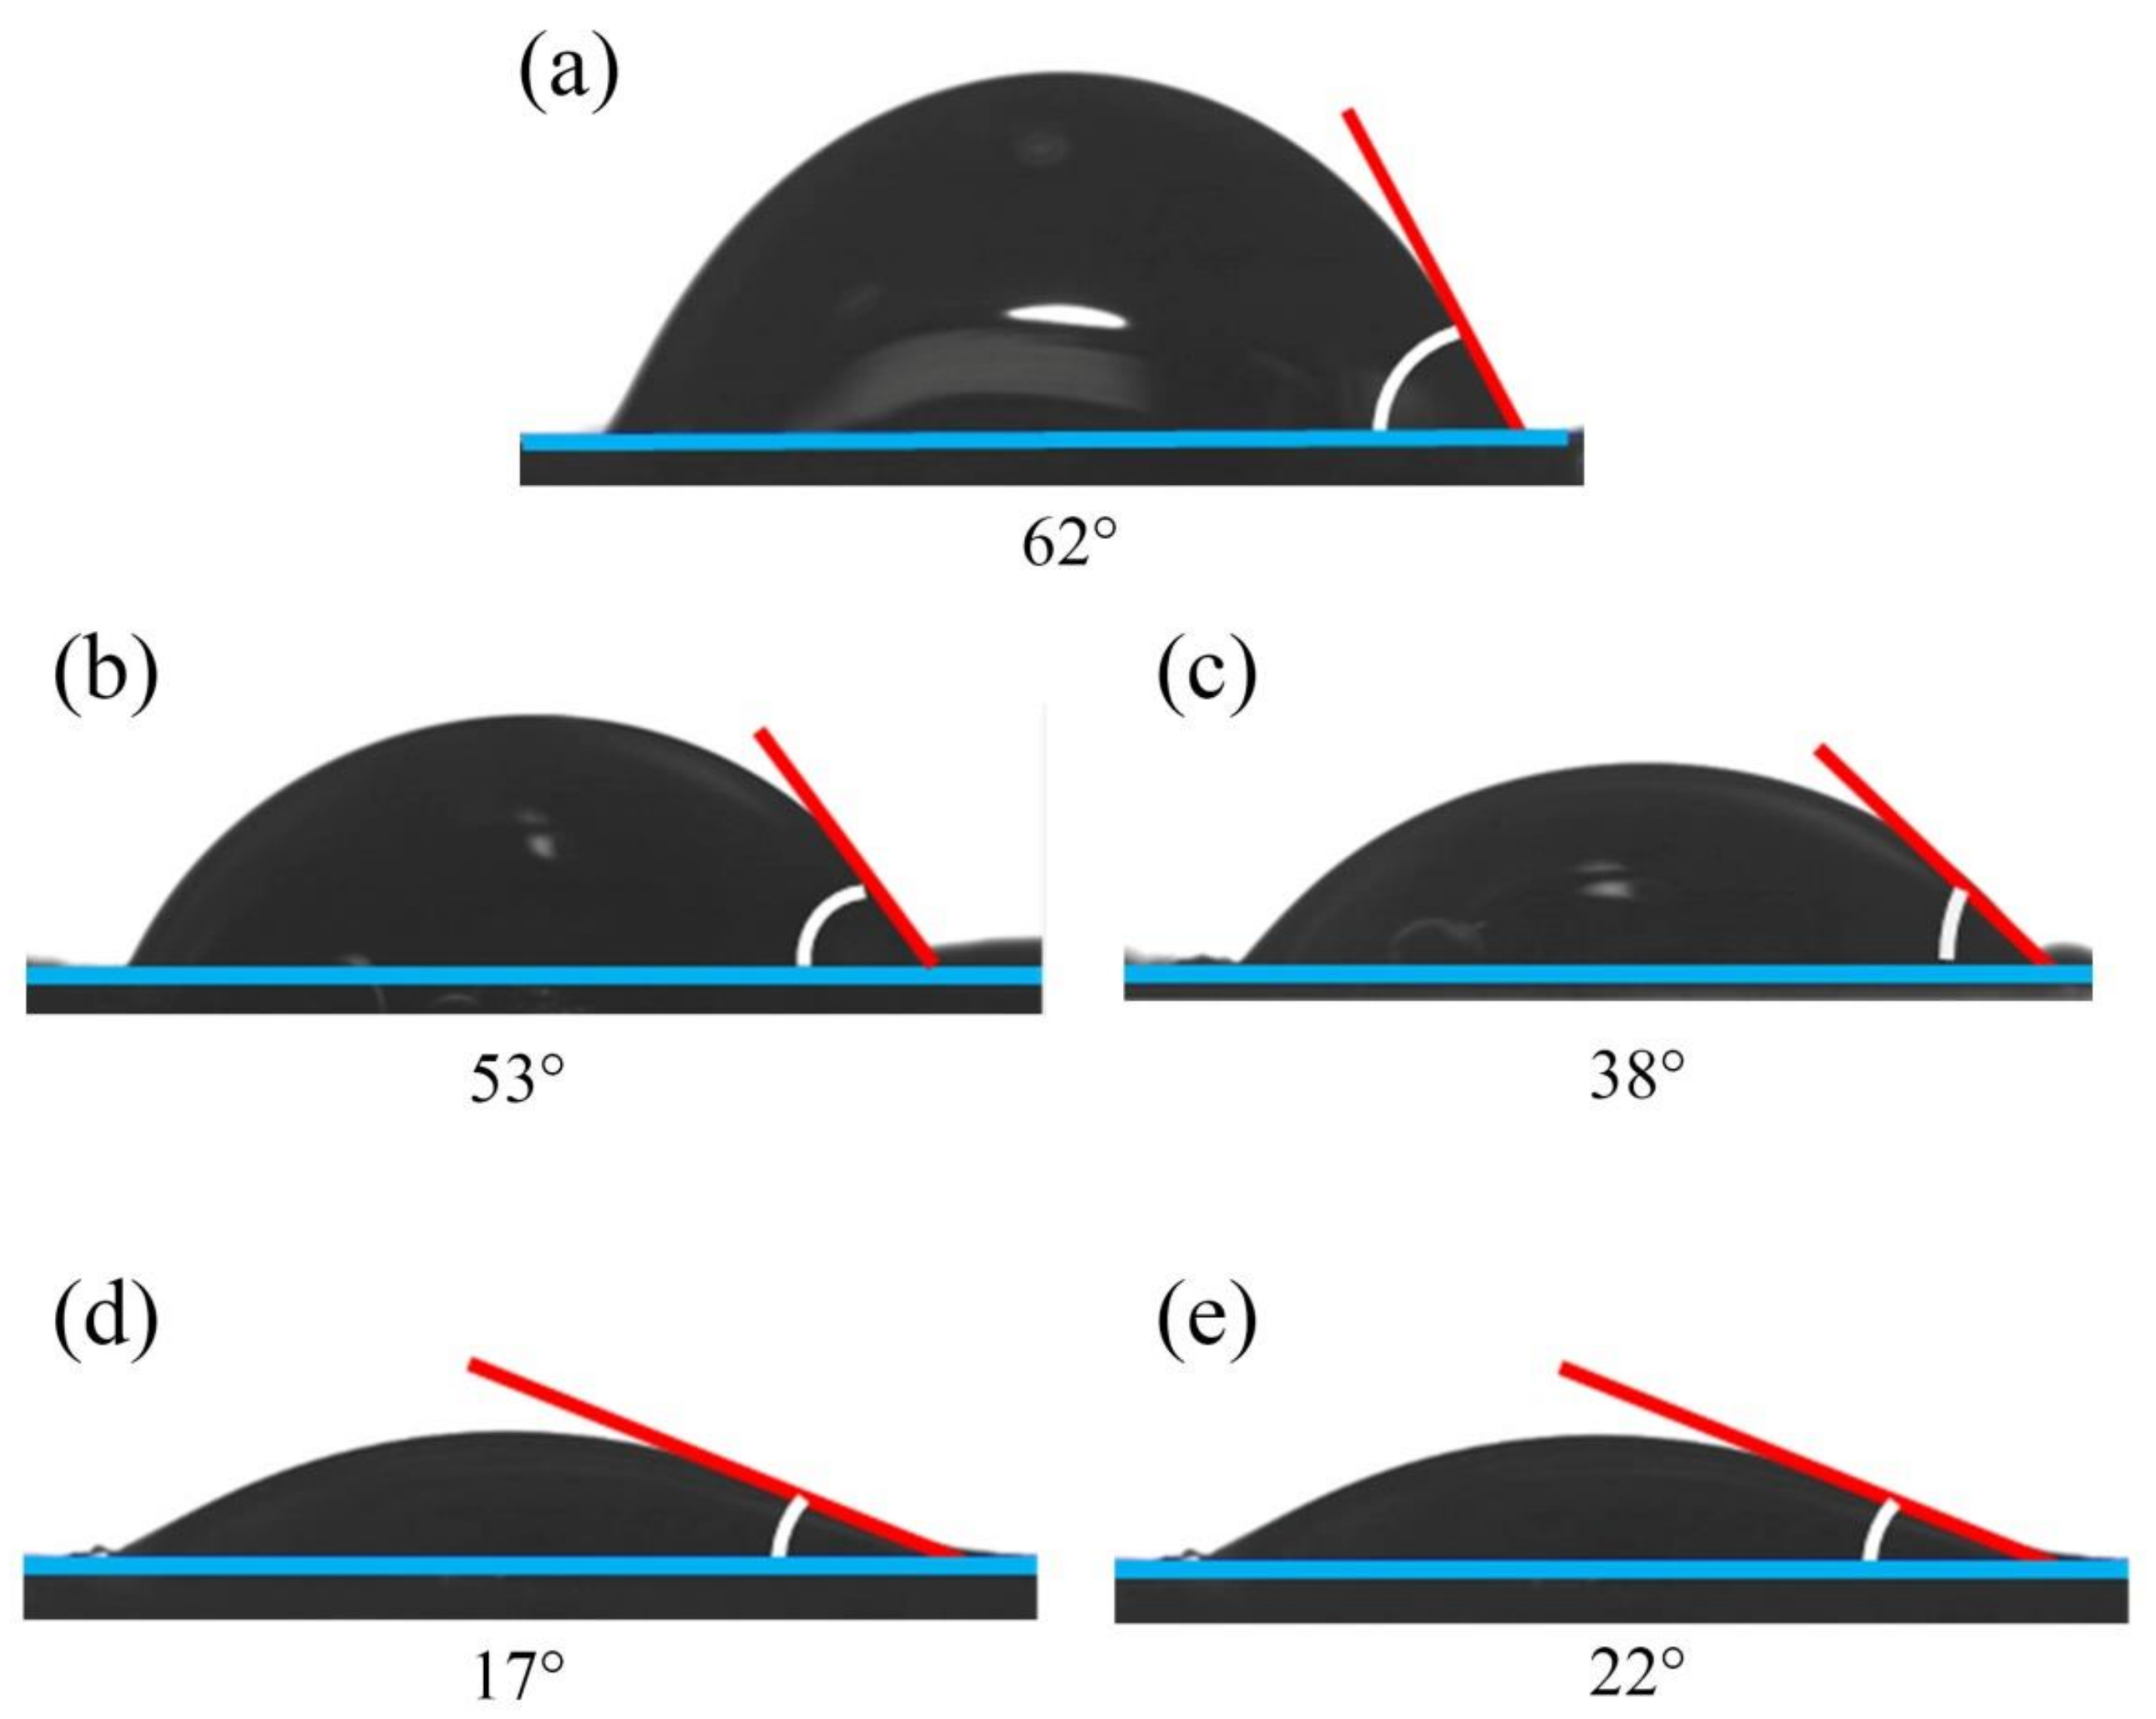
3.1. Contact Angle Measurement
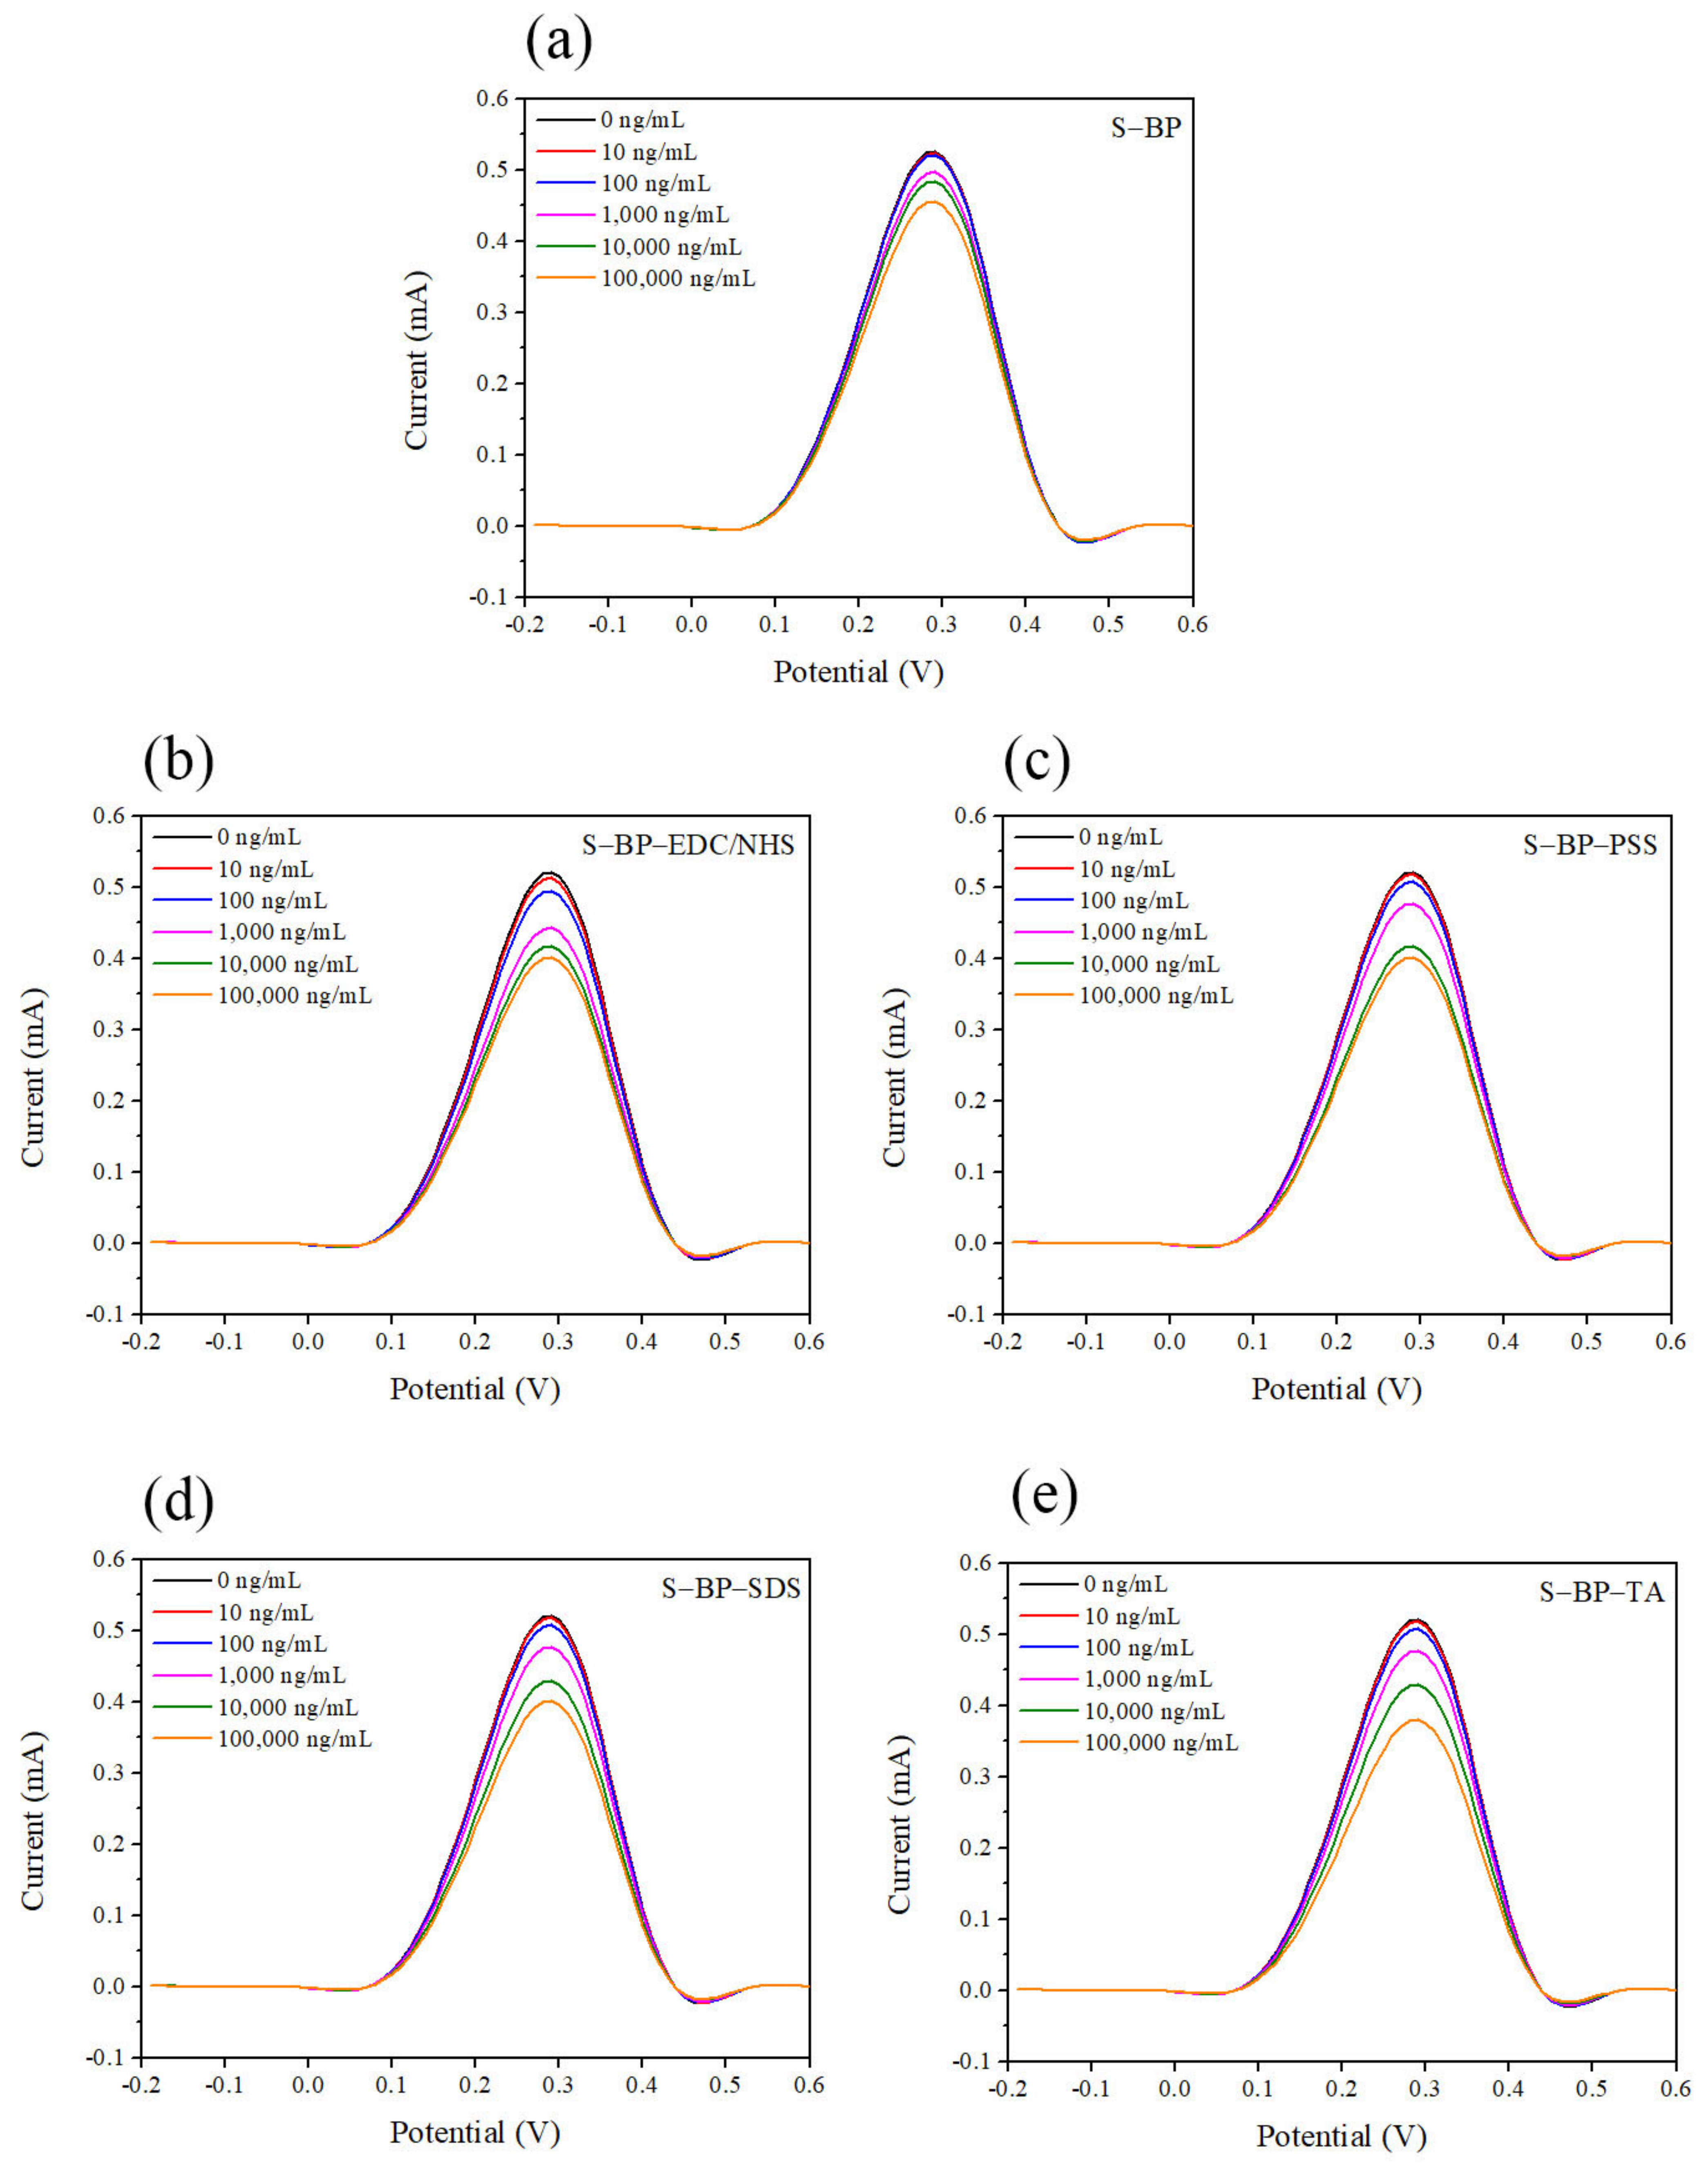
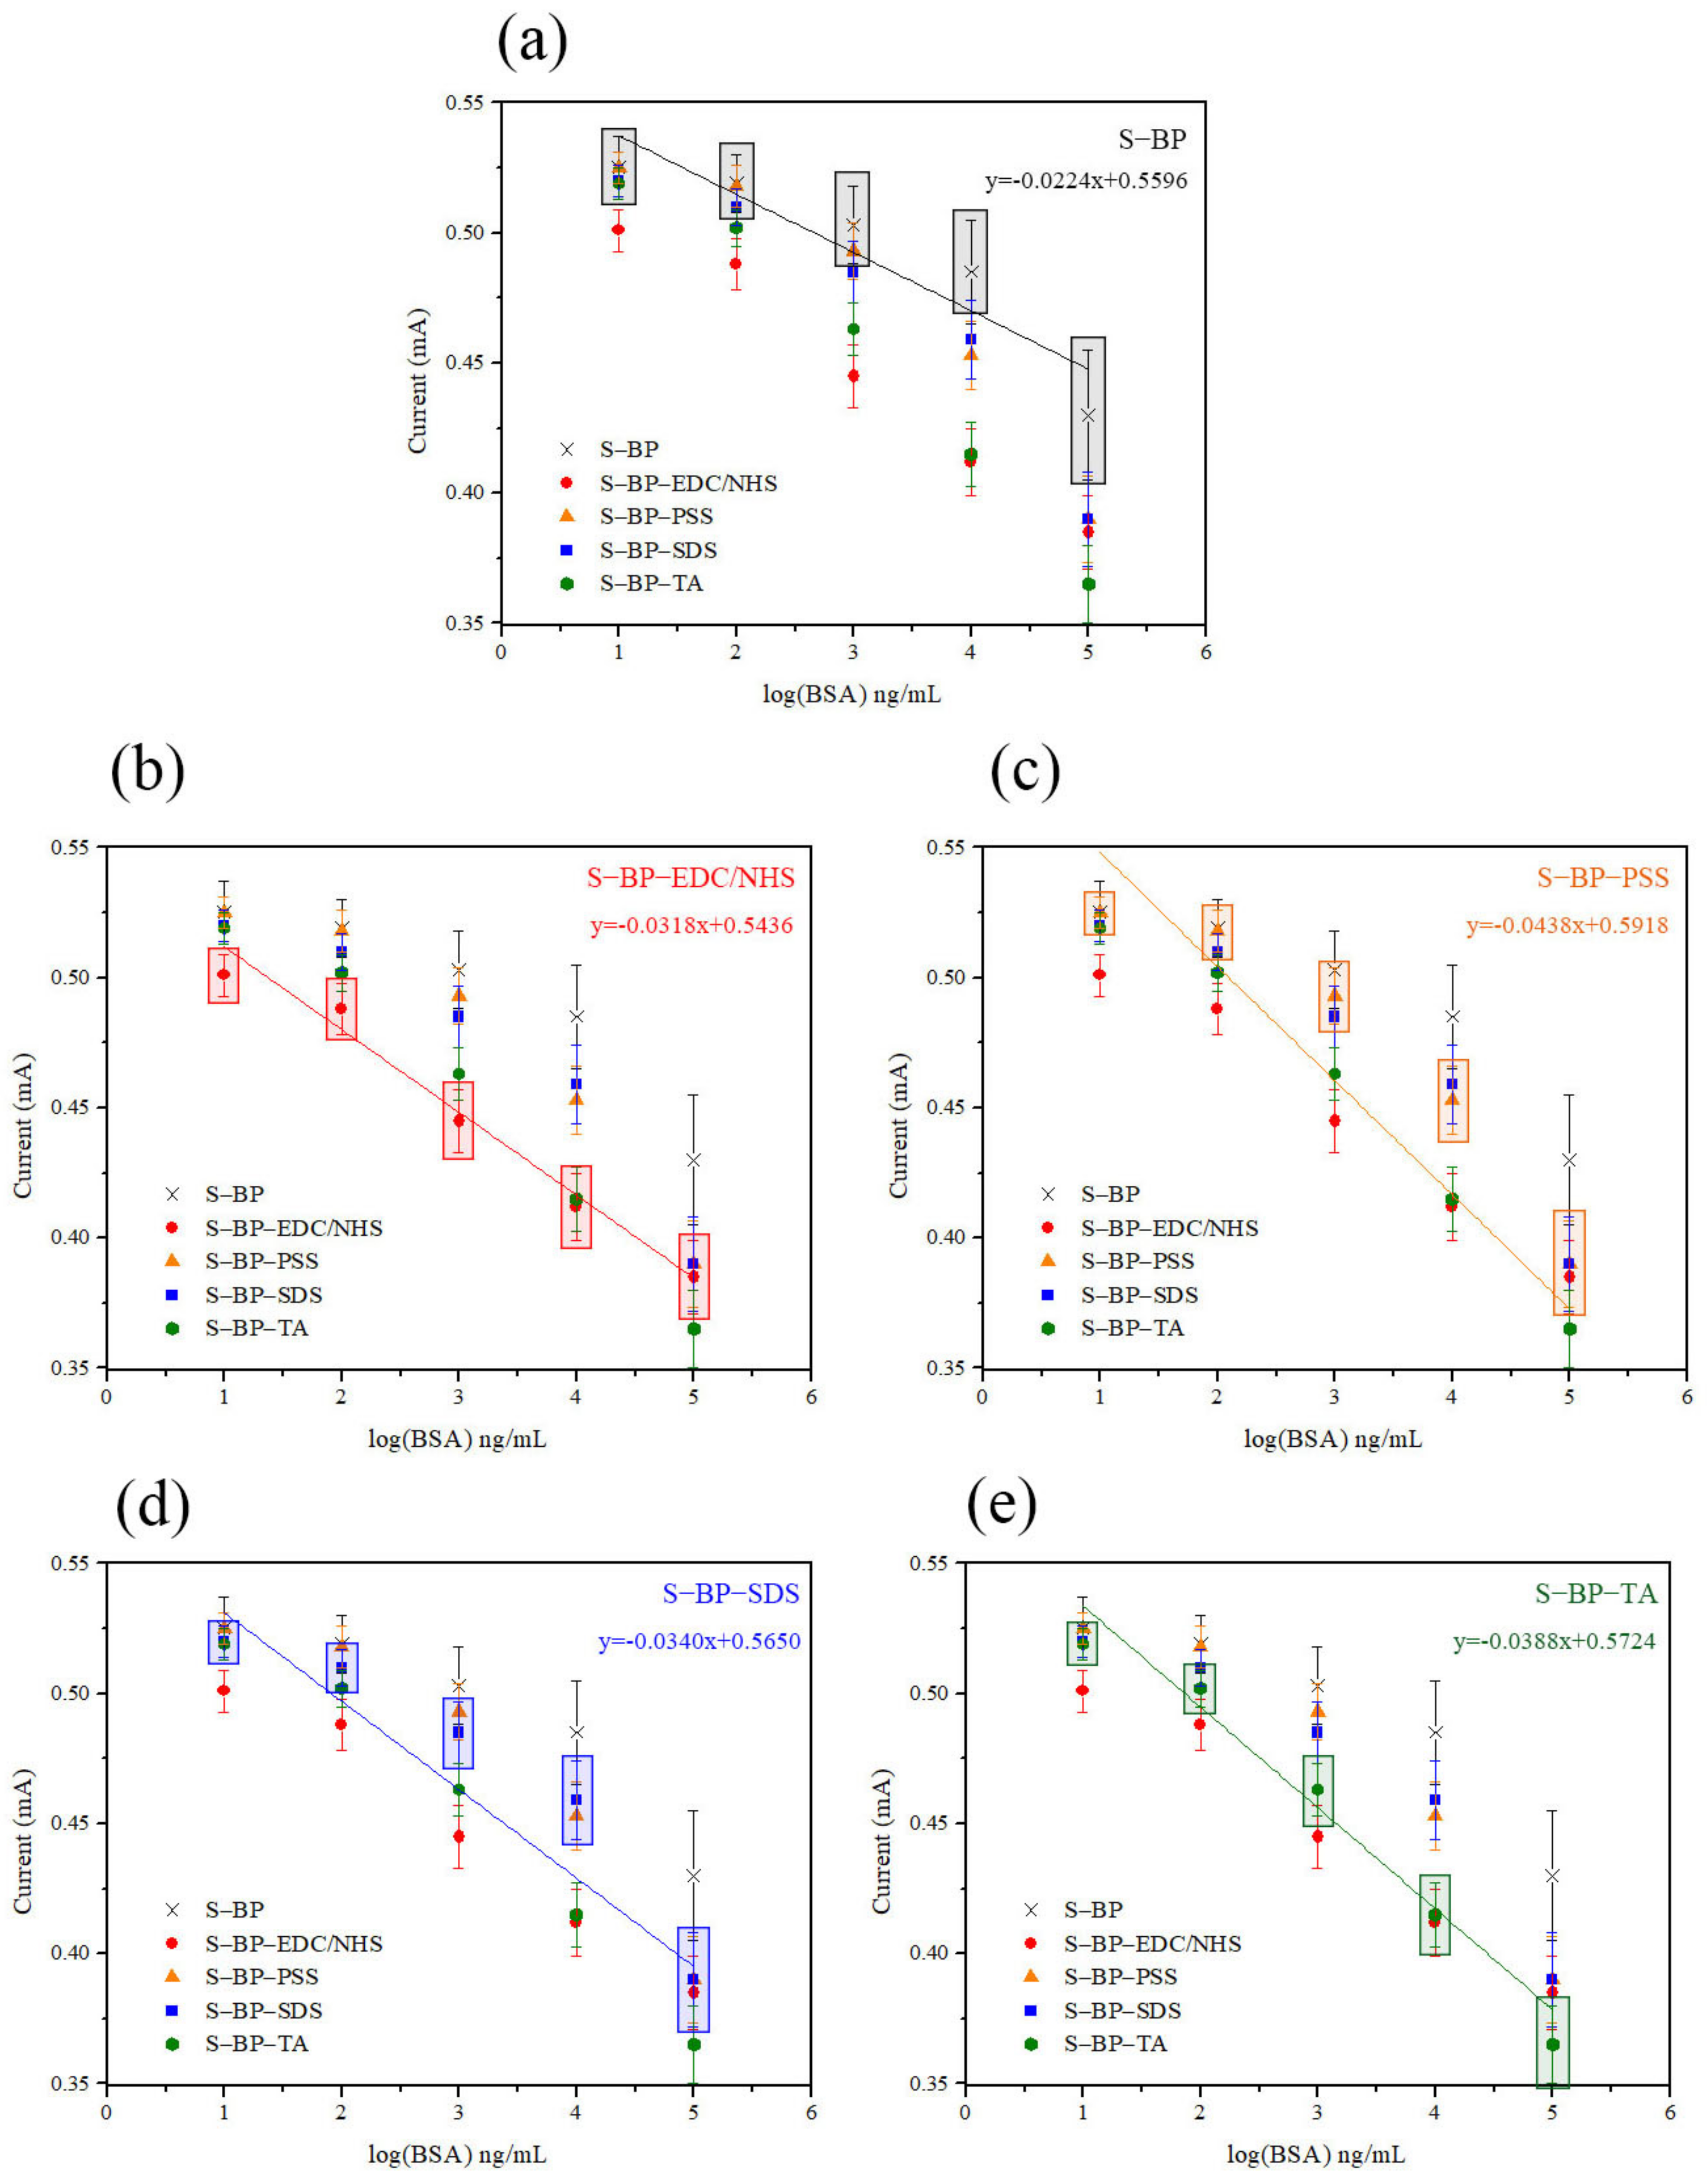
3.2. Differential Pulse Voltammetry (DPV) Measurement of Buckypaper Composite Films
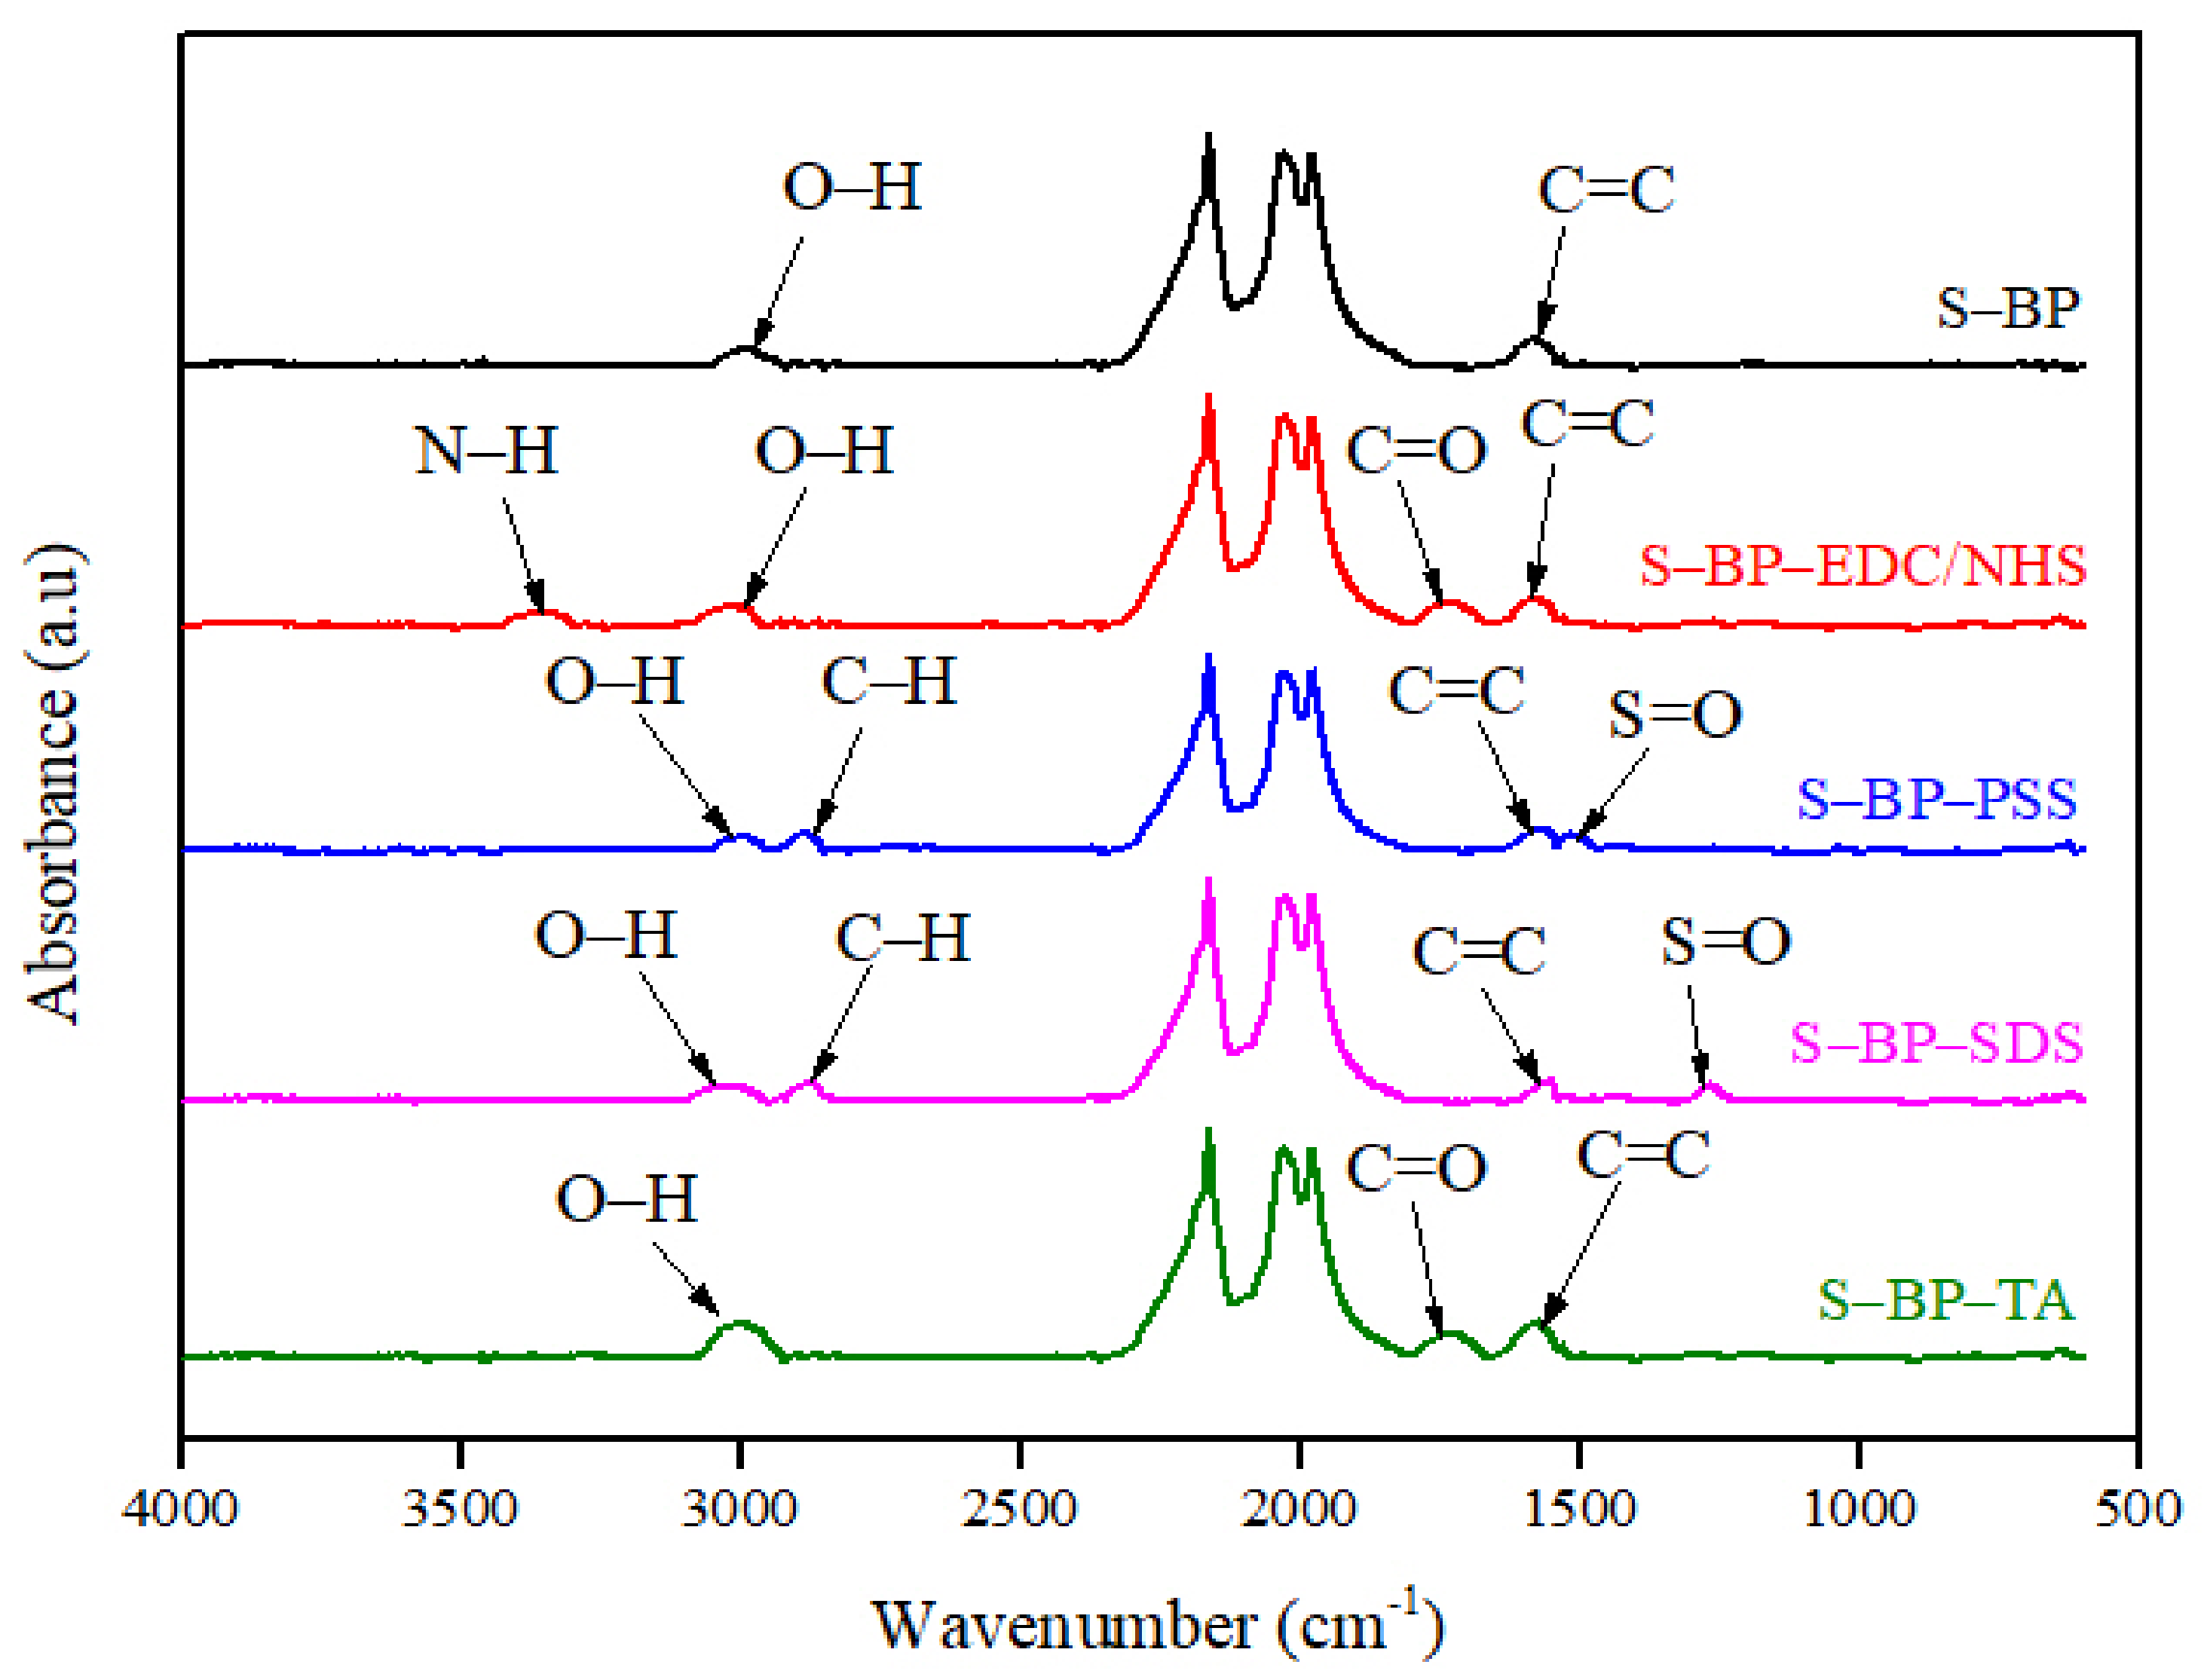
3.3. Functional Group Detection
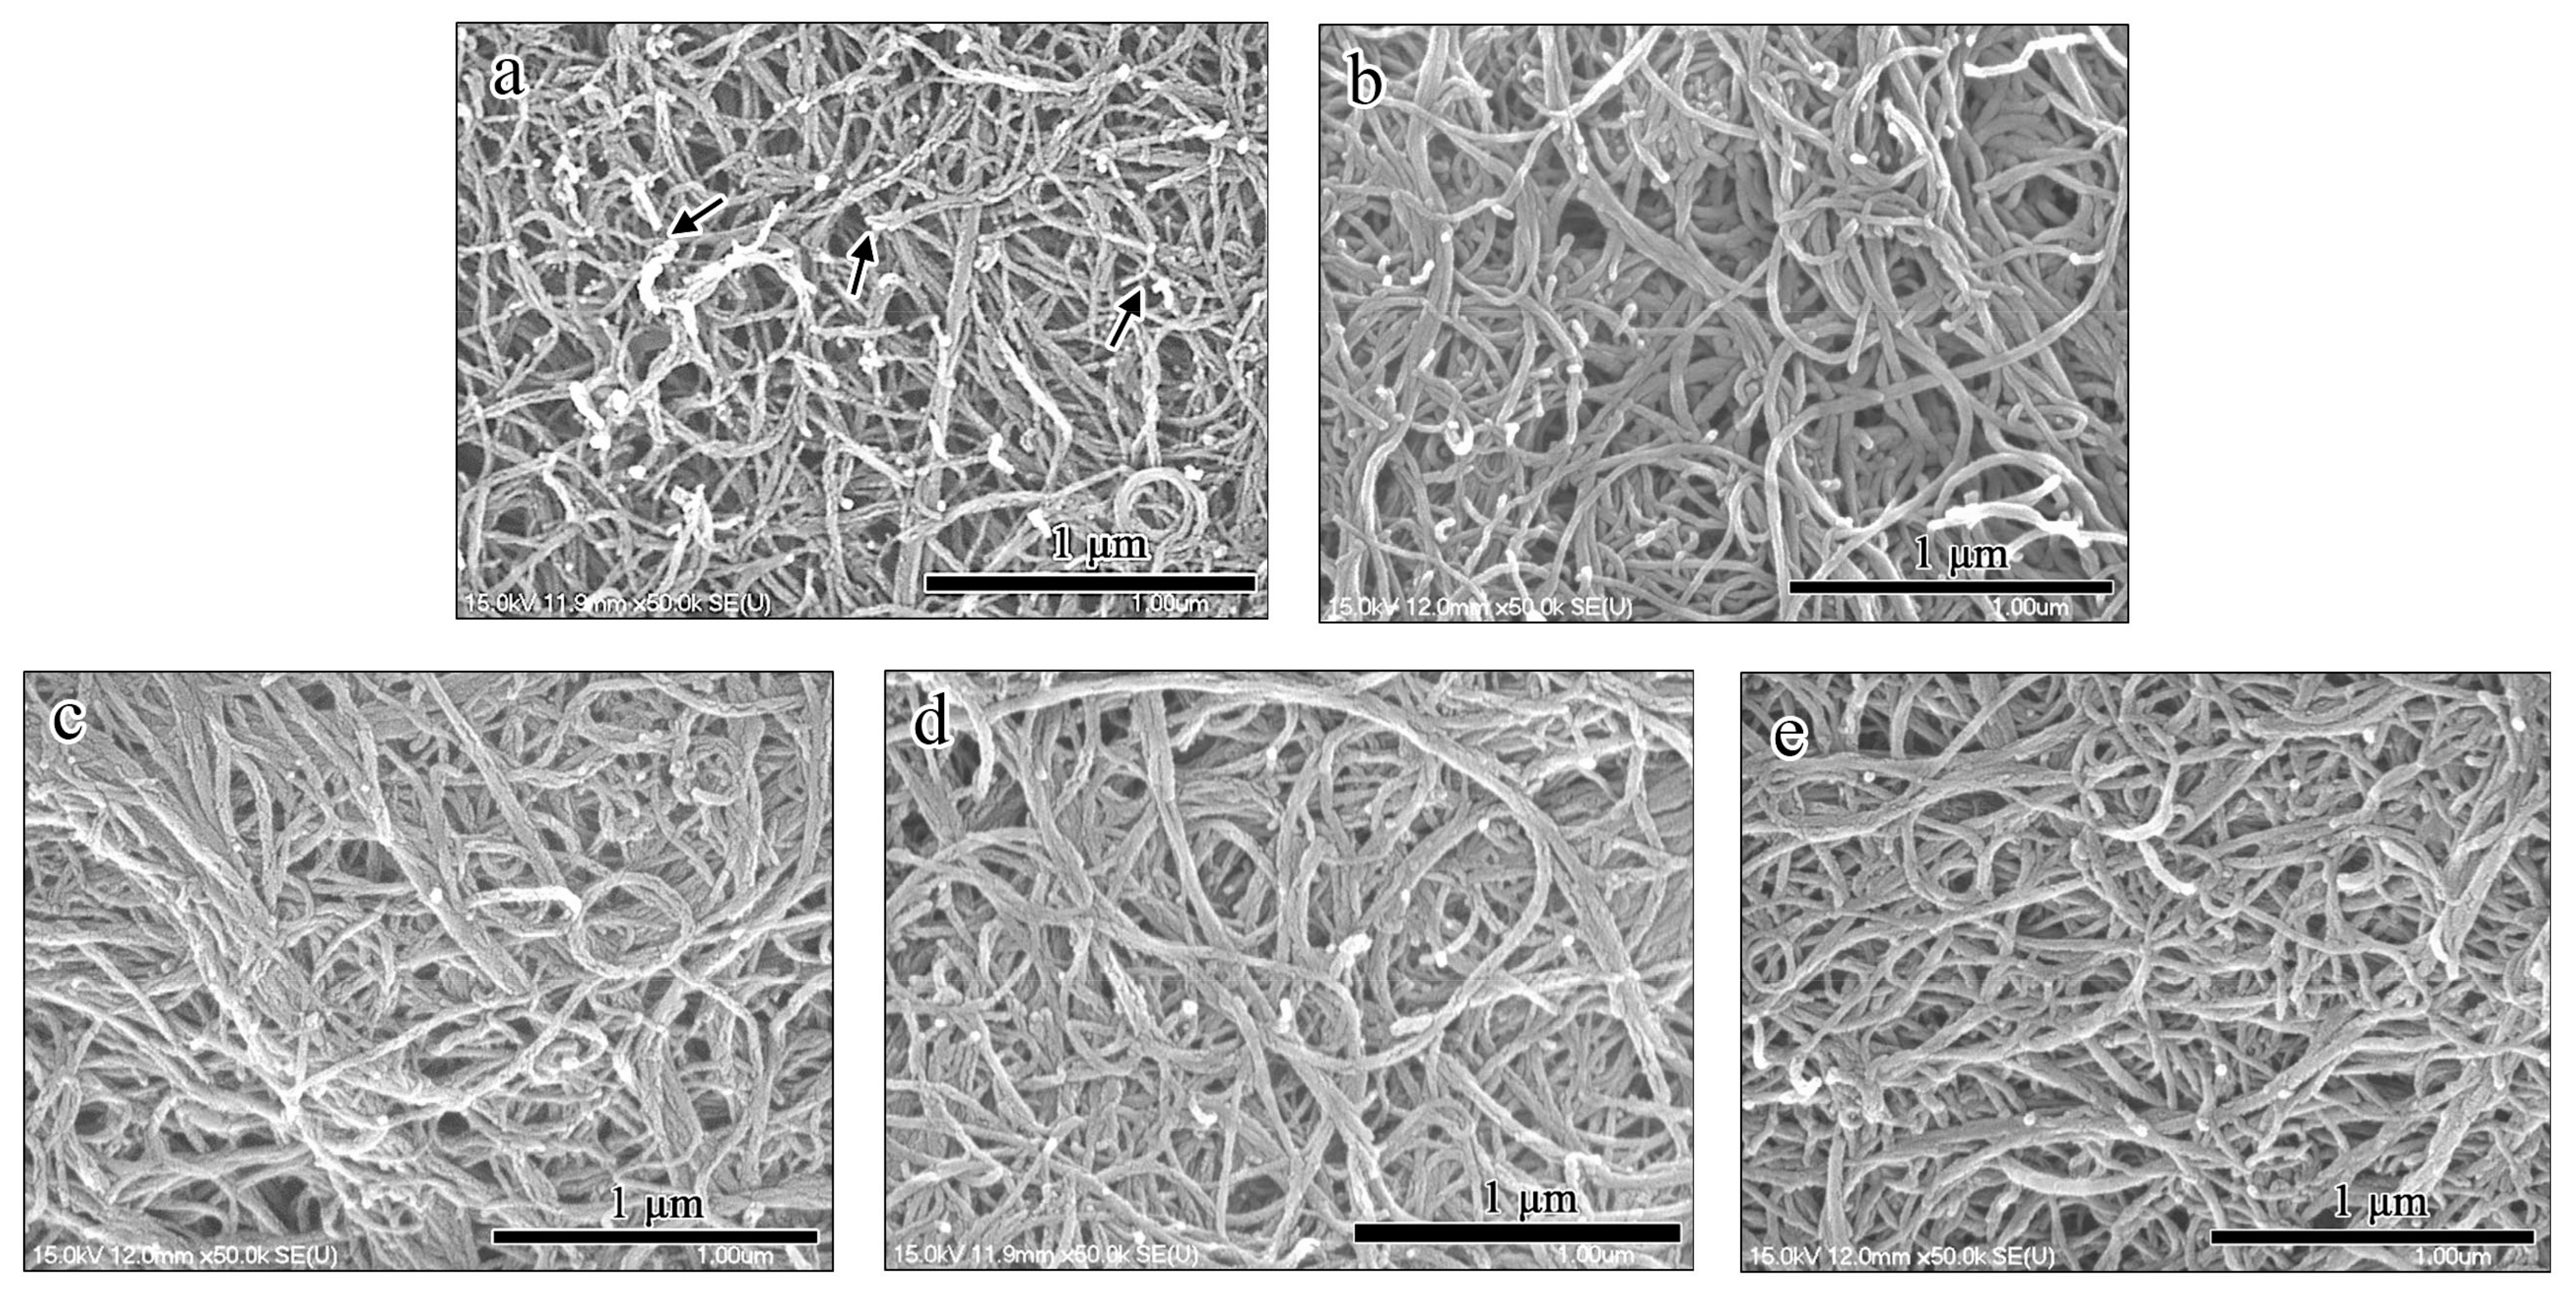
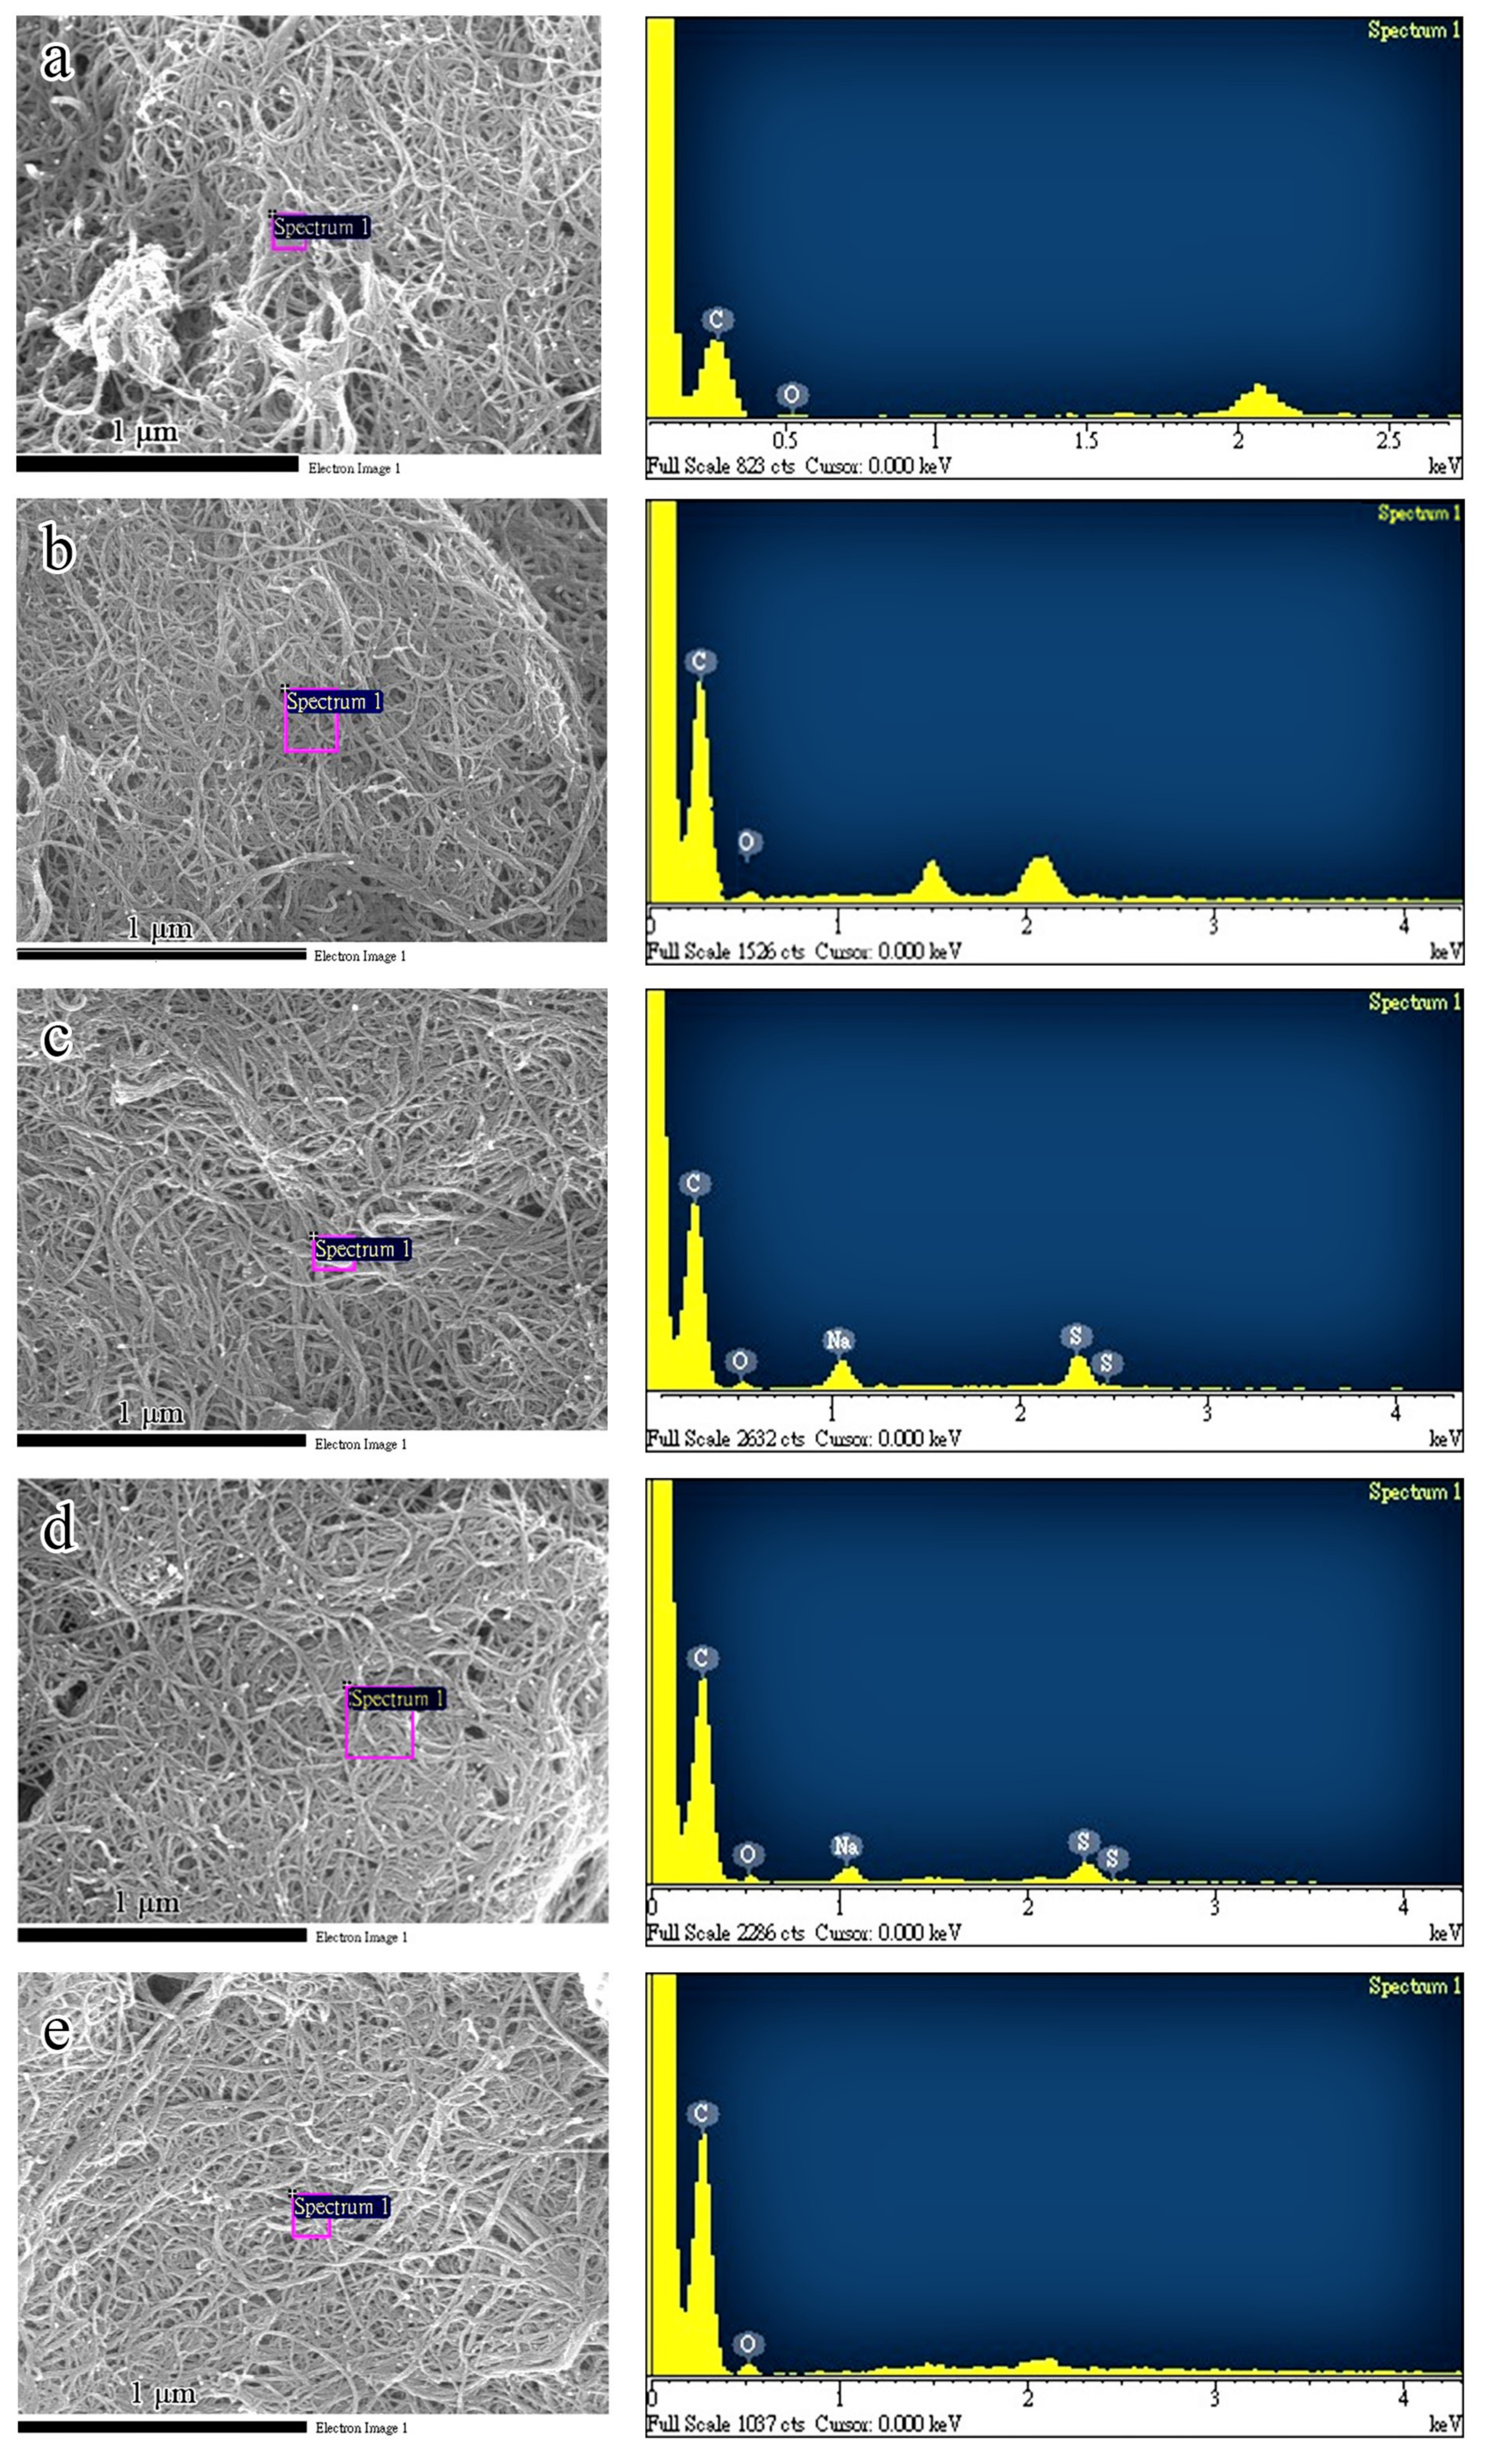
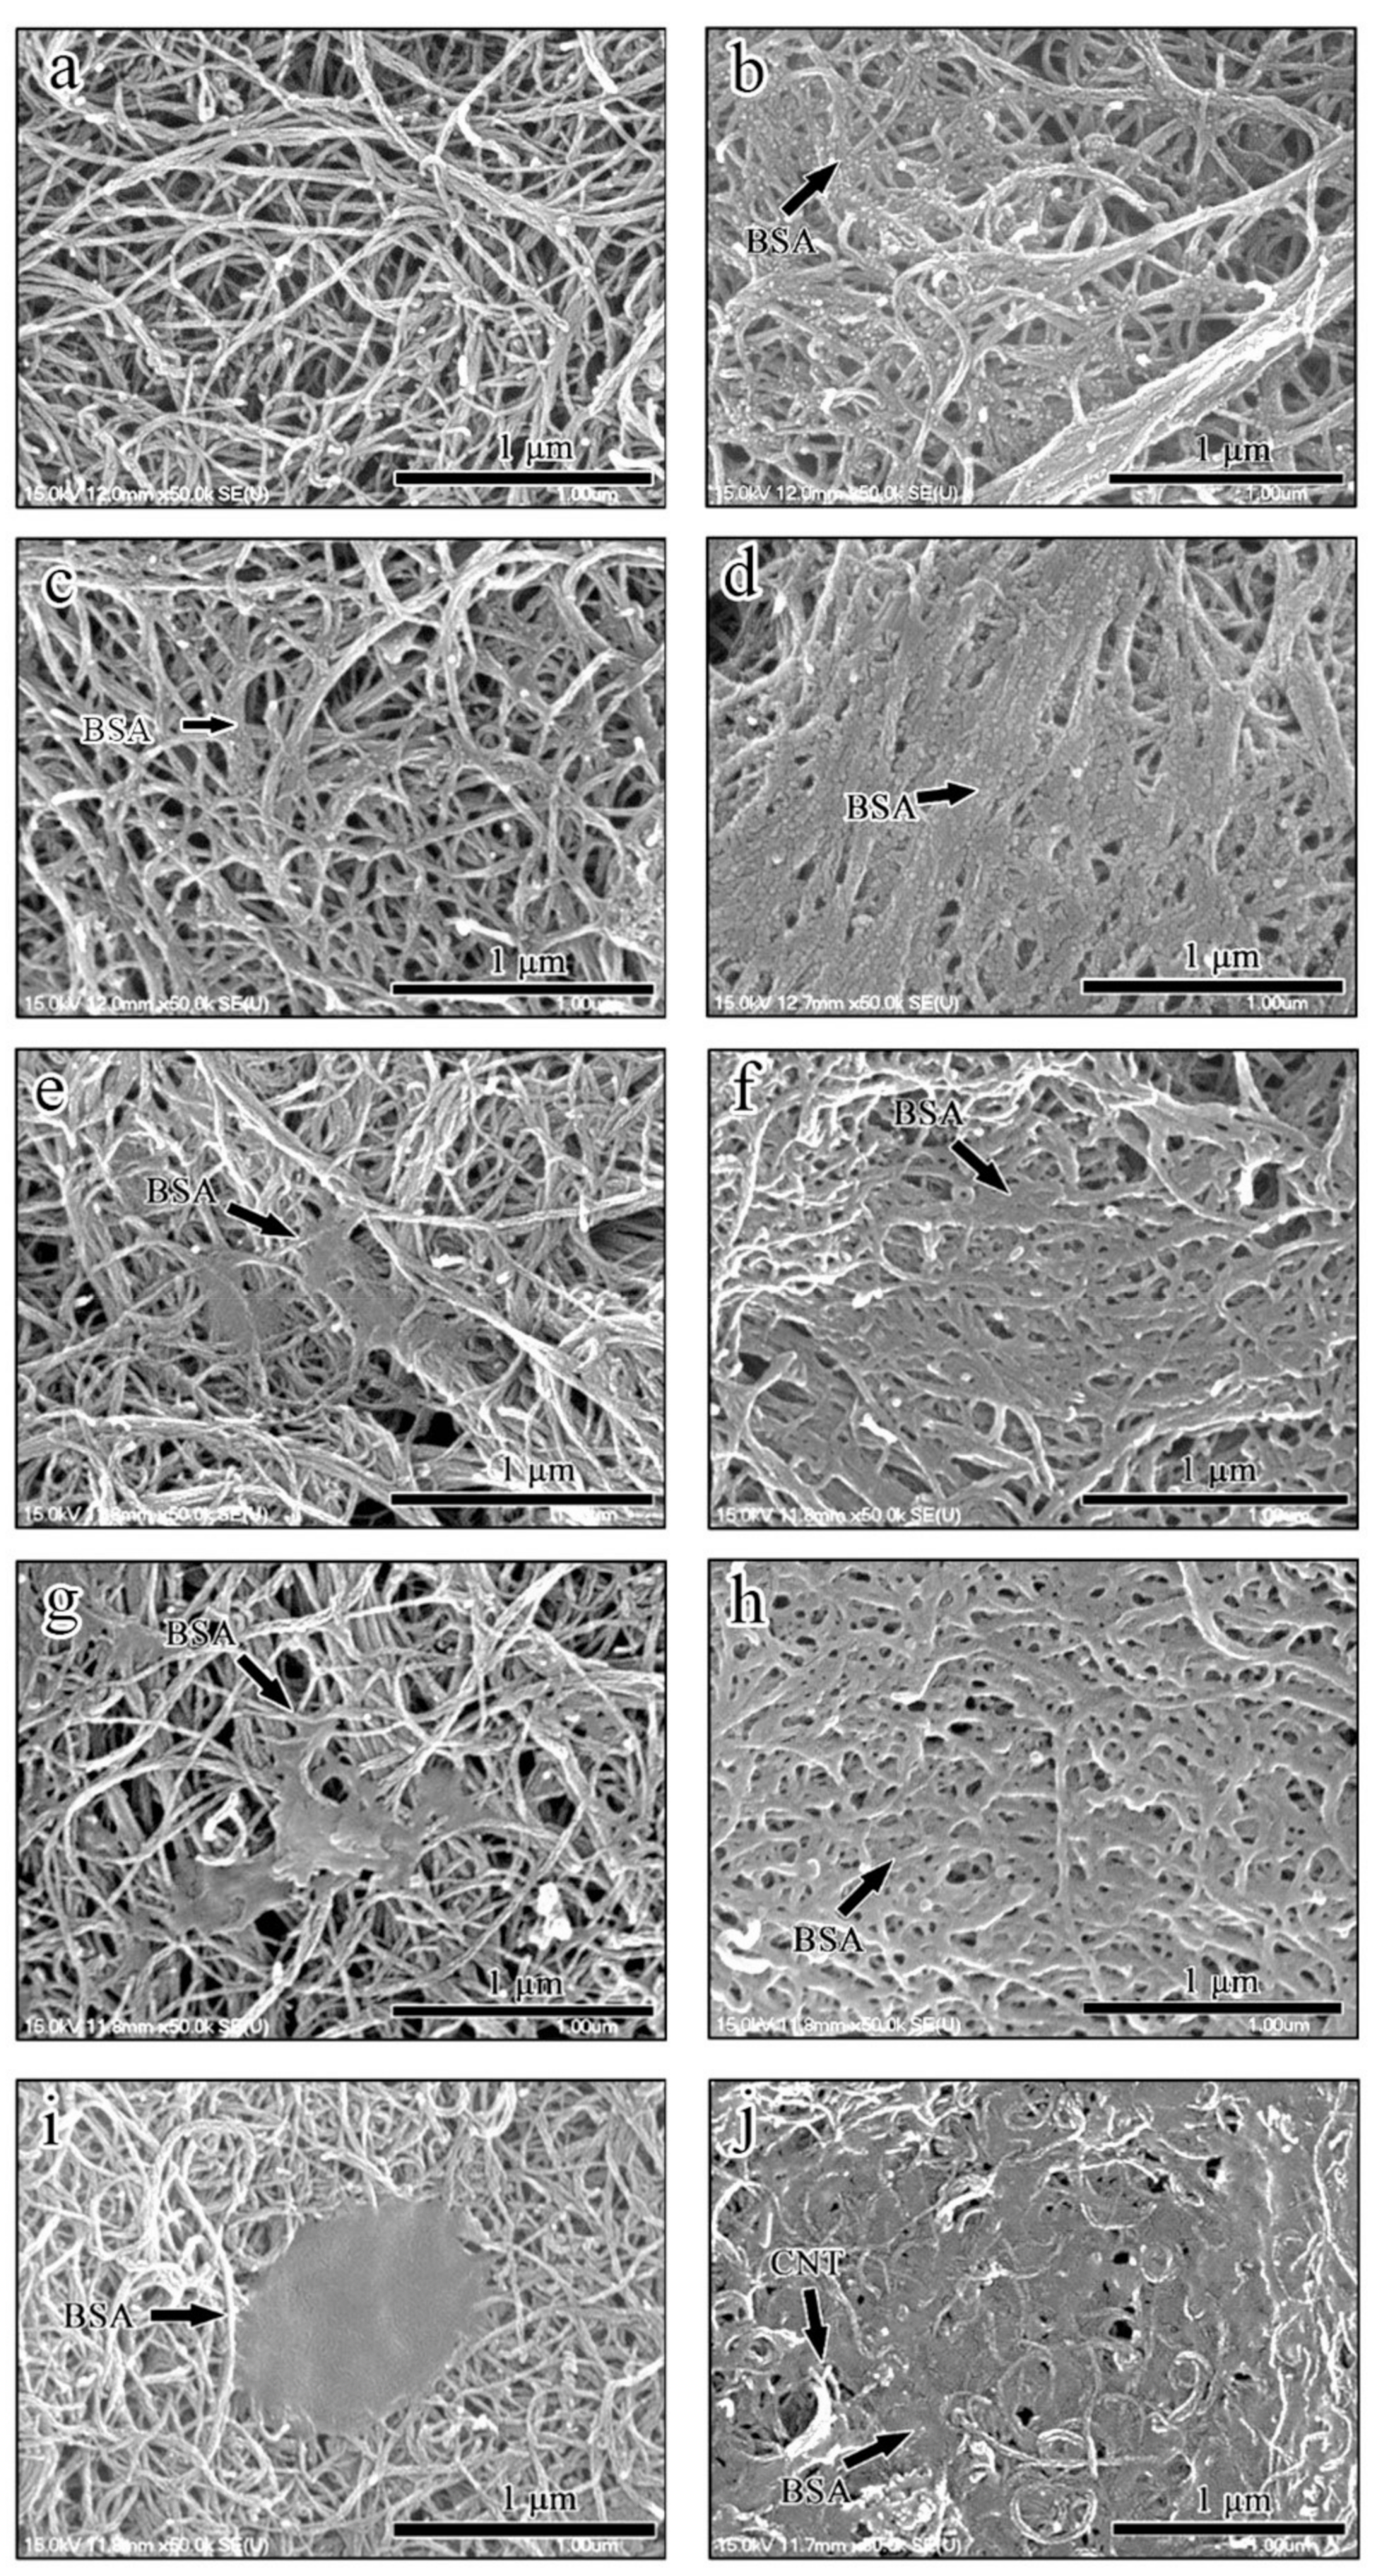
3.4. Observation of Microstructure
4. Conclusions
Author Contributions
Funding
Institutional Review Board Statement
Informed Consent Statement
Data Availability Statement
Acknowledgments
Conflicts of Interest
References
- Zhou, S.; Shi, H.; Feng, X.; Xue, K.; Song, W. Design of templated nanoporous carbon electrode materials with substantial high specific surface area for simultaneous determination ofbiomolecules. Biosens. Bioelectron. 2013, 42, 163–169. [Google Scholar] [CrossRef] [PubMed]
- Kara, P.; de la Escosura–Muñiz, A.; Maltez–da Costa, M.; Guix, M.; Ozsoz, M.; Merkoçi, A. Aptamers based electrochemical biosensor for protein detection using carbon nanotubes platforms. Biosens. Bioelectron. 2010, 26, 1715–1718. [Google Scholar] [CrossRef] [PubMed]
- Valentini, F.; Orlanducci, S.; Terranova, M.L.; Amine, A.; Palleschi, G. Carbon nanotubes as electrode materials for the assembling of new electrochemical biosensors. Sens. Actuators B Chem. 2004, 100, 117–125. [Google Scholar] [CrossRef]
- Li, F.; Wang, Z.; Shan, C.; Song, J.; Han, D.; Niu, L. Preparation of gold nanoparticles/functionalized multiwalled carbon nanotube nanocomposites and its glucose biosensing application. Biosens. Bioelectron. 2009, 24, 1765–1770. [Google Scholar] [CrossRef]
- Guan, W.J.; Li, Y.; Chen, Y.Q.; Zhang, X.B.; Hu, G.Q. Glucose biosensor based on multi–wall carbon nanotubes and screen printed carbon electrodes. Biosens. Bioelectron. 2005, 21, 508–512. [Google Scholar] [CrossRef]
- Huang, J.; Yang, Y.; Shi, H.; Song, Z.; Zhao, Z.; Anzai, J.I.; Osa, T.; Chen, Q. Multi–walled carbon nanotubes–based glucose biosensor prepared by a layer–by–layer technique. Mater. Sci. Eng. C 2006, 26, 113–117. [Google Scholar] [CrossRef]
- Fatoni, A.; Numnuam, A.; Kanatharana, P.; Limbut, W.; Thammakhet, C.; Thavarungkul, P. A highly stable oxygen–independent glucose biosensor based on a chitosan–albumin cryogel incorporated with carbon nanotubes and ferrocene. Sens. Actuators B Chem. 2013, 185, 725–734. [Google Scholar] [CrossRef]
- Li, G.; Liao, J.M.; Hu, G.Q.; Ma, N.Z.; Wu, P.J. Study of carbon nanotube modified biosensor for monitoring total cholesterol in blood. Biosens. Bioelectron. 2005, 20, 2140–2144. [Google Scholar] [CrossRef]
- Tsai, Y.C.; Chen, S.Y.; Lee, C.A. Amperometric cholesterol biosensors based on carbon nanotube–chitosan–platinum–cholesterol oxidase nanobiocomposite. Sens. Actuators B Chem. 2008, 135, 96–101. [Google Scholar] [CrossRef]
- Shi, Q.; Peng, T.; Cheng, J. A cholesterol biosensor based on cholesterol oxidase immobilized in a sol–gel on a platinum–decorated carbon nanotubes modified electrode. Chin. J. Anal. Chem. 2005, 33, 329–332. [Google Scholar]
- Wisitsoraat, A.; Sritongkham, P.; Karuwan, C.; Phokharatkul, D.; Maturos, T.; Tuantranont, A. Fast cholesterol detection using flow injection microfluidic device with functionalized carbon nanotubes based electrochemical sensor. Biosens. Bioelectron. 2010, 26, 1514–1520. [Google Scholar] [CrossRef]
- Tong, Y.; Li, H.; Guan, H.; Zhao, J.; Majeed, S.; Anjum, S.; Liang, F.; Xu, G. Electrochemical cholesterol sensor based on carbon nanotube@molecularly imprinted polymer modified ceramic carbon electrode. Biosens. Bioelectron. 2013, 47, 553–558. [Google Scholar] [CrossRef]
- Dong, X.Y.; Mi, X.N.; Zhang, L.; Liang, T.M.; Xu, J.J.; Chen, H.Y. DNAzyme–functionalized Pt nanoparticles/carbon nanotubes for amplified sandwich electrochemical DNA analysis. Biosens. Bioelectron. 2012, 38, 337–341. [Google Scholar] [CrossRef]
- Yang, K.; Zhang, C.Y. Simple detection of nucleic acids with a single–walled carbon–nanotube–based electrochemical biosensor. Biosens. Bioelectron. 2011, 28, 257–262. [Google Scholar] [CrossRef]
- Brahman, P.K.; Dar, R.A.; Pitre, K.S. DNA–functionalized electrochemical biosensor for detection of vitamin B1 using electrochemically treated multiwalled carbon nanotube paste electrode by voltammetric methods. Sens. Actuators B Chem. 2013, 177, 807–812. [Google Scholar] [CrossRef]
- Li, F.; Peng, J.; Wang, J.; Tang, H.; Tan, L.; Xie, Q.; Yao, S. Carbon nanotube–based label–free electrochemical biosensor for sensitive detection of miRNA–24. Biosens. Bioelectron. 2014, 54, 158–164. [Google Scholar] [CrossRef]
- Wu, L.; Xiong, E.; Zhang, X.; Zhang, X.; Chen, J. Nanomaterials as signal amplification elements in DNA–based electrochemical sensing. Nano Today 2014, 9, 197–211. [Google Scholar] [CrossRef]
- Kim, J.; Elsnab, J.; Gehrke, C.; Li, J.; Gale, B.K. Microfluidic integrated multi–walled carbon nanotube (MWCNT) sensor for electrochemical nucleic acid concentration measurement. Sens. Actuators B Chem. 2013, 185, 370–376. [Google Scholar] [CrossRef]
- Rinzler, A.G.; Liu, J.; Dai, H.; Nikolaev, P.; Huffman, C.B.; Rodríguez–Macías, F.J.; Boul, P.J.; Lu, A.H.; Heymann, D.; Colbert, D.T.; et al. Large–scale purification of single–wall carbon nanotubes: Process, product, and characterization. Appl. Phys. A 1998, 67, 29–37. [Google Scholar] [CrossRef]
- Li, Y.; Kröger, M. A theoretical evaluation of the effects of carbon nanotube entanglement and bundling on the structural and mechanical properties of buckypaper. Carbon 2012, 50, 1793–1806. [Google Scholar] [CrossRef]
- Zhang, J.; Jiang, D.; Peng, H.X. A pressurized filtration technique for fabricating carbon nanotube buckypaper: Structure, mechanical and conductive properties. Microporous Mesoporous Mater. 2014, 184, 127–133. [Google Scholar] [CrossRef]
- Shankar, K.R. Preparation and Characterization of Magnetically Aligned Carbon Nanotube Buckypaper and Composite; Florida State University: Tallahassee, FL, USA, 2003. [Google Scholar]
- Desmet, C.; Marquette, C.A.; Blum, L.J.; Doumèche, B. Paper electrodes for bioelectrochemistry: Biosensors and biofuel cells. Biosens. Bioelectron. 2016, 76, 145–163. [Google Scholar] [CrossRef] [PubMed]
- Papa, H.; Gaillard, M.; Gonzalez, L.; Chatterjee, J. Fabrication of Functionalized Carbon Nanotube Buckypaper Electrodes for Application in Glucose Biosensors. Biosensors 2014, 4, 449–460. [Google Scholar] [CrossRef] [PubMed] [Green Version]
- Chupp, J.; Papa, H.; Gonzales, L.; Turgeon, O.; Chatterjee, J. Studies on Electrochemical Properties of Functionalized Carbon Nanotube Bucky Paper Electrodes for Biosensor Applications. Res. Rev. J. Mater. Sci. 2015, 3, 17–24. [Google Scholar] [CrossRef] [Green Version]
- Kulesza, S.; Szroeder, P.; Patyk, J.K.; Szatkowski, J.; Kozanecki, M. High–temperature electrical transport properties of buckypapers composed of doped single–walled carbon nanotubes. Carbon 2006, 44, 2178–2183. [Google Scholar] [CrossRef]
- Su, F.; Miao, M. Transition of electrical conductivity in carbon nanotube/silver particle composite buckypapers. Particuology 2014, 17, 15–21. [Google Scholar] [CrossRef]
- Smajda, R.; Kukovecz, Á.; Kónya, Z.; Kiricsi, I. Structure and gas permeability of multi–wall carbon nanotube buckypapers. Carbon 2007, 45, 1176–1184. [Google Scholar] [CrossRef]
- Chen, Y.; Miao, H.Y.; Zhang, M.; Liang, R.; Zhang, C.; Wang, B. Analysis of a laser post–process on a buckypaper field emitter for high and uniform electron emission. Nanotechnology 2009, 20, 325302. [Google Scholar] [CrossRef]
- Knapp, W.; Schleussner, D. Carbon Buckypaper field emission investigations. Vacuum 2002, 69, 333–338. [Google Scholar] [CrossRef]
- Chatterjee, S.; Chen, A. Functionalization of carbon buckypaper for the sensitive determination of hydrogen peroxide in human urine. Biosens. Bioelectron. 2012, 35, 302–307. [Google Scholar] [CrossRef]
- Ansón–Casaos, A.; González–Domínguez, J.M.; Terrado, E.; Martínez, M.T. Surfactant–free assembling of functionalized single–walled carbon nanotube buckypapers. Carbon 2010, 48, 1480–1488. [Google Scholar] [CrossRef] [Green Version]
- Lin, D.; Xing, B. Tannic Acid Adsorption and Its Role for Stabilizing Carbon Nanotube Suspensions. Environ. Sci. Technol. 2008, 42, 5917–5923. [Google Scholar] [CrossRef]
- Pacios, M.; Yilmaz, N.; Martín–Fernández, I.; Villa, R.; Godignon, P.; Del Valle, M.; Bartrolí, J.; Esplandiu, M.J. A simple approach for DNA detection on carbon nanotube microelectrode arrays. Sens. Actuators B Chem. 2012, 162, 120–127. [Google Scholar] [CrossRef]
- Wang, L.; Chen, W.; Xu, D.; Shim, B.S.; Zhu, Y.; Sun, F.; Liu, L.; Peng, C.; Jin, Z.; Xu, C.; et al. Simple, Rapid, Sensitive, and Versatile SWNT—Paper Sensor for Environmental Toxin Detection Competitive with ELISA. Nano Lett. 2009, 9, 4147–4152. [Google Scholar] [CrossRef] [Green Version]
- Liu, G.; Craig, V.S.J. Improved Cleaning of Hydrophilic Protein–Coated Surfaces using the Combination of Nanobubbles and SDS. ACS Appl. Mater. Interfaces 2009, 1, 481–487. [Google Scholar] [CrossRef]
- Gao, Y.; Kyratzis, I. Covalent Immobilization of Proteins on Carbon Nanotubes Using the Cross–Linker 1–Ethyl–3–(3–dimethylaminopropyl)carbodiimide—A Critical Assessment. Bioconjugate Chem. 2008, 19, 1945–1950. [Google Scholar] [CrossRef] [Green Version]
- Lee, C.T.; Smith, K.A.; Hatton, T.A. Photocontrol of Protein Folding: The Interaction of Photosensitive Surfactants with Bovine Serum Albumin. Biochemistry 2005, 44, 524–536. [Google Scholar] [CrossRef]


Publisher’s Note: MDPI stays neutral with regard to jurisdictional claims in published maps and institutional affiliations. |
© 2022 by the authors. Licensee MDPI, Basel, Switzerland. This article is an open access article distributed under the terms and conditions of the Creative Commons Attribution (CC BY) license (https://creativecommons.org/licenses/by/4.0/).
Share and Cite
Lee, K.-J.; Lee, M.-H.; Shih, Y.-H.; Wang, C.-P.; Lin, H.-Y.; Jian, S.-R. Fabrication of Carboxylated Carbon Nanotube Buckypaper Composite Films for Bovine Serum Albumin Detection. Coatings 2022, 12, 810. https://doi.org/10.3390/coatings12060810
Lee K-J, Lee M-H, Shih Y-H, Wang C-P, Lin H-Y, Jian S-R. Fabrication of Carboxylated Carbon Nanotube Buckypaper Composite Films for Bovine Serum Albumin Detection. Coatings. 2022; 12(6):810. https://doi.org/10.3390/coatings12060810
Chicago/Turabian StyleLee, Kuo-Jung, Ming-Husan Lee, Yung-Hui Shih, Chao-Ping Wang, Hsun-Yu Lin, and Sheng-Rui Jian. 2022. "Fabrication of Carboxylated Carbon Nanotube Buckypaper Composite Films for Bovine Serum Albumin Detection" Coatings 12, no. 6: 810. https://doi.org/10.3390/coatings12060810