
The Corrosion Behaviors of an As-Rolled Mg-8Li (in wt.%) Alloy in Two Differently Concentrated NaCl Solutions


Abstract
:1. Introduction
2. Materials and Methods
2.1. Sample Preparation
2.2. Electrochemical Tests
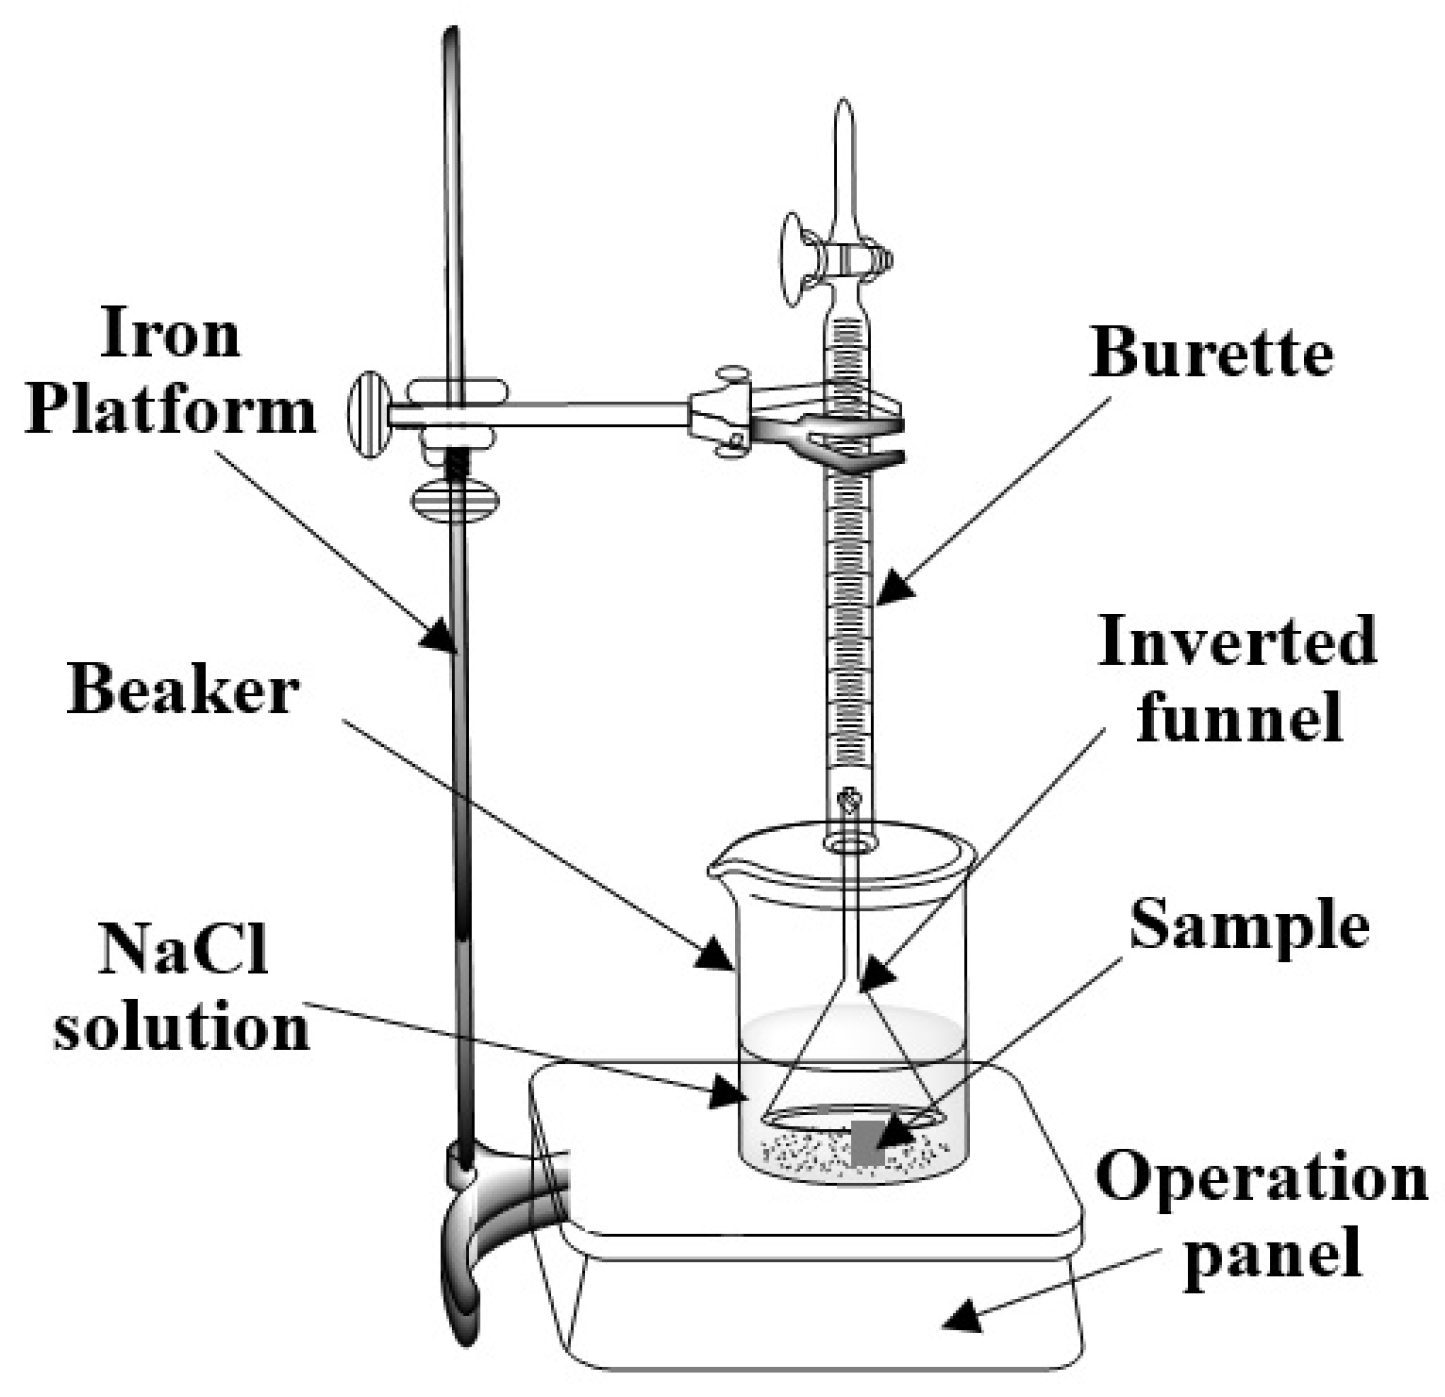
2.3. Hydrogen Evolution Measurements and Immersion Test
3. Results
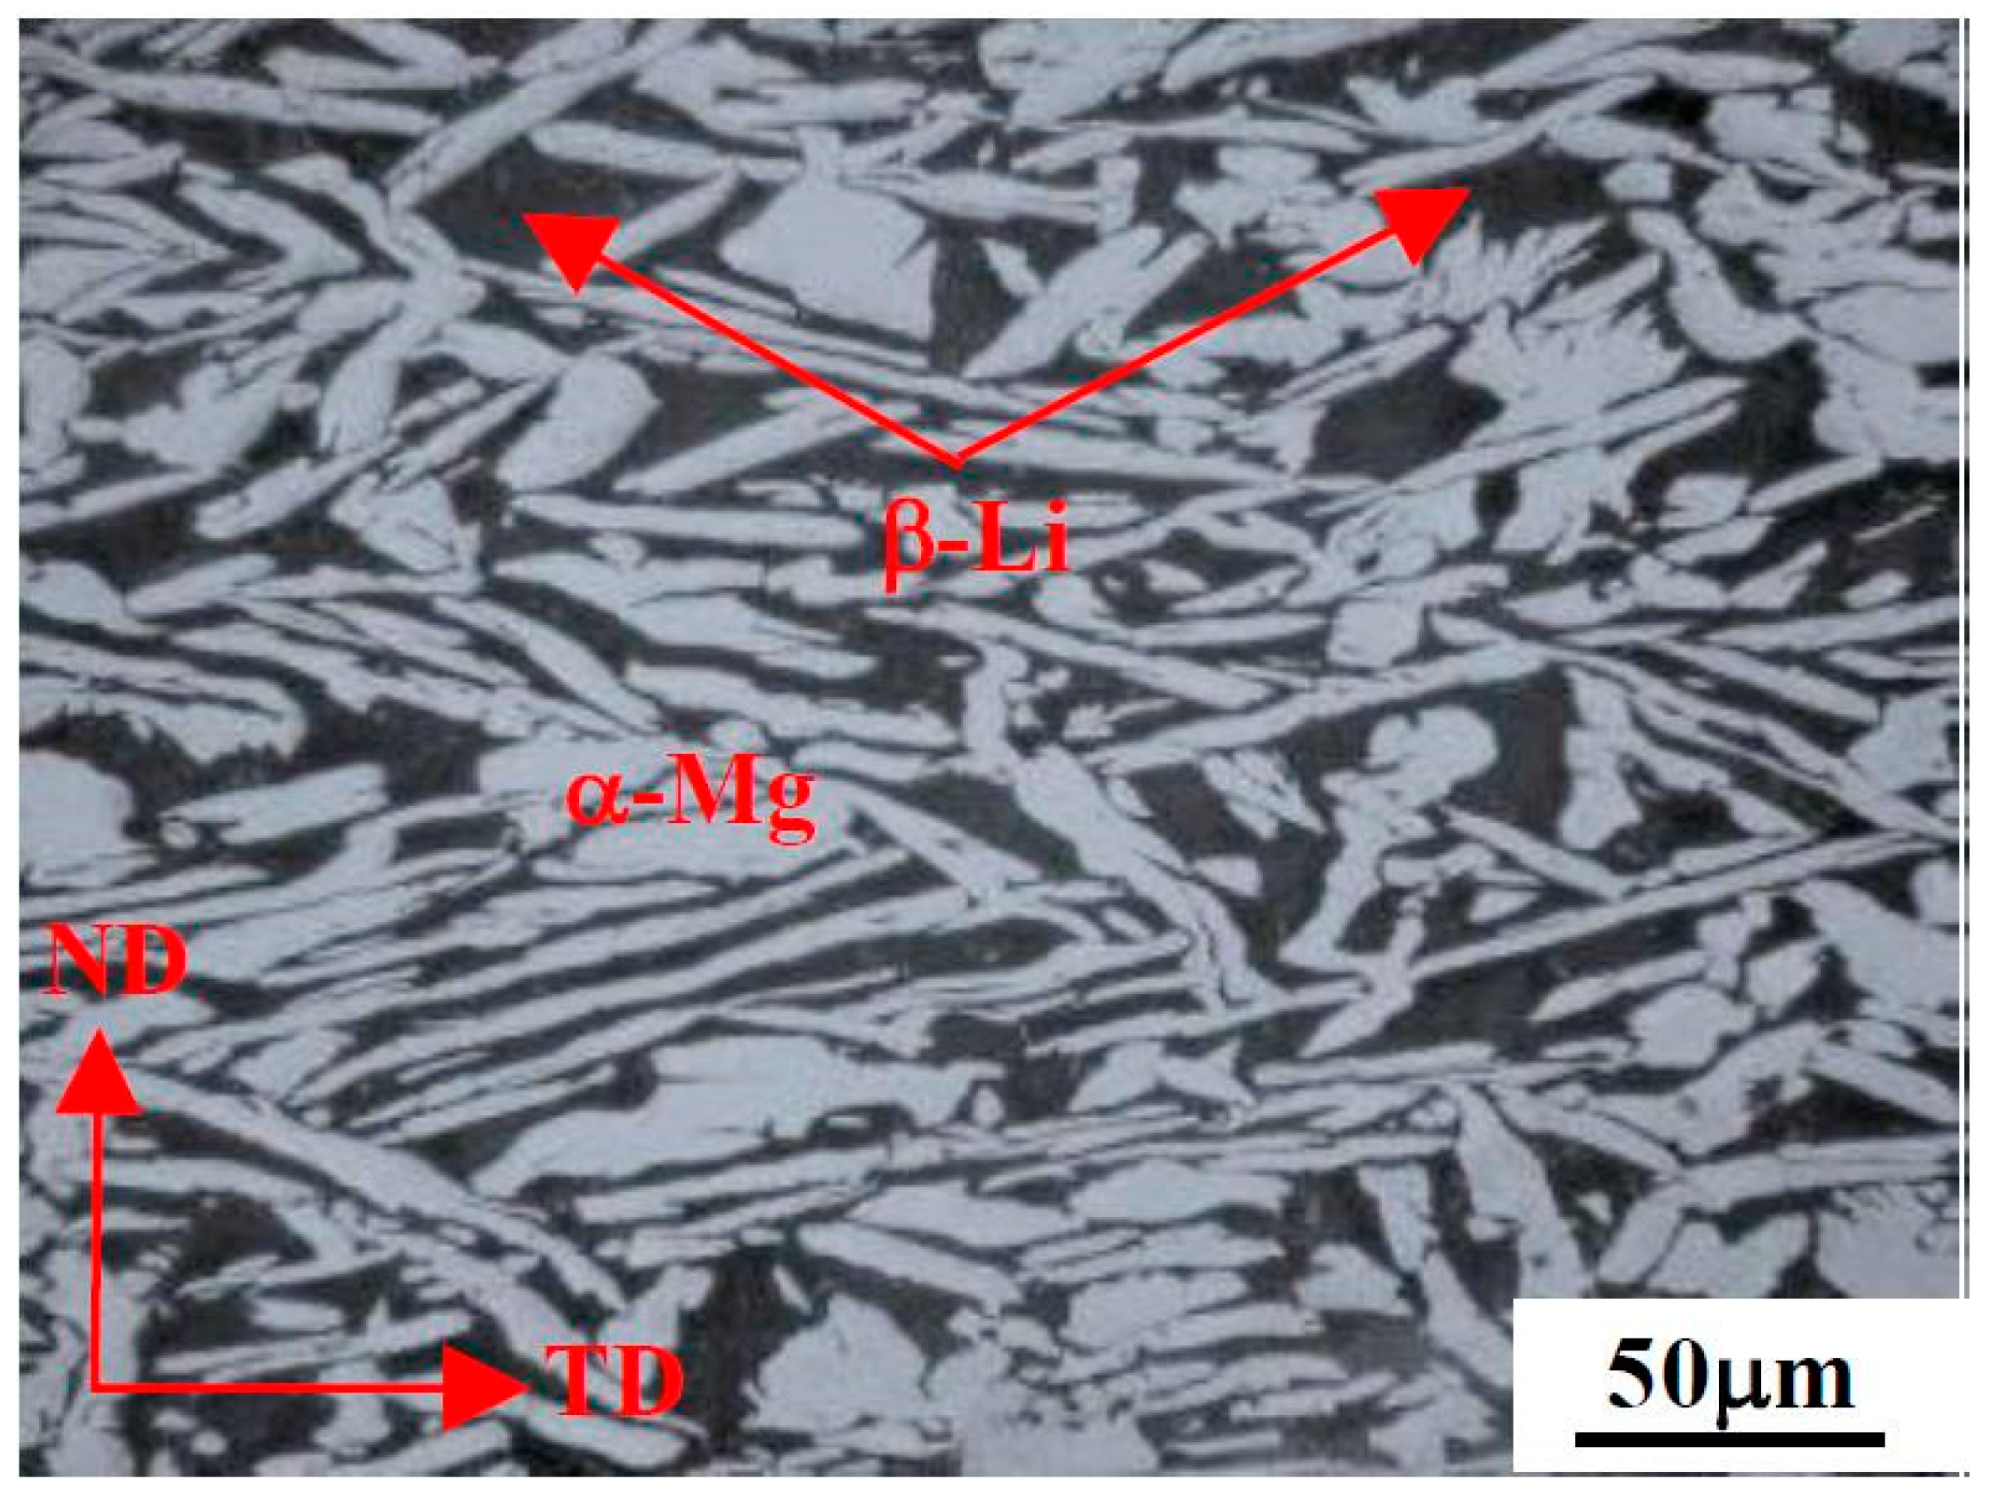
3.1. Microstructure
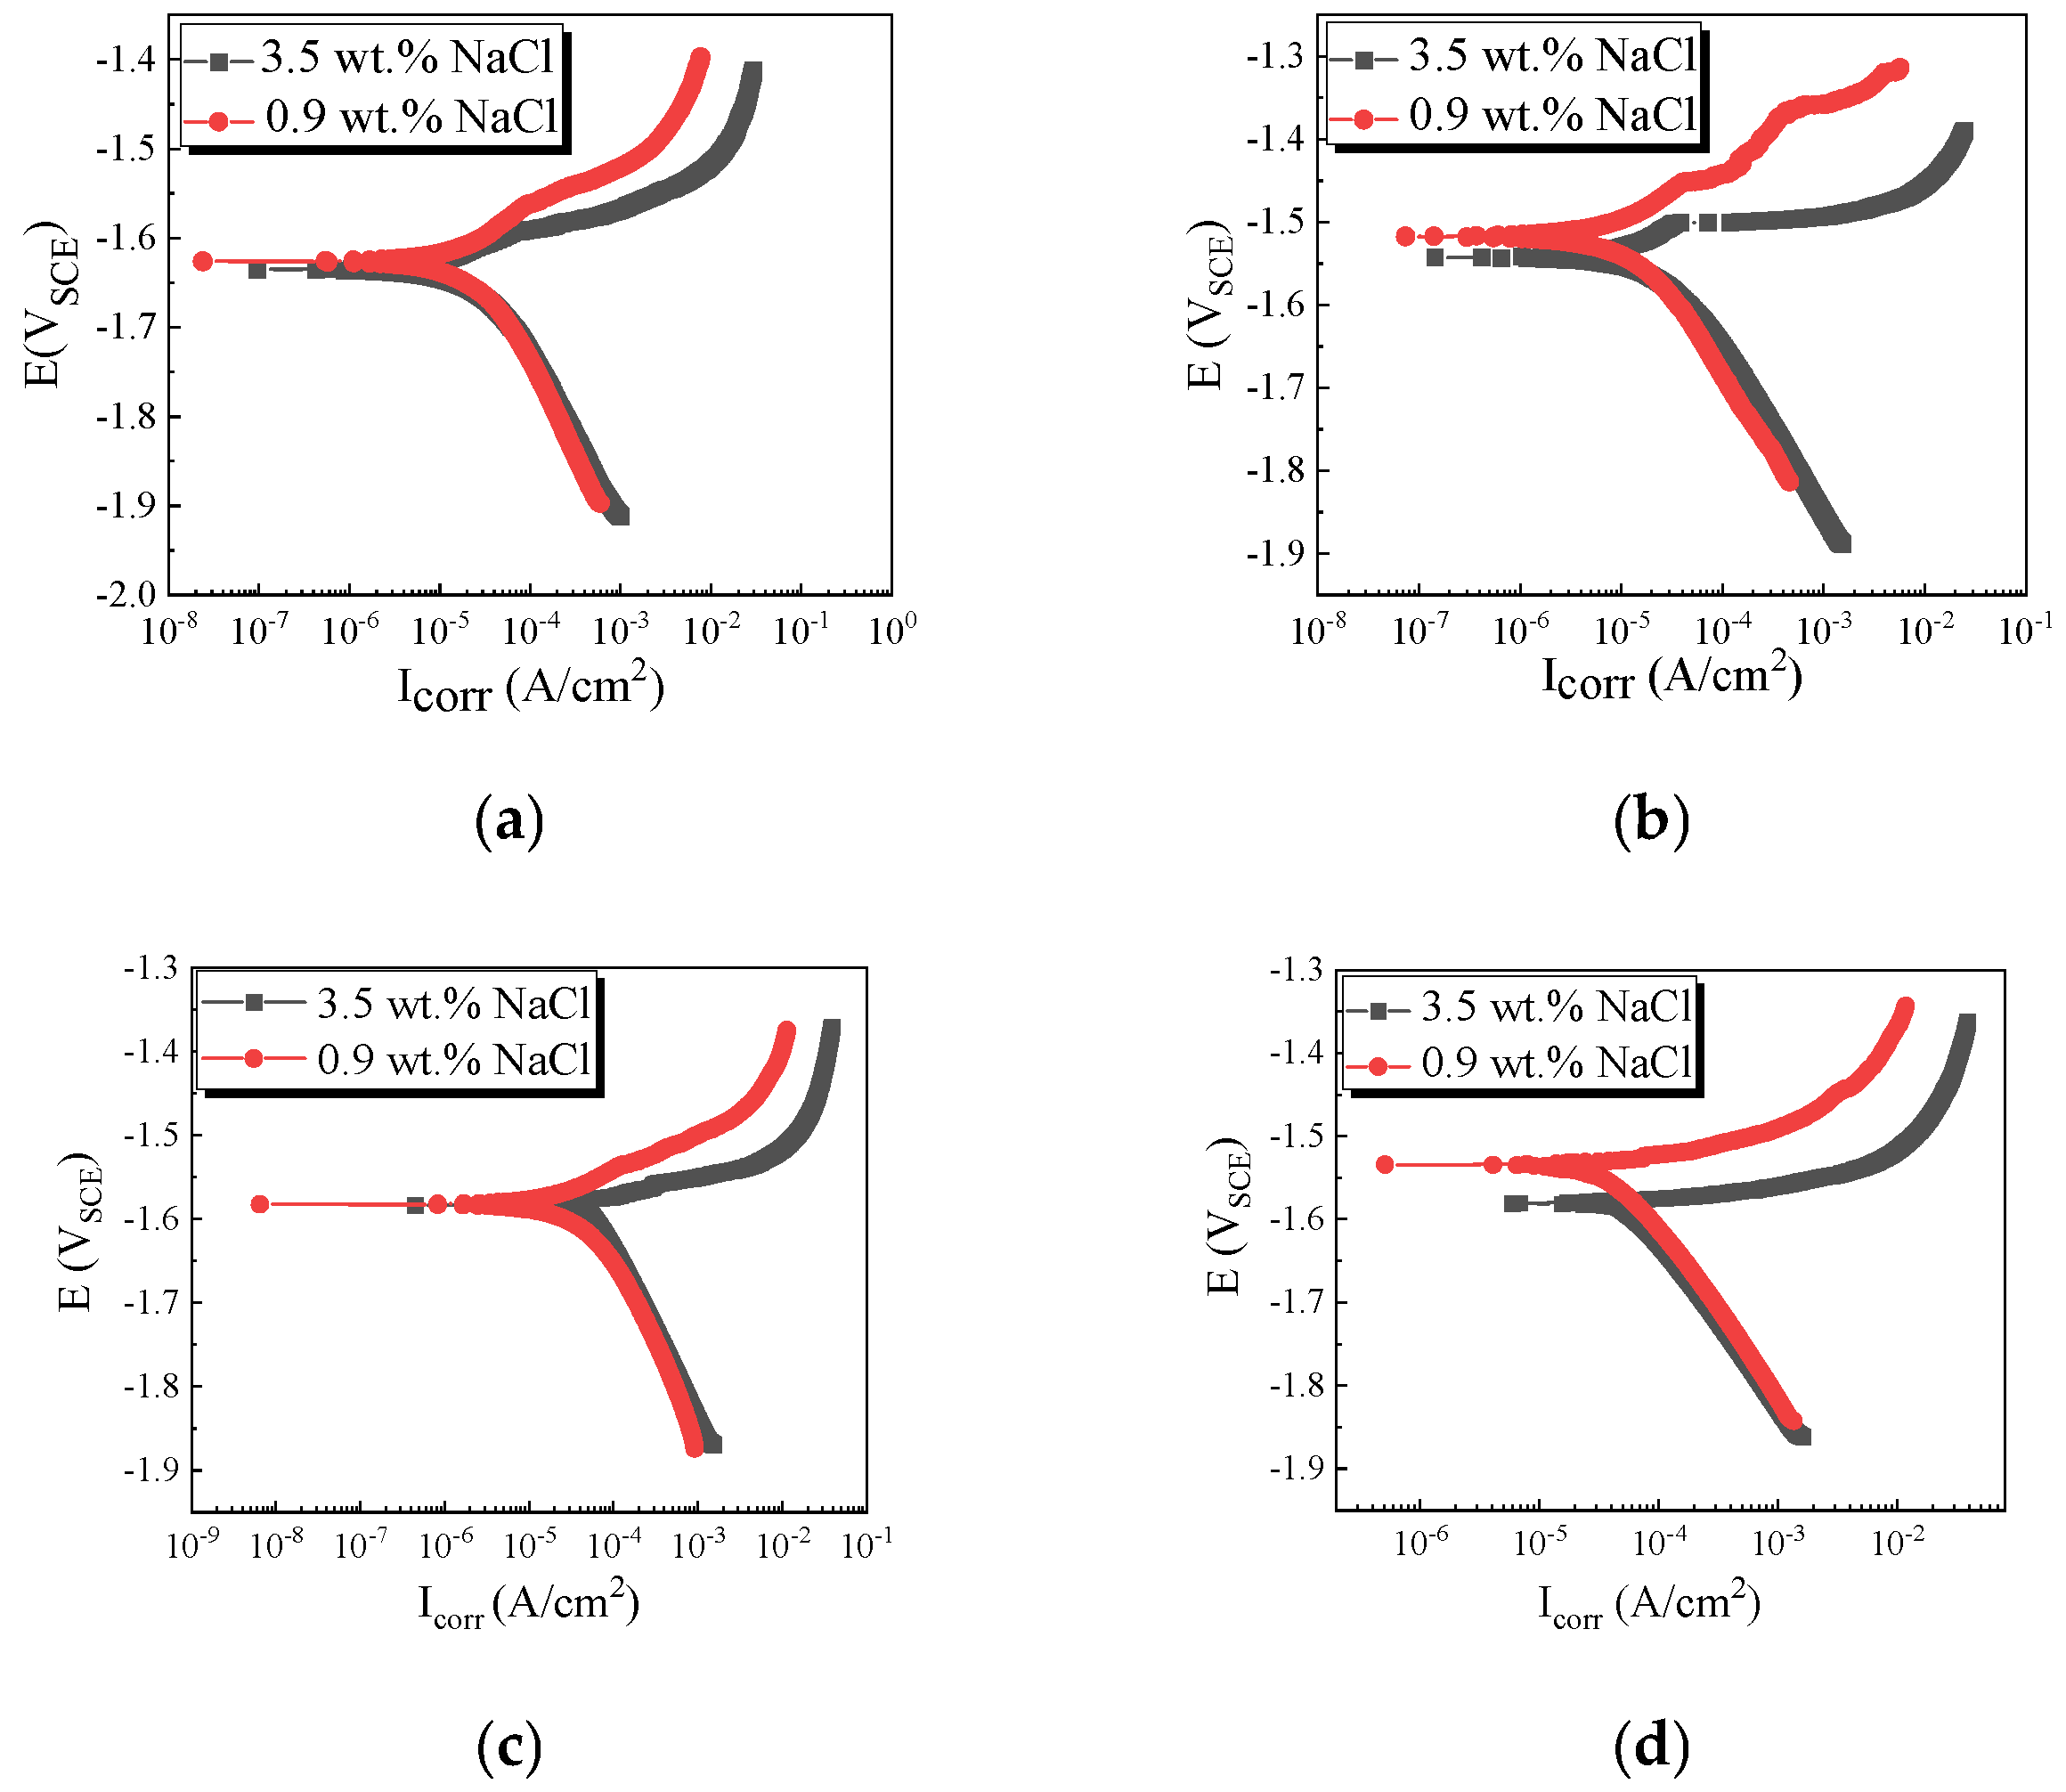
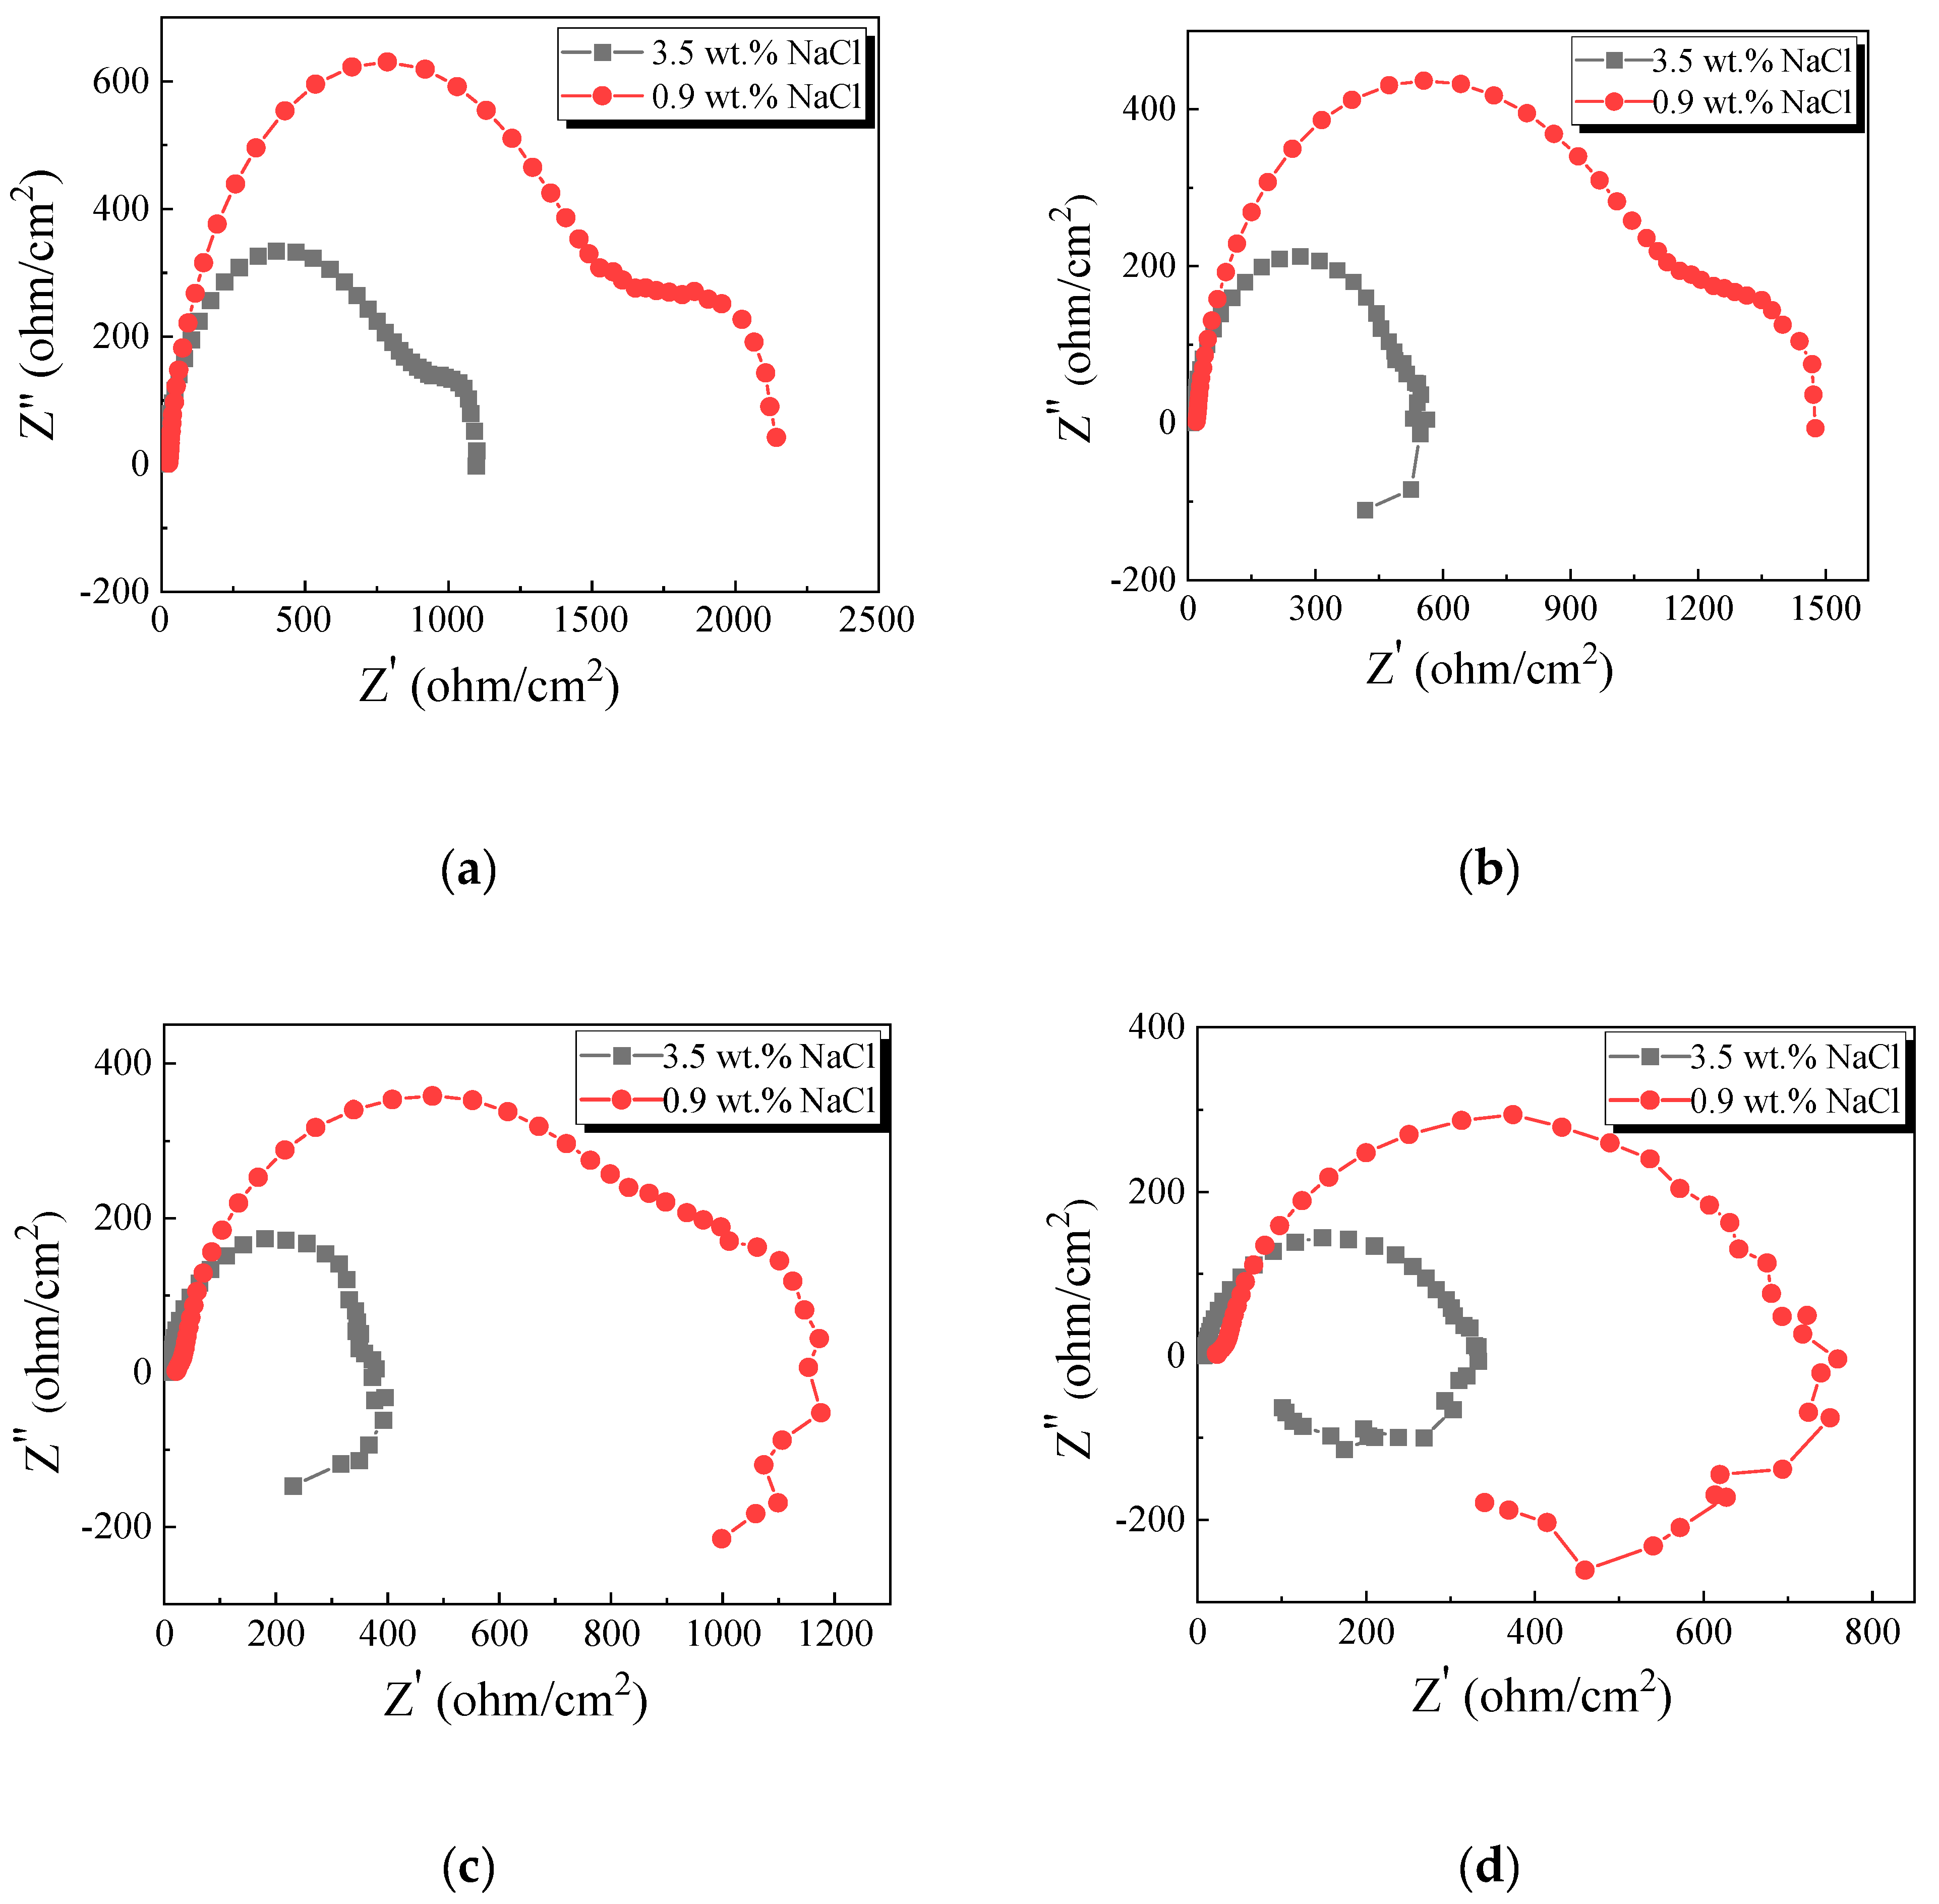
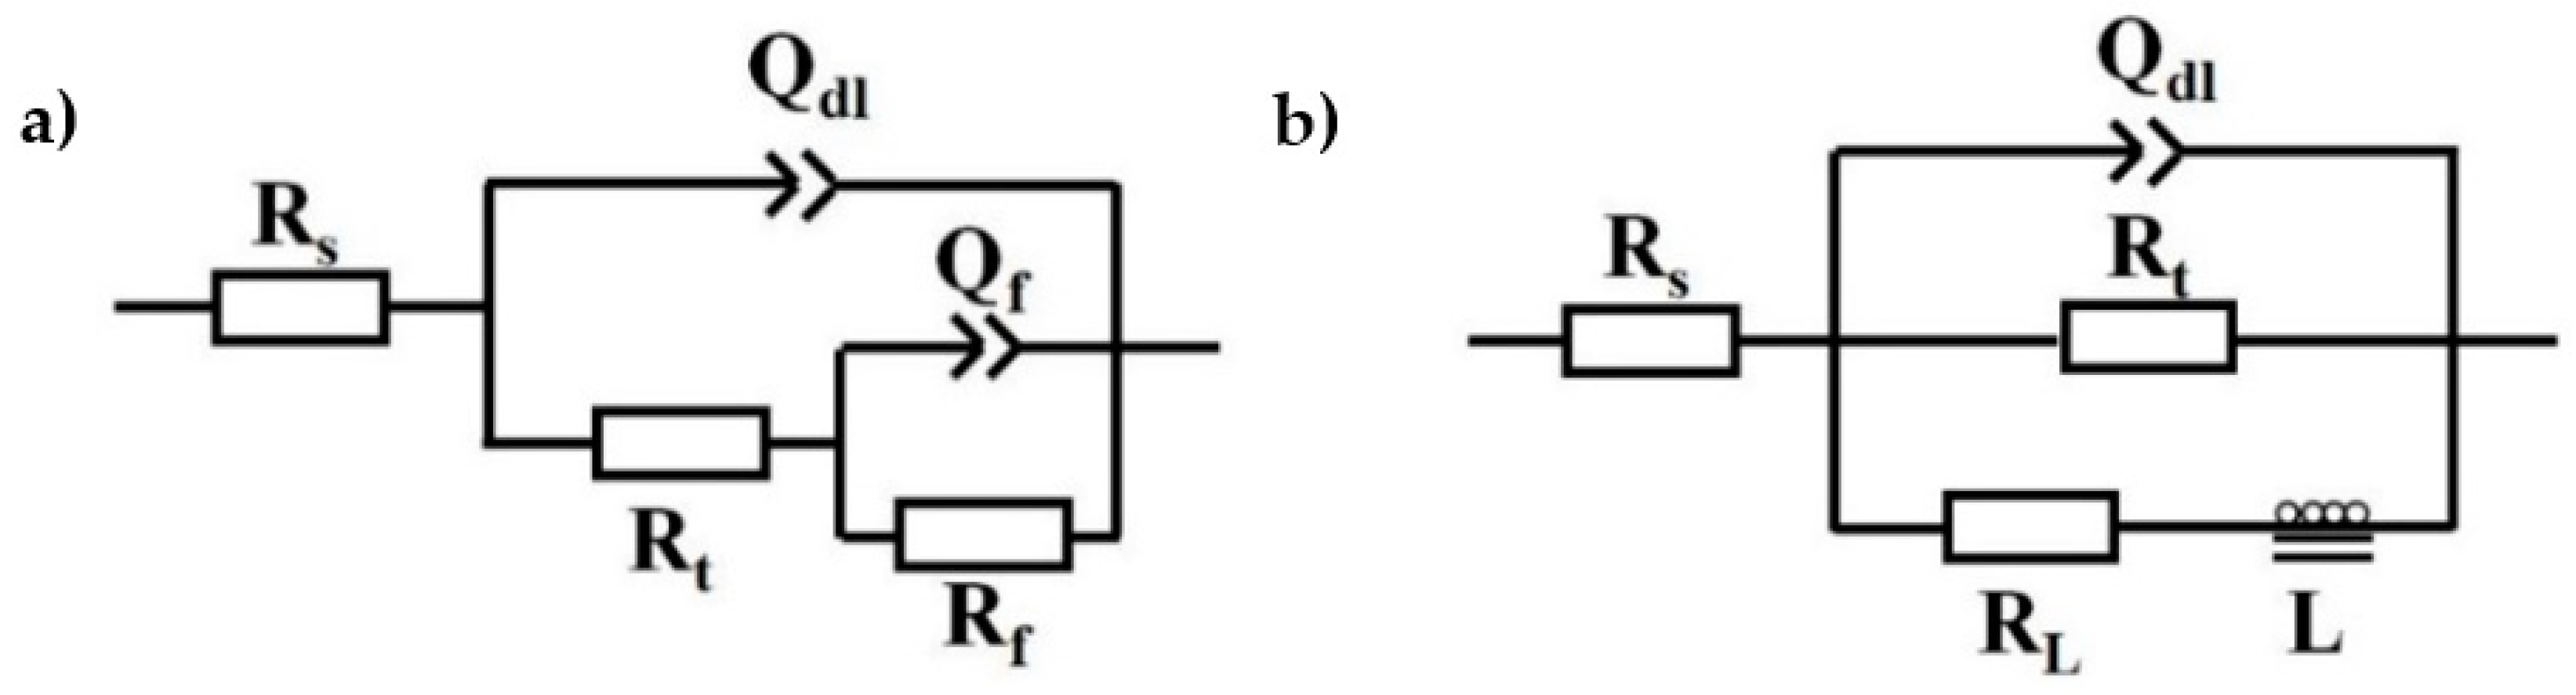
3.2. Electrochemical Responses
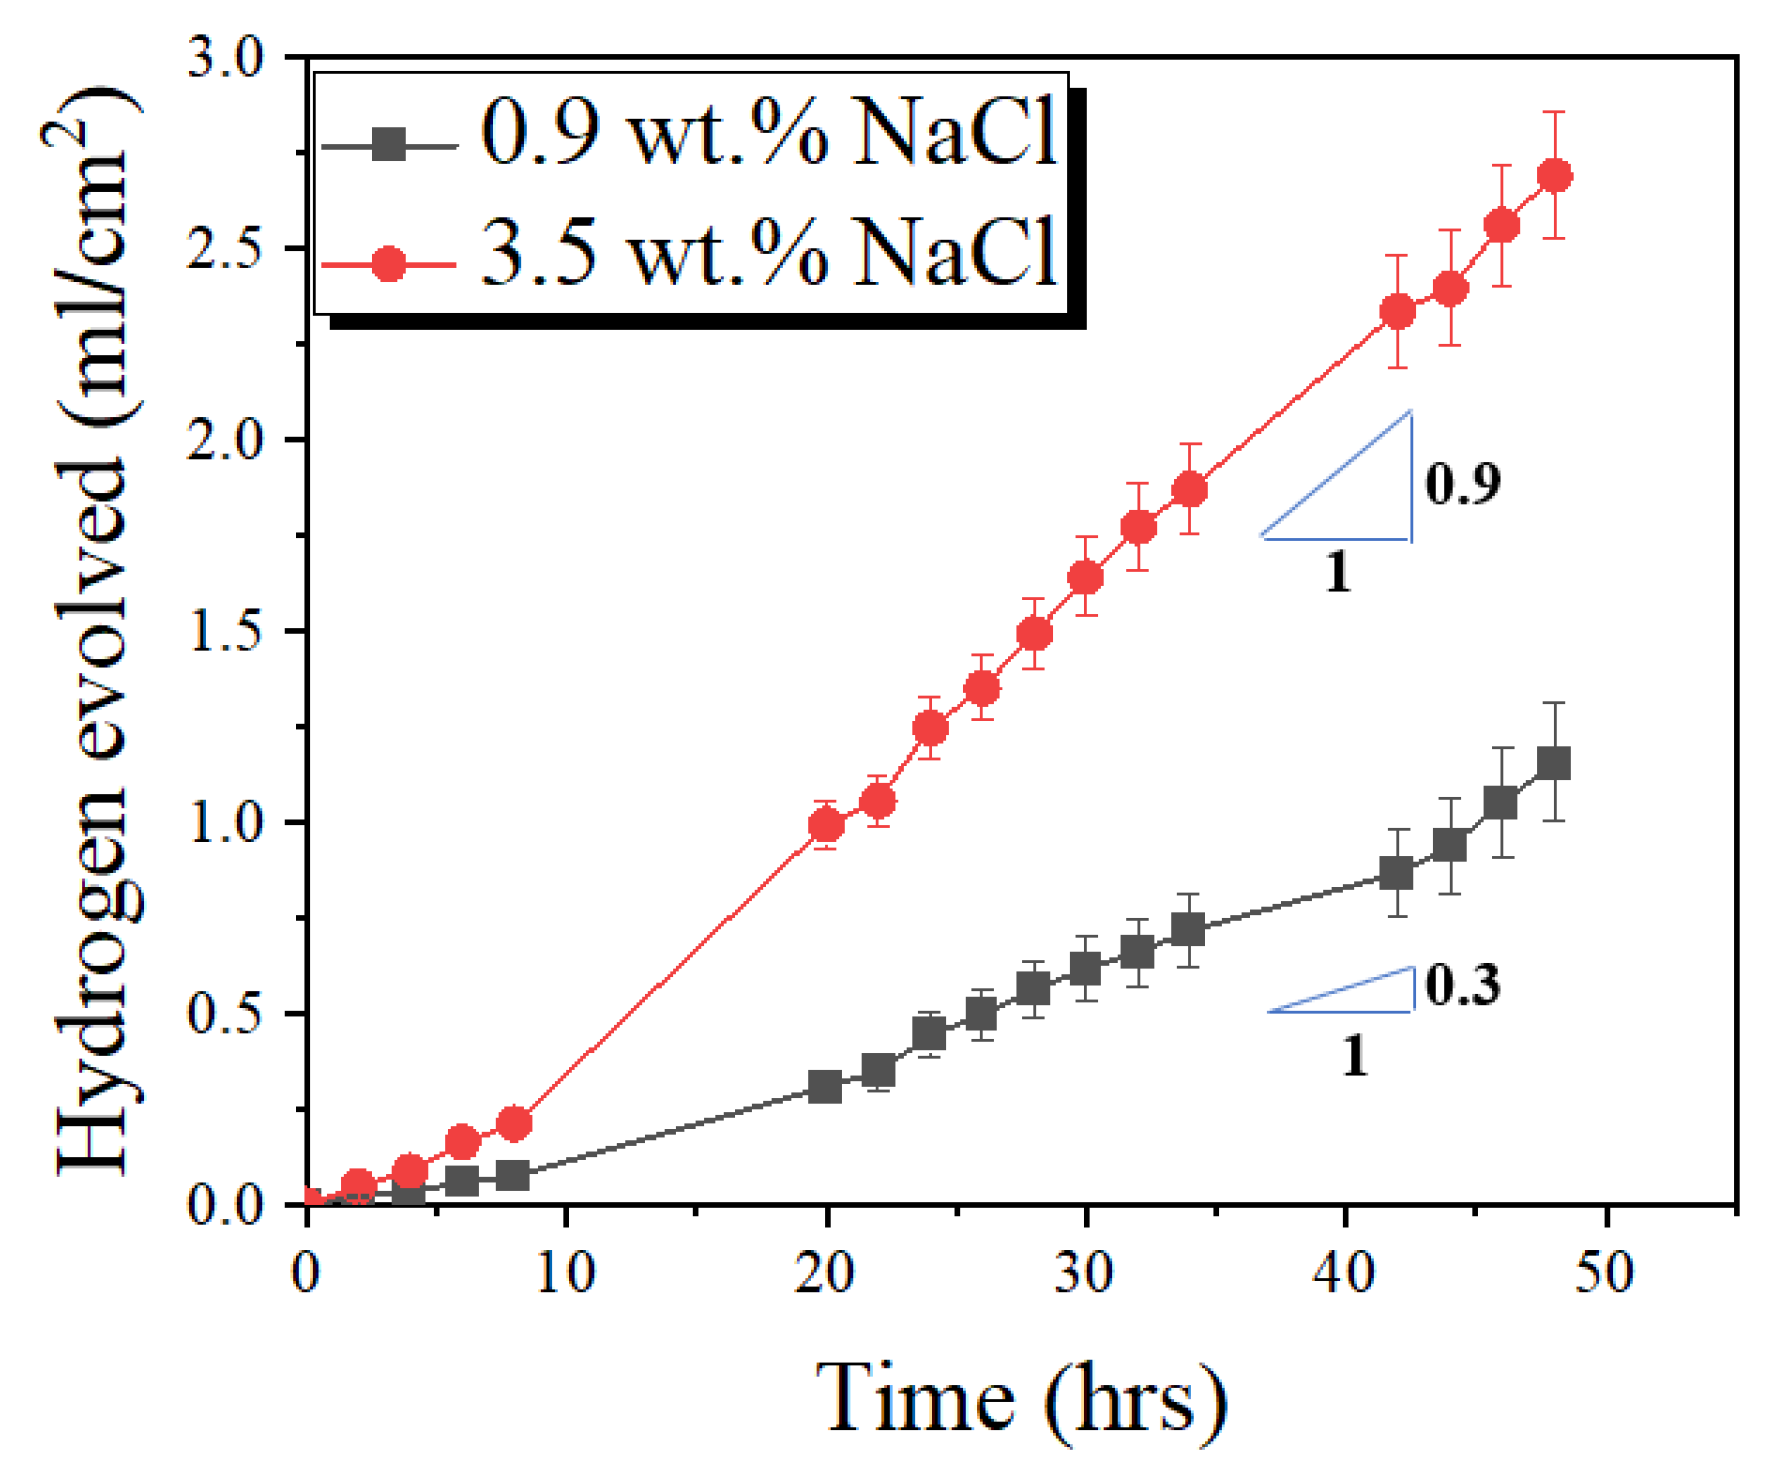
3.3. Hydrogen Evolution
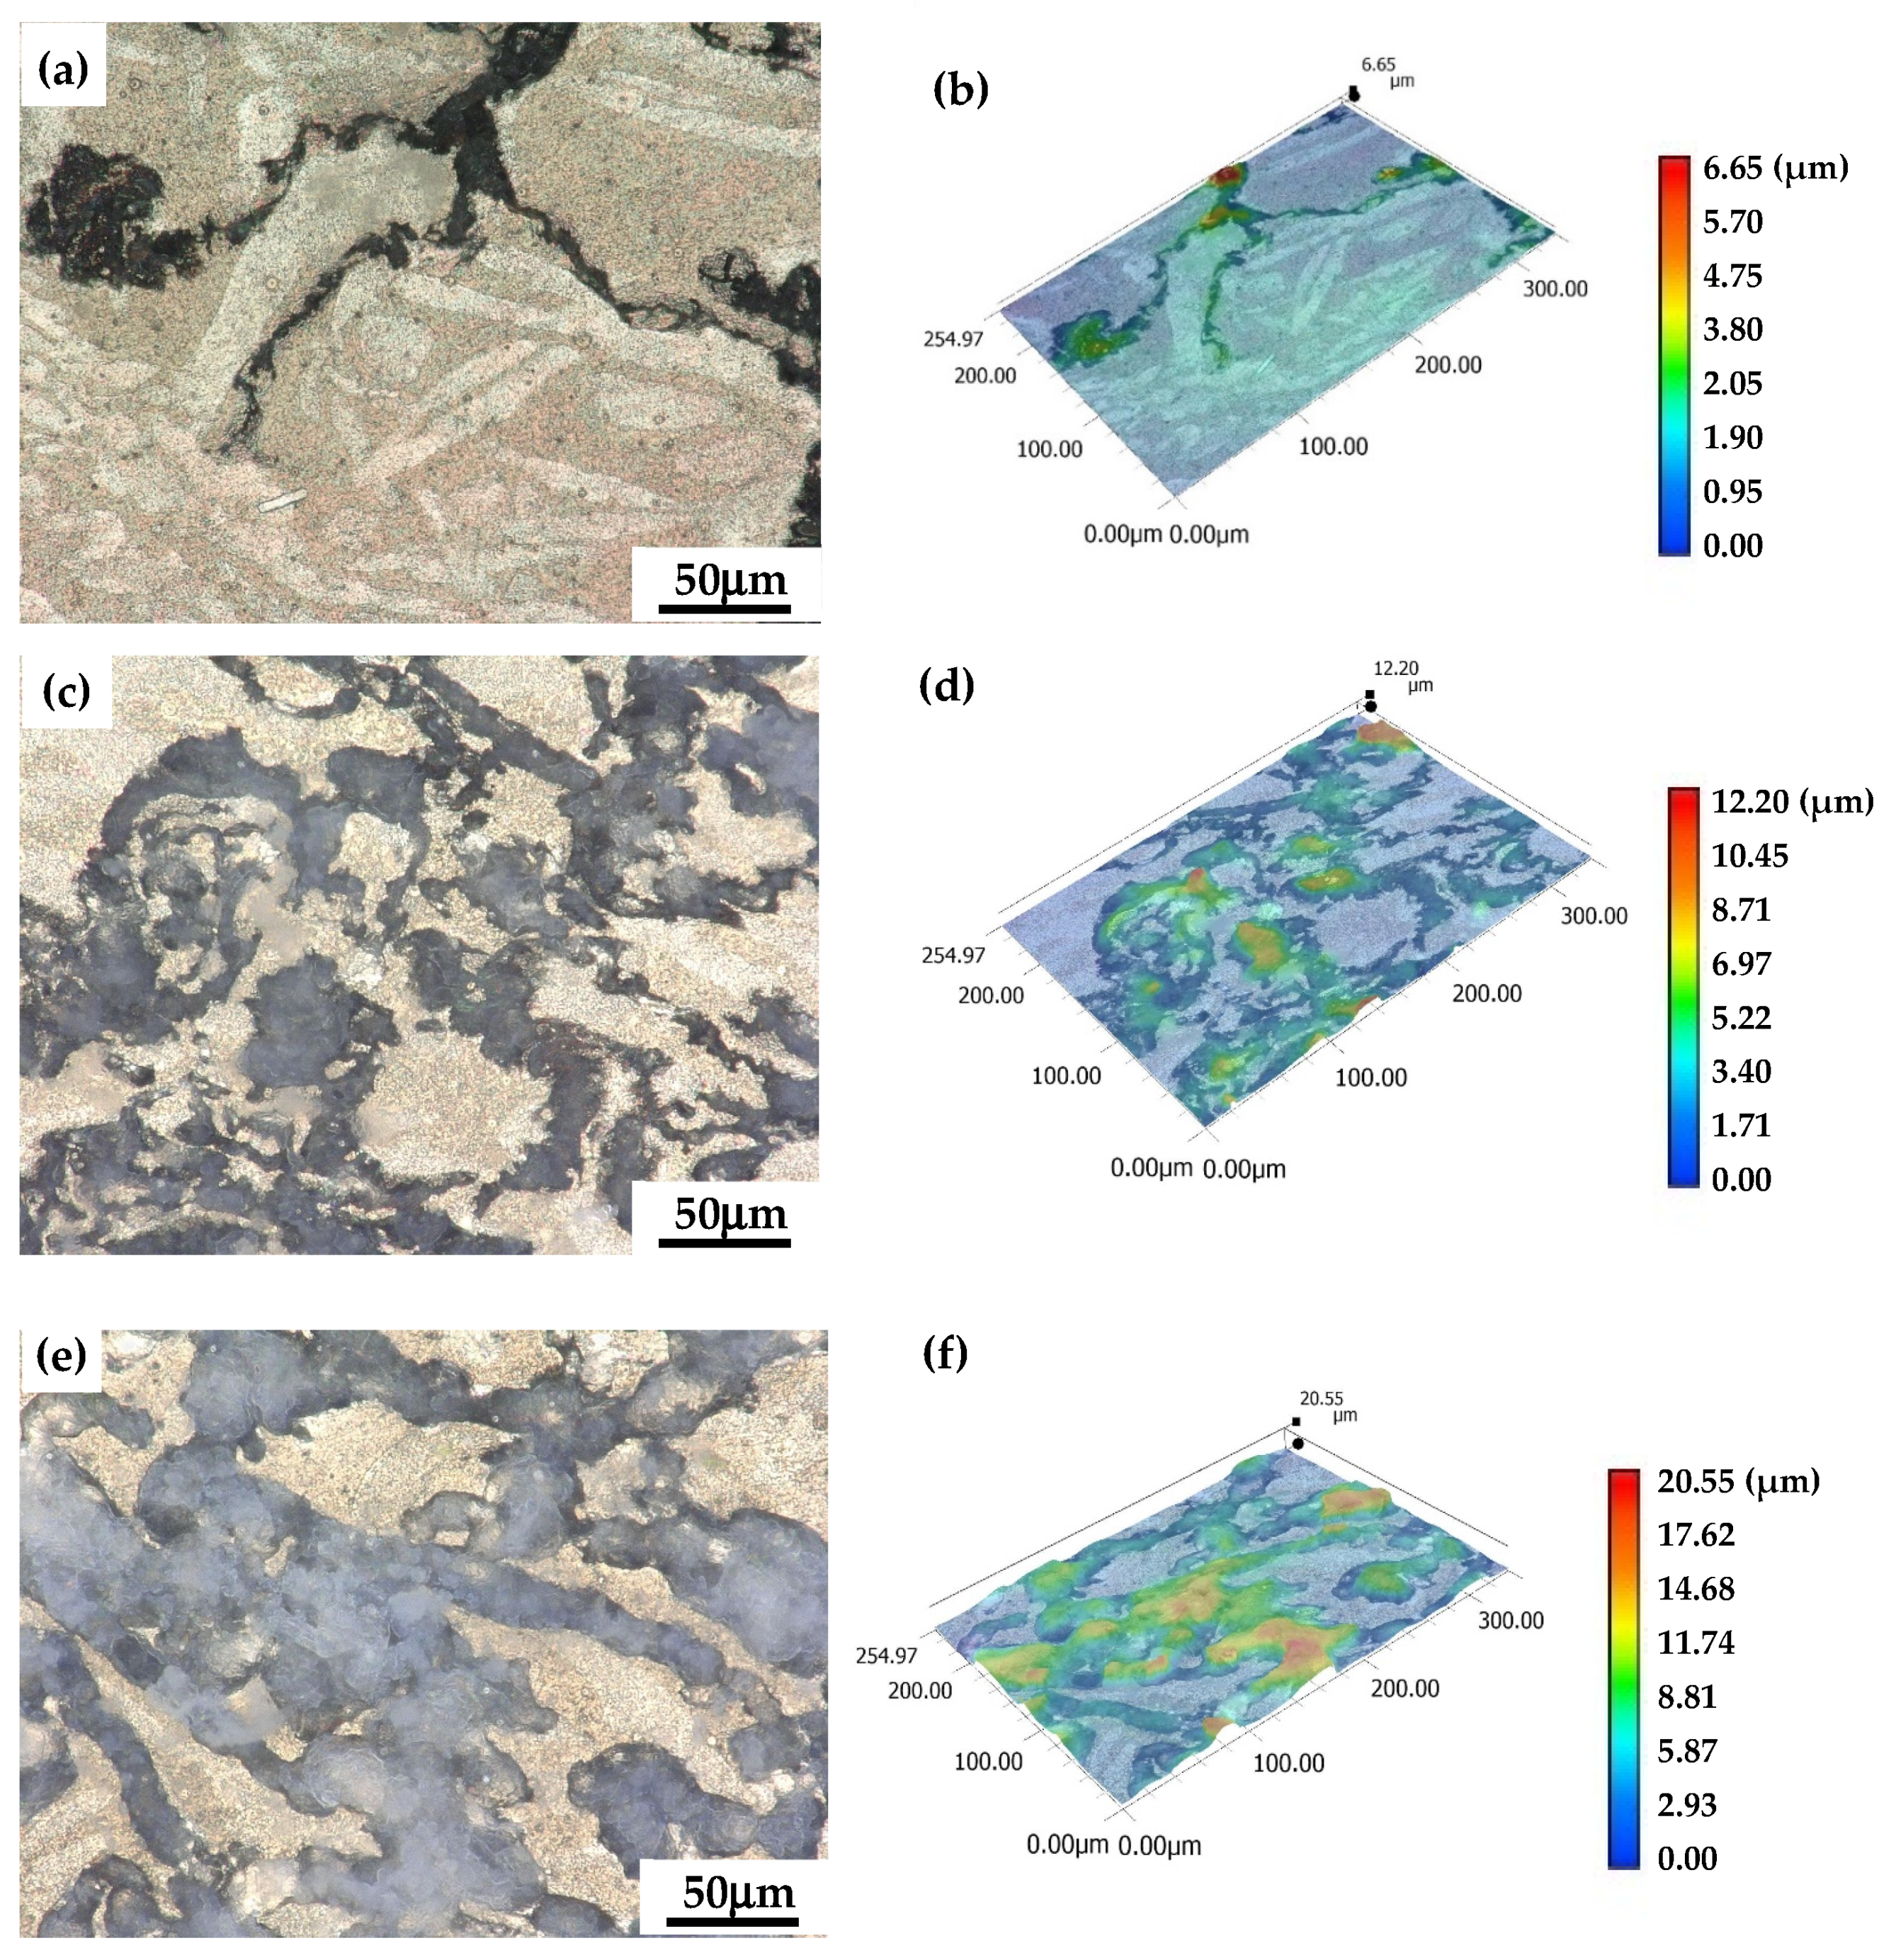
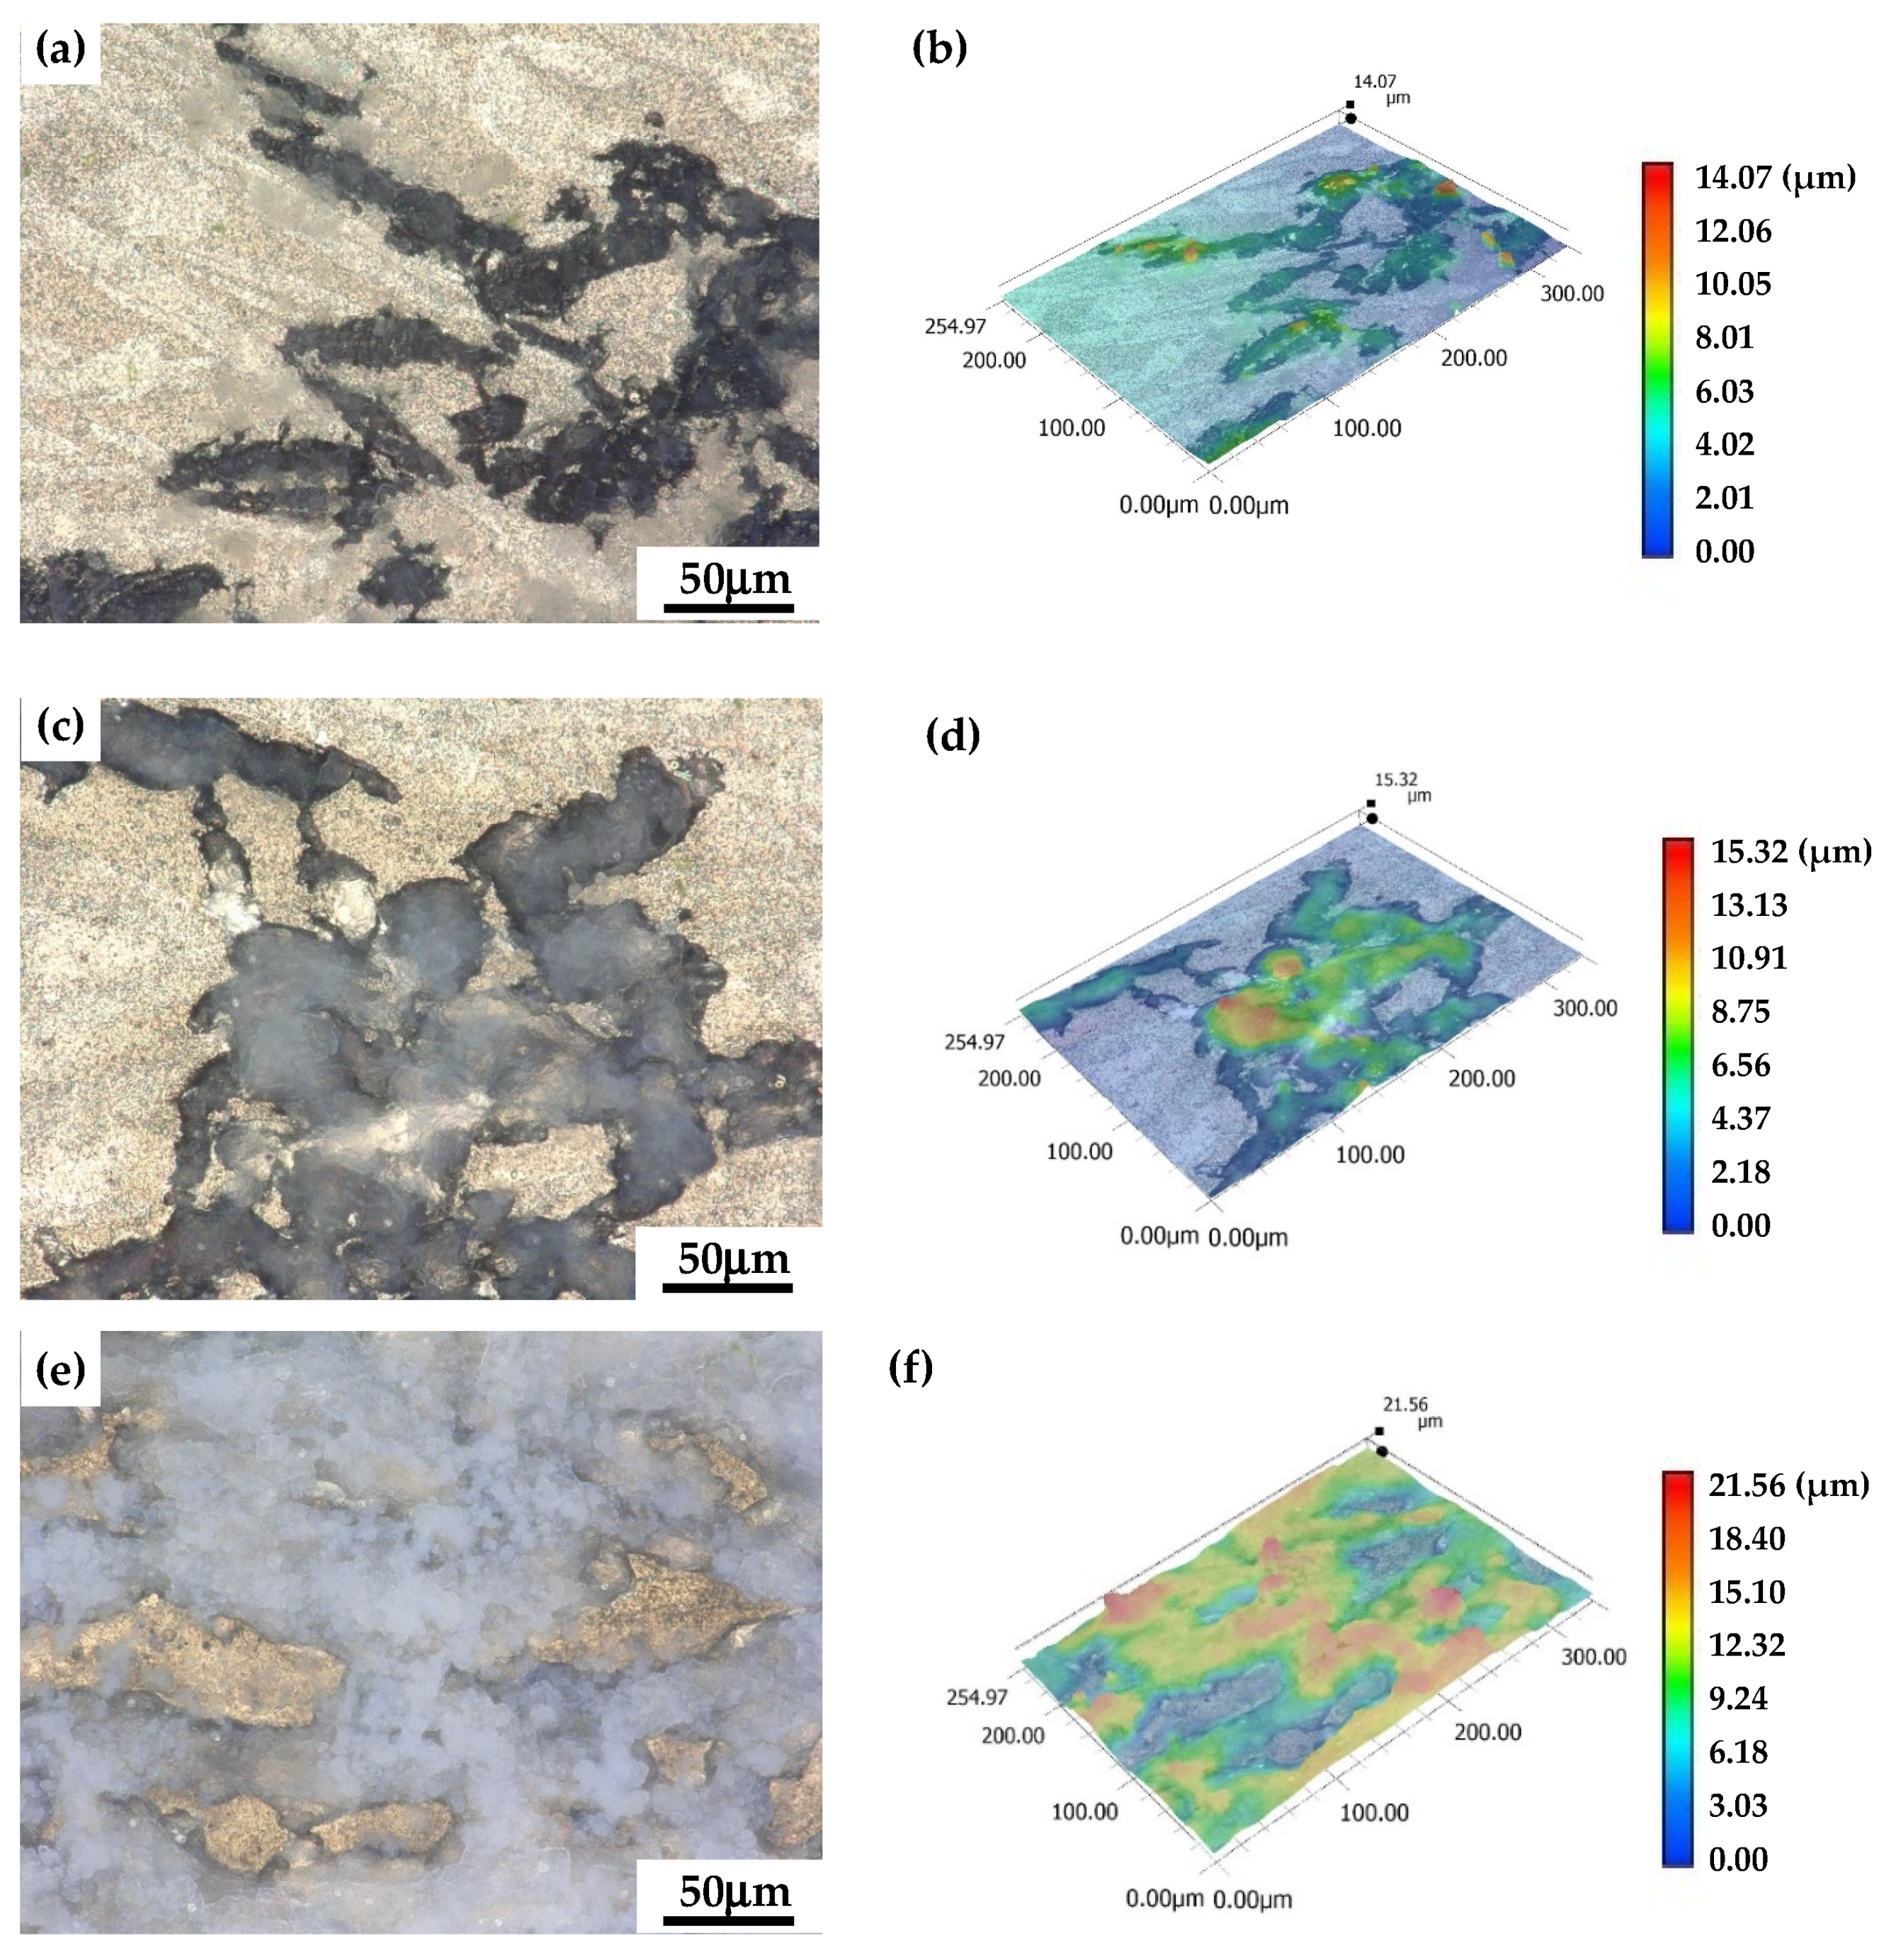
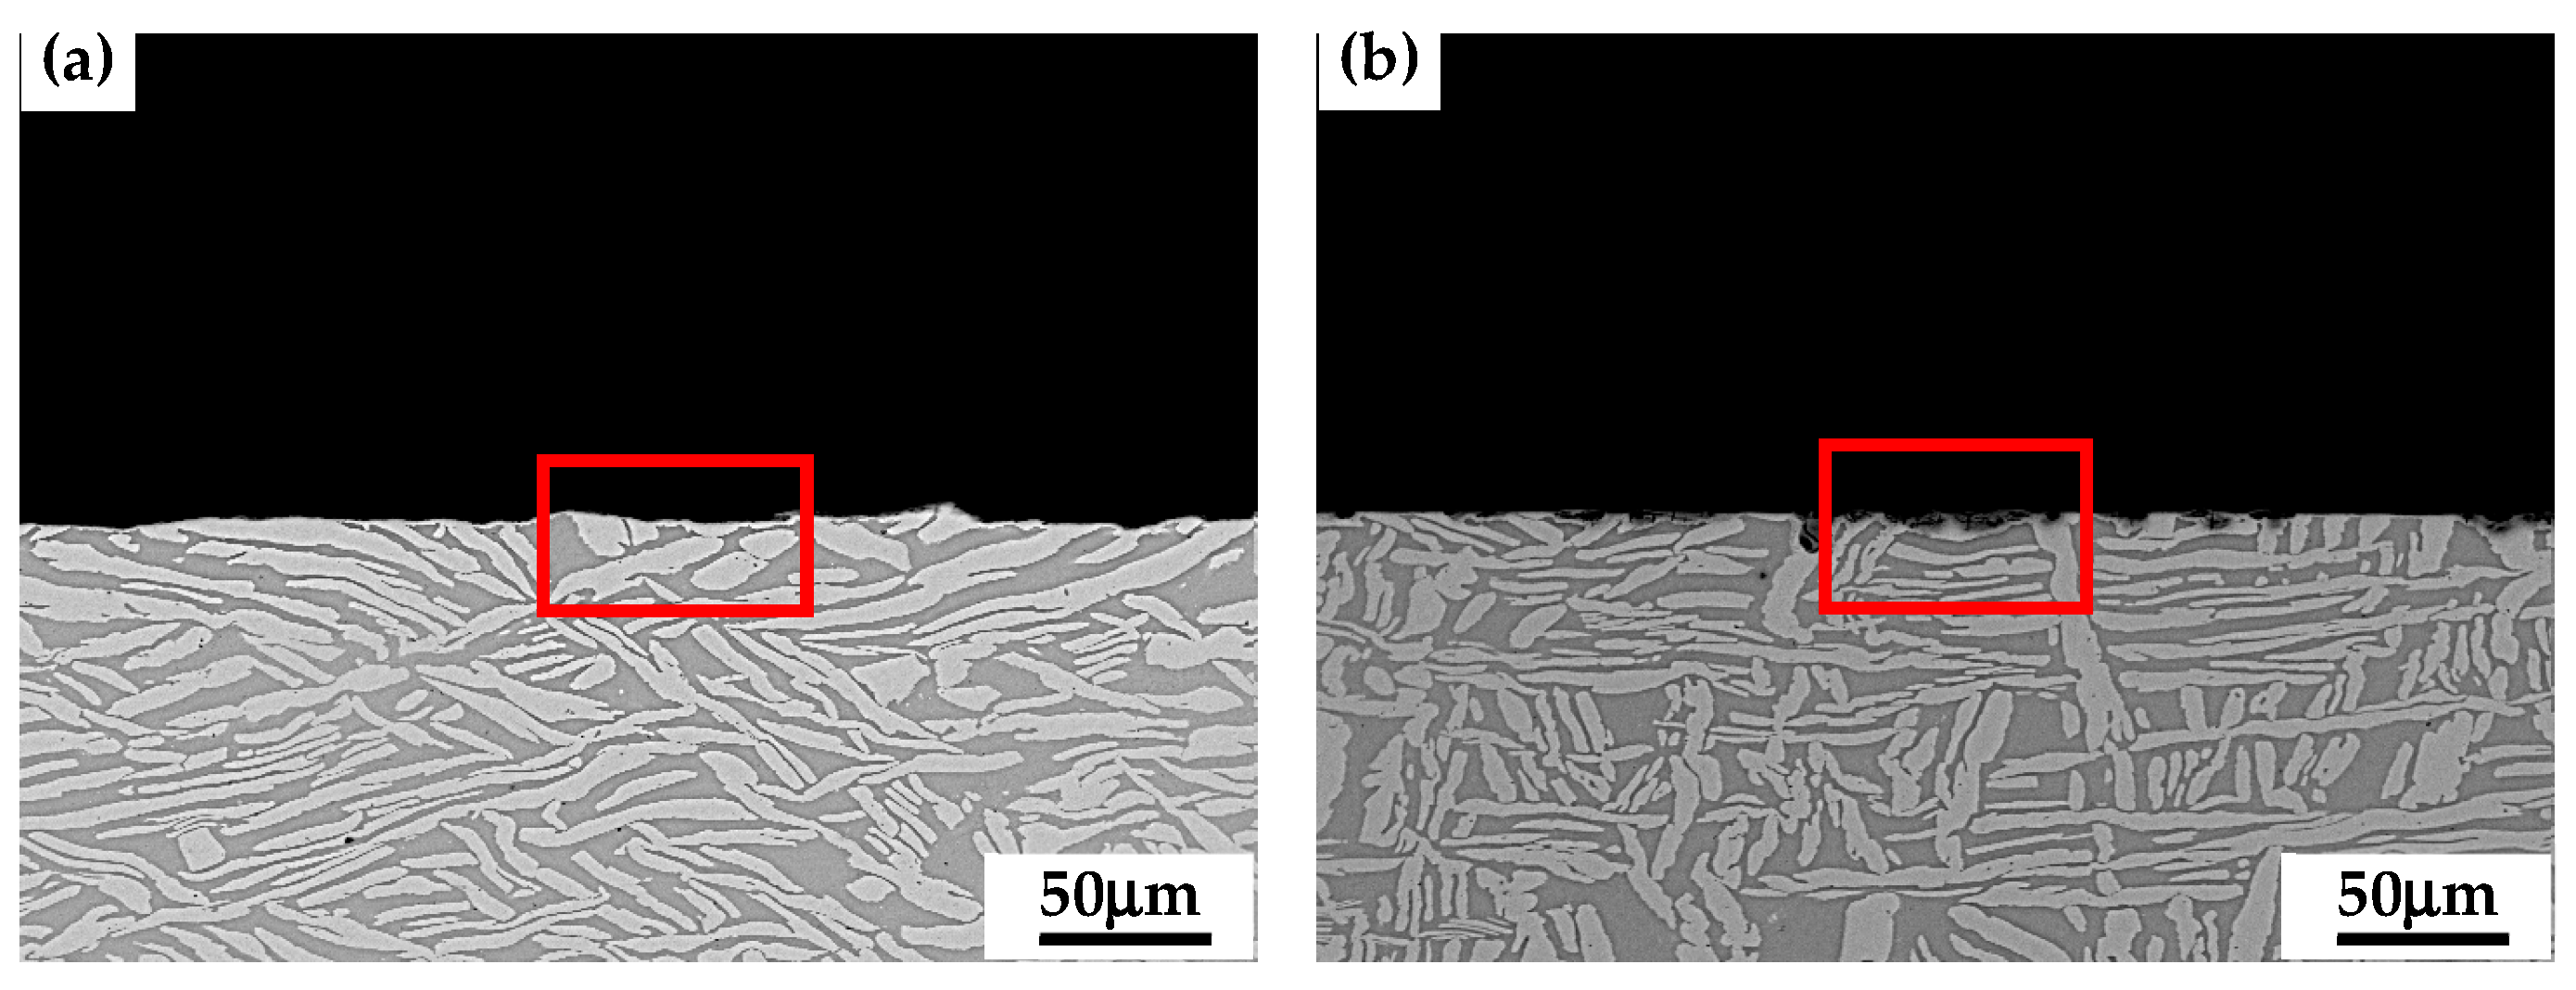
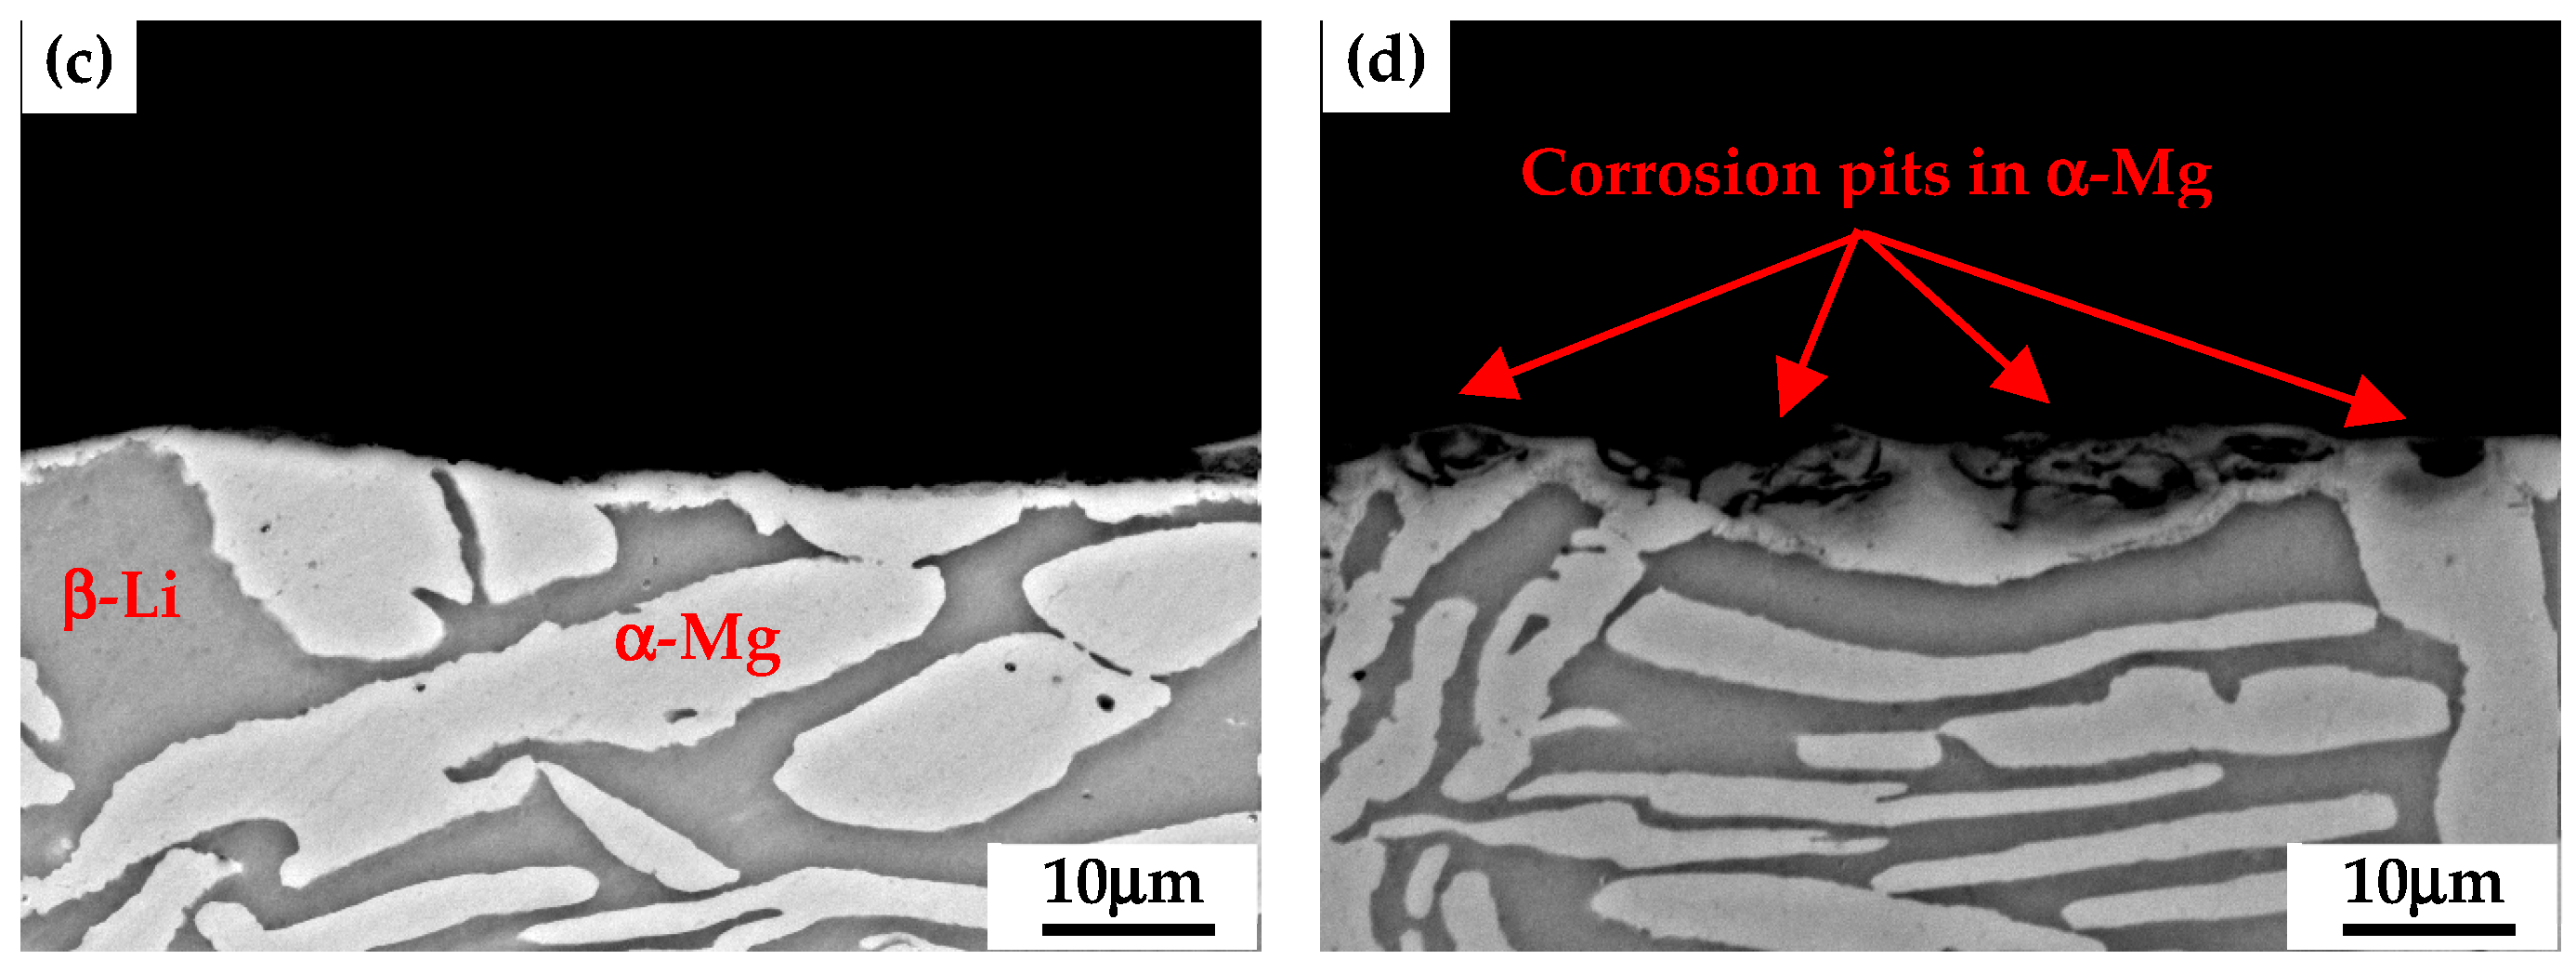
3.4. Observations to the Corrosion Morphologies
4. Conclusions
- (1)
- Based on the determined slopes of the measured hydrogen evolution curves, the corrosion rate of the alloy in the 3.5 wt.% NaCl solution is 3 times higher than that in the 0.9 wt.% NaCl solution when the immersion time exceeds 8 h.
- (2)
- The corrosion mechanisms of the as-rolled Mg-8%Li alloy are obviously different in the two concentrated NaCl solutions. In the 0.9 wt.% NaCl solution, the corrosion attack mainly occurs at the α-Mg phase. In the 3.5 wt.% NaCl solution, the corrosion attack initially occurs in the α-Mg phase and then gradually extends to the β-Li phase.
Author Contributions
Funding
Institutional Review Board Statement
Informed Consent Statement
Data Availability Statement
Conflicts of Interest
References
- Zhu, W.H.; Zheng, Z.X.; Feng, J.Z.; Xu, H.H.; Wang, Y.T.; Lu, L.L. Dynamic Design Method for Magnesium Alloys Wheel of New Energy Vehicles. Adv. Mater. Res. 2010, 961, 930–934. [Google Scholar] [CrossRef]
- Kannan, M.B.; Raman, P.K.S. In vitro degradation and mechanical integrity of calcium-containing magnesium alloys in modified-simulated body fluid. Biomaterials 2008, 29, 2306–2314. [Google Scholar] [CrossRef]
- Wang, B.J.; Xu, D.K.; Cai, X.; Qiao, Y.X.; Sheng, L.Y. Effect of rolling ratios on the microstructural evolution and corrosion performance of an as-rolled Mg-8 wt.%Li alloy. J. Magnes. Alloy. 2021, 9, 560–568. [Google Scholar] [CrossRef]
- Zhang, Y.; Xu, J.; Ruan, Y.C.; Yu, M.K.; O’Laughlin, M.; Wise, H.; Chen, D.; Tian, L.; Shi, D.; Wang, J.; et al. Implant-derived magnesium induces local neuronal production of CGRP to improve bone-fracture healing in rats. Nat. Med. 2016, 22, 1160–1169. [Google Scholar] [CrossRef]
- Wang, B.J.; Xu, K.; Xu, D.K.; Cai, X.; Qiao, Y.X.; Sheng, L.Y. Anisotropic corrosion behavior of hot-rolled Mg-8 wt.%Li alloy. J. Mater. Sci. Technol. 2020, 53, 102–111. [Google Scholar] [CrossRef]
- Tang, Q.B.; Huang, S.D.; Wu, T.B. Application analysis of magnesium alloys in weapon components. Ordnance. Mater. Sci. Eng. 2007, 30, 69–72. [Google Scholar]
- Lv, Y.; Wang, L.; Li, Y.; Jin, Y.; Feng, J.; Ren, Y.M.; Cao, D.; Wang, G.; Zhang, M. The effect of different concentrations of Na2SnO3 on the electrochemical behaviors of the Mg-8Li electrode. Ionics 2014, 20, 1573–1578. [Google Scholar] [CrossRef]
- Chen, Z. Magnesium Alloy; Chemical Industry Press: Beijing, China, 2004. [Google Scholar]
- Li, M.; Hao, H.; Zhang, A.; Song, Y.; Zhang, X. Effects of Nd on microstructure and mechanical properties of as-cast Mg-8Li-3Al alloy. J. Rare Earths 2012, 30, 492–496. [Google Scholar] [CrossRef]
- Xu, D.K.; Li, C.Q.; Wang, B.J.; Han, E.H. Effect of icosahedral phase on the crystallographic texture and mechanical anisotropy of duplex structured Mg-Li alloys. Mater. Des. 2015, 88, 88–97. [Google Scholar] [CrossRef]
- Xu, D.; Wang, B.; Li, C.; Zu, T.; Han, E. Effect of icosahedral phase on the thermal stability and ageing response of a duplex structured Mg-Li alloy. Mater. Des. 2015, 69, 124–129. [Google Scholar] [CrossRef]
- Li, C.Q.; Xu, D.K.; Wang, B.J.; Sheng, L.Y.; Qiao, Y.X.; Han, E.H. Natural ageing responses of duplex structured Mg-Li based alloys. Sci. Rep. 2017, 7, 40078. [Google Scholar] [CrossRef] [Green Version]
- Lv, Y.Z.; Xu, Y.; Wang, X.X.; Tian, H.L. The Electrochemical Performances of Mg-8Li, Mg-8Li-0.5Ce and Mg-8Li-1Ce Alloys in 0.7 mol·L−1 NaCl Solution. Acta. Chim. Sinica 2011, 69, 2248–2252. [Google Scholar]
- Xu, D.K.; Han, E.H. Effect of quasicrystalline phase on improving the corrosion resistance of a duplex structured Mg-Li alloy. Scr. Mater. 2014, 71, 21–24. [Google Scholar] [CrossRef]
- Yang, L.H.; Jiang, Q.T.; Zheng, M.; Hou, B.; Li, Y. Corrosion behavior of Mg-8Li-3Zn-Al alloy in neutral 3.5% NaCl solution. J. Magnes. Alloy 2016, 4, 22–26. [Google Scholar] [CrossRef] [Green Version]
- Yuan, X.; Yu, D.; Gao, L.-L.; Gao, H. Effect of Phosphate-Buffered Solution Corrosion on the Ratcheting Fatigue Behavior of a Duplex Mg-Li-Al Alloy. J. Mater. Eng. Perform 2016, 25, 1802–1810. [Google Scholar] [CrossRef]
- Dobkowska, A.; Adamczyk-Cieslak, B.; Mizera, J.; Kubásek, J.; Vojtěch, D. Corrosion Behaviour of Magnesium Lithium Alloys in NaCl Solution. Solid. State. Phenom. 2015, 3763, 87–90. [Google Scholar] [CrossRef]
- Thirumalaikumarasamy, D.; Shanmugam, K.; Balasubramanian, V. Comparison of the corrosion behaviour of AZ31B magnesium alloy under immersion test and potentiodynamic polarization test in NaCl solution. J. Magnes. Alloy. 2014, 2, 36–49. [Google Scholar] [CrossRef] [Green Version]
- Shan, D.Y.; Zhou, W.Q.; Han, E.H.; Ke, W. Corrosion and electrochemical behavior of AZ31D magnesium alloys in sodium chloride. Trans. Nonferr. Met. Soc. China 2006, 16, 1789–1792. [Google Scholar]
- Thirumalaikumarasamy, D.; Shanmugaml, K.; Balasubramanian, V. Influence of chloride ion concentration on immersion corrosion behaviour of plasma sprayed alumina coatings on AZ31B magnesium alloy. J. Magnes. Alloy. 2014, 2, 325–334. [Google Scholar] [CrossRef] [Green Version]
- Liu, F.; Song, Y.W.; Shan, D.Y.; Han, E.H. Corrosion behavior of AZ31 magnesium alloy in simulated acid rain solution. Trans. Nonferrous Met. Soc. China 2010, 20, 638–642. [Google Scholar] [CrossRef]
- Li, M.M.; Qin, Z.; Yang, Y.; Xiong, X.M.; Zhou, G.; Cui, X.F.; Jiang, B.; Peng, X.D.; Pan, F.S. Microstructure and Corrosion Properties of Duplex-Structured Extruded Mg-6Li-4Zn-xMn Alloys. Acta. Metall. Sin. 2022. [Google Scholar] [CrossRef]
- Ma, X.C.; Jin, S.Y.; Wu, R.Z.; Wang, J.X.; Wang, G.X.; Krit, B.; Betsofen, S. Corrosion behavior of Mg-Li alloys: A review. Trans. Nonferrous Met. Soc. China 2021, 31, 3228–3254. [Google Scholar] [CrossRef]
- Li, C.Q.; Liu, X.; Dong, L.J.; Shi, B.Q.; Tang, S.; Dong, Y.; Zhang, Z.R. Simultaneously improved mechanical strength and corrosion resistance of Mg-Li-Al alloy by solid solution treatment. Mater. Lett. 2021, 301, 130305. [Google Scholar] [CrossRef]
- Dong, L.J.; Liu, X.; Liang, J.X.; Li, C.Q.; Dong, Y.; Zhang, Z.R. Corrosion behavior of a eutectic Mg-8Li alloy in NaCl solution. Electrochem. Commun. 2021, 129, 107087. [Google Scholar] [CrossRef]
- Dobkowska, A.; Adamczyk-Cieslak, B.; Kubasek, J.; Vojtech, D.; Kuc, D.; Hadasik, E.; Mizera, J. Microstructure and corrosion resistance of a duplex structured Mg-7.5Li-3Al-1Zn. J. Magnes. Alloy. 2021, 9, 467–477. [Google Scholar] [CrossRef]
- Li, C.Q.; He, Y.B.; Huang, H.P. Effect of lithium content on the mechanical and corrosion behaviors of HCP binary Mg-Li alloys. J. Magnes. Alloy. 2021, 9, 569–580. [Google Scholar] [CrossRef]
- Wang, B.J.; Xu, D.K.; Sun, J.; Han, E.H. Effect of grain structure on the stress corrosion cracking (SCC) behavior of an as-extruded Mg-Zn-Zr alloy. Corros. Sci. 2019, 157, 347–356. [Google Scholar] [CrossRef]
- Zeng, R.C.; Sun, L.; Zheng, Y.F.; Cui, H.Z.; Han, E.H. Corrosion and characterization of dual phase Mg-Li-Ca alloy in Hank’s solution: The influence of microstructural features. Corros. Sci. 2014, 79, 69–82. [Google Scholar] [CrossRef]
- Xu, W.; Birbilis, N.; Sha, G.; Wang, Y.; Daniels, J.; Xiao, Y.; Ferry, M. A high-specific-strength and corrosion-resistant magnesium alloy. Nat. Mater. 2015, 14, 1229–1235. [Google Scholar] [CrossRef]
- Liu, G.; Xie, W.; Wei, G.; Yang, Y.; Liu, J.; Xu, T.; Xie, W.; Peng, X. Dynamic Recrystallization Behavior and Corrosion Resistance of a Dual-Phase Mg-Li Alloy. Materials 2018, 11, 408. [Google Scholar] [CrossRef] [Green Version]
- Xin, Y.C.; Chu, P.K. Influence of Tris in simulated body fluid on degradation behavior of pure magnesium. Mater. Chem. Phys. 2010, 124, 33–35. [Google Scholar] [CrossRef]
- Wang, B.J.; Xu, D.K.; Zhao, T.Y.; Sheng, L.Y. Effect of CaCl2 and NaHCO3 in physiological saline solution on the corrosion behavior of an as-extruded Mg-Zn-Y-Nd alloy. Acta Metall. Sin. 2021, 34, 239–247. [Google Scholar] [CrossRef]
- Masing, G.; Tamman, G. Behavior of lithium, toward sodium, potassium, yin, cadmium and magnesium. Z. Fur Anorg. Allg. Chem. 1960, 67, 197–198. [Google Scholar]
- Wang, B.J.; Xu, D.K.; Dong, J.H.; Ke, W. Effect of corrosion product films on the in vitro degradation behavior of Mg-3%Al-1%Zn (in wt%) alloy in Hank’s solution. J. Mater. Sci. Technol. 2018, 34, 1756–1764. [Google Scholar] [CrossRef]
- Li, C.Q.; Xu, D.K.; Chen, X.B.; Wang, B.J.; Wu, R.Z.; Han, E.H.; Birbilis, N. Composition and microstructure dependent corrosion behaviour of Mg-Li alloys. Electrochim. Acta 2018, 260, 55–64. [Google Scholar] [CrossRef]
- Song, Y.W.; Shan, D.Y.; Chen, R.S.; Han, E.H. Investigation of surface oxide film on magnesium lithium alloy. J. Alloys Compd. 2009, 484, 585–590. [Google Scholar] [CrossRef]


| Chemical Composition | Li | Fe | Mg |
|---|---|---|---|
| Content (wt.%) | 7.85 | <0.001 | balance |
| Pre-Immersion Time | In 0.9 wt.% NaCl | In 3.5 wt.% NaCl | ||
|---|---|---|---|---|
| Ecorr (VSCE) | icorr (μA/cm2) | Ecorr (VSCE) | icorr (μA/cm2) | |
| 0 h 4 h 8 h 24 h | 1.625 ± 0.005 1.524 ± 0.003 1.585 ± 0.003 1.538 ± 0.003 | 20 ± 2 24 ± 2 41 ± 4 51 ± 4 | 1.643 ± 0.005 1.545 ± 0.003 1.586 ± 0.003 1.572 ± 0.003 | 22 ± 2 43 ± 3 55 ± 4 62 ± 5 |
| Conditions | Rs (Ω cm2) | Ydl (μΩ−1cm−2sn) | ndl | Rct (Ω cm2) | Yf (μΩ−1cm−2sn) | nf | Rf (Ω cm2) | L (H cm−2) | RL (Ω cm2) | |
|---|---|---|---|---|---|---|---|---|---|---|
| In 0.9 wt.% NaCl | 0 h 4 h 8 h 24 h | 24.2 ± 0.5 20.4 ± 0.5 22.3 ± 0.4 24.8 ± 0.4 | 20 ± 2 18 ± 2 88 ± 5 102 ± 8 | 0.91 ± 0.03 0.91 ± 0.03 0.91 ± 0.03 0.83 ± 0.02 | 1447 ± 90 991 ± 80 831 ± 80 726 ± 70 | 1537 ± 150 1245 ± 125 - - | 0.71 ± 0.03 0.61 ± 0.02 - - | 738 ± 75 521 ± 65 - - | - - 2619 ± 348 6840 ± 465 | - - 175 ± 58 382 ± 95 |
| In 3.5 wt.% NaCl | 0 h 4 h 8 h 24 h | 7.0 ± 0.2 7.6 ± 0.2 7.4 ± 0.2 7.3 ± 0.2 | 27 ± 2 89 ± 5 119 ± 8 96 ± 5 | 0.89 ± 0.02 0.89 ± 0.02 0.91 ± 0.03 0.91 ± 0.03 | 764 ± 70 523 ± 60 378 ± 40 316 ± 40 | 1829 ± 176 - - - | 0.61 ± 0.02 - - - | 394 ± 35 - - - | - 2185 ± 315 3695 ± 385 1482 ± 175 | - 146 ± 54 204 ± 69 111 ± 45 |
Publisher’s Note: MDPI stays neutral with regard to jurisdictional claims in published maps and institutional affiliations. |
© 2022 by the authors. Licensee MDPI, Basel, Switzerland. This article is an open access article distributed under the terms and conditions of the Creative Commons Attribution (CC BY) license (https://creativecommons.org/licenses/by/4.0/).
Share and Cite
Wang, B.; Hou, J.; Luan, J.; Xu, D.; Sun, H.; Sun, J. The Corrosion Behaviors of an As-Rolled Mg-8Li (in wt.%) Alloy in Two Differently Concentrated NaCl Solutions. Coatings 2022, 12, 406. https://doi.org/10.3390/coatings12030406
Wang B, Hou J, Luan J, Xu D, Sun H, Sun J. The Corrosion Behaviors of an As-Rolled Mg-8Li (in wt.%) Alloy in Two Differently Concentrated NaCl Solutions. Coatings. 2022; 12(3):406. https://doi.org/10.3390/coatings12030406
Chicago/Turabian StyleWang, Baojie, Jiyu Hou, Jiyu Luan, Daokui Xu, Haijing Sun, and Jie Sun. 2022. "The Corrosion Behaviors of an As-Rolled Mg-8Li (in wt.%) Alloy in Two Differently Concentrated NaCl Solutions" Coatings 12, no. 3: 406. https://doi.org/10.3390/coatings12030406