
Evaluation of Anticorrosion Coatings for Offshore Wind Turbine Monopiles for an Optimized and Time-Efficient Coating Application


Abstract
:1. Introduction
2. Materials and Methods
2.1. Nomenclature of the Analyzed Coatings
2.2. Preparation of the Test Coupons
2.3. Accelerated Laboratory Aging
2.3.1. Atmospheric Zone
- ▪
- 72 h of exposure to UV and condensation;
- ▪
- 72 h of exposure to neutral salt spray; and
- ▪
- 24 h of exposure to low temperature at (−20 ± 2 °C).
2.3.2. Splash Zone
- 1.
- The cyclic test, which also applies for the atmospheric zone coating cyclic method.
- 2.
- Seawater immersion test as defined in ISO 2812-2 [11], In this test, the coated panels are immersed in synthetic seawater for 4200 h at 40 °C. The panels are placed on a support that keeps them at an angle of 15 to 20° to the vertical. During aging, the aeration is ensured by constant circulation of the seawater.
- 3.
- Cathodic disbonding according to ISO 15711 [12]. In this test, the cathodic protection of the offshore structure is simulated in artificial seawater and the resistivity of the coating to disbonding is evaluated. To initiate the cathodic disbonding, a 6 mm diameter circular holiday is created in the coating in order to expose the steel substrate to the environment. Then, the panel is connected to the cathodic protection circuit and placed in artificial seawater for 4200 h. The test system is under constant steering to ensure aeration.
2.3.3. Submerged Zone
- 1.
- Seawater immersion test as defined in ISO 2812-2; and
- 2.
- Cathodic disbonding according to ISO 15711.
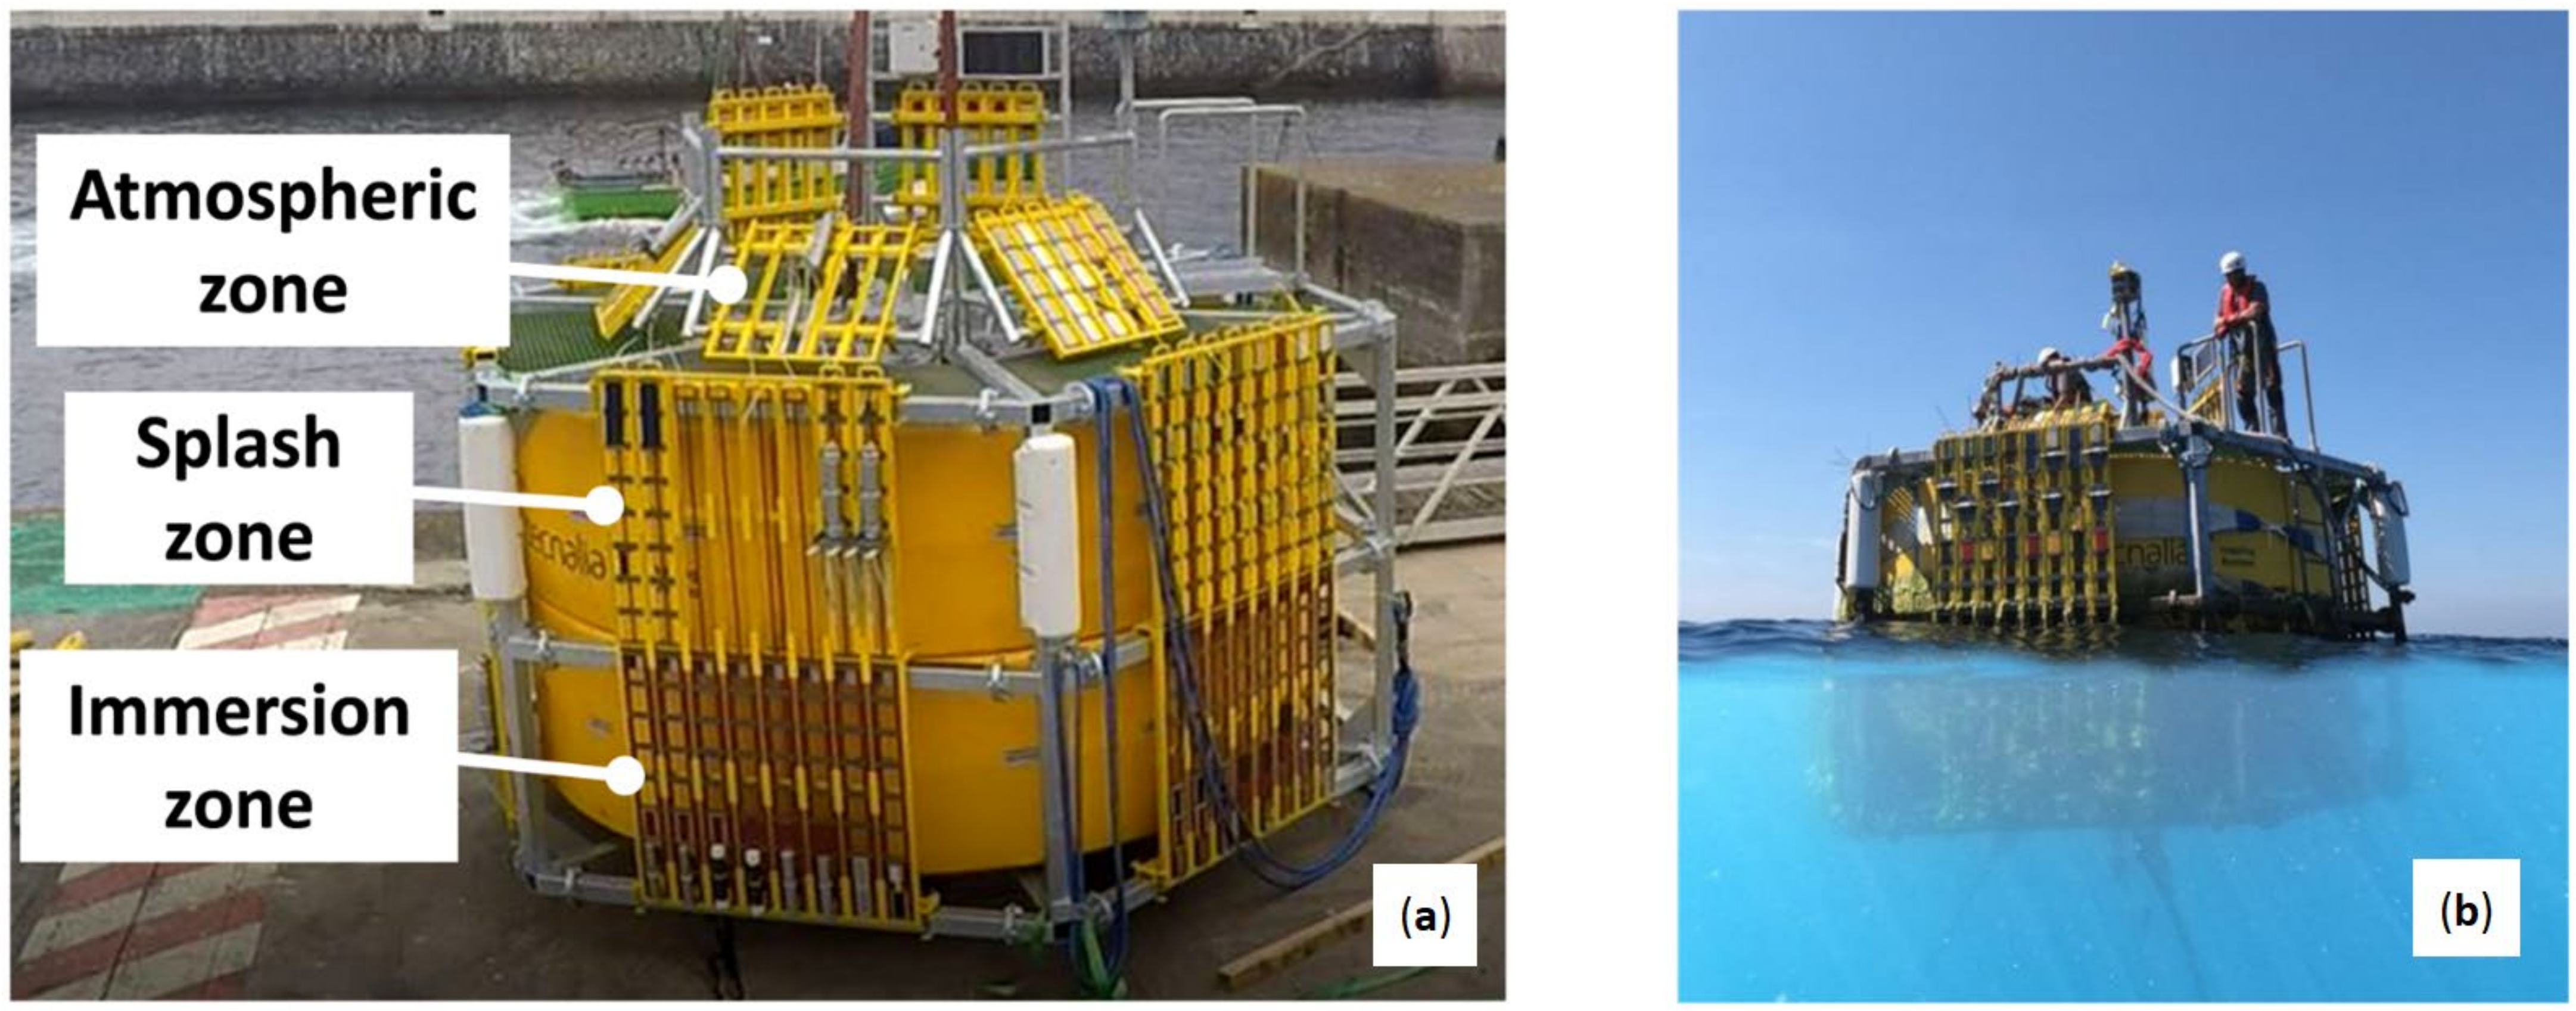
2.4. Field Exposure Conditions
2.5. Coating Characterization and Assessment
- •
- Thickness measurement: the total dry film thickness (DFT measured) was measured by magnetic induction in accordance with ISO 2178 [13] using a FISCHER thickness gauge, model DUALSCOPE MP0R (FISCHER, Waltham, MA, USA).
- •
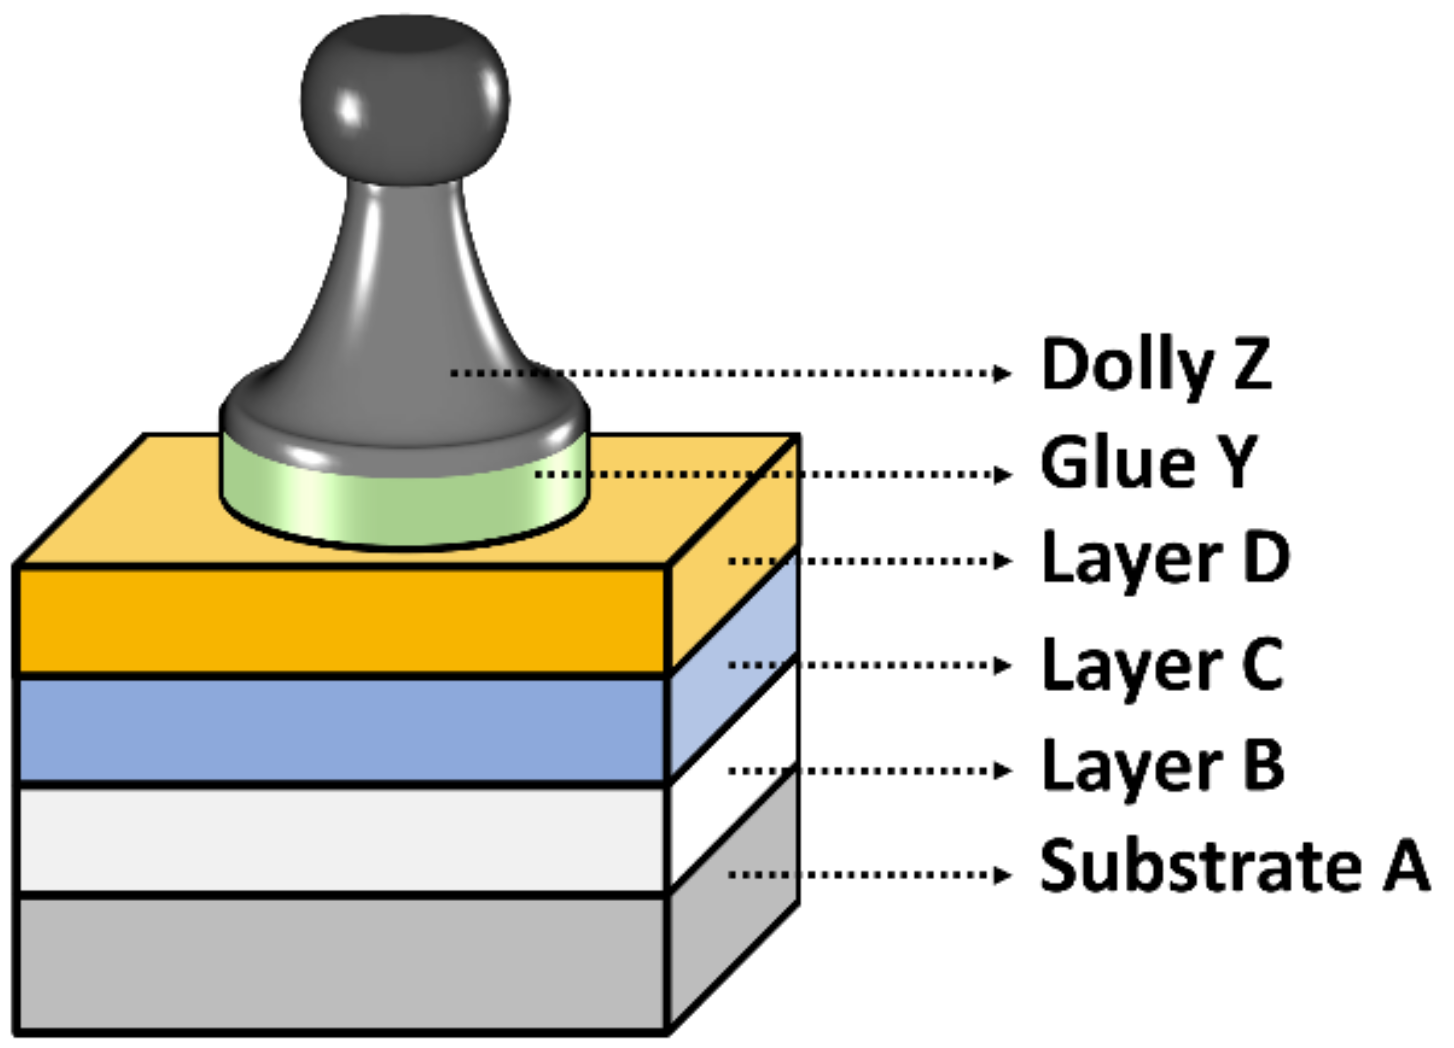
- Adhesion: the pull adhesion test was carried out on new and aged panels according to the ISO 4624 [14]. Ø20 mm dollies were attached to the coating panel using epoxy adhesive. The adhesion strength was measured with a DEFELSKO adhesion device model POSITEST AT (DEFELSKO, New York, NY, USA). Three samples were measured for each system, and three different zones were tested in each panel. The fracture mode was evaluated according to ISO 4624 as interface (adhesive) failures, which are indicated as A/B, B/C, C/D, D/Y, and Y/E, where A is the metallic substrate, B, C, and D are the different layers of the coating systems, Y is the glue used to attach the dolly, and Z is the dolly (Figure 3). Cohesive failures within one layer are indicated by the corresponding layer letter indicator.
- •
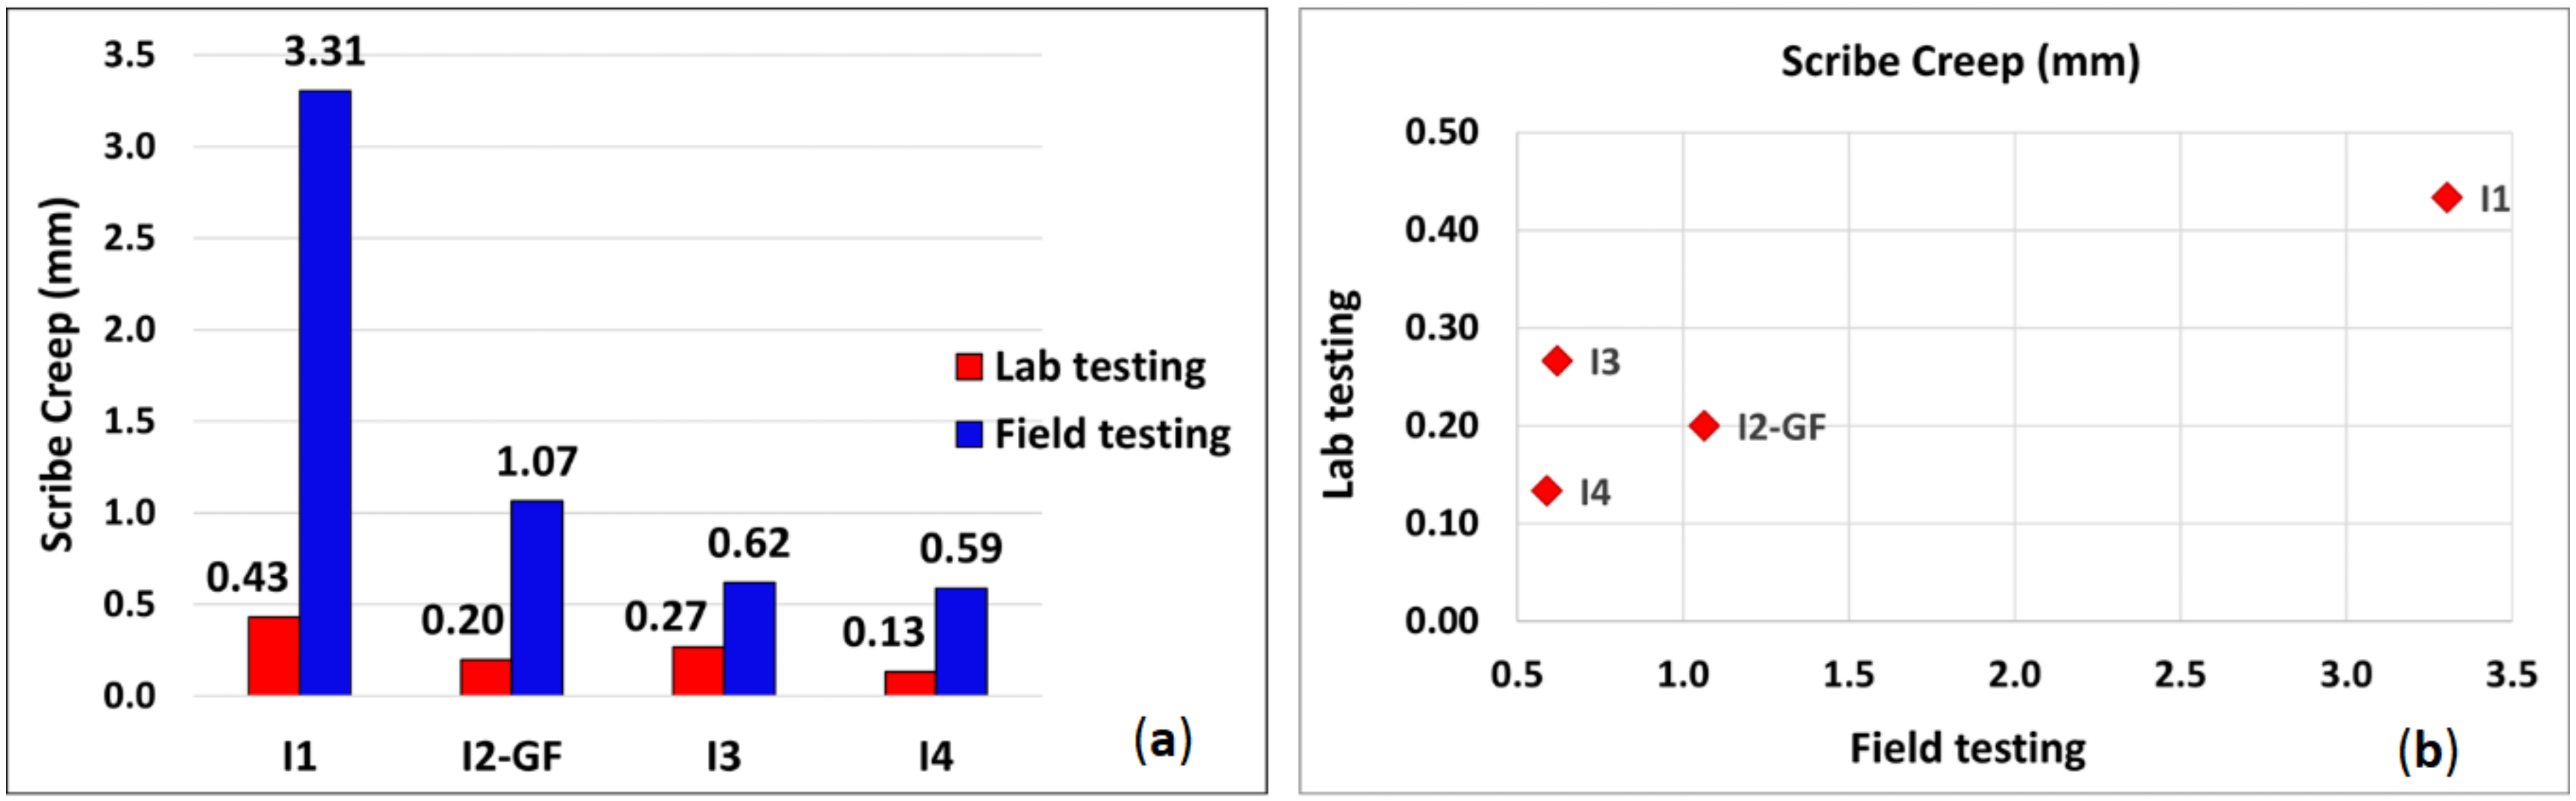
- Corrosion penetration at scribe (creep) was evaluated according to ISO 12944-6 [15].
3. Results and Discussion
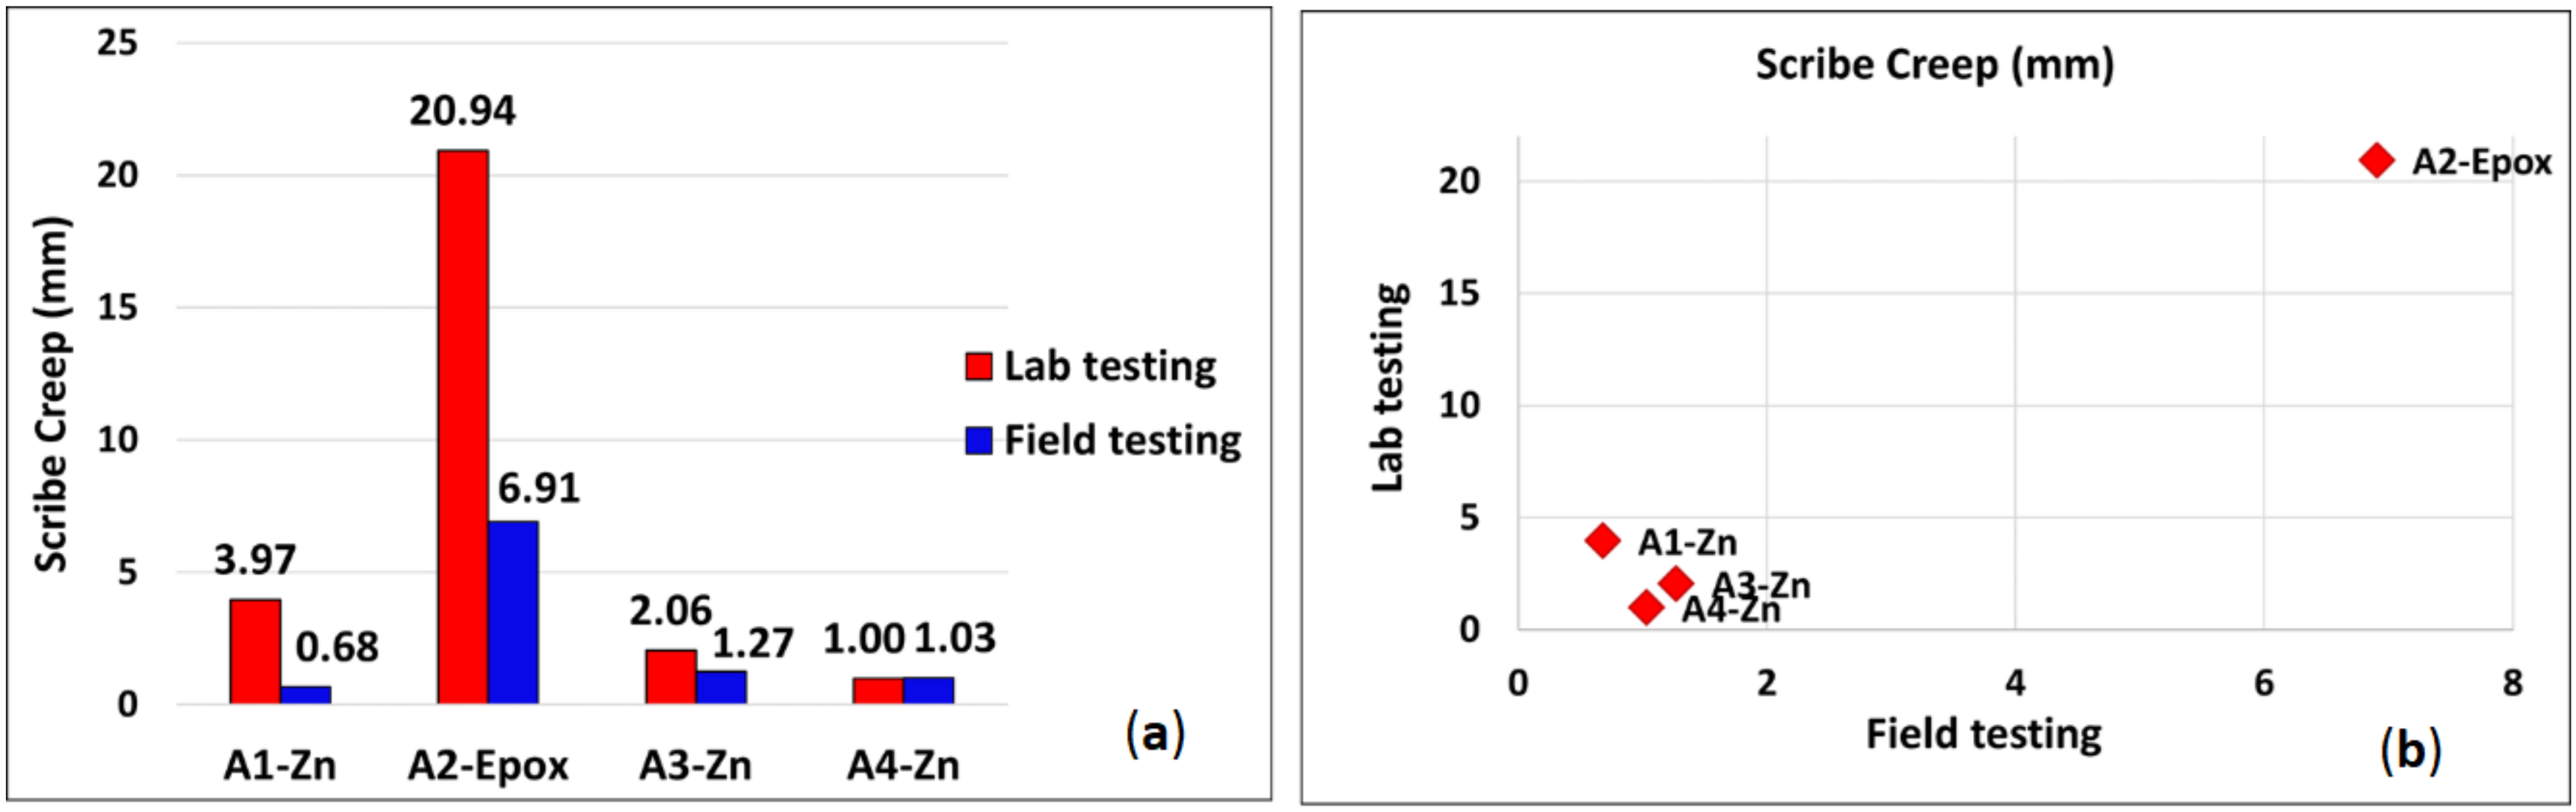
3.1. Atmospheric Zone
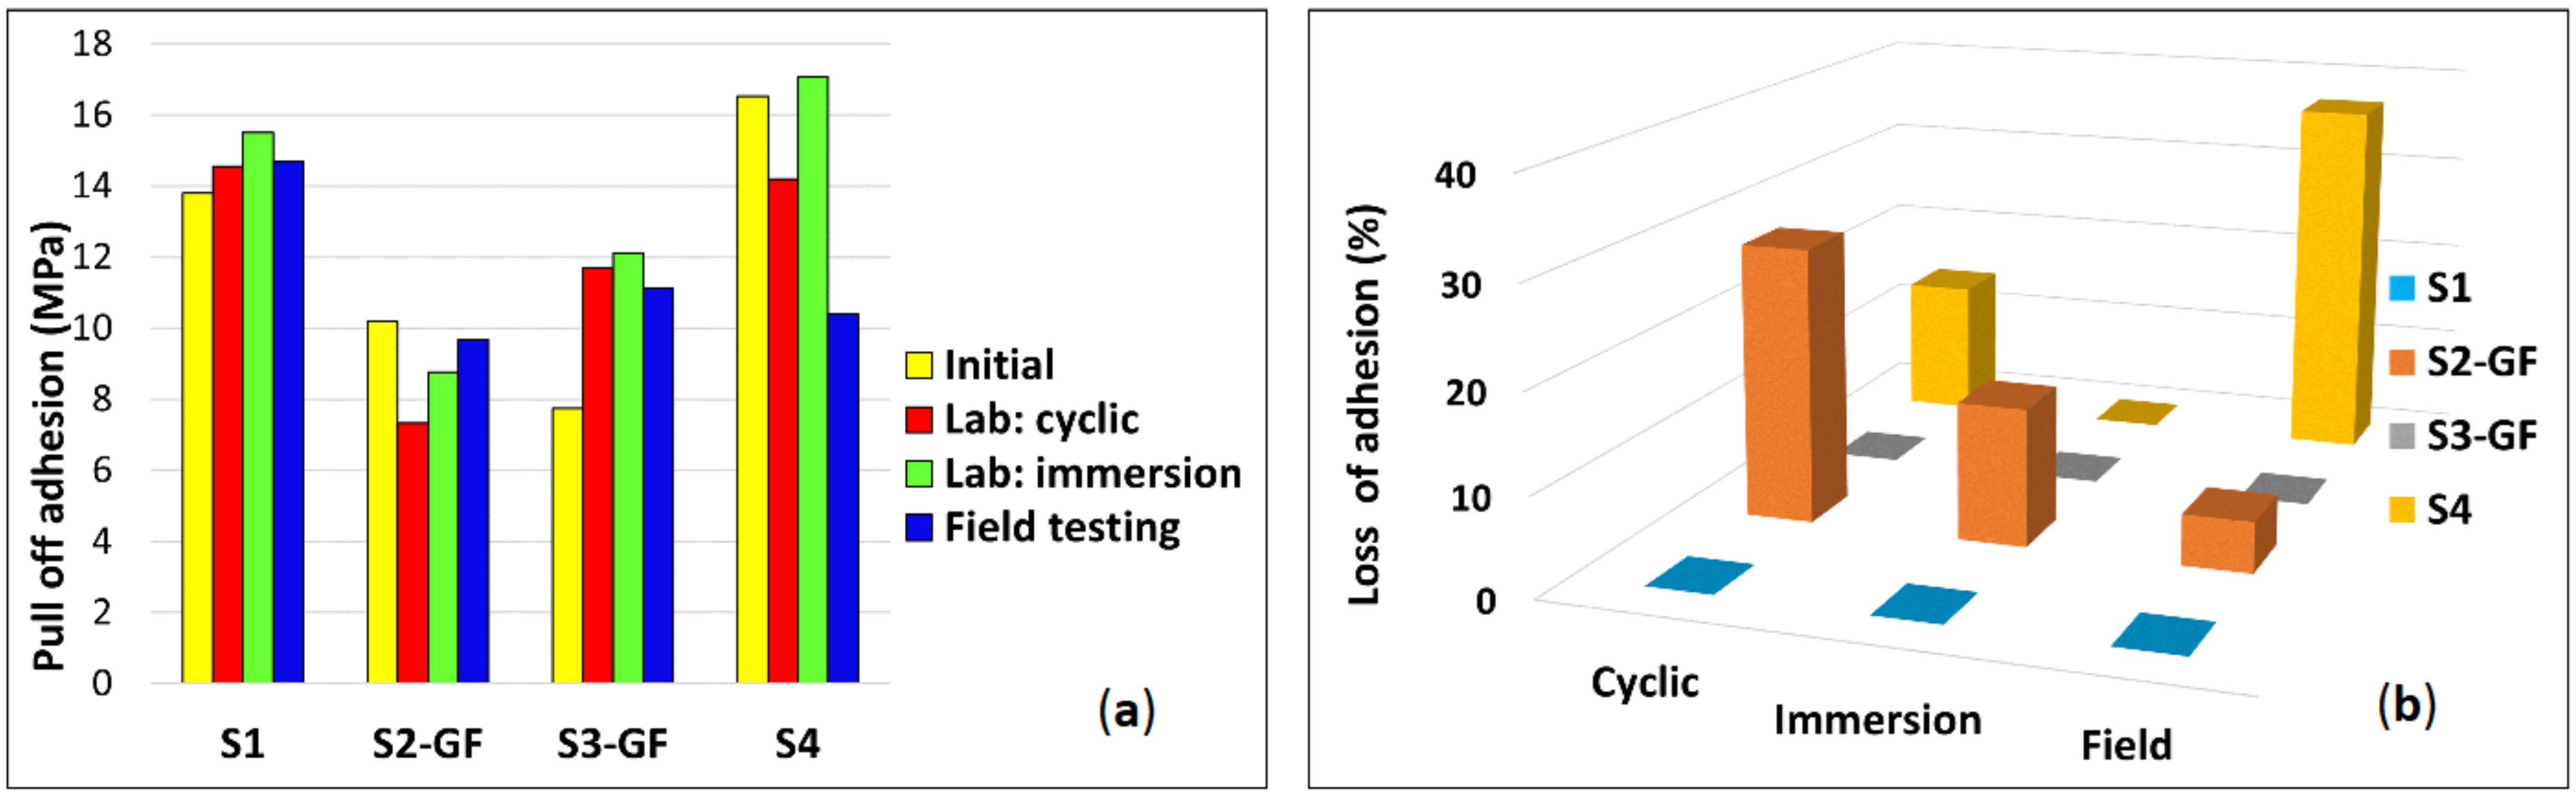
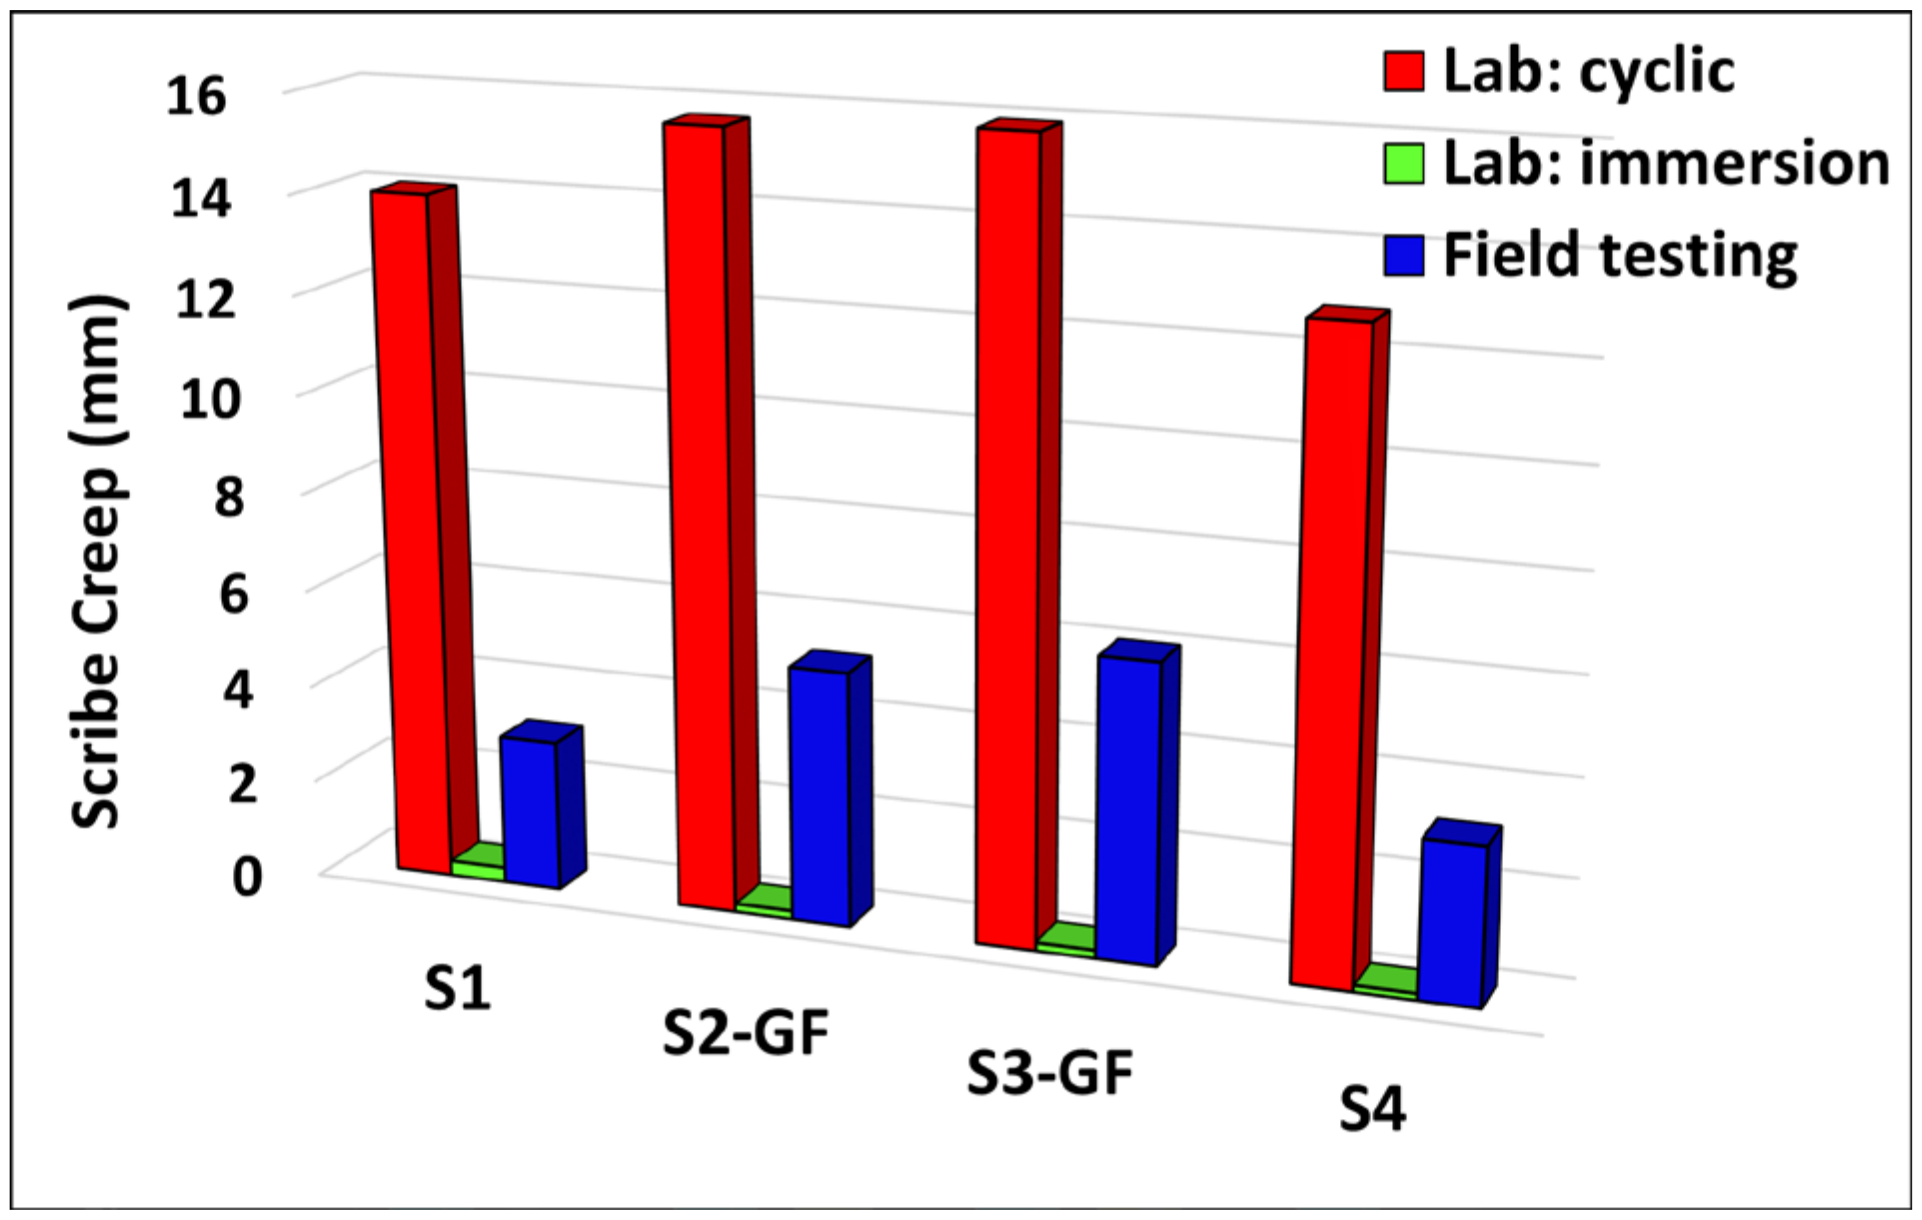
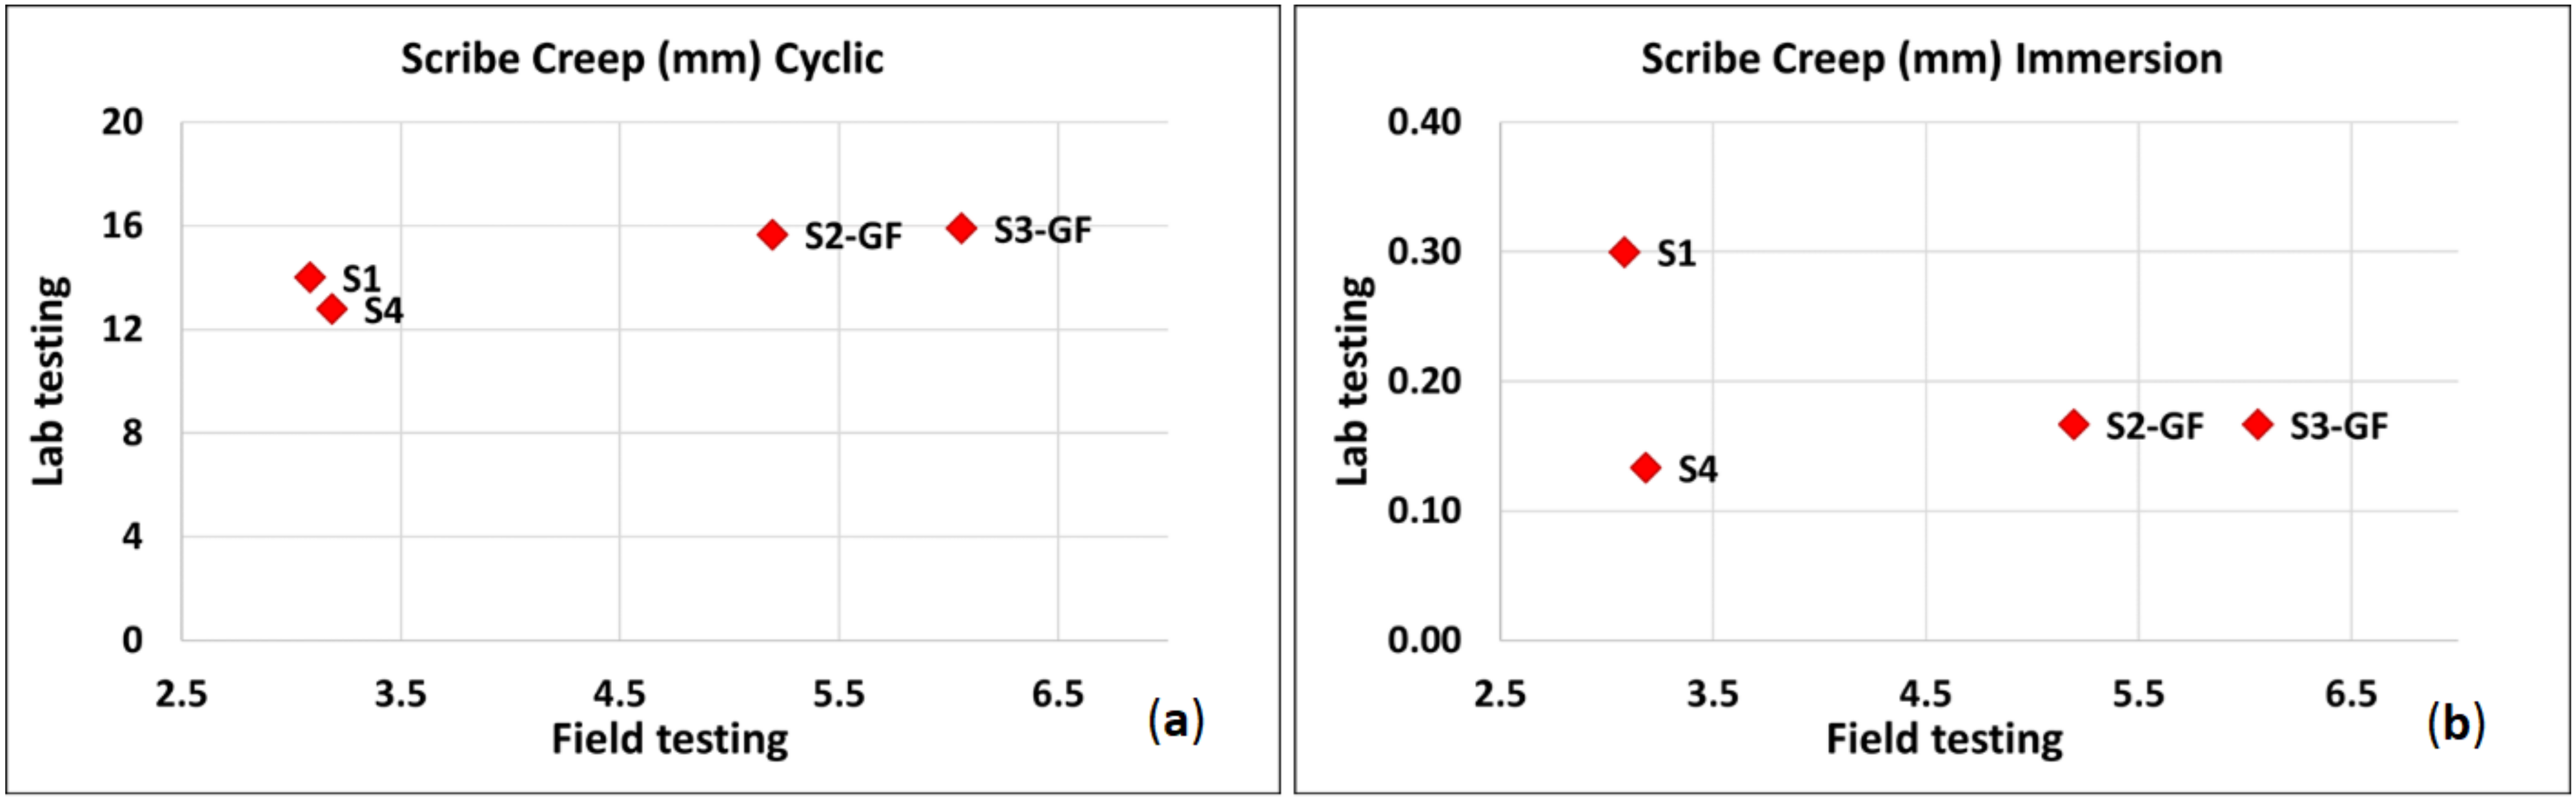
3.2. Splash Zone
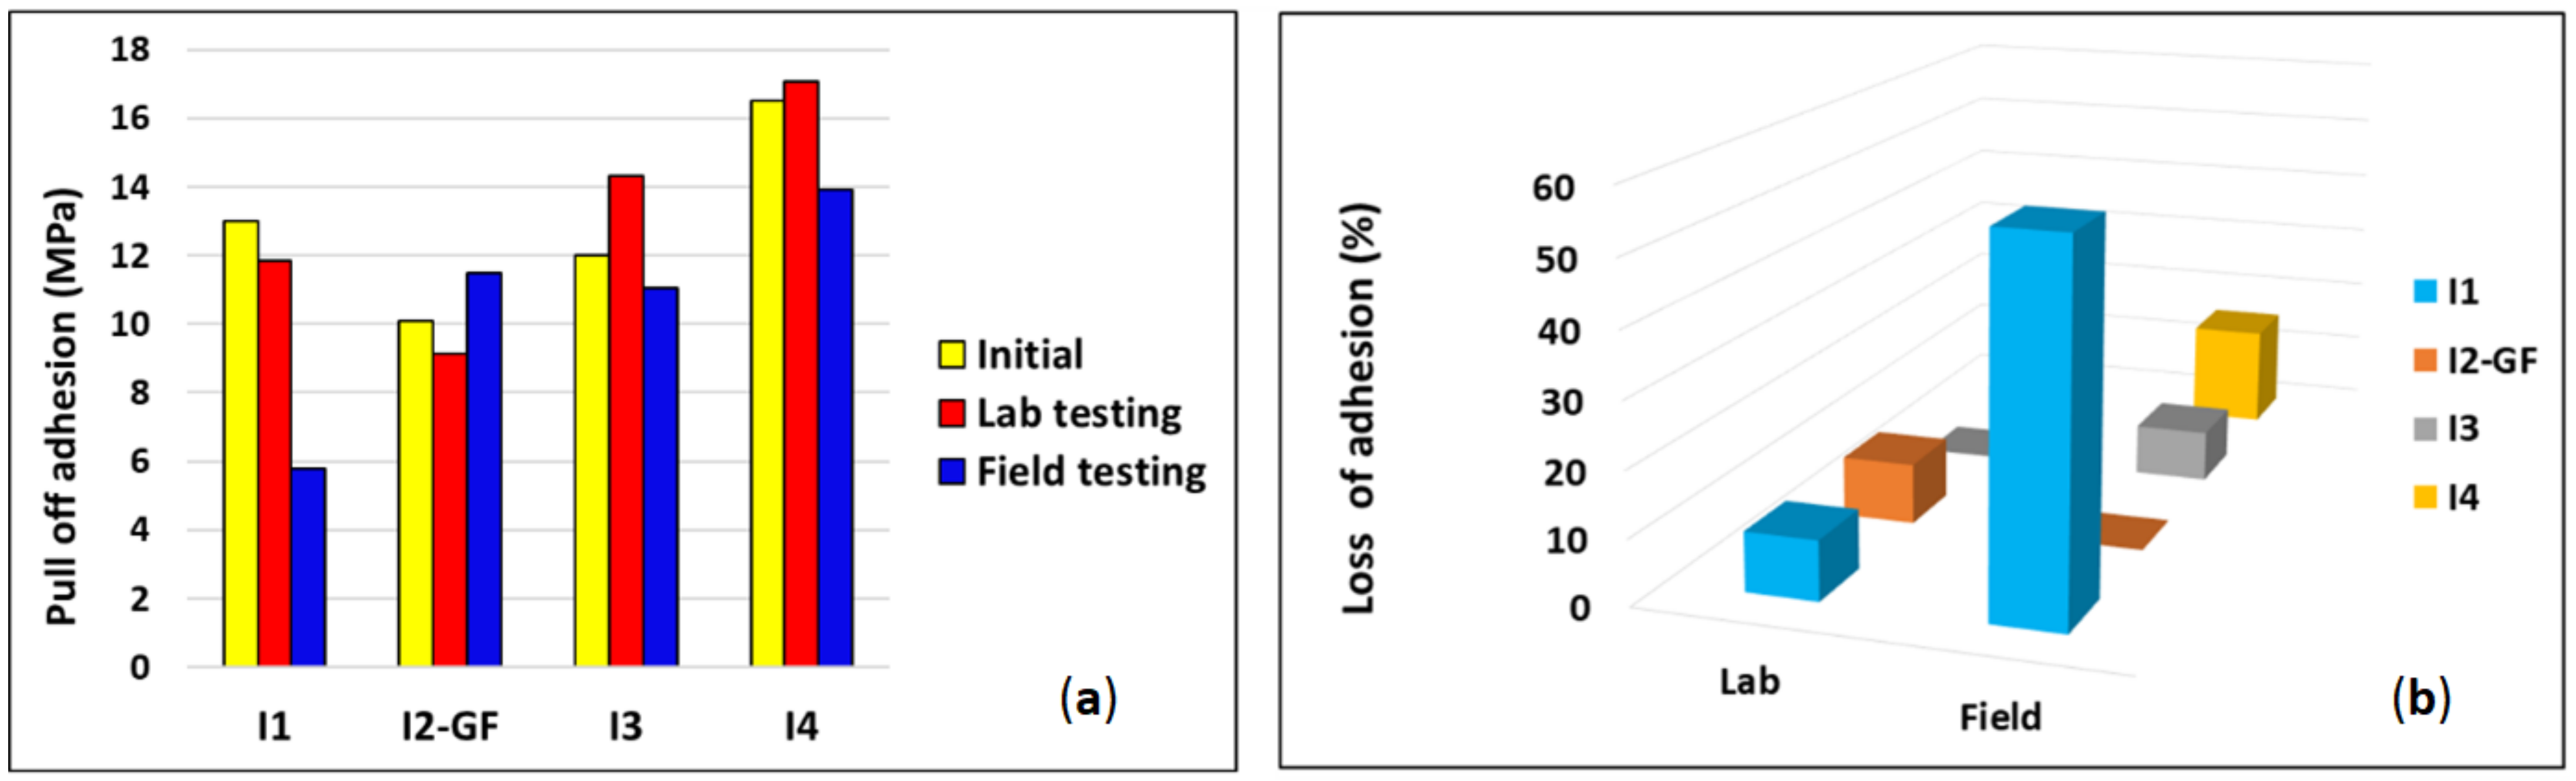
3.3. Immersion Zone
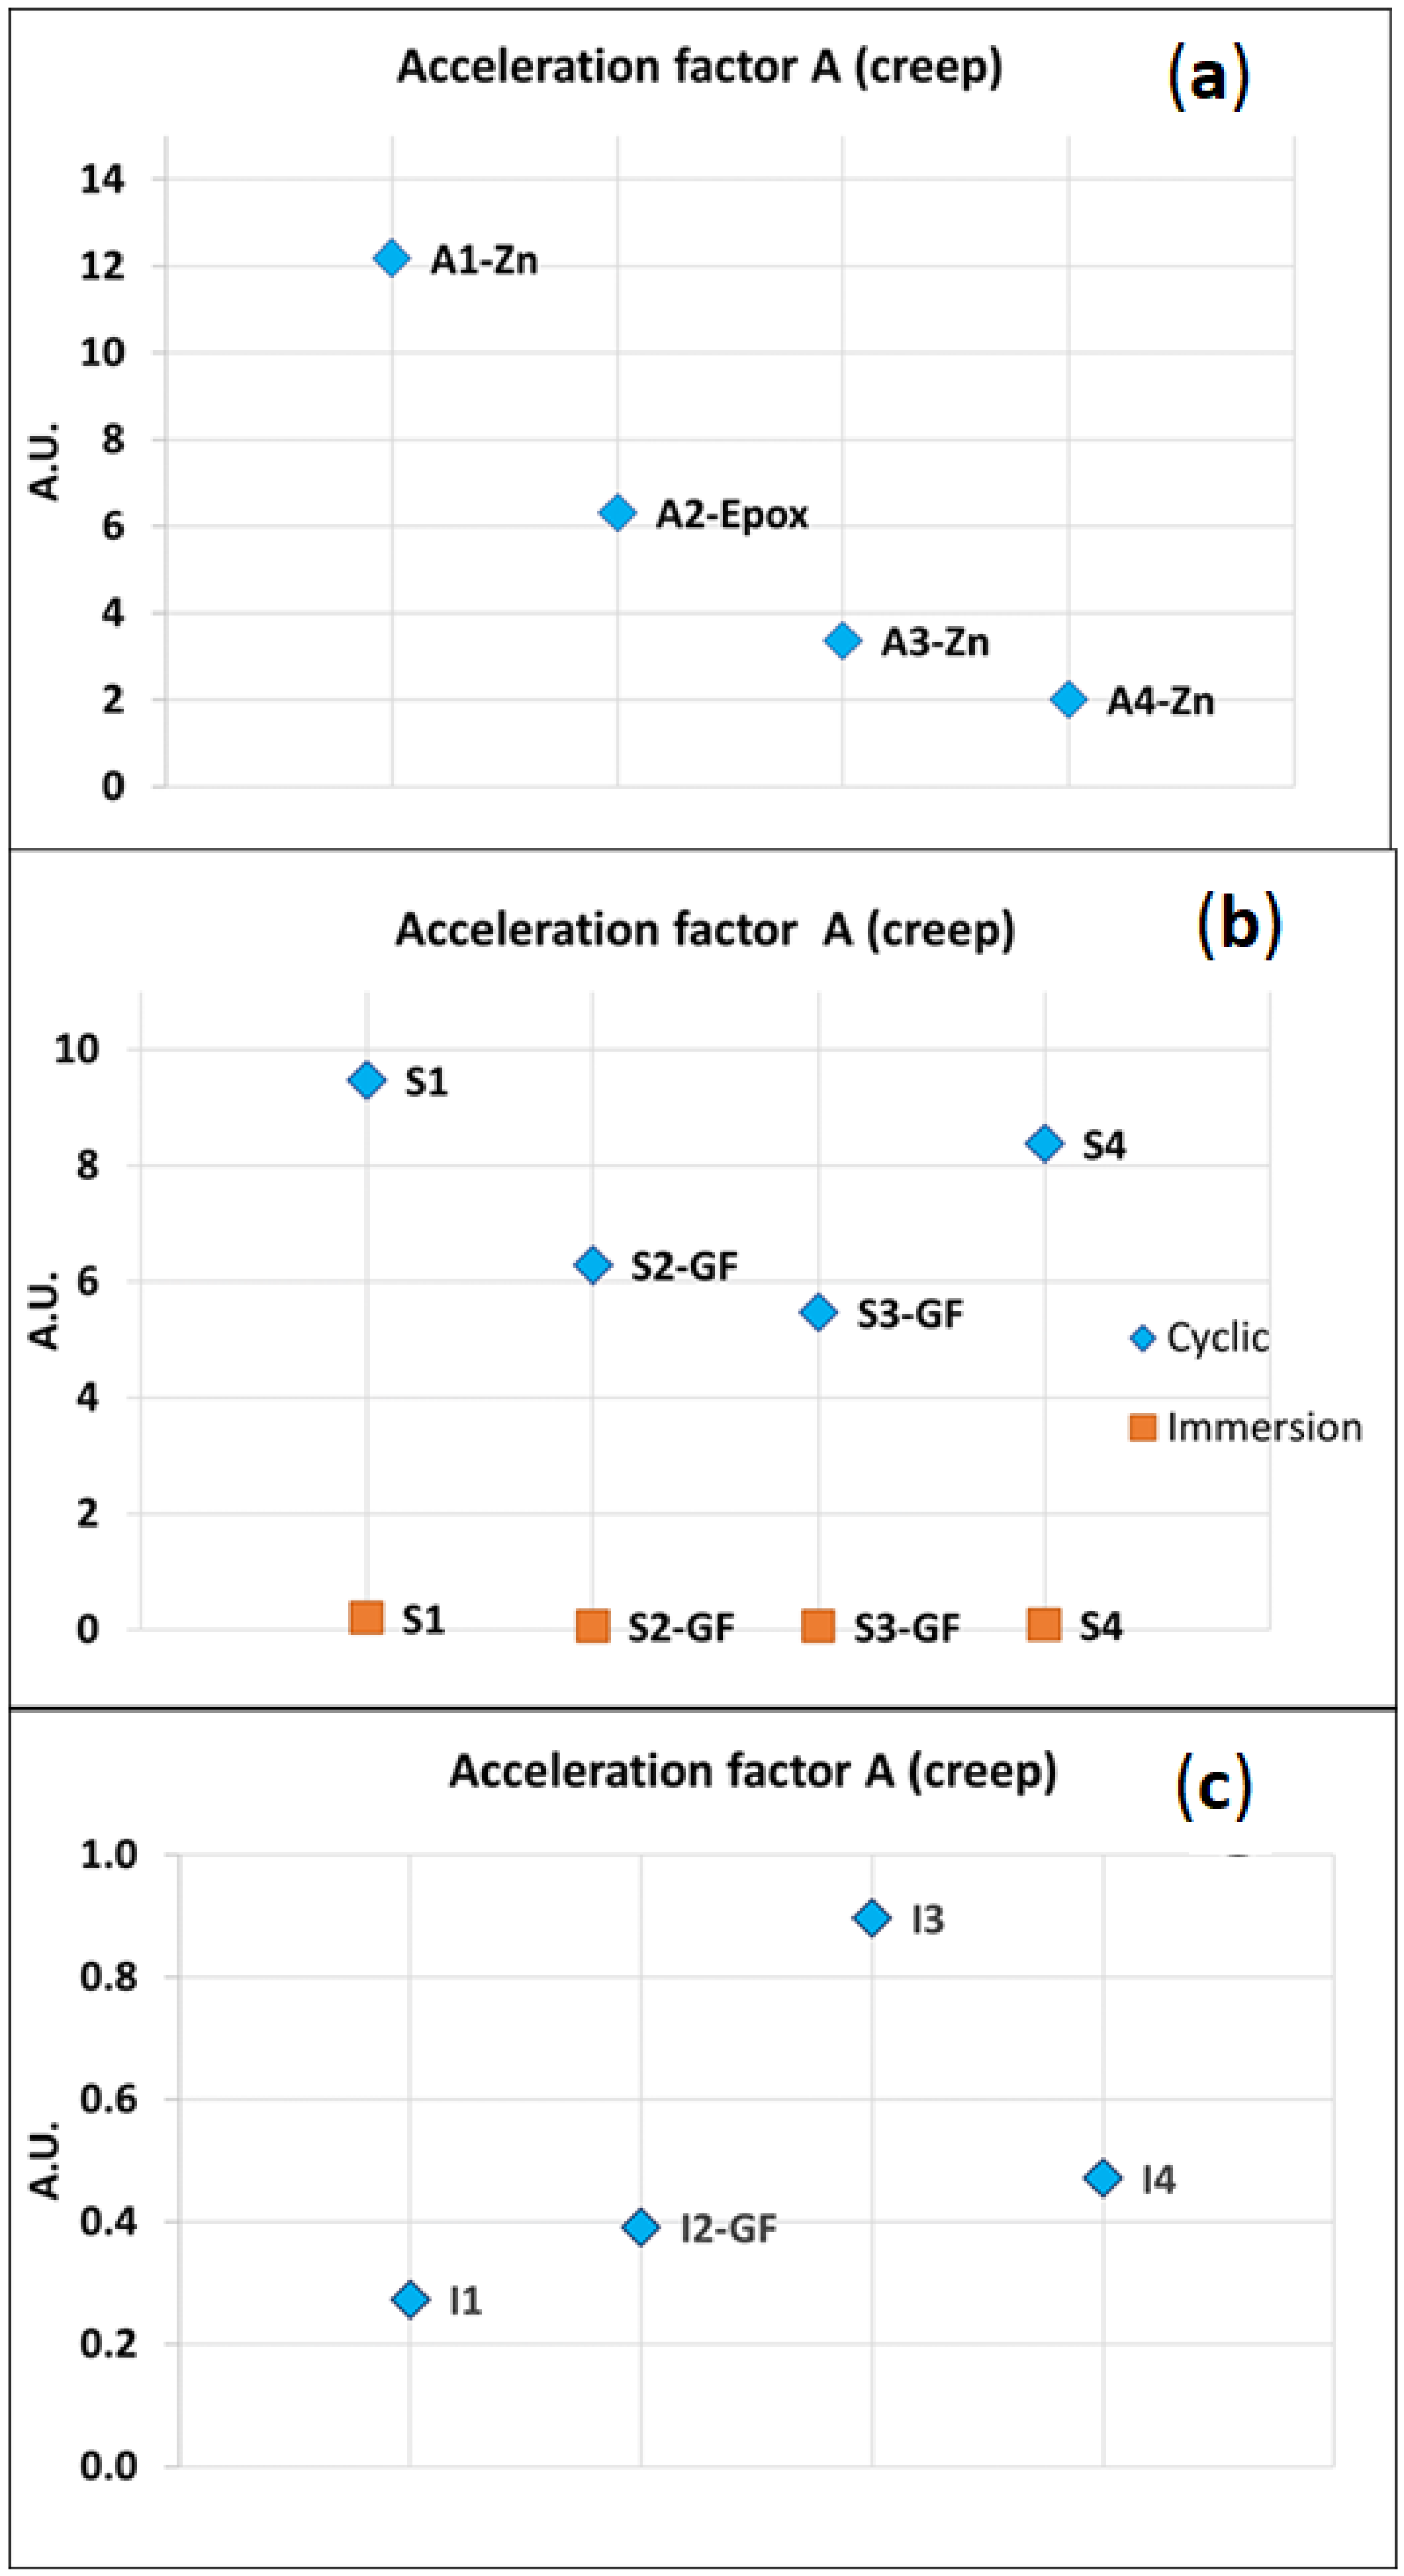
3.4. Acceleration Factor
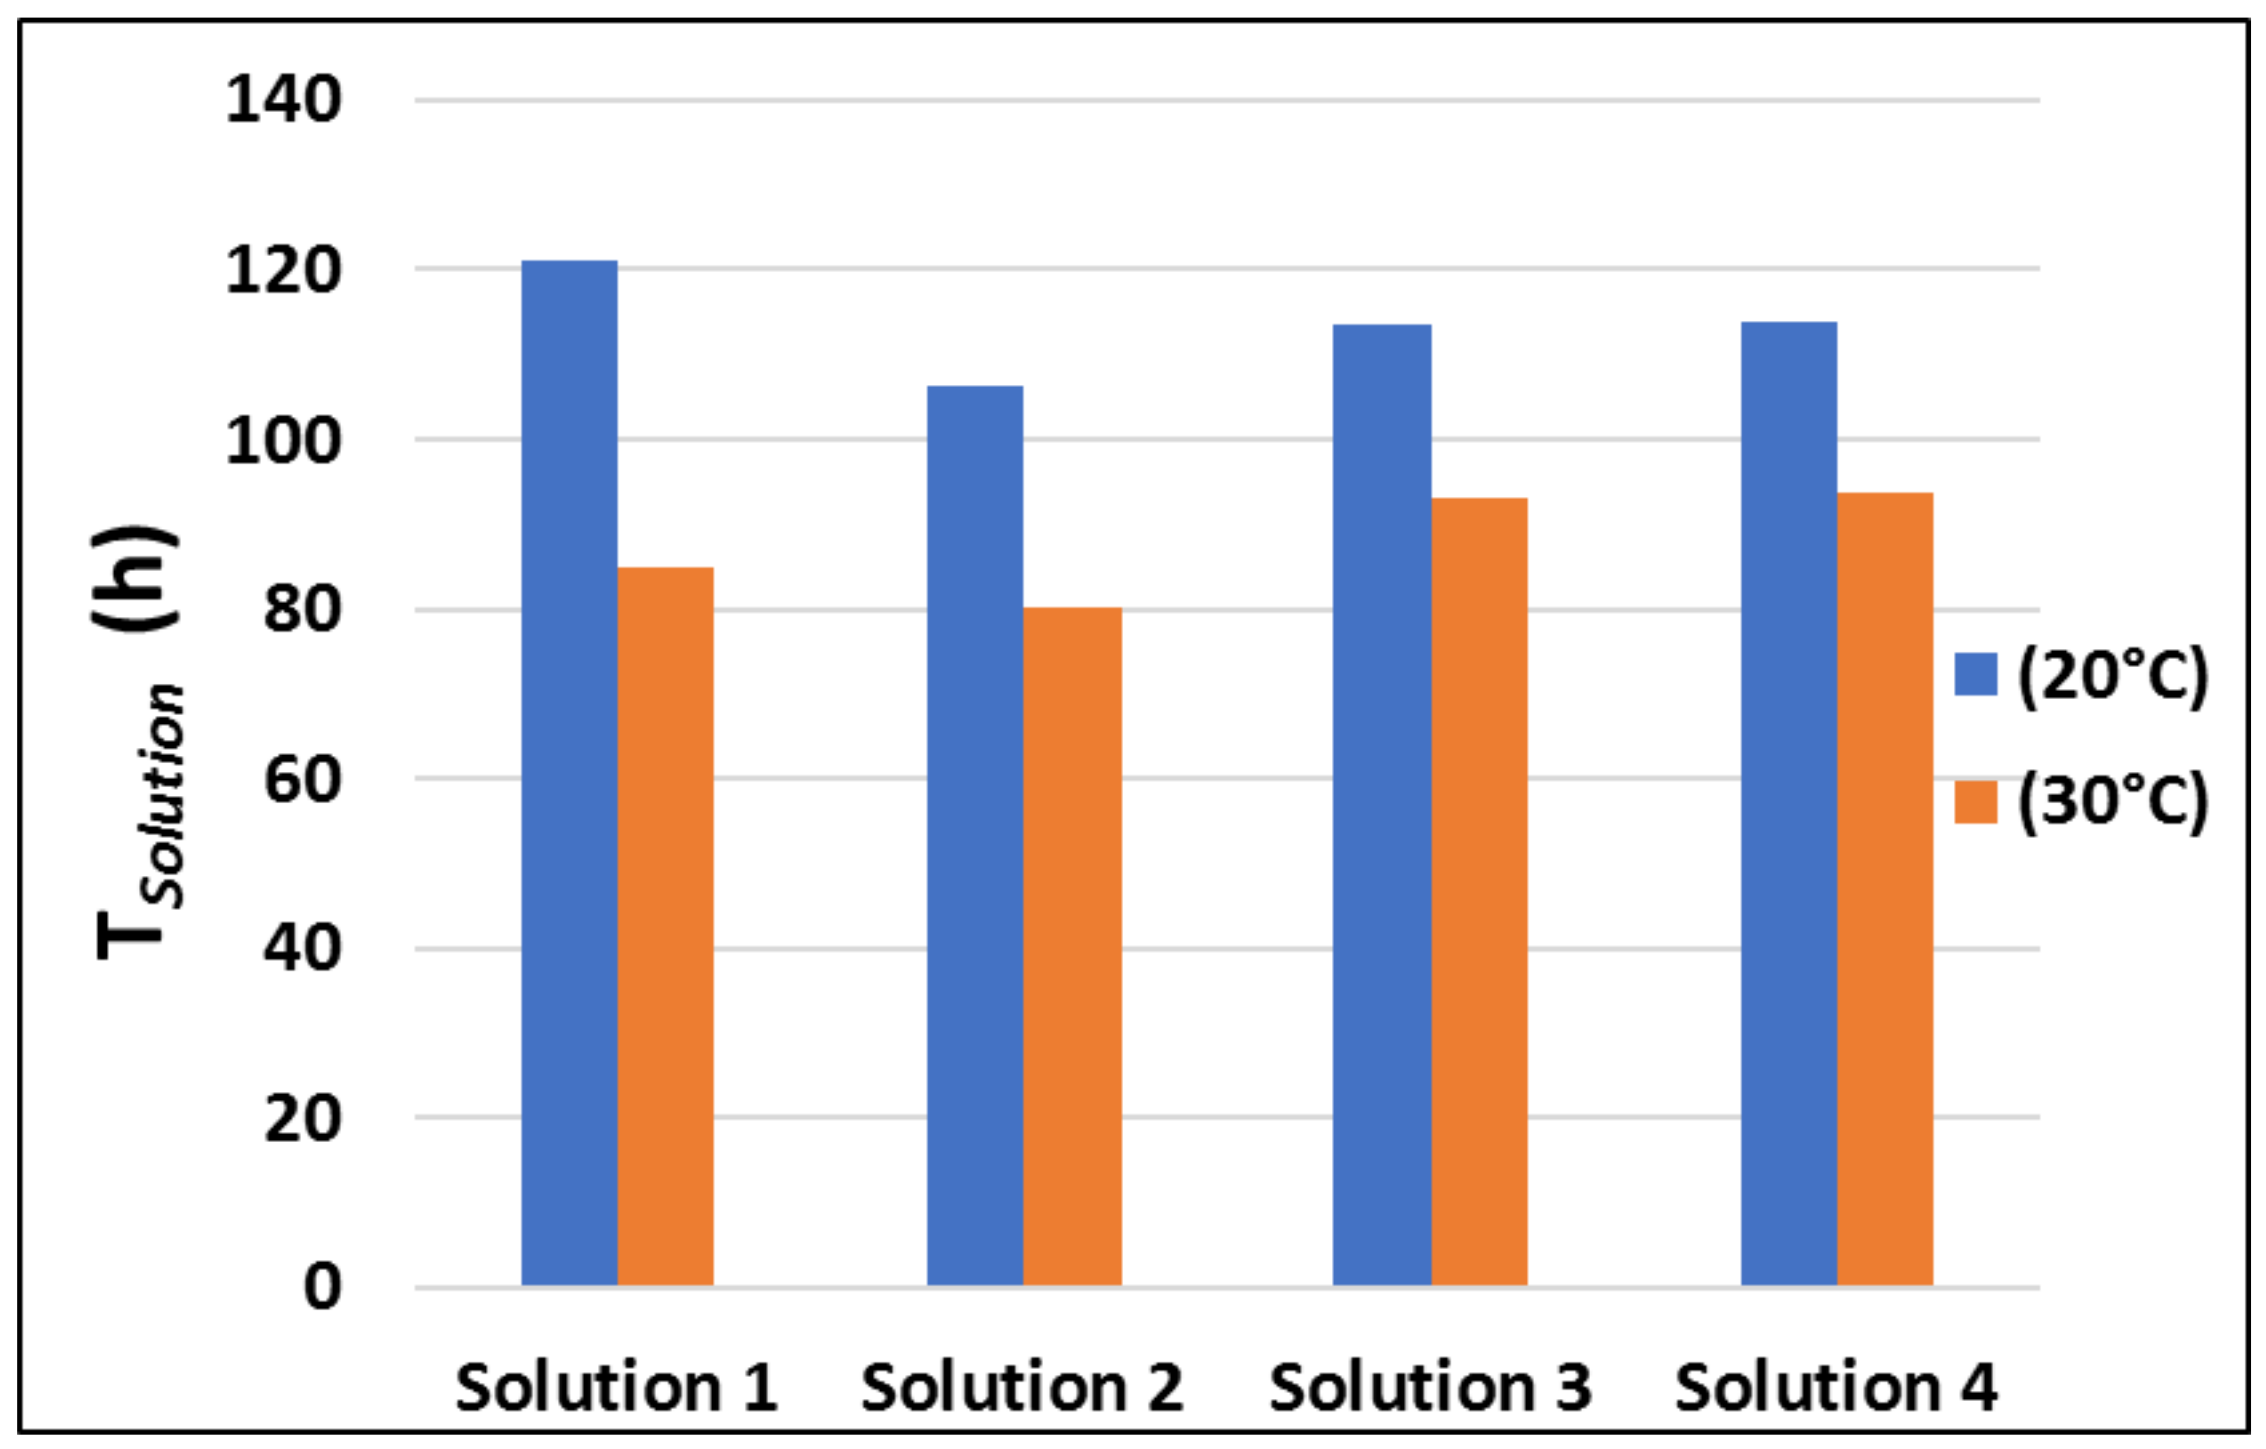
3.5. Analysis and Optimization of the Coating Process in the Coating Booth
- •
- i is the index of the coating layer;
- •
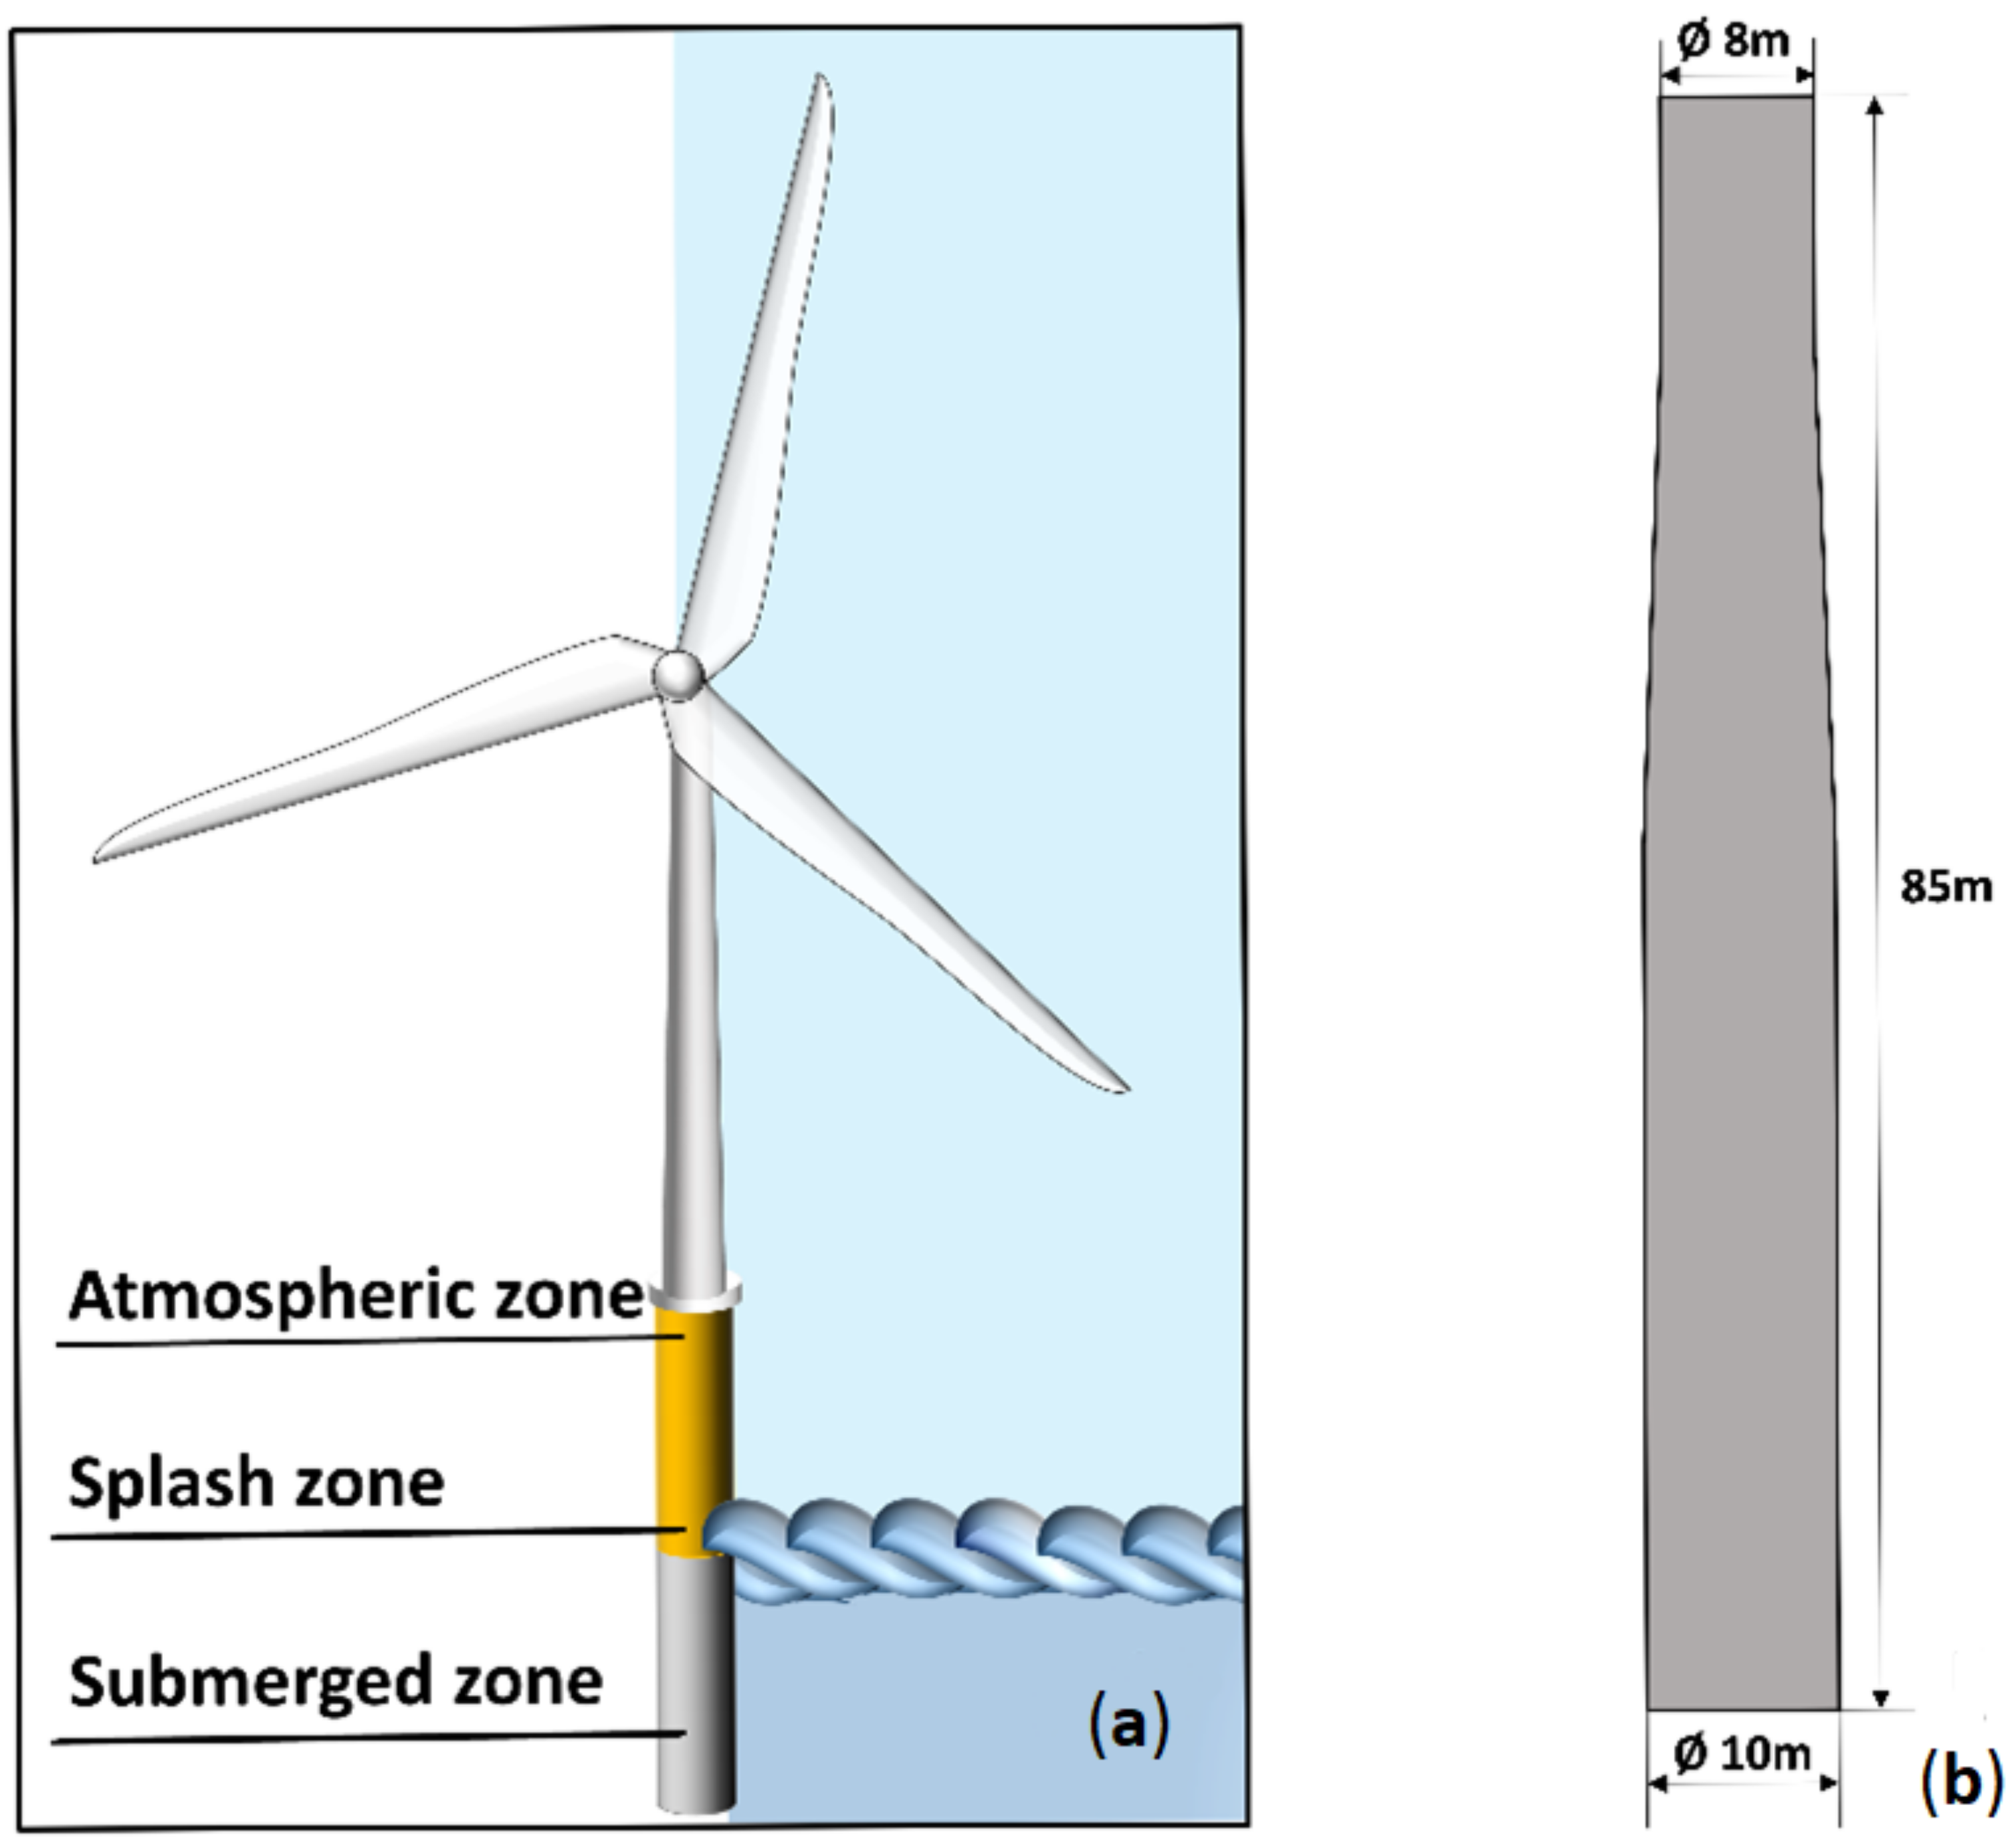
- TApp is the time of the application of a coating layer, which is a function of the area to be covered and is provided by a monopile manufacturer. It is considered that for the type of monopile depicted in Figure 1, the corresponding areas to be covered are as follows: atmospheric zone of 1000 m2; splash zone of 300 m2, submerged zone of 500 m2;
- •
- TOver is the minimum overcoating interval, this is taken from the coating data sheet;
- •
- TInsp is the time required for the inspection of each coating layer, which is a function of the area and is provided by the monopile manufacturer: Atmospheric zone: 0.5 h, Splash zone: 0.15 h, Submerged zone: 0.25 h;
- •
- Trepair is the time for the repair of the coating layer, and is given by the monopile manufacturer: atmospheric zone: 0.5 h, splash zone: 0.15 h, submerged zone: 0.25; and
- •
- THandle is the dry to handle time, and is one for the whole system and is taken from the data sheet.
4. Conclusions
Supplementary Materials
Author Contributions
Funding
Institutional Review Board Statement
Informed Consent Statement
Data Availability Statement
Acknowledgments
Conflicts of Interest
References
- DNV. DNV-OS-J101. Design of Offshore Wind Turbine Structures; DNV: Høvik, Norway, 2014. [Google Scholar]
- ISO 12944-9; Paints and Varnishes-Corrosion Protection of Steel Structures by Protective Paint Systems. Part 9: Protective Paints Systems and Laboratory Performance Test Methods for Offshore and Related Structures. ISO: Geneva, Switzerland, 2018.
- ISO 12944-2; Corrosion Protection of Steel Structures by Protective Pain Systems Part 2: Classification of Environments. ISO: Geneva, Switzerland, 2017.
- Black, A.R.; Hilbert, L.R.; Mathiesen, T. Corrosion protection of offshore wind foundations. In Proceedings of the NACE—International Corrosion Conference Series, Dallas, TX, USA, 15–19 March 2015. [Google Scholar]
- Eom, S.H.; Kim, S.S.; Lee, J.B. Assessment of anti-corrosion performances of coating systems for corrosion prevention of offshore wind power steel structures. Coatings 2020, 10, 970. [Google Scholar] [CrossRef]
- Skilbred, A.W.B.; Arntzen, O.A.; Aamodt, T.; Løken, A. Field testing—On the correlation between accelerated laboratory tests and field testing. In Proceedings of the NACE—International Corrosion Conference Series, Nashville, TN, USA, 24–28 March 2019; pp. 1–9. [Google Scholar]
- Taekker, N.P.; Rasmussen, S.N.; Roli, J. Offshore coating maintenance—Cost affect by choice of new building specification and ability of the applicator. In Proceedings of the NACE—International Corrosion Conference Series, San Diego, CA, USA, 12–16 March 2006; pp. 060291–060297. [Google Scholar]
- Mühlberg, K. Corrosion protection of offshore wind turbines—A challenge for the steel builder and paint applicator. J. Prot. Coat. Linings 2010, 27, 20–32. [Google Scholar]
- Knudsen, O.; Steinsmo, U.; Bjordal, M.; Nijjer, S. Accelerated Testing and Five Years of Offshore Field Testing. J. Prot. Coat. Linings 2001, 18, 52–56. [Google Scholar]
- LeBozec, N.; Thierry, D.; Le Calvé, P.; Favennec, C.; Pautasso, J.P.; Hubert, C. Performance of marine and offshore paint systems: Correlation of accelerated corrosion tests and field exposure on operating ships. Mater. Corros. 2015, 66, 215–225. [Google Scholar] [CrossRef]
- ISO 2812-2; Paints and Varnishes—Determination of Resistance to Liquids—Part 2: Water Immersion Method. ISO: Geneva, Switzerland, 2018.
- ISO 15711; Paints and Varnishes—Determination of Resistance to Cathodic Disbonding of Coatings Exposed to Sea Water. ISO: Geneva, Switzerland, 2003.
- ISO 2178; Non-Magnetic Coatings on Magnetic Substrates—Measurement of Coating Thickness—Magnetic Method. ISO: Geneva, Switzerland, 2016.
- ISO 4624; Paints and Varnishes—Pull-Off Test for Adhesion. ISO: Geneva, Switzerland, 2016.
- ISO 12944-6; Paints and Varnishes-Corrosion Protection of Steel Structures by Protective Paint System—Part 6 Laboratory Performance Test Methods. ISO: Geneva, Switzerland, 2018.


| ISO 12944-9:2018 | Corrosivity Category | Durability | Environment |
|---|---|---|---|
| Atmospheric | CX | 15–25 years | Marine offshore |
| Splash | CX / Im4 | ||
| Immersion | Im4 |
| Test | CX (Atmospheric Offshore) | CX (Offshore) + Im4 (Splash and Tidal Zones) | Im4 (Submerged Zone) |
|---|---|---|---|
| Cyclic test annex B of ISO 12944-9 | 4200 h | 4200 h | - |
| Cathodic disbonding ISO 15711, method A | - | 4200 h | 4200 h |
| Seawater immersion, ISO 2812-2 | - | 4200 h | 4200 h |
| Parameter | Value |
|---|---|
| Annual precipitation | 1500 mm/year |
| Mean interannual temperature | Min 13 °C, Max 16 °C |
| Average interannual temperature | Min 10 °C, Max 16 °C |
| Average insolation | 1825 h/year |
| Average annual wetting time (RH * >80%, T >0 °C) | 5960 h |
| Water temperature | Min 11 °C (January), Max 22 °C (August) |
| Significant wave height | Min 1.15 m, Max 9.62 m, Average 1.67 m |
| Average salinity: | 35 USP. |
| Average dissolved O2 | 6 mL/L |
| Average transmittance: | 88% |
| Atmospheric Zone | |||
|---|---|---|---|
| Reference | Chemical Composition and Thickness | NDFT * (μm) | DFT Measured (μm) |
| A1-Zn ** | Zinc rich epoxy 60 μm Epoxy 160 μm Polyurethane (yellow) 60 μm | 280 | 281 |
| A2-Epox *** | Epoxy 200 μm Epoxy 200 μm Polyurethane (white) 60 μm | 460 | 485 |
| A3-Zn | Zinc rich epoxy 60 μm Epoxy 160 μm Polyurethane (yellow) 60 μm | 280 | 399 |
| A4-Zn | Zinc rich epoxy 60 μm Epoxy 170 μm Polyurethane (grey) 50 μm | 280 | 312 |
| Splash Zone | |||
|---|---|---|---|
| Reference | Chemical Composition and Thickness | NDFT (μm) | DFT Measured (μm) |
| S1 | Epoxy 275 μm Epoxy 275 μm Polyurethane (yellow) 60 μm | 610 | 691 |
| S2-GF | Epoxy GF * 300 μm Epoxy (grey) GF 300 μm | 600 | 728 |
| S3-GF | Epoxy GF 300 μm Epoxy GF 300 μm Polyurethane (yellow) 60 μm | 660 | 821 |
| S4 | Epoxy 300 μm Epoxy (grey) 300 μm | 600 | 629 |
| Submerged Zone (Immersion) | |||
|---|---|---|---|
| Reference | Chemical Composition and Thickness | NDFT * (μm) | DFT Measured (μm) |
| I1 | Epoxy 50 μm Epoxy (yellow) 300 μm | 350 | 440 |
| I2-GF | Epoxy GF 200 μm Epoxy (grey) GF 200 μm | 400 | 435 |
| I3 | Epoxy 200 μm Epoxy (grey) 150 μm | 350 | 461 |
| I4 * | Epoxy 300 μm Epoxy (grey) 300 μm | 600 | 629 |
| Ref. | Initial | Cycling Aging (4200 h) | Field Exposure (1 Year) | |||
|---|---|---|---|---|---|---|
| Fracture Mode | Adhesion (MPa) | Fracture Mode | Adhesion (MPa) | Fracture Mode | Adhesion (MPa) | |
| A1-Zn | 100% D | 15.09 | 70% A/B, 30% D | 10.72 | 100% D | 13.12 |
| A2-Epox | 55% C/D 45% C, | 11.06 | 100% C | 9.17 | 85% C, 15% C/D | 14.50 |
| A3-Zn | 80% D, 20% C | 8.90 | 70% D, 20% C, 10% C/D | 12.38 | 70% D, 20% C, 10% B | 12.54 |
| A4-Zn | 95% B, 10% B/C | 8.45 | 100% C | 9.70 | 50% C, 50% B | 10.07 |
| Ref. | Initial | Cycling Aging (4200 h) | Immersion Aging (4200 h) | Field Exposure (1 Year) | ||||
|---|---|---|---|---|---|---|---|---|
| Fracture Mode | Adhesion (MPa) | Fracture Mode | Adhesion (MPa) | Fracture Mode | Adhesion (MPa) | Fracture Mode | Adhesion (MPa) | |
| S1 | 100% D | 13.81 | 100% D | 14.56 | 55% D/Y, 45% D | 15.51 | 100% D | 14.69 |
| S2-GF | 100% C | 10.20 | 81%C, 19% B | 7.34 | 100% B | 8.77 | 50% B, 50% C | 9.67 |
| S3-GF | 90% D, 10% C/DC | 7.75 | 90% D, 10% C/D | 11.71 | 47% C/D, 46% D, 7% D/Y | 12.11 | 60% D, 40% C/D | 11.13 |
| S4 | 45% B, 40% C, 5%C/Y | 16.52 | 90% C, 10% B/C | 14.20 | 91% C, 9% B/C | 17.08 | 90% C, 10% B/C | 10.41 |
| Ref. | Cyclic Aging (mm) | Immersion Aging (mm) | Field Exposure (mm) |
|---|---|---|---|
| S1 | 14.01 | 0.30 | 3.09 |
| S2-GF | 15.67 | 0.17 | 5.20 |
| S3-GF | 15.90 | 0.17 | 6.06 |
| S4 | 12.79 | 0.13 | 3.19 |
| Ref. | Initial | Immersion Aging (4200 h) | Field Exposure (1 Year) | |||
|---|---|---|---|---|---|---|
| Fracture Mode | Adhesion (MPa) | Fracture Mode | Adhesion (MPa) | Fracture Mode | Adhesion (MPa) | |
| I1 | 65% C, 35% C/Y | 13.02 | 45% A/B, 35% C/Y, 20% C | 11.83 | 65% A/B, 35 C | 5.77 |
| I2-GF | 100% C | 10.09 | 85% C, 15% C/Y | 9.15 | 50% B, 25% C, 25% B/C | 11.50 |
| I3 | 86% B, 14% C | 12.01 | 73% B, 27%C | 14.30 | 50% B, 50% C | 11.07 |
| I4 | 45% B, 40% C, 5% C/Y | 16.52 | 38% B, 35% C/Y, 7% B/C, 7% Y/Z, 7% Y | 17.08 | 55% B, 35% C, 10% B/C | 13.94 |
| Atmospheric Zone | A (creep) | Splash Zone | A (Creep) Cyclic Test | A (Creep) Immersion Test | Submerged Zone | A (Creep) |
|---|---|---|---|---|---|---|
| A1-Zn | 12.19 | S1 | 9.47 | 0.20 | I1 | 0.27 |
| A2-Epox | 6.33 | S2-GF | 6.29 | 0.07 | I2-GF | 0.39 |
| A3-Zn | 3.38 | S3-GF | 5.47 | 0.06 | I3 | 0.90 |
| A4-Zn | 2.02 | S4 | 8.38 | 0.09 | I4 | 0.47 |
| Coating Solution | Coating Systems | Application Duration TApp (h) | Minimum Overcoating Interval TOver (h) | Dry to Handle Time THandle (h) | Total Application Time TTotal (h) | Application Time Whole Monopile TSolution (h) | ||||
|---|---|---|---|---|---|---|---|---|---|---|
| (20 °C) | (30 °C) | (20 °C) | (30 °C) | (20 °C) | (30 °C) | (20 °C) | (30 °C) | |||
| Solution 1 | A1-Zn | 9.7 | 1.5 | 0.85 | 8 | 4 | 49.9 | 39.25 | 121.12 | 84.97 |
| 9.7 | 4 | 2 | ||||||||
| 6 | 8 | 4 | ||||||||
| S1 | 2.91 | 8 | 4 | 8 | 4 | 40.52 | 24.52 | |||
| 2.91 | 8 | 4 | ||||||||
| 1.8 | 8 | 4 | ||||||||
| I1 | 4.85 | 3.5 | 2 | 8 | 4 | 30.7 | 21.2 | |||
| 4.85 | 8 | 4 | ||||||||
| Solution 2 | A2-Epox | 9.7 | 5.5 | 3.5 | 8 | 3.5 | 55.4 | 42.4 | 106.32 | 80.32 |
| 9.7 | 5.5 | 3.5 | ||||||||
| 6 | 8 | 3.5 | ||||||||
| S2-GF | 2.91 | 5.5 | 3.5 | 5.5 | 3 | 23.22 | 16.72 | |||
| 2.91 | 5.5 | 3.5 | ||||||||
| I2-GF | 4.85 | 5.5 | 3.5 | 5.5 | 3 | 27.7 | 21.2 | |||
| 4.85 | 5.5 | 3.5 | ||||||||
| Solution 3 | A3-Zn | 9.7 | 2 | 1.5 | 5 | 4.5 | 48.4 | 43.4 | 113.62 | 93.12 |
| 9.7 | 6 | 4.5 | ||||||||
| 6 | 7 | 4.5 | ||||||||
| S3-GF | 2.91 | 6 | 4.5 | 7 | 4.5 | 34.52 | 26.52 | |||
| 2.91 | 6 | 4.5 | ||||||||
| 1.8 | 7 | 4.5 | ||||||||
| I3 | 4.85 | 6 | 4.5 | 6 | 4.5 | 30.7 | 23.2 | |||
| 4.85 | 6 | 4.5 | ||||||||
| Solution 4 | A4-Zn | 9.7 | 4 | 2 | 6 | 5 | 52.4 | 46.4 | 113.82 | 93.82 |
| 9.7 | 8 | 6 | ||||||||
| 6 | 6 | 5 | ||||||||
| S42 | 2.91 | 8 | 5 | 6 | 5 | 28.72 | 21.72 | |||
| 2.91 | 8 | 5 | ||||||||
| I42 | 4.85 | 8 | 5 | 6 | 7 | 30.7 | 23.2 | |||
| 4.85 | 8 | 5 | ||||||||
Publisher’s Note: MDPI stays neutral with regard to jurisdictional claims in published maps and institutional affiliations. |
© 2022 by the authors. Licensee MDPI, Basel, Switzerland. This article is an open access article distributed under the terms and conditions of the Creative Commons Attribution (CC BY) license (https://creativecommons.org/licenses/by/4.0/).
Share and Cite
Marinova, N.; Urbegain, A.; Benguria, P.; Travé, A.; Caracena, R. Evaluation of Anticorrosion Coatings for Offshore Wind Turbine Monopiles for an Optimized and Time-Efficient Coating Application. Coatings 2022, 12, 384. https://doi.org/10.3390/coatings12030384
Marinova N, Urbegain A, Benguria P, Travé A, Caracena R. Evaluation of Anticorrosion Coatings for Offshore Wind Turbine Monopiles for an Optimized and Time-Efficient Coating Application. Coatings. 2022; 12(3):384. https://doi.org/10.3390/coatings12030384
Chicago/Turabian StyleMarinova, Nevena, Aiala Urbegain, Pablo Benguria, Andreu Travé, and Raúl Caracena. 2022. "Evaluation of Anticorrosion Coatings for Offshore Wind Turbine Monopiles for an Optimized and Time-Efficient Coating Application" Coatings 12, no. 3: 384. https://doi.org/10.3390/coatings12030384