Article

Electrochemical Behavior of Nickel Aluminide Coatings Produced by CAFSY Method in Aqueous NaCl Solution

by
Amalia Marinou
1,2,*,
Angeliki G. Lekatou
1,3,
Galina Xanthopoulou
2 and
George Vekinis
2
1
Department of Materials Science and Engineering, University of Ioannina, 45110 Ioannina, Greece
2
Institute of Nanoscience and Nanotechnology, National Centre of Scientific Research “Demokritos”, 15310 Athens, Greece
3
Institute of Materials Science and Computing, University Research Center of Ioannina (URCI), 45110 Ioannina, Greece
*
Author to whom correspondence should be addressed.
Coatings 2022, 12(12), 1935; https://doi.org/10.3390/coatings12121935
Submission received: 31 October 2022 / Revised: 2 December 2022 / Accepted: 5 December 2022 / Published: 8 December 2022
(This article belongs to the Special Issue Surface Modification/Engineering for Electrochemical Applications)

Abstract

:
Combustion-assisted flame spraying (CAFSY) is a novel method that allows in-flight synthesis of alloys during flame spraying. The in-flight synthesis of alloys by the CAFSY method during flame spraying combines two different methods: the self-propagating high-temperature synthesis (SHS) and flame spraying (FS). The present work studies the corrosion performance (by cyclic polarization and chronoamperometry in aerated 3.5 wt.% NaCl) of NiAl coatings fabricated by the CAFSY technique in relation to main process parameters (composition of the initial feedstock, spraying distance, substrate temperature, postdeposition heat treatment) and their effect on the microstructure and porosity of the coatings. Most of the coatings exhibited limited susceptibility to localized corrosion. In all cases, the steel substrate remained intact despite corrosion. Interconnected porosity was the main parameter accelerating uniform corrosion. Localized corrosion had the form of pitting and/or crevice corrosion in the coating that propagated dissolving Al and Al-rich nickel aluminides along coating defects. Substrate preheating and postdeposition heat treatment negatively affected the corrosion resistance. A short spraying distance (1.5 inch) increased the corrosion resistance of the coatings.

1. Introduction

The intermetallic compounds (IC) of NiAl and Ni3Al are important for the industry, owing to their outstanding properties as protective coatings [1,2]. Because of their high melting points, these intermetallic compounds are used in high-temperature applications, such as heat treatment furnaces, gas turbines, aircraft connectors, automotive turbochargers, pistons and valves, tools, and permanent molds [3]. The application of nickel aluminide coatings on metals and alloys has a beneficial effect on the high-temperature performance of boilers and turbines that operate at high temperatures [4]. The intermetallic compounds of the Ni-Al system are known for their high-temperature mechanical strength and can improve the resistance to oxidation and corrosion by forming a protective outer alumina film [5]. It has also been reported that the two-phase material Ni3Al + NiAl exhibits a synergistic beneficial effect on the properties of these alloys and has been used in aerospace engines [6]. In addition, intermetallic compounds in the Ni-Al system, as well as the Ti-Al system, are considered strong candidates as new alternative structural systems for high-temperature applications [7,8,9,10].
The in-flight synthesis of alloys by the CAFSY method during flame spraying combines two different methods: the self-propagating high-temperature synthesis (SHS) and flame spraying (FS) [11,12]. During CAFSY, the initial mixture of base-metal powders is introduced into the flame, and, during the flight stage, the base-metal powders react exothermically, producing in situ intermetallic coatings on the substrate [13].
In the past, a similar in-flight synthesis during thermal spraying was demonstrated only by plasma spraying due to the very high temperatures that can be reached [14,15,16,17]. However, plasma spraying significantly increases the cost of such composite coatings due to a high consumption of electricity [18]. The need to synthesize low-cost coatings in an oxygen-acetylene flame was the main impetus that led to the development of the CAFSY method by the authors of the present work [19,20].
The in-flight flame spraying method is an economical and portable method of synthesis of coatings of various compositions using pure conventional powders (powder particle size: 40–250 mm). The first efforts to synthesize nickel aluminides in-flight from pure Ni and Al powders were described in previous works [19,20]. The exothermic reactions during flight increase the available energy; thereby, the required reaction time between Ni and Al is reduced, resulting in a rapid synthesis of the NiAl and Ni3Al intermetallics [19,20]. The Ni-Al system was selected because the intermetallic compounds of the system (particularly NiAl and Ni3Al) are widely used in industry as built-up and bond coats, as well as for high-temperature applications [1,21].
Since commercial Ni and Al powders are widely available and very inexpensive, CAFSY eliminates the need to use the expensive pre-alloyed powders generally used for thermal spraying and hard coatings [22,23].
During CAFSY of various Ni and Al powder mixtures in air, many different compounds form (NiAl3, Ni2Al3, NiAl, Ni3Al, NiO, Al2O3, NiAl2O4) by mostly exothermic combustion reactions, which have originally been described by Naiborodenko et al. [24]. Unfortunately, the formation of nickel aluminides is accompanied by the generation of oxides and spinels within the final coating.
The process parameters are determined on the basis of one product stoichiometry (NiAl with a stoichiometric ratio of Ni-to-Al equal to 1:1). However, during SHS and even during the mechanical treatment of the Ni-Al system, complicated mechanisms occur with many parallel reactions that lead to multiphase products composed of mixtures of two or more from NiAl3, Ni2Al3, NiAl, Ni3Al and Ni [25,26,27].
Previous efforts [19,28] by the authors focused on the improvement of the process parameters. Parameter optimization led to high-quality coatings with low porosity (<3%), coherent structure, good adhesion strength to the substrate (>40 MPa) and a low erosion rate (2–8 mg/min) [19]. When the matrix of the coating consists of large amounts of Ni and Al, intermetallics do not significantly affect the erosion resistance. Instead, coatings with high amounts of NiAl and Ni3Al and simultaneously low contents of brittle NiAl3 and Ni2Al3 phases have shown improved resistance to airborne sand erosion [19,20]. It was also shown that the content of intermetallic phases in the coatings can be improved substantially by post-spraying heat treatments applied by repeated passes of the materials in the flame [28].
In many applications, coatings are required to combine high hardness and erosion resistance with high aqueous corrosion resistance. Many studies have been carried out on the corrosion behavior of Al-alloys and Ni-alloys; much fewer studies have addressed the corrosion performance of aluminides of transition metals (TMs). The bilayered structure of the passive film of Al is long known [29]. According to Bockris et Kang [30], the outer layer consists of Al-oxide, hydrated alumina and fibril-like AlOOH. The inner layer is mainly composed of Al2O3, with small amounts of fibril AlOOH. Several studies have reported that the passive film on Ni is bilayered, comprising an inner barrier NiO layer and an outer Ni(OH)2 layer [31,32,33]. Oxides of alloying elements (such as Cr, Ta, Si, Ge) may benefit the localized corrosion resistance of Al and Fe-aluminides by blocking the Cl adsorption sites [30,34,35]. Mixed multilayered structures of hydroxides/oxy-hydroxides/oxides of Al and TMs have been reported to form on aluminides of TMs exposed to various electrolytes [34,36,37,38,39,40,41,42]. The inner layers are composed of anhydrous oxides that have a barrier character, whereas the outer layers are composed of mixed Al-TM hydroxides/oxy-hydroxides. The presence of transition metals, such as Cr [43,44], W [30], Mo [30], Ta [30,45], Co [39,40,46], etc., in the Al2O3-based passivating layer reportedly improves the localized corrosion resistance in solutions containing Cl. In many metals, aggressive anions, such as Cl, are able to enhance the flux of cation vacancies through the barrier layer, such that under favorable conditions (voltage, pH, Cl concentration), vacancy condensation will occur at the metal/barrier layer interface and, hence, passivity breakdown will ensue [47].
Within the above framework, the present work presents results of the corrosion performance of nickel aluminide coatings fabricated by the CAFSY technique in relation to the process parameters and their effect on the microstructure and porosity of the coatings (both of paramount importance for the corrosion behavior of a material). An integrated evaluation of the above coatings has the final objective to open the way for the synthesis of coatings of other compositions by the CAFSY method.

2. Materials and Methods

Plates of 304L stainless steel (nominal size 4 cm × 5 cm) were coated by the CAFSY method. The following powders were used as feedstock materials: Sulzer-Metco’s 56C-NS (Ni) and pure aluminum (99.5%) from Aluminium Powder Company ALPOCO Ltd. (Rotherham, UK), with particle sizes of 45–75 μm and 45–90 μm, respectively. Flame spraying was conducted employing the 5P-II oxy-acetylene flame spraying gun. During CAFSY, the Ni and Al powder mixture reacted in an SHS synthesis regime, both in-flight and on the surface of coupons, producing various nickel aluminides. Table 1 presents the parameters employed in the present study, as previously determined [20,28]. Four different parameters were studied: (1) composition of the initial powder (COMPO), (2) distance of thermal spraying (DIST), (3) substrate temperature (SUBTEM) and (4) postheat treatment (COATR). The substrate temperature was measured by an infrared thermometer (UEI, INF 151) and was determined under identical conditions of passing the gun over the substrate without powder feeding and heating it up until the desired temperature was reached. Postheat treatment was carried out applying a number of gun passes after the coating deposition; the temperature was measured by an infrared thermometer.
Rectangular coated coupons were cut with a diamond saw and used for electrochemical testing. The coupons were ground with a #1000 SiC grit to a final roughness of lower than 5 μm in order to avoid the formation of microgalvanic cells due to their initial roughness. Ultrasonically cleaned coupons were encapsulated in PTFE, leaving an exposed surface area of ∼1 cm2 to be exposed to aerated 3.5 wt.% NaCl at 25 °C. A standard three-electrode cell (reference electrode: Ag/AgCl (3.5 M KCl, EAgCl = ESHE − 200 mV), counter electrode: Pt gauge) was employed. All the electrochemical tests were performed using the Gill AC potentiostat/galvanostat by ACM instruments. The rest potential (Erest) was determined after 4 h of immersion in 3.5% NaCl at 25 °C (open circuit state). Following the determination of the rest potential, potentiodynamic polarization tests were carried out at a scan rate of 10 mV/min. Tafel extrapolation [48] was used to determine the corrosion current densities. In this work, linear regression analysis (least squares method) was applied to the E–log (i) data starting from Erest ± 50 mV and extending over a current density range of at least one order of magnitude. The linear regression was computed by the statistical analysis tools of Microsoft Excel (LINEST and TREND functions). A reasonable accuracy was ensured by conforming to several criteria elaborately reported in previous works [49,50].
Reverse polarization tests were also conducted to study the susceptibility of the coatings to localized corrosion. This technique is based on the principle that pitting would occur if the current density of the anodic curve of the reverse scan is greater than the current density of the forward scan for the same anodic potential [51]. In that case, the so-called “negative hysteresis” results. More details can be found in a previous work [50]. Finally, chronoamperometry tests (2 h in 3.5% NaCl at 25 °C) were carried out in order to confirm the indications of the potentiodynamic polarization tests regarding the nature and the protection ability of the current limiting processes.
The microstructure of the specimens was examined by scanning electron microscopy (SEM), under secondary electron (SE) and back scattered image (BSE) modes, and energy dispersion X-ray (EDX) analysis in the Quanta Inspect FEI Inspect SEM. The surface phases in the coatings were identified by X-ray diffraction analysis (XRD). The development of the various intermetallics was monitored by calculating the peak ratios of intensities of particular XRD peaks. The peaks used were: for aluminum, hkl: 111; for NiAl, hkl: 220; for Ni3Al, hkl: 311; and for NiAl3, hkl: 112. These peaks were selected because they were uniquely assigned to their respective phases. The porosities of the coatings were determined by image analysis on polished cross-sections (×500 magnification); image analysis was carried out by thresholding the porosity in the field of view. Ten separate fields of view per sample were analyzed. The Leica image analysis method was used. Pores were identified by a process of color segmentation.

3. Results and Discussion

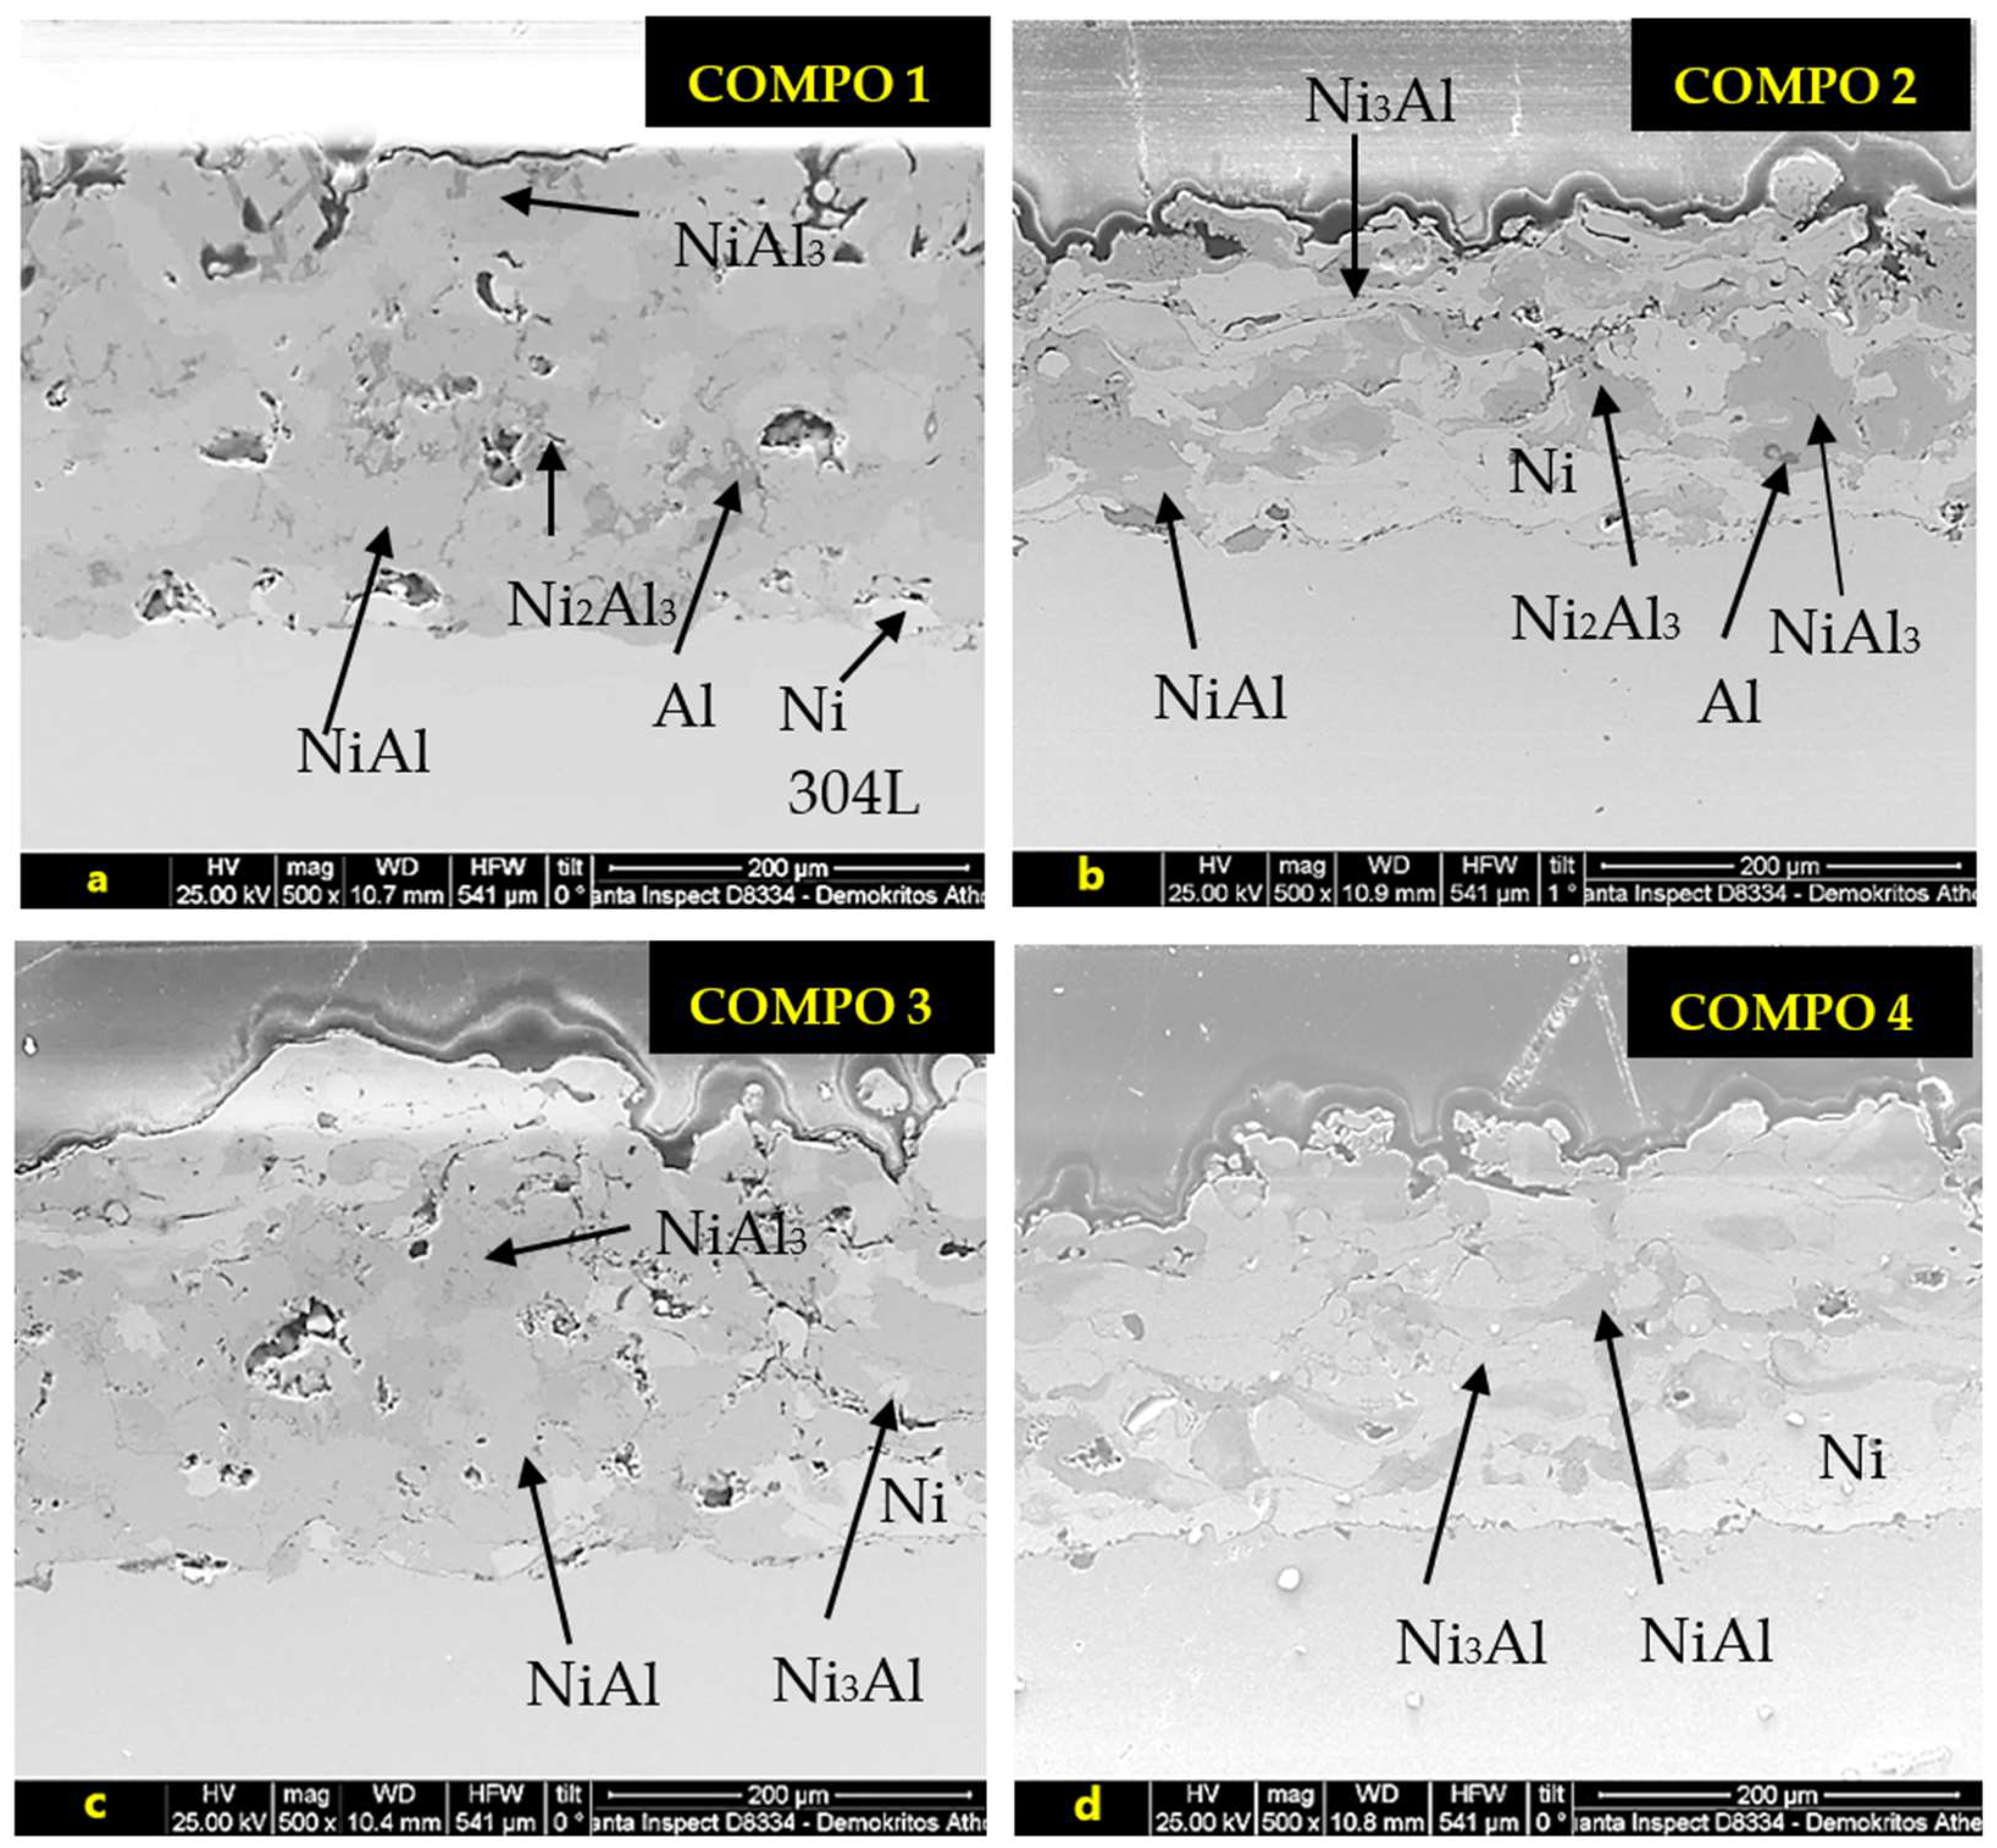
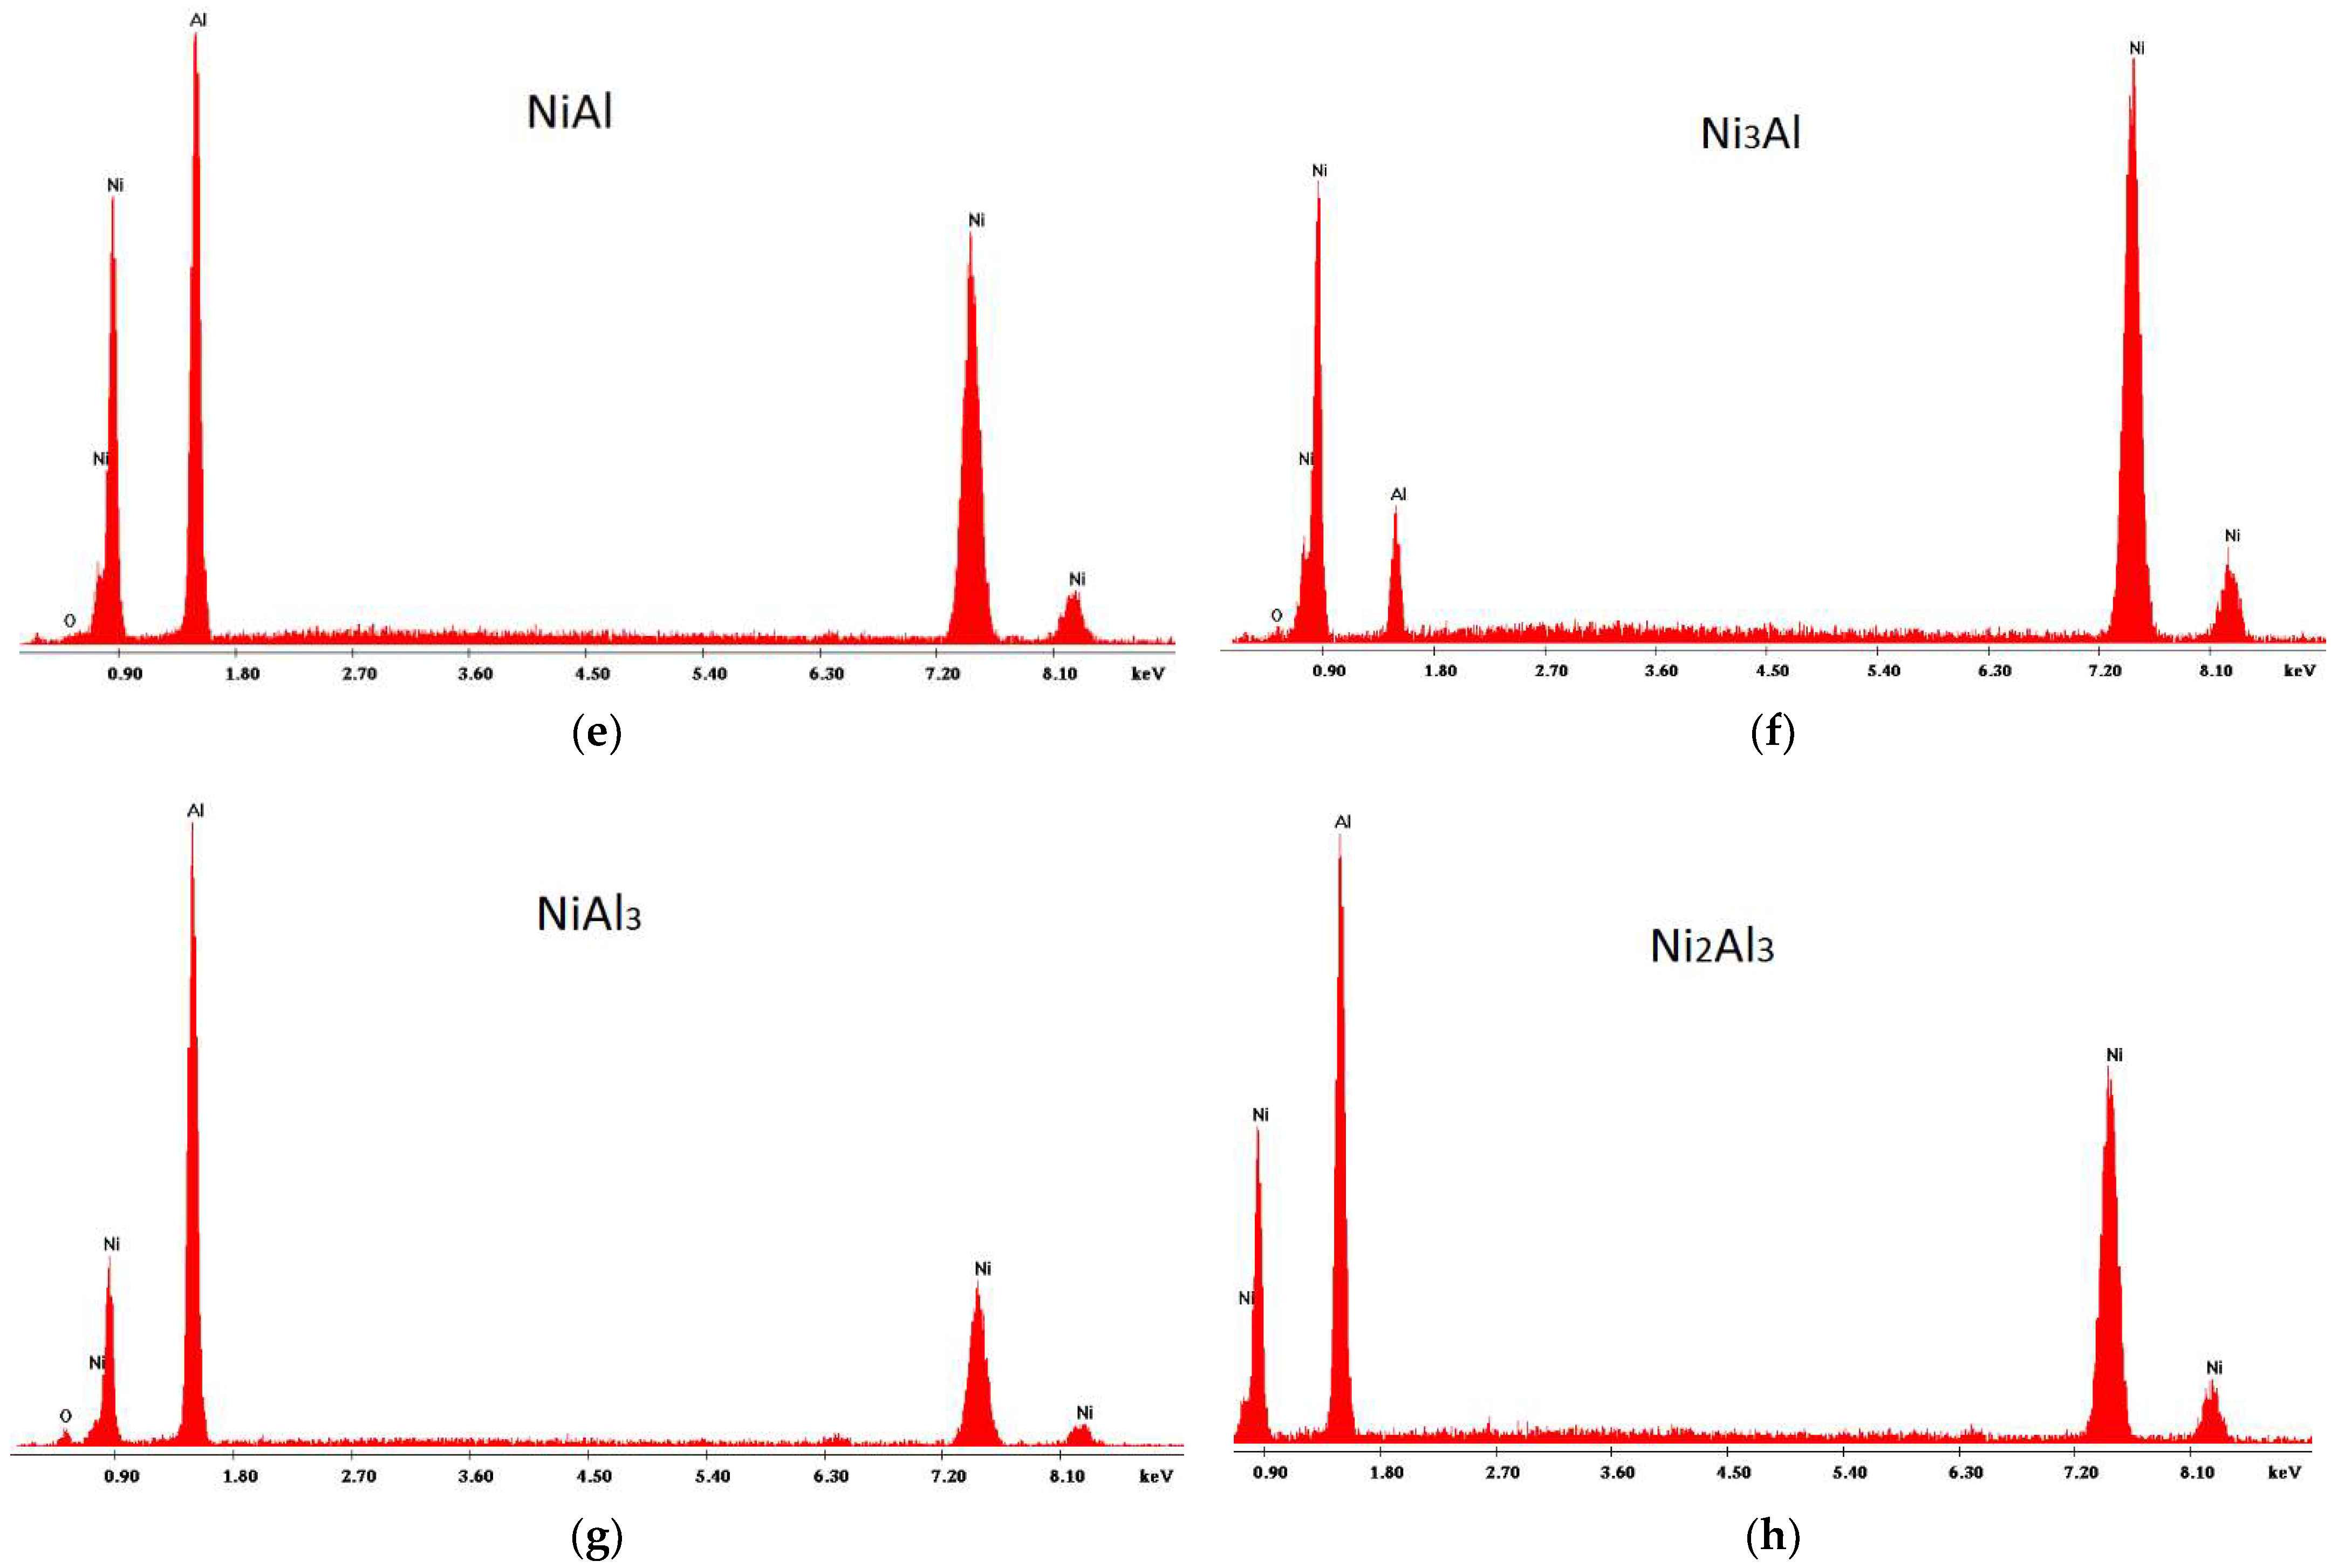
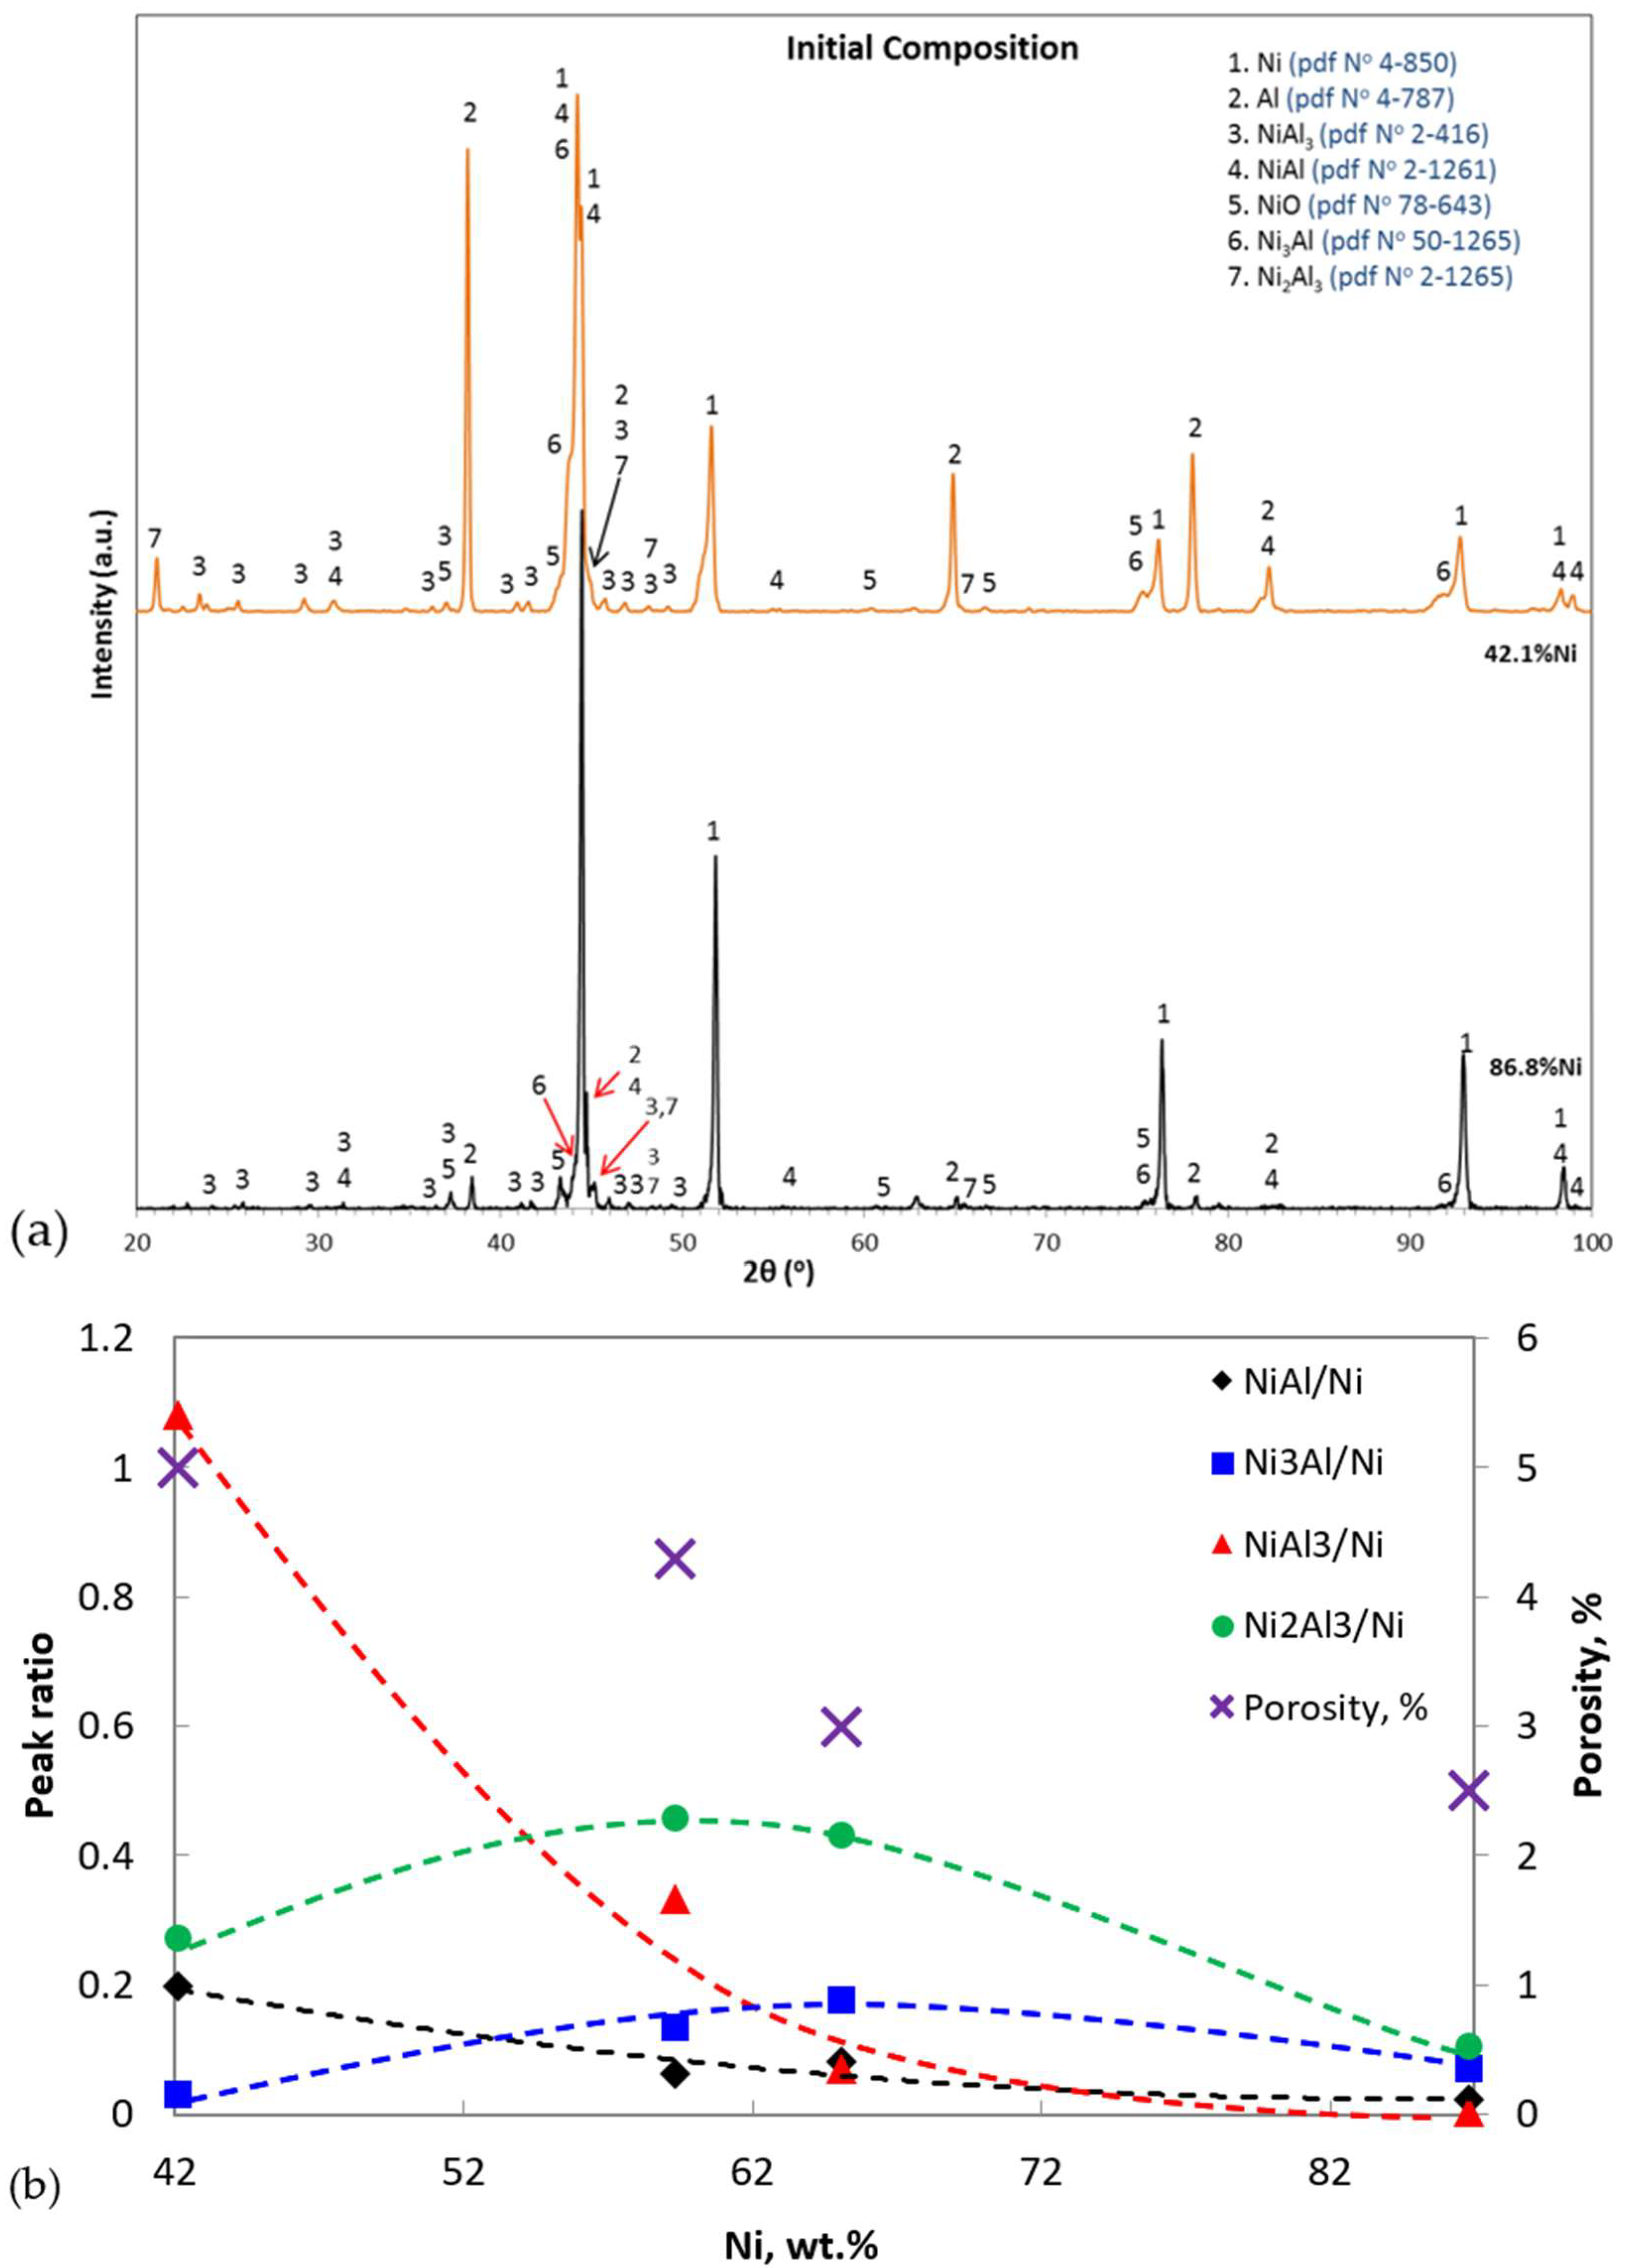
3.1. Microstructure of the As-Sprayed Coatings

3.1.1. Effect of Composition

Figure 1 illustrates cross-sections of coatings that were fabricated from powders of different Ni contents and were subjected to a heat treatment of 10 gun passes. Relatively high percentages of intermetallic compounds and scare unmelted particles were revealed. According to elemental quantitative EDX, the intermetallics found correspond to NiAl, NiAl3, Ni2Al3 and Ni3Al. Heat treatment significantly increased the coating temperature, favoring solid–liquid phase reactions between intermetallic compounds and Al, as well as solid-phase reactions [26].
X-ray diffraction analysis in Figure 2a (using data of [52]) shows that coatings COMPO 1, COMPO 2 and COMPO 3 (42.1 wt.%, 59.3 wt.% and 65.1 wt.% Ni) consisted of Ni, NiAl, NiAl3, Ni2Al3, Ni3Al, Al, NiO, NiAl2O4 and Al2O3 phases. Coating COMPO 4 (86.8 wt.% Ni) displayed only traces of NiAl3, while no Al and Al2O3 were detected. It is clear that as the concentration of Ni in the initial mixture increased up to 65.1 wt.%, the amount of the Ni3Al phase increased. The non-detection of an Al phase in the final product of COMPO 4 indicates that Ni3Al was rather the product of reaction between NiAl and Ni than reaction between Ni and Al.
As shown in Figure 2b, the concentration of each NixAly phase (as a function of the Ni percentage) appears to be maximum in the Ni composition corresponding to the stoichiometry of the respective reaction between Ni and Al (42.1 wt.% Ni is the percentage that corresponds to the NiAl3 stoichiometry during reaction Ni + 3Al → NiAl3; 59.3 wt.% Ni corresponds to the Ni2Al3 stoichiometry during reaction 2Ni + 3Al → Ni2Al3; and 65.1 wt.% Ni corresponds to the NiAl stoichiometry during reaction Ni + Al → NiAl). On the other hand, the concentration of Ni3Al in the coating with 86.8 wt.% Ni (corresponding to the Ni3Al stoichiometry during reaction 3Ni + Al → Ni3Al) appears lower than those in the other compositions, as a result of the lowest Al concentration in the initial mixture. For such a low Al concentration in the initial mixture, the reaction between three Ni particles and one Al particle to produce Ni3Al during flight is perplexing, whereas Al sublimation in the flame deteriorated the yield of reaction 3Ni + Al → Ni3Al. Figure 2 also shows that the porosity of the coating decreased with increasing the percentage of Ni. As the Ni percentage increased, less aluminum became available to sublime and, hence, less Al2O gas could be trapped between coating splats.

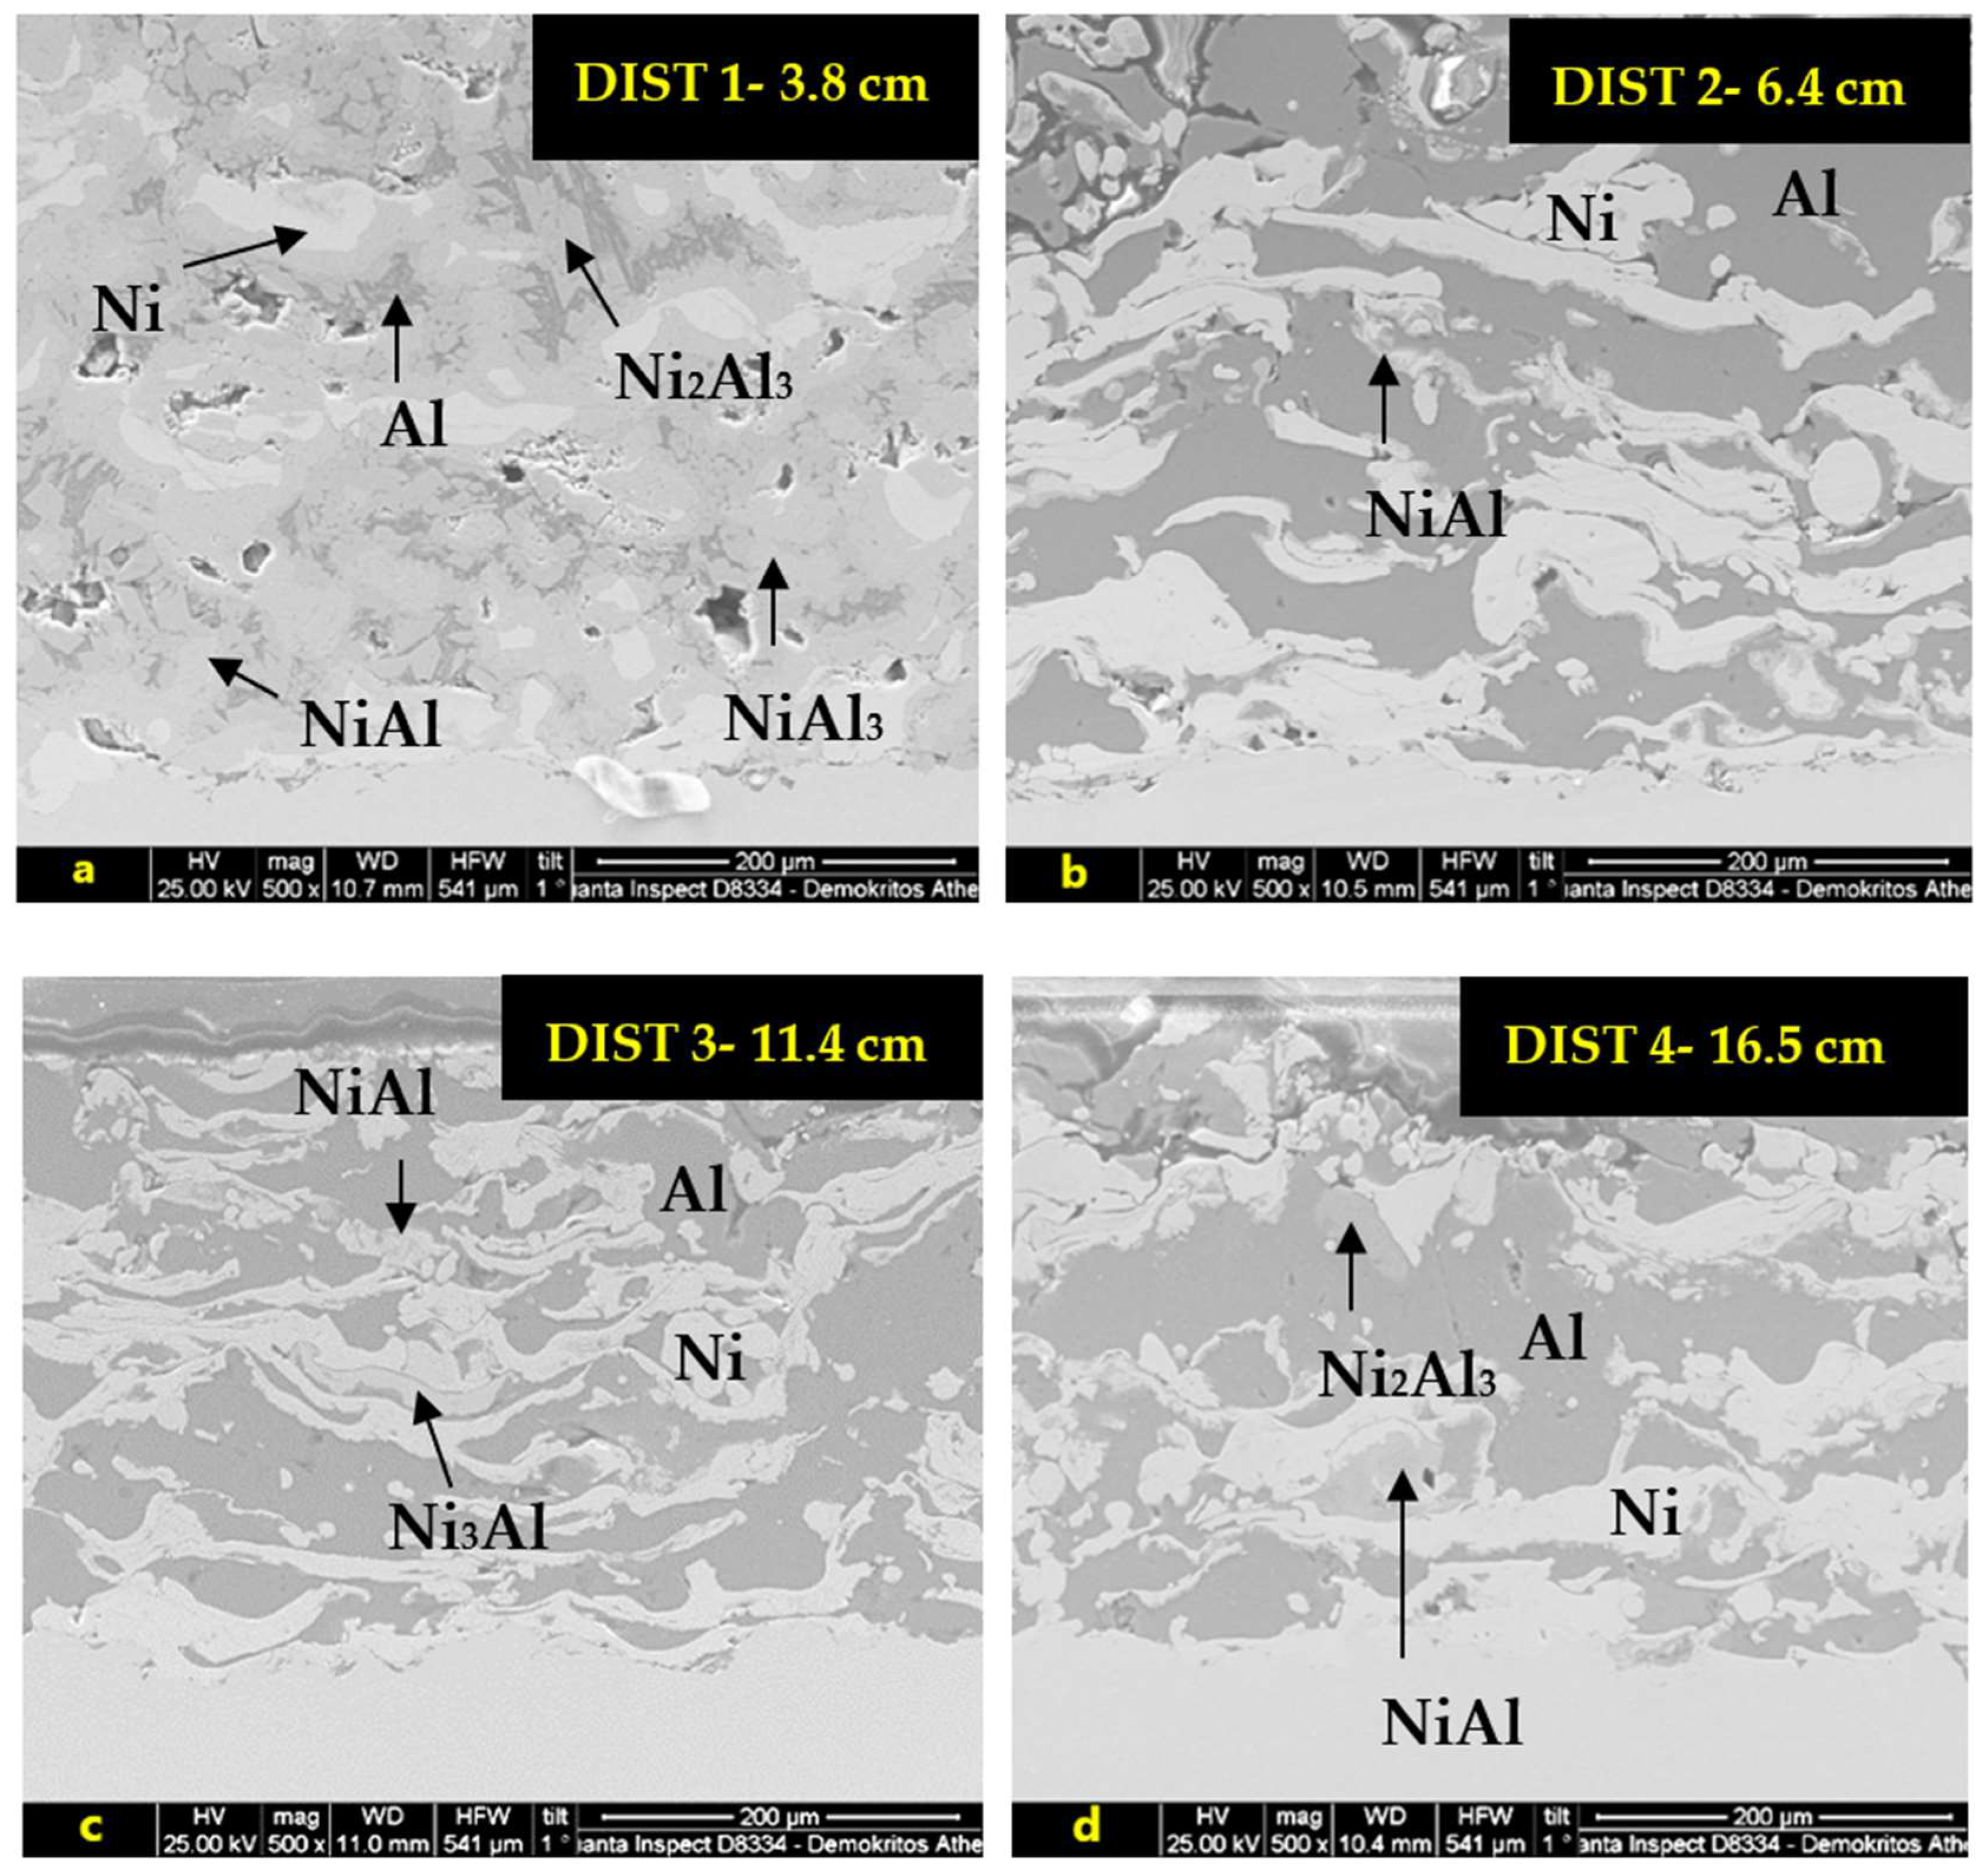
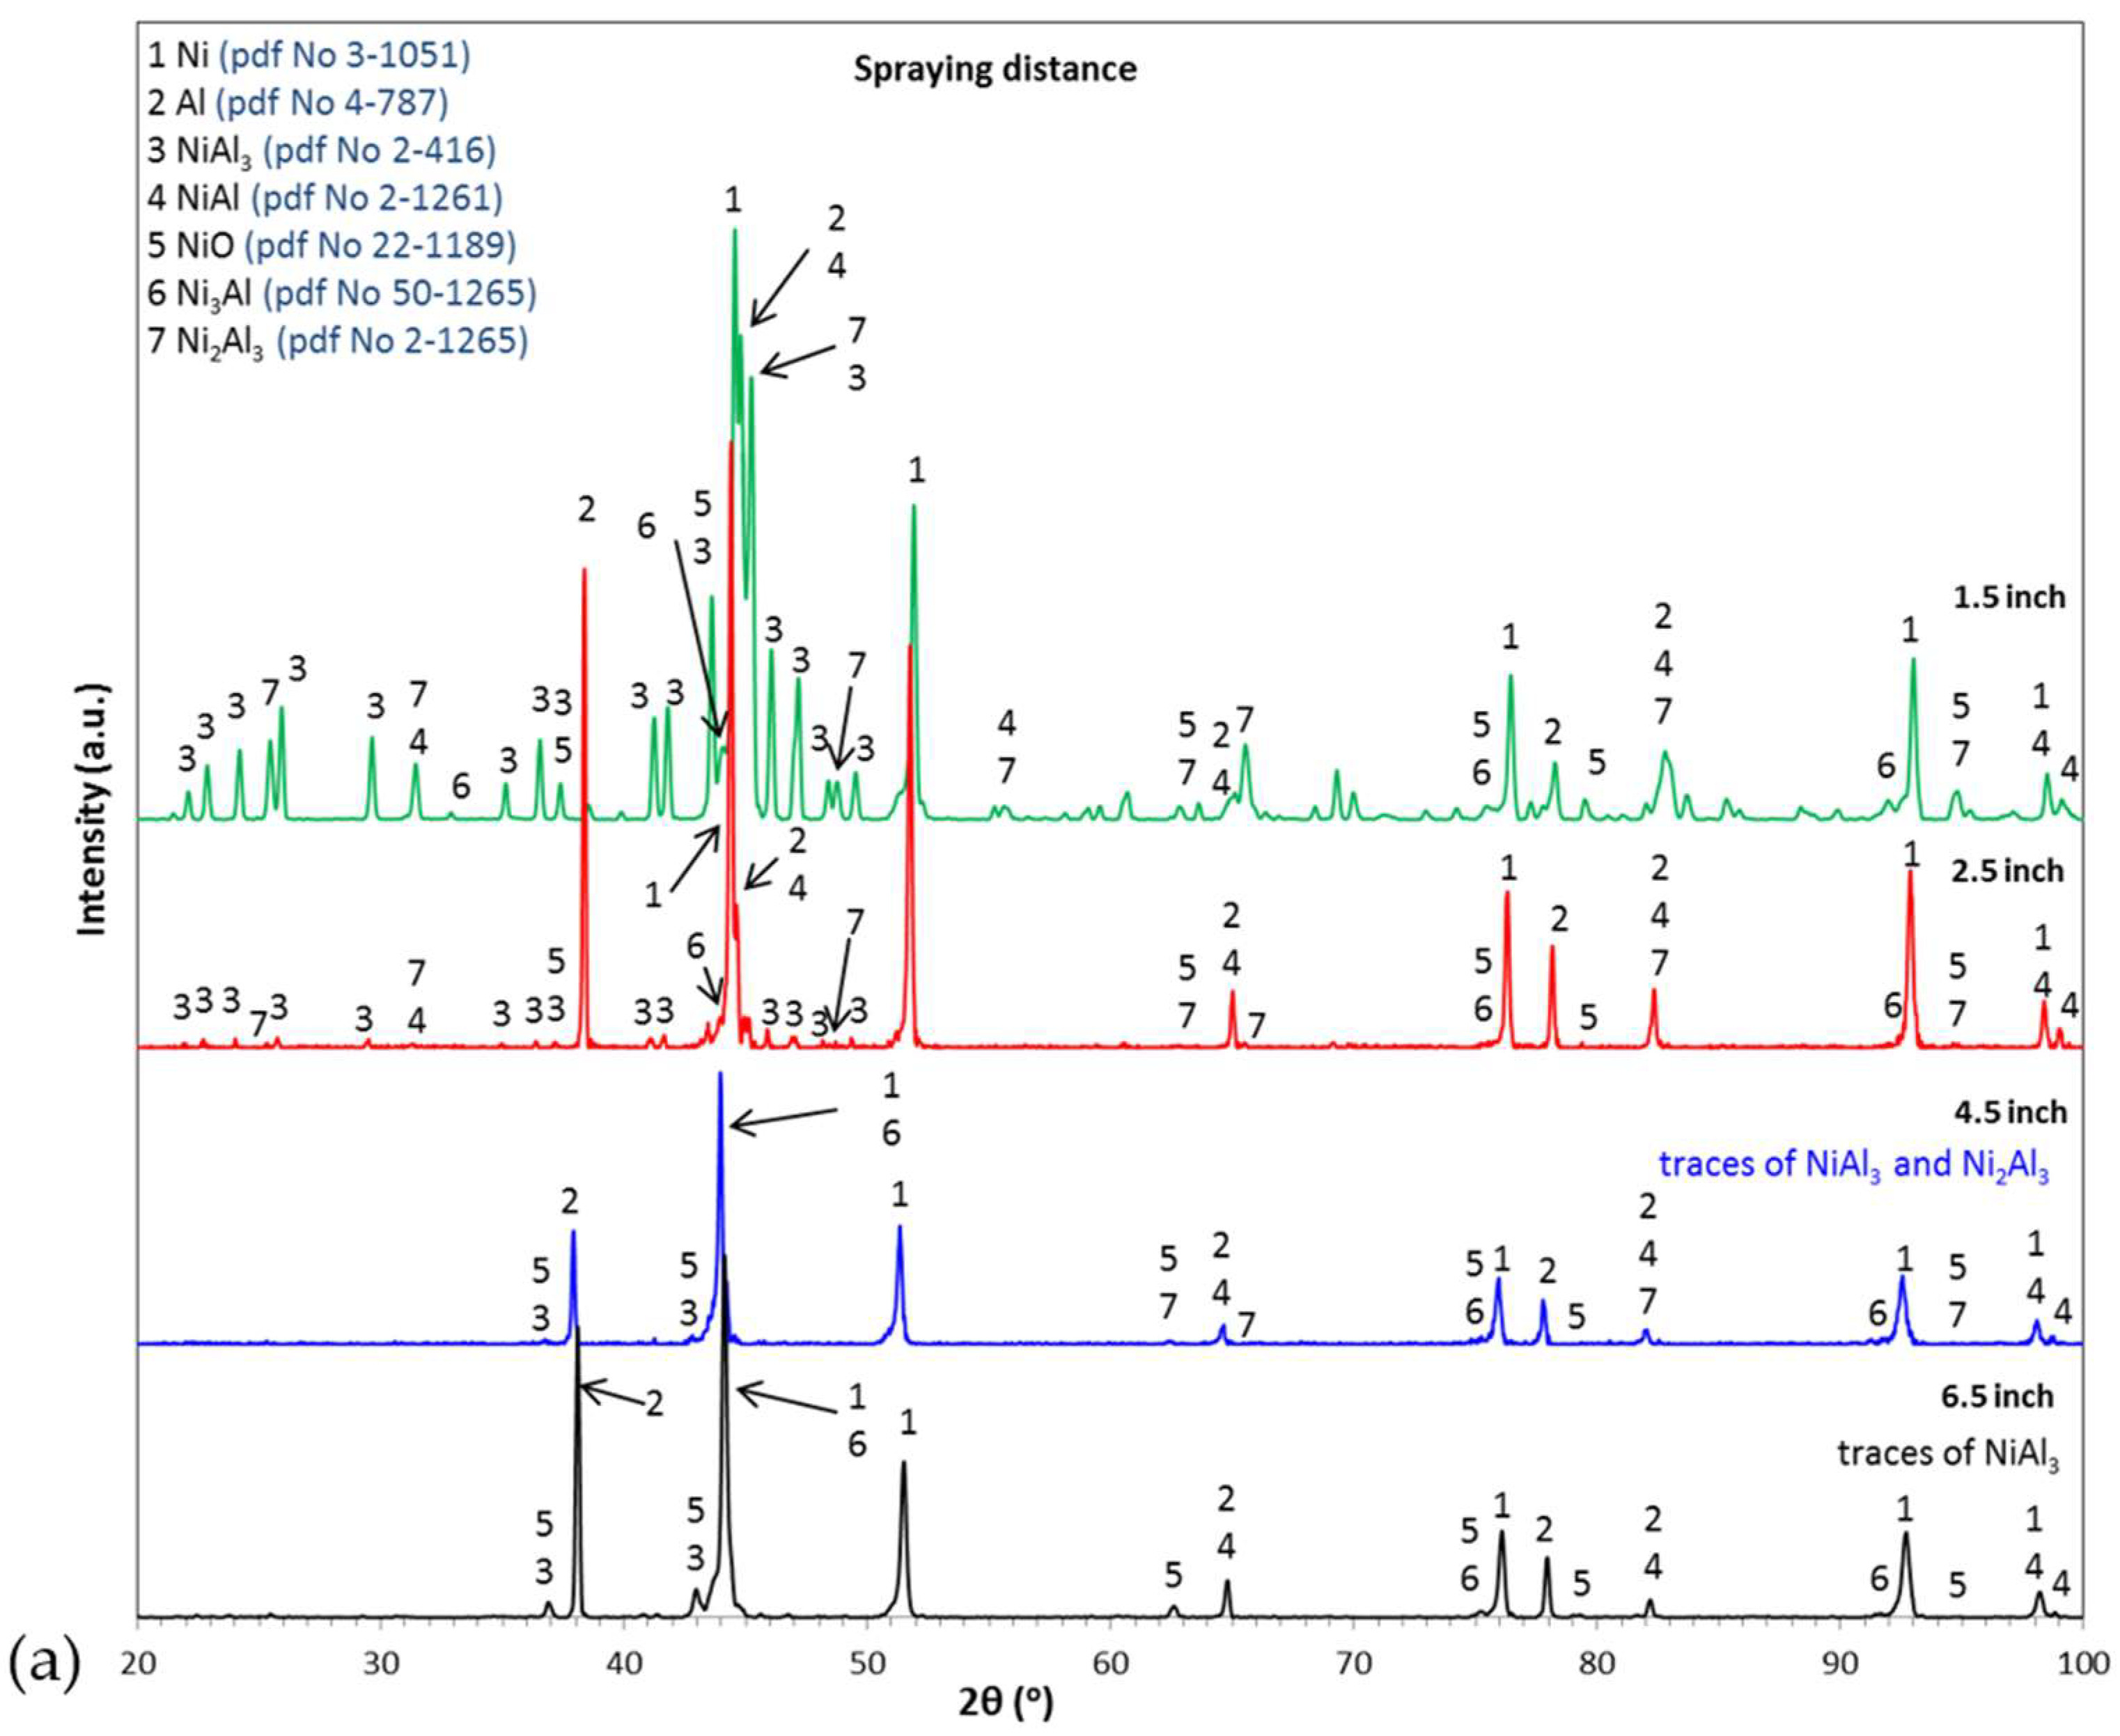
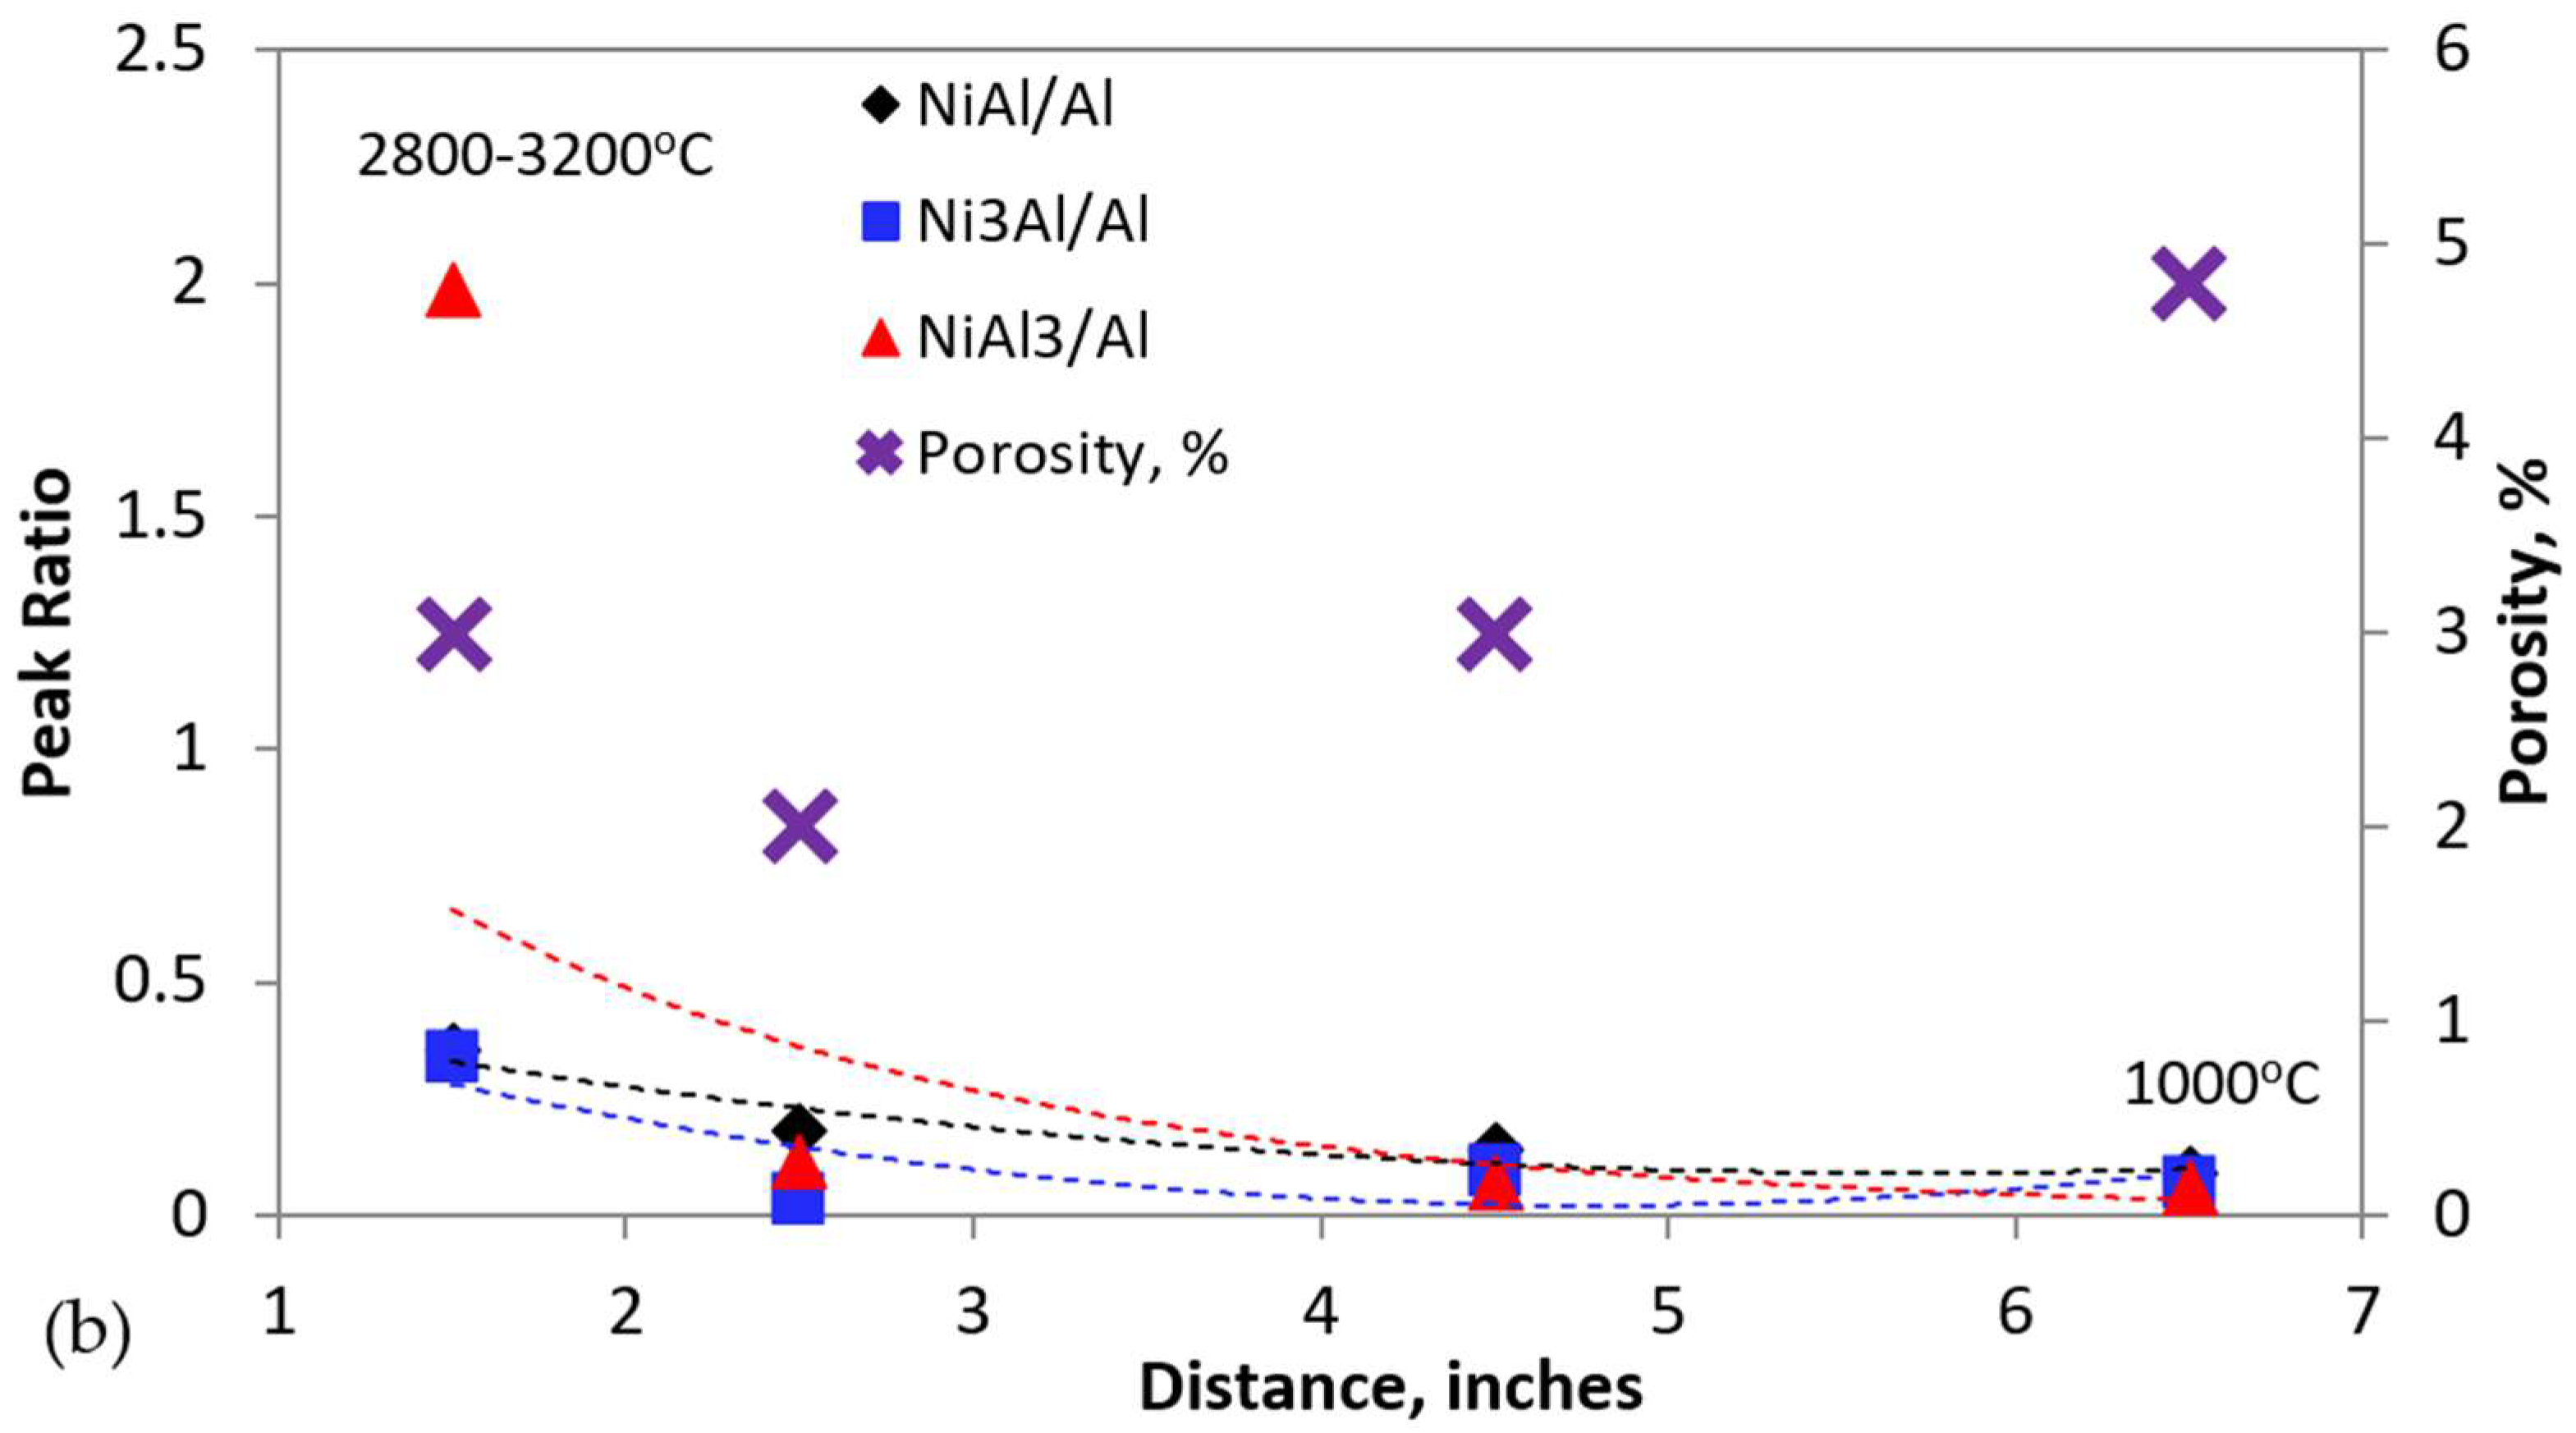
3.1.2. Effect of Thermal Spraying Distance

SEM examination of cross-sections of the coatings (Figure 3) shows that as the spraying distance decreased, the amount of the intermetallic compounds formed (intermediate contrast regions) increased. At the distance of about 3.8 cm (Figure 3a), the Al phase (dark-gray contrast) appears drastically reduced, while there is a strong presence of intermetallic compounds. Quantitative EDX analysis identified the presence of NiAl3, NiAl and Ni2Al3 intermetallics. An increase in the spraying distance led to an increase in the remaining Al phase in the final product because by moving the gun away from the substrate, the substrate temperature decreased. At close spraying distances, the substrate temperature reached high values, enhancing the complete melting of the aluminium particles. When the fully melted particles impacted the substrate, the droplets backscattered and did not adhere to the substrate, creating cavities. As a result, the porosity of the coating increased.
Indeed, the porosity of coating DIST 1 (3.8 cm spraying distance, Figure 3a) appears to be higher than that of DIST 2 (6.4 cm spray distance, Figure 3b). Besides the aforementioned scattering of the droplets, a major reason for the increased porosity at the short spraying distance is the sublimation of Al inside the flame (higher temperatures enhance evaporation of Al, leading to formation of Al2O gas trapped between the splat of the coating) and on the surface of the substrate of DIST 1 (higher temperatures of the coating surface also lead to higher sublimation of Al at the surface).
The XRD analysis in Figure 4a shows that the coatings consisted of Ni, Al, NiAl, Ni3Al, NiAl3, Ni2Al3 and NiO phases. The DIST 1 coating sprayed at the lowest distance exhibited the lowest concentration of Al and the highest concentrations of NiAl3 and Ni2Al3 (based on the relative intensities of the corresponding peaks [53,54]). Conversely, an increase in the spraying distance led to reduced peak intensities of the Ni-aluminides. Specifically, only traces of NiAl3 were observed in the diffractograms of DIST 3 and DIST 4 coatings (11.4 and 16.5 cm distances, respectively), while the Ni2Al3 phase was not even detected in the diffractogram of coating DIST 4.
In more detail, the semiquantitative presentation of the peak ratios (Al, hkl: 111, Ni hkl: 200, NiAl, hkl: 220, Ni3Al, hkl: 311 and NiAl3, hkl: 112 [55]) as functions of the thermal spraying distance in Figure 4b shows that as the spraying distance increased, the concentrations of NiAl, Ni3Al and NiAl3 decreased. The concentration of NiAl3 shows a sharp drop, with distance increasing from 1.5 inch to 2.5 inch. The concentrations of the NiAl and Ni3Al compounds appear to have stabilized at spraying distances greater than 2.5 inch, suggesting that more energy was needed to increase their concentration in the coating. This action can be performed by varying other spraying conditions.
During flame spraying, the substrate continues to be heated. As such, when the substrate is closer to the gun, the temperature of the coating and the substrate increases faster and continuously until the whole coating is sprayed. Therefore, at the spraying distance of 1.5 inch, the hot zone of the flame gun contacts the substrate, leading to a sharply increased coating/substrate temperature; consequently, the synthesis of intermetallic compounds is aided. However, this can be dangerous for the spray gun, as there is a risk of overheating due to the short distance from the substrate. Figure 4 (using data of [28]) also reveals that the porosity increases with increasing spray distance, while exhibiting a minimum value at the spraying distance of 2.5 inch. This can be attributed to the reduction of the fully melted particles when they impacted the substrate, resulting in fewer backscattered droplets, and hence, a smaller number of cavities. A further increase in the spraying distance (DIST 3 and DIST 4) led to the sublimation of smaller particles of Al inside the flame, having thus promoted the entrapment of gas (Al2O) between the splats in the coating; hence, it resulted in a higher porosity.

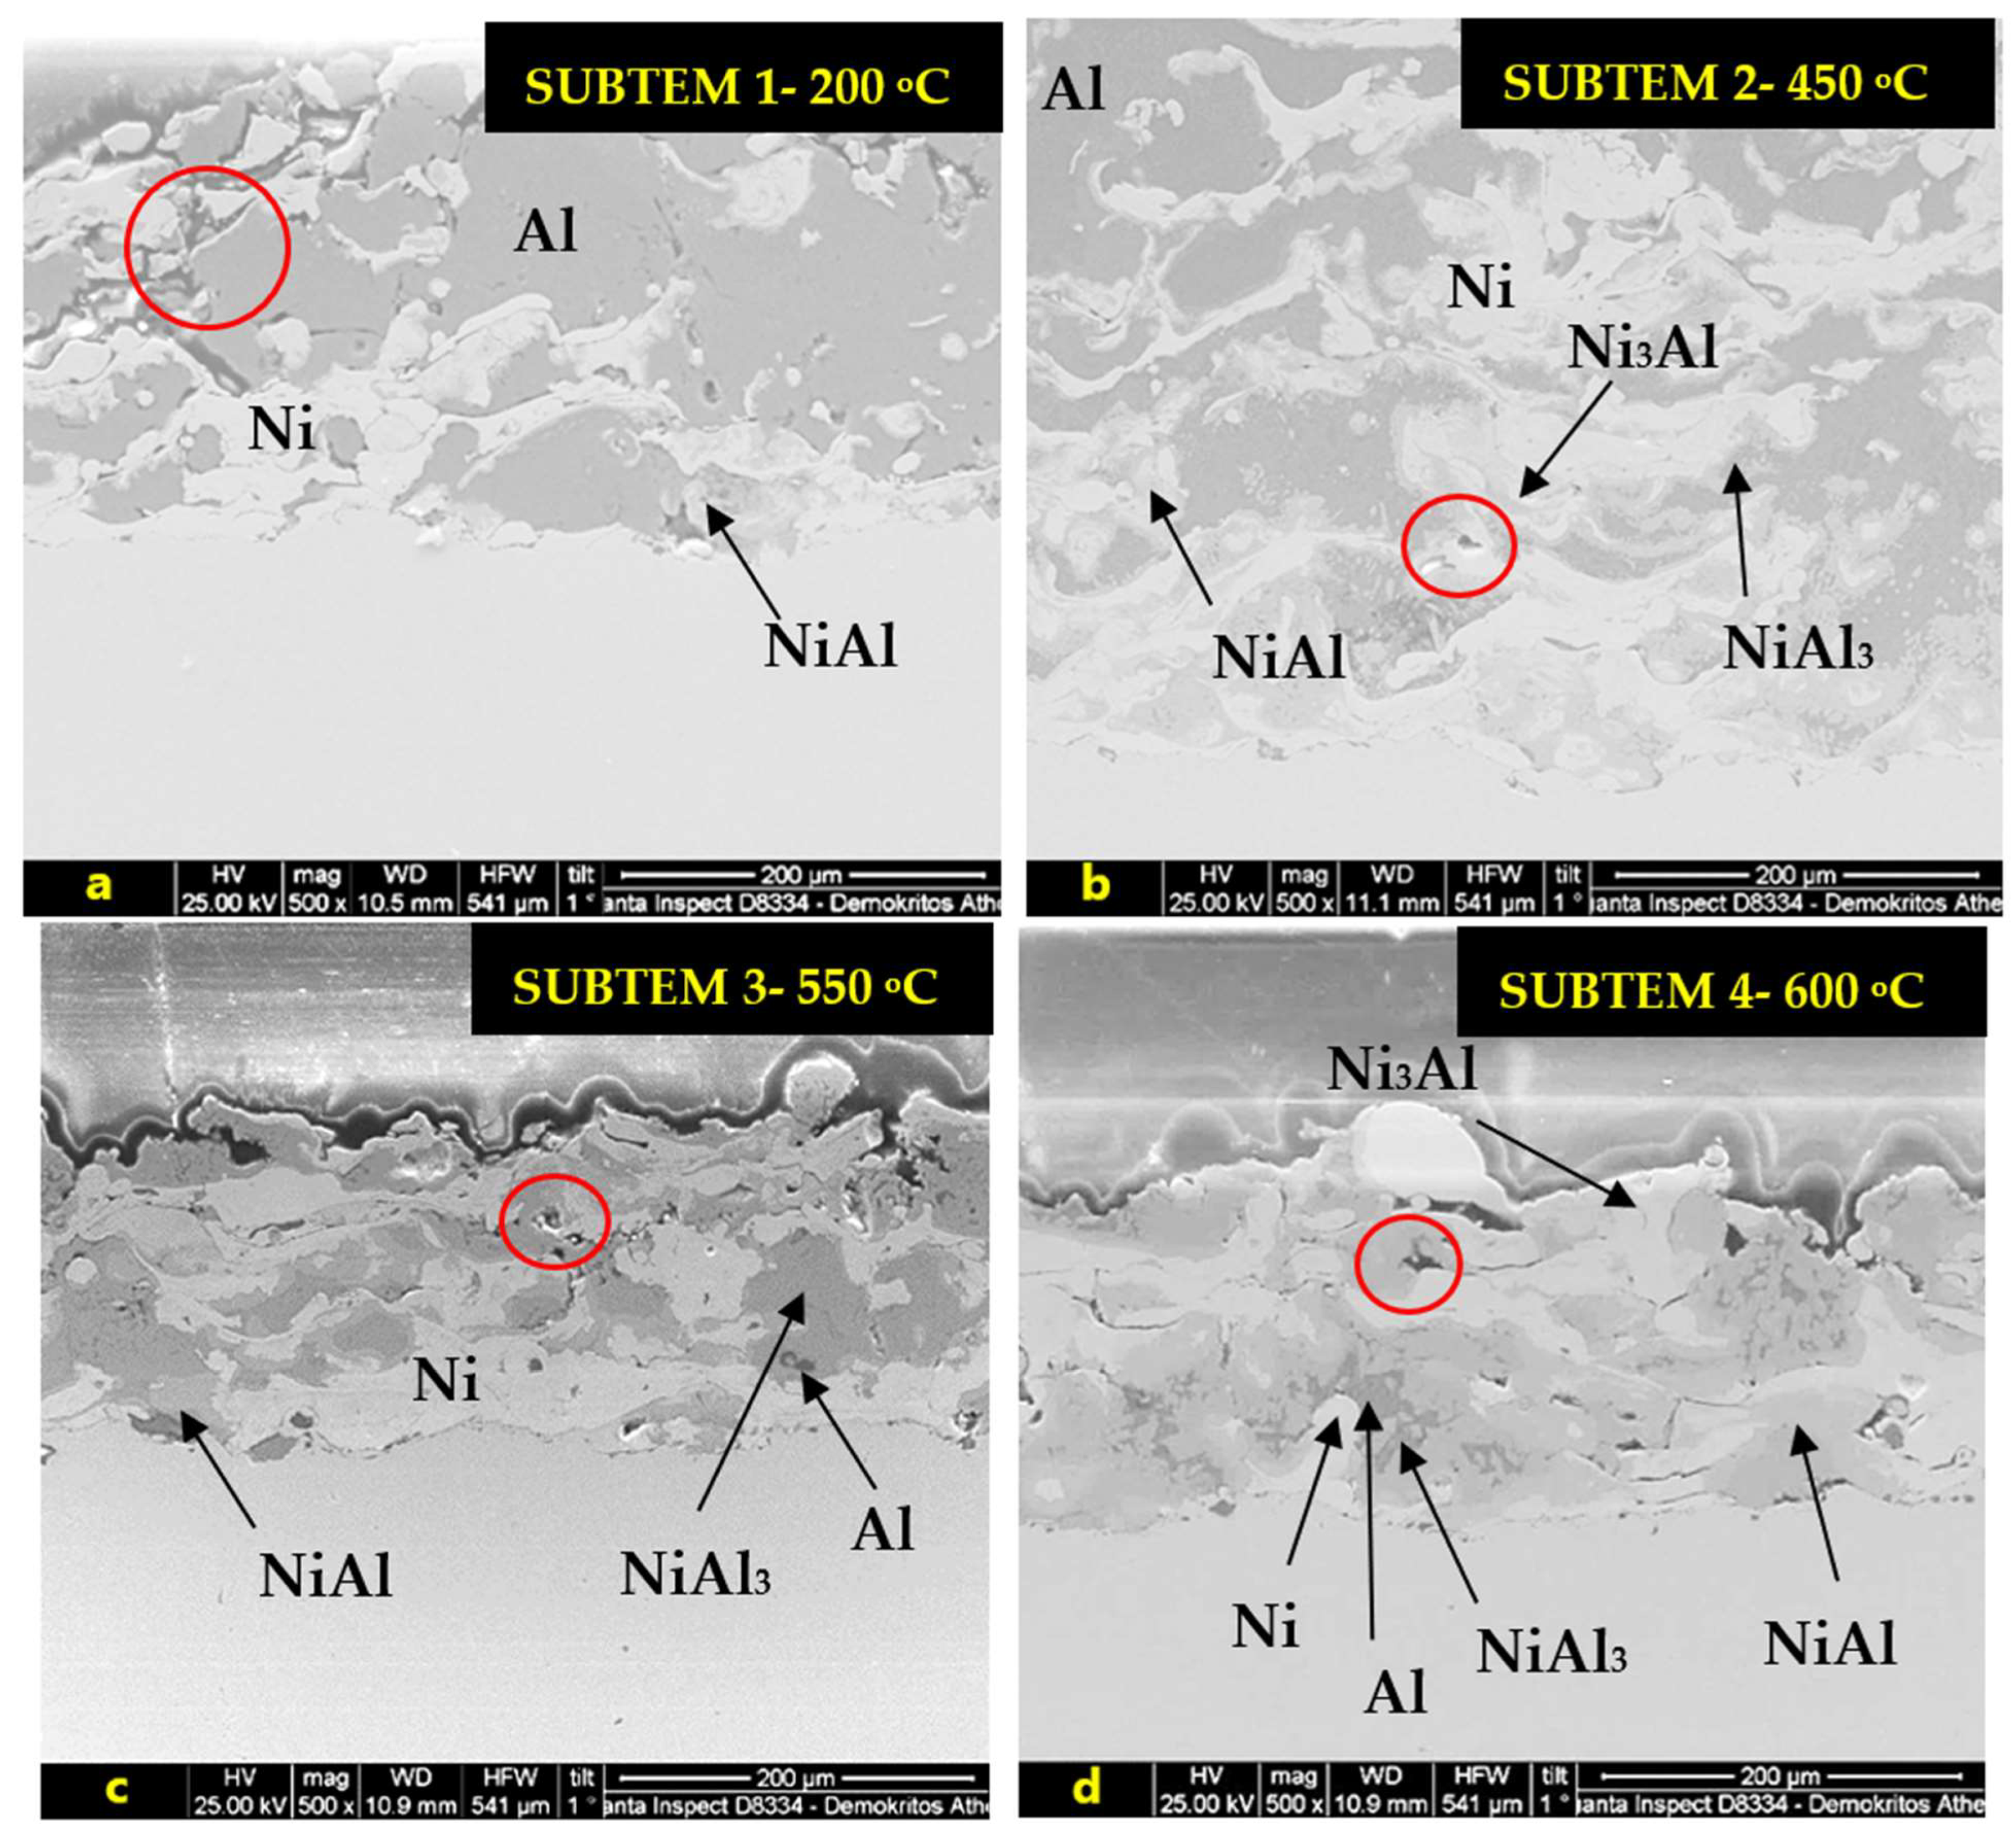
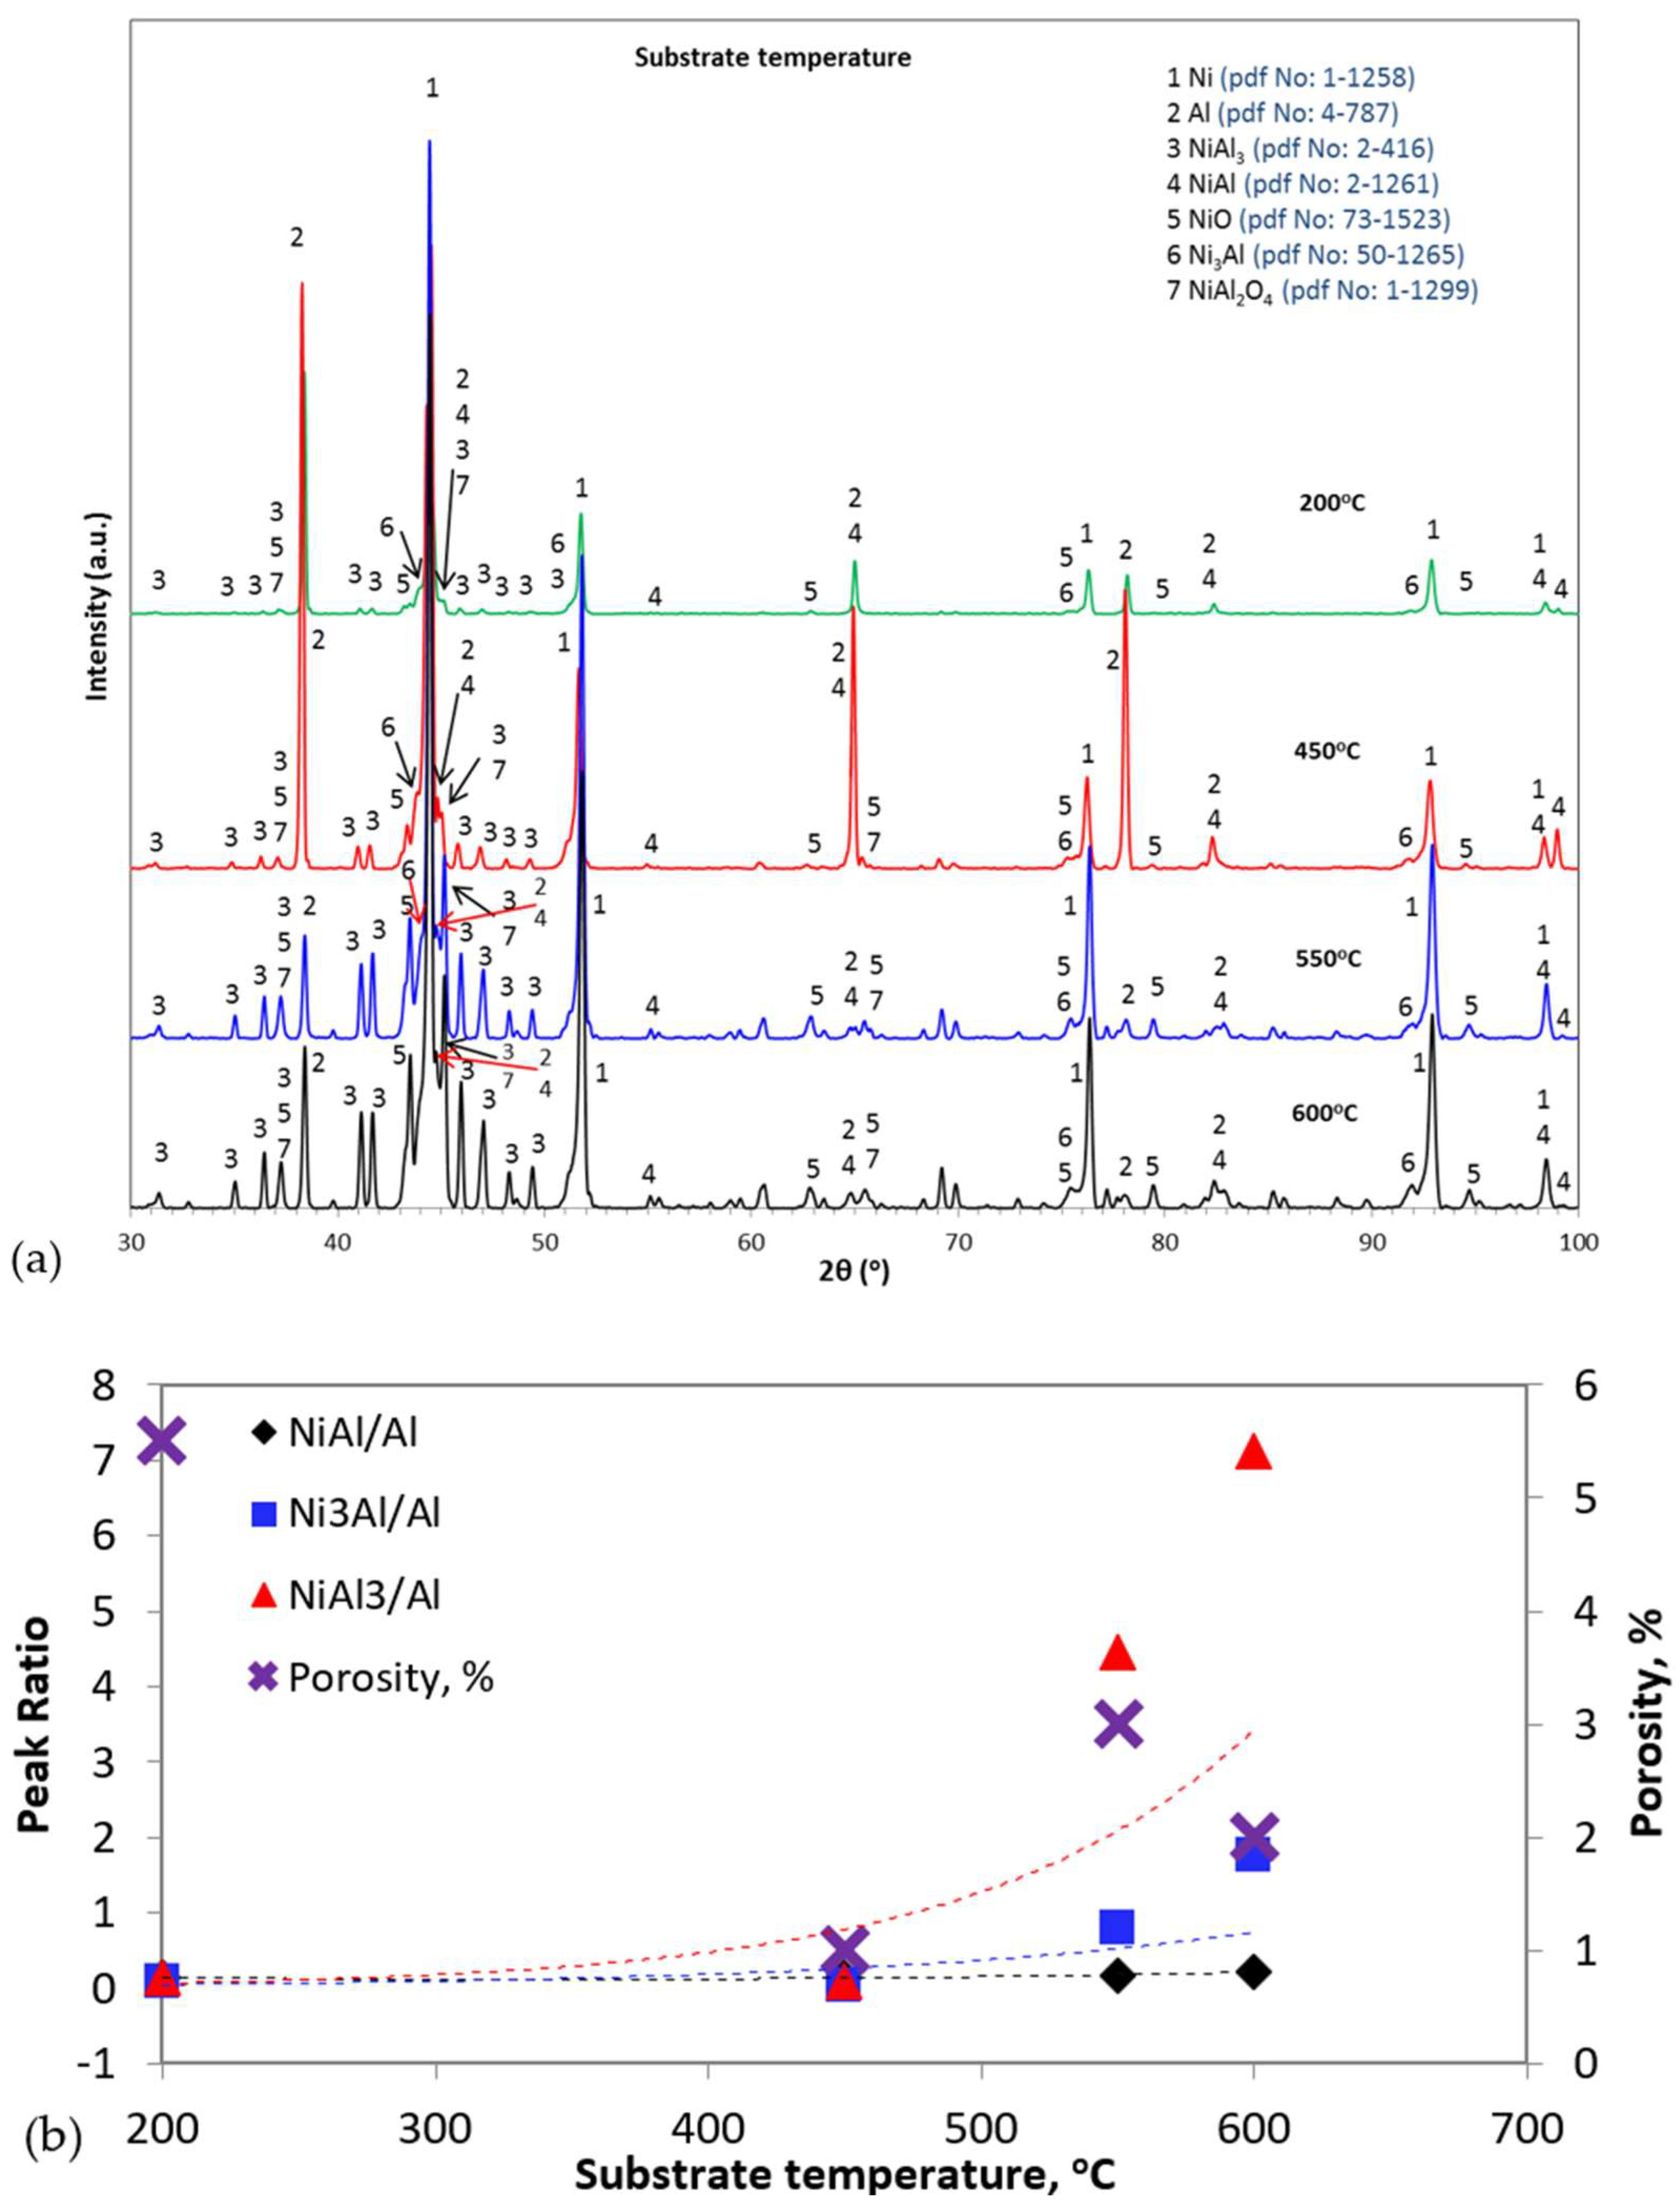
3.1.3. Effect of Substrate Temperature

The SEM observation of the coatings in cross-sections (Figure 5) shows that the low preheating temperature (200 °C-SUBTEM 1, Figure 5a) led to distinct splats with rough boundaries. Once the semi-molten particle impacted the “cold” surface, it solidified faster, preventing its spreading and smoothing at the top. The SUBTEM 2 coating (Figure 5b) seems more uniform than the rest; porosity is significantly reduced, and formation of splats is uniform. It is also observed in Figure 5b that the amount of intermetallics (intermediate contrast areas) formed during the first passes (close to the coating/substrate interface) is increased relative to the succeeding passes. This suggests that preheating of the substrate to 450 °C promoted the formation of the ICs. Preheating the substrate to 550 °C and 600 °C led to a slightly increased porosity (red circles in Figure 5c,d), attributed to the backscattering of particles. The molten particles impacted the substrate, which cannot be cooled on time to form a uniform splat. As such, the cooling rate of the molten particle decreased, while the impact velocity remained high. Especially, as far as SUBTEM 4 is concerned, the substrate temperature is high enough and, in fact, close to the melting temperature of Al, thus resulting in prolonged reactions throughout the coating and, hence, more reaction products, i.e., ICs and, possibly, gaseous Al2O.
The diffractograms of Figure 6a show an increase in the peak intensities of the ICs, with the substrate temperature increasing (NiAl3 primarily and Ni3Al secondarily). This increase is observed especially in NiAl3 because Al melted evenly on the surface of the coating, enabling a further reaction to form NiAl3, which is intermetallic with the highest concentration in the metal having the fastest diffusion rate, i.e., Al. Generally, the XRD analysis shows that all the coatings consisted of Ni, Al, NiAl3, NiAl, Ni3Al, NiO and NiAl2O4.
Semiquantitative analysis based on the peak ratios (Al, hkl: 111, Ni hkl: 200, NiAl, hkl: 220, Ni3Al, hkl: 311 and NiAl3, hkl: 112 [55]) in Figure 6 (using data of [28]) confirms that an increase in the substrate temperature caused an increase in the concentration of the intermetallic compounds. NiAl3 manifests the largest increase since, as mentioned above, heating of the substrate at temperatures over 550 °C increased the reactivity of Al, especially when the temperature is close to the melting point. A small but noticeable increase in the content of Ni3Al with substrate temperature is observed. The higher the temperature of the substrate, the faster the temperature increase in the coating. The coating temperature probably reached levels that promoted the formation of Ni3Al (by facilitating diffusion of Ni).

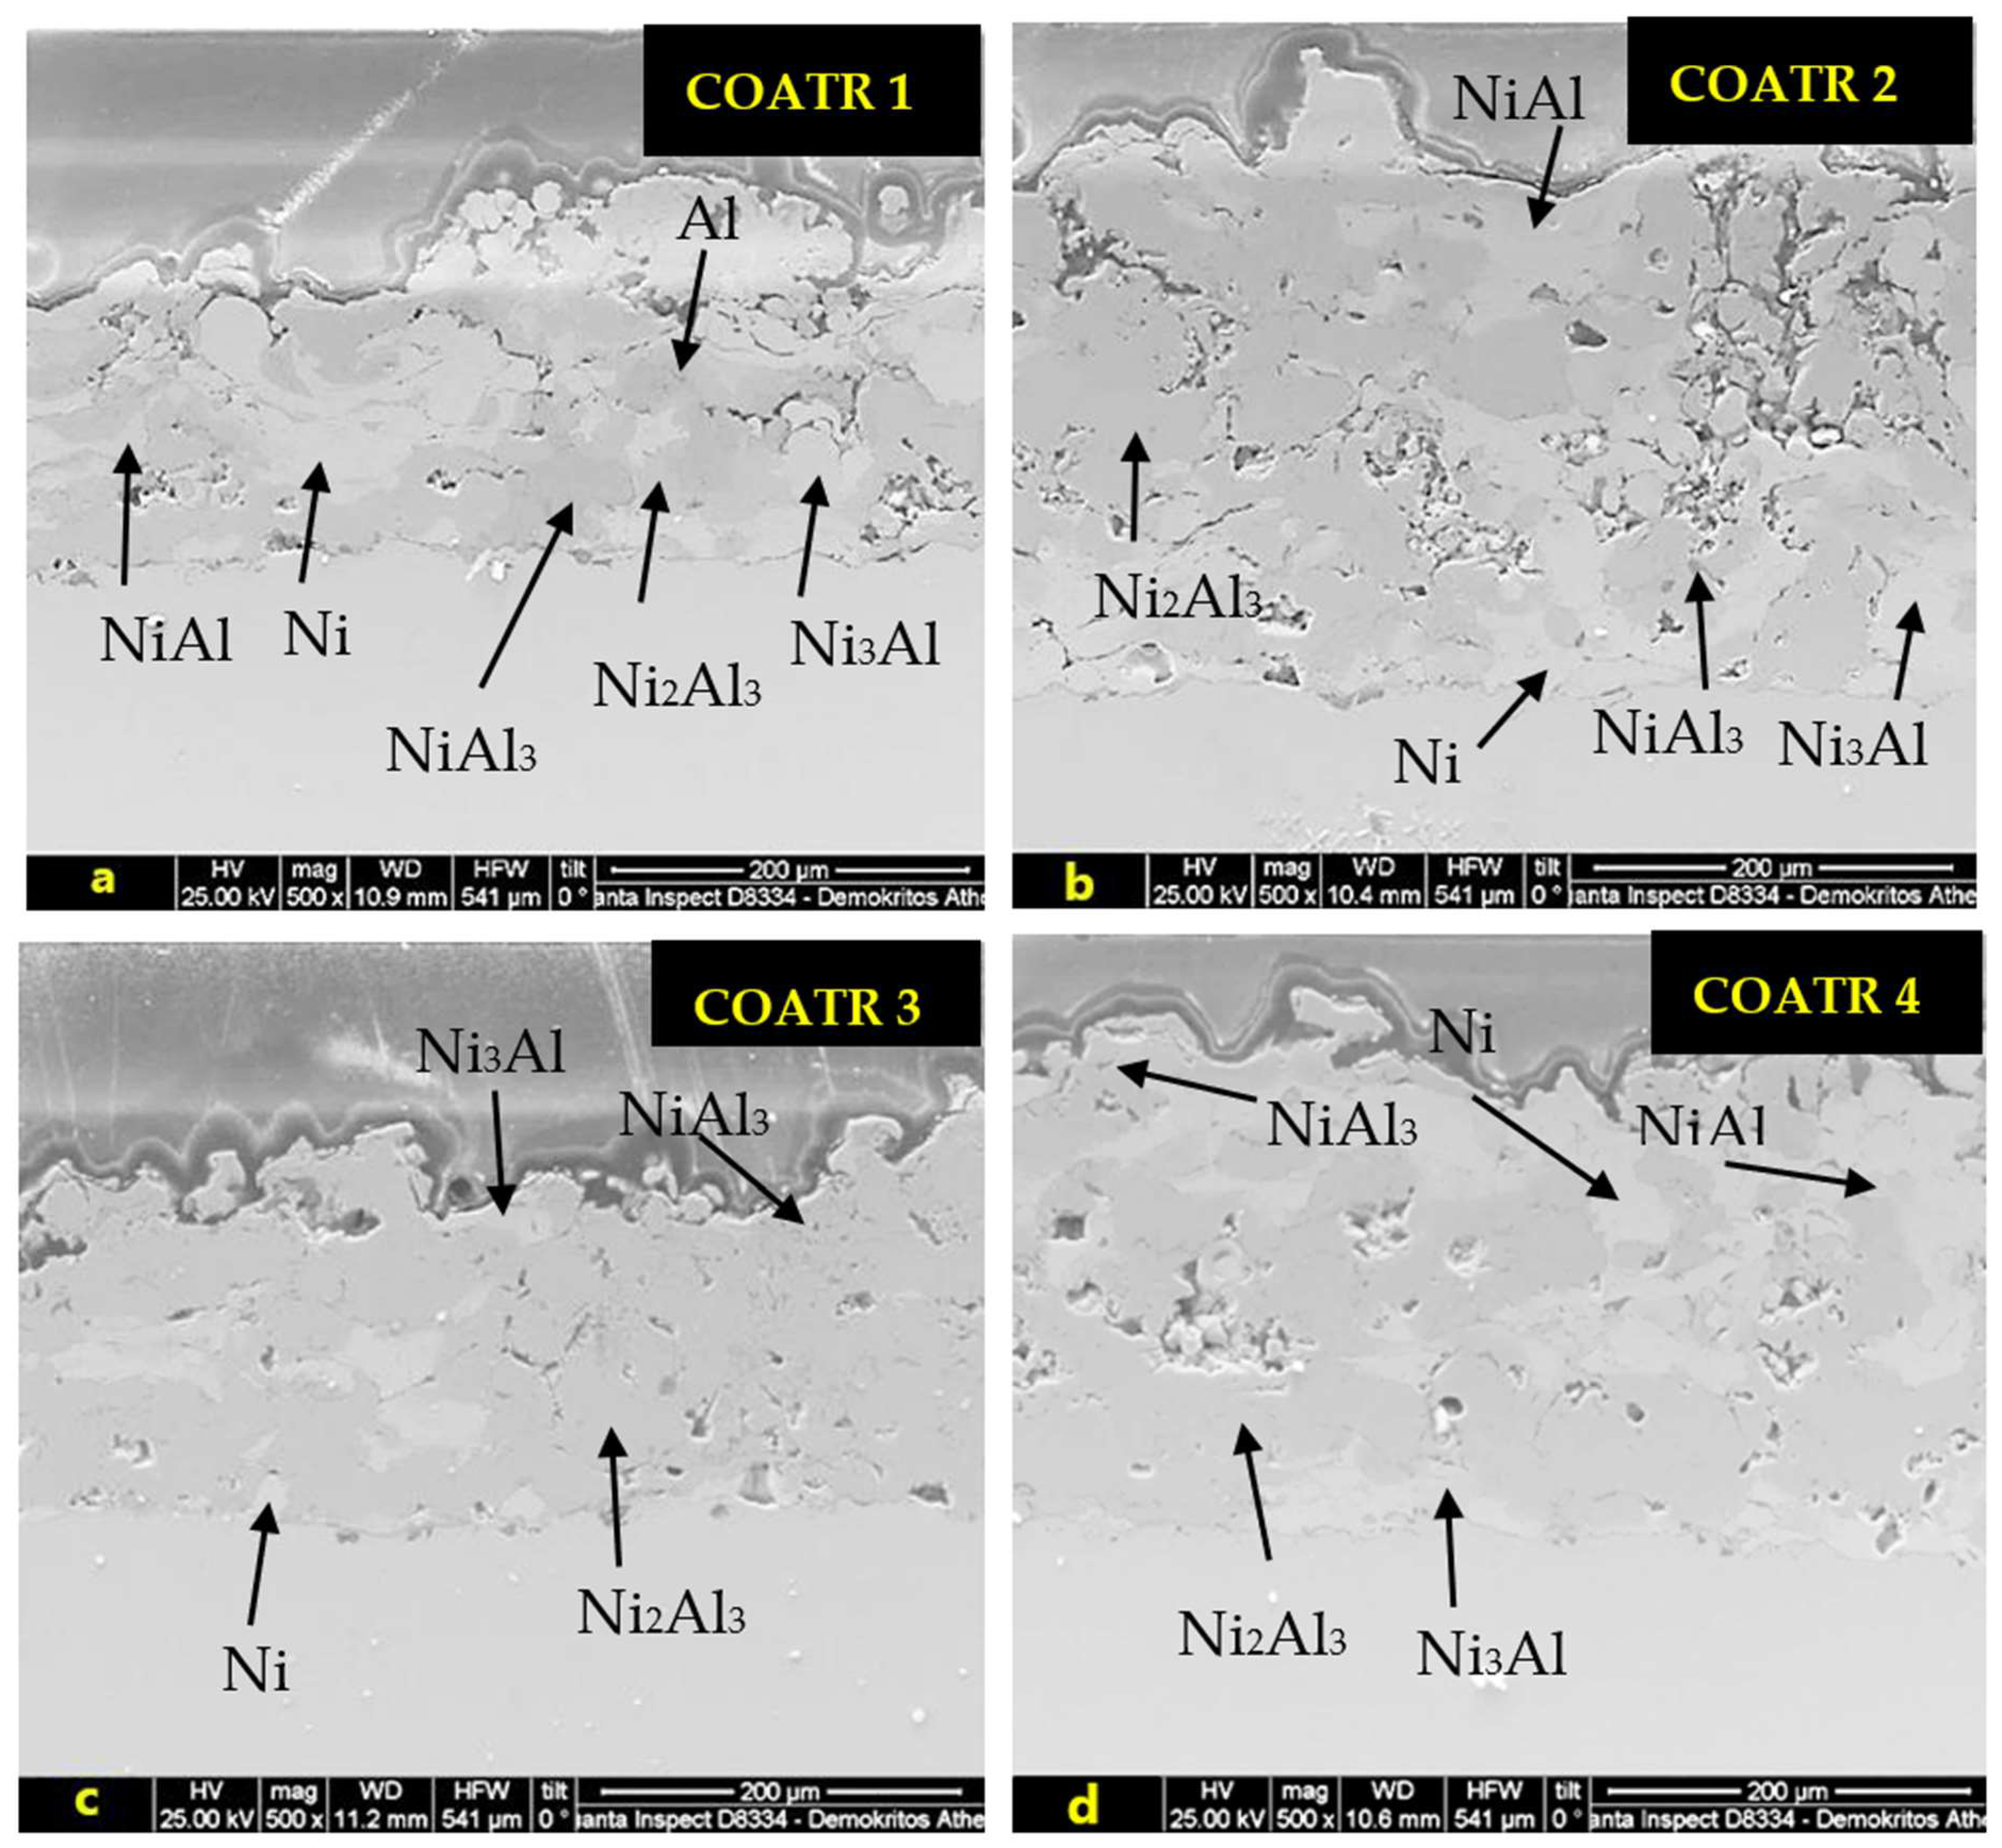
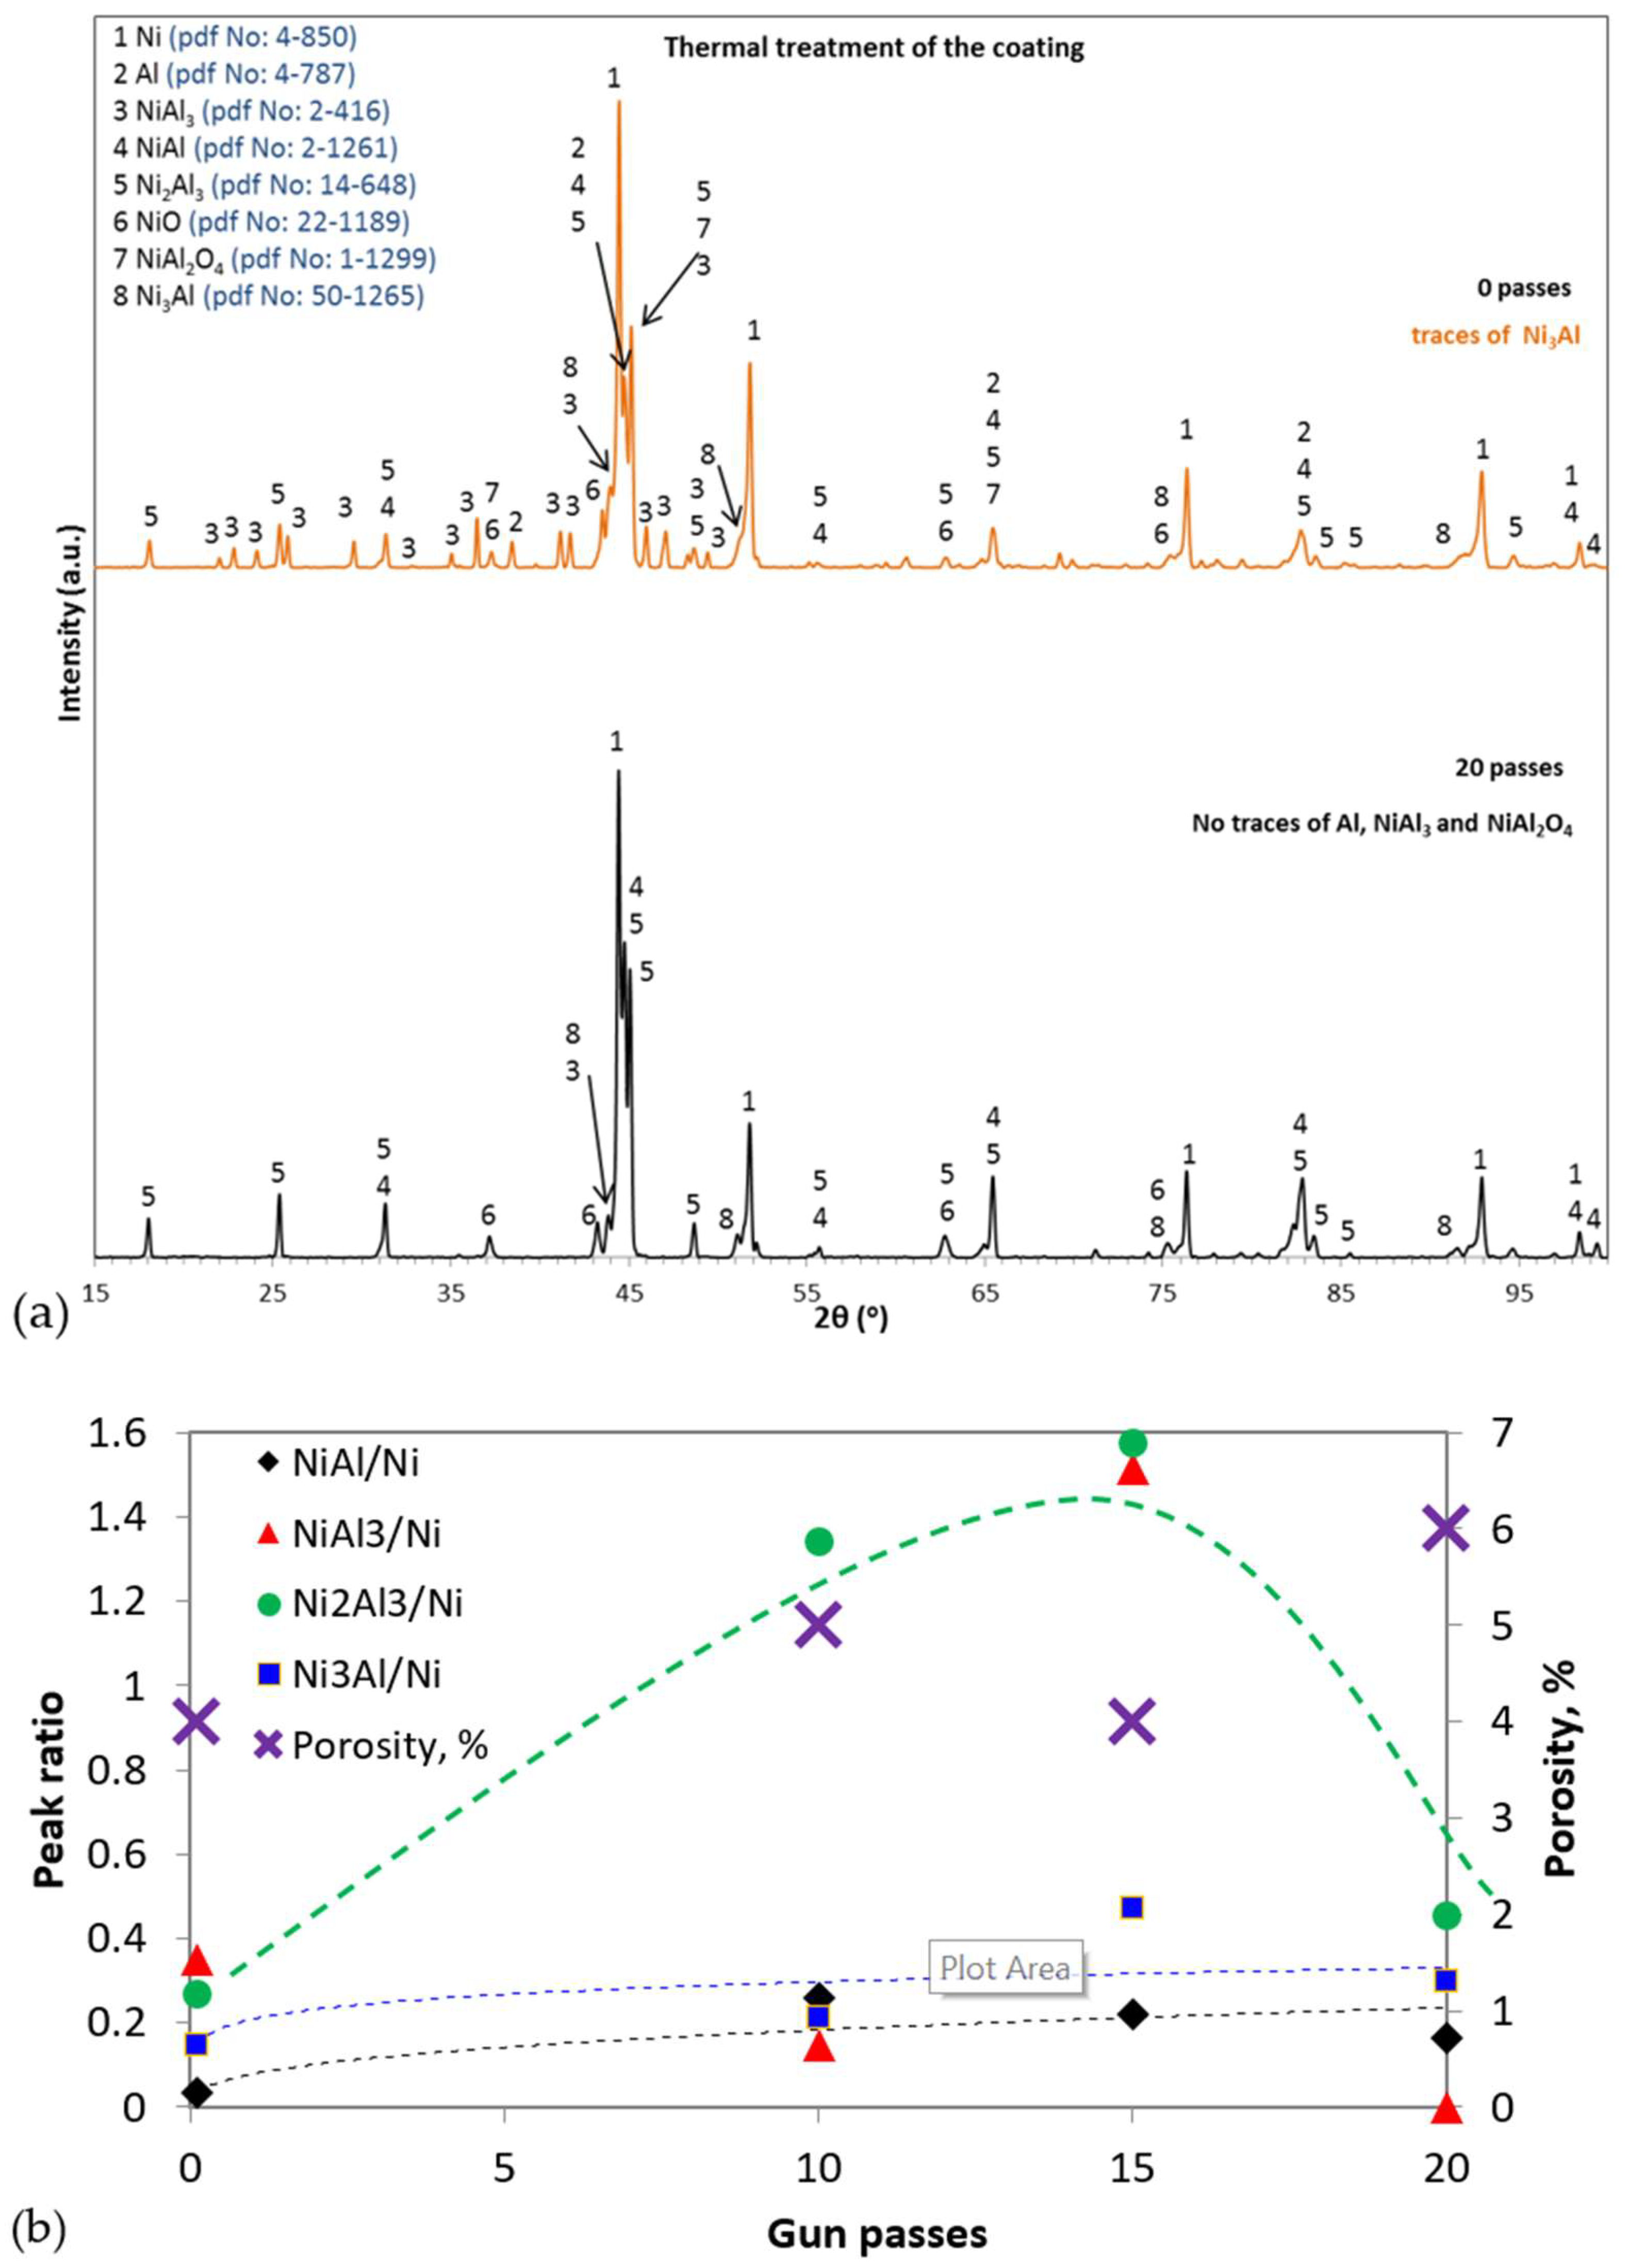
3.1.4. Effect of Heat Treatment of the Coating

SEM examination of cross-sections of the coatings (Figure 7) suggests a proliferation of reactions by increasing the heat input (the greater the number of gun passes, the higher the postdeposition coating temperature). In further detail, Figure 7a–c reveal a decrease in the percentage of Ni as the number of gun passes (after coating deposition) increased from 0 to 15 passes of the flame. This suggests that the temperature increased, encouraging the reaction of the remaining Al with Ni. In fact, it appears that the coating subjected to 15 passes contains almost 95 vol.% (estimated by image analysis) of intermetallic compounds.
The XRD analysis (using data of [28]) presented in Figure 8a indicates that the COATR 1 coating (as-sprayed) consisted of Ni, Al, NiAl3, NiAl, Ni2Al3, NiO, NiAl2O4 and traces of Ni3Al. In contrast with COATR 1, coating COATR 4 (20 heat-treatment passes) resulted in an absence of Al, NiAl3, NiAl2O4, Ni42.2Al9 and Al2O3.
The influence of the postdeposition heat treatment on the contents of NiAl, Ni2Al3, Ni3Al and NiAl3 in relation to the remaining unreacted Ni is illustrated in Figure 8b (based on data of [28]). The semiquantitative analysis in Figure 8 shows that heat treatment of 10 passes notably decreased the NiAl3 concentration, while it notably increased the Ni2Al3 concentration; hence, it is concluded that the coating temperature attained by 10 gun passes was suitable to form Ni2Al3 by the reaction of NiAl3 + Ni → Ni2Al3. Further increasing gun passes from 10 to 20 led to the extinction of NiAl3 and a small increase in the concentration of NiAl and Ni3Al (as compared to the as-sprayed coating). Multiple passes of the gun on the coating led to an increase in the temperature of the coating itself. Thus, it is indicated that in the final coating (COATR 8), NiAl3 completely reacted with the remaining free Ni to form the NiAl and Ni3Al phases.
Considering the above microstructure analysis and the negative values of free enthalpy of formation of various NixAly phases (Table 2), it is suggested that all intermetallic compounds in the Ni-Al system can be formed by exothermic reactions in the CAFSY method. The more negative the Gibbs free energy of formation (ΔGf0), the higher the formation tendency of the IC. Accordingly, when nickel reacts with aluminium, Ni2Al3 is produced first, followed by Ni3Al, NiAl3 and NiAl.

3.2. Cyclic Polarization Experiments

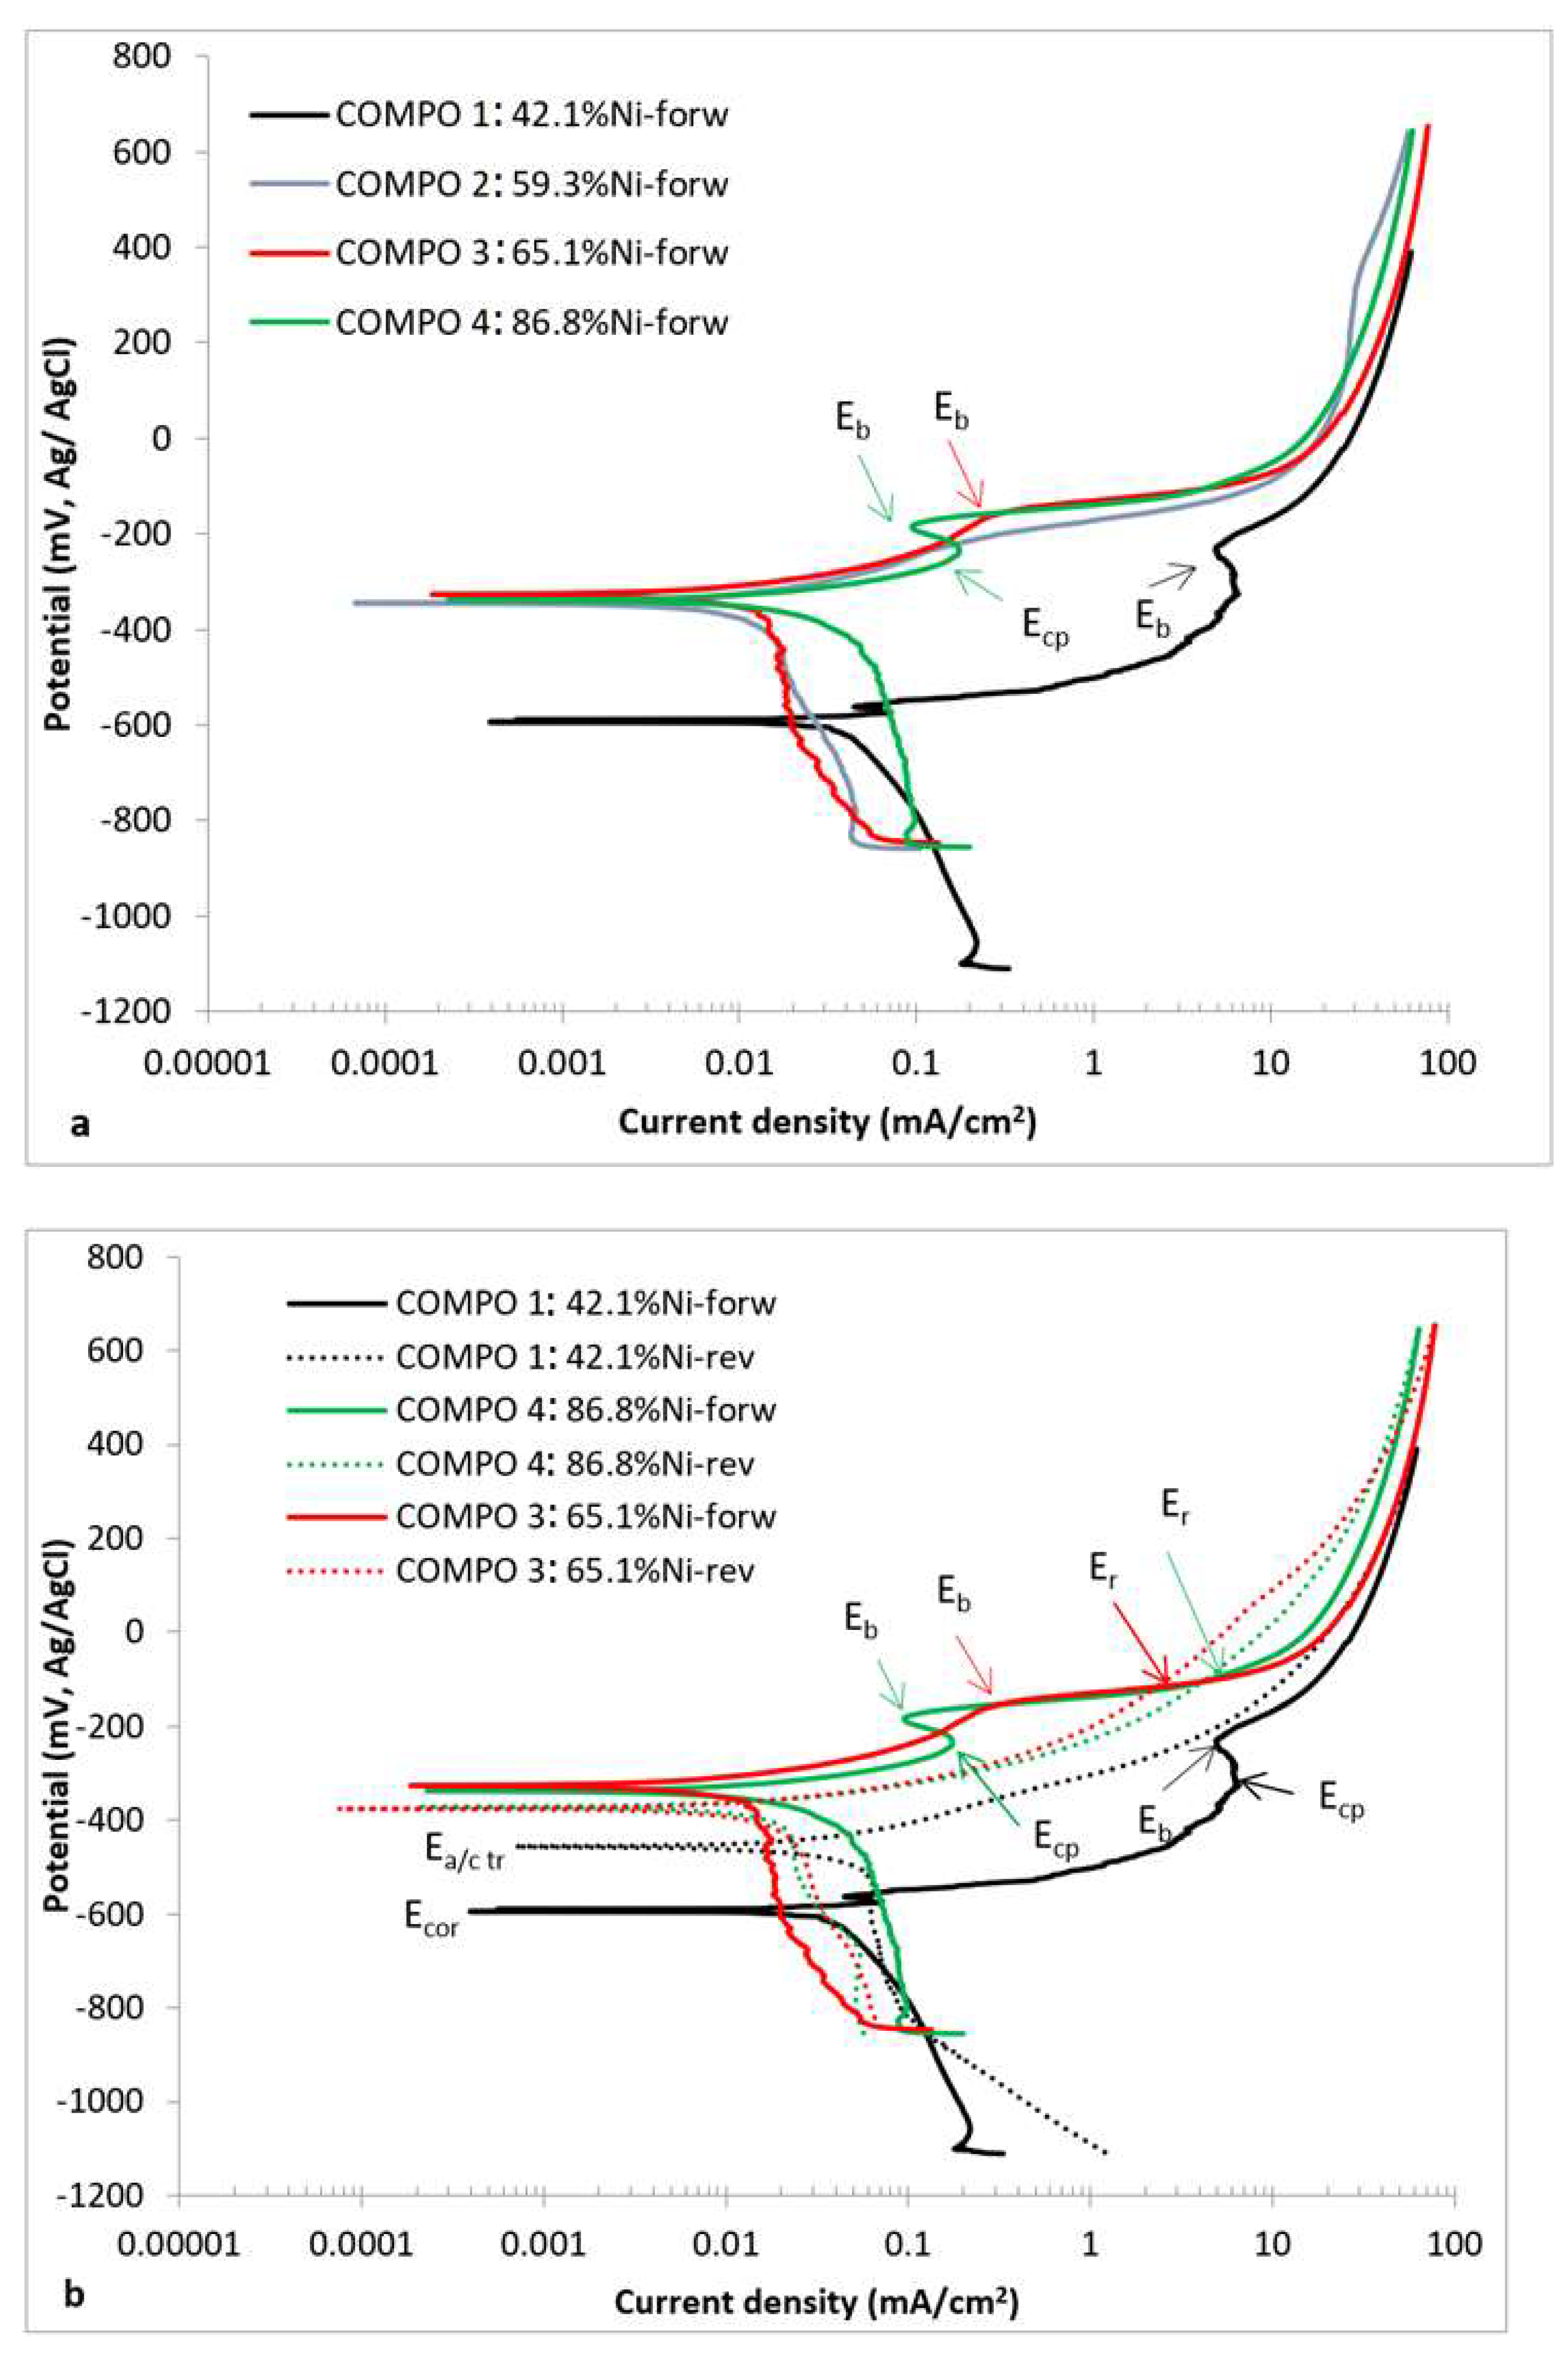
3.2.1. Effect of Composition

Figure 9 and Table 3 show that increasing the Ni content from 59.3% to 86.8% did not have any significant effect on the anodic polarization curves of the coatings.
The anodic forward polarization curves of the three coatings present more or less distinct deflections in their gradients at the breakdown potential (Eb), leading to almost flat gradients, which are sustained for about two orders of magnitude of current. Moreover, the hysteresis upon reverse polarization at potentials lower than Er becomes negative (Figure 9b). Hence, it is suggested that the three coatings have been subjected to localized corrosion.
The anodic forward polarization curves of the three coatings present final current stabilization stages at very high current densities. The latter imply the deposition of unstable (heavily hydrated surface compounds) and/or high concentration of cations in the anolyte. Despite the high current densities, the positive hysteresis loop (Figure 9b) upon reverse polarization through the final current limiting stage suggests a temporary protective effect lasting from the anodic potential of scan reversal to a potential Er nearly equal to Eb (where the positive hysteresis turns to negative).
A different polarization behavior is exhibited by the Al-42.1% Ni coating, as shown in Figure 9 and Table 3. This coating presents the highest corrosion current density due to having the highest porosity (Figure 2), the highest surface area of Al (Figure 1a) and the lowest corrosion potential as a result of the significant presences of Al and NiAl3 (the IC with the highest ratio of Al/Ni), which are hardly present in alloys COMPO 3 and COMPO 4. Moreover, the residual stresses due to trapping of Al2O gas are also responsible for the comparatively low corrosion potential of COMPO 1 [40]. The positive hysteresis loop and the nobler anodic-to-cathodic potential (Ea/c tr) value as compared to the corrosion potential (Ecorr) (implying nobler surfaces at Ea/c tr upon reverse scanning) suggest non-susceptibility to pitting. The paradox of high resistance (Figure 9b, COMPO 1) to localized corrosion despite the high porosity indicates that pores are not interconnected, being blocked by the complex microstructure features (splat boundaries, phase boundaries, interlayer boundaries, etc.). Moreover, the high amount of aluminides with low Ni content (NiAl3) led to a weak galvanic effect between Al and aluminides. Finally, it is possible that the high amount of unreacted Al led to well-melted splats that fit well to their substrates and did not form distinct boundaries with their matrix. As such, splats were not efficient stress concentrators, and they did not favor localized stress-corrosion processes.
It should be noted that the microstructures of the coatings were too complex to justify any strong and consistent trends in the electrochemical values. The many corrosion-resistant intermetallic phases competed against abundant cell inducers, such as interlayer boundaries, phase boundaries, splat interfaces, pores and oxides. The net resultants are similar electrochemical values and corrosion mechanisms governed by localized phenomena at the aforementioned defects.
The different shapes and the large shifts of the cathodic curves in Figure 9 are justified by the different number, distribution, types and particle sizes of the cathodic intermetallic phases. COMPO 4 presents the highest cathodic current densities, possibly due to the presence of large areas of Ni3Al and NiAl that could effectively support cathodic reactions with adjacent ICs of higher Al or metal elements.

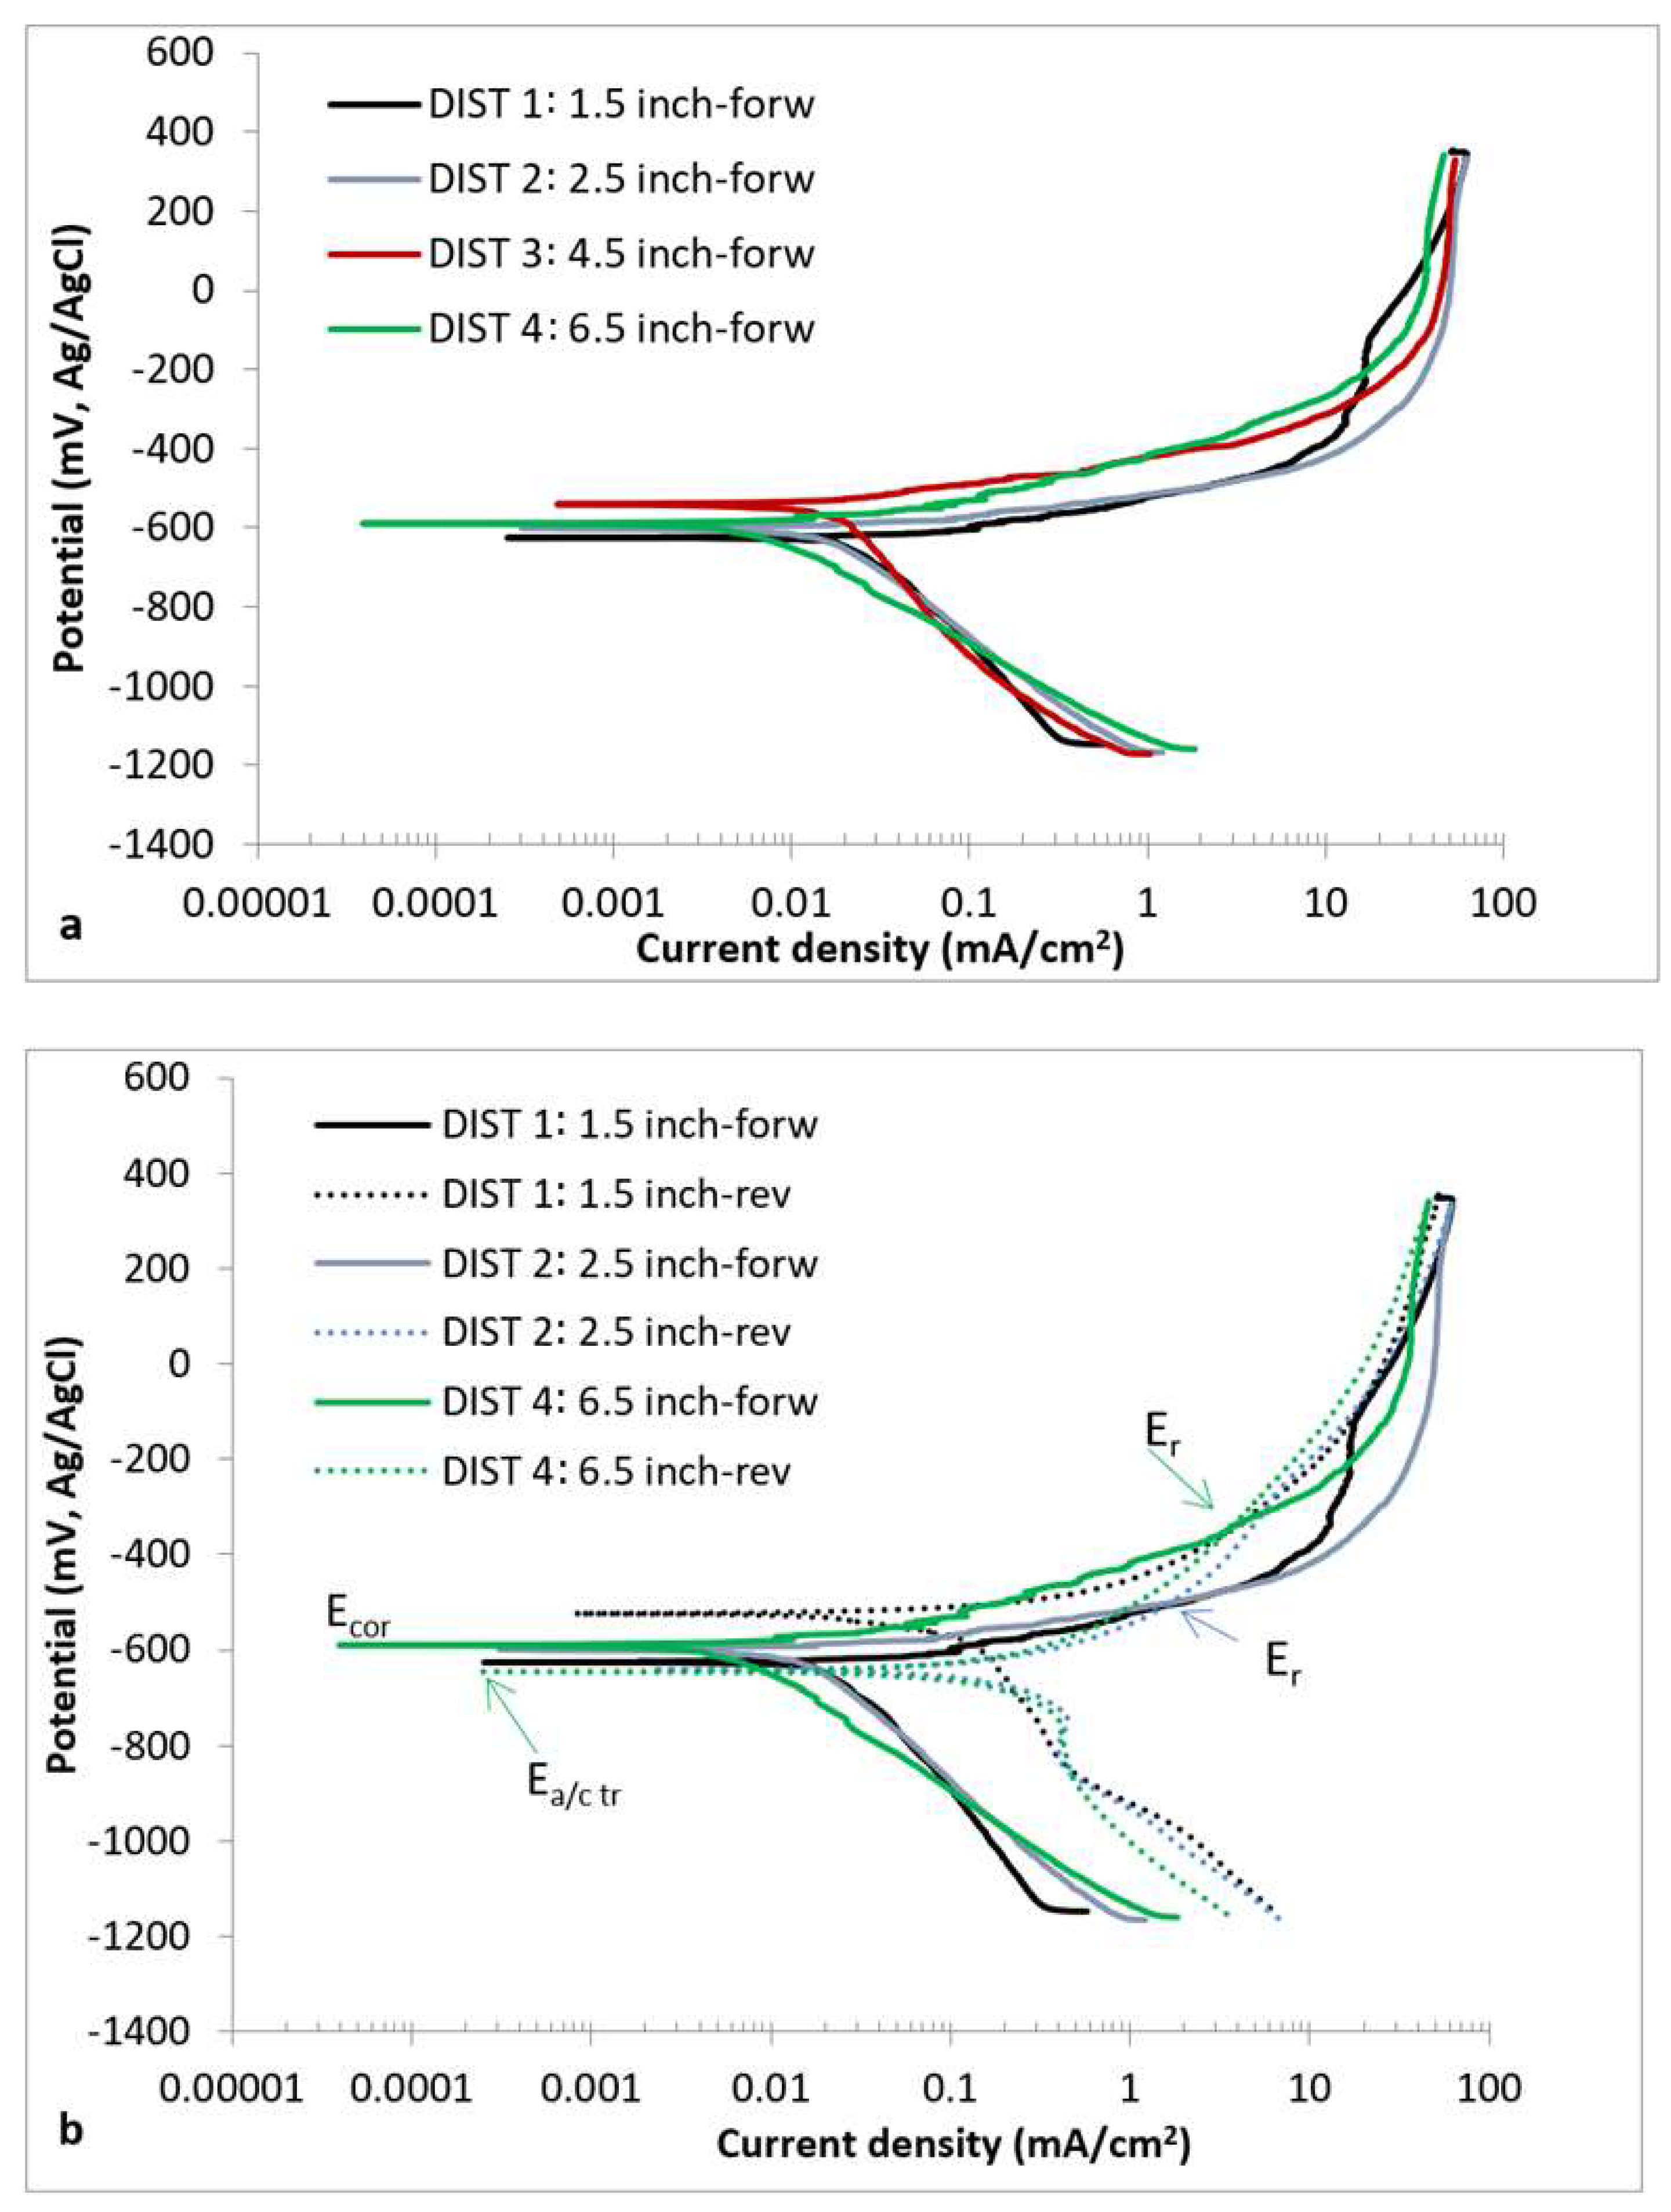
3.2.2. Effect of Thermal Spraying Distance

Figure 10 and Table 4 show that increasing the thermal spraying distance from 2.5 to 6.5 inch did not have any significant effect on the polarization curves of the coatings.
All coatings (except DIST 1) show negative hysteresis loops at E < Er, suggesting susceptibility to localized corrosion. However, the reverse anodic scan of DIST 1 (1.5 inch) does not section the forward anodic scan, resulting in higher Ea/c tr as compared to Ecorr. The latter indicates nobler surfaces at Ea/c tr upon reverse polarization relative to the surface at Ecorr upon forward polarization.
The relatively high resistance to localized corrosion exhibited by the coating sprayed at the lowest distance (DIST 1) can be justified by the high contents of NiAl3 and Ni2Al3. The high portion of Al in these aluminides reduces the galvanic effect between the Al matrix and adjacent aluminides. Moreover, porosity is also relatively low (Figure 4). Here, it should be noted that the differences between Ecorr and Ea/c tr for DIST 2 (which exhibits the lowest porosity—Figure 4) are small and within experimental error, also suggesting a good behavior toward localized corrosion.
The relatively high (general) corrosion rate (icor) of DIST 4 can be justified by the high porosity (Figure 4) and the high amounts of unreacted Ni and Al (Figure 3d and Figure 4). The differences in the Ecorr values are small and within experimental error. It should be mentioned that the extremely complex (multiphase, multilayer, multidefect) microstructure is considered responsible for the large standard deviations observed in some cases (e.g., DIST 1).

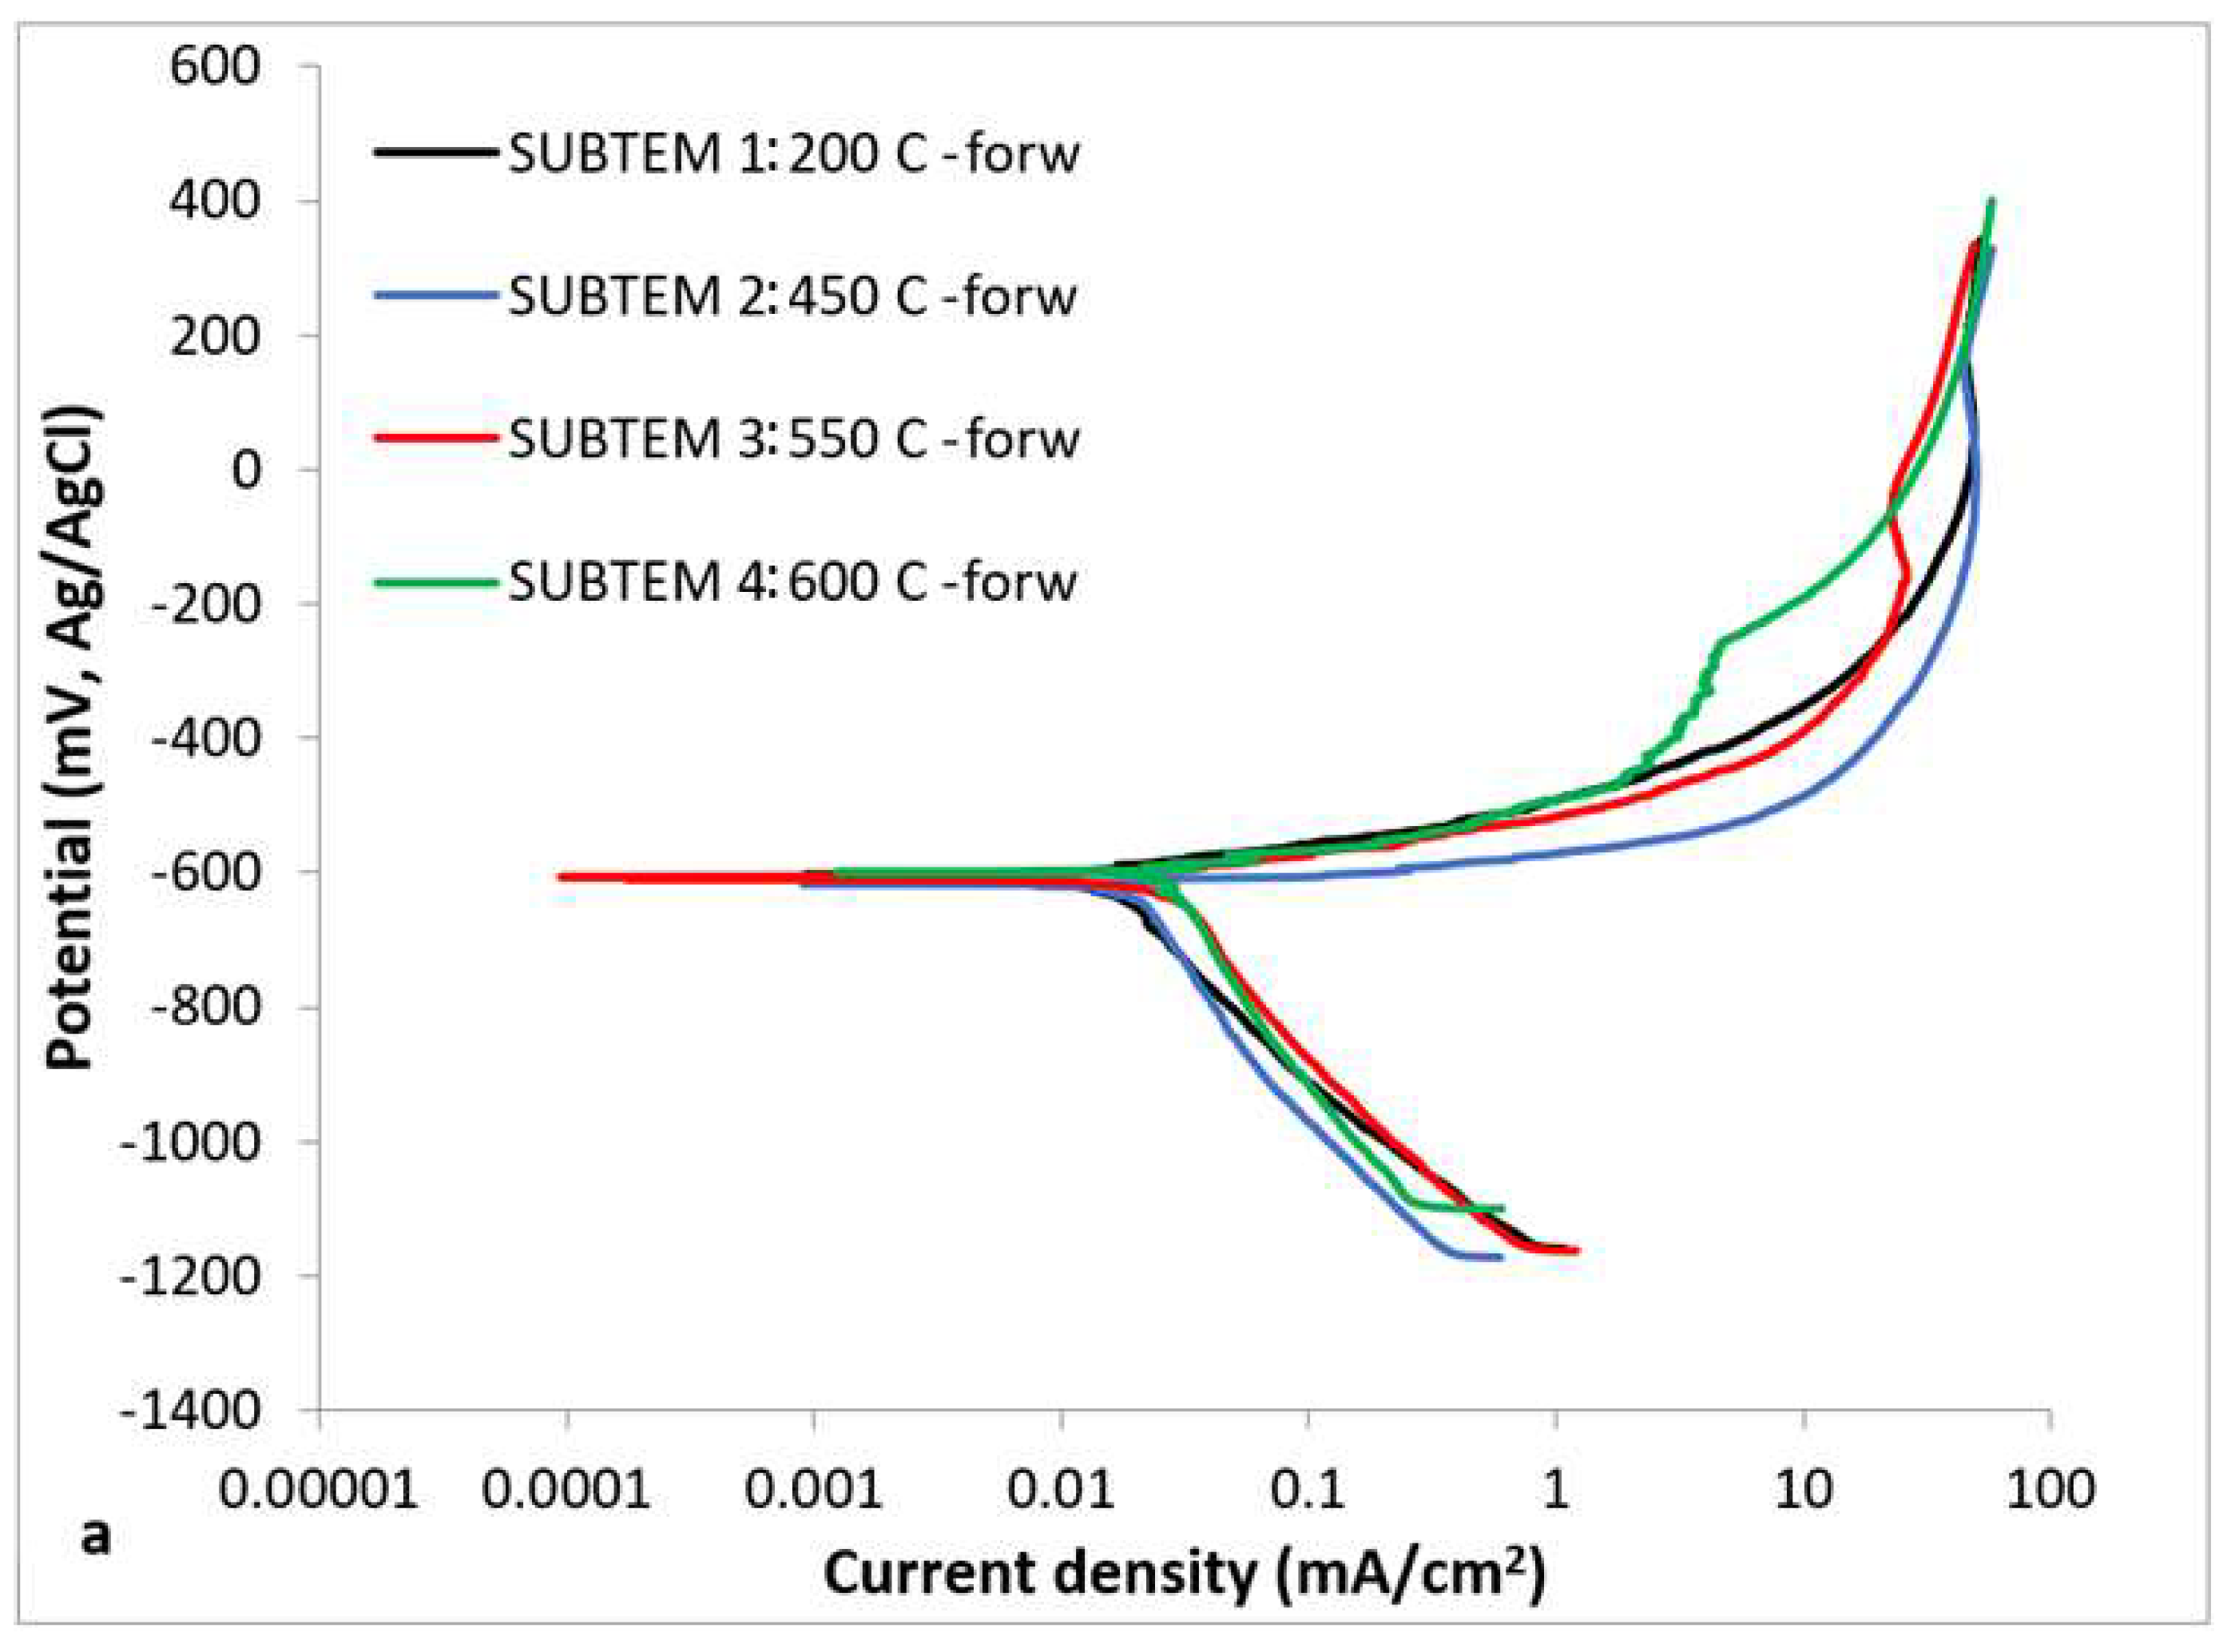
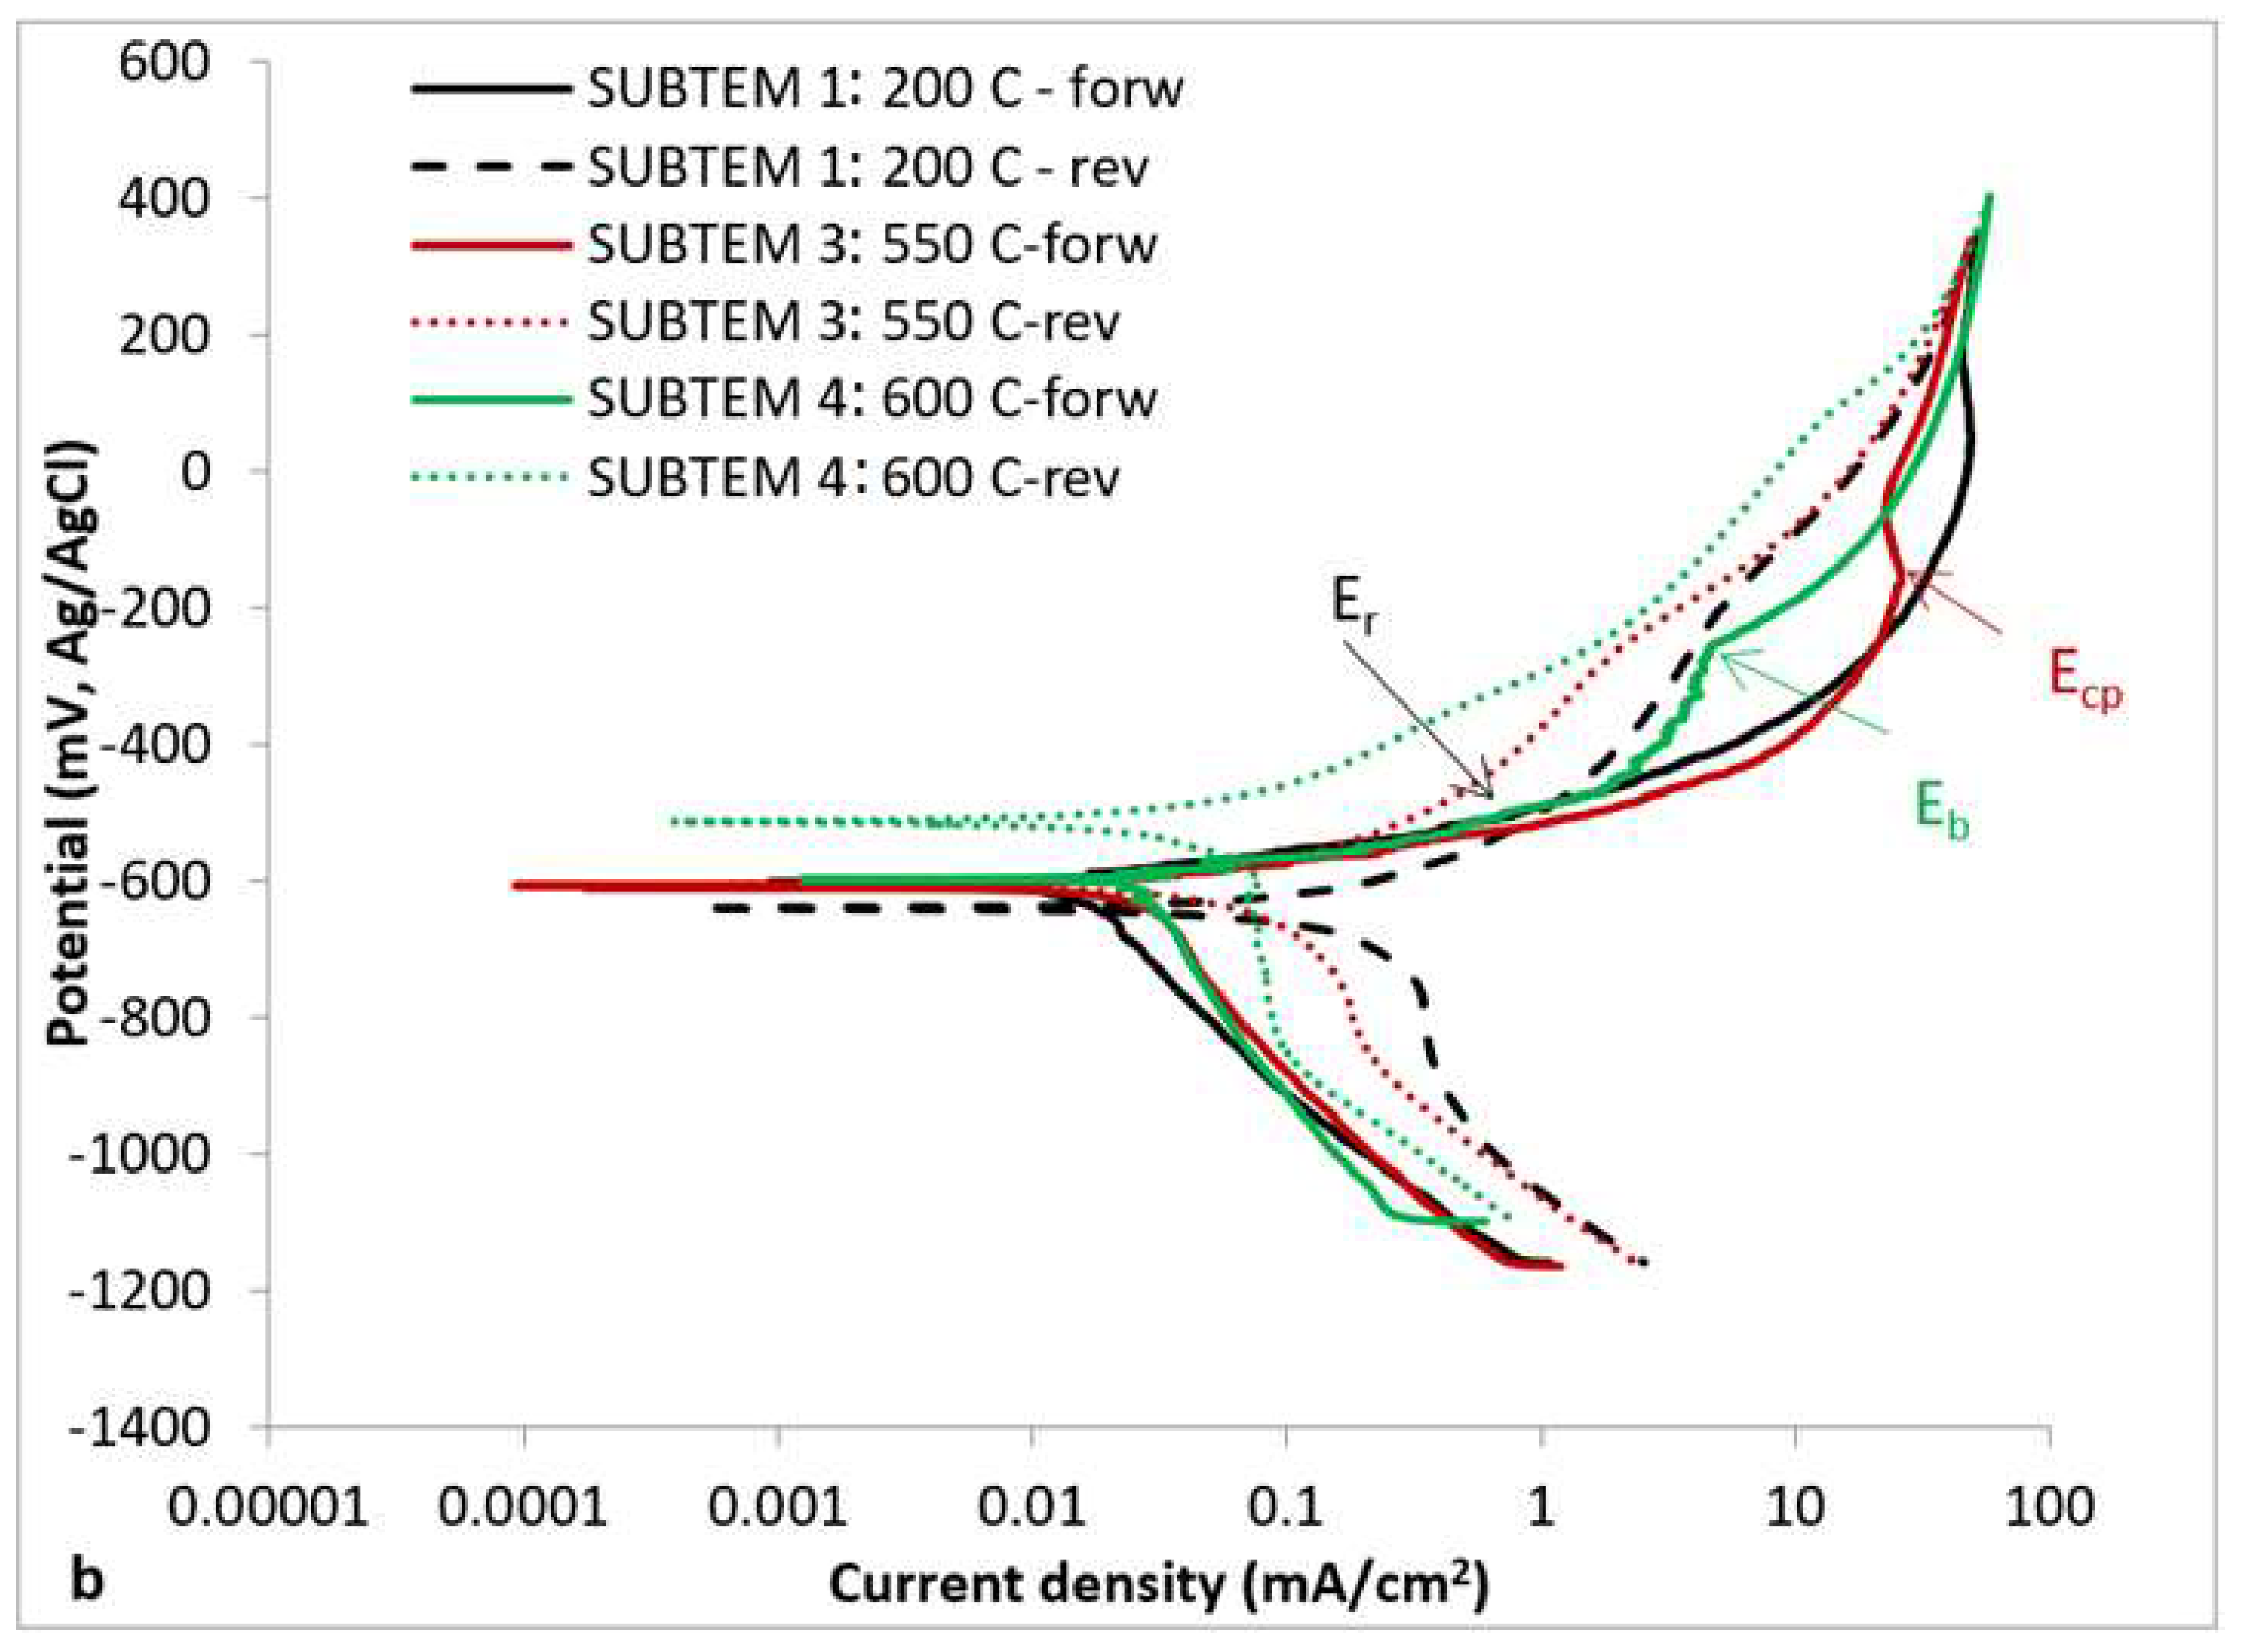
3.2.3. Effect of Substrate Temperature

The polarization curves of all coatings (Figure 11) present positive hysteresis loops of large surface areas, suggesting a high resistance to localized corrosion. Surface films deposited during the final current limiting stage, although highly conductive and probably hydrated, seem to protect the coatings at E > Er. Even the coatings deposited on hotter substrates (550 °C and 600 °C) show a good localized corrosion resistance despite their relatively high porosities (Figure 6) and the less-uniform microstructures (compare Figure 5b with Figure 5c,d). It seems that the porosity shown in Figure 5c,d, as well as Figure 6, was filled up with surface depositions (formed during the current limiting stage upon forward polarization) that were not dissolved during almost the entire anodic part of reverse polarization. Additionally, porosity is not interconnected, as it is intercepted by the abundant different microstructural features (along with the high percentage of intermetallics), not allowing the electrolyte to access the substrate. However, hysteresis turns to negative at E < Er, suggesting that localized corrosion may occur at low anodic Es.
Despite their relatively high porosities, SUBTEM 3 and SUBTEM 4 sprayed on the hottest substrates (550 °C and 600 °C) display high resistance to localized corrosion with Ea/c tr nobler or equally noble to Ecorr (Table 5). It is postulated that the reduced presence of Al induces limited localized corrosion occurrence. Additionally, the highly increased presence of NiAl3 mediated the galvanic effect between Ni and Al, forming weak galvanic couples between Al and NiAl3. Similarly, the increased presence of NiAl3 mediated the galvanic effect between Ni and Al, forming weak galvanic couples with Ni.
However, hotter substrates seem to have led to relatively high corrosion current density values (slightly higher, though within experimental error), as shown in Table 5. This trend can be attributed to the increased porosity (Figure 6) as well as the presence of small anodic areas (Al) adjacent to large cathodic areas (NiAl3), as illustrated in Figure 5c,d.

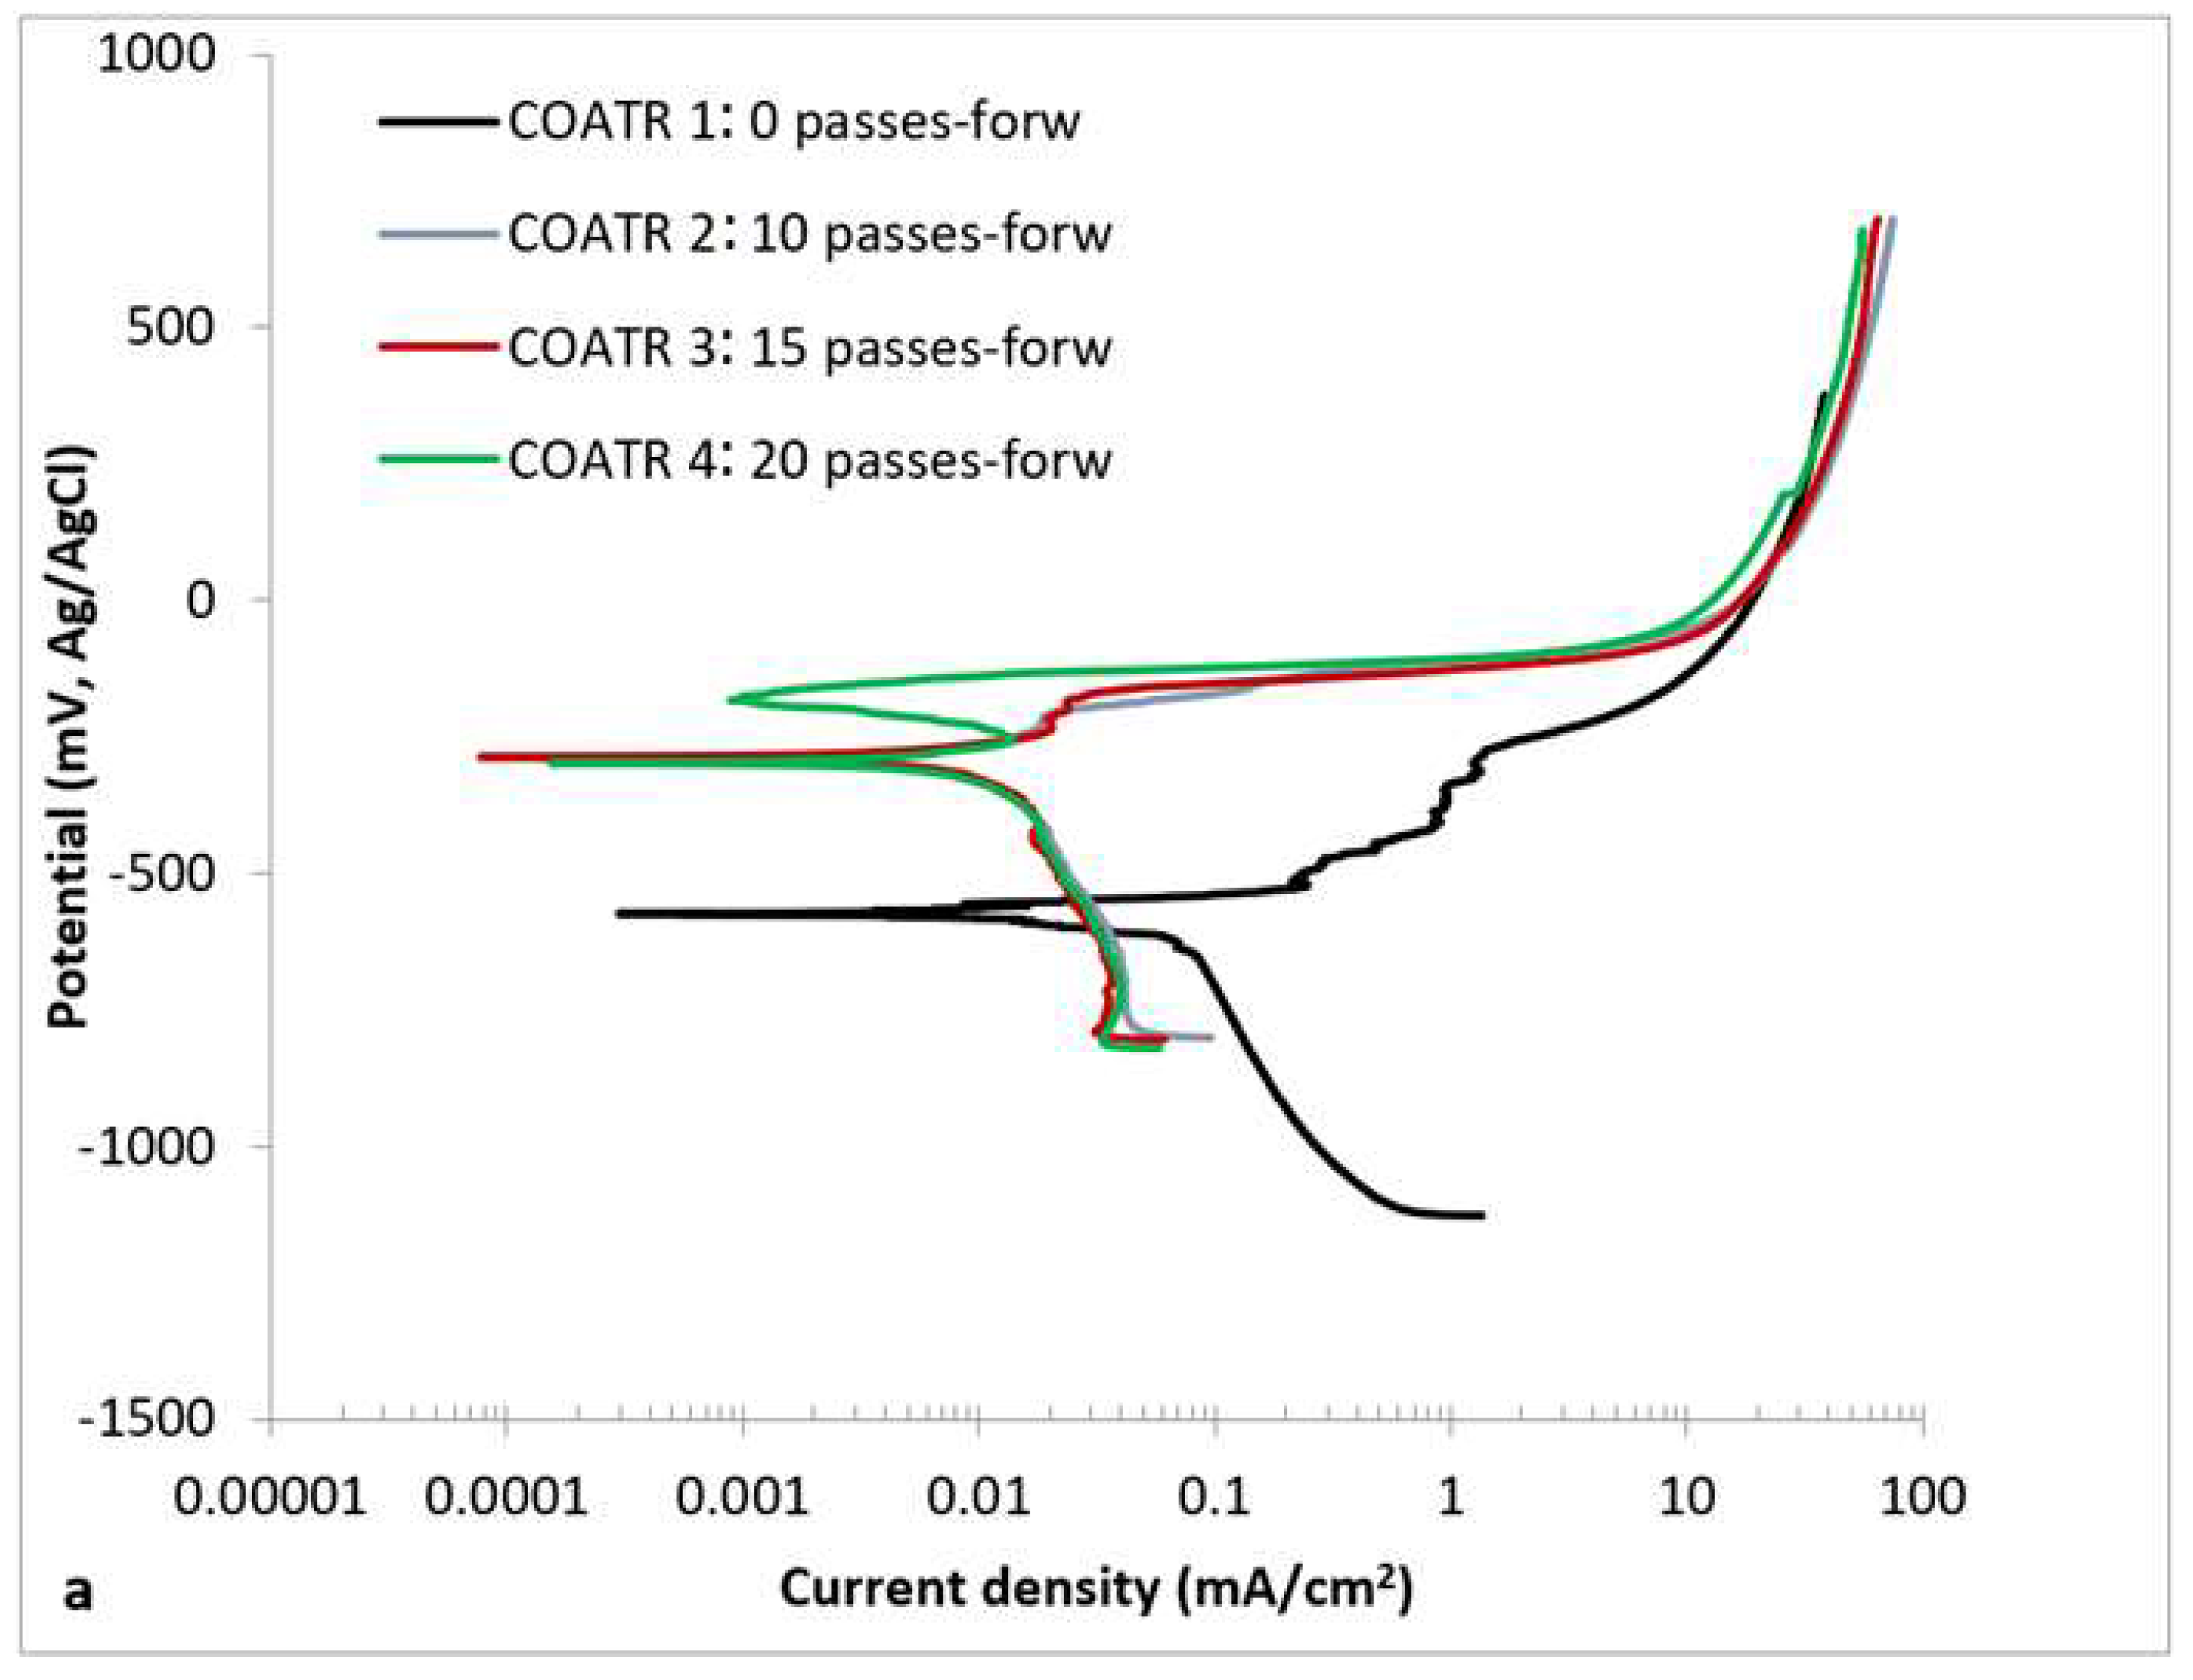
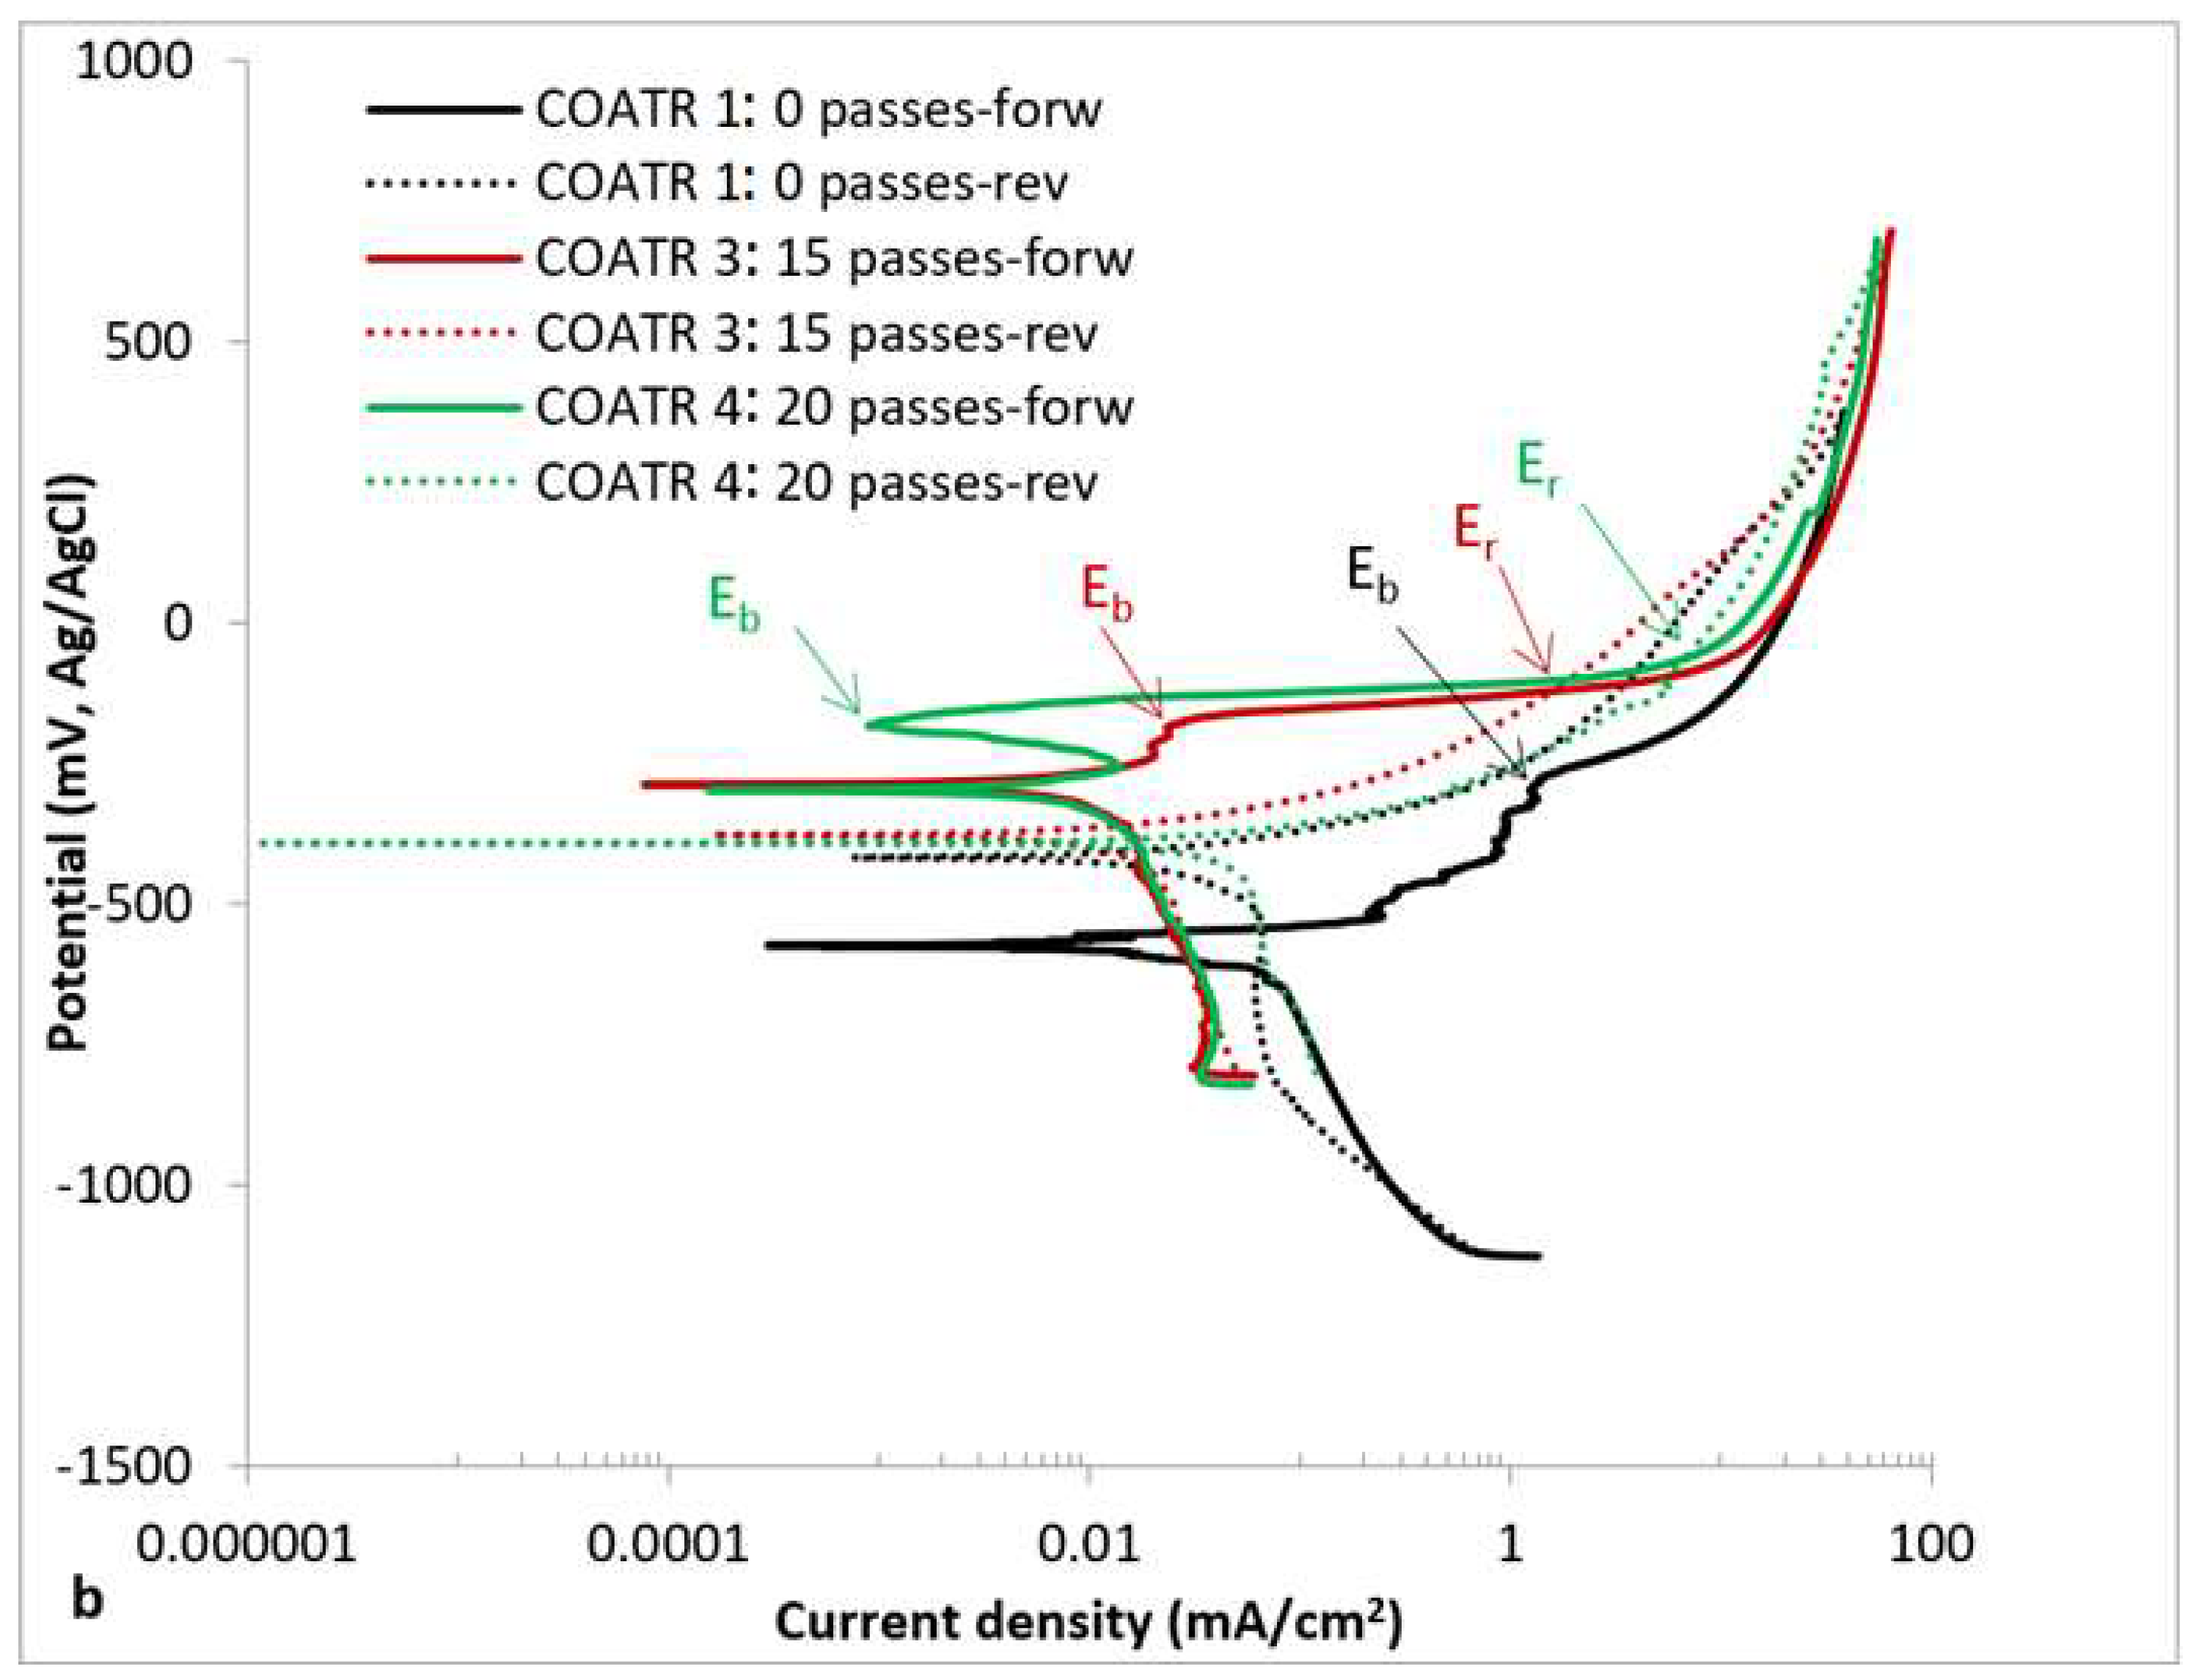
3.2.4. Effect of Thermal Treatment of the Coating

The different shape and electrochemical values of the polarization curve of the as-sprayed coating (COATR-1) in Figure 12 and Table 6 suggest that the postdeposition heat treatment in the form of gun passes led to a different corrosion response. On the other hand, not many differences are observed in the polarization performance of the coatings as a function of the number of gun passes (10–25 passes).
The sustainable flat gradients of the anodic forward portions of the heat treated specimens (Figure 12a) corresponding to negative hysteresis loops of considerable surface areas and the fact that Ea/c tr values are less noble than the Ecor values by approximately 100 mV manifest the occurrence of localized degradation. On the other hand, the positive hysteresis loop of accountable surface area along with the nobler Ea/c tr relative to the Ecor by ~160 mV suggest a high resistance to localized corrosion for the as-sprayed coating.
It would be expected that heat treatment of 15 passes (COATR 3) would lead to the best behavior toward localized corrosion due to the lowest porosity and the high amount of aluminides. However, the particularly high amount of the Al-rich aluminides NiAl3 and Ni2Al3 may have led to a strong galvanic coupling between Ni and intermetallics, favoring pitting and crevicing at the interfaces. Moreover, Figure 7c reveals small anodic areas (Ni) in contact with large cathodic areas (NiAl3, Ni2Al3), a combination that accelerates the dissolution of Ni at the interfaces.
On the other hand, the untreated coating (COATR 1) presents an equally low porosity with COATR 3 but higher amounts of Ni and Al. The presence of high amounts of Al-rich aluminides (NiAl3, Ni2Al3), which are contained in accountable quantities (Figure 7a and Figure 8) combined with relatively large surface areas of anodic Al, may lead to the formation of weak galvanic couples. Figure 7a also illustrates large surface areas of Ni (anodic) next to smaller zones of intermetallics, suggesting relatively weak galvanic coupling.
Finally, the nobler Ecor of the heat-treated coatings as compared to the Ecor of the as-sprayed coating may be explained by the absence of Al (10, 20 passes) and the extremely high amount of intermetallics (15 passes).

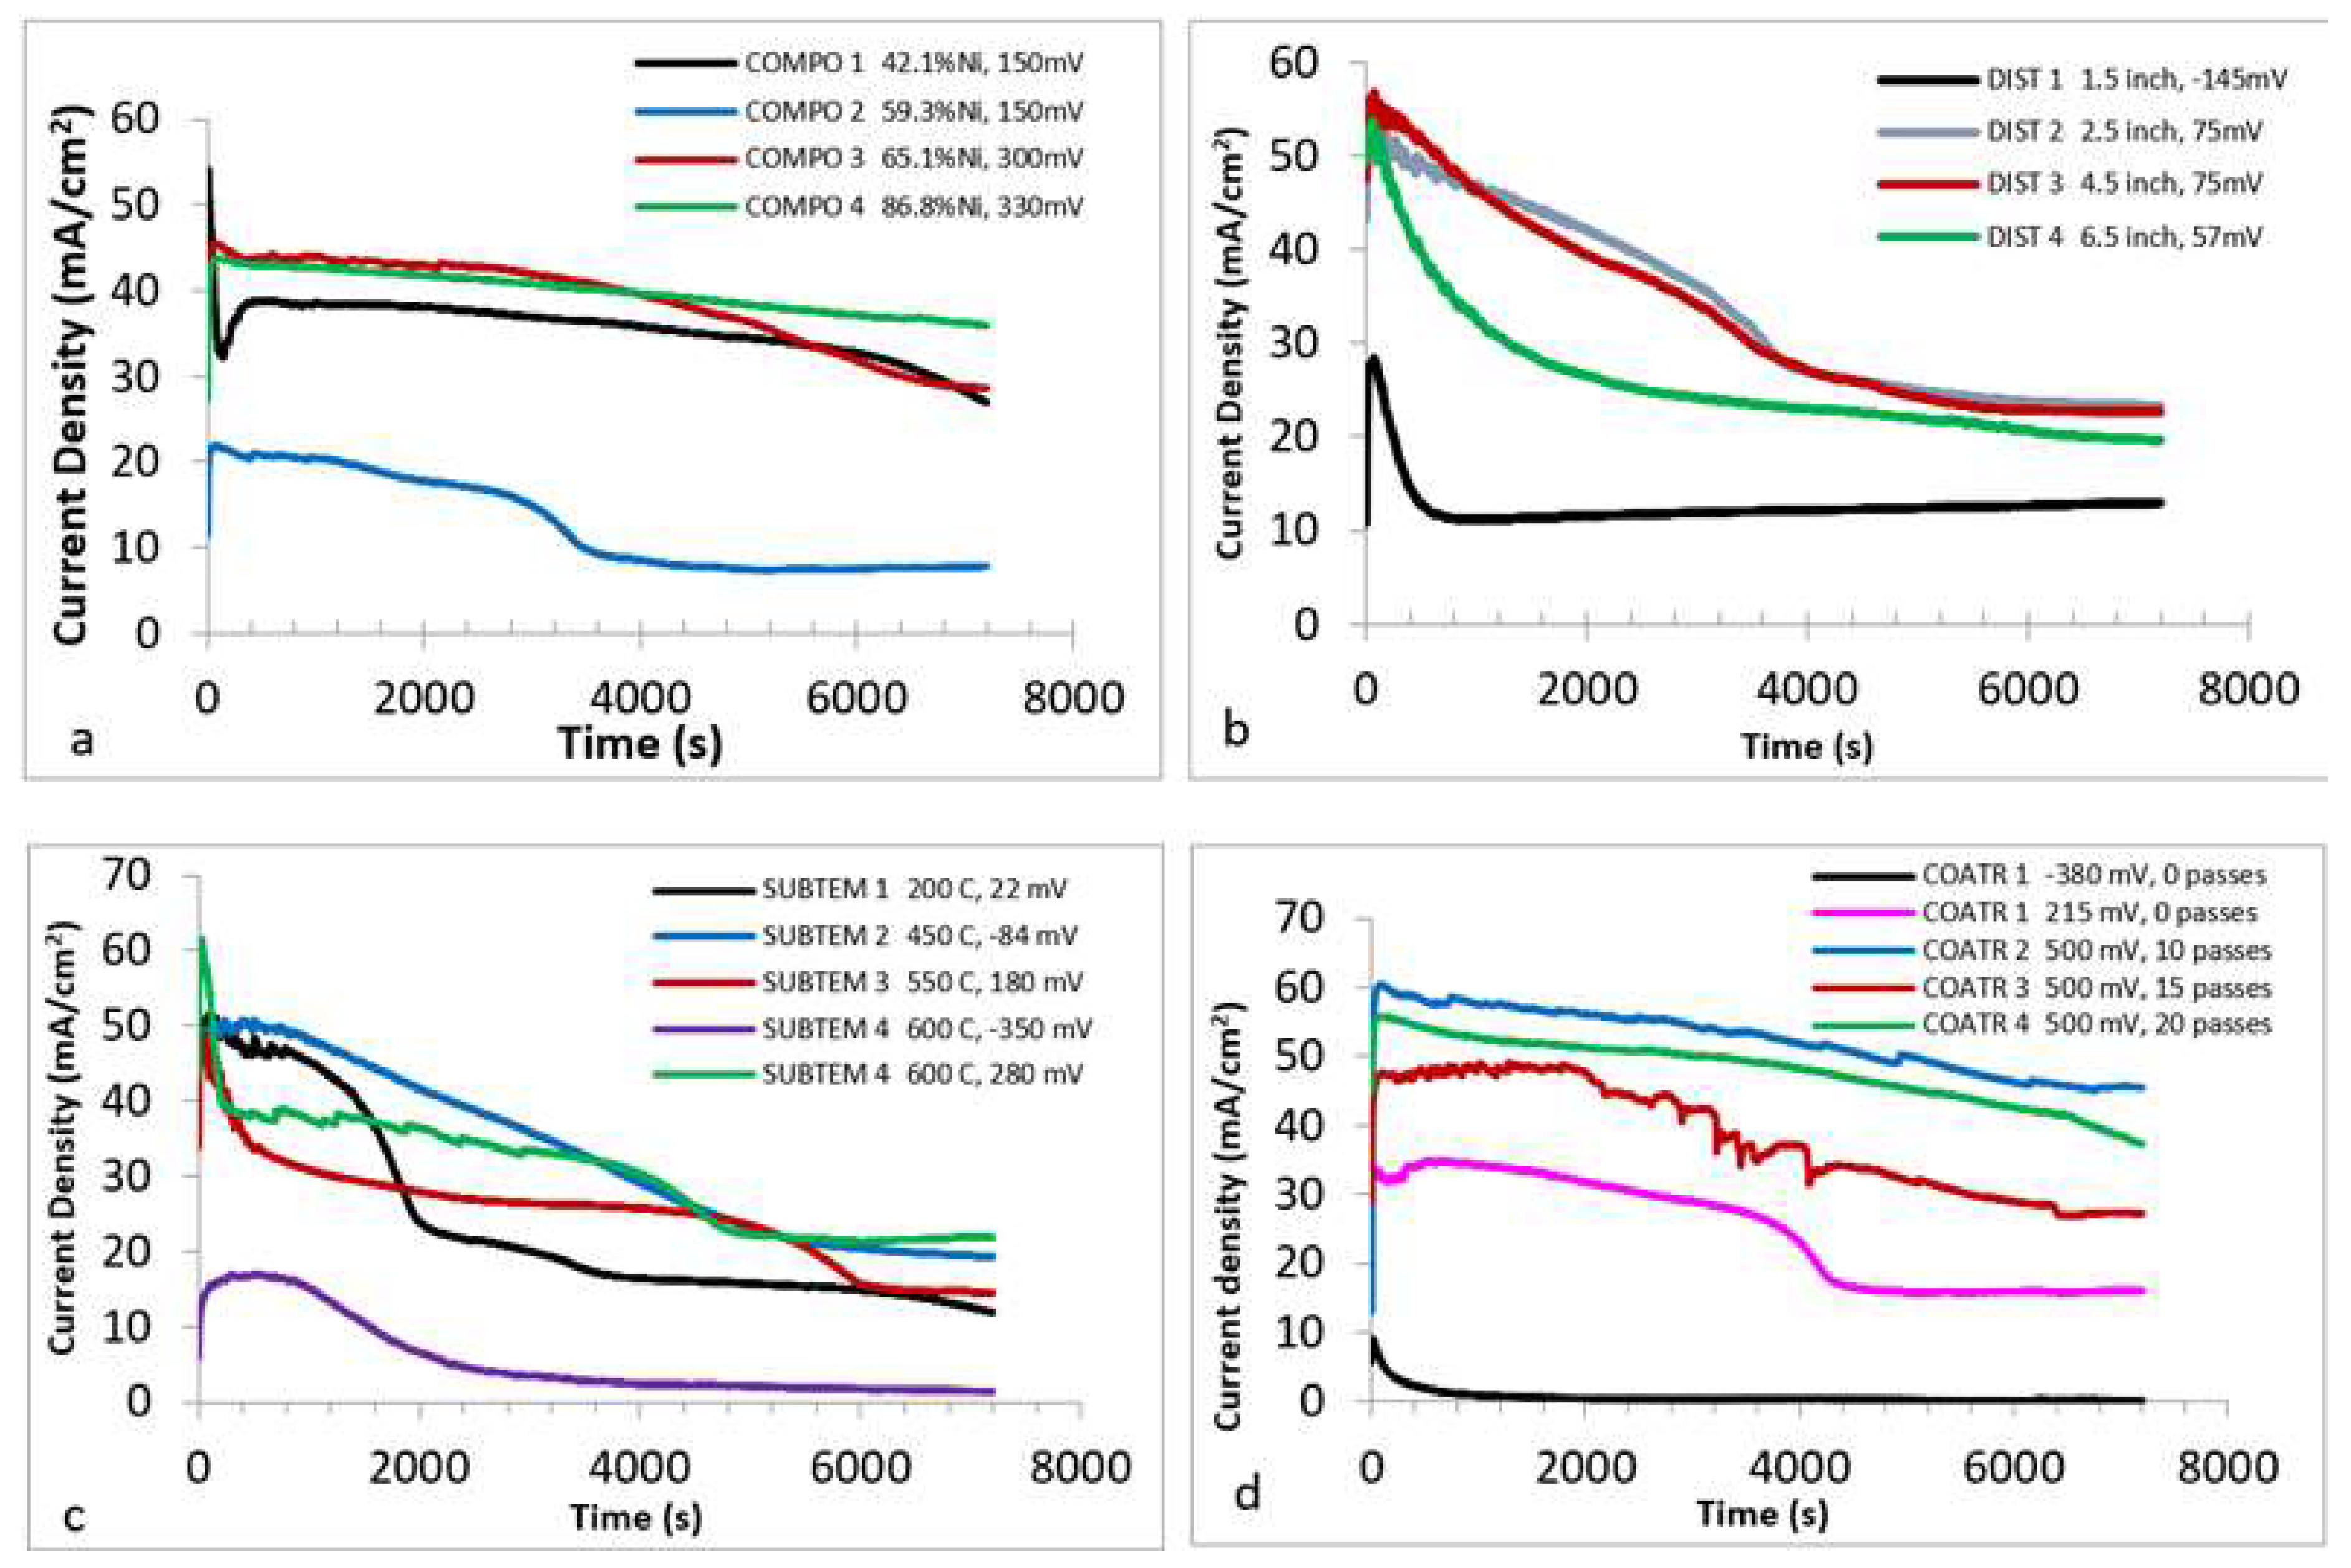
3.3. Chronoamperometry

Chronoamperometry testing was performed to confirm the deposition of surface films indicated at the high anodic Es of the potentiodynamic curves. The potentiostatic measurements were performed by polarization of the specimens at potential values corresponding to the pseudopassive regions for 2 h (Figure 13).
All curves of Figure 13a,b correspond to anodic potentials in the final current limiting stage, where hysteresis is positive. In general, the i vs. t curves present shapes typical of a current-limiting behavior. Current density initially decreased quickly, attaining a minimum value. Thereafter, it relaxed either to steady values or values that gradually decreased. The above trend signifies the build-up of surface films to a maximum thickness and extent. The maximum surface layer volume was further maintained or slightly and gradually increased. However, the high current density values in compatibility with the high current density values in the current limiting stages of the voltammograms (Figure 9, Figure 10, Figure 11 and Figure 12) imply heavily hydrated products. Indeed, as mentioned in the Introduction, it is well-established that all the major phases participating in the coatings, i.e., Al, Ni and aluminides, form bilayered surface films during immersion in aqueous chlorides with a defective inner oxide (barrier) layer adjacent to the metal and an outer layer that is composed of oxyhydroxides/hydroxides formed by cations that have been ejected from the barrier layer into the solution.
The paradox of high current density values despite the good protection ability of the surface depositions suggested by the positive hysteresis can be explained by the bilayered structure of the surface films, where the inner layer is anhydrous and has barrier abilities but the outer layer is hydrated and, thus, highly conductive, as reported in the Introduction.
COMPO 2, COMPO 3 and COMPO 4 present a slow but consistent decrease in current as a function of time, which is evidence of a slow but consistent deposition of surface products on the active surfaces. The higher current density values of COMPO 1 (42.1% Ni in the initial feedstock—the lowest Ni content) as compared to COMPO 2 (both polarized at 150 mV vs. Ag/AgCl) are in compatibility with the differences in the current density values of COMPO 1 and COMPO 2 at 150 mV during forward potentiodynamic polarization. They can mainly be ascribed to the high porosity of COMPO 1. COMPO 1 exhibits an initial sharp drop of i vs. t, most likely justified by the relatively high content of unreacted Al, which is subjected to spontaneous “passivation” as soon as it is immersed in the electrolyte. The succeeding current increase can be attributed to the anodic activity of the defective film (pores, interfaces, etc.).
The relatively low current density values of DIST 1 (Figure 13b) are rather due to the relatively low overpotential, as the concentration of Cl in the exposed defective surfaces increases with increasing potential [39]. Moreover, the DIST 1 coating, sprayed at the lowest spraying distance, contains the highest amount of Ni-aluminides, especially Ni3Al, (Figure 4), as shown in Figure 5. As such, it may be postulated that the surface films are the richest in Ni, which, as a transition metal, is expected to improve the resistance of the Al2O3-based film to Cl, according to the aforementioned literature. Hence, the lowest conductivity of the surface film on DIST 1 conforms with the highest resistance to localized corrosion, indicated in Figure 10.
The jagged shape of the current density vs. time curve of SUBTEM 4 (highest substrate temperature), polarized at −350 mV (Figure 13c), is compatible with the metastable pitting suggested by the jagged “pseudopassive” portion of the voltammogram in Figure 11. High porosity (Figure 6) along with a variety of IC and metal phases (Al, Ni, Ni3Al, NiAl, NiAl3) favored the formation of differential aeration cells. Nevertheless, it is postulated that the increased NiAl3 and Ni3Al (Figure 6) caused an enrichment of the surface films with Ni; thus, the surface films became more stable with time, inhibiting stabilization of the pits. Based on the above postulation, the shape of the curve at −350 mV can be explained by the above considerations, namely, active corrosion was succeeded by the formation of unstable products on the active sites, which were formed with the same rate at which they were dissolved, resulting in a jagged plateau, and maintained up to 650 s of immersion. Then, a slow but consistent drop of current follows, suggesting alternative regrowth and dissolution, where the regrowth takes place at an increasingly higher rate as compared to the dissolution. Eventually, the film thickness and extent are stabilized. Metastable pitting is shown in all cases of substrate preheating (indicated by the jagged shape of the i vs. t curves). Nevertheless, in all cases, the dropping trend of current eventually became a current stabilization trend, manifesting a pseudopassive activity ascribed to thick, hydrated Al2O3-based films.
All the i vs. t curves of Figure 13d exhibit a gradual current drop with time, eventually leading to current stabilization (except COATR 4). Current oscillations and high current density values suggest soluble surface films, which grew with time until attainment of a constant thickness. However, the as-sprayed coating (COATR 1) exhibits a different behavior during polarization at −300 mV vs. Ag/AgCl, a potential corresponding to the first current limiting stage in the respective voltammogram of Figure 12. The initial sharp drop of current followed by current stabilization at very low values implies a passive-like behavior. This behavior confirms the occurrence of a first current limiting stage shown in Figure 12. A deeper investigation on the nature of this stage is out of the scope of this paper; however, on a first approximation, it could be associated with passivation of Al, which is the phase with the highest passivation tendency for passivation. Indeed, the Gibbs free energies of formation of Al-oxide-based compounds are more negative (−1562.7 kJ/mol) than the Gibbs energies of formation of Ni-oxide-based compounds (−211.7 kJ/mol) [58]. Of course, the potential of −380 mV vs. Ag/AgCl is higher than the pitting potential of Al (~−660 mV [39,40,41]), and this probably explains the metastable pitting situation during potentiodynamic polarization (Figure 12).
The metastable pitting that did not evolve to stable pitting raises the possibility that Ni dissolved in Al stabilized the Al2O3-based film of Al. The solubility of Ni in Al is negligible under equilibrium conditions: 0.023 at% Ni (~0.05 wt. %) [59]; however, under the rapid solidification conditions of thermal spraying, the solubility of Ni in Al may be increased to 1.5 at% Ni (~3.0 wt. %) [60]. Indeed, SEM/EDX quantitative analysis of the Al phase in the coatings revealed dissolved Ni up to 1.4 at% (~2.8 wt.%).
The intense current fluctuations along with the plateau of i vs. t up to 2000 s, for the coating post-heat-treated by 15 gun passes (COATR 7), confirm the consideration stemming from the potentiodynamic polarization findings that indicated a strong galvanic coupling between Ni and Al-rich aluminides that favored pitting/crevicing at the interfaces.
The high current density values recorded for the coatings heat-treated by 10 and 20 gun passes as compared to the 15 gun passes heat-treated coating can be justified by the relatively high porosities that constitute sites of increased Cl concentration.

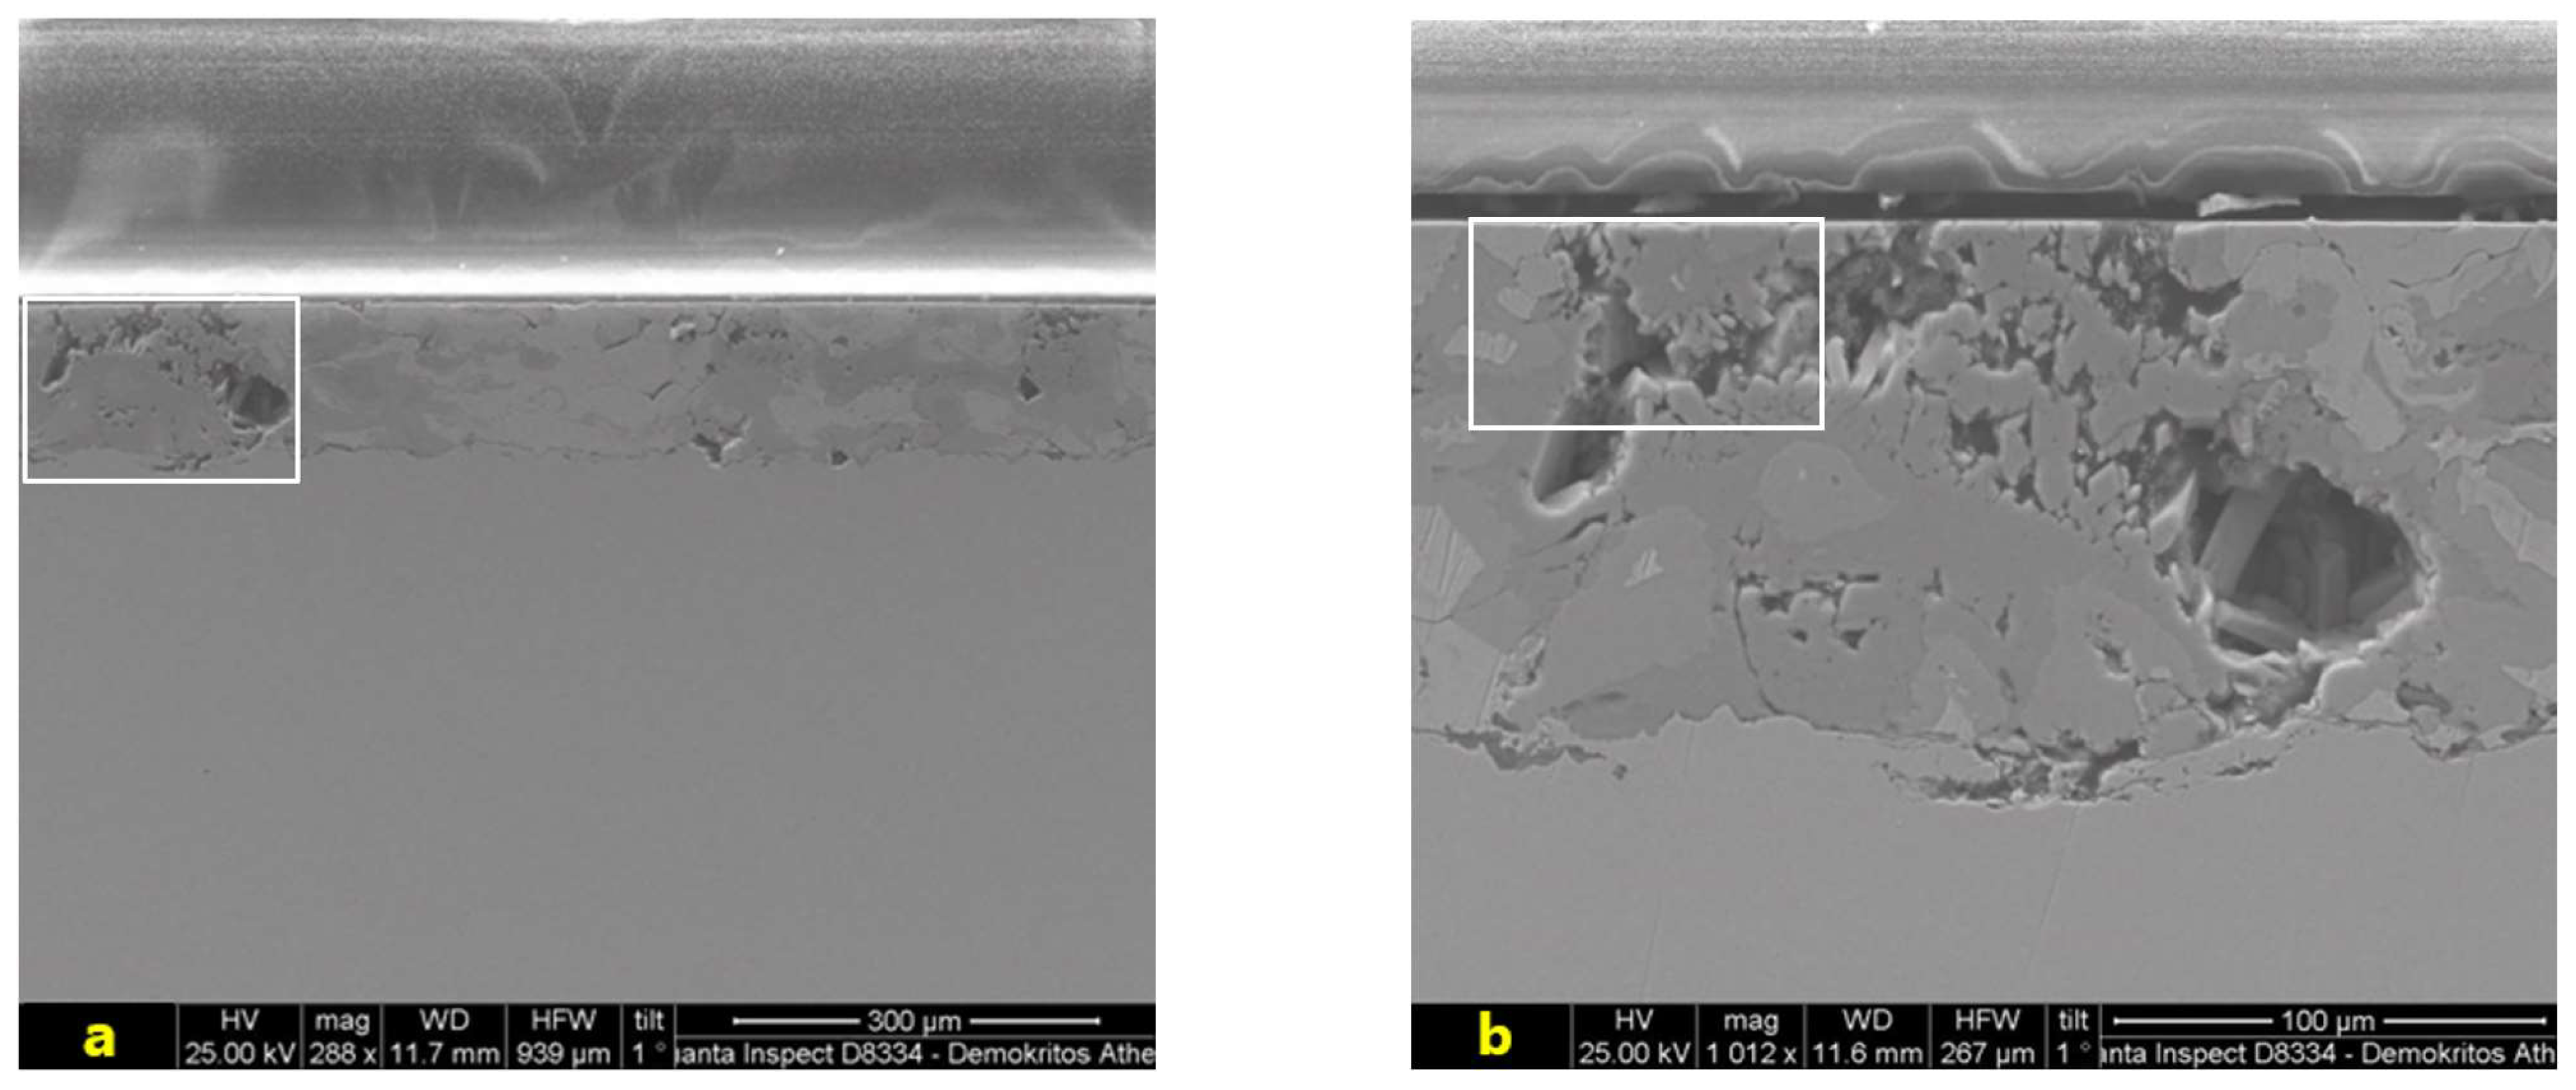
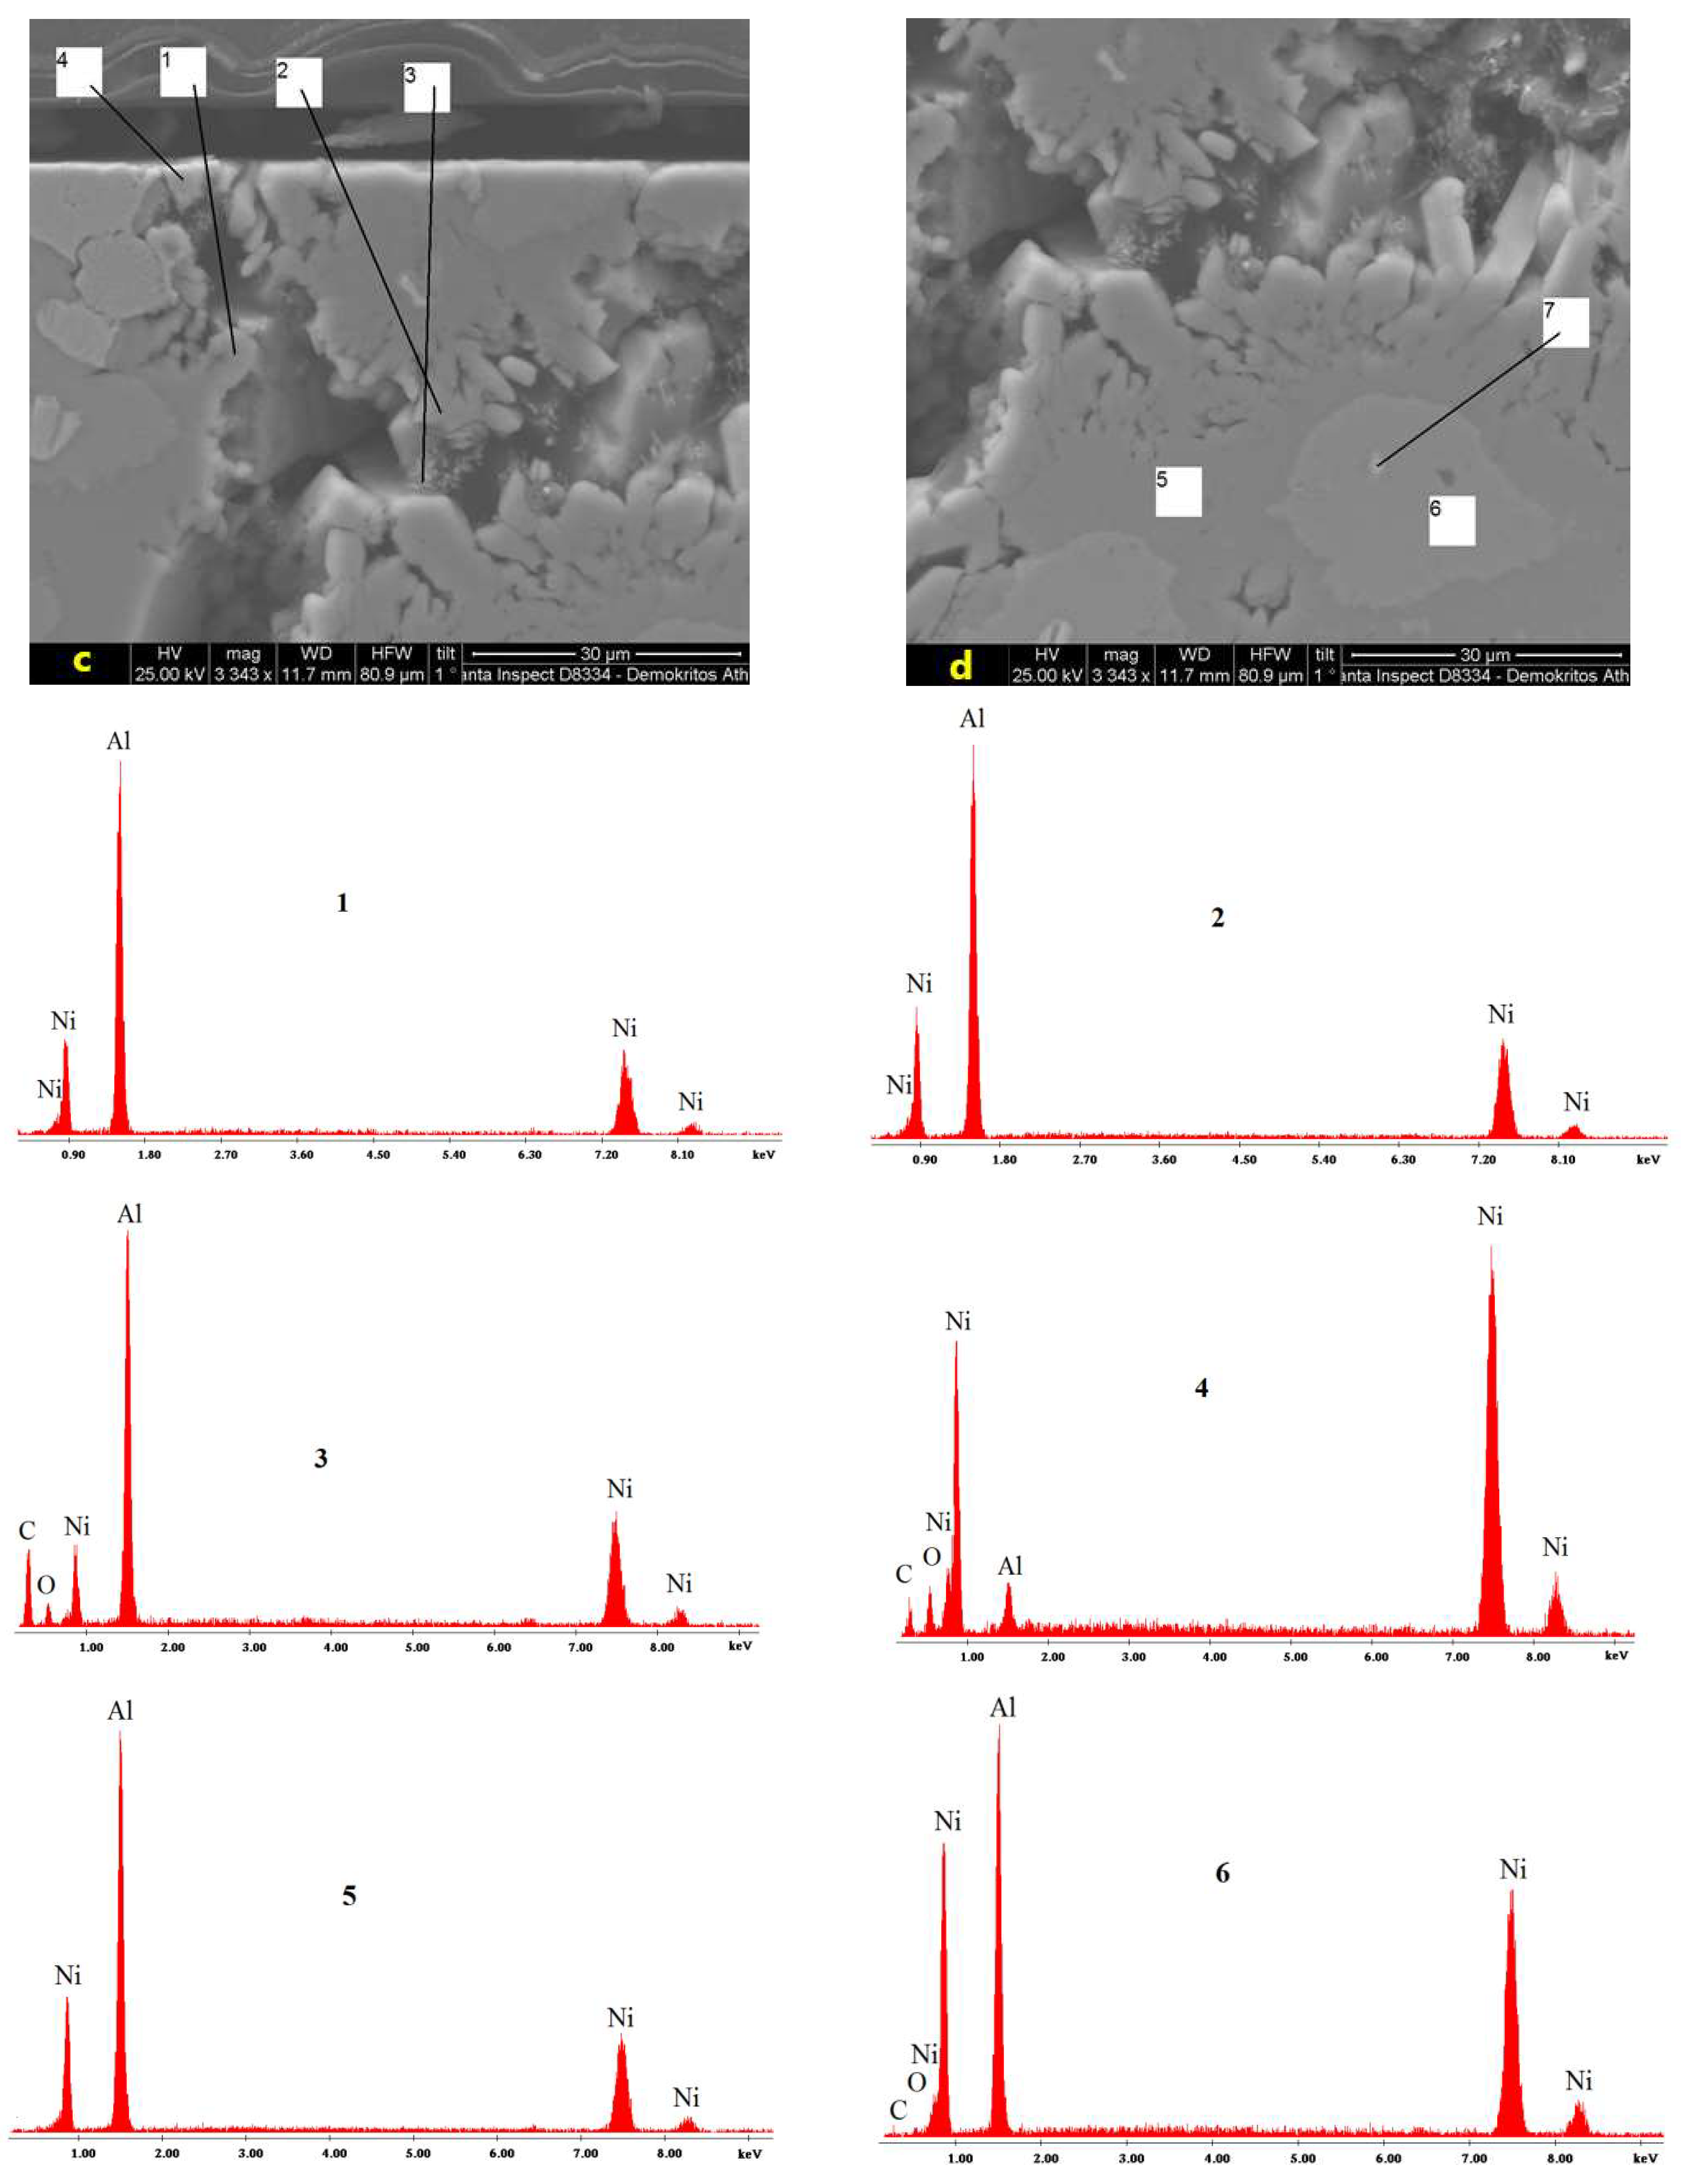
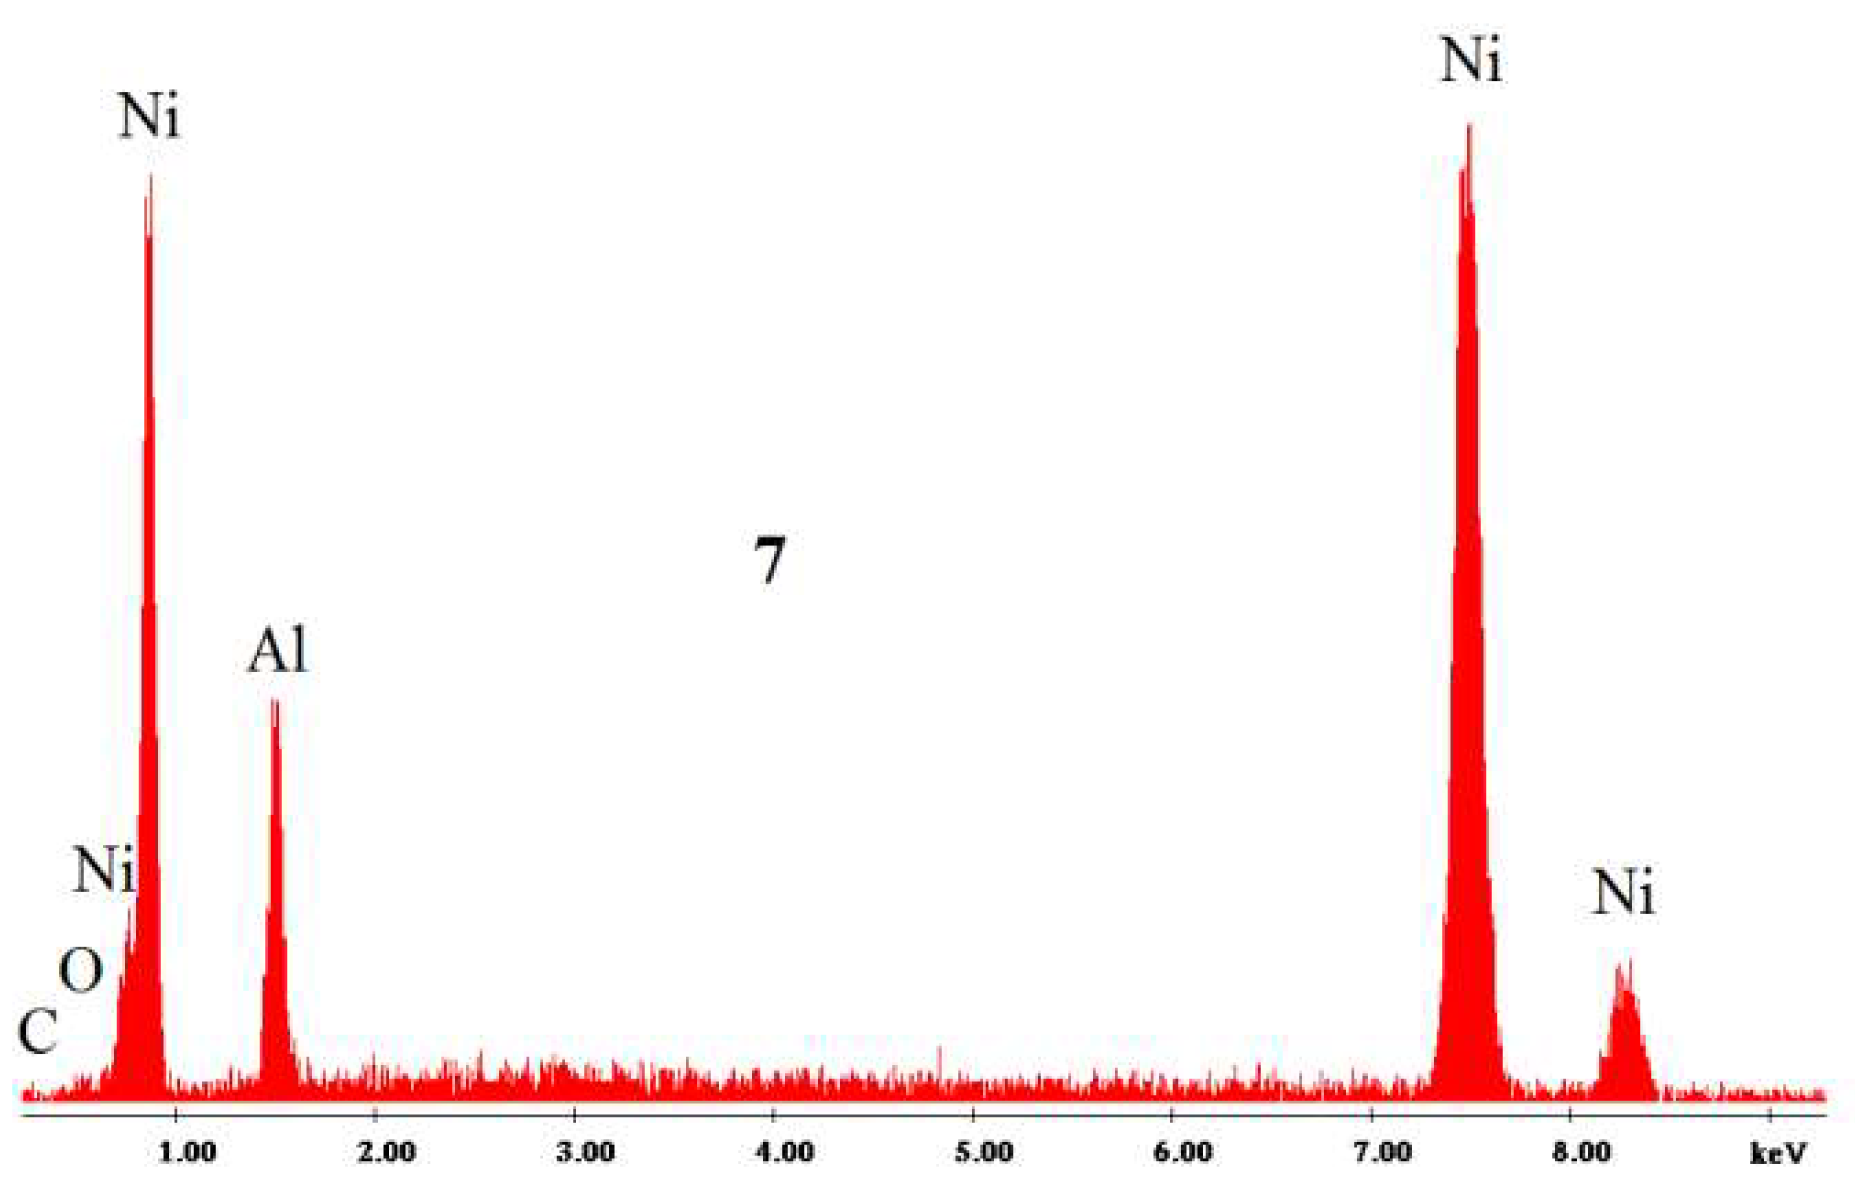
3.4. Microstructure of Corrosion

Figure 14 presents the microstructure of COATR 3 after cyclic polarization. COATR 3 (15 passes of heat treatment) showed low resistance to localized corrosion in Figure 12.
The presence of both oxide products of Al and Ni in the surface of the coatings agrees with previous studies on the corrosion of intermetallic compounds of Al with transition metals [36,37,38,39,42].
Each phase of the coating exhibited a different behavior to corrosion. From the observation of the cross-section of coating COATR 3 by SEM/EDS (Figure 14) after cyclic polarization, it seems that the corrosion propagated through phases containing a high percentage of Al (Figure 14, points 1–3).
Figure 14a shows an overview of the cross-section of COATR 3. The pits propagated through the dark phase in the coating, as shown in Figure 14b. It is observed that lighter phases are protected during polarization. EDX analysis (Figure 14c, points 1–3) suggests that the dark areas correspond to the NiAl3 intermetallic compound, while the white areas (Figure 14c, point 4) correspond to Ni. It is seen that the electrolyte did not reach the interface with the substrate. It was reported that at high temperatures, corrosion of NiAl may occur by diffusion of Al and formation of a surface Al2O3-based film. When the proportion of Al is reduced below the minimum level necessary for the formation of Al2O3, corrosion penetrates the substrate, resulting in formation of brittle phases [61,62].
Thus, it appears that Ni was protected in the presence of the NiAl3 phase, which was oxidized first; the formed film was probably not stable enough to stop the penetration of the electrolyte into the coating. Close to the pit, the phases of Ni2Al3 (Figure 14d, point 5), NiAl (Figure 14d, point 6) and Ni3Al (Figure 14d, point 7) are observed. The oxidation trend most likely follows the order: NiAl3 > Ni2Al3 > NiAl > Ni3Al, in analogy to their Al content. Moon et al. [63] stated that the NiAl coatings exhibited lower corrosion rates than the Ni2Al3 coatings in a carbonate fuel solution (molten carbonate fuel cell, MCFC). It is also established that in aerated solutions containing halogen ions, among which Cl is the most common, aluminum is highly susceptible to pitting corrosion [39,40].
A likely localized corrosion mechanism involves selective dissolution of the Al and NiAl3 phase. Pits started from the phase of Al and propagated sequentially through NiAl3 (phase rich in Al) and then through Ni2Al3. This sequence occurred in areas highly susceptible to localized corrosion, such as pores, splats boundaries and unmelted particles. The phases of Ni and Ni3Al adjacent to NiAl3 remained protected.

4. Conclusions

  • The corrosion behavior of the nickel aluminide coatings is complicated because of the complex microstructure, characterized by the coexistence of various intermetallic phases (Ni-aluminides of various stoichiometries) with unreacted Ni and Al, along with thermal spraying defects (pores, splats, unmelted particles, oxide inclusions, etc.). As a consequence, no clear trends could be extracted from the electrochemical behavior of the coatings as a function of the fabrication (composition of the initial feedstock, spraying distance, substrate temperature, postdeposition heat treatment) parameters.
  • Most of the coatings have exhibited limited susceptibility to localized corrosion. In all cases, the steel substrate remained intact despite corrosion.
  • The main effects of the fabricating parameters on the corrosion behavior of the coatings are as follows. Effect of initial powder mixture composition: the coating with the lowest Ni content in the initial powder feedstock (42.1 wt.% Ni) exhibited the lowest resistance to general corrosion but the highest resistance to localized corrosion. Effect of spraying distance: the coating sprayed at the shortest distance presented the highest resistance to localized corrosion. Effect of substrate temperature: hotter substrates have led to lower resistances to general corrosion. Effect of postdeposition heat treatment: heat treatment led to an increased susceptibility to localized corrosion.
  • Interconnected porosity seems to be the main parameter accelerating uniform corrosion. An increase in porosity from 1.3 vol.% to 5.0 vol.% resulted in a tripling of the corrosion current density.
  • Nickel aluminides appeared oxidized after polarization.
  • Chronoamperometry experiments at pseudopassive potentials confirmed findings 3 and 4 of the potentiodynamic polarization experiments.
  • Localized corrosion had the form of pitting and/or crevice corrosion in the coating and propagated dissolving Al and Al-rich nickel aluminides along coating defects.
  • The low susceptibility to localized corrosion and the intactness of the substrate suggest that the CAFSY method is prospective for the production of corrosion-resistant nickel aluminide coatings.

Author Contributions

Conceptualization, A.M.; Software, G.X.; Formal analysis, A.G.L.; Investigation, A.M.; Data curation, G.V.; Writing—original draft, A.M.; Writing—review & editing, A.G.L. and G.V.; Visualization, A.G.L.; Project administration, G.X. All authors have read and agreed to the published version of the manuscript.

Funding

This research received no external funding.

Institutional Review Board Statement

Not applicable.

Informed Consent Statement

Not applicable.

Data Availability Statement

Data sharing is not applicable to this article.

Conflicts of Interest

The authors declare no conflict of interest.

References

  1. Frommeyer, G.; Rablbauer, R. High Temperature Materials Based on the Intermetallic Compound NiAl Reinforced by Refractory Metals for Advanced Energy Conversion Technologies. Steel Res. Int. 2008, 79, 507–512. [Google Scholar] [CrossRef]
  2. Dey, G.K.; Tewari, R.; Roa, P.; Wadekar, S.L.; Mukhopadhyay, P. Precipitation hardening in nickel copper alloy monel K500. Metall. Trans. A 1993, 24, 2709–2719. [Google Scholar] [CrossRef]
  3. Davis, J.R. Nickel Cobalt and Their Alloys, ASM Specialty Handbook; ASM International: Materials Park, OH, USA, 2000. [Google Scholar]
  4. Sidhu, T.S.; Prakash, S.; Agrawal, R.D. Hot corrosion and performance of nickel-based coatings. Curr. Sci. 2006, 90, 41–47. [Google Scholar]
  5. Buta, S.S.; Prakash, S. Evaluation of the Corrosion Behavior of Plasma Sprayed Ni3Al Coatings on Steel in Oxidation and Molten Salt Environments at 900 °C. Surf. Coat. Technol. 2003, 166, 89–100. [Google Scholar]
  6. Hussey, T.S.; Koczak, M.J.; Smith, R.W.; Kalidindi, S.R. Synthesis of nickel aluminides by vacuum plasma spraying and exothermic in-situ reactions. Mater. Sci. Eng. A 1997, 229, 137–146. [Google Scholar] [CrossRef]
  7. Vershinnikov, V.I.; Borovinskaya, I.P. Self-propagating high-temperature synthesis of titanium and nickel aluminides with additives. Powder Metall. Met. Ceram. 2009, 48, 533–539. [Google Scholar] [CrossRef]
  8. Yamaguchi, M.; Inui, H.; Ito, K. High-temperature structural intermetallintermetallics. Acta Mater. 2000, 48, 307–322. [Google Scholar] [CrossRef]
  9. Sauthoff, G. Multiphase intermetallic alloys for structural applications. Intermetallics 2000, 8, 1101–1109. [Google Scholar] [CrossRef]
  10. Scheppe, F.; Sahm, P.R.; Hermann, W.; Paul, U.; Preuhs, J. Nickel aluminides: A step toward industrial application. Mater. Sci. Eng. A 2002, 329–331, 596–601. [Google Scholar] [CrossRef]
  11. Makino, A. Fundamental aspects of the heterogeneous flame in the self-propagating high-temperature synthesis (SHS) process. Prog. Energy Combust. Sci. 2001, 27, 1–74. [Google Scholar] [CrossRef]
  12. Pawlowski, L. The Science and Engineering of Thermal Spray Coatings; John Wiley and Sons: Hoboken, NJ, USA, 1995. [Google Scholar]
  13. Xanthopoulou, G. Catalytic Properties of the SHS products. Rev. Adv. Sci. Technol. 2010, 63, 287–296. [Google Scholar]
  14. Kozerski, S. The Oxide Reduction in the Plasma Sprayed Ni-A1 Layers, Advances in Thermal Spraying. In Proceedings of the Eleventh International Thermal Spray Conference, Montreal, QC, Canada, 8–12 December 1986; Pergamon Press: Oxford, UK, 1986; pp. 845–852. [Google Scholar]
  15. Zhang, Q.; Li, C.J.; Wang, X.R.; Ren, Z.L.; Li, C.X.; Yang, G.J. Formation of NiAl Intermetallic Compound by Cold Spraying of Ball-Milled Ni/Al Alloy Powder Through Postannealing Treatment. J. Therm. Spray Technol. 2008, 17, 715–720. [Google Scholar] [CrossRef]
  16. Deevi, S.C.; Sikka, V.K.; Swindeman, C.J.; Seals, R.D. Reactive Spraying of NickeI-Aluminide Coatings. J. Therm. Spray Technol. 1997, 6, 335–344. [Google Scholar] [CrossRef]
  17. Zhu, H.; Abbaschian, R. Reactive processing of nickel-aluminide intermetallic compounds. J. Mater. Sci. 2003, 38, 3861–3870. [Google Scholar] [CrossRef]
  18. Vardelle, A.; Moreau, C.; Themelis, N.J.; Chazelas, C. A Perspective on Plasma Spray Technology. Plasma Chem. Plasma Process. 2015, 35, 491–509. [Google Scholar] [CrossRef]
  19. Xanthopoulou, G.; Marinou, A.; Vekinis, G.; Lekatou, A.; Vardavoulias, M. Ni-Al and NiO-Al Composite Coatings by Combustion-Assisted Flame Spraying. Coatings 2014, 4, 231–252. [Google Scholar] [CrossRef] [Green Version]
  20. Marinou, A. Synthesis of High Temperature Coatings Produced by the Novel CAFSY Method. Ph.D. Thesis, University of Ioannina, Ioannina, Greece, 2016. [Google Scholar]
  21. Kumar, K.G.; Sivarao, T.J.; Sahaya Anand, A. Novel Intermetallic Nickel Aluminide (Ni3Al) as an Alternative Automotive Body Material. Int. J. Eng. Technol. 2011, 11, 17327197. [Google Scholar]
  22. Sampath, S.; Bancke, G.A.; Herman, H.; Rangaswamy, S. Plasma Sprayed Ni–Al Coatings. J. Surf. Eng. 1989, 5, 293–298. [Google Scholar] [CrossRef]
  23. Oerlikon Metco. Material Data Sheet. Available online: https://www.oerlikon.com/ecoma/files/DSM-0271.2_Ni-Al.pdf (accessed on 10 October 2022).
  24. Naiborodenko, Y.S.; Itin, V.I.; Savitskii, K.V. Exothermic effects during sintering of a mixture of nickel and aluminium powders. Sov. Phys. J. 1968, 11, 89–93. [Google Scholar] [CrossRef]
  25. Ozdemir, O.; Zeytin, S.; Bindal, C. A study on NiAl produced by pressure-assisted combustion synthesis. Vacuum 2010, 84, 430–437. [Google Scholar] [CrossRef]
  26. Curfs, C.; Turrillas, X.; Vaughan, G.B.M.; Terry, A.E.; Kvick, A.; Rodríguez, M.A. Al-Ni intermetallintermetallics obtained by SHS: A time-resolved X-ray diffraction study. Intermetallics 2007, 15, 1163–1171. [Google Scholar] [CrossRef]
  27. Cui, H.Z.; Wei, N.; Zeng, L.L.; Wang, X.B.; Tang, H.J. Microstructure and formation mechanism of Ni-Al intermetallic compounds fabricated by reaction synthesis. Trans. Nonferrous Met. Soc. China 2013, 23, 1639–1645. [Google Scholar] [CrossRef]
  28. Marinou, A.; Xanthopoulou, G.; Vekinis, G.; Lekatou, A.; Vardavoulias, M. Synthesis and Heat Treatment of Sprayed High Temperature NiAl–Ni3Al Coatings by In-Flight Combustion Synthesis (CAFSY). Int. J. Self Propagating High Temp. Synth. 2015, 24, 192–201. [Google Scholar] [CrossRef]
  29. Hunter, M.S.; Fowle, P. Naturally and thermally formed oxide films on aluminum. J. Electrochem. Soc. 1956, 103, 482–485. [Google Scholar] [CrossRef]
  30. Bockris, J.O.M.; Kang, Y. The protectivity of aluminum and its alloys with transition metals. J. Solid State Electrochem. 1997, 1, 17–35. [Google Scholar] [CrossRef]
  31. Sikora, E. Nature of the passive film on nickel. Electrochim. Acta 2002, 48, 69–77. [Google Scholar] [CrossRef]
  32. Melendres, C.A.; Pankuch, M. On the composition of the passive film on nickel: A surface-enhanced Raman spectroelectrochemical study. J. Electroanal. Chem. 1992, 333, 103–113. [Google Scholar] [CrossRef]
  33. Nishimura, R. Pitting Corrosion of Nickel in Borate and Phosphate Solutions. Corrosion 1987, 43, 486–492. [Google Scholar] [CrossRef]
  34. Zamanzade, M.; Barnoush, A. Effect of chromium on the electrochemical properties of iron aluminide intermetallic intermetallics. Corros. Sci. 2014, 78, 223–232. [Google Scholar] [CrossRef]
  35. Rosalbino, F.; Carlini, R.; Parodi, R.; Zanicchi, G.; Scavino, G. Investigation of passivity and its breakdown on Fe3Al–Si and Fe3Al–Ge intermetallintermetallics in chloride-containing solution. Corros. Sci. 2014, 85, 394–400. [Google Scholar] [CrossRef]
  36. Schaepers, D.; Strehblow, H.-H. An XPS and ISS Investigation of passive layers on Fe-Al alloys. Corros. Sci. 1997, 39, 2193–2213. [Google Scholar] [CrossRef]
  37. Frangini, S.; de Cristofaro, N.B.; Mignone, A.; Lascovich, J.; Giorgi, R. A combined electrochemical and XPS study on the passivity of B2 iron aluminides in sulphuric acid solution. Corros. Sci. 1997, 39, 1431–1442. [Google Scholar] [CrossRef]
  38. Shankar Rao, V. A review of the electrochemical corrosion behaviour of iron aluminides. Electrochim. Acta 2004, 49, 4533–4542. [Google Scholar]
  39. Lekatou, A.; Sfikas, A.K.; Karantzalis, A.E.; Sioulas, D. Microstructure and corrosion performance of Al-32%Co alloys. Corros. Sci. 2012, 63, 193–209. [Google Scholar] [CrossRef]
  40. Lekatou, A.; Sfikas, A.K.; Petsa, C.; Karantzalis, A.E. Al-Co alloys prepared by vacuum arc melting: Correlating microstructure evolution and aqueous corrosion behavior with co content. Metals 2016, 6, 46. [Google Scholar] [CrossRef]
  41. Palm, M.; Krieg, R. Neutral salt spray tests on Fe–Al and Fe–Al–X. Corros. Sci. 2012, 64, 74–81. [Google Scholar] [CrossRef]
  42. Lekatou, A.; Marinou, A.; Patsalas, P.; Karakassides, M.A. Aqueous corrosion behaviour of Fe-Ni-B metal glasses. J. Alloy Compd. 2009, 483, 514–518. [Google Scholar] [CrossRef]
  43. Beni, A.; Ott, N.; Binczyk, E.U.; Rasinski, M.; Bauer, B.; Gille, P.; Ulrich, A.; Schmutz, P. Passivation and localised corrosion susceptibility of new Al–Cr–Fe complex metallic alloys in acidic NaCl electrolytes. Electrochim. Acta 2011, 56, 10524–10532. [Google Scholar] [CrossRef]
  44. Veys, D.; Rapin, C.; Li, X.; Aranda, L.; Fournee, V.; Dubois, J.M. Electrochemical behavior of approximant phases in the Al-(Cu)-Fe-Cr system. J. Non-Cryst. Solids 2004, 347, 1–10. [Google Scholar] [CrossRef]
  45. Davis, G.D.; Shaw, B.A.; Rees, B.J.; Pecile, C.A. Electrochemical behavior and surface chemistry of nonequilibrium aluminum-tantalum alloys: Solute-rich interphase model. Surf. Interf. Anal. 1995, 23, 609–617. [Google Scholar] [CrossRef]
  46. Lekatou, A.G.; Sfikas, A.K.; Karantzalis, A.E. The influence of the fabrication route on the microstructure and surface degradation properties of Al reinforced by Al9CO2. Materials 2017, 200, 33–49. [Google Scholar]
  47. Ahn, S.; Kwon, H.S.; Macclorand, D.D. Surface Oxide Films. In ECS PV2003-25; Birss, V., Burke, L., Hillman, A.R., Lillard, R.S., Eds.; ECS Publishing Group: Paris, France, 2003. [Google Scholar]
  48. Stern, A.L. Geary, Electrochemical Polarization I. A Theoretical Analysis of the Shape of Polarization Curves. J. Electrochem. Soc. 1957, 104, 56–61. [Google Scholar] [CrossRef]
  49. Lekatou, A.; Zois, D.; Karantzalis, A.E.; Grimanelis, D. Electrochemical behaviour of cermet coatings with a bond coat on Al7075: Pseudopassivity, localized corrosion and galvanic effect considerations in a saline environment. Corros. Sci. 2010, 52, 2616–2635. [Google Scholar] [CrossRef]
  50. Lekatou, A.; Sioulas, D.; Karantzalis, A.E.; Grimanelis, D. A comparative study on the microstructure and surface property evaluation of coatings produced from nanostructured and conventional WC–Co powders HVOF-sprayed on Al7075. Surf. Coat. Technol. 2015, 276, 539–556. [Google Scholar] [CrossRef]
  51. Silverman, D.C. Practical corrosion prediction using electrochemical techniques. In Uhlig’s Corrosion Handbook, 3rd ed.; Winston Revie, R., Ed.; Wiley & Sons: Hoboken, NJ, USA, 2011; pp. 1129–1166. [Google Scholar]
  52. Xanthopoulou, G.; Marinou, A.; Karanasios, K.; Vekinis, G. Combustion Synthesis during Flame Spraying (“CAFSY”) for the Production of Catalysts on Substrates. Coatings 2017, 7, 14. [Google Scholar] [CrossRef] [Green Version]
  53. Rog, G.; Borchardt, G.; Wellen, M.; Lose, W.J. Determination of the activities in the (Ni + Al) alloys in the temperature range 870 K to 920 K by a solid-state galvanic cell using a CaF2 electrolyte. Chem. Thermodyn. 2003, 35, 261–268. [Google Scholar] [CrossRef]
  54. Rog, G.; Kozłowska-Rog, A.; Borchardt, G.; Dorrer, L.; Loser, W. Determination of the standard Gibbs free energy of the intermetallic compound Ni3Al in the temperature range (820 to 920) K by a solid-state galvanic cell method. J. Chem. Thermodyn. 2005, 37, 97–100. [Google Scholar] [CrossRef]
  55. Grote, K.-H.; Antonsson, E.K. (Eds.) Springer Handbook of Mechanical Engineering; Springer: New York, NY, USA, 2009. [Google Scholar]
  56. Available online: http://www.tms.org/pubs/journals/JOM/9712/Kattner-9712.html (accessed on 30 September 2022).
  57. Itin, V.Y.; Naiborodenko, U.S. High Temperature Synthesis Intermetallic Compounds; Tomsk University: Tomsk, Russia, 1989; pp. 1–212. [Google Scholar]
  58. Dean, J.A. Lange’s Handbook of Chemistry, 12th ed.; McGraw-Hill: New York, NY, USA, 1979. [Google Scholar]
  59. Gogebakan, M.; Uzun, O.; Karaaslan, T.; Keskin, M. Rapidly solidified Al-6.5 wt.% Ni alloy. J. Mater. Process. 2003, 142, 87–92. [Google Scholar] [CrossRef]
  60. Afonso, C.R.M.; Spinelli, J.E.; Bolfarini, C.; Botta, W.J.; Kiminami, C.S.; Garcia, A. Rapid Solidification of an Al-5Ni Alloy Processed by Spray Forming. Materials 2012, 15, 779–785. [Google Scholar] [CrossRef] [Green Version]
  61. Leyens, C.; Pint, B.A.; Wright, I.G. Effect of Composition on the Oxidation and Hot Corrosion Resistance of Ni-Al Doped with Precious Metals. Surf. Coat. Technol. 2000, 133–134, 15–22. [Google Scholar] [CrossRef]
  62. Houngninou, C.; Chevalier, S.; Larpin, J.P. Synthesis and characterisation of pack cemented aluminide coatings on metals. Appl. Surf. Sci. 2004, 236, 256–269. [Google Scholar] [CrossRef]
  63. Moon, Y.; Lee, D. Corrosion resistance of 316 L stainless steel with surface layer of Ni2Al3 or NiAl in molten carbonates. J. Power Source 2003, 115, 1–11. [Google Scholar] [CrossRef]
Figure 1. SEM (SE mode) micrographs of coatings (cross-sections) with an initial mixture composition of: (a) 42.1% Ni-COMPO 1; (b) 59.3% Ni-COMPO 2; (c) 65.1% Ni-COMPO 3; (d) 86.8% Ni-COMPO 4 and (eh) phase identification by EDX. All coatings have been subjected to 10 gun passes of heat treatment. Based on data of [52].
Coatings 12 01935 g001aCoatings 12 01935 g001b
Figure 2. (a) XRD pattern of the surfaces formed after different initial composition of the powder before CAFSY (using data of [52]) and (b) coating porosity and semiquantitative analysis of the intermetallic phases present in the coatings as functions of the Ni content in the initial feedstock mixture.
Coatings 12 01935 g002
Figure 3. SEM (SE mode) micrographs of the cross-sections of the coatings produced at various thermal spraying distances: (a) 1.5 inch (3.8 cm): DIST 1, (b) 2.5 inch (6.4 cm): DIST 2, (c) 4.5 inch (11.4 cm): DIST 3 and (d) 6.5 inch (16.5 cm): DIST 4 and phase identification by EDX.
Coatings 12 01935 g003
Figure 4. (a) XRD pattern of the surfaces formed after different thermal spraying distance and (b) coating porosity and semiquantitative analysis of the IC phases present in the coatings as functions of the thermal spraying distance.
Coatings 12 01935 g004aCoatings 12 01935 g004b
Figure 5. SEM (SE mode) micrographs of cross-sections of the coatings with various substrate temperatures: (a) 200 °C: SUBTEM 1, (b) 450 °C: SUBTEM 2, (c) 550 °C: SUBTEM 3 and (d) 600 °C: SUBTEM 4 and phase identification by EDX. Red circles enclose porosity of the coatings.
Coatings 12 01935 g005
Figure 6. (a) XRD pattern of the surfaces formed with different substrate temperatures and (b) coating porosity and semiquantitative analysis of the intermetallic phases present in the coating as functions of the substrate temperature.
Coatings 12 01935 g006
Figure 7. SEM (SE mode) micrographs of the coatings (in cross-section) at various levels of postdeposition heat treatment using the flame spraying gun; (a) 0 gun passes: COATR 1, (b) 10 gun passes: COATR 2, (c) 15 gun passes: COATR 3 and (d) 20 passes: COATR 4, corresponding to surface temperatures of about 400 °C, 500 °C, 600 °C and 700 °C, respectively. Based on data of [28].
Coatings 12 01935 g007
Figure 8. (a) XRD pattern of the surfaces changing the postdeposition heat treatment (using data of [28]) and (b) coating porosity and semiquantitative analysis of the intermetallic phases in the coatings as functions of the postdeposition heat treatment of the coating: 0 passes: COATR 1; 10 passes: COATR 2; 15 passes: COATR 3; 20 passes: COATR 4.
Coatings 12 01935 g008
Figure 9. Effect of Ni content in the initial feedstock on the cyclic polarization behavior of nickel aluminide coatings. (a) Forward polarization curves; (b) cyclic (forward and reverse) polarization curves (3.5% NaCl, 25 °C).
Coatings 12 01935 g009
Figure 10. Effect of thermal spraying distance on the cyclic polarization behavior of nickel aluminide coatings. (a) Forward polarization curves; (b) cyclic (forward and reverse) polarization curves (3.5% NaCl, 25 °C).
Coatings 12 01935 g010
Figure 11. Effect of substrate temperature on the cyclic polarization behavior of nickel aluminide coatings. (a) Forward polarization curves; (b) cyclic (forward and reverse) polarization curves (3.5% NaCl, 25 °C).
Coatings 12 01935 g011aCoatings 12 01935 g011b
Figure 12. Effect of heat treatment of the coatings after thermal spraying on the cyclic polarization behavior of nickel aluminide coatings. (a) Forward polarization curves; (b) cyclic (forward and reverse) polarization curves (3.5% NaCl, 25 °C).
Coatings 12 01935 g012aCoatings 12 01935 g012b
Figure 13. Chronoamperometry plots of the nickel aluminide coatings at pseudopassive potentials (as determined by potentiodynamic polarization) varying: (a) the initial mixture composition (%wt. Ni), (b) the thermal spraying distance, (c) the substrate temperature and (d) the thermal treatment of the coating. All specimens were immersed in 3.5% NaCl at 25 °C.
Coatings 12 01935 g013
Figure 14. SEM of cross-section and EDX analysis of points 1–7 of nickel aluminide coating (COATR 7) after cyclic polarization in 3.5 wt.% NaCl at 25 °C. (a) low magnification for a general view, (b) magnification of the “square area” of (a), (c) magnification of the “square” area of (b), (d) area below the crevice of (c), (17)—EDX spectra of respective points in (c,d).
Coatings 12 01935 g014aCoatings 12 01935 g014bCoatings 12 01935 g014c
Table 1. Parameters of thermal spraying.
Sample Name →COMPO 1COMPO 2COMPO 3COMPO 4DIST 1DIST 2DIST 3DIST 4SUBTEM 1SUBTEM 2SUBTEM 3SUBTEM 4COATR 1COATR 2COATR 3COATR 4
Parameters
of Thermal
Spraying ↓
Composition Ni+Al, wt.%42.1 Ni 57.9 Al59.3 Ni 40.7 Al65.1 Ni 34.9 Al86.8 Ni 13.2 Al65.1 Ni 34.9 Al65.1 Ni 34.9 Al65.1 Ni 34.9 Al65.1 Ni 34.9 Al65.1 Ni 34.9 Al65.1 Ni 34.9 Al65.1 Ni 34.9 Al65.1 Ni 34.9 Al65.1 Ni 34.9 Al65.1 Ni 34.9 Al65.1 Ni 34.9 Al65.1 Ni 34.9 Al
Particle size Al, μm75–10075–10075–10075–10075–10075–10075–10075–10075–10075–10075–10075–10075–10075–10075–10075–100
Spray distance, cm (inch)11.4 (4.5)11.4 (4.5)11.4 (4.5)11.4 (4.5)3.8 (1.5)6.4 (2.5)11.4 (4.5)16.5 (6.5)11.4 (4.5)11.4 (4.5)11.4 (4.5)11.4 (4.5)11.4 (4.5)11.4 (4.5)11.4 (4.5)11.4 (4.5)
Ratio O2/C2H21.561.561.561.562.392.392.392.391.521.521.521.521.561.561.561.56
Substrate temperature, °C450450450450200200200200200450550600450450450450
Number of gun passes for heat treatment10101010--------0101520
Table 2. Gibbs free energies of formation and free enthalpies of formation of some nickel aluminides [53,54,56,57].
ReactionGibbs Free Energy of Formation ΔGf0 (kJ·mol−1)Free Enthalpy of Formation ΔHf0 (kJ/mol), T = 298 K
Ni + 3Al → NiAl3 −166.8−114.4
2Ni + 3Al → Ni2Al3 −311.0−170.9
Ni + NiAl3 → Ni2Al3 −144.1-
Ni + Al → NiAl−133.0−117.4
3Ni + Al → Ni3Al −167.8−153.3
Table 3. Electrochemical values of the coatings immersed in 3.5% NaCl at 25 °C: Effect of powder composition.
SampleInitial Mixture Ni + Al, wt.%Ecorr (mV vs. Ag/AgCl)Ea/c tr (mV vs. Ag/AgCl)Ecp (mV vs. Ag/AgCl)Eb (mV
vs. Ag/AgCl)
Er (mV
vs. Ag/AgCl)
icor (mA/cm2)R2bc (mV/decade)
Compo 142.1 Ni 57.9 Al−595 (±120)−456 (±108)−441 (±95)−203 (±67)-0.047 (±0.021)0.982 ± 0.004−663
Compo 259.3 Ni 40.7 Al−344 (±45)−382 (±34)-340 (±41)339 (±35)0.011 (±0.005)0.992 ± 0.008−684
Compo 365.1 Ni 34.9 Al−326 (±28)−375 (±33)--−105 (±19)0.023 (±0.007)0.980 ± 0.002148
Compo 486.8 Ni 13.2 Al−337 (±26)−371 (±29)−250 (±18)−192 (±23)−108 (±11)0.035 (±0.010)0.970 ± 0.00947
Ecor: corrosion potential; Ea/c tr: anodic-to-cathodic transition potential; Ecp: critical “passivation” potential; Eb: breakdown potential; Er: potential at which positive hysteresis turns to negative; icor: corrosion current density; R2: regression coefficient of the linear fit; bc: cathodic Tafel slope.
Table 4. Electrochemical values of the coatings immersed in 3.5% NaCl at 25 °C: Effect of spray distance.
SampleSpray Distance,
cm (inch)
Ecor (mV vs. Ag/AgCl)Ea/c tr (mV vs. Ag/AgCl)Er (mV vs. Ag/AgCl)icor (mA/cm2)R2bc (mV/decades)
DIST 13.8 (1.5)−626 (±112)−592 (±129)-0.023 (±0.014)0.994 ± 0.005−437 (±54)
DIST 26.4 (2.5)−600 (±46)−641 (±22)−511 (±25)0.015 (±0.004)0.998 ± 0.002−333 (±87)
DIST 311.4 (4.5)−540 (±62)−638 (±58)−327 (±49)0.021 (±0.003)0.994 ± 0.006−473 (±32)
DIST 416.5 (6.5)−591 (±29)−644 (±36)−318 (±23)0.058 (±0.011)0.996 ± 0.003−244 (±112)
Ecor: corrosion potential; Ea/c tr: anodic-to-cathodic transition potential; Er: potential at which positive hysteresis turns to negative; icor: corrosion current density; R2: regression coefficient of the linear fit; bc: cathodic Tafel slope.
Table 5. Electrochemical values of the coatings immersed in 3.5% NaCl at 25 °C: Effect of substrate temperature.
SampleSubstrate Temperature, °CEcor (mV vs. Ag/AgCl)Ea/c tr (mV vs. Ag/AgCl)Er (mV vs. Ag/AgCl)Eb (mV vs. Ag/AgCl)Ecp (mV vs. Ag/AgCl)icor (mA/cm2)R2bc (mV/decades)
SUBTEM 1200 °C−602 (±98)−640 (±110)−474 (±40)--0.013 (±0.005)0.997 (±0.003)−351 (±34)
SUBTEM 2450 °C−617 (±74)−655 (±86)−557 (±53)--0.016 (±0.006)0.989 (±0.007)−437 (±48)
SUBTEM 3550 °C−607 (±112)−607 (±99)--177 (±71)0.022 (±0.010)0.993 (±0.005)−401 (±26)
SUBTEM 4600 °C−598 (±88)−514 (±94)-−283 (±34)-0.022 (±0.012)0.992 (±0.008)−478 (±19)
Ecor: corrosion potential; Ea/c tr: anodic-to-cathodic transition potential; Er: potential at which positive hysteresis turns to negative; Eb: breakdown potential; Ecp: critical “passivation” potential; icor: corrosion current density; R2: regression coefficient of the linear fit; bc: cathodic Tafel slope.
Table 6. Electrochemical values of the coatings immersed in 3.5% NaCl at 25 °C: Effect of heat treatment.
SampleThermal Treatment (Gun Passes)Ecor (mV vs. Ag/AgCl)Ea/c tr (mV vs. Ag/AgCl)Eb (mV vs. Ag/AgCl)Er (mV vs. Ag/AgCl)ip (mA/cm2)
COATR 10−574 (±78)−416 (±82)−247 (±39)-20 (±3)
COATR 210−291 (±65)−383 (±68)−238 (±45)−69 (±11)22 (±5)
COATR 315−289 (±48)−376 (±56)−205 (±68)−105 (±29)23 (±6)
COATR 420−298 (±53)−391 (±69)−188 (±44)−34 (±13)24 (±8)
Ecor: corrosion potential; Ea/c tr: anodic-to-cathodic transition potential; Eb: breakdown potential; Er: potential at which positive hysteresis turns to negative; ip: current density range in the middle of the final pseudopassive region. (icor could not be determined because of low R2 values).
Publisher’s Note: MDPI stays neutral with regard to jurisdictional claims in published maps and institutional affiliations.

