Article

Improving the Efficiency of Metalworking by the Cutting Tool Rake Surface Texturing and Using the Wear Predictive Evaluation Method on the Case of Turning an Iron–Nickel Alloy

Department of High-Efficiency Machining Technologies, Moscow State University of Technology STANKIN, Vadkovskiy per. 3A, 127055 Moscow, Russia
*
Author to whom correspondence should be addressed.
Coatings 2022, 12(12), 1906; https://doi.org/10.3390/coatings12121906
Submission received: 9 November 2022 / Revised: 1 December 2022 / Accepted: 2 December 2022 / Published: 6 December 2022
(This article belongs to the Special Issue Technologies of Coatings and Surface Hardening for Tool Industry II)

Abstract

:
The article proposes and substantiates the function of predictive evaluation using the criterion of the relative efficiency of using a cutting tool with a microtextured rake surface based on tangential force and cutting temperature. Comprehensive durability tests carried out under various processing modes with the measurement of heat power parameters made it possible to create an experimental base for mathematical modeling. An empirical model of cutting parameters based on modified multiplicative functions with non-constant indicators in the form of linear dependencies on processing factors was used based on planning an experiment for processing a heat-resistant alloy for predictive wear assessment in order to determine rational cutting modes. Predicting the rational use of a cutting tool with a microtextured work surface made it possible to obtain a 1.3-fold increase in durability.

1. Introduction

Approaches to improving the efficiency of blade processing are quite diverse. They can associate with the use of new cutting strategies, the development of new tool materials and systems, progressive lubricating and cooling technological means (LCTM), and methods of modifying the working surfaces of the tool, which are one of the foremost modern directions for improving efficiency. At the same time, approaches are used for surface alloying [1,2], application of protective wear-resistant coatings [3,4,5,6,7], and various kinds of energy effects designed to provide the required structural and chemical changes or to affect the macro- and micro-geometry of the instrument [8,9,10].
The influence of microtexturing of the tool surface on the nature of the cutting process has also been the object of research by several scientists [11]. In these works, various methods of obtaining microtextures and their influence on the cutting process during the processing of steels, aluminum, and titanium alloys with and without lubricants are studied, and practical recommendations on micro geometry of textures are proposed, taking into account the thermal and mechanical factors. All these approaches achieve the goal of improving the machinability of materials and tool durability by reducing cutting forces, residual stresses, cutting temperature, friction forces, chemical activity of the material, etc. However, all these effects, being in close interaction, have different effects on the final wear of the tool and its durability period [12].
Many authors emphasize the fact that various LCTMs are better held in the microtexture on the tool surface. It is a kind of lubricating microchannel directly in the contact zone with the processed material, which influences the microtextures on the force and coefficient of friction between the materials of the workpieces and the tool.
In [13], Lei S. with co-authors, laser processing is used to obtain micro-holes on the hard alloy surface. Deng et al. [14] used a similar approach to create lubrication micro-reserves in the cutting zone. The work of Z. Wu et al. [15] investigated a way to increase the efficiency of titanium alloy processing by applying microtextures on the rake surface to retain lubrication and remove excess heat from the tool. Additionally, in other similar works [16,17,18,19,20], there is a decrease in the chip contact length by up to 30% compared to the original tools, which is associated with a reduction in friction forces as the effect of surface modification. These studies showed a reduction in cutting forces and a decrease in the adhesion to the processed material. Moreover, the effect was more pronounced for high cutting speeds and perpendicular arrangement of texture lines concerning the trajectory of the chip.
In the works of Deng J et al. [21], it suggested that the positive effects caused by the presence of microtextures, in the form of a decrease in cutting temperatures, can shift the zones of rational processing modes and lead to an increase in the effects of build-up due to reduced temperatures. It found [17] that tools with a combed microtexture filled with a solid lubricant reduce the cutting temperature by 5–15% at a high cutting speed (>120 m/min). Wu Z. et al. [15] reduced the cutting temperature by 15–20% using a specially designed cutting tool. Fatima A. et al. [22] showed that the groove textures reduce the tool temperature by 12% at lower cutting speeds compared to non-textured tools.
However, despite a significant number of publications, the systematic justification of various physical–chemical, thermal, tribological, and other phenomena explaining the effects of microtexturing of the working surfaces of the tool from the standpoint of the theory of cutting materials have not developed sufficiently. The issues of creating microtextures with parametric relief on the surface of the tool providing a change in the conditions of contact interaction with the processed material need additional studies. In addition, microtextured tool processing processes were experimentally studied for a limited range of processed materials. For example, the methods of cutting difficult-to-process iron–nickel-based alloys with such a tool, which widely used manufacturing of critical products of aviation and other high-tech industries, remain practically unexplored. There are almost no methods of the microtextured tool area’s practical application predictive assessment.
It will be necessary to obtain analytical dependences of microtexturing parameters on turning modes for a predictive assessment. It is quite difficult to say exactly which effects will be prioritized for making certain assumptions and constructing an adequate theoretical dependence. As a basis, it was decided to base on empirical models for the cutting force and temperature depending on the cutting parameters. It is required to determine the relationship of the selected parameters of the tangential cutting force (Ft) and temperature ( Θ ) with the wear resistance of the cutting tool and select an evaluation criterion to create any predictive assessment of the operation of a microtextured tool and its wear resistance.
In this paper, it is proposed to use a complex indicator for considering the combined influence of temperature and tangential cutting force in the form of a product of these values to study the nature of the cutting process. It is proposed to evaluate the influence of these factors precisely by their product and not by their values individually since the larger the product, the greater the destructive effect of the impact of cutting conditions on the tool.

2. Materials and Methods

2.1. Tool and Workpiece

An increase in the processing efficiency of the hard-to-process iron–nickel alloy C0.3Cr15Ni35Mo7Mn7Fe is investigated in this work. It has a low thermal conductivity, provoking increased cutting temperatures, high strength, and mechanical hardenability during processing, complicating the cutting process and causing increased wear—also, this material contributes to increased build-up during the cutting process.
When conducting field studies on the effect of processing modes of speed, feed, and cutting depth on the cutting force and temperature for the initial tool and tool with a microtextured front surface, as well as using wear-resistant coatings, standard experimental methods were used. The tests were carried out on a universal turning machine model CU 500 M (ZMM, Sliven, Bulgaria). The machine has a spindle speed that smoothly changes the thyristor converter and sets the required cutting speed.
A blank with a diameter of 150 mm and a length of 600 mm is used when turning. Before taking measurements, the workpiece is pressed by a rotating center and pre-ground to eliminate runouts. The TK20 Sandvik alloy was selected after preliminary wear resistance tests. Square cutting plates with a flank angle of 11° and a radius at the apex of 1.2 mm of the SPGN 120, 312 shapes suitable for processing materials from the group of heat-resistant and iron–nickel alloys selected as a tool for turning. A holder for replaceable cutting plates with a rake angle of 0° and a plan angle of 45° was selected.

2.2. Microtexture Application

In this work, a laser method for producing microtextures was tested. In all tested modes, at the accepted band boundaries, there are deposits left over from the liquid phase displacement from the treatment zone as a result of the explosive evaporation of the hard alloy. In Figure 1, the appearance of growths at the borders of the grooves is noticeable due to the displaced liquid phase during the treatment with the U-15 nanosecond laser (RMI Laser LLC, Lafayette, LA, USA). Such zones may indicate the presence of undesirable temperature effects on the material and possible changes in the structure and composition of the material in the processing zone, as well as have a retarding effect on the chip coming off, causing the appearance of secondary cutting edges in the path of its coming off.
Each of the methods of applying microtexture has its drawbacks. The complexity of the indentation method lies in the fact that it is necessary to take into account factors related to the strength and flexibility of the material of the textured tool, its resistance to deformation and the effect of force on the cutting edge when moving to the actual drawing on the surface.
The shape and depth of the print will primarily depend on the indenter used. The most common and available options are Vickers and Berkovich indenters. Accordingly, in the first case, patterns of a square section are obtained, and in the second, in the form of a regular triangle. At the same time, the indentation process assumes that the adjacent prints do not intersect, and the surface is flat and perpendicular to the indenter for uniform immersion in the material and exclusion of non-axial loads on the indenter, which can lead to chipping of the pointed tip. As a result, many individual prints standing at some distance from each other can be obtained. If the depth of indentation is set constant for all prints, then the defining requirement for the texture geometry is the requirement of print structure parametric ordering, which allows for easy automation from a software (Qpix control version 2) point of view of its creation on the tool surface.
It is possible to increase or decrease the surface treatment density by changing the parameters of the fingerprint structure. A one-parameter task is preferable, in which it proposed to arrange rows of prints in two, creating pseudo-bands of dense relief areas with mutually overlapping zones on the chip escape path at the maximum possible packing density. The size of the overlap of the lines is determined by the indentation and a fixed constant step.
The Qness 10A microhardness meter (Qness Gmbh, Golling, Austria) with a Vickers indenter used (Figure 2) as equipment for applying microtextures to the surface of the cutting plates, this equipment allows performing micro indentation on a selected site in automatic mode with a load value chosen. Since the selected plates have a rear angle, and the indentation took place perpendicular to the front surface in the vicinity of the cutting edge above the overhanging part, the plates were glued to the device holder for the time of indentation.
A force of 20 N selected. This load made it possible to obtain square-shaped prints with a width of 30 µm, a diagonal of 40 µm, and a maximum depth of 7 µm. The maximum density of tracks, which was took into account the limitations on positioning accuracy, was 50–60 µm between the centers (Figure 3).
Another limiting factor is the allowable distance to the cutting edge. It noted that the edge chipping during indentation could occur after injection at a distance of 50–70 µm. Therefore, the minimum space to the cutting edge of 100 µm is limited. The following parameter that was tried to account for during the application of microtexture is the microtexture pattern orientation concerning the cutting edge and the chip trajectory.
One of the expected effects is the function of micro-reserves for lubrication, which helps the lubricants to be held directly in the cutting area. Based on tests on various turning modes, conclusions drawn about the active contact zone of the chip and the tool with a length of 0.5–0.6 mm. It decided to take this value into account when applying microtextures to the tool surface when determining the size of the processing zone to ensure the lubricant operation over the entire contact surface in the cutting zone.
Additionally, the option of using different step densities of prints was tested when choosing the parameters of microtextures, both in terms of the step size between individual bands and when varying the step between unique prints as part of bands. During the trial tests, it was decided to focus on applying textures in the form of strips with an interval between them, approximately equal to the width of the strip, and a step between the prints of 60 µm. A lower density of microtextures ceased to have a noticeable effect on the cutting process, and a denser one sometimes enhanced the formation on the rake surface (Figure 4).
The possibility of combining various methods of tool modification in the form of microtexturing of the surface with a wear-resistant coating was studied. Wear-resistant coatings were applied on the Platit p311 installation (PLATIT AG, Selzach, Switzerland).
The main problem when applying prints to the surface of plates with wear-resistant coatings may be insufficient adhesion of coatings to the substrate and their cracking and peeling. The multilayer coating nATCRo3 based on (TiCrAlSi)N proved the best. The nATCRo3 coating combined (CrTi)N and (AlTi)N layer sequence and an (AlTiCr)N/SiN nanocomposite coating. A two-phase structure of the last layer is constituted by (AlTiCr)N crystals with a grain size of up to 5 nm and is distributed equally to Si3N4 in the amorphous phase. The phase interfaces are the area of intensive dissipation of energy, diverging the cracks in the coating from their paths, and inhibiting their propagation rate, which leads to the hardening of the material. When indenting, it turned out to choose a variant of the microtexture density that did not cause the formation of noticeable micro-cracks on the surface of the plates. Plates with this kind of coating were tested in experiments.

2.3. Selection of Modes and Measurement of Processing Parameters

The processing modes were selected from the conditions of finishing turning with small feed (0.1, 0.125, and 0.15 mm/rev) and cutting depth values (0.3, 0.4, and 0.5 mm). The cutting speed (17, and 27 m/min) was chosen with the recommended values from the manufacturer of the cutting plates and subsequently changed for turning conditions of iron–nickel alloy blanks with a durability period of the initial plates of 30 min, for which preliminary tests were carried out.
In addition, during the tests, a universal motorized stereo microscope with the possibility of telecommunications Stereo Discovery V12 with a visualization system based on the Axiocam 503 Color video camera (Carl Zeiss AG, Jena, Germany) was used to monitor and photograph the final wear of the cutting plates after the tests.
The wear resistance of the cutting tool is characterized by its durability period T
T = l / V
where l is the cutting path with the appropriate blunting criterion hfcr and relative linear hoL and surface relative wear hoR:
h o L = h f f h f i l f l i ,
h o R = h f f h f i · 100 l f l i · S
where hfi, li, and hff, lf are the initial and final wear values along the back surface and the cutting path, respectively.
The cutting plate failure criterion during resistance tests was hfr = 0.4 mm.
Temperature measuring during the cutting process is an ambiguous task with many features and approaches to solve it. In this regard, many methods of varying degrees of complexity for measuring this parameter. A natural thermocouple method is used based on the principle of the occurrence of a potential difference at the point of contact of different materials of the tool and the workpiece under the influence of the cutting temperature. However, this method of temperature measurement is characterized by complex calibration tests in the case of surface modification that changes their thermophysical parameters.
At the same time, to reduce measurement errors, the workpiece and the cutting tool isolated from other mechanical devices to reduce spurious signals. The measurement and fixation of the cutting temperature were carried out under a well-established cutting process at the interval of 10 s after cutting the tool into the workpiece. A current mercury collector and a digital voltmeter INSTEK GDM-8246 (Good Will Instrument Co., Ltd, Kaoshiung, China), which allows recording voltage up to 0.1 mV, are used to measure the thermo-EMF signal. The scheme for measuring the values of the average cutting temperature during turning tests shown in Figure 5.
The experiments were conducted to determine the components of the cutting force on a three-component dynamometer of the company Kistler model 9253B23 (Winterthur, Switzerland) to study the nature of the dependencies of cutting forces on the investigated method of modifying the surface of the cutting tool and cutting modes.
As noted above, the effect of microtextures on the cutting process is best manifested in the presence of LCTM due to better penetration and retention of these lubricants in the processing zone. Therefore, in the course of experimental studies on turning an iron–nickel alloy with carbide plates with a textured and initial surface, processing options in the absence of lubricants were considered.
As a result of these studies, it was impossible to achieve a noticeable improvement in the cutting conditions of the tool with microtexture. The considered rake surfaces of the plates showed a more significant build-up for a tool with microtextures than for the original instrument in the same processing modes. Additionally, the durability period of the modified plates under dry friction conditions turned out to be lower than for the original version of the tool.
It was decided to use dry molybdenum disulfide lubricant, which was previously applied to the rake and flank surfaces of the plates using Molykote D-321 when conducting experiments to study the properties of microtextured plates. The results of field experiments during turning have shown that such a lubricant can indeed linger in the crater of the microtexture on the cutting plate rake surface in the area of contact with the chips of the processed material. Thus, the microtextures can act as reservoirs for lubricants, feeding a dosed grease into the processing zone, and improving friction conditions (Figure 6). These modes tested for plates in the initial state, with microtexture on the rake surface, with coating, and with microtexture on the coating.

3. Results and Discussion

3.1. Determination of Cutting Process Parameters

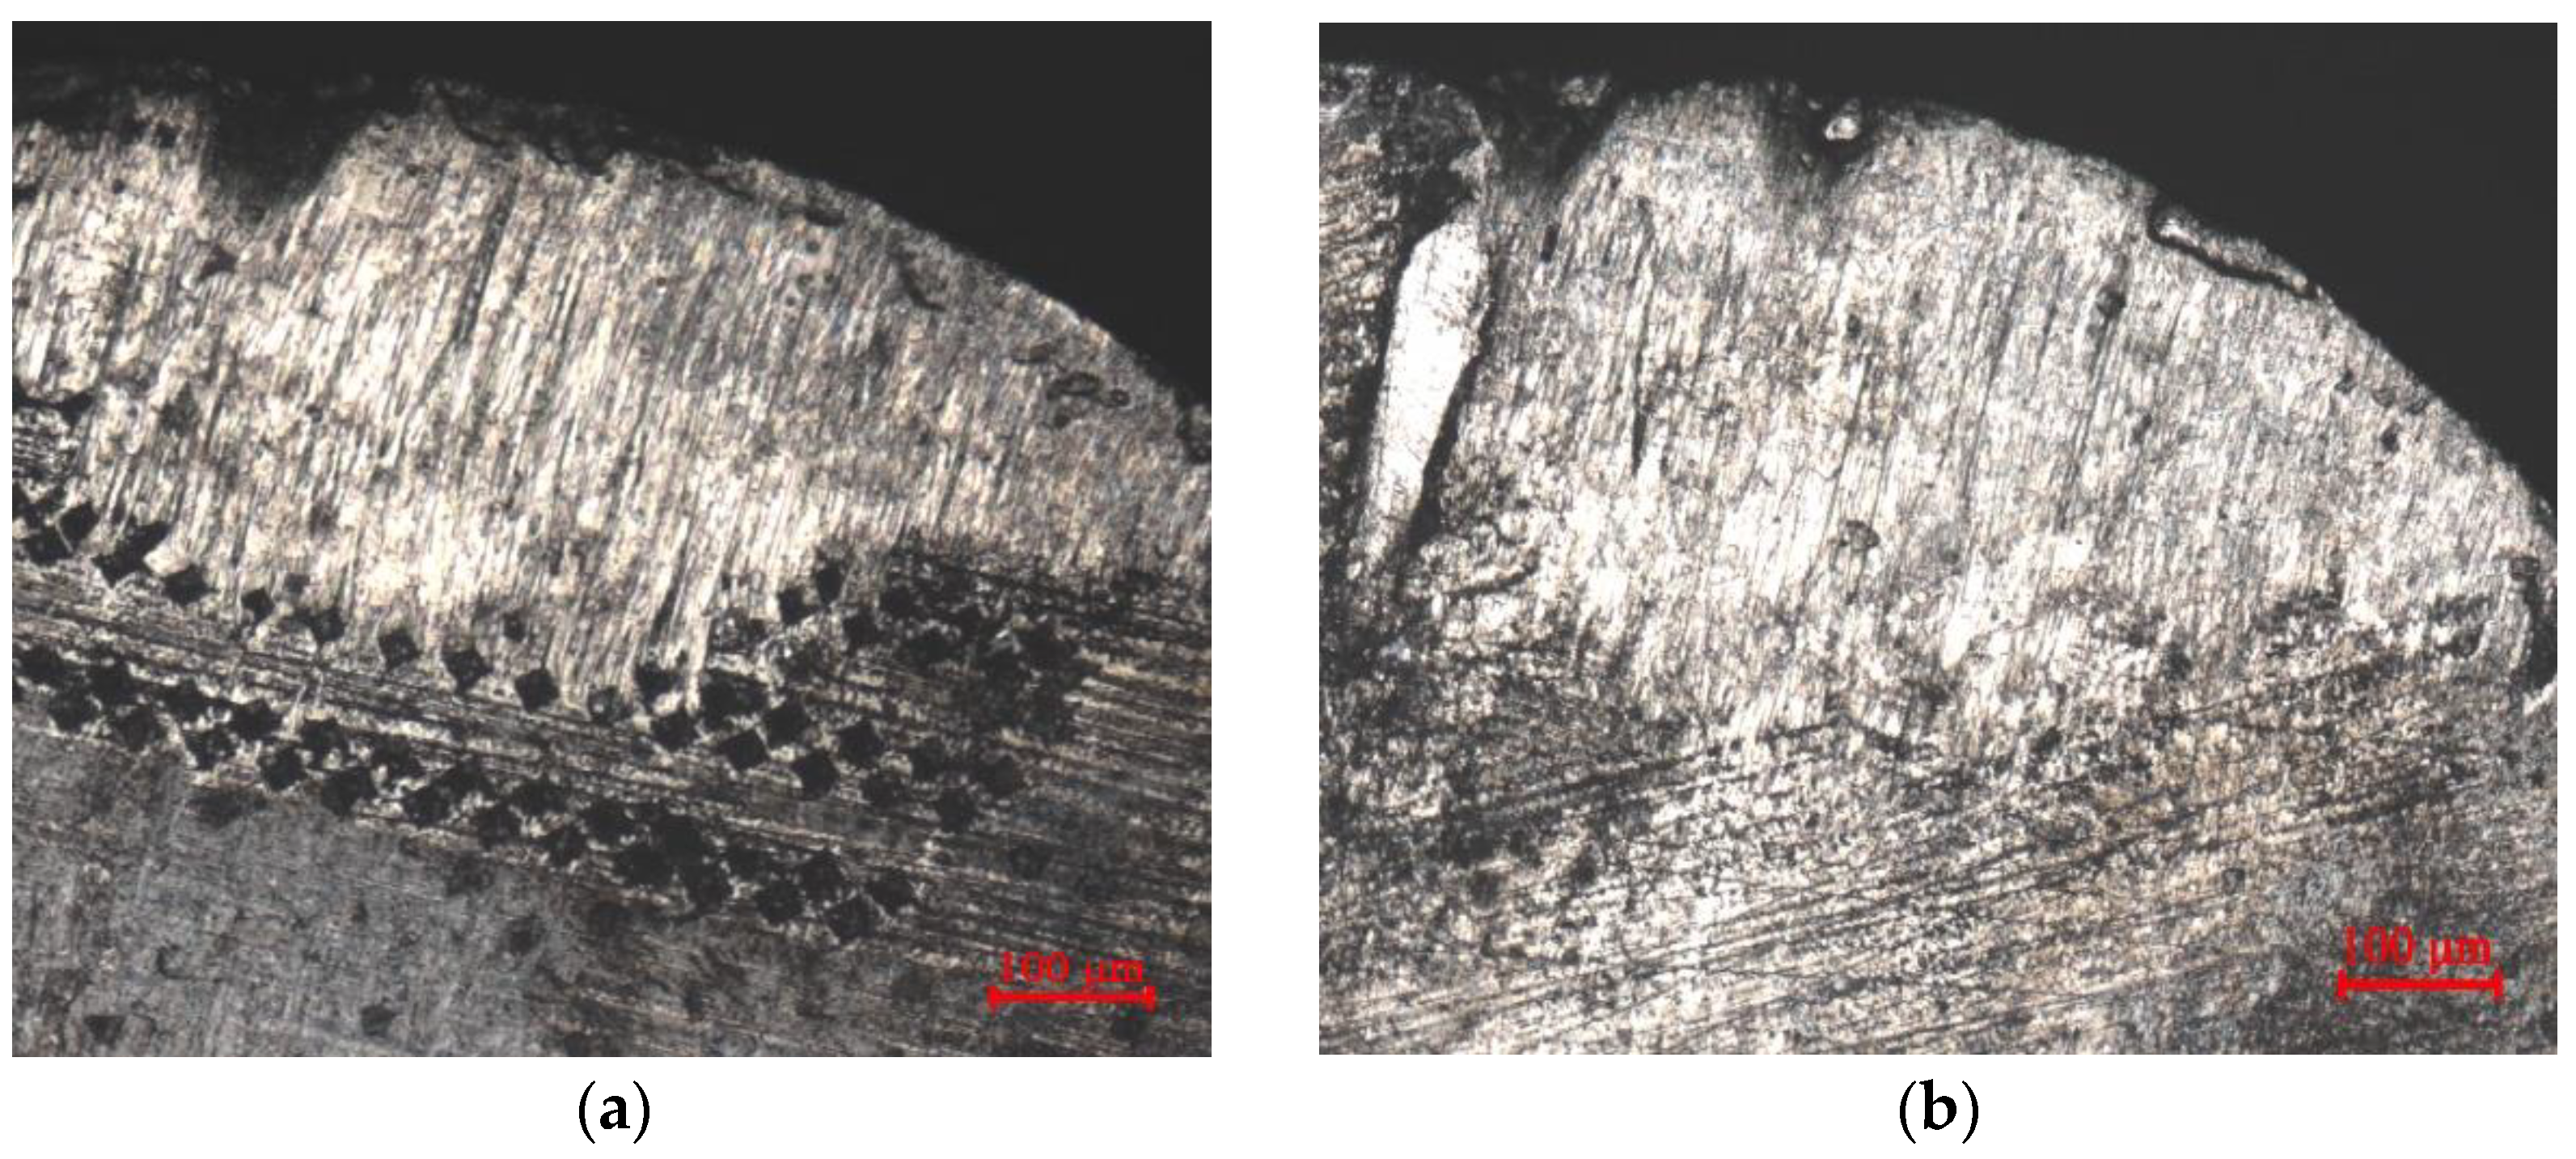
The active formation of growths on the front surface of the tool and, as a consequence, adhesive wear is characteristic when processing heat-resistant alloys with a carbide tool. The adhesive wear prevails over other types of wear at a specific range of cutting temperatures [23,24]. The growth zone has characteristic boundaries that repeat the geometry of the rake surface microtexture, unlike a tool without it (Figure 7).
This phenomenon limits the growth zone. The cutting process becomes more controlled. Moreover, the tool surface after the growth zone in the presence of microtexture looks cleaner, without traces of adhesive setting of the material, than without microtexture on the rake surface. It is also possible to notice a closer location of scraps of solid grease residue in the presence of microtexture, which may indicate a shorter chip contact zone with the front surface of the tool.
All these effects, to one degree or another, had reflected in the same way on the cutting process parameters as cutting force and temperature. In contrast to the cutting forces, the temperature values in the cutting zone are pretty problematic to measure directly. In the applied natural thermocouple method, it is possible to talk only about the overall temperature of the cutting process. However, it is possible to compare the efficiency of the process between different tool modifications under the same processing modes even based on such an indicator.
In the results of the experiments on recording the cutting temperature presented in Figure 8 and Figure 9, in addition to the characteristic increase in temperature, one can notice the difference between tools with different surface properties. In this case, modifications separately in the microtexture on the rake surface and coatings without microtexture show very similar results and overlap in places. The combination of these modifications gives a more pronounced drop in cutting temperature.
On the one hand, the microtexture keeps the lubricant in the cutting zone and thereby affects the friction force and the interaction of the tool and workpiece materials. However, as a rule, wear-resistant coatings have the same effect on the cutting process [25,26]. Namely, they reduce the coefficient of friction and are chemically resistant. On the other hand, it can assume that the company of microtextures contributes to a reduced setting between the material of the workpiece and the tool.
It was decided to focus on studying the changes in the tangential component of the cutting force, as a force that indicates the amount of energy transferred from the machine drives to the processing zone to complete the cutting process and chip formation, and this component used to judge the nature of the cutting process when measuring the cutting forces.
In the conducted experiments, lower values of the tangential component of the cutting force are shown by a tool with a coating and the microtexture on the rake surface. Individually, these modifications showed themselves differently with a change in feed and depth of cut. With increasing cutting depth, the tool with microtexture showed values of the tangential component of the cutting force closer to the tool in the initial state, while the coated tool showed lower values (Figure 10).
On the other hand, the change in feed per revolution caused similar changes in the tangential component of the cutting force between a tool with a microtexture on the rake surface and a tool with a coating (Figure 11).
It is problematic to unambiguously judge the results of measuring the tangential component of the cutting force. The change in the cutting depth, in this case, may have a different effect on the component of the cutting force due to the influence of microtexture. However, with the same processing depth, the chip escape trajectory was constant, and when the feed changed, only the number of microtexture strips involved altered. In contrast, the effect of the microtexture effect was more stable.
There are similar patterns in a coated tool and a tool with a microtexture on the rake surface if we judge the changes in the component of the cutting force by the change in feed. It is also possible to point out the mutual addition of the effects affecting the tangential part of the cutting force when combining options for modifying tools by coating and then applying microtexture to the coated cutting surface.
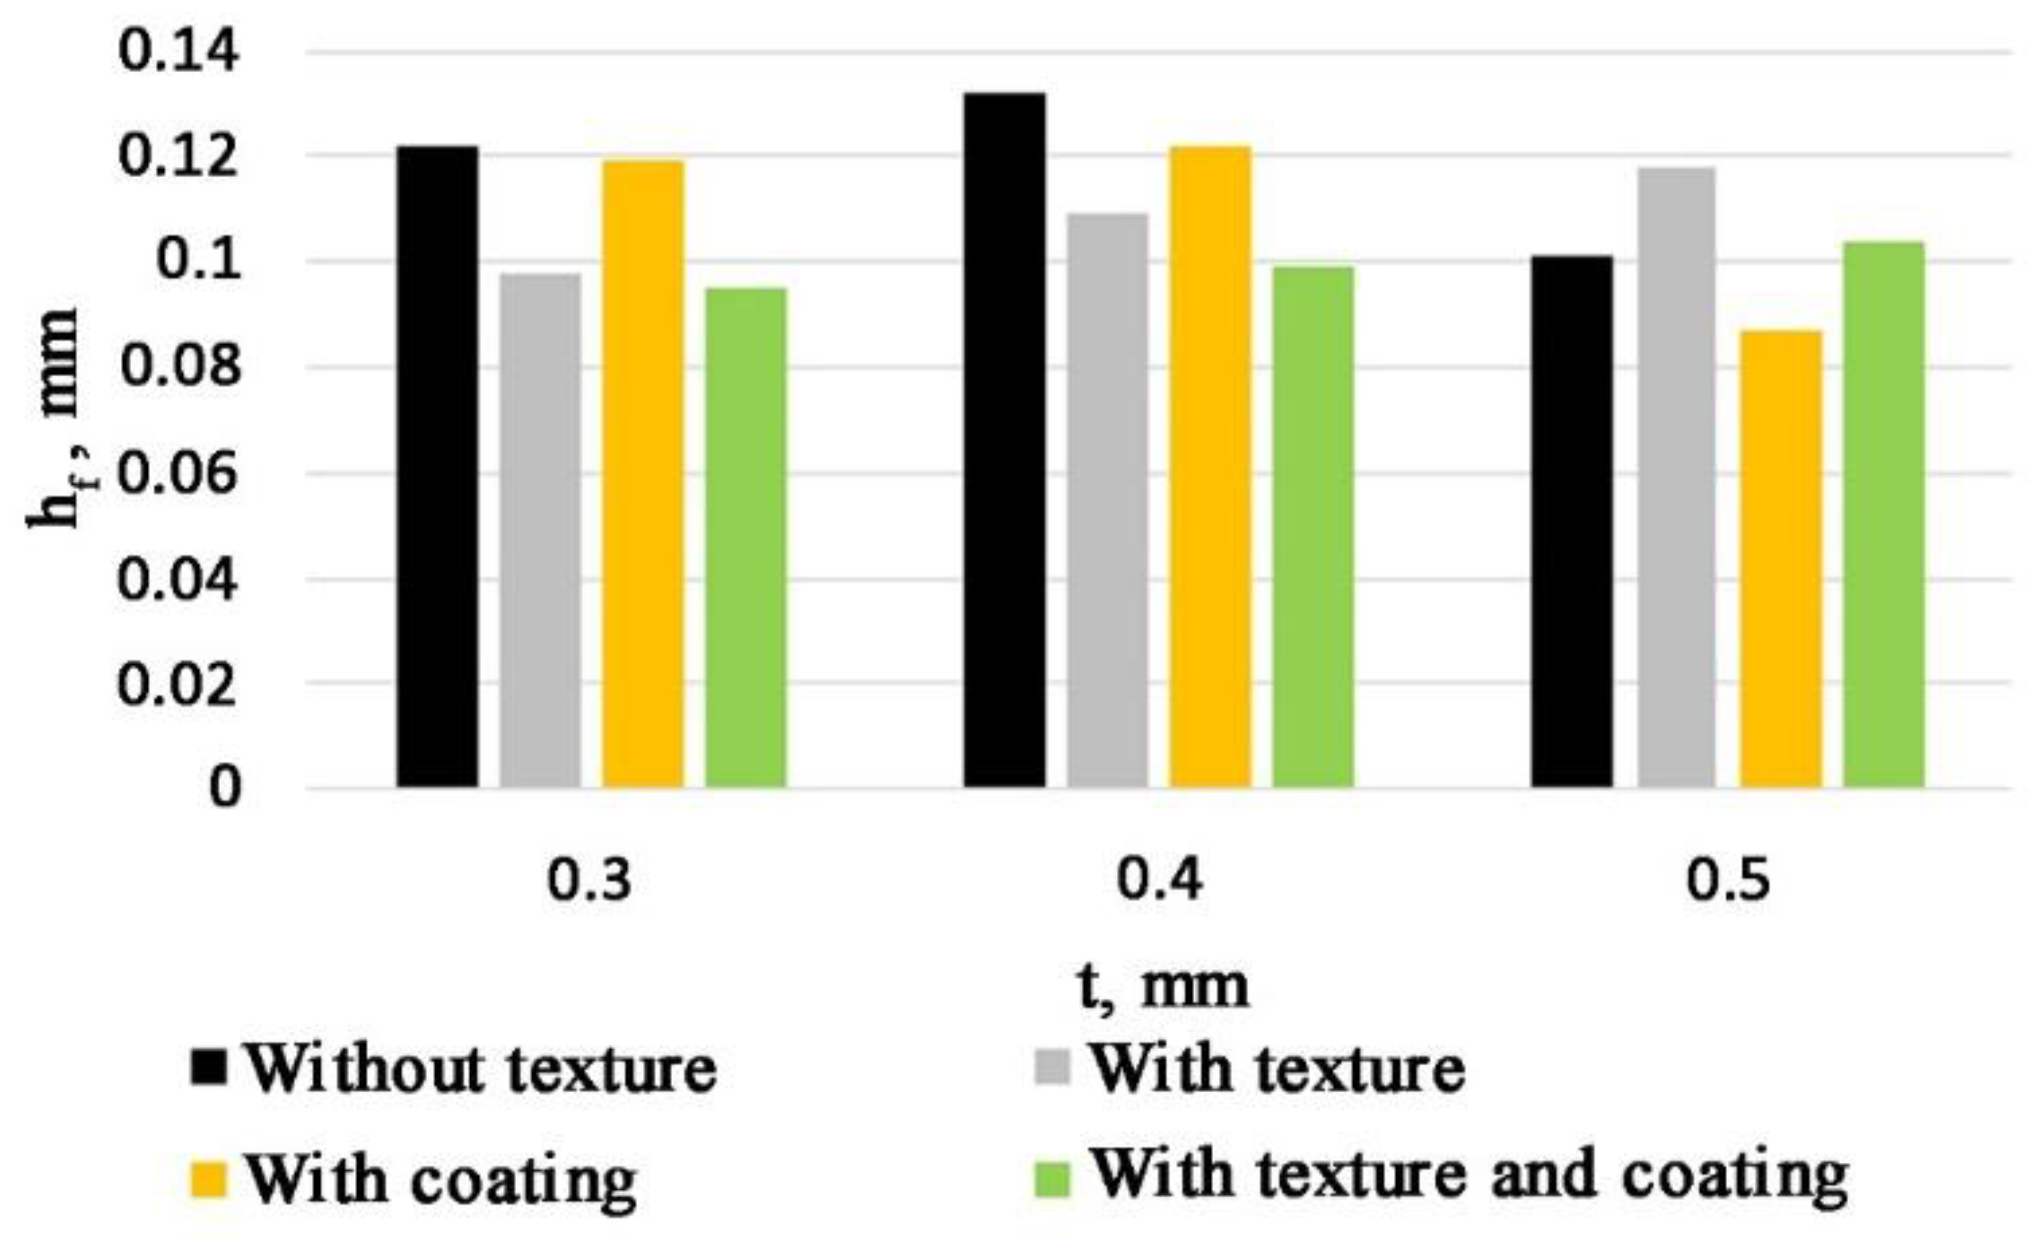
An important wear parameter is worn on the flank surface due to small cross-sections of the cut when turning finishes. The results of measuring the wear of various tools are shown in Figure 12 and Figure 13. On these dependencies, we can note the increased durability of the tool, which has both surface modifications in the form of microtexture and coating.
The study of the plate flank surface after turning shows that the wear chamfer of the original tool turned out to be broader than that of the textured one. Moreover, the slope of this chamfer also turned out to be ample for the original tool, which indicates more intensive dimensional wear of such cutting plates compared to plates having a textured surface. Thus, after the conducted research and experimental results, it concluded that the microtexture on the rake surface of the cutting plates allows influencing the friction and the adhesion zone, which has a positive effect on the temperature, and cutting force reduces tool wear.
There are summarized data obtained as a result of consistent experiments in Table 1, having considered the features and patterns of the influence of various types of modification of the tool surface on the processing process. The processing modes that formed the experimental base selected take into account the matrix of the practical plan described above. The force, cutting temperature, and current wear on the flank surface were recorded. These data from field experiments formed the basis for constructing the predictive evaluation function.

3.2. Predictive Assessment of the Microtexturing Effect on Wear Resistance

The established practice of constructing empirical models for cutting parameters suggests using the multiplicative dependence of the studied parameter for modeling through processing modes of the form:
F t = C V a 1 S a 2 t a 3
where t—is the cutting depth, S—is the feed per revolution, V—is the cutting speed, and C is the coefficient that takes into account the features of this pair of materials [27].
A similar expression is given for the cutting temperature θ.
At the same time, it assumed that the nature of the change in cutting forces and temperatures is monotonous. These values either grow monotonically or decrease monotonically. This type of change is usually well described by parabolic or hyperbolic curves, which are conveniently approximated by power functions. The values of the exponents and express the dependence of the change in the parameter under study on the processing modes can be obtained having formed an experimental plan for this type of model with the alternating iterations of processing modes.
However, it is difficult to assess the nature of the change in cutting parameters when there is a discrete microtexture on the rake surface. Changes in feed modes and cutting depth can have an unpredictable effect on the parameters under study. Changing the width and depth of cutting entails changes in the contact point. The entry into the cutting process of new discrete microtexture elements or the exit of individual components from the contact spot is likely to complicate the dependence (4) seriously when there is a microtexture on the rake surface, which consist of individual elements characterized by directivity, the density of layout, etc.
Based on this assumption, consider a variant of the empirical form of the model, where exponents of degrees are functions of the feed and depth of cut. Then, the model for the cutting force takes the following form:
F t = C V a 1 S , t S a 2 S , t t a 3 S , t
After the logarithm of this expression, a function comes to the following form:
ln F t = ln C + a 1 S , t ln V + a 2 S , t ln S + a 3 S , t ln t
In the resulting expression, we have the dependence of the cutting force logarithm on the cutting modes and coefficients logarithms, which are a function of the reliance on the feed and cutting depth. Let us rewrite (6), bringing all dependencies to a single form of logarithmic argument functions:
ln F t = ln C + a 1 ln S , ln t ln V + a 2 ln S , ln t ln S + a 3 ln S , ln t ln t
The expression (4) has the same type of parameters, reduced to the dependence of the cutting force logarithm on the processing modes logarithms:
ln F t = f ( ln V , ln S ,   ln t )
This function of dependence on the logarithms of the processing mode is represented as a polynomial for regression analysis, limited to the second order of nonlinearity:
ln F t = ln C + a 1 ln V + a 2 ln S + a 3 ln t + a 4 ln 2 S + a 5 ln 2 t + a 6 ln V ln S + a 7 ln V ln S + a 8 ln S ln t
Thus, we can obtain an analytical dependence of the logarithm of the cutting force on the logarithms of the processing modes having further carried out the process of determining the coefficients of this expression using regression analysis, and by potentiating, we obtain a model of the cutting force of the following type:
F t = C V a 1 S a 2 + a 4 ln S + a 6 ln V + a 8 ln t t a 3 + a 5 ln t + a 7 ln V
Conducting similar reasoning for the cutting temperature, we obtain its model in the form:
θ = C V b 1 S b 2 + b 4 ln S + b 6 ln V + b 8 ln t t b 3 + b 5 ln t + b 7 ln V
As a result, we obtain models of thermal force factors that allow the possibility of mutual changes in processing modes and power coefficients when determining temperatures and cutting forces. When considering the effective use of a microtextured tool under specified cutting conditions, as a result of comparing it with a tool without texture, we introduce a criterion for evaluating relative efficiency based on the following functionality:
I % = F t θ t F t θ
where (Ftθ)t is the product of the tangential component of the cutting force and the cutting temperature for the textured tool, and Ftθ is the product of the force tangential component and temperature for the original tool. At the same time, the criterion itself (the area of effectiveness of the microtextured tool) is determined by the inequality:
I % S , t , V < 1
This hypothetical assumption will be tested during experimental studies and becomes confidential. The value of I% is a predictive estimation function. To construct this value, we based it on the empirical dependencies of the cutting force and temperature in expressions (10) and (11). Let us consider the source of determining the numerical values of the coefficients for the models of cutting force and temperature before proceeding to determine the final type of expression (12). We will find these coefficients by conducting a factor experiment with a complete search of the feed and cutting depth, interval selection of speed, and calculation of values using the least squares method in the form:
A = G T G 1 G T Y
where A is the vector of the desired coefficients of the models of the form (a0, a1, a2 …), G is the formed matrix of the experiment plan with encoded values of variables and their mutual enumeration, Y is the vector of the results of the investigated quantity importance (cutting force or temperature) for each combination of processing modes under the experiment plan.
First, let us consider the procedure for calculating the coefficients for the cutting force. We reduce the initial form of the chosen multiplicative model Equation (10) to a polynomial form using a logarithm. As a result, we obtain an expression of the following form:
ln F t = ln C + a 1 ln V + a 2 ln S + a 3 ln t + a 4 ln 2 S + a 5 ln 2 t + a 6 ln V ln S + a 7 ln V ln S + a 8 ln S ln t
As a result, we obtain a polynomial whose coefficients can found using regression analysis. At the same time, the logarithm of the correction factor ln(C) will be the zero coefficient of the regression model. Let us rewrite the logarithm expression in the following form:
ln F t = a 0 + a 1 ln X 1 + a 2 ln X 2 + a 3 ln X 3 + a 4 ln 2 X 2 + a 5 ln 2 X 3 + a 6 ln X 1 ln X 2 + a 7 ln X 1 ln X 3 + a 8 ln X 2 ln X 3
where ln(C) is replaced by the coefficient a0, and the original designations of the processing modes V, S, and t by X1, X2, and X3, respectively.
For the next stage of finding coefficients by the least square’s method, it will be necessary to encode variables, reducing the ranges of values of each variable to the interval (–1, 1). It is possible to perform this operation using the following expression:
ln x i = ln ( X i ) ln ( X i   m i n ) + ln ( X i   m a x ) 2 ln ( X i   m a x ) ln ( X i   m i n ) 2 ,       i = 1 ,   2 ,   3
where Xi is the initial value of the variable models (speed, feed, and cutting depth) used in the experiment, and ln(Xi) is the result of coding from −1 to 1.
Next, it is necessary to make a matrix of the experiment plan G with encoded variables and their mutual enumeration of values using the values of the minimum value (ln(Xi) = −1, Xi − min), the maximum value (ln(Xi) = 1, Xi − max) and the average value of each variable in various combinations. In this experimental plan, a complete search was performed for the feed parameters X2 and the cutting depth X3, and the interval selection of the cutting speed X1.
During the experiment, it is necessary to follow the obtained matrix, setting the appropriate modes from each set of variables and measuring the resulting value of the cutting force tangential component. As a result, a vector of the resulting Y values is obtained, and it is possible to apply expression (14) to calculate the desired coefficients of the model for the cutting force.
The type of model for the cutting temperature is similar to the kind of model for the cutting force. After performing a logarithm to bring it to a polynomial form and rewriting the designations of the model parameters, we have the following type of model:
ln Θ = b 0 + b 1 ln X 1 + b 2 ln X 2 + b 3 ln X 3 + b 4 ln 2 X 2 + b 5 ln 2 X 3 + b 6 ln X 1 ln X 2 + b 7 ln X 1 ln X 3 + b 8 ln X 2 ln X 3 ,
Accordingly, the coding of variables and the experimental plan be similar for the cutting temperature, which can measure simultaneously with the cutting force in the same matrix of the practical plan G. As a result, using the logarithms of the values of the observed temperature data, we will be able to find the importance of the coefficients of the model using the least squares method. As a result, we obtain an expression for finding the vectors of the model’s coefficients of cutting force A [9 × 1] and cutting temperature B [9 × 1] in the following form:
A , B = G T G 1 G T Y P , Y θ
where YP [18 × 1], Yθ [18 × 1] are the vectors of the results of the cutting force values and temperature, respectively, obtained in the experiment, the matrix of the experiment plan G, therefore, has a dimension of 18 × 9.
Let us consider a way to calculate the relative efficiency criterion using calculated cutting forces and temperature models. First, write down once again the expressions for the logarithms of the cutting force and temperature in the polynomial form:
ln F t = a 0 + a 1 ln X 1 + a 2 ln X 2 + a 3 ln X 3 + a 4 ln 2 X 2 + a 5 ln 2 X 3 + a 6 ln X 1 ln X 2 + a 7 ln X 1 ln X 3 + a 8 ln X 2 ln X 3
ln Θ = b 0 + b 1 ln X 1 + b 2 ln X 2 + b 3 ln X 3 + b 4 ln 2 X 2 + b 5 ln 2 X 3 + b 6 ln X 1 ln X 2 + b 7 ln X 1 ln X 3 + b 8 ln X 2 ln X 3 ,
Having made the potentiation of these expressions and given transformations by grouping such multipliers, we obtain terms that will take the following form:
F t = e a 0 X 1 a 1 X 2 a 2 + a 4 ln X 2 + a 6 ln X 1 + a 8 ln X 3 X 3 a 3 + a 5 ln X 3 + a 7 ln X 1
θ = e b 0 X 1 b 1 X 2 b 2 + b 4 ln X 2 + b 6 ln X 1 + b 8 ln x 3 X 3 b 3 + b 5 ln x 3 + b 7 ln x 1
Here, the selected model variant for the studied parameters is quite convenient for calculating the value of the relative efficiency criterion. We obtain the same multiplicative form of expression in which it is simply necessary to add up the corresponding coefficients found for each of the models when the force model is multiplied by the temperature model:
F t θ = e a 0 + b 0 X 1 a 1 + b 1 X 2 a 2 + b 2 + a 4 + b 4 ln X 2 + a 6 + b 6 ln X 1 + ( a 8 + b 8 ln X 3 ) × X 3 a 3 + b 3 + a 5 + b 5 ln X 3 + ( a 7 + b 7 ln X 1 )
In dividing one product of force by temperature for a textured tool by the product for the original instrument, it is sufficient to subtract the corresponding values of the divisor from the exponents of the multipliers of the divisible. Based on this, the final expression of the predictive evaluation functional for the criterion of relative efficiency will take the form:
( F t θ ) t F t θ = e c 0 X 1 c 1 X 2 c 2 + c 4 ln X 2 + c 6 ln X 1 + c 8 ln X 3 × X 3 c 3 + c 5 ln X 3 + c 7 ln X 1 c i = a i + b i t a i + b i ,     i = 0 ,   1 ,   ,   8
Thus, we immediately calculate the function of the predictive evaluation of the criterion of relative efficiency, which eventually has the same form as the original models of cutting forces and temperatures. It turns out that we can compare the textured and the original tool by determining the coefficients.

3.3. Mathematical Modeling of Thermal Force Parameters When Comparing Conventional and Textured Tools

It is possible to perform mathematical modeling to create a predictive assessment of the success of the modified cutting tool after making an experimental base during practical tests as a result of turning an iron–nickel alloy with carbide plates with the presence of microtextures and in the initial state under various modes and recording the results of the force measuring, cutting temperature and wear on the flank surface.
First, we analyze the comparison of the classical type with constant coefficients of degree indicators empirical models and the extended model proposed version, when the degree indicators are a function of the feed modes and cutting depth themselves. Let us make this comparison using the example of the cutting force model calculation. To begin with, we will encode the values of the cutting modes used in the experiment using the expression (17). We obtain the following encoded values of variables for building models (Table 2, Table 3 and Table 4):
The view of the cutting force tangential component model in coded variables has the following form:
ln F t = a 0 + a 1 ln x 1 + a 2 ln x 2 + a 3 ln x 3 + a 4 ln 2 x 2 + a 5 ln 2 x 3 + a 6 ln x 1 ln x 2 + a 7 ln x 1 ln x 3 + a 8 ln x 2 ln x 3
In this case, the matrix of the experiment plan (G), taking into account the coding of the modes used in the experiments, have the following form Table 5:
We can calculate the coefficient vector AG for an extended model using the following formula
A G = G T G 1 G T Y ,   where   A G = a 0 , a 1 , a 2 , a 3 , ,   a 8 T
The vector of coefficients AG calculated for the extended matrix G have the form (Table 6):
We can write a variant of the extended model with encoded variables in the following form by these coefficients:
ln F t = 5.6679 + 0.0359 ln x 1 + 0.151 ln x 2 + 0.3836 ln x 3 0.00079 ln 2 x 2 + 0.0835 ln 2 x 3 0.0166 ln x 1 ln x 2 + 0.0933 ln x 1 ln x 3 + 0.0012 ln x 2 ln x 3
Next, we perform similar calculations to calculate the model of the cutting temperature dependence on the cutting speed, feed, and depth. View of the extended model in coded variables:
ln θ = b 0 + b 1 ln x 1 + b 2 ln x 2 + b 3 ln x 3 + b 4 ln 2 x 2 + b 5 ln 2 x 3 + b 6 ln x 1 ln x 2 + b 7 ln x 1 ln x 3 + b 8 ln x 2 ln x 3
The matrices of experimental data are similar to those of cutting forces calculation. The vector of the resulting values of the investigated quantity is YΘ = ln(θ), where θ are the values recorded in the experiments. Taking into account these values, we can calculate the coefficient vector BG for an extended model using the following formula:
B G = G T G 1 G T Y θ
We have for the components of the vector BG (Table 7):
We will calculate the coefficients of the models for the case with a microtextured surface according to a similar scenario considered when calculating models of cutting force and temperature. The only difference here is in the vectors of the resulting values obtained in the experiment. The values of the coefficients for the extended cutting force and temperature models are equal (Table 8):
Thus, the models of cutting forces and temperatures are calculated based on the accumulated experimental data during the turning of an iron–nickel alloy, which can be used to calculate the predictive function.

3.4. Using the Predictive Evaluation Functionality

Let us determine the resulting values of the relative efficiency criterion and consider its relationship with the difference in wear on the flank surface (hf (texture) − hf) in each case. Let us multiply the corresponding importance of force and temperature to determine the values of the criterion, find their ratio, and compare this ratio with the difference in the wear for the two considered options. The studied processing modes and the corresponding values of the cutting force and temperature, and the results of the calculations are presented in Table 9.
According to the assumption, the value of the ratio greater than one indicates the worst efficiency of the cutting process and the expectation of more intensive tool wear. In the considered cases, the value of the proposed criterion exceeds the value of one in three instances: under the numbers 10, 13, and 16. For these cutting modes, it is expected that the difference in the importance of the wear value on the back surface between the tool with microtexture and the tool without microtexture would be positive. The significance of this difference is equal, respectively: 0.017, −0.036, and 0.014. In this case, in two out of three points, a higher wear value was obtained for a tool with a microtexture. Additionally, among other cases, when the ratio value is less than one and a lower wear value is expected for a tool with a microtexture, a positive difference was obtained in one set of modes. The expectations about the final amount of wear on the rear surface based on the proposed criterion coincide in 16 out of 18 cases based on the 18 cases considered.
Let us now calculate the model for the available forecast according to the proposed algorithm above using the coefficient values of previously computed models. The expression of the predictive evaluation available for the criterion of relative efficiency has the form:
( F t θ ) t F t θ = e c 0 X 1 c 1 X 2 c 2 + c 4 ln X 2 + c 6 ln X 1 + c 8 ln X 3 × X 3 c 3 + c 5 ln X 3 + c 7 ln X 1   c i = a i + b i t a i + b i ,     i = 0 ,   1 ,   ,   8
Thus, it is necessary to sum and subtract the corresponding coefficients of the degrees of the models for the textured and original tools. The vector of the functional magnitude coefficients calculated by the formula (AG + BG)texture − (AG + BG) is presented below (Table 10):
Thus, the calculated form of the predictive evaluation functional model for the relative efficiency criterion will be as follows:
( F t θ ) t F t θ = e 0.184 X 1 0.0301 X 2 0.0308 + 0.0309 ln X 2 0.0311 ln X 1 0.0242 ln X 3 × X 3 0.0049 + 0.0121 ln X 3 0.1365 ln X 1
Consider the results of the values calculated using this model (Table 11):
The results of these calculations show values above 1 in two cases. There are experiments number 9 when a combination of minimum speed and maximum feed and cutting depth was used, and number 16 when a combination of top speed and feed and minimum cutting depth was used. These cases should correspond to the inefficiency of using microtexture on the tool surface according to the accepted assumption. Let us consider in more detail the model results on the plane of values.
For the convenience of further analysis, we reduce the model to a polynomial form by performing a logarithm of the expression:
ln ( F t θ ) t e x t u r e F t θ = 0.184 + 0.0301 ln x 1 + 0.0308 ln x 2 + 0.0049 ln x 3 + 0.0309 ln 2 x 2 + 0.012 ln 2 x 3 0.031 ln x 1 ln x 2 0.136 ln x 1 ln x 3 0.02424 ln x 2 ln x 3
In this form, the values above 0 indicate areas of inefficient use of microtexture on the tool surface, and values below 0 indicate areas of effective use of microtexture.
Let us construct the planes of the values of the criterion logarithm depending on the processing parameters in encoded values (Figure 14 and Figure 15). It noted that the feed value does not significantly affect the results of the values. In turn, changes in the importance of the speed and depth of cutting cause transitions from the area of effective use of microtexture to the area of its inefficient use.
Let us consider the case of the criterion values transition from the size of practical application of microtexture to the size of ineffective values. Let us take the chance of top feed and processing depth and consider the range of practical values depending on the speed.
We set the efficiency condition for the expression of the criterion in the polynomial form:
0.184 + 0.0301 ln x 1 + 0.0308 ln x 2 + 0.0049 ln x 3 + 0.0309 ln 2 x 2 + 0.012 ln 2 x 3 0.031 ln x 1 ln x 2 0.136 ln x 1 ln x 3 0.02424 ln x 2 ln x 3 < 0      
Let us substitute into this expression the maximum values of feed and processing depth in coded values that correspond to one:
0.184 + 0.0301 ln x 1 + 0.0308 + 0.0049 + 0.0309 + 0.012 0.031 ln x 1 0.136 ln x 1 0.02424 < 0
We give similar terms and express the condition for the speed values in coded variables when the use of microtexture is effective:
ln x 1 > 0.95
As a result, we obtain the condition of the encoded speed value, under which the processing conditions with a microtextured tool will be more effective. We reverse the conversion of the encoded velocity value to the values used in the experiment:
V > 17.2   m / min
We obtain the condition that with the top feed and cutting depth used in the experiments, which are, respectively, S = 0.15 mm/rev and t = 0.5 mm, for the effective use of microtextures, the speed must be higher than 17.2 m/min. We examine this condition in more detail in the next section.

3.5. Verification of the Theoretical Forecast of the Effectiveness of the Tool with Microtexturing of the Working Surface

The criterion of relative efficiency establishes the area of effective use of a cutting tool with a microtexture. In particular, a condition for the efficiency of using a microtextured tool obtained when the speed was higher than 17.2 m/min. This value is close to the boundary of the minimum velocity value used in the experiment at 17 m/min. The result of processing at the minimum speed showed that the efficiency criterion takes a value higher than one, and the relative wear of the tool with microtexture at the same time turns out higher than the wear of the original instrument.
Although based on the modeling requirements, we can judge the results of the model’s operation only under the conditions of the selected range of processing modes. Let us consider a further decrease in the cutting speed at the same maximum feed and cutting depth. For the experiment, we choose a cutting speed of 12.5 m/min, a feed of 0.15 mm/rev, and a cutting depth of 0.5 mm. The results of the experiment are shown in the Table 12 below:
The value of the relative efficiency criterion for these processing modes is 1.039, which indicates a lower efficiency of using a tool with a microtexture and assumes a large amount of wear. Under these processing conditions, the wear difference on the back surface between the microtextured tool and the original one is equal to hr(textures) − hr = 0.01. Based on these values, it assumed that at a speed of V = 17.2 m/min, there is a transition point from the effective use of microstructure on the surface of the tool to the size of its inefficient use.
The method of predictive evaluation used in work suggests evaluating the durability properties of the tool without conducting labor-intensive durability tests. However, it has a hypothetical character, since the wear is a random process, and the nature of the wear curves can be quite variable. Therefore, to confirm the method, resistance tests were carried out in the zones of processing modes, where the criterion of relative efficiency shows values below one.
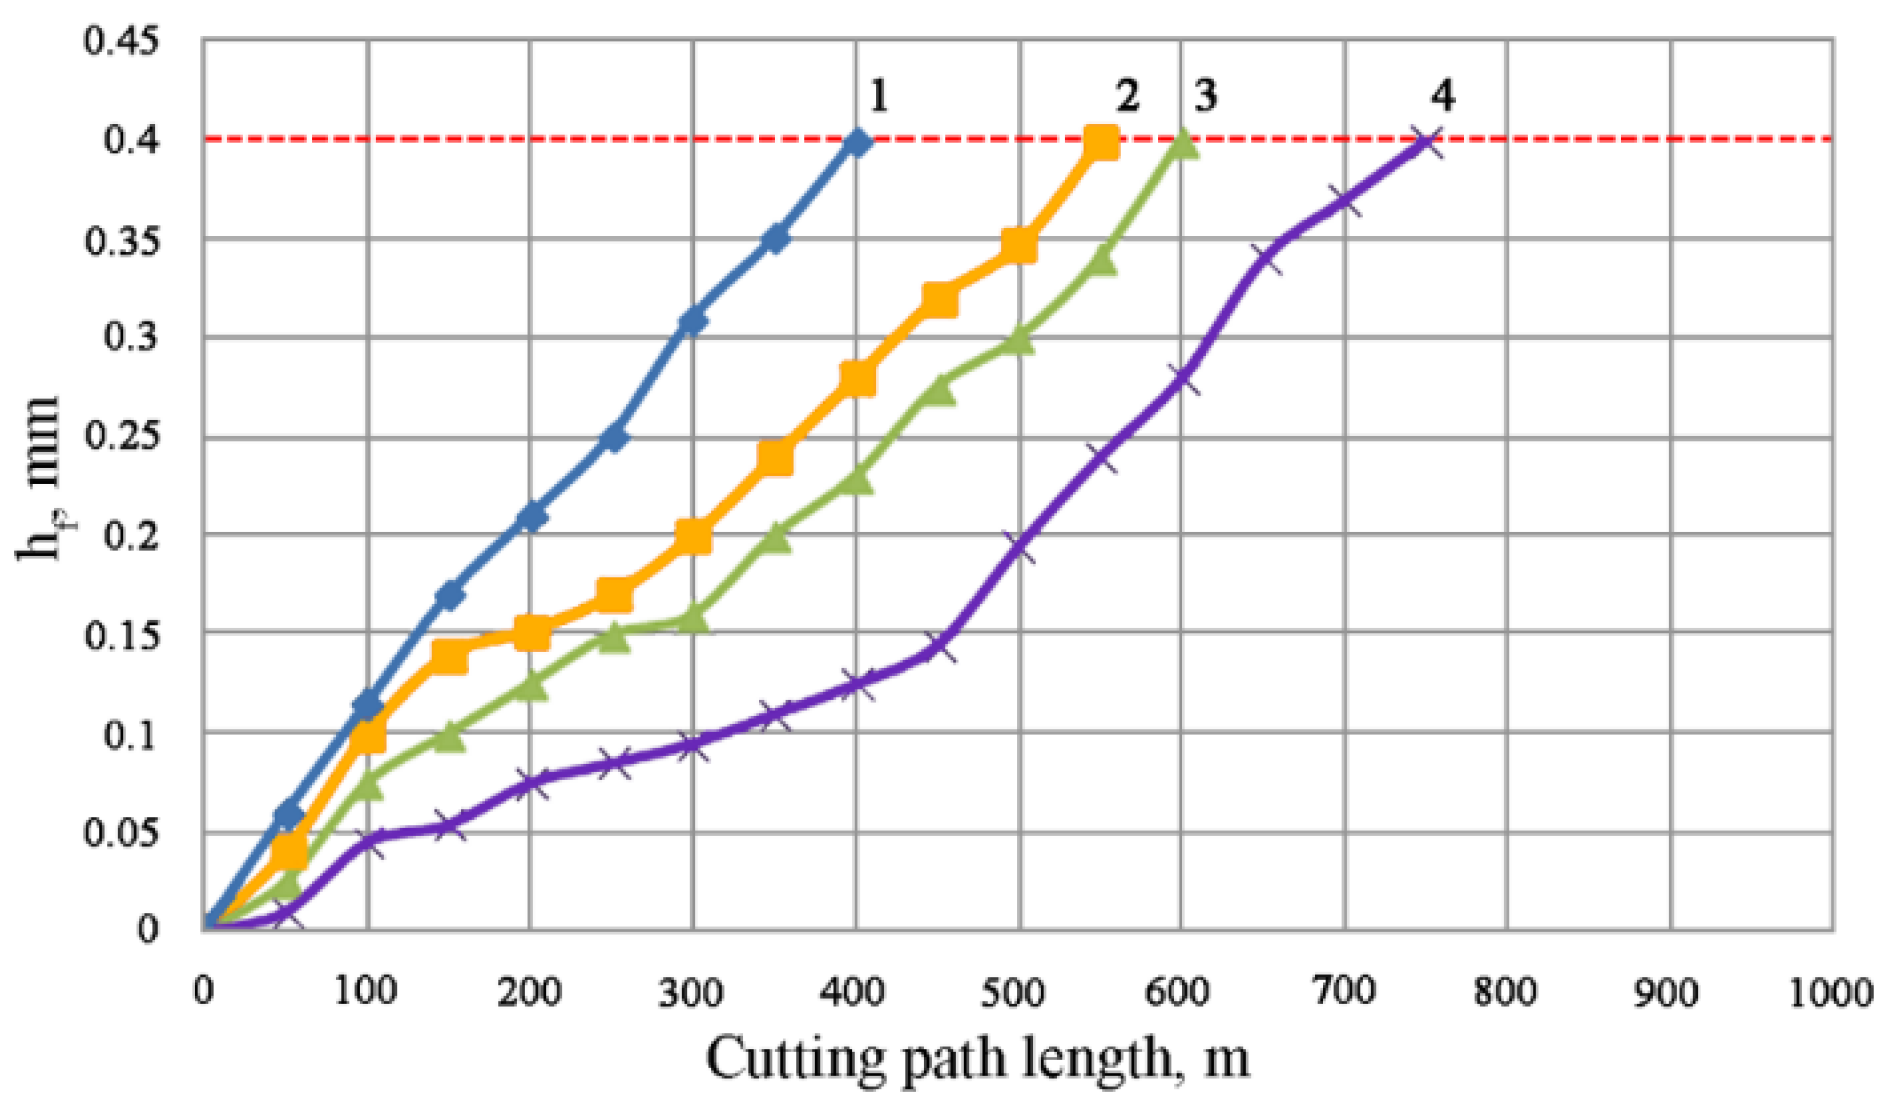
In these tests, the maximum values of the cutting speed and depth and the minimum feed were used (V = 25 m/min, S = 0.1 mm/rev, t = 0.5 mm). The tests carried out until the wear on the flank surface was equal to 0.4 mm. The cutting time until the critical wear criterion for initial plate was reached was approximately 30 min. The results of the resistance tests are shown in Figure 16.
In the course of resistance tests, a tool with a microtexture on the rake surface showed increased resistance values under operation conditions with lubrication in the zone of the practical importance of processing modes according to the criterion of relative efficiency. At the same time, the durability of the modified tool turned out to be about 30% higher compared to the initial instrument, and about 25% compared to the coated tool.

4. Conclusions

  • The article presents new technological techniques aimed at solving the problem of increasing the efficiency of processing iron–nickel alloys with a carbide tool.
  • A method is proposed and implemented for the one-parameter setting of the structure of the print when microtexturing the rake surface of a carbide plate in the form of strips, focused on their automated application. Tests of a tool with a microtexture revealed a significant effect of a microtexture filled with a MoS2-based lubricant on the processed material adhesion to the tool. The build-up zone has characteristic boundaries that repeat the geometry of the microtexture.
  • The comprehensive tests of the cutting tool for durability under various processing modes with the thermal power parameters measurement during the turning of an iron–nickel alloy made it possible to create an experimental basis for further mathematical modeling
  • Mathematical models of thermal power parameters of the cutting process based on multiplicative power functions with indicators in the form of feed and cutting depth linear functions have been developed. The function of predictive evaluation is proposed and justified using the criterion of relative efficiency. An analytical expression of this function is obtained and makes it possible to predict the rational use of a cutting tool with a microtextured working surface based on numerical calculations.
  • Predictive estimates of the turning efficiency have been experimentally tested on the example of alloy C0.3Cr15Ni35Mo7Mn7Fe. It is established that the values calculated on the basis of the developed forecasting method have a high convergence with the results of experimental tests. It was possible to obtain an increase in the tool durability by 1.3–1.5 times due to the microtexturing operation.

Author Contributions

Conceptualization, M.S.; Methodology, M.M.; Software, E.O.; Formal analysis, M.S.; Data curation, E.O. and M.M.; Writing—original draft, S.F.; Project administration, S.F. All authors have read and agreed to the published version of the manuscript.

Funding

The research was carried out at the expense of the grant of the Russian Science Foundation No. 22-19-00694. The study was carried out on the equipment of the Center of collective use of MSUT “STANKIN” supported by the Ministry of Higher Education of the Russian Federation (project No. 075-15-2021-695 from 26 July 2021, unique identifier RF 2296.61321 × 0013).

Institutional Review Board Statement

Not applicable.

Informed Consent Statement

Not applicable.

Data Availability Statement

Not applicable.

Conflicts of Interest

The authors declare no conflict of interest.

References

  1. Fedorov, S.V.; Swe, M.H.; Kapitanov, A.V.; Egorov, S.B. Wear of carbide inserts with complex surface treatment when milling nickel alloy. Mech. Ind. 2017, 18, 710. [Google Scholar] [CrossRef] [Green Version]
  2. Fedorov, S.V.; Swe, M.H. Refractory phases synthesis at the surface microalloying using a wide aperture electron beam. IOP Conf. Ser. J. Phys. Conf. Ser. 2017, 830, 012076. [Google Scholar] [CrossRef] [Green Version]
  3. Sousa, V.F.C.; Silva, F.J.G. Recent advances on coated milling tool technology—A Comprehensive review. Coatings 2020, 10, 235. [Google Scholar] [CrossRef] [Green Version]
  4. Grigoriev, S.N.; Vereschaka, A.A.; Fyodorov, S.V.; Sitnikov, N.N.; Batako, A.D. Comparative analysis of cutting properties and nature of wear of carbide cutting tools with multi-layered nano-structured and gradient coatings produced by using of various deposition methods. Int. J. Adv. Manuf. Technol. 2017, 90, 3421–3435. [Google Scholar] [CrossRef]
  5. Vereschaka, A.S.; Grigoriev, S.N.; Sotova, E.S.; Vereschaka, A.A. Improving the efficiency of the cutting tools made of mixed ceramics by applying modifying nano-scale multilayered coatings. Adv. Mater. Res. 2013, 712–715, 391–394. [Google Scholar] [CrossRef]
  6. Siwawut, S.; Saikaew, C.; Wisitsoraat, A.; Surinphong, S. Cutting performances and wear characteristics of WC inserts coated with TiAlSiN and CrTiAlSiN by filtered cathodic arc in dry face milling of cast iron. Int. J. Adv. Manuf. Technol. 2018, 97, 3883–3892. [Google Scholar] [CrossRef]
  7. Grigoriev, S.N.; Volosova, M.A.; Vereschaka, A.A.; Fyodorov, S.V.; Seleznev, A.E. Properties of (Cr,Al,Si)N-(DLC-Si) composite coatings deposited on a cutting ceramic substrate. Ceram. Int. 2020, 46, 18241–18255. [Google Scholar] [CrossRef]
  8. Fedorov, S.V.; Ostrikov, E.A.; Mustafaev, E.S.; Hamdy, K. The formation of the cutting tool microgeometry by pulsed laser ablation. Mech. Ind. 2018, 19, 703. [Google Scholar] [CrossRef]
  9. Grigoriev, S.; Melnik, Y.; Metel, A. Broad fast neutral molecule beam sources for industrial scale beam-assisted deposition. Surf. Coat. Technol. 2002, 156, 44–49. [Google Scholar] [CrossRef]
  10. Metel, A.; Bolbukov, V.; Volosova, M.; Grigoriev, S.; Melnik, Y. Source of metal atoms and fast gas molecules for coating deposition on complex shaped dielectric products. Surf. Coat. Technol 2013, 225, 34–39. [Google Scholar] [CrossRef]
  11. Ozel, T.; Biermann, D.; Enomoto, T.; Mativenga, P. Structured and textured cutting tool surfaces for machining applications. CIRP Ann. Manuf. Technol. 2021, 70, 495–518. [Google Scholar] [CrossRef]
  12. Sharma, V.; Pandey, P.M. Recent advances in turning with textured cutting tools: A review. J. Clean. Prod. 2016, 137, 701–715. [Google Scholar] [CrossRef]
  13. Lei, S.; Devarajan, S.; Chang, Z. A study of micropool lubricated cutting tool in machining of mild steel. J. Mater. Process. Technol. 2009, 209, 1612–1620. [Google Scholar] [CrossRef]
  14. Deng, J.; Song, W.; Zhang, H.; Yan, P.; Liu, A. Friction and wear behaviors of the carbide tools embedded with solid lubricants in sliding wear tests and in dry cutting processes. Wear 2011, 270, 666–674. [Google Scholar] [CrossRef]
  15. Wu, Z.; Deng, J.; Su, C.; Luo, C.; Xia, D. Performance of the micro-texture self-lubricating and pulsating heat pipe self-cooling tools in dry cutting process. Int. J. Refract. Met. Hard Mater. 2014, 45, 238–248. [Google Scholar] [CrossRef]
  16. Kawasegi, N.; Sugimori, H.; Morimoto, H.; Morita, N.; Hori, I. Development of cutting tools with microscale and nanoscale textures to improve frictional behavior. Precis. Eng. 2009, 33, 248–254. [Google Scholar] [CrossRef]
  17. Deng, J.; Wu, Z.; Lian, Y.; Qi, T.; Cheng, J. Performance of carbide tools with textured rake-face filled with solid lubricants in dry cutting processes. Int. J. Refract. Met. Hard Mater. 2012, 30, 164–172. [Google Scholar] [CrossRef]
  18. Xing, Y.; Deng, J.; Zhao, J.; Zhang, G.; Zhang, K. Cutting performance and wear mechanism of nanoscale and microscale textured Al2O3/TiC ceramic tools in dry cutting of hardened steel. Int. J. Refract. Met. Hard Mater. 2014, 43, 46–58. [Google Scholar] [CrossRef]
  19. Fatima, A.; Whitehead, D.J.; Mativenga, P.T. Femtosecond laser surface structuring of carbide tooling for modifying contact phenomena. Proc. Inst. Mech. Eng. Part B J. Eng. Manuf. 2014, 228, 1325–1337. [Google Scholar] [CrossRef]
  20. Obikawa, T.; Kamio, A.; Takaoka, H.; Osada, A. Micro-texture at the coated tool face for high performance cutting. Int. J. Mach. Tools Manuf. 2011, 51, 966–972. [Google Scholar] [CrossRef]
  21. Xing, Y.; Deng, J.; Li, S.; Yue, H.; Meng, R.; Gao, P. Cutting performance and wear characteristics of Al2O3/TiC ceramic cutting tools with WS2/Zr soft-coatings and nano-textures in dry cutting. Wear 2014, 318, 12–26. [Google Scholar] [CrossRef]
  22. Fatima, A.; Mativenga, P.T. A comparative study on cutting performance of rake-flank face structured cutting tool in orthogonal cutting of AISI/SAE 4140. Int. J. Adv. Manuf. Technol. 2014, 78, 2097–2106. [Google Scholar] [CrossRef]
  23. Grigoriev, S.N.; Kozochkin, M.P.; Sabirov, F.S.; Kutin, A.A. Diagnostic Systems as Basis for Technological Improvement. Proc. CIRP 2012, 1, 599–604. [Google Scholar] [CrossRef] [Green Version]
  24. Grigoriev, S.N.; Sinopalnikov, V.A.; Tereshin, M.V.; Gurin, V.D. Control of parameters of the cutting process on the basis of diagnostics of the machine tool and workpiece. Meas. Tech. 2012, 55, 555–558. [Google Scholar] [CrossRef]
  25. Vereschaka, A.; Grigoriev, S.; Tabakov, V.; Migranov, M.; Sitnikov, N.; Milovich, F.; Andreev, N. Influence of the Nanostructure of Ti-TiN-(Ti,Al,Cr)N Multilayer Composite Coating on Tribological Properties and Cutting Tool Life. Tribol. Int. 2020, 150, 106388. [Google Scholar] [CrossRef]
  26. Grigoriev, S.; Vereschaka, A.; Milovich, F.; Tabakov, V.; Sitnikov, N.; Andreev, N.; Sviridova, T.; Bublikov, J. Investigation of multicomponent nanolayer coatings based on nitrides of Cr, Mo, Zr, Nb, and Al. Surf. Coat. Technol. 2020, 401, 126258. [Google Scholar] [CrossRef]
  27. Grigoriev, S.N.; Gurin, V.D.; Volosova, M.A.; Cherkasova, N.Y. Development of residual cutting tool life prediction algorithm by processing on CNC machine tool. Materwiss. Werksttech. 2013, 44, 790–796. [Google Scholar] [CrossRef]
Figure 1. View of grooves on the hard alloy surface when treated with a nanosecond laser: (a) the top view; (b) the groove cross-section.
Coatings 12 01906 g001
Figure 2. The Qness 10A microhardness tester used for applying the microtextures.
Coatings 12 01906 g002
Figure 3. Type of prints on the surface of the plates after indentation.
Coatings 12 01906 g003
Figure 4. Final view of microtextures: (a,b) the microtexture location on the rake surface.
Coatings 12 01906 g004
Figure 5. Scheme of temperature measurement by natural thermocouple method: 1—mercury current collector; 2, 4—insulation; 3—cartridge; 5—blank; 6—isolated rear center; 7—tailstock; 8—tool holder; 9—a cutter with insulation; 10—a computer; 11—a digital voltmeter.
Coatings 12 01906 g005
Figure 6. Grease residues inside the microtexture craters at the border of the growth zone; the build-up at V = 27 m/min, t = 0.5 mm, S = 0.15 mm/rev.
Coatings 12 01906 g006
Figure 7. View of the front surface of plates with (a) and without (b) microtexture with traces of build-up after processing of heat-resistant material at V = 27 m/min, t = 0.5 mm, S = 0.1 mm/rev.
Coatings 12 01906 g007
Figure 8. Dependence of the cutting temperature on the cutting depth for various tools at a cutting speed of V = 17 m/min and S = 0.15 mm/rev.
Coatings 12 01906 g008
Figure 9. Dependence of the cutting temperature on the feed per revolution for various tools at a cutting speed of V = 17 m/min and t = 0.5 mm/rev.
Coatings 12 01906 g009
Figure 10. The tangential component of the cutting force on the cutting depth dependence for various tools at a cutting speed of V = 17 m/min and S = 0.125 mm/rev.
Coatings 12 01906 g010
Figure 11. The tangential component of the cutting force on the feed per revolution dependence for various tools at a cutting speed of V = 17 m/min and t = 0.4 mm.
Coatings 12 01906 g011
Figure 12. The wear on the flank surface on the different cutting depths dependent on various tools at a cutting speed V = 17 m/min and S = 0.125 mm/rev.
Coatings 12 01906 g012
Figure 13. The wear on the flank surface on different feed per revolution values dependent on various tools at a cutting speed V = 17 m/min and t = 0.4 mm.
Coatings 12 01906 g013
Figure 14. The surface of the change in criterion logarithm value from the cutting depth and feed encoded values at a speed of V = 17 m/min.
Coatings 12 01906 g014
Figure 15. The surface of the change in the criterion logarithm value from the cutting depth and cutting speed encoded values at S = 0.15 mm/rev.
Coatings 12 01906 g015
Figure 16. Comparison of wear on the flank surface for textured and original tools at V = 25 m/min, S = 0.1 mm/rpm, t = 0.5 mm: 1—initial, 2—initial textured, 3—with coating, 4—coated and textured.
Coatings 12 01906 g016
Table 1. Values of the studied processing parameters were obtained as a result of experiments for the original and textured tool.
No.V, m/minS, mm/revt mmFt HΘ CFt(texture) HΘ(texture) Chf(texture) − hf
1170.10.3193.3287170.7200−0.013
2170.10.4234.9295249.3240−0.012
3170.10.5353310372.7270−0.016
4170.1250.3226.6305221.4240−0.013
5170.1250.4297.7315269.4290−0.014
6170.1250.5422.1326409.6310−0.02
7170.150.3281.1315253272−0.024
8170.150.4327320315.5300−0.023
9170.150.5476.4332484.83250.017
10270.10.3181360193.33420.018
11270.10.4279.3371258.5358−0.032
12270.10.5450387356387−0.03
13270.1250.3200376218.7347−0.036
14270.1250.4335.6385273.8365−0.033
15270.1250.5520395404.1391−0.033
16270.150.3223.93912503680.014
17270.150.4380395328.4385−0.035
18270.150.5600400489.7396−0.032
Table 2. Encoded values of cutting speed V.
X1 = V, m/minln(X1)ln(x1)
273.2961
172.833−1
Table 3. Encoded values of feed S.
X2 = S, mm/revln(X2)ln(x2)
0, 15−1.8971
0, 125−2.0790.1
0, 1−2.303−1
Table 4. Encoded values of cutting depth t.
X3 = t, mmln(X3)ln(x3)
0, 5−0.6931
0, 4−0.9160.126
0, 3−1.204−1
Table 5. Experiment plan (matrix G).
No.KLn (x1)Ln (x2)Ln (x3)ln2(x2)ln2 (x3)ln (x1) ln (x2)Ln (x1) ln (x3)Ln (x2) ln (x3)
11−1−1−111111
21−1−10.12610.0161−0.126−0.126
31−1−11111−1−1
41−10.1−10.011−0.11−0.1
51−10.10.1260.010.016−0.1−0.1260.013
61−10.110.011−0.1−10.1
71−11−111−11−1
81−110.12610.016−1−0.1260.126
91−11111−1−11
1011−1−111−1−11
1111−10.12610.016−10.126−0.126
1211−1111−11−1
13110.1−10.0110.1−1−0.1
14110.10.1260.010.0160.10.1260.013
15110.110.0110.110.1
16111−1111−1−1
171110.12610.01610.1260.126
18111111111
Table 6. The vector AG coefficients for an extended model.
CoefficientAG
a05.6679
a10.0359
a20.151
a30.3836
a4−0.00079
a50.0835
a6−0.0166
a70.0933
a80.0012
Table 7. The components of the vector BG.
CoefficientBG
b05.8429
b10.1055
b20.0354
b30.0286
b4−0.0077
b50.0088
b6−0.00561
b7−0.0042
b8−0.00909
Table 8. Models coefficients for the case with a microtextured surface.
CoefficientAG(texture)CoefficientBG(texture)
a05.5678b05.7586
a10.0086b10.1628
a20.1427b20.0746
a30.3289b30.0882
a40.0336b4−0.0112
a50.1078b5−0.0032
a6−0.0068b6−0.0465
a7−0.0119b7−0.0354
a8−0.0111b8−0.0210
Table 9. Results of calculating the values of the relative efficiency criterion.
No.V m/minS mm/revt mmFtΘ(FtΘ)(texture)(FtΘ)(texture)/FtΘhf(texture − hf
1170.10.355.47734.1400.615389−0.013
2170.10.469.29559.8320.863433−0.012
3170.10.5109.430100.6290.919574−0.016
4170.1250.369.11353.1360.768828−0.013
5170.1250.493.77578.1260.833117−0.014
6170.1250.5137.604126.9760.92276−0.02
7170.150.388.54668.8160.777174−0.024
8170.150.4104.64094.6500.90453−0.023
9170.150.5158.164157.5600.9961760.017
10270.10.365.16066.1081.0145580.018
11270.10.4103.62092.5430.893097−0.032
12270.10.5174.150137.7720.791111−0.03
13270.1250.375.20075.8881.009161−0.036
14270.1250.4129.20699.9370.77347−0.033
15270.1250.5205.400158.0030.769246−0.033
16270.150.387.54492.0001.0508890.014
17270.150.4150.100126.4340.842332−0.035
18270.150.5240.000193.9210.808005−0.032
Table 10. The vector of the functional magnitude coefficients.
Coefficient(AG + BG)textureAG + BGCriterion Coefficient
c011.3265311.51088−0.18435
c10.1715580.1414210.030137
c20.2173840.1865540.030831
c30.4172280.4123010.004927
c40.022411−0.008520.030931
c50.1045850.0924250.01216
c6−0.05334−0.02223−0.03112
c7−0.047380.089169−0.13655
c8−0.03215−0.0079−0.02424
Table 11. The predictive evaluation functional model coefficients.
Experiment NumberCoefficient Value
10.670949
20.782311
30.934612
40.709069
50.806954
60.940961
70.797175
80.885492
91.007808
100.996542
110.884264
120.803953
130.98962
140.857088
150.760579
161.04546
170.883761
180.765463
Table 12. Results of additional experiment processing parameters.
ToolV m/minS mm/revt mmFt HΘ Chf mm
Textured12.50.150.5497.43020.199
Untextured12.50.150.5488.42960.189
Publisher’s Note: MDPI stays neutral with regard to jurisdictional claims in published maps and institutional affiliations.

