
Simulation Analysis with Randomly Distributed Multiple Projectiles and Experimental Study of Shot Peening

Abstract
:1. Introduction
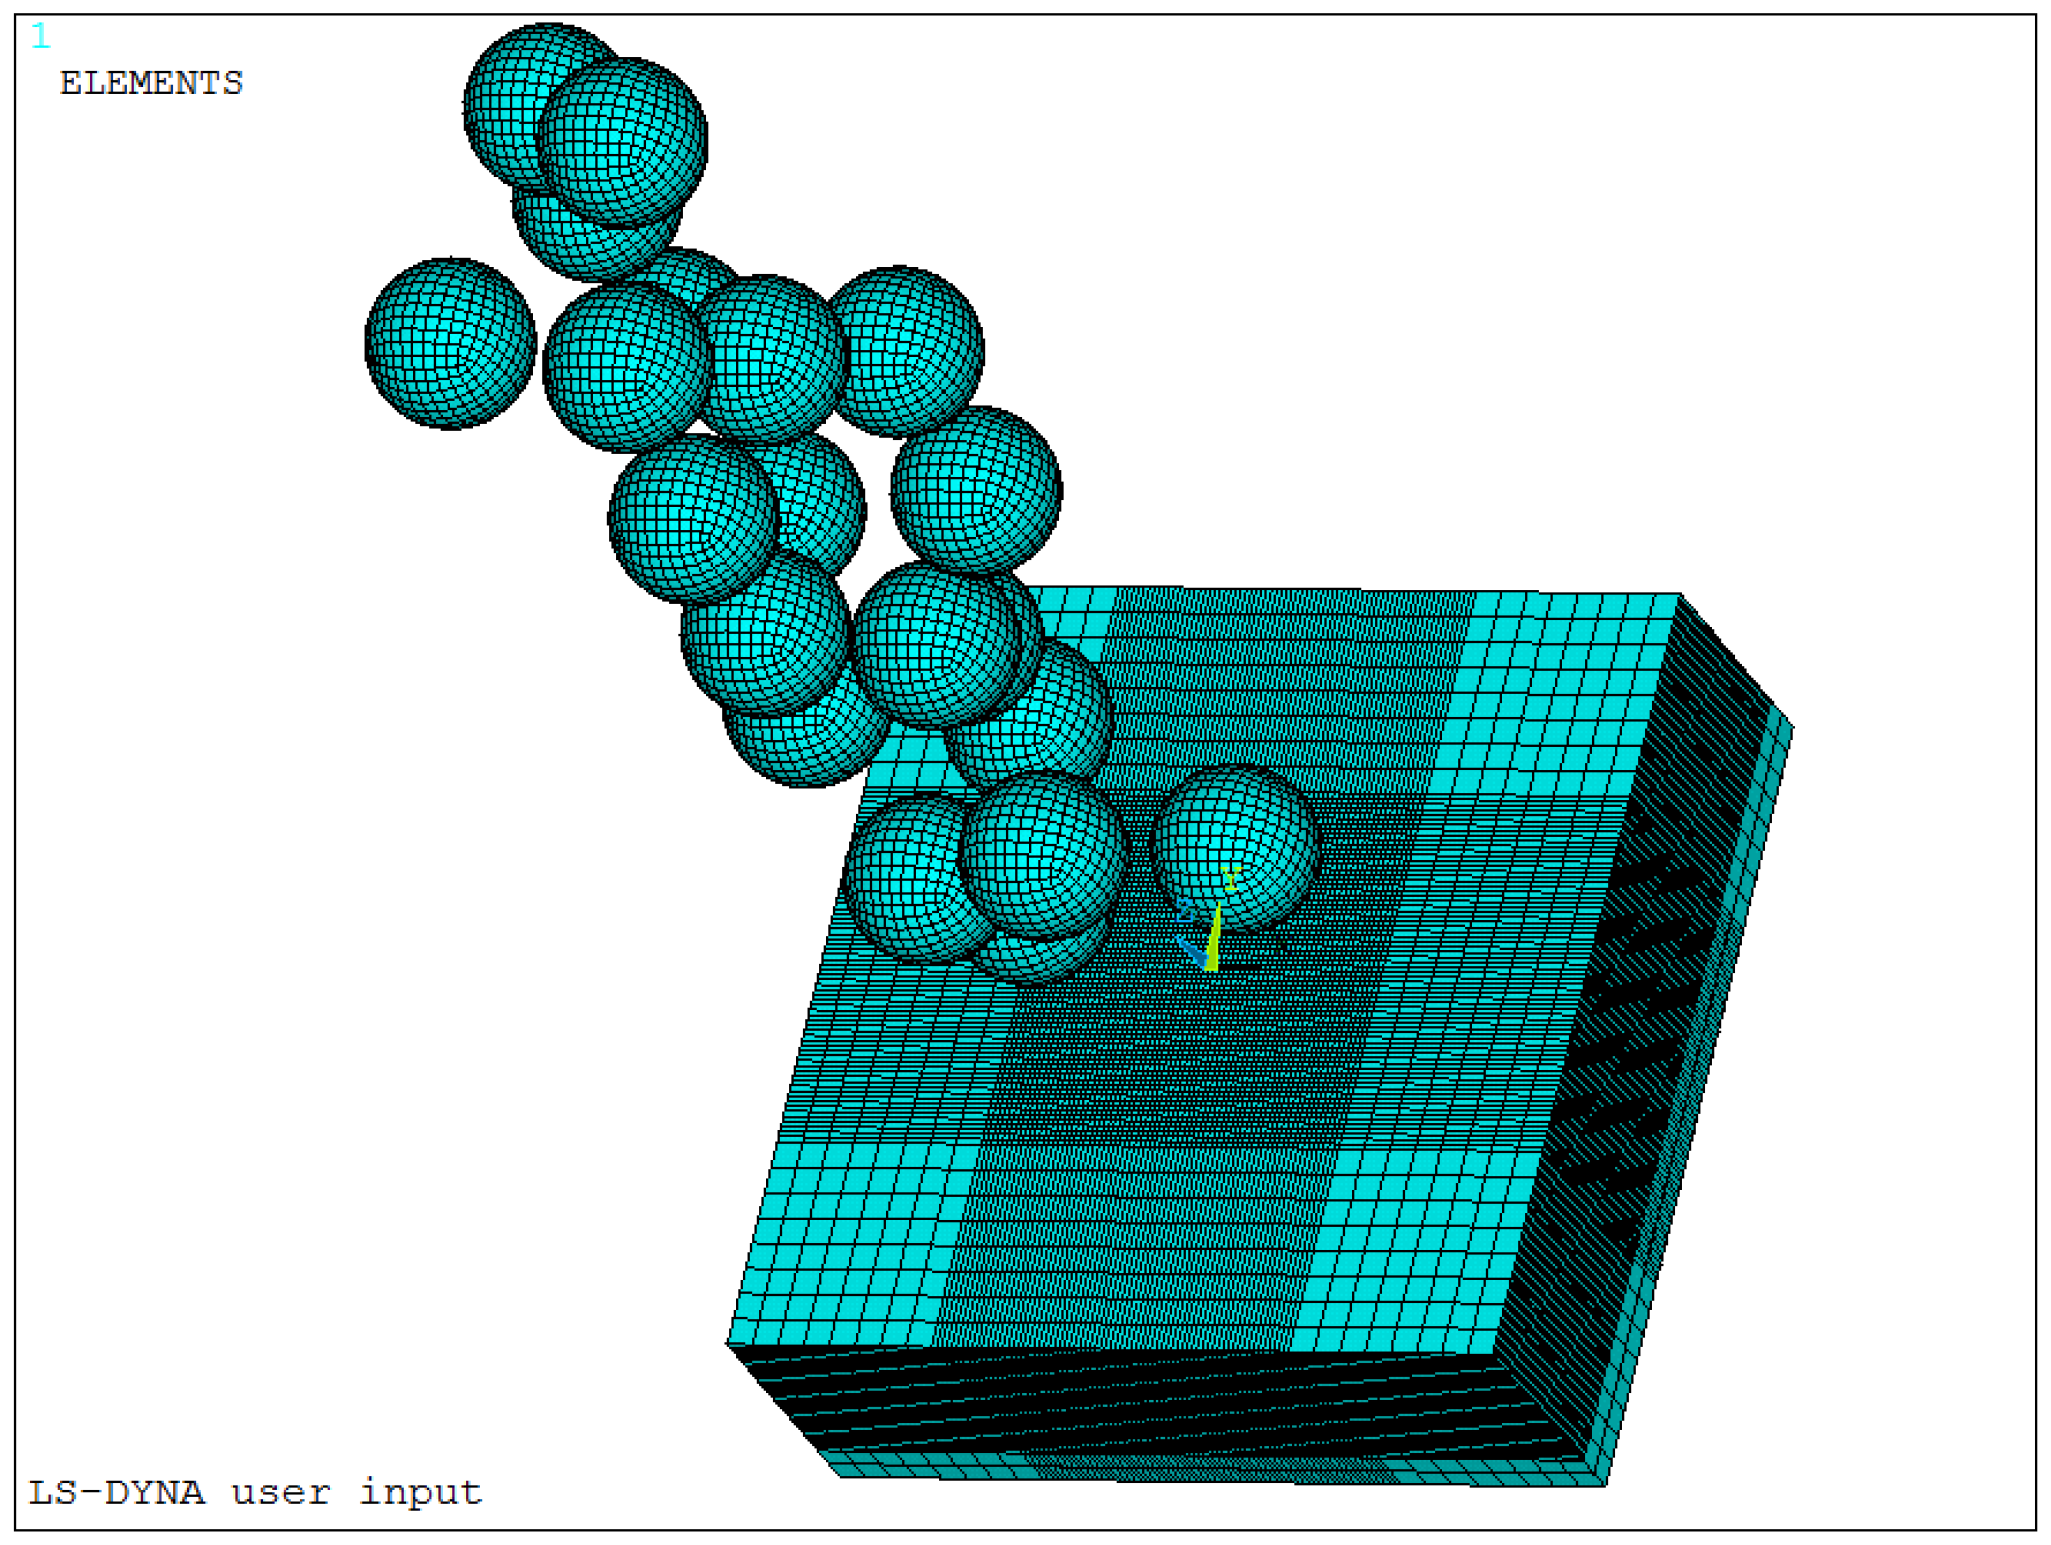
2. Finite Element Simulation Analysis
3. Experimental Procedure
3.1. Shot-Peening Test
3.2. Residual Stress Test
4. Results and Discussion
4.1. Simulation Results and Discussion
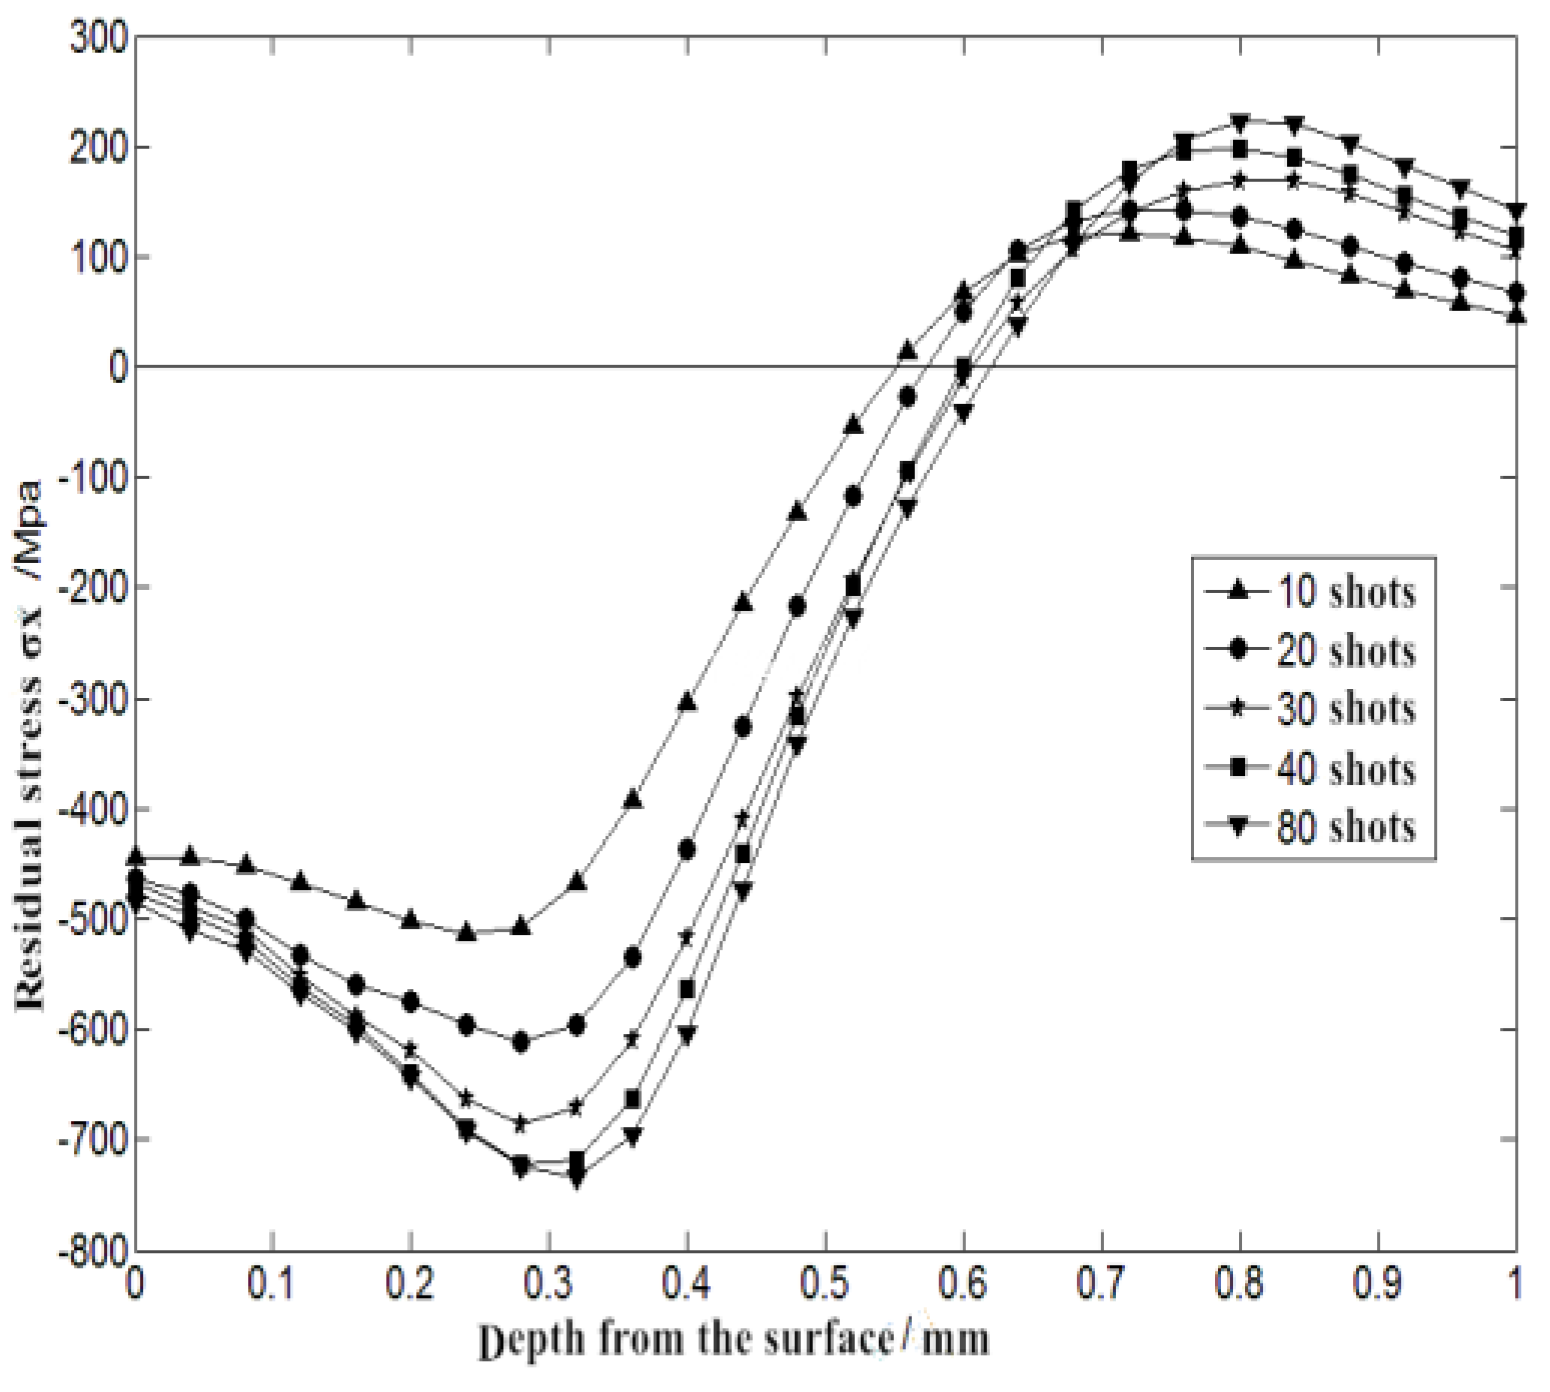
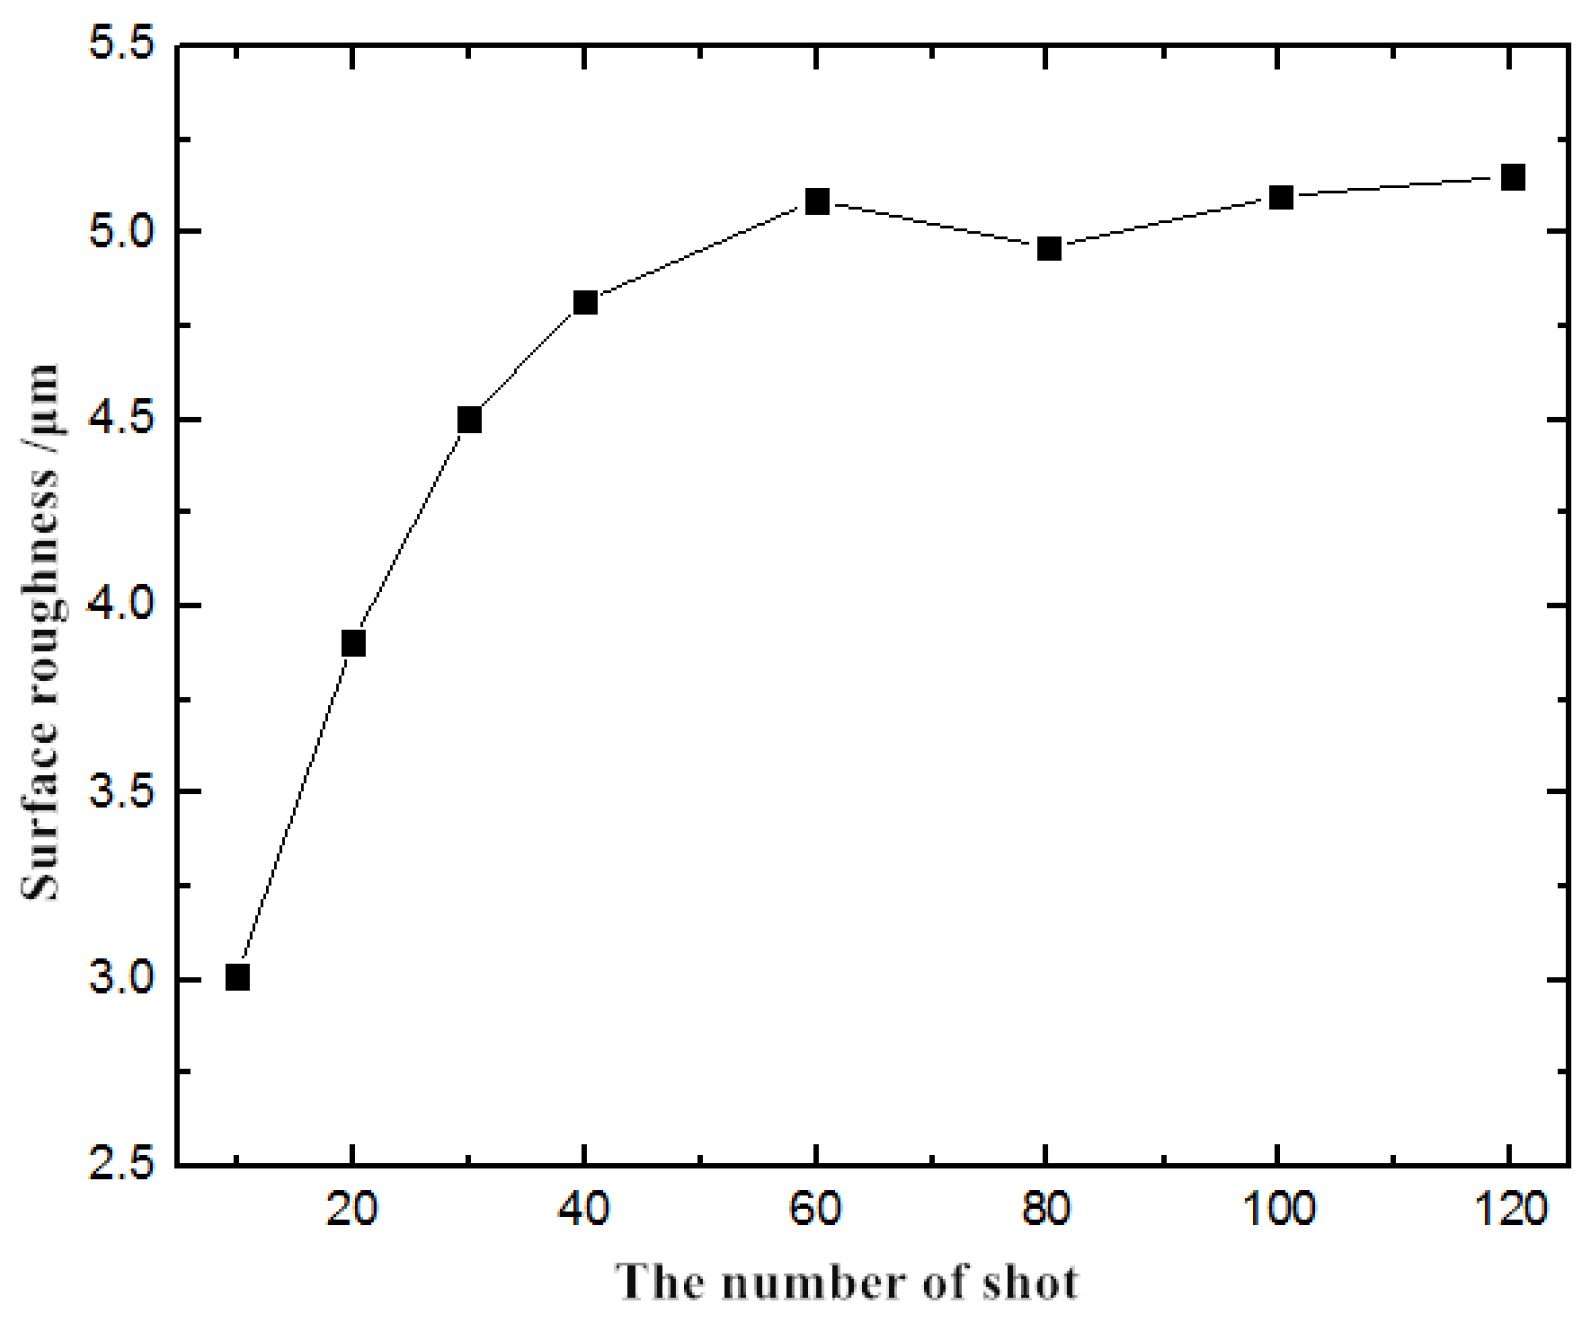
4.1.1. Influence of Shot-Peening Coverage on Residual Stress and Surface Roughness
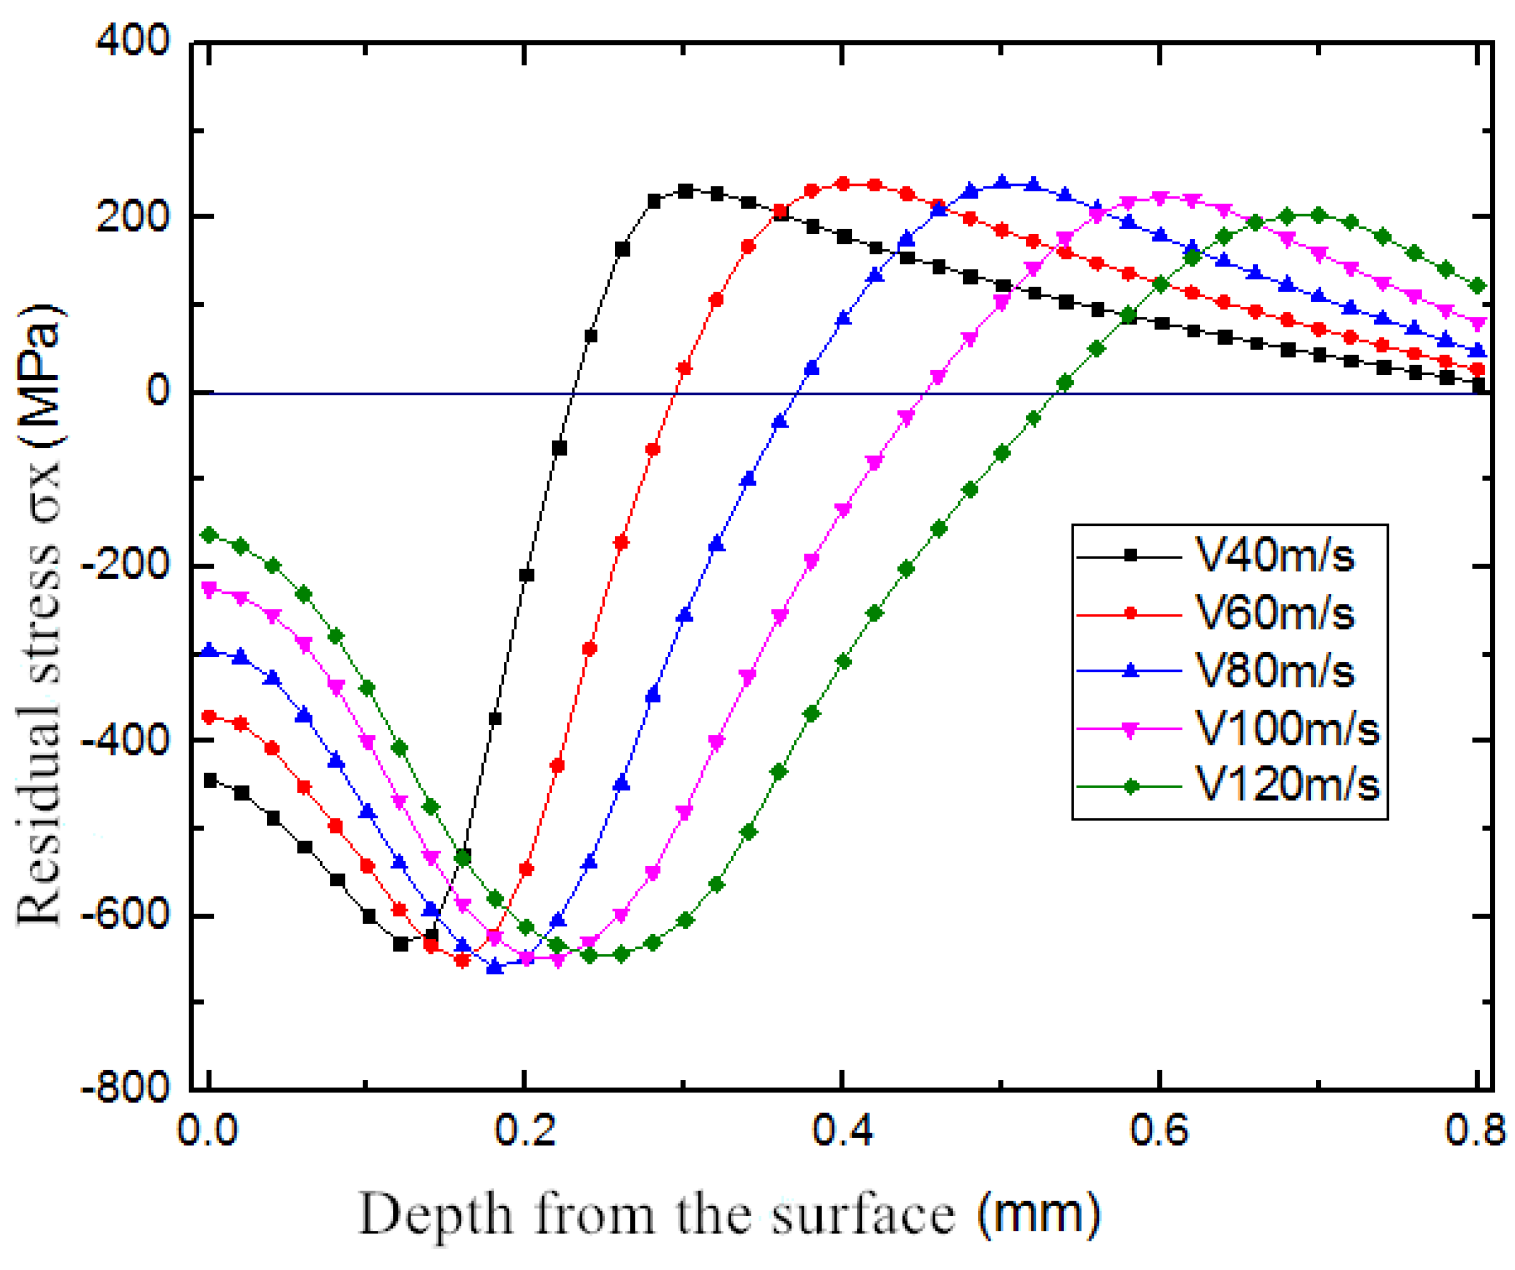
4.1.2. Influence of Different Shot Speeds on Residual Stress and Surface Roughness
4.2. Test Results and Discussion
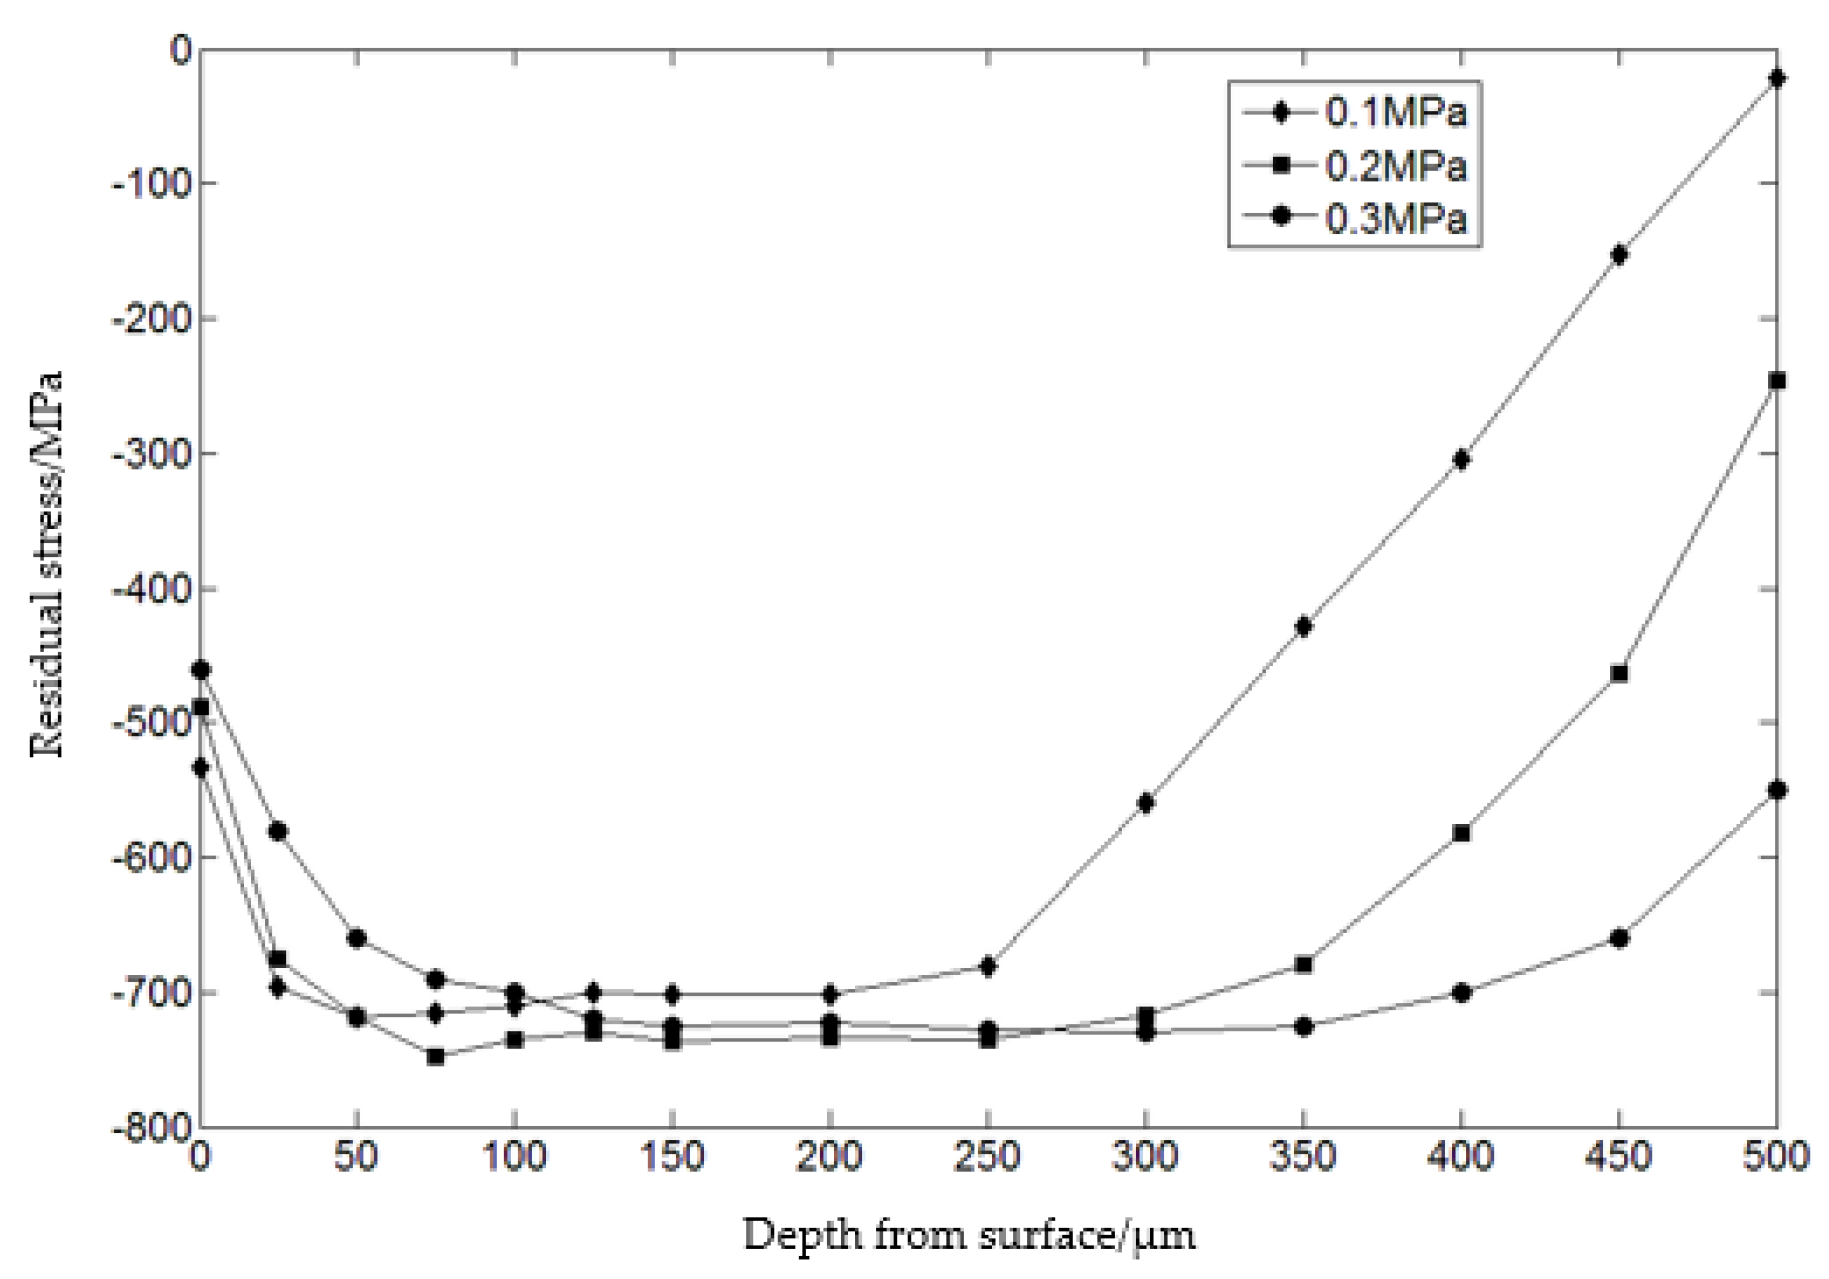
4.2.1. Effect of Shot-Peening on Residual Stress Distribution
4.2.2. Effect of Shot-Peening on Roughness
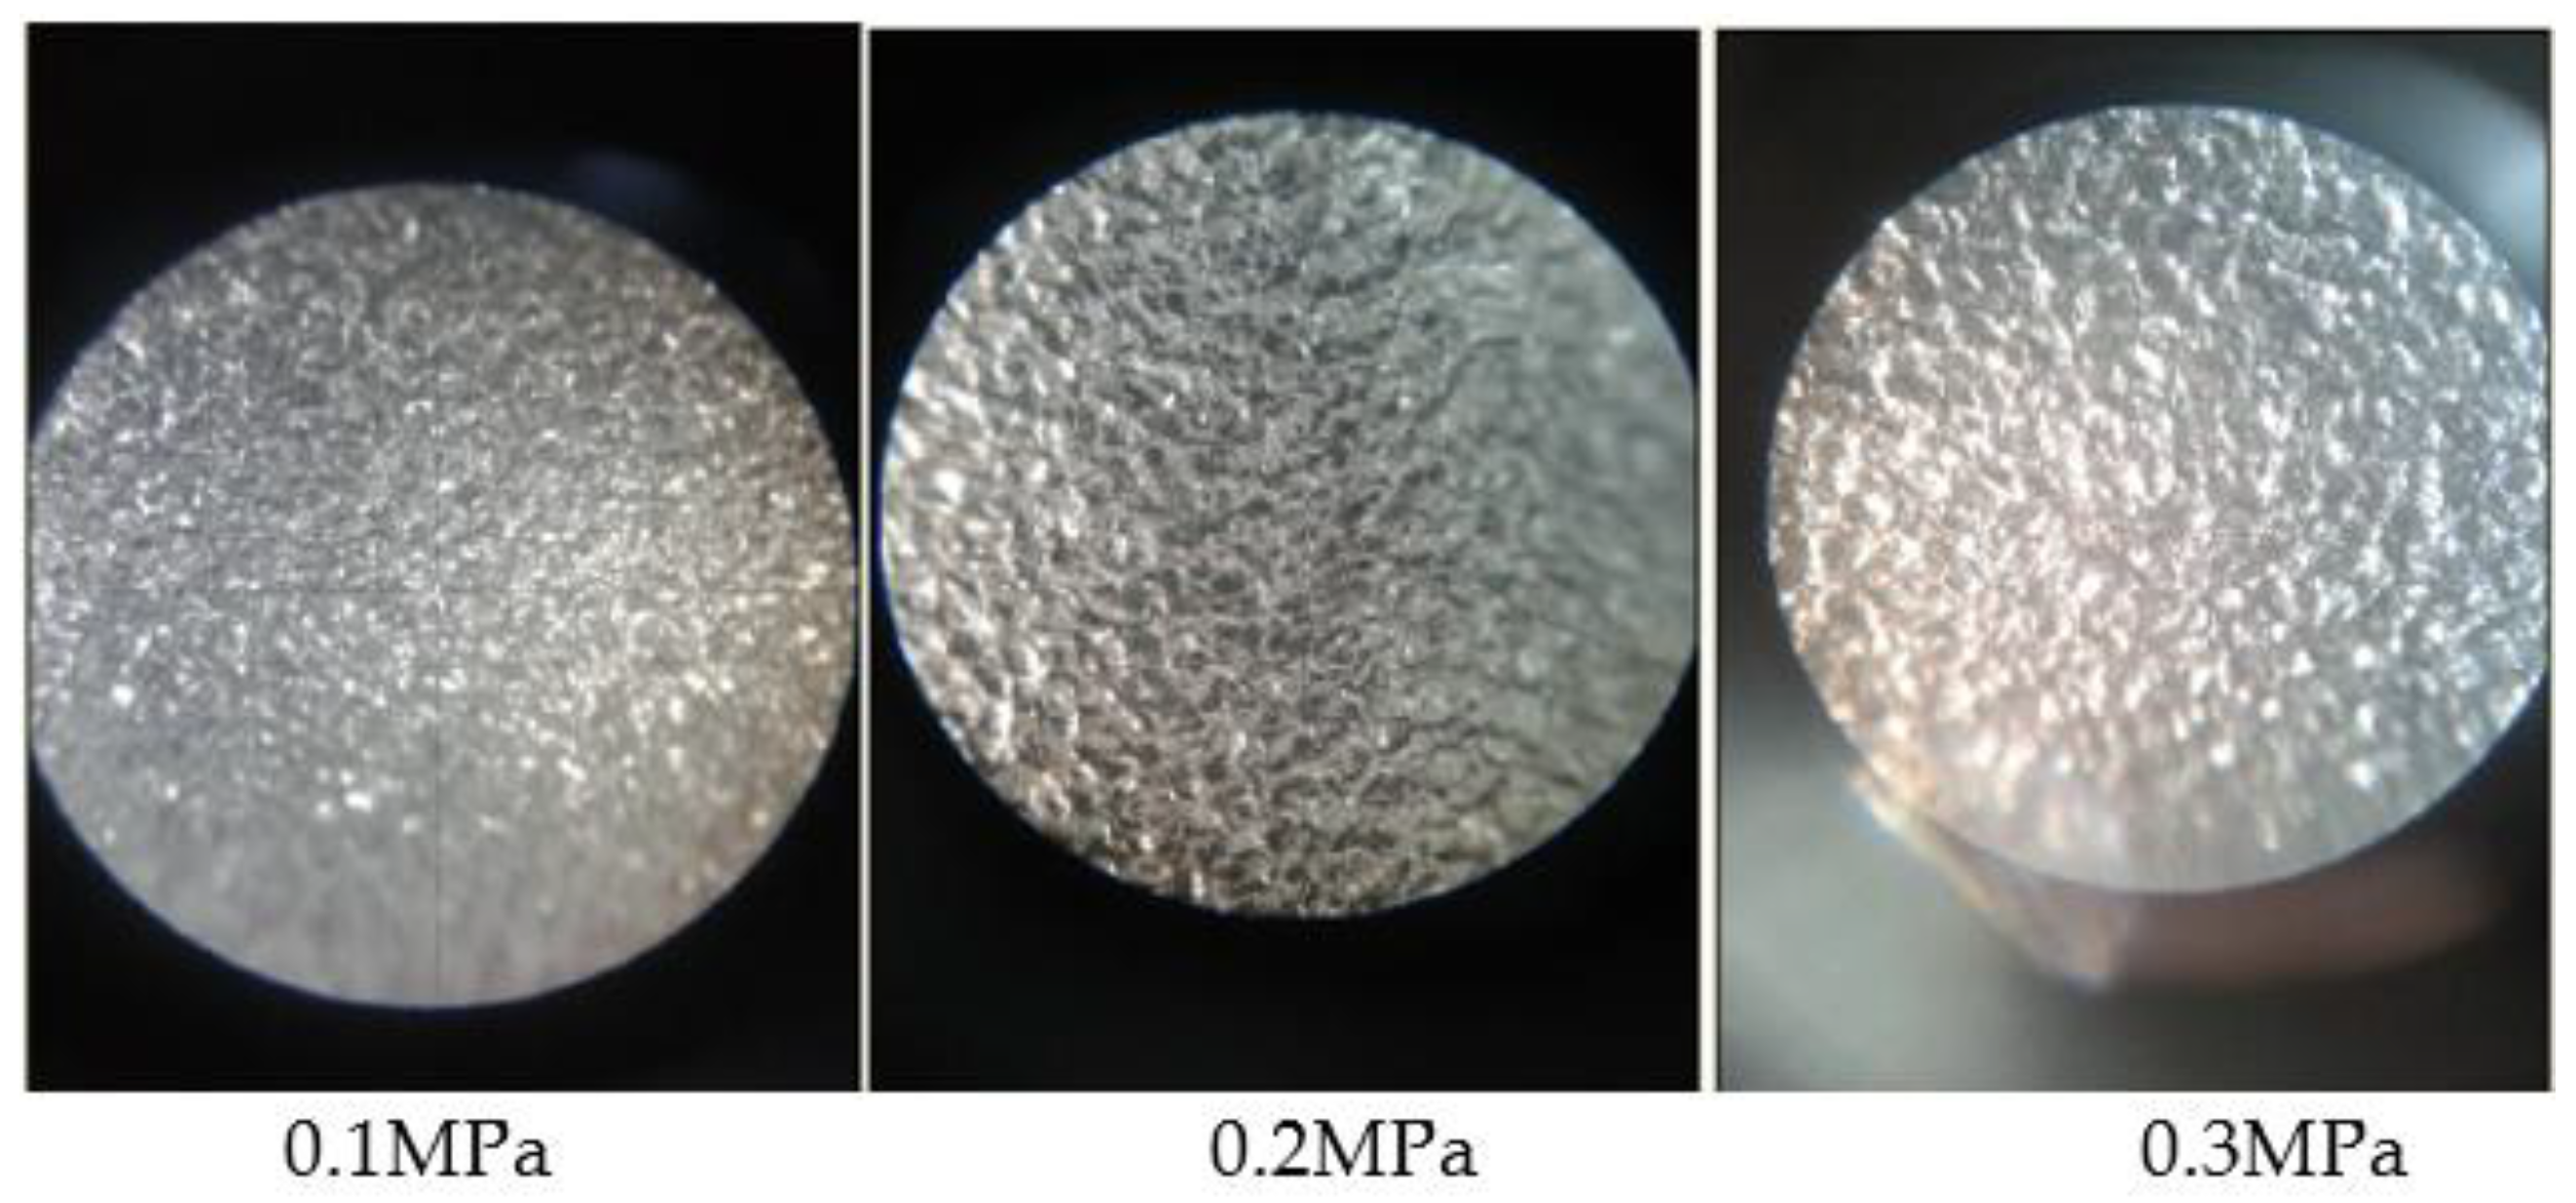
- (1)
- The effect of different shot peening pressure on the roughness
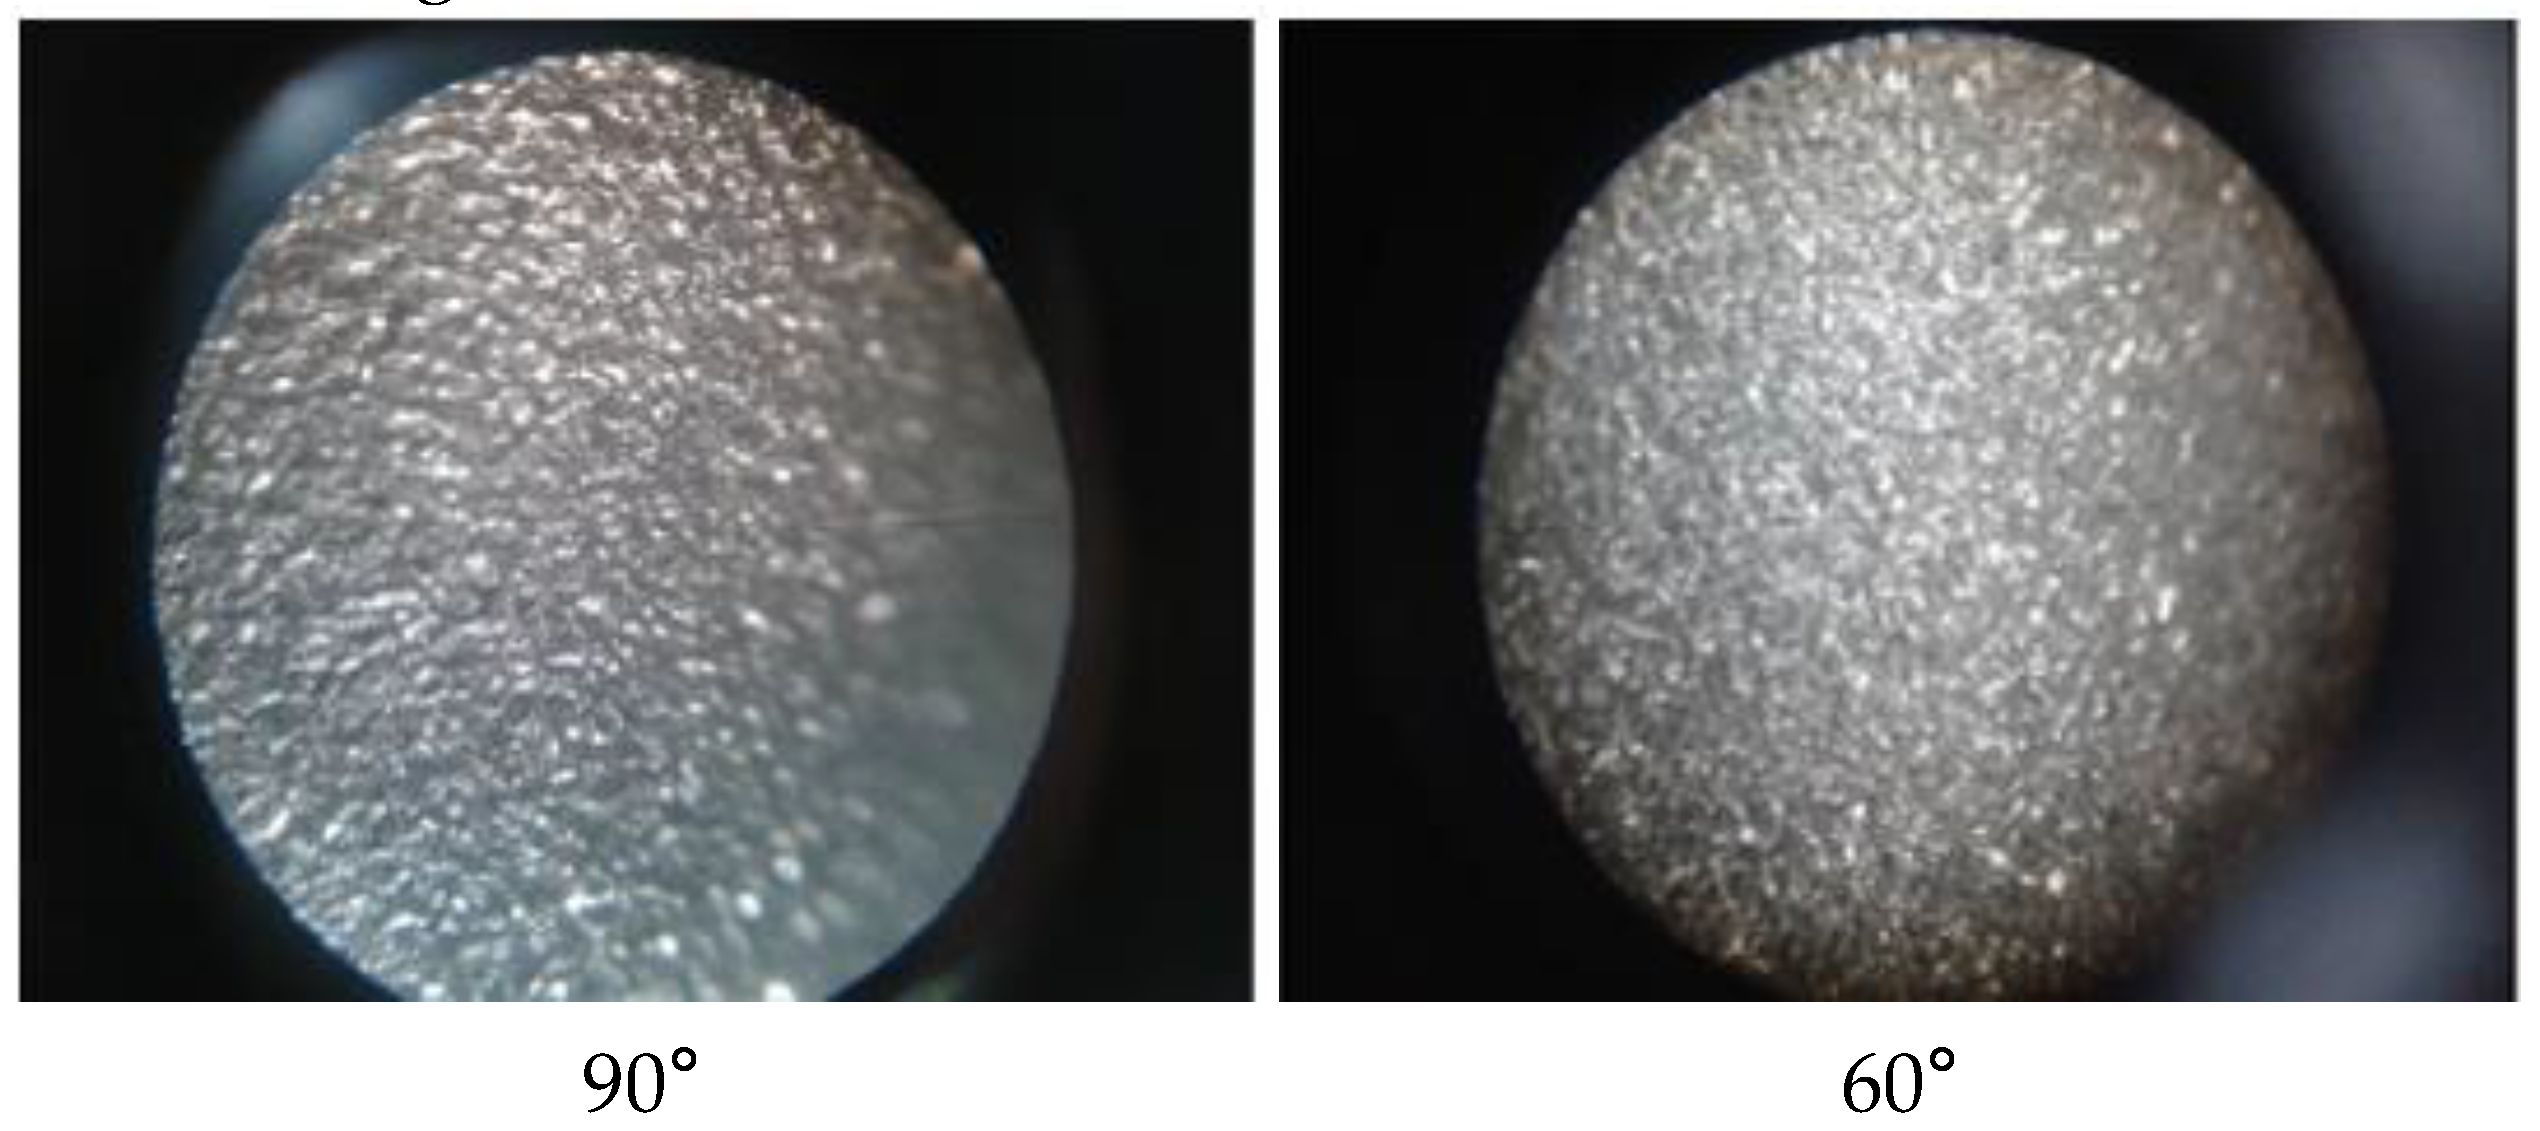
- (2)
- The effect of different injection angles on the roughness
4.2.3. Effect of Shot-Peening on Fatigue Life
- (1)
- Fatigue lives under different shot-peening pressures
- (2)
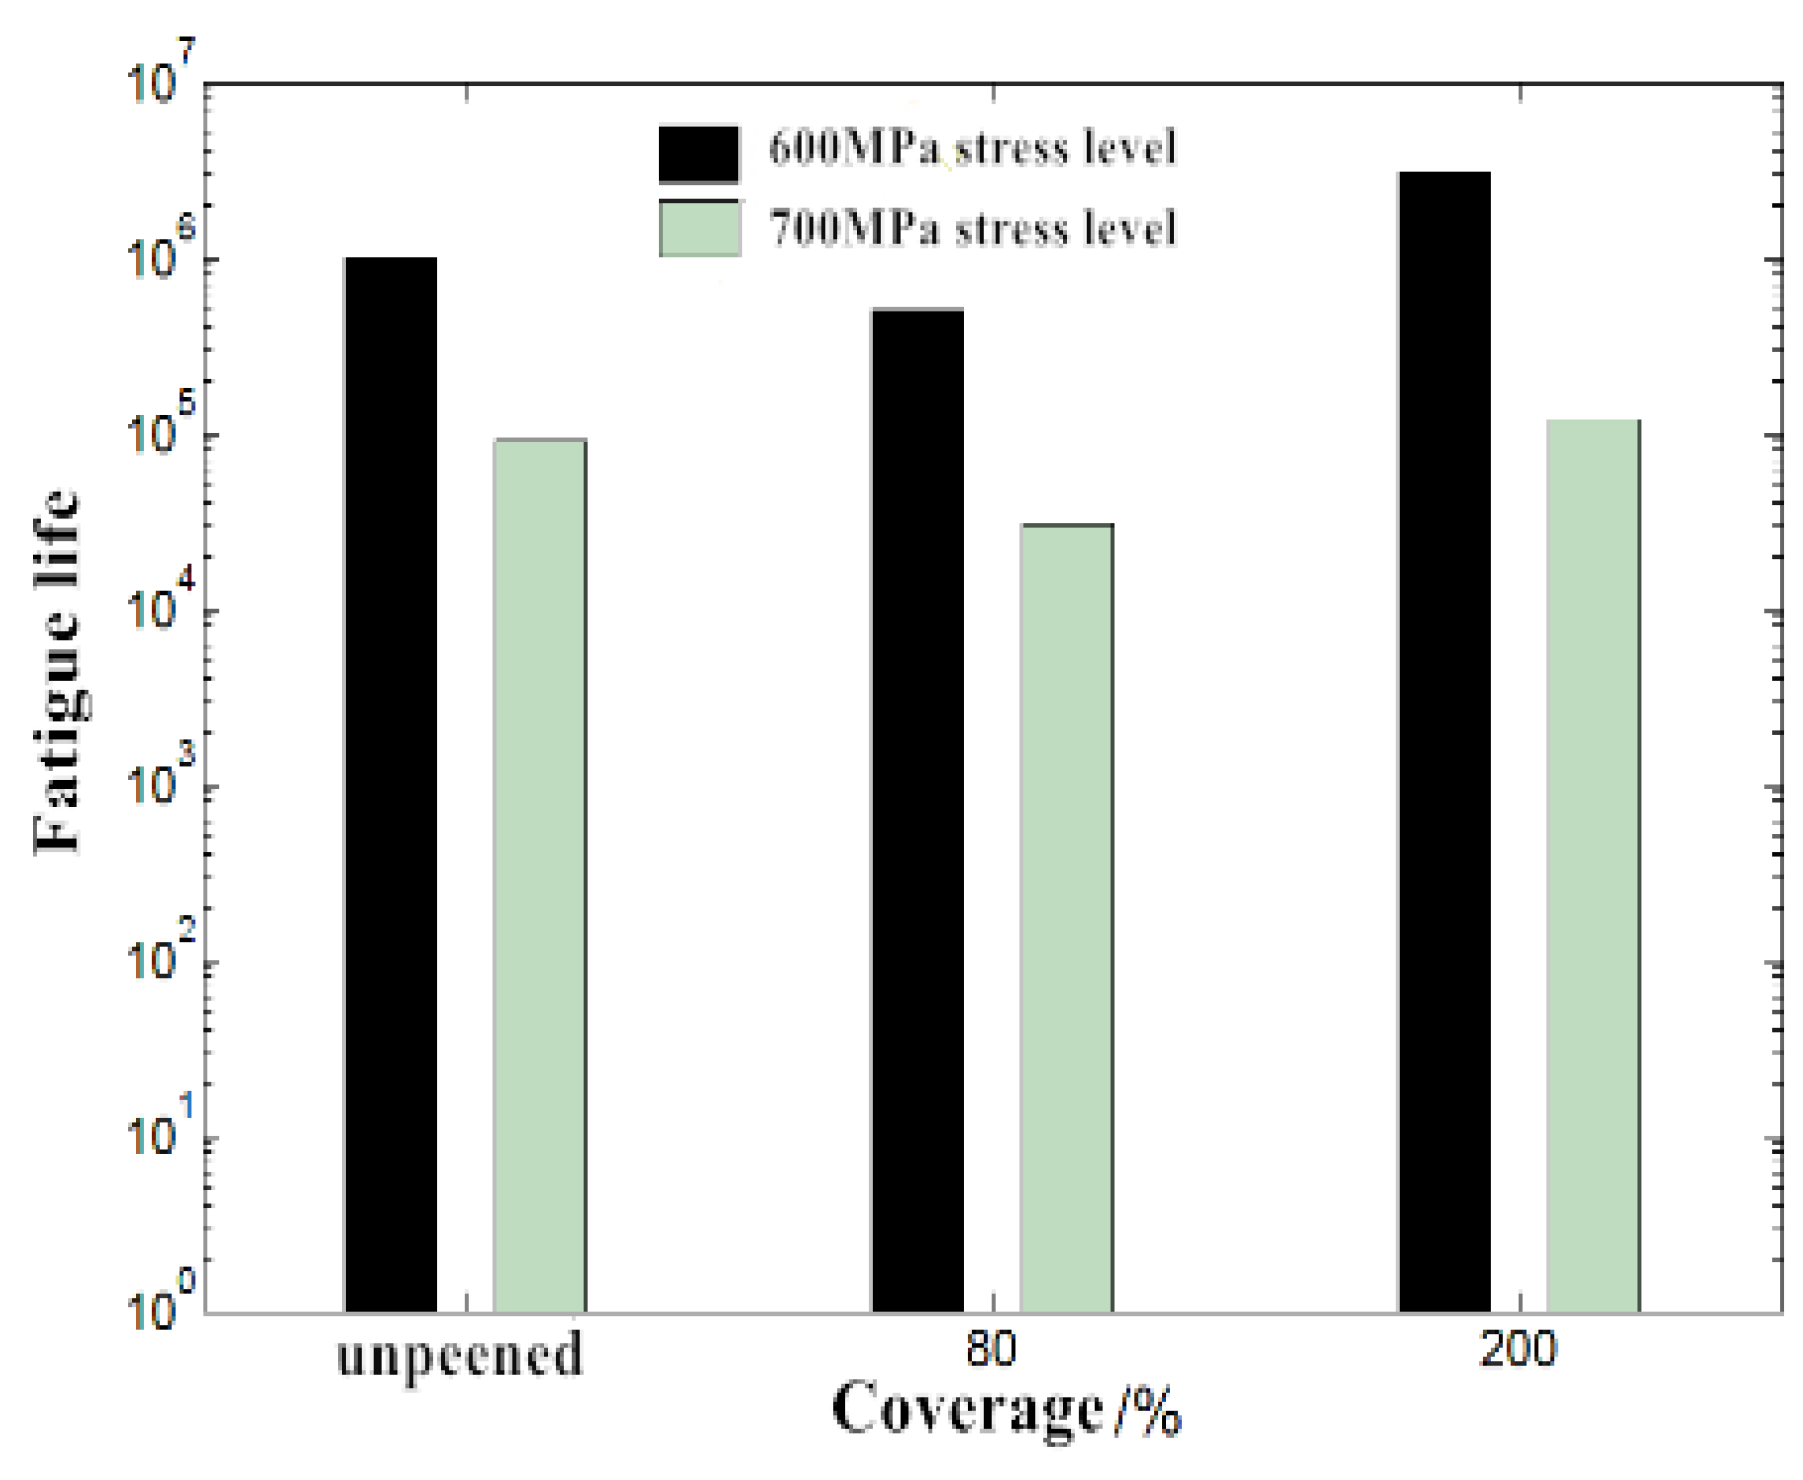
- Fatigue lives under different shot peening coverage rate
- (3)
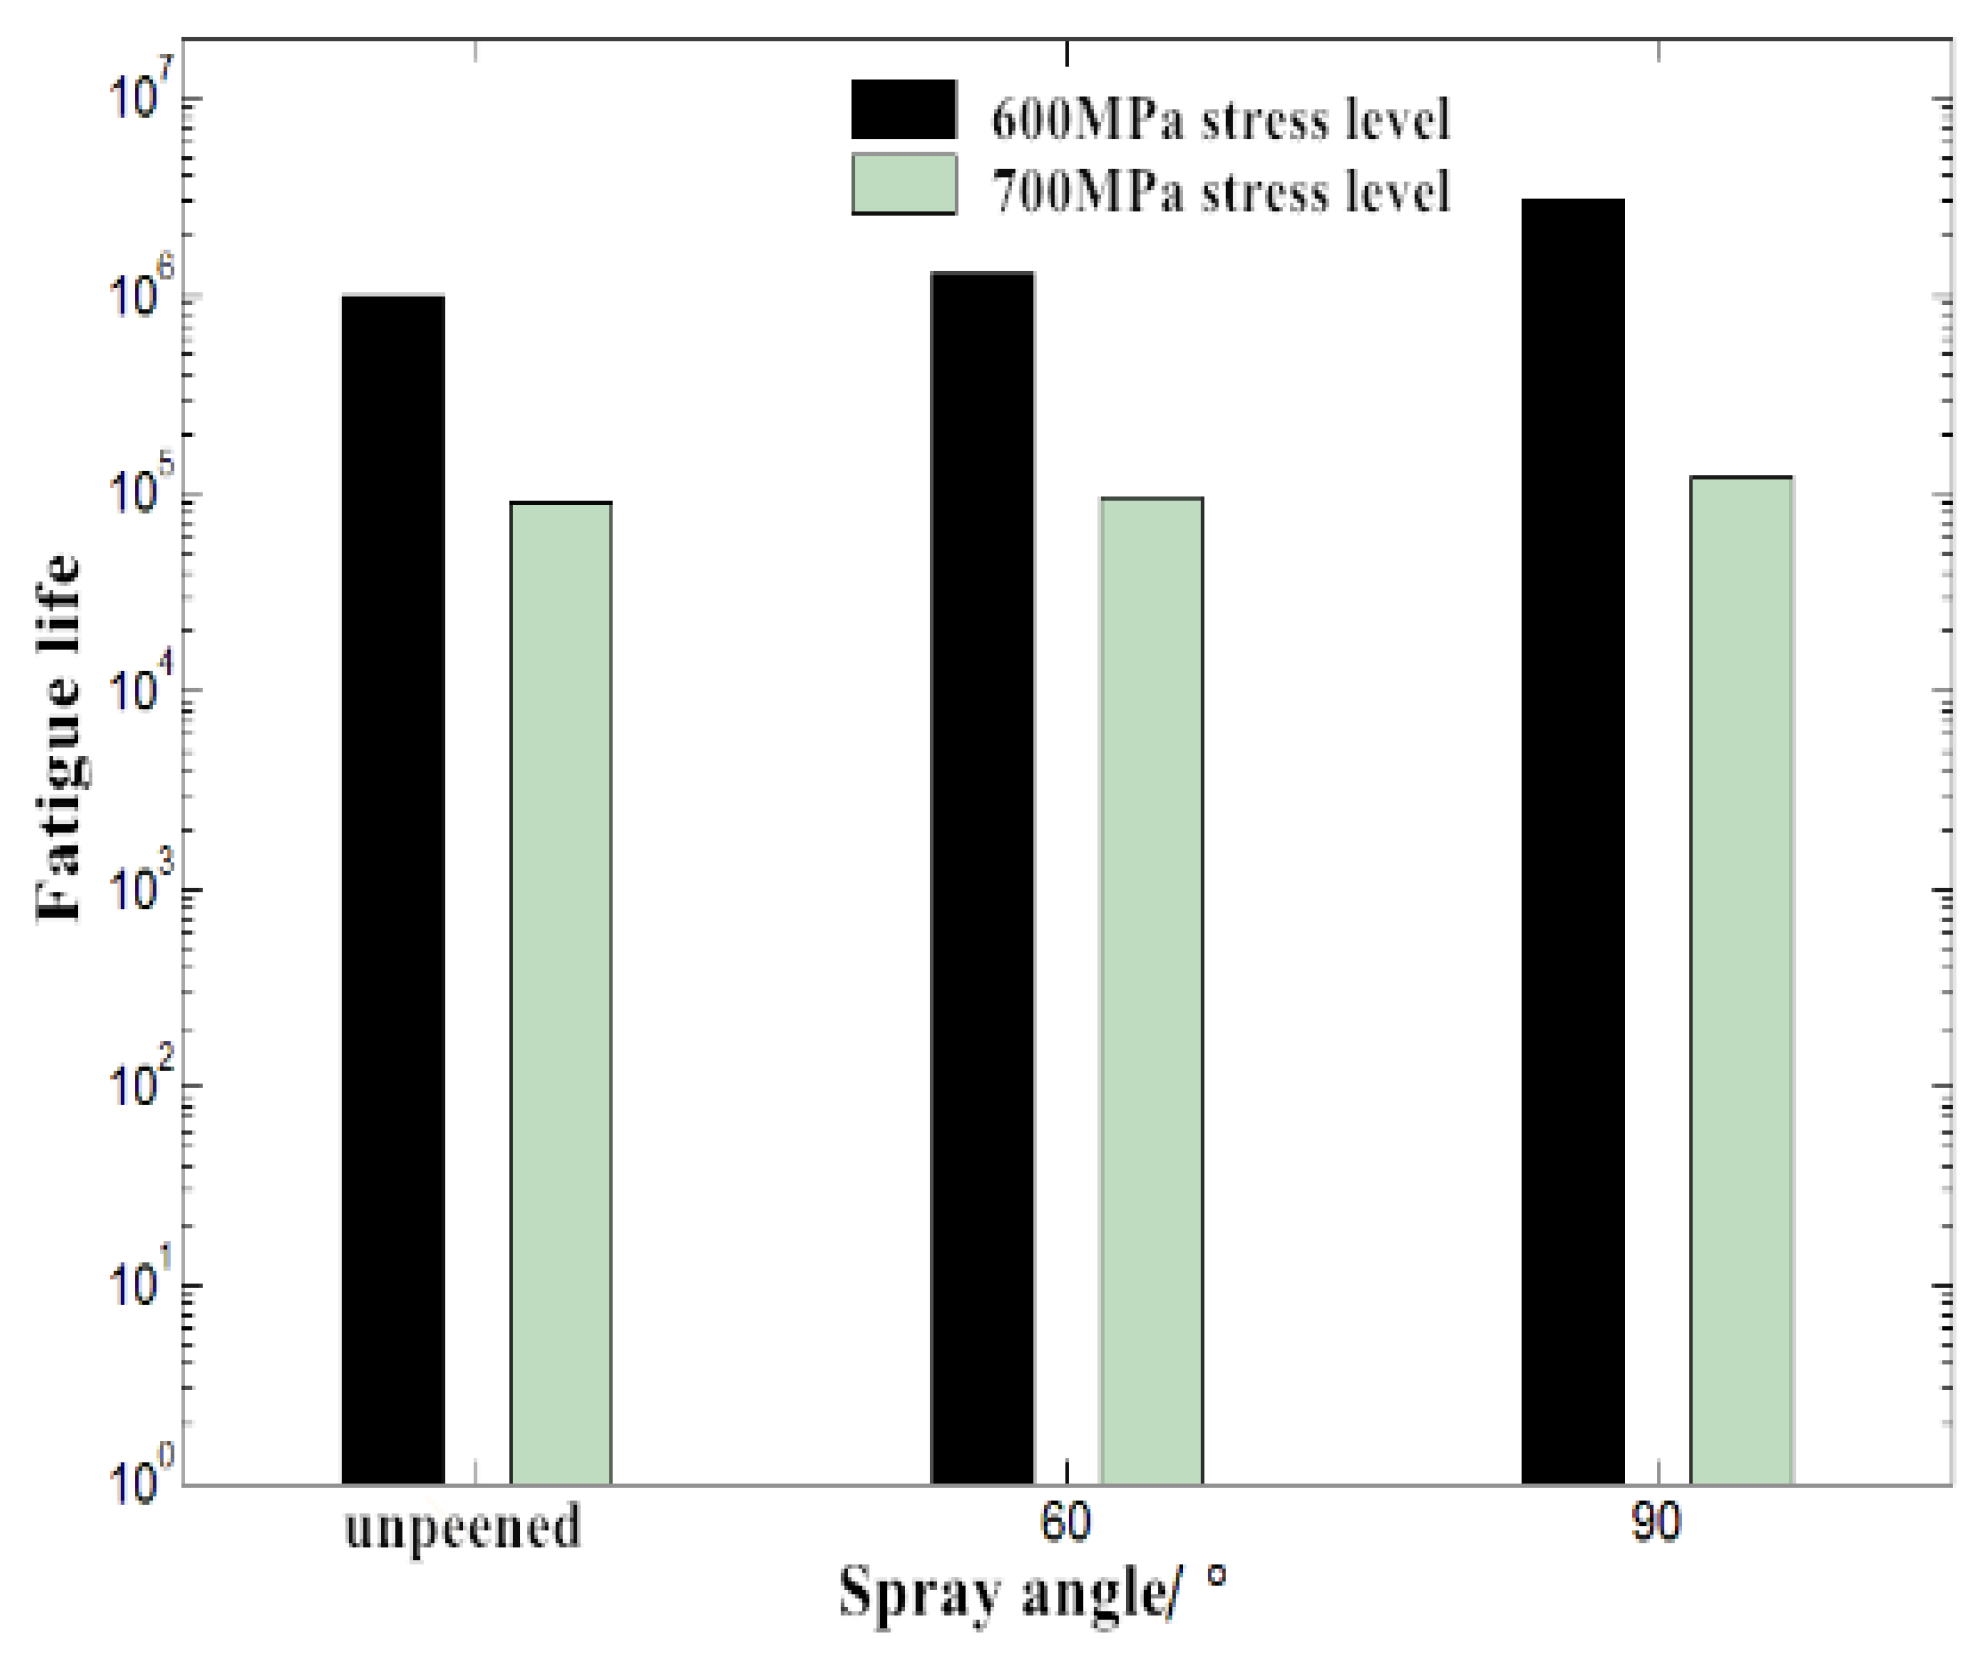
- Effect of different spray angles on fatigue lives
5. Conclusions
- (1)
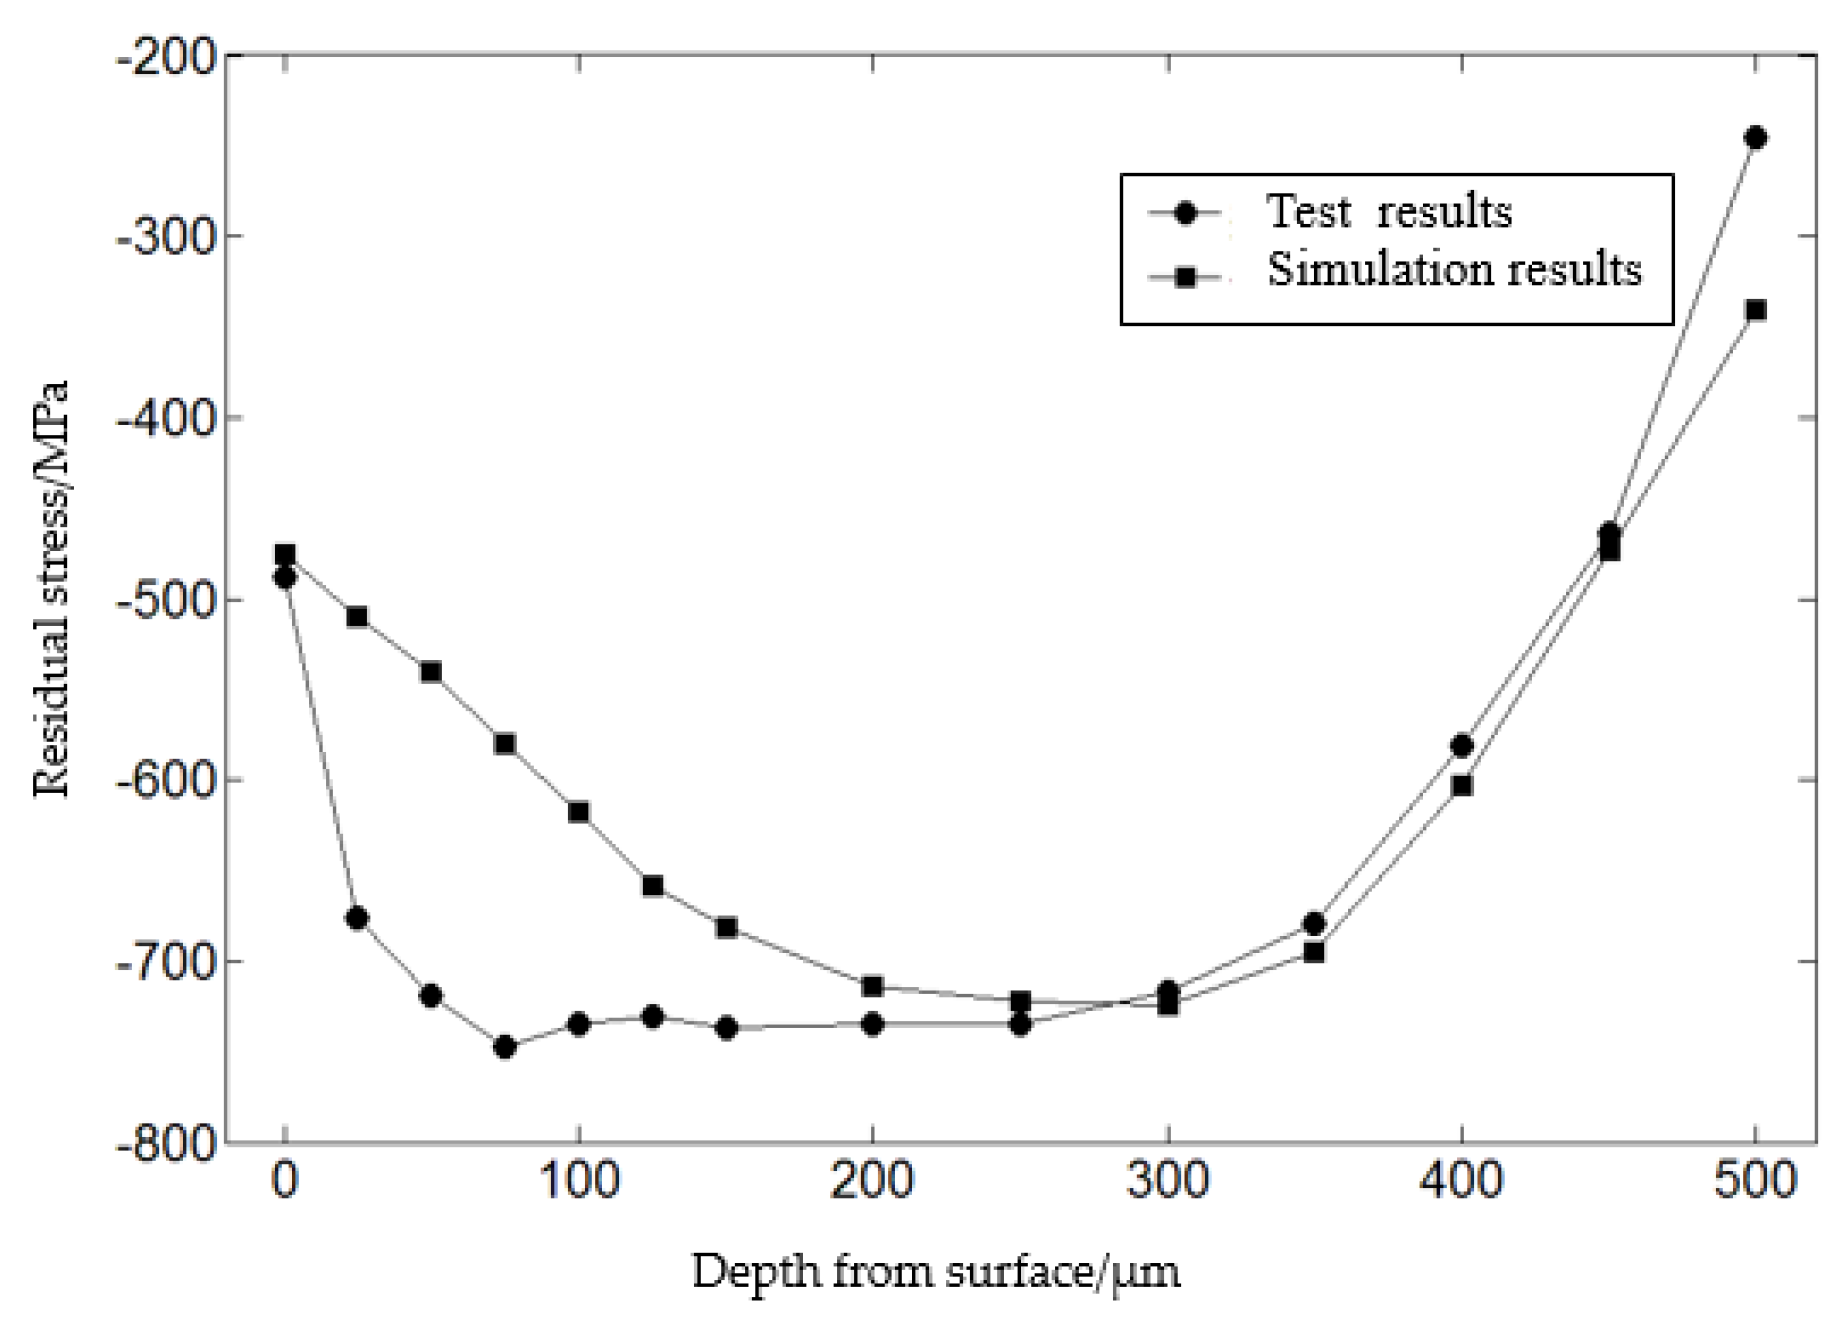
- The simulation results of the multiple-shot random distribution model are basically consistent with the experimental results, which can better simulate the process of shot peening.
- (2)
- With the increase of peening coverage, the depth of the compressive residual stress layer increases and surface roughness becomes larger. However, the residual stress field distribution and surface roughness value become stable when the coverage rate reaches a certain value. The following shot peening will not make it more useful. However, the fatigue life will be reduced when the coverage rate is less than 100%, so the coverage rate must be at least 100%.
- (3)
- With the increase of peening pressure, surface residual compressive stress decreases gradually, and the depth of the residual compressive stress layer increases. Surface roughness becomes larger, correspondingly, and the peak pressure force first increases and then decreases. Nevertheless, the surface of parts will generate micro-cracks due to excessive pressure, which reduces the fatigue life.
Author Contributions
Funding
Institutional Review Board Statement
Informed Consent Statement
Data Availability Statement
Conflicts of Interest
References
- Dong, X.; Zhang, H.; Duan, X. Finite element simulation of residual stress field with water jet peening strengthening. Chin. J. Mech. Eng. 2010, 46, 189–194. [Google Scholar] [CrossRef]
- Concli, F. Numerical study of the impact of shot peening on the tooth root fatigue performances of gears using critical plane fatigue criteria. Appl. Sci. 2022, 12, 8245. [Google Scholar] [CrossRef]
- Huang, H.; Niu, J.; Xing, X.; Lin, Q.; Chen, H.; Qiao, Y. Effects of the shot peening process on corrosion resistance of aluminum alloy: A review. Coatings 2022, 12, 629. [Google Scholar] [CrossRef]
- Villegas, J.C.; Shaw, L.L. Nanocrystallization Process and mechanism in a nickel alloy subjected to surface severe plastic deformation. Acta Mater. 2009, 57, 5782–5795. [Google Scholar] [CrossRef]
- Heydari, A.; Bagherifard, S.; Bradanini, A.; Duó, P.; Henze, S.; Taylor, B.; Guagliano, M. Application of shot peening to case-hardened steel gears: The effect of gradient material properties and component geometry. Surf. Coat. Technol. 2020, 398, 126084. [Google Scholar] [CrossRef]
- Tu, F.; Delbergue, D.; Klotz, T.; Bag, A.; Miao, H.; Bianchetti, C.; Brochu, M.; Bocher, P.; Levesque, M. Discrete element-periodic cell coupling model and investigations on shot stream expansion, Almen intensities and target materials. Int. J. Mech. Sci. 2018, 145, 353–366. [Google Scholar] [CrossRef]
- Sanjurjo, P.; Rodríguez, C.; Peñuelas, I.; García, T.E.; Belzunce, F.J. Influence of the target material constitutive model on the numerical simulation of a shot peening process. Surf. Coat. Technol. 2014, 258, 822–831. [Google Scholar] [CrossRef]
- Gariépy, A.; Miao, H.Y.; Lévesque, M. Simulation of the shot peening process with variable shot diameters and impacting velocities. Adv. Eng. Softw. 2017, 114, 121–133. [Google Scholar] [CrossRef]
- Yang, F.; Chen, Z.; Meguid, S.A. Effect of initial surface finish on effectiveness of shot peening treatment using enhanced periodic cell model. Int. J. Mech. Mater. Des. 2014, 11, 463–478. [Google Scholar] [CrossRef]
- Al-Hassani, S. Mechanical aspects of residual stress development in shot peening. In Proceedings of the 1st International Conference on Shot Peening (ICSP1), Paris, France, 14–17 September 1981; pp. 583–602. [Google Scholar]
- AI-Hassani, S. An engineering approach to shot peening mechanics. In Proceedings of the 2nd International Conference on Shot Peening (ICSP2), Chicago, IL, USA, 14–17 May 1984; pp. 275–281. [Google Scholar]
- Majzoobi, G.H.; Azizi, R.; Alavi Nia, A. A three-dimensional simulation of shot peening process using multiple shot impacts. J. Mater. Process. Technol. 2005, 164, 1226–1234. [Google Scholar] [CrossRef]
- Li, Y.; Lei, L.; Zeng, P. Shot stream finite element model for shot peening numerical simulation and its experiment study. Chin. J. Mech. Eng. 2011, 47, 43–48. [Google Scholar] [CrossRef]
- Gao, Z.; Liao, K.; Chen, J. Surface characteristic function of al alloy after shot peening. Coatings 2021, 11, 160. [Google Scholar] [CrossRef]
- Luan, W. Recent trends on sur face modification technology of shot peening. China Mech. Eng. 2005, 16, 1405–1409. [Google Scholar]
- Unal, O.; Maleki, E.; Karademir, I.; Husem, F.; Efe, Y.; Das, T. Effects of conventional shot peening, severe shot peening, re-shot peening and precised grinding operations on fatigue performance of AISI 1050 railway axle steel. Int. J. Fatigue 2022, 155, 106613. [Google Scholar] [CrossRef]
- Soyama, H. Comparison between the improvements made to the fatigue strength of stainless steel by cavitation peening, water jet peening, shot peening and laser peening. J. Mater. Process. Technol. 2019, 269, 65–78. [Google Scholar] [CrossRef]
- Matuszak, J.; Zaleski, K.; Skoczylas, A.; Ciecielag, K.; Kecik, K. Influence of semi-random and regular shot peening on selected surface layer properties of aluminum alloy. Materials 2021, 14, 7620. [Google Scholar] [CrossRef]
- Wang, P.; Cao, Q.; Liu, S.; Peng, Q. Surface strengthening of stainless steels by nondestructive laser peening. Mater. Des. 2021, 205, 109754. [Google Scholar] [CrossRef]
- Sheng, X.; Xia, Q.; Cheng, X.; Lin, L. Residual stress field induced by shot peening based on random-shots for 7075 aluminum alloy. Trans. Nonferrous Met. Soc. China 2012, 22, s261–s267. [Google Scholar] [CrossRef]
- Hu, D.; Gao, Y.; Meng, F.; Song, J.; Wang, R. Experimental and Numerical Analysis of Microstructures and Stress States of Shot-Peened GH4169 Superalloys. Metall. Mater. Trans. A 2018, 49, 1397–1409. [Google Scholar] [CrossRef]
- Hu, D.; Gao, Y.; Meng, F.; Song, J.; Wang, Y.; Ren, M.; Wang, R. A unifying approach in simulating the shot peening process using a 3D random representative volume finite element model. Chin. J. Aeronaut. 2017, 30, 1592–1602. [Google Scholar] [CrossRef]
- Zhang, H.; Zhang, Y.; Wu, Q. Numerical simulation of shot-peening process and impact effect. Acta Metall. Sin. 2010, 46, 111–117. [Google Scholar] [CrossRef]
- Xiao, X.; Tong, X.; Gao, G.; Zhao, R.; Liu, Y.; Li, Y. Estimation of peening effects of random and regular peening patterns. J. Mater. Process. Technol. 2018, 254, 13–24. [Google Scholar] [CrossRef]
- Yang, Q.; Cheng, J.; Guan, H.; Tan, W.; Zhang, Y. Investigation of wet shot peening on microstructural evolution and tensile-tensile fatigue properties of Ti-6Al-4V alloy. Mater. Chem. Phys. 2022, 291, 126635. [Google Scholar] [CrossRef]
- Li, R.; Liu, D.; Wei, Z.; Xuan, L.; Qiao, M.; Xia, M. Influence of shot peening and surface integrity on the fatigue properties of 300m steel. Mech. Sci. Technol. Aerosp. Eng. 2011, 30, 1418–1421. [Google Scholar]
- Li, J. Determination of superficial stress-strain relationship with x-ray diffraction technique. Chin. J. Mater. Res. 1998, 12, 287–290. [Google Scholar]
- Zhang, Y.; Zhang, Z.; Liu, J. The distribution of residual stress along the depth under different shot peening process. J. Beijing Univ. Technol. 2009, 35, 1584–1590. [Google Scholar]
- Yang, Y.; Qiao, M.; Zhang, W. Influence of shot peening parameters on the residual stress field. China Surf. Eng. 2009, 22, 45–48. [Google Scholar]
- Zhu, X. Application Study of Shot Peening Process on Parts Surface. Mod. Veh. Power 2013, 2, 38–40. [Google Scholar]
- Gundgire, T.; Jokiaho, T.; Santa-aho, S.; Rautio, T.; Järvenpää, A.; Vippola, M. Comparative study of additively manufactured and reference 316 L stainless steel samples—Effect of severe shot peening on microstructure and residual stresses. Mater. Charact. 2022, 191, 112162. [Google Scholar] [CrossRef]


| Yield Strength σs/MPa | Tensile Strength σb/MPa | Elongation δ/% | Section Shrinkage ψ/% | Impact Absorption Energy KU2/J | Hardness/HRC |
|---|---|---|---|---|---|
| 1200~1240 | 1330~1460 | 13.0~14.0 | 58.5~59.5 | 113~121 | 38~42 |
| Measuring method: roll fixing method Ψ | Ψ angle: 0.0°, 24.2°, 35.3°, 45.0° | 2θ scan end angle: 146° |
| Diameter collimator: Φ3 mm | Stress constant: −318 MPa/angle | 2θ scan step: 0.10° |
| The method for determining peak positions: cross correlation method | Diffraction plane: (211) | X-ray tube voltage: 30 KV |
| Target shooting: Cr Kα | 2θ scan start angle: 166° | X-ray tube current:6.7 mA |
Publisher’s Note: MDPI stays neutral with regard to jurisdictional claims in published maps and institutional affiliations. |
© 2022 by the authors. Licensee MDPI, Basel, Switzerland. This article is an open access article distributed under the terms and conditions of the Creative Commons Attribution (CC BY) license (https://creativecommons.org/licenses/by/4.0/).
Share and Cite
Qian, W.; Huang, S.; Yin, X.; Xie, L. Simulation Analysis with Randomly Distributed Multiple Projectiles and Experimental Study of Shot Peening. Coatings 2022, 12, 1783. https://doi.org/10.3390/coatings12111783
Qian W, Huang S, Yin X, Xie L. Simulation Analysis with Randomly Distributed Multiple Projectiles and Experimental Study of Shot Peening. Coatings. 2022; 12(11):1783. https://doi.org/10.3390/coatings12111783
Chicago/Turabian StyleQian, Wenxue, Shuanghui Huang, Xiaowei Yin, and Liyang Xie. 2022. "Simulation Analysis with Randomly Distributed Multiple Projectiles and Experimental Study of Shot Peening" Coatings 12, no. 11: 1783. https://doi.org/10.3390/coatings12111783