Article

Photocatalytic Performance of ZnO/Ag(NPs) Nanocomposite Thin Films under Natural Conditions

1
Unité de Recherche Matériaux & Ingénierie Mécanique, Université de Reims Champagne-Ardenne, 51100 Reims, France
2
Laboratoire de Physique de la Matière Condensée, Université de Picardie-Jules Verne, 80000 Amiens, France
*
Author to whom correspondence should be addressed.
Coatings 2022, 12(11), 1782; https://doi.org/10.3390/coatings12111782
Submission received: 31 October 2022 / Revised: 16 November 2022 / Accepted: 18 November 2022 / Published: 21 November 2022

Abstract

:
The original technique developed for the direct incorporation and efficient dispersion of silver metal NPs into ZnO precursor solution allowed us to elaborate nanocomposite thin films with a large effective surface area for interaction with the external environment as well as a large surface area for metal–semiconductor interaction suitable for surface photocatalysis reactions. Such photocatalysts have the advantage of being in solid form, combining the benefits of the semiconductor material and the metallic nanoparticles embedded in it, while being eco-friendly. Their photocatalytic performance was analyzed under different operating conditions. The improved photocatalytic performance, stability, and reusability of the nanocomposite were demonstrated under both laboratory and natural conditions of use. The results of the present study provide interesting perspectives for the application of these photocatalysts in water treatment.

1. Introduction

Water is the universal solvent that can dissolve more substances than any other liquid; however, it is particularly vulnerable to pollution. All toxic substances resulting from human activities (domestic, agricultural, industrial, …) can be found in water, causing its pollution. Water quality has become not only a public health issue but also an environmental problem, which leads to increasingly strict rules concerning industrial activities. With global warming, wastewater treatment has become an indisputable necessity and the development of efficient and inexpensive recycling techniques is a major challenge for the protection of water resources. Any initiative to clean up water using a minimum of energy contributes not only to the safeguarding of public health but also to the preservation of the environment.
The classical process of wastewater treatment, involving physical, chemical, and biological processes, is not sufficient to remove toxic and hazardous substances from water, especially long-chain molecular substances, such as synthetic dyes, which are non-biodegradable and/or bactericidal. The search for more efficient and inexpensive methods for the treatment of these polluted waters is more than topical. Advanced oxidation techniques developed over the last two decades, such as heterogeneous photocatalysis, represent an efficient solution for the degradation of toxic molecules that are very difficult to eliminate through conventional processes [1]. The general principle of heterogeneous photocatalysis consists in irradiating the surface of a photocatalyst, a semiconductor material, to create electron–hole pairs. These charge carriers will be involved in redox chemical reactions with free radicals to degrade, at least partially, non-biodegradable toxic polluting molecules. The association of the solar resource as an energy source for heterogeneous photocatalysis is an additional factor to boost the research of innovative and low cost photocatalysts, eco-friendly and able to eliminate pollutants such as dyes, pesticides, fertilizers, or bacteria during the treatment of contaminated water.
As the photodegradation reactions occur at the surface of the photocatalyst, powder is the most advantageous form given its higher surface/volume ratio [2]. However, in addition to the risks for human health and/or the environment related to the dispersion of NPs in the environment, the complex problem of filtration for their recovery and reuse gives a definite advantage to photocatalysts deposited on a substrate and to their integration in water treatment systems. If, in addition, the photocatalyst thin film presents a nanogranular morphology more likely to increase its reactive surface, this would give it a clear advantage for industrial applications [3].
In addition to the various advantages of thin film photocatalysts (low cost due to the small amount of material, no collection for recycling, fewer physical alterations, easy integration in various devices, …), the use of solar flux makes their fixed arrangement particularly important. However, the share of publications and patents on thin film photocatalysts using solar resource remains moderate [4].
Wide band gap semiconductors are the most commonly used catalysts [5]. Stability, non-toxicity, and ease of processing are among the key criteria for choosing a photocatalyst. By meeting these criteria, ZnO offers a clear advantage for its use in photocatalysis. Indeed, the valence and conduction bands of this semiconductor are adequately located with respect to the redox potential of water and many organic species. This allows the direct oxidation/reduction of the species adsorbed on its surface, or indirectly by the action of hydroxyl radicals (OH*) from the oxidation of water [6]. TiO2, a semiconductor with the same characteristics and qualities as ZnO, was the first to find applications in the field of photocatalysis. However, its recent ban as a food additive [7] has allowed ZnO to dethrone it as a catalyst, becoming hence the focus of attention in recent years [8].
Among the different techniques for the fabrication of ZnO-based thin film photocatalysts, the sol–gel process coupled with spin-coating offers the advantage of good control of the morphology in order to obtain a dense nanogranular material with a good crystalline quality, conditions that contribute to good photochemical performances [3]. Indeed, the optoelectronic properties are thus improved and enable the creation of electron–hole pairs by irradiation, which in turn generate hydroxyl radicals and superoxide radical anions (O2). These active radicals will degrade organic pollutants until the production of simpler molecules, H2O and CO2.
The beneficial contribution of silver to the photocatalytic properties of ZnO has been widely reported in the literature in recent years. A significant part of these studies has focused on ZnO-based nanostructures decorated with Ag, due to their very advantageous surface-to-volume ratio in the photocatalysis process [9,10,11,12,13,14,15].
To synthesize Ag NPs loaded ZnO-based photocatalyst thin films, we directly included the Ag NPs in the one-step ZnO deposition process. Thus, the possible plasmonic effects linked to the NPs will be favored to the detriment of the simple electronic doping effect. To our knowledge, we are the precursors in the use of such a process. Indeed, users of the sol–gel process combine Ag precursors (most commonly silver nitrates, but also silver acetates) with ZnO precursors [16,17,18,19,20,21,22,23,24]. This approach leads rather to a substitution effect of Zn2+ by Ag+ in the ZnO host matrix.
In a previous paper [25] we presented preliminary results on these nanocomposite thin films demonstrating their feasibility and stability under laboratory operating conditions. In this paper, we have deeply revisited this study and extended it to natural operating conditions, using river water solution and using sunlight as an illumination source.

2. Experimental

2.1. Elaboration by Sol–Gel Coupled with Spin-Coating

The sol–gel spin-coating deposition process has been previously described [25]. It is schematically recalled in Figure 1 The preparation of the ZnO precursor solution involves the dissolution of zinc acetate dehydrate (Zn(CH3CO2)2·2H2O) of concentration 1 mol/L in propanol (C3H8O) and monoethanolamin (C2H7NO) as a stabilizer at the same concentration (1 mol/L). Lower concentrations of zinc acetate dihydrate led to macroscopically discontinuous deposits similar to islands separated by voids [3]. This morphology would not be advantageous in the intended application of photocatalysis.
We used 20 nm sized Ag NPs provided by US Research Nanomaterials, Inc. After 30 min of ultrasonic stirring, a quantity of Ag NPs is added to the ZnO precursor solution in mass percentage such as 5% ≤ Ag/ZnO ≤ 30%. The solution is left to rest for 24 h. After 5 min of ultrasonic stirring and efficient dispersion of Ag, a few drops are deposited by spin-coating on a crystalline silicon (c-Si) substrate. The elaboration of the ZnO/Ag(NPs) composite thin films is performed according to the following protocol:
-
Deposition of 4 successive layers of ZnO/Ag(NPs) nanocomposite by spin-coating with a rotation speed equal to 2500 rpm, each one during 20 s.
-
Heat treatment of each deposited layer at 300 °C for 10 min to evaporate the solvent and solution residues.
-
Heat treatment of the final nanocomposite film at 550 °C for 1 h to improve its crystalline structure.

2.2. Characterization Techniques

The characterization of the film morphology was performed with a JEOL scanning electron microscope (SEM, JEOL JSM-7900f, Tokyo, Japan) coupled with an EDX analysis and a Digital Instruments nanoscope III atomic force microscopy (AFM, Digital, Los Angeles, CA, USA) in the tapping mode. The Raman spectroscopy measurements (Renishaw) were performed with a blue–green laser of wavelength λ = 532 nm. The Fourier transform infrared spectrometer (FTIR, Nicolet iS50, Thermofischer, Courtaboeuf, France), can operate in transmission or reflection mode, in the range of wavenumbers 400 cm−1–4000 cm−1 with a resolution of 4 cm−1. X-ray diffractometer (D8 Advance Bruker, Billerica, MA, USA) equipped with a copper anticathode (λ CuKα = 1.54056 Å), in the range of 30°–80°, with a scan rate of 1 s by step, was used to analyze the structure of ZnO/Ag(NPs) nanocomposites.
The optical characterization was carried out with a Jobin-Yvon Uvisel UV-visible spectroscopic ellipsometer (SE, Horiba, Palaiseau, France) in the photon energy range 1.5 eV ≤ E ≤ 5 eV at an incident angle of 70°. Ellipsometry measures the change of polarization state between incident light and reflected light on a sample, resulting from multiple reflections due to the thin film structure and optical properties of the media and interfaces. SE measurements were treated assuming a representative bi-layer optical model with a bulk layer (with a thickness db) and a top roughness layer (with a thickness ds). We used an original inversion process described elsewhere [26,27,28] to extract db and ds as well as the complex dielectric function ε = εr + i of the deposited material. The surface roughness layer is considered to be formed by 50% of the same material as the bulk layer and 50% of the void (εV = 1).
The photocatalytic activity was investigated on 1.5 cm × 1.5 cm sized samples through the degradation of indigo carmine (IC: C16H8N2Na2O8S2) solution with a concentration of 6.6 mg/L in water. Indigo carmine, the most widely used dye for fiber dyeing (such as jeans), is known for its harmful effects of toxicity and non-biodegradability. However, few works have been devoted to its photodegradation by the ZnO/Ag composite [29]. In the laboratory conditions, the illumination of ZnO/Ag(NPs) nanocomposite immersed in the solution, was provided by a 450 W (75 mW/cm2) halogen lamp, equipped with a UV cutting filter, giving an emission spectrum similar to the solar spectrum and a 1 W, 365 nm UV-lamp (2 mW/cm2). For photocatalysis experiments, we used 1.5 cm × 1.5 cm sized samples.

3. Results and Discussion

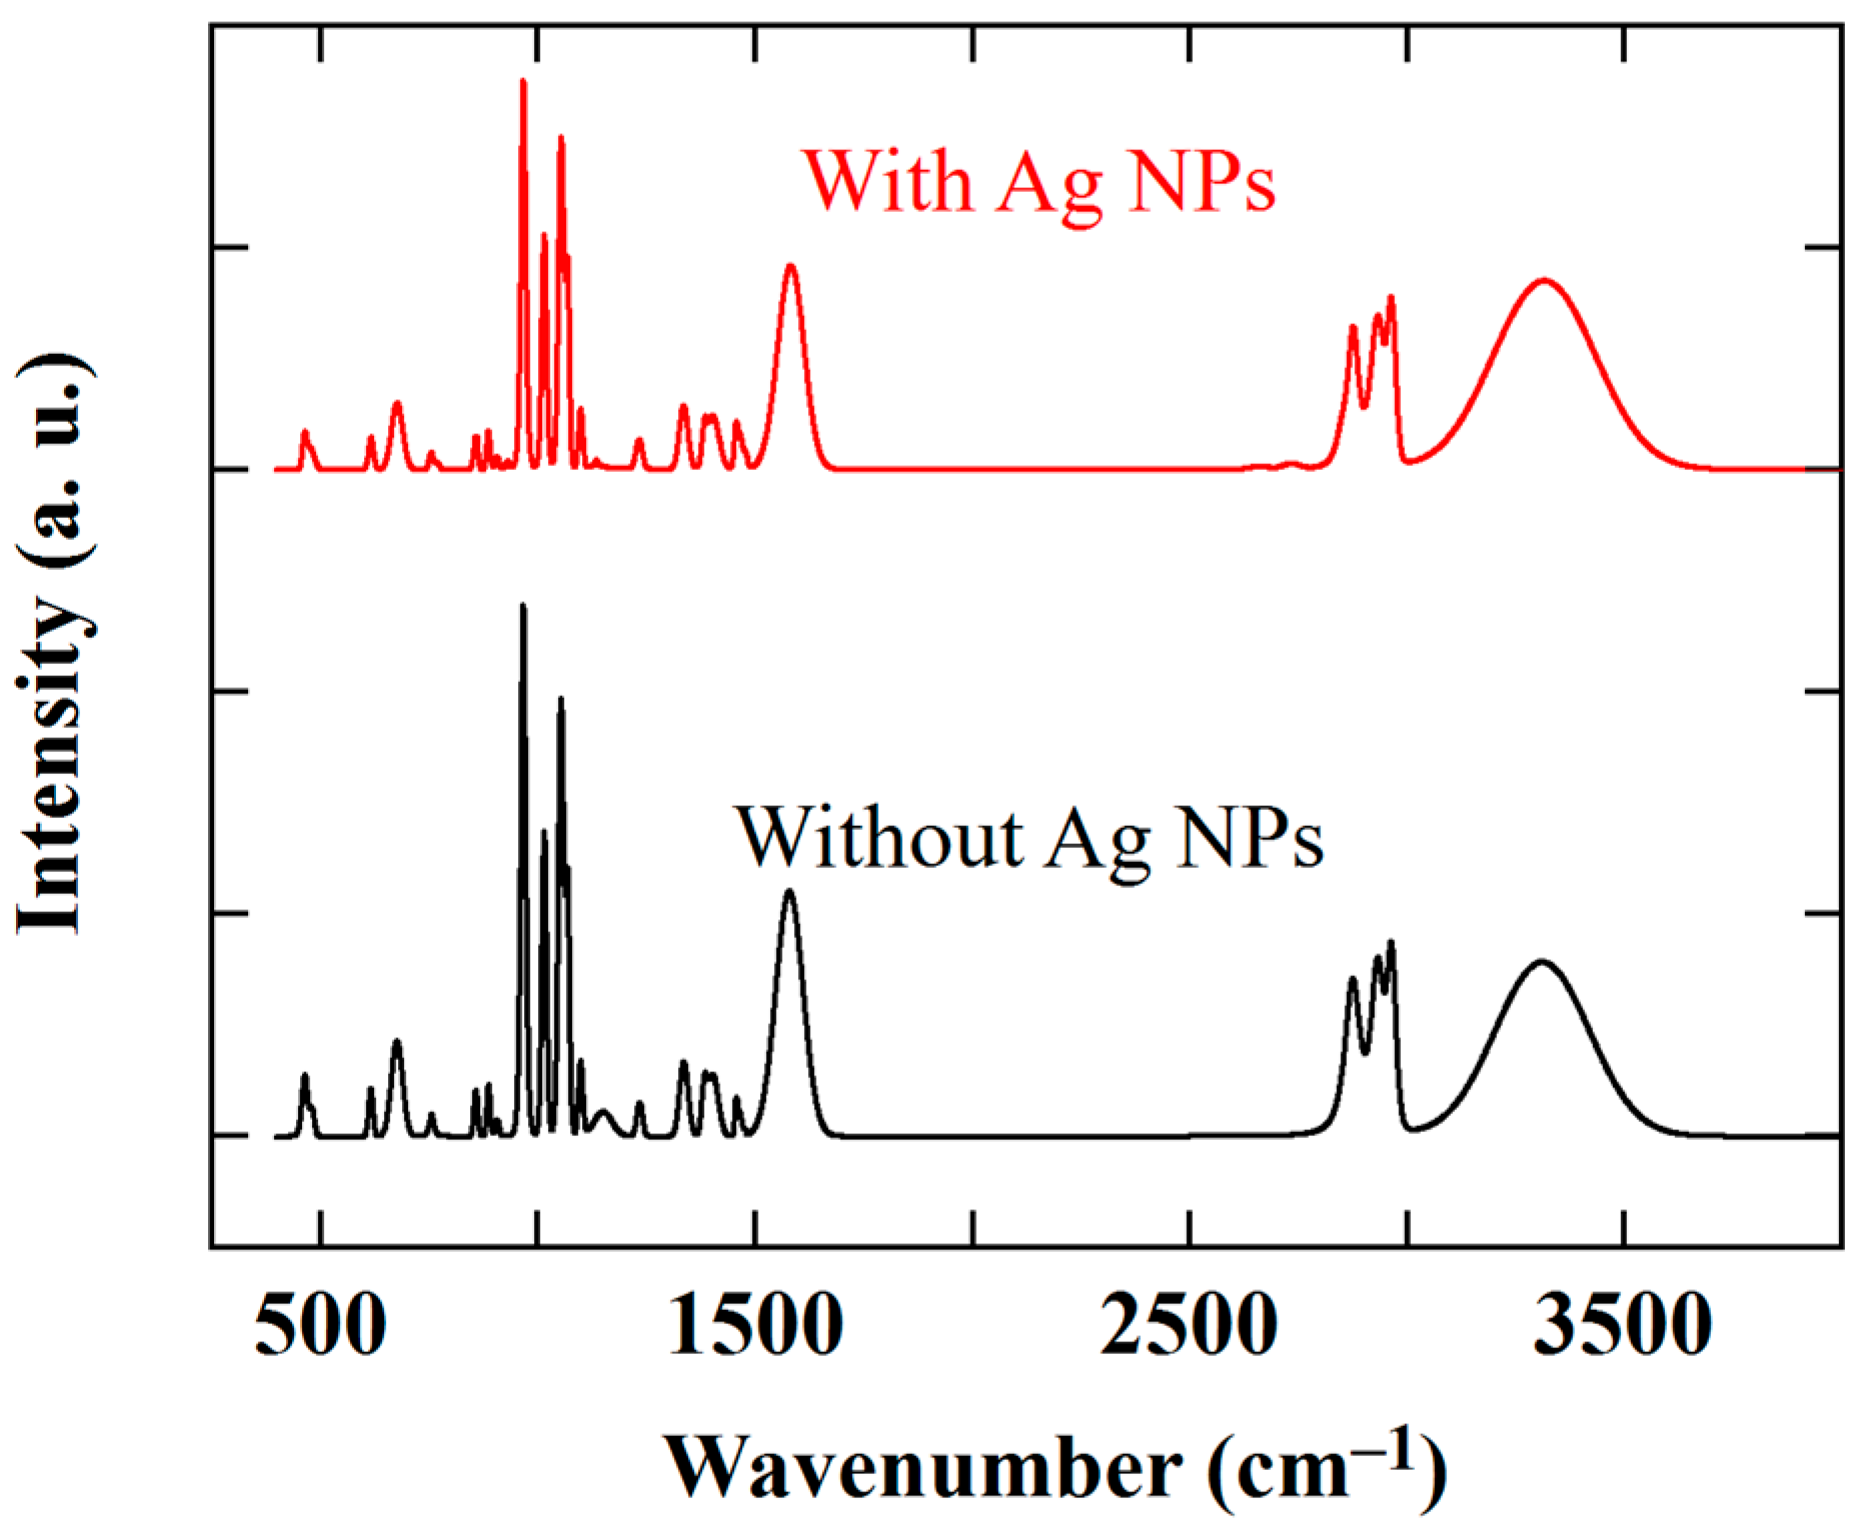
3.1. Ag NPs in the Precursor Solution

We checked the stability of the Ag NPs in the precursor solution with both Fourier transform infrared absorption (FTIR) and Raman spectroscopy. Figure 2 shows the FTIR spectra of ZnO precursor solution in the wave number range 400 cm−1–4000 cm−1, before and after the addition and dispersion of a quantity of Ag NPs in a mass ratio Ag/ZnO = 10%. The two spectra are perfectly similar with a broad band at 3322 cm−1 and a lesser broad band at 1580 cm−1 corresponding to the vibrations of the N–H bond of a primary amine of monoethanolamine, but also to the O–H vibrations of the solvent [30]. The bands between 2870 and 2920 cm−1 correspond to the elongation vibration wave numbers of the CH3 and CH2 groups. The vibrations between 1350–1450 cm−1 are assigned to the symmetric vibrations of CH2 and CH3 [30]. The elongation of the C–O bond of the primary alcohol is between 1030 and 1075 cm−1 [30,31], but the vibration at 1010 cm−1 may also correspond to C–N elongation [30]. The band between 400 cm−1 and 500 cm−1 corresponds to the Zn–O bond [32,33,34]. The spectra in Figure 2 show no vibrational modes of bonds involving ZnO and silver. According to Oje et al. [35], the vibrations of Ag–O silver oxide give a contribution at 530 cm−1. The absence of any bonding between ZnO and silver indicates the stability of Ag NPs in the precursor solution.
The stability of Ag NPs in the ZnO precursor solution was also checked through Raman spectroscopy measurements. Figure 3 displays the Raman spectra of the ZnO precursor solution, between 90 cm−1 and 1350 cm−1, before and after the addition and dispersion of 10% of Ag NPs. Without Ag NPs, the spectrum exhibits two Raman vibrational modes at 442 and 609 cm−1. A vibrational mode at 426 cm−1, corresponding to the E2(high) mode of zinc acetate dissolved in ethanol, has been reported in the literature [36]. This mode is shifted from the Raman mode of zinc acetate powder located at 434 cm−1 [36]. Thus, the mode at 442 cm−1 would correspond to zinc acetate. Solid ZnO is characterized by an E1(LO) Raman mode at 591 cm−1 [37]. In precursor form, this mode is shifted to 609 cm−1. The shift of both modes would be due to the measurement performed on a solution.
When Ag NPs are added to the precursor solution, both modes of ZnO display a higher intensity and an additional vibration mode with lower intensity appears at 246 cm−1. This mode cannot correspond to Zn–Ag interaction, since the Raman spectrum of silver-doped ZnO shows a characteristic mode Zn–Ag at 393.7 cm−1 [38,39] whereas the vibrations of Ag NPs are characterized by a vibration mode at 241 cm−1 [40]. Therefore, the additional mode observed at 246 cm−1 is necessarily due to Ag NPs.
In conclusion, from measurements of the vibrational properties, it can be stated that:
(i)
Ag NPs, once added and dispersed in the ZnO precursor solution, do not dissolve in solution.
(ii)
They remain present in metallic form in the solution and no doping effect of ZnO by silver is generated.

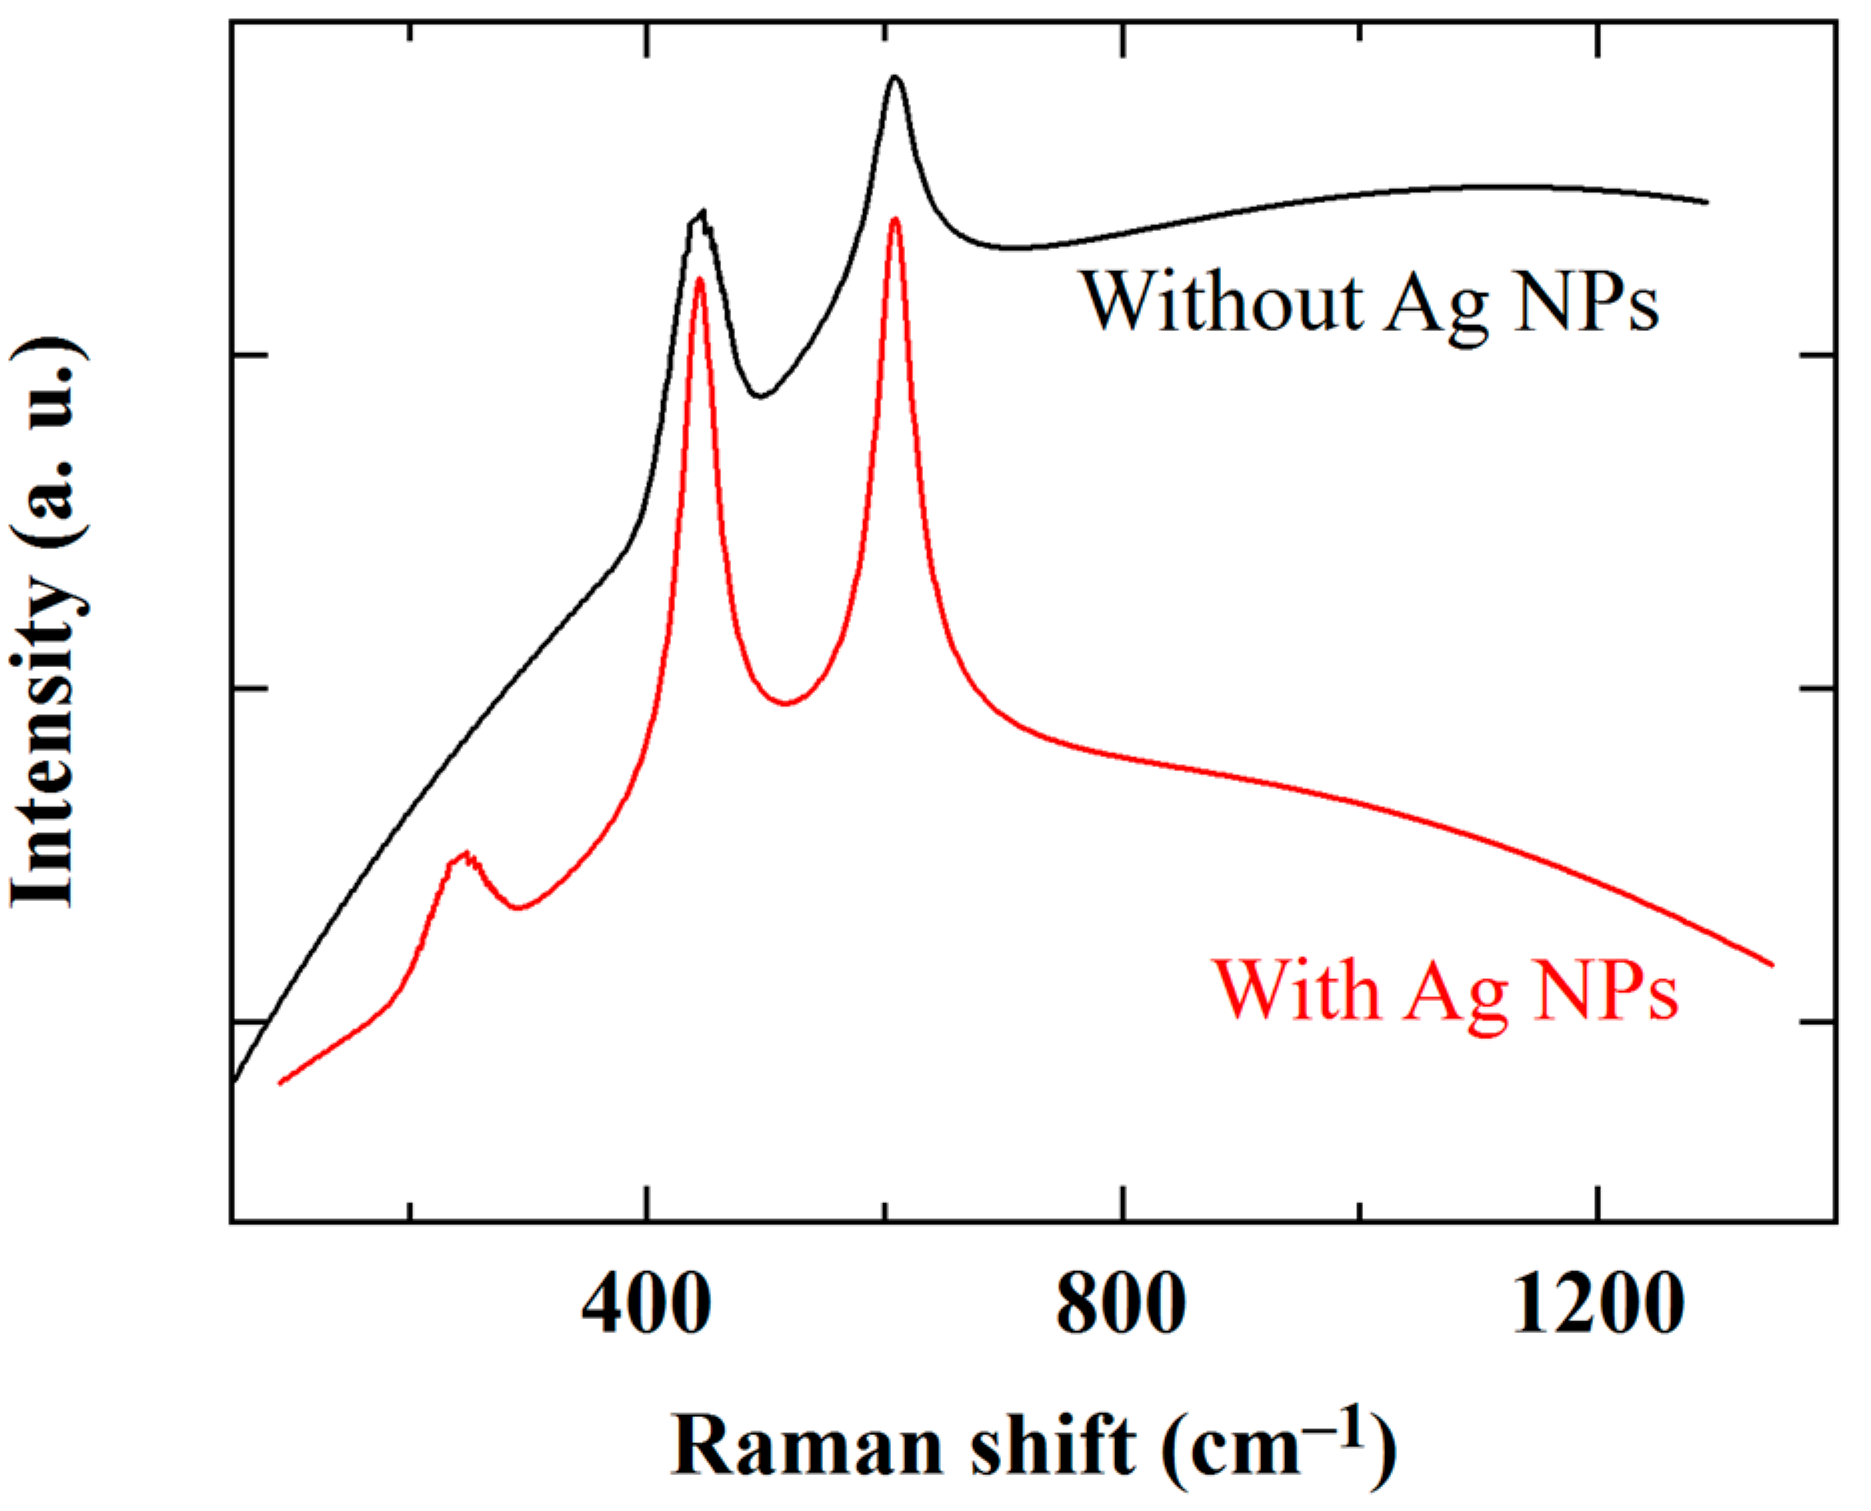
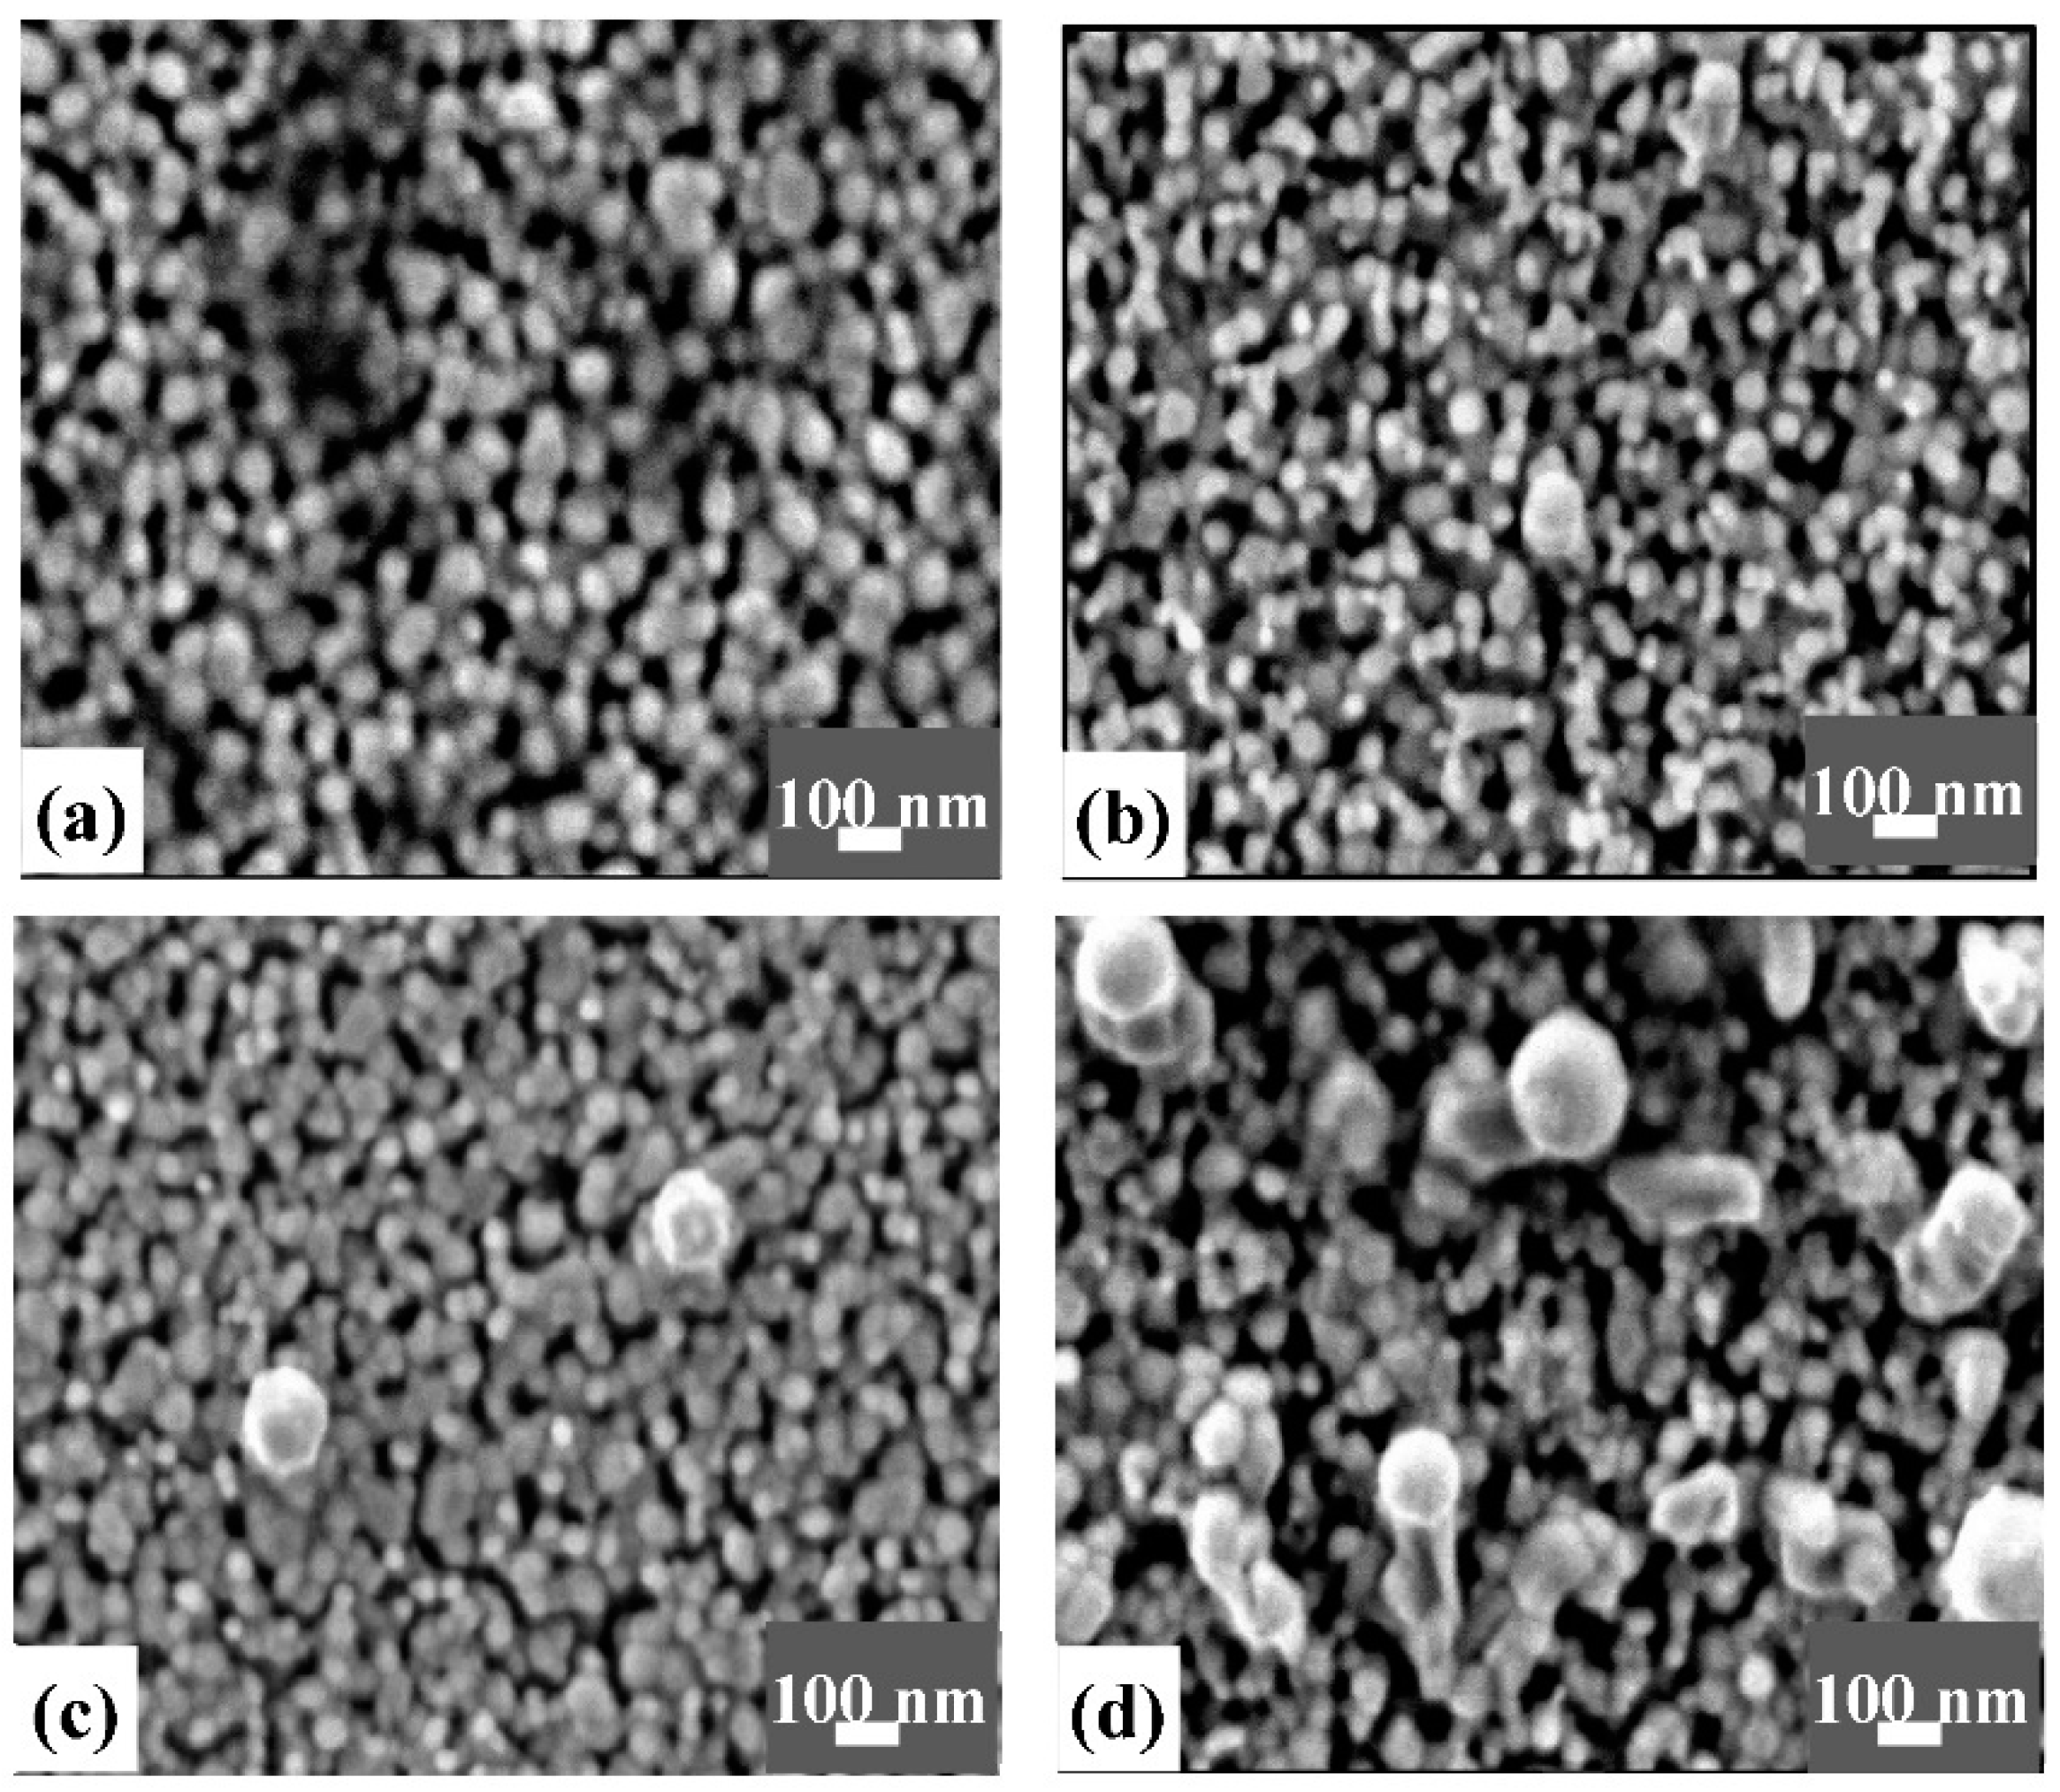
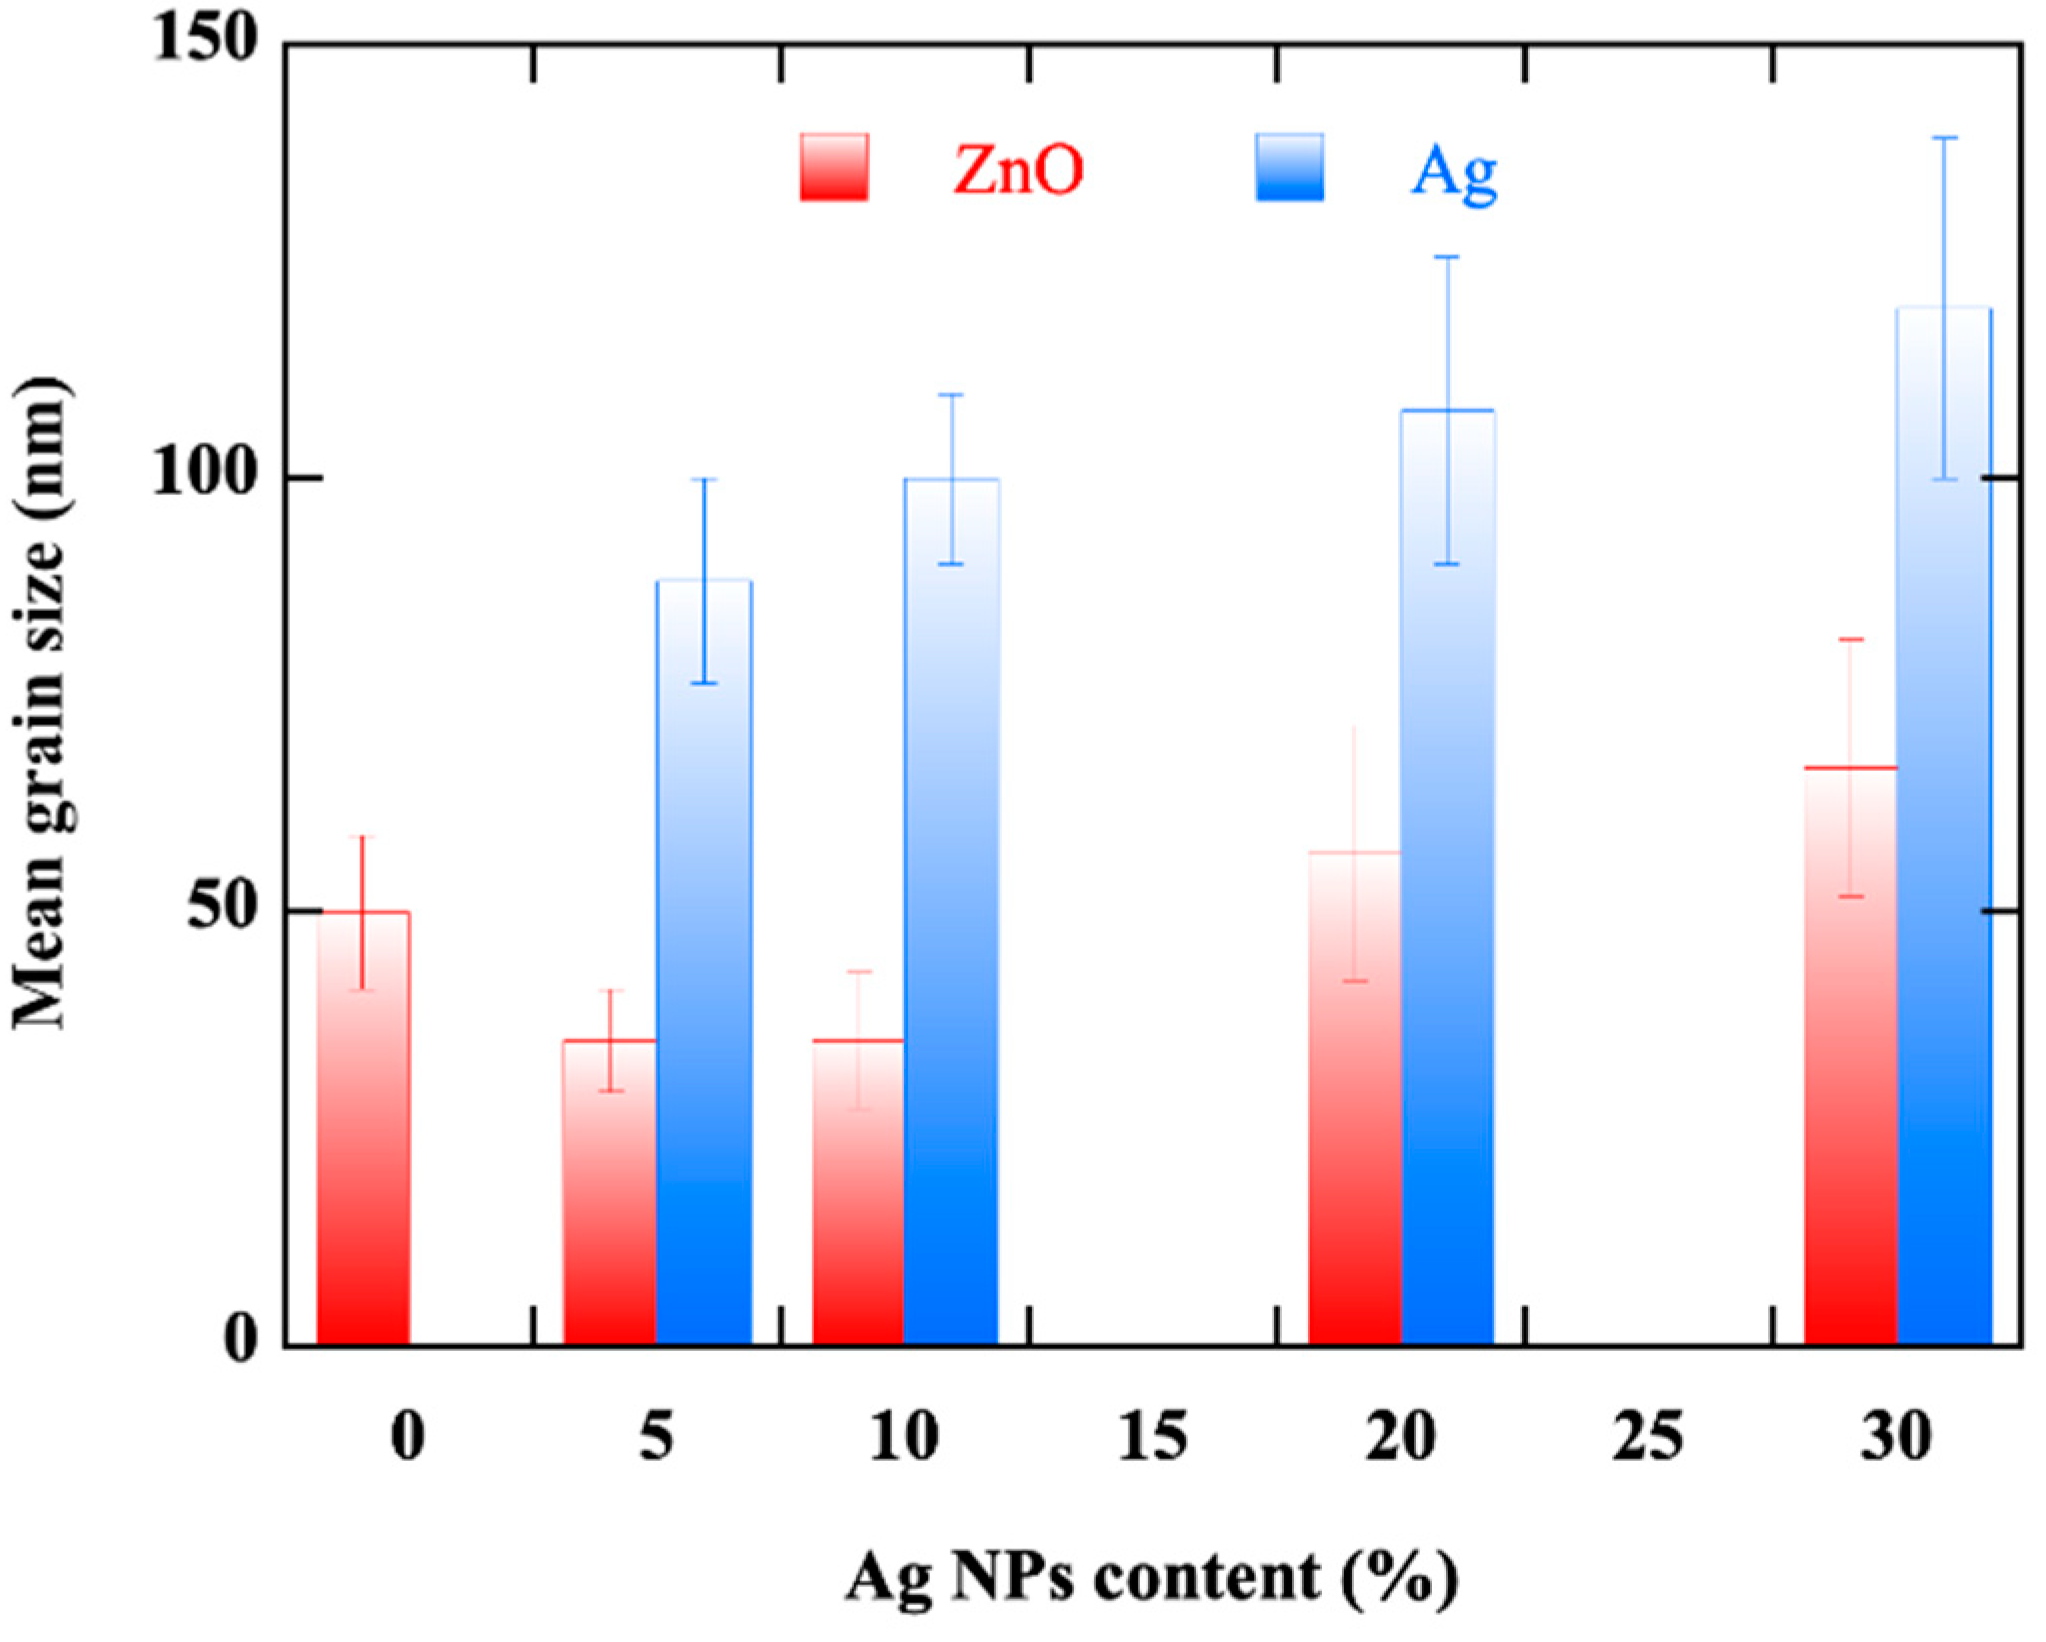
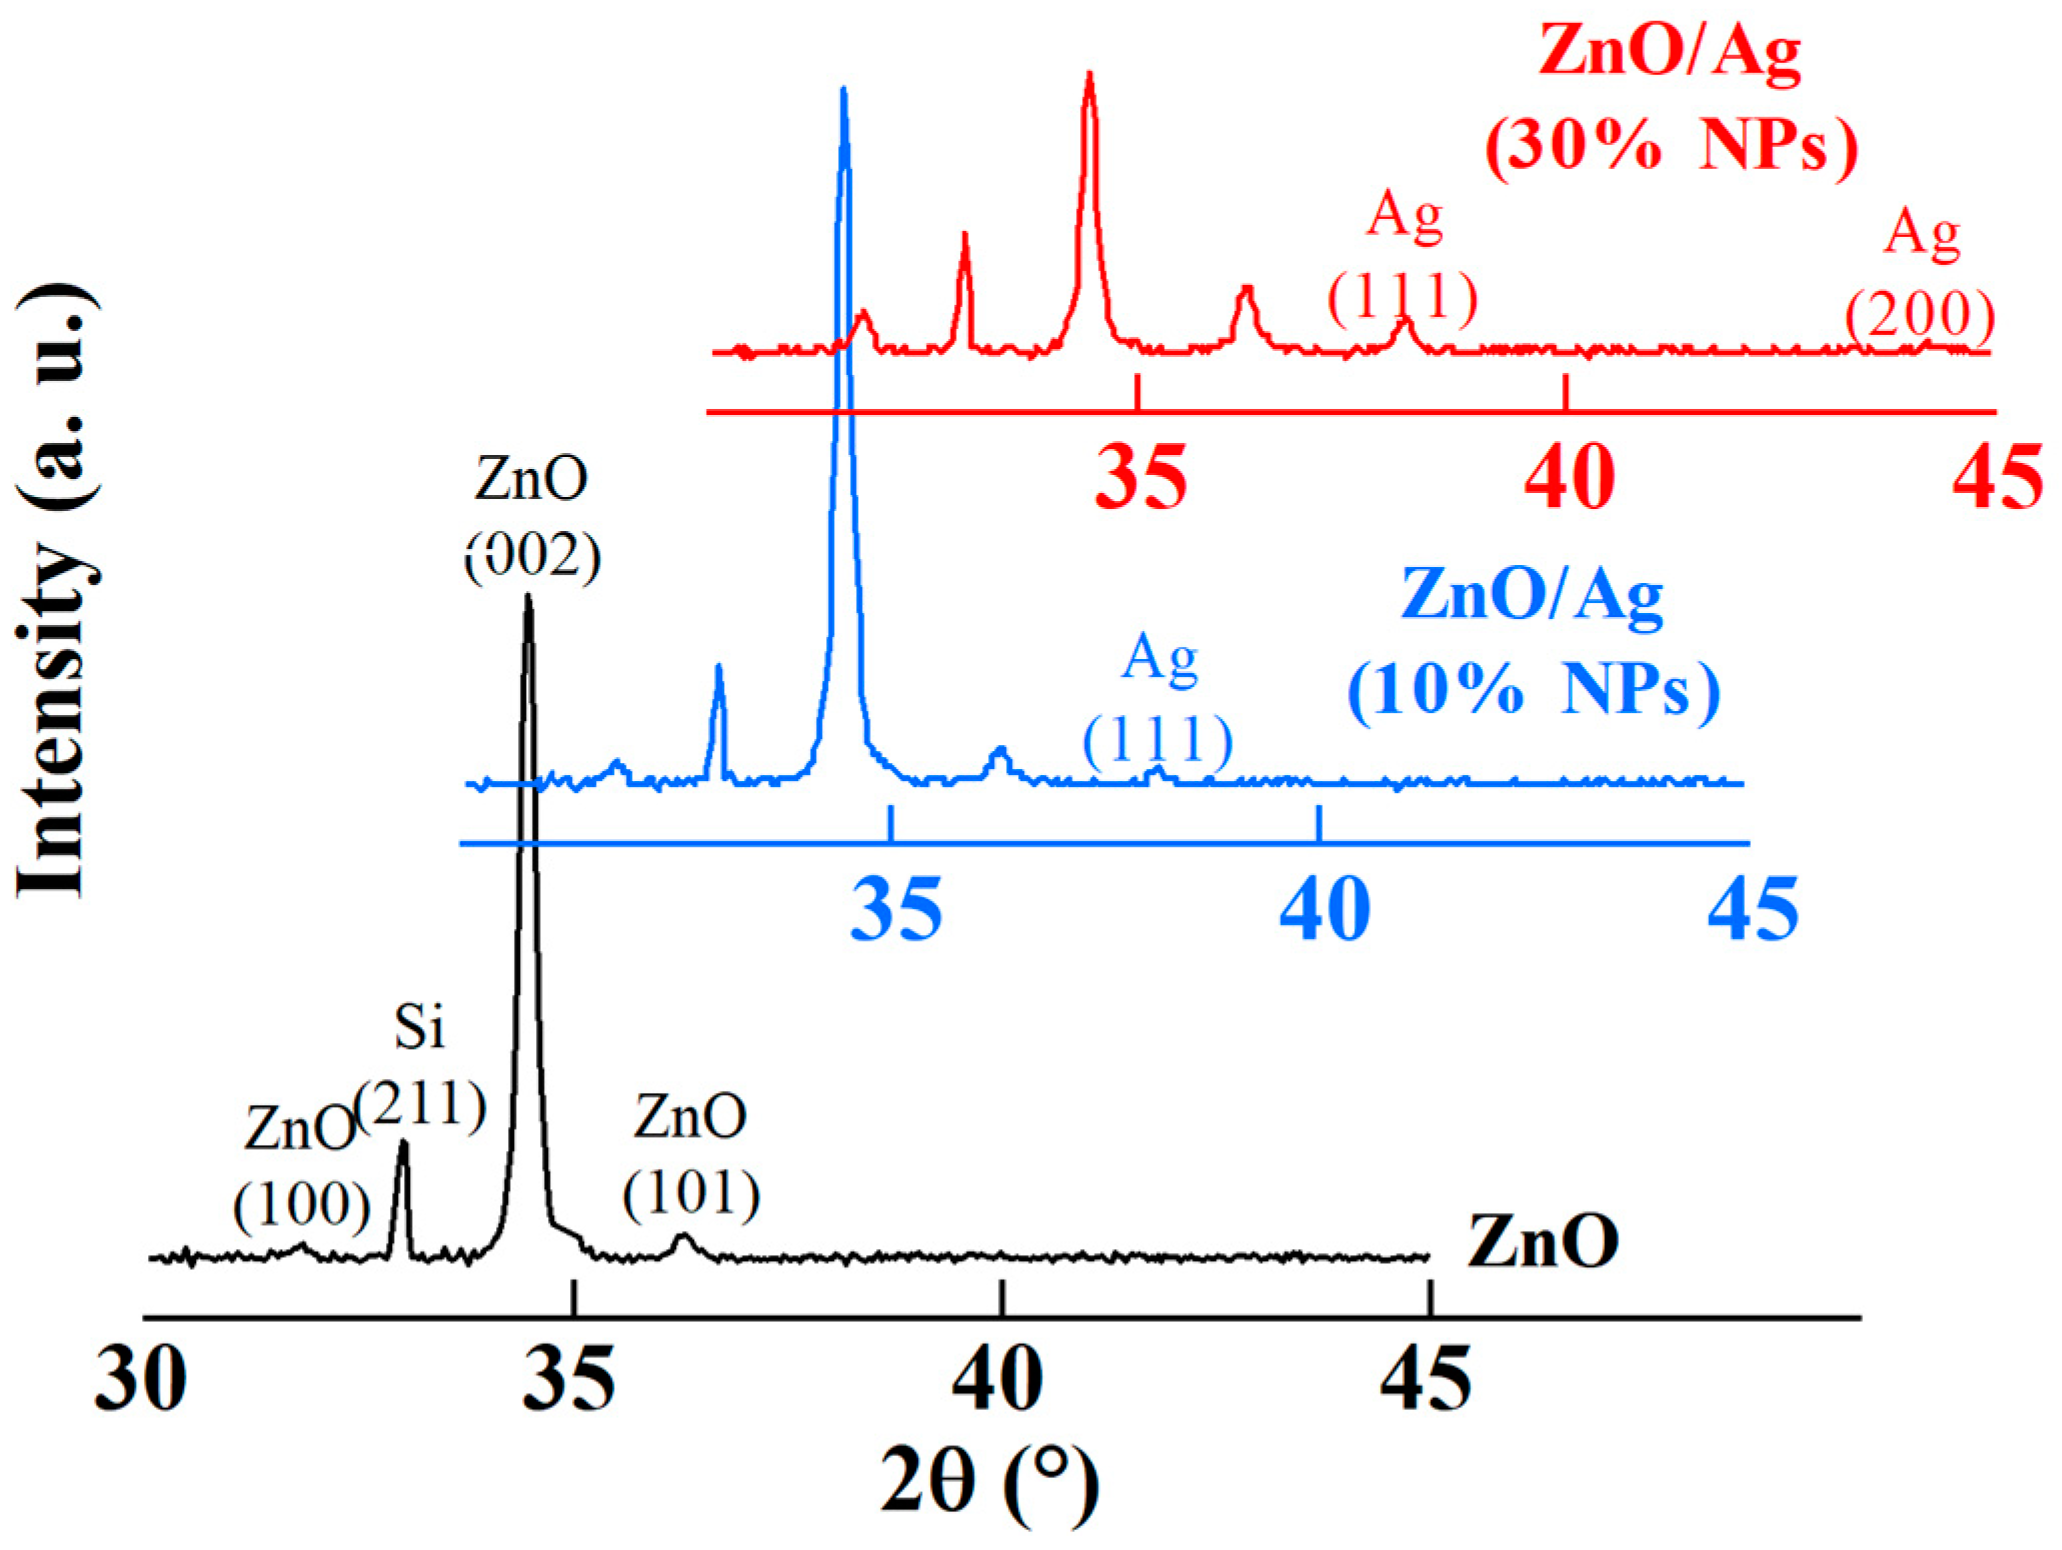
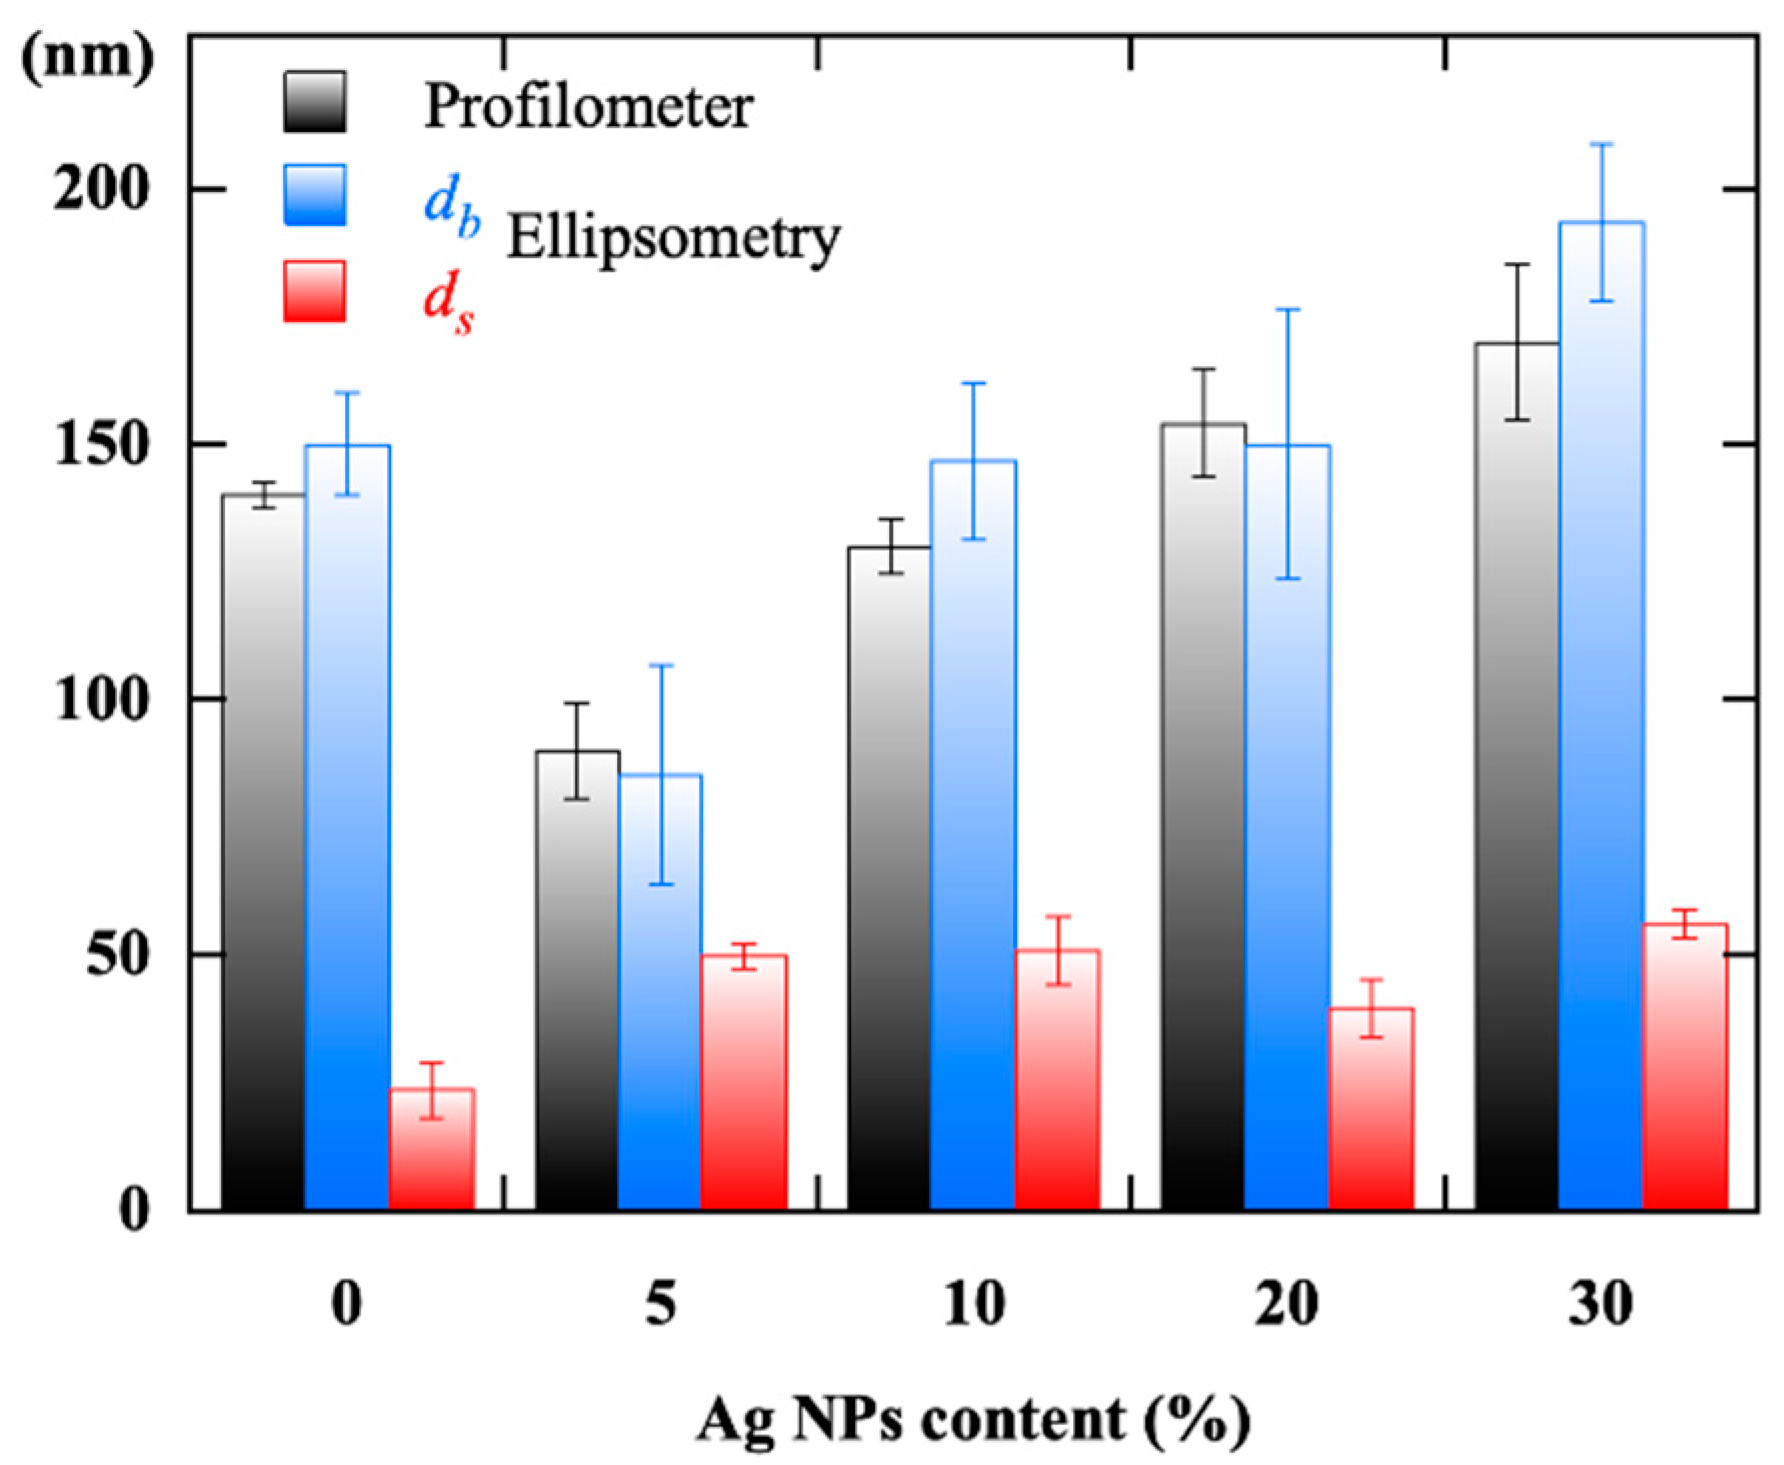
3.2. Ag NPs in the Nanocomposite Film

The incorporation of Ag NPs has a direct effect on the macroscopic appearance of the nanocomposite thin film as it is shown in Figure 4. Initially, ZnO exhibits a metallic sky-blue surface (Figure 4a). At the lowest Ag NPs content (5%), the surface, still very reflective, turns yellow but becomes macroscopically granular (Figure 4b). By increasing the Ag NPs content up to 10% (Figure 4c), the ZnO/Ag(NPs) nanocomposite film becomes more homogeneous. At the highest Ag NPs concentration (30%), the ZnO/Ag(NPs) nanocomposite film becomes inhomogeneous again with its purplish surface outlined by wider fringes (Figure 4d).
Figure 5 shows scanning electron microscopy (SEM) micrographs, at a scale of a few hundred nm, of ZnO/Ag(NPs) nanocomposite thin films grown with different Ag NPs contents and deposited on c-Si substrates. The nanogranular morphology of the ZnO matrix is highlighted (Figure 5a). Up to 10% Ag NPs content (Figure 5b,c), the ZnO matrix remains dense but with a grain size slightly smaller than that of pure ZnO film and the low density of spherical Ag NPs increases. In addition, the matrix becomes more porous, Ag aggregates tend to agglomerate and lose their spherical shape (Figure 5d). The presence of silver in the aggregates on the surface of ZnO/Ag(NPs) nanocomposites was confirmed by energy-dispersive X-ray spectroscopy (EDX) measurements [25].
Processing of the SEM images by grain counting software allowed us to determine an average size over 80 grains for ZnO and Ag NPs on the surface of the ZnO/Ag(NPs) nanocomposite. Figure 6 displays these sizes as a function of the Ag NPs content. The average size of the ZnO grains decreases from 50 nm to 35 nm for 10% of Ag NPs content. Beyond that, it increases to 65 nm at the highest Ag NP content. This finding indicates that the growth mechanism of the ZnO matrix is affected by the presence of Ag NPs in the precursor solution. The average size of Ag NPs progressively increases from 88 nm to 130 nm with Ag NP content. SEM characterizations highlight the fact that, due to the final thermal annealing at 550 °C, starting from Ag NPs of 20 nm in size in the deposition precursor solution we obtain a ZnO/Ag(NPs) nanocomposite thin film with spherical Ag aggregates of about 100 nm and uniformly distributed on its surface [41,42,43,44,45]. The presence of Ag NPs on the film surface should, a priori, facilitate the photocatalysis reactions taking place at the surface of the photocatalyst.
Figure 7 presents the X-ray diffraction (XRD) diagrams of pure ZnO and ZnO/Ag(NPs) nanocomposite thin films. Within the 30°–45° 2θ range, they show peaks pointing around 32.0°, 34.6° and 36.4°, respectively attributed to (100), (002), and (101) orientations, according to JCPDS 36-1451 of bulk ZnO. In the case of pure ZnO, the diagram presents the dominant (002) peak revealing the Wurtzite phase of ZnO with a c-axis perpendicular to the substrate plane. Its dominance remains practically unchanged up to 10% of Ag NPs. It significantly decreases beyond 10% of Ag NPs with a relative enhancement of both (101) and (100) peaks, indicating that the incorporation of Ag NPs starts to affect the monocrystallinity of the ZnO matrix. The presence of Ag NPs is characterized by the (111) and (200) Ag peaks located at 38.1° and 44.2°, respectively, and whose intensity increases with Ag NPs content.

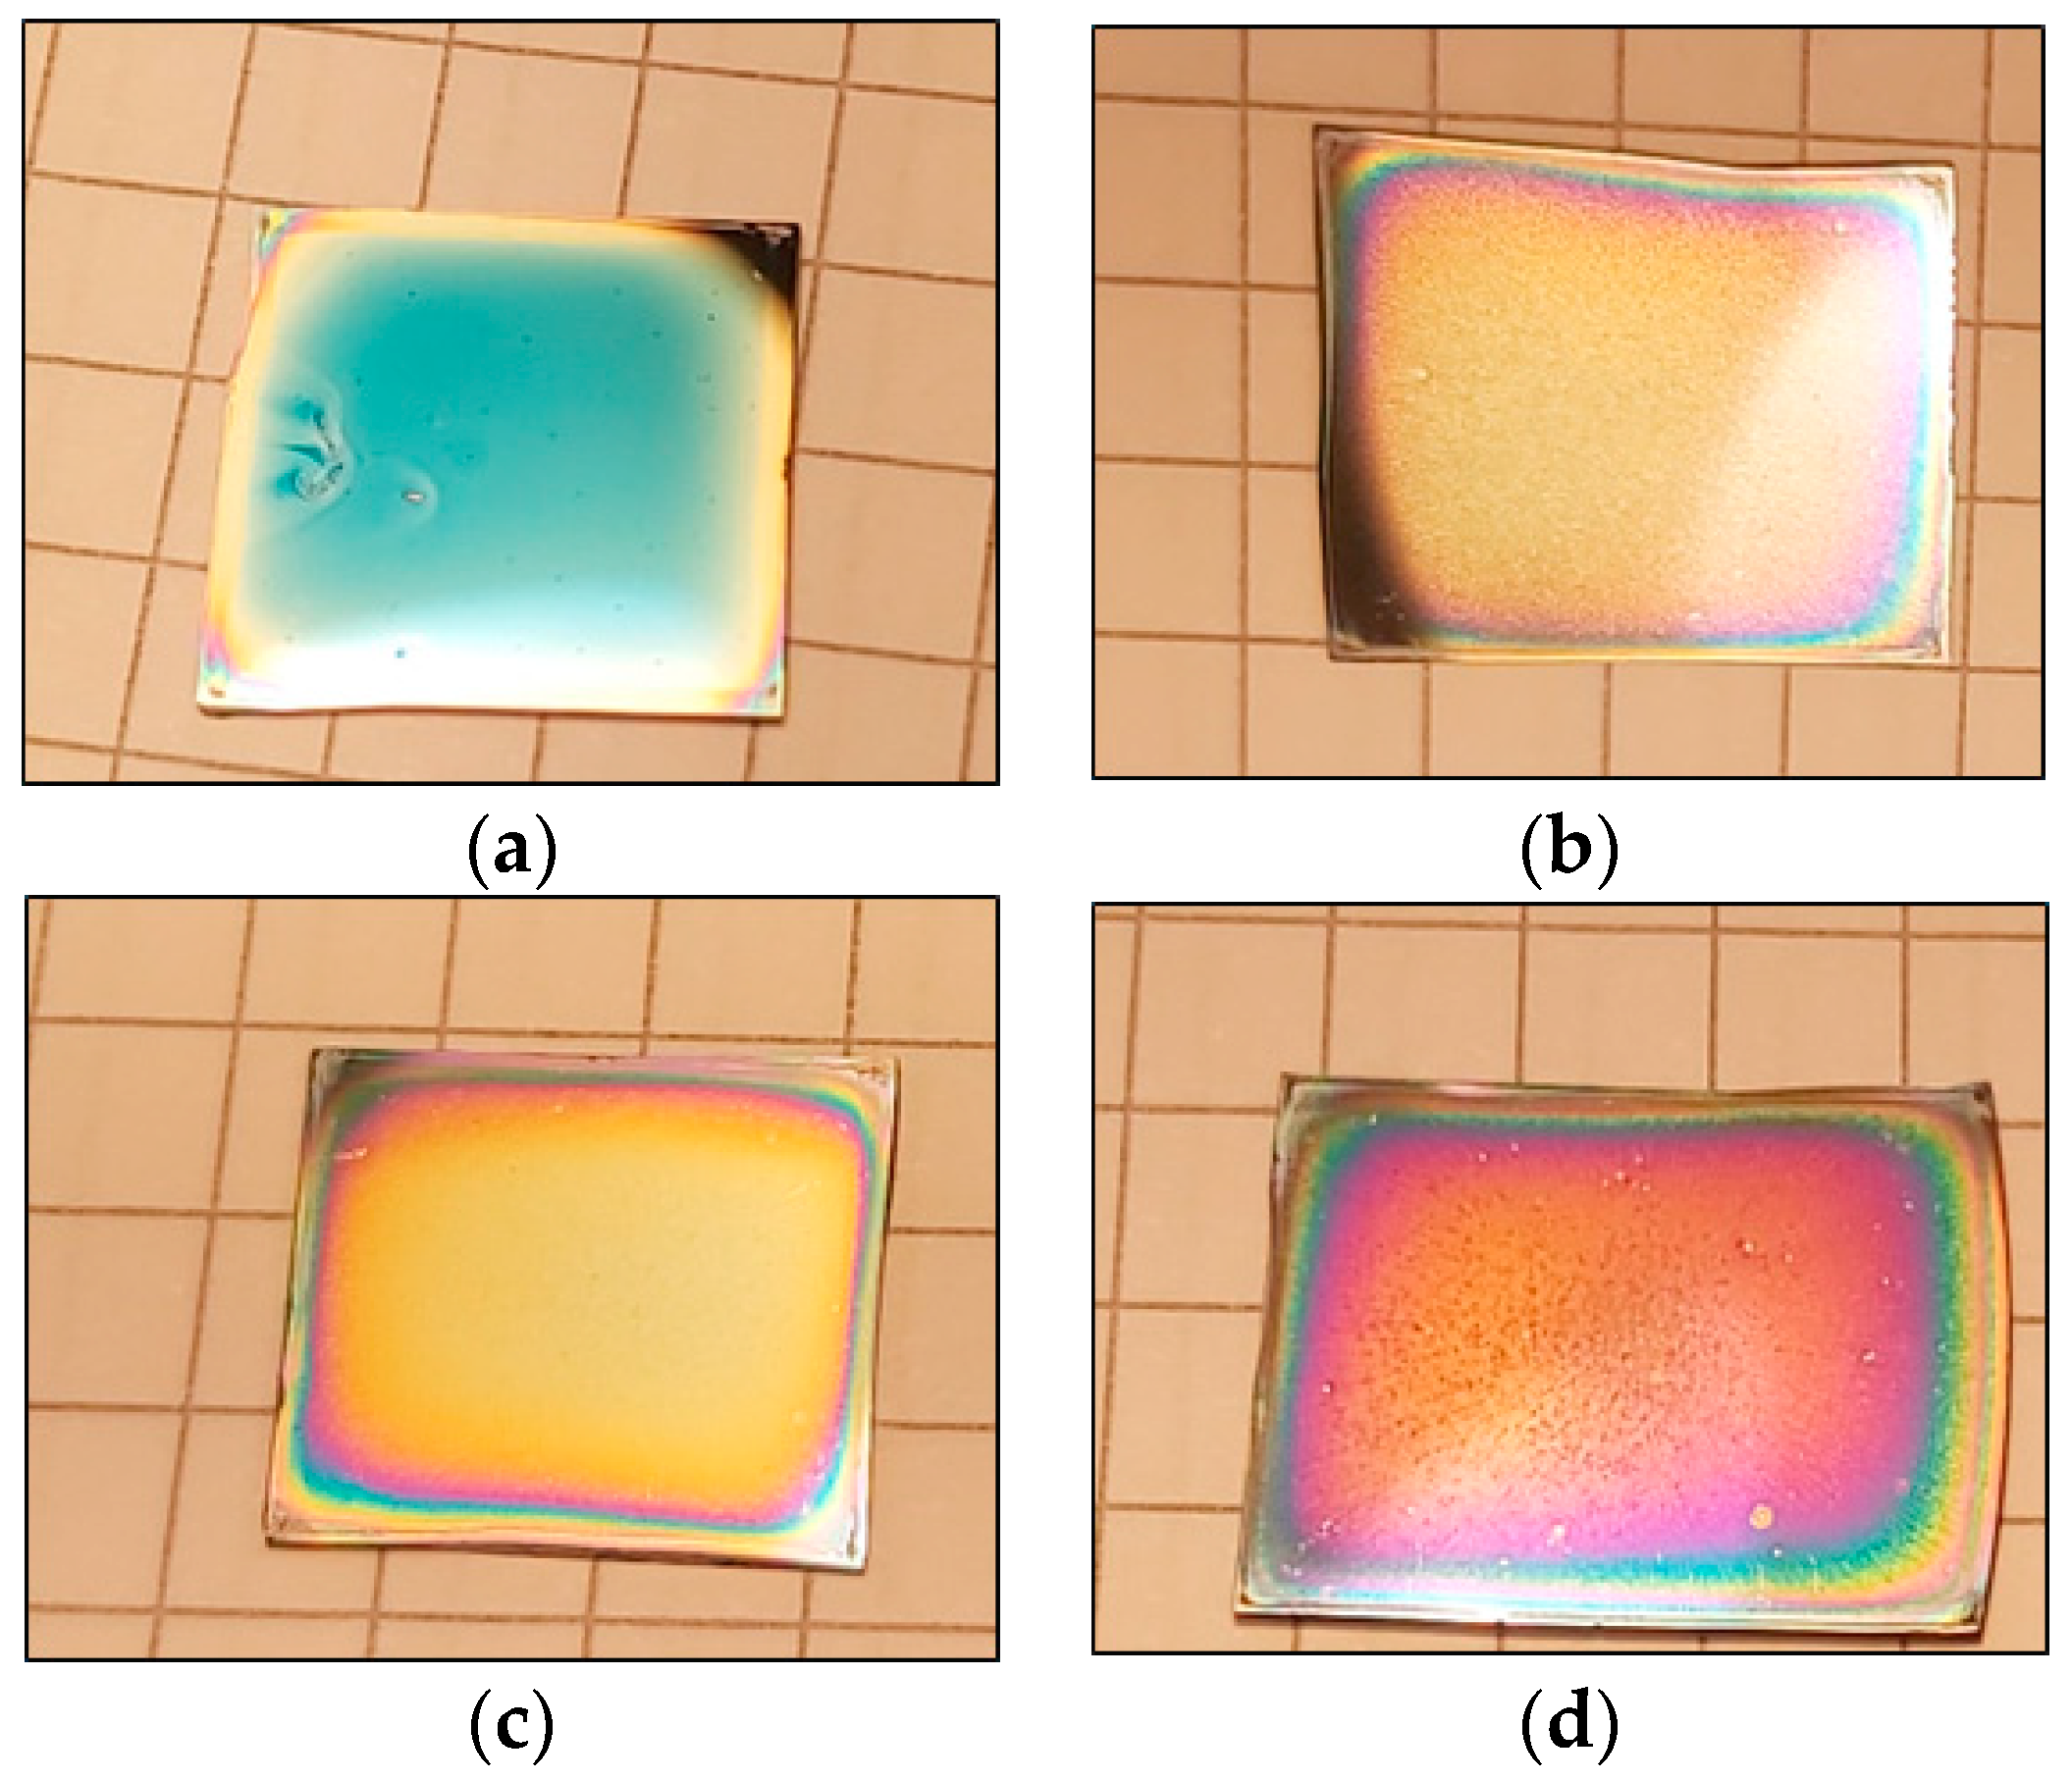
3.3. Effects of Ag NPs Content on Surface Wettability

The ZnO/Ag(NPs) nanocomposite thin films are intended for photocatalysis applications and will be in contact with solutions to be degraded. The study of the wettability of their surface, in particular as a function of the Ag NPs content of the nanocomposite, is therefore a necessary step. The measurement of the contact angle of the nanocomposite surface was performed using deionized water drops of 3 µL volume. The surface of the c-Si substrate is hydrophilic with a contact angle of 60° (Figure 8). The surface of the pure ZnO thin film shows a rather hydrophobic property with a contact angle of 120°. Several wettability studies conducted on ZnO have shown a superhydrophobic [46,47,48] or hydrophilic [49] character of its surface, depending on the deposition conditions. Figure 8 shows that the presence of Ag NPs makes the surface of the ZnO/Ag(NPs) nanocomposite hydrophilic with a contact angle of 85° for 10% Ag NPs. The hydrophilic character increases with increasing Ag NPs content, probably due to the decrease in the liquid contact area with ZnO. However, other factors such as surface roughness can affect the hydrophilic or hydrophobic character of the material surface [50].

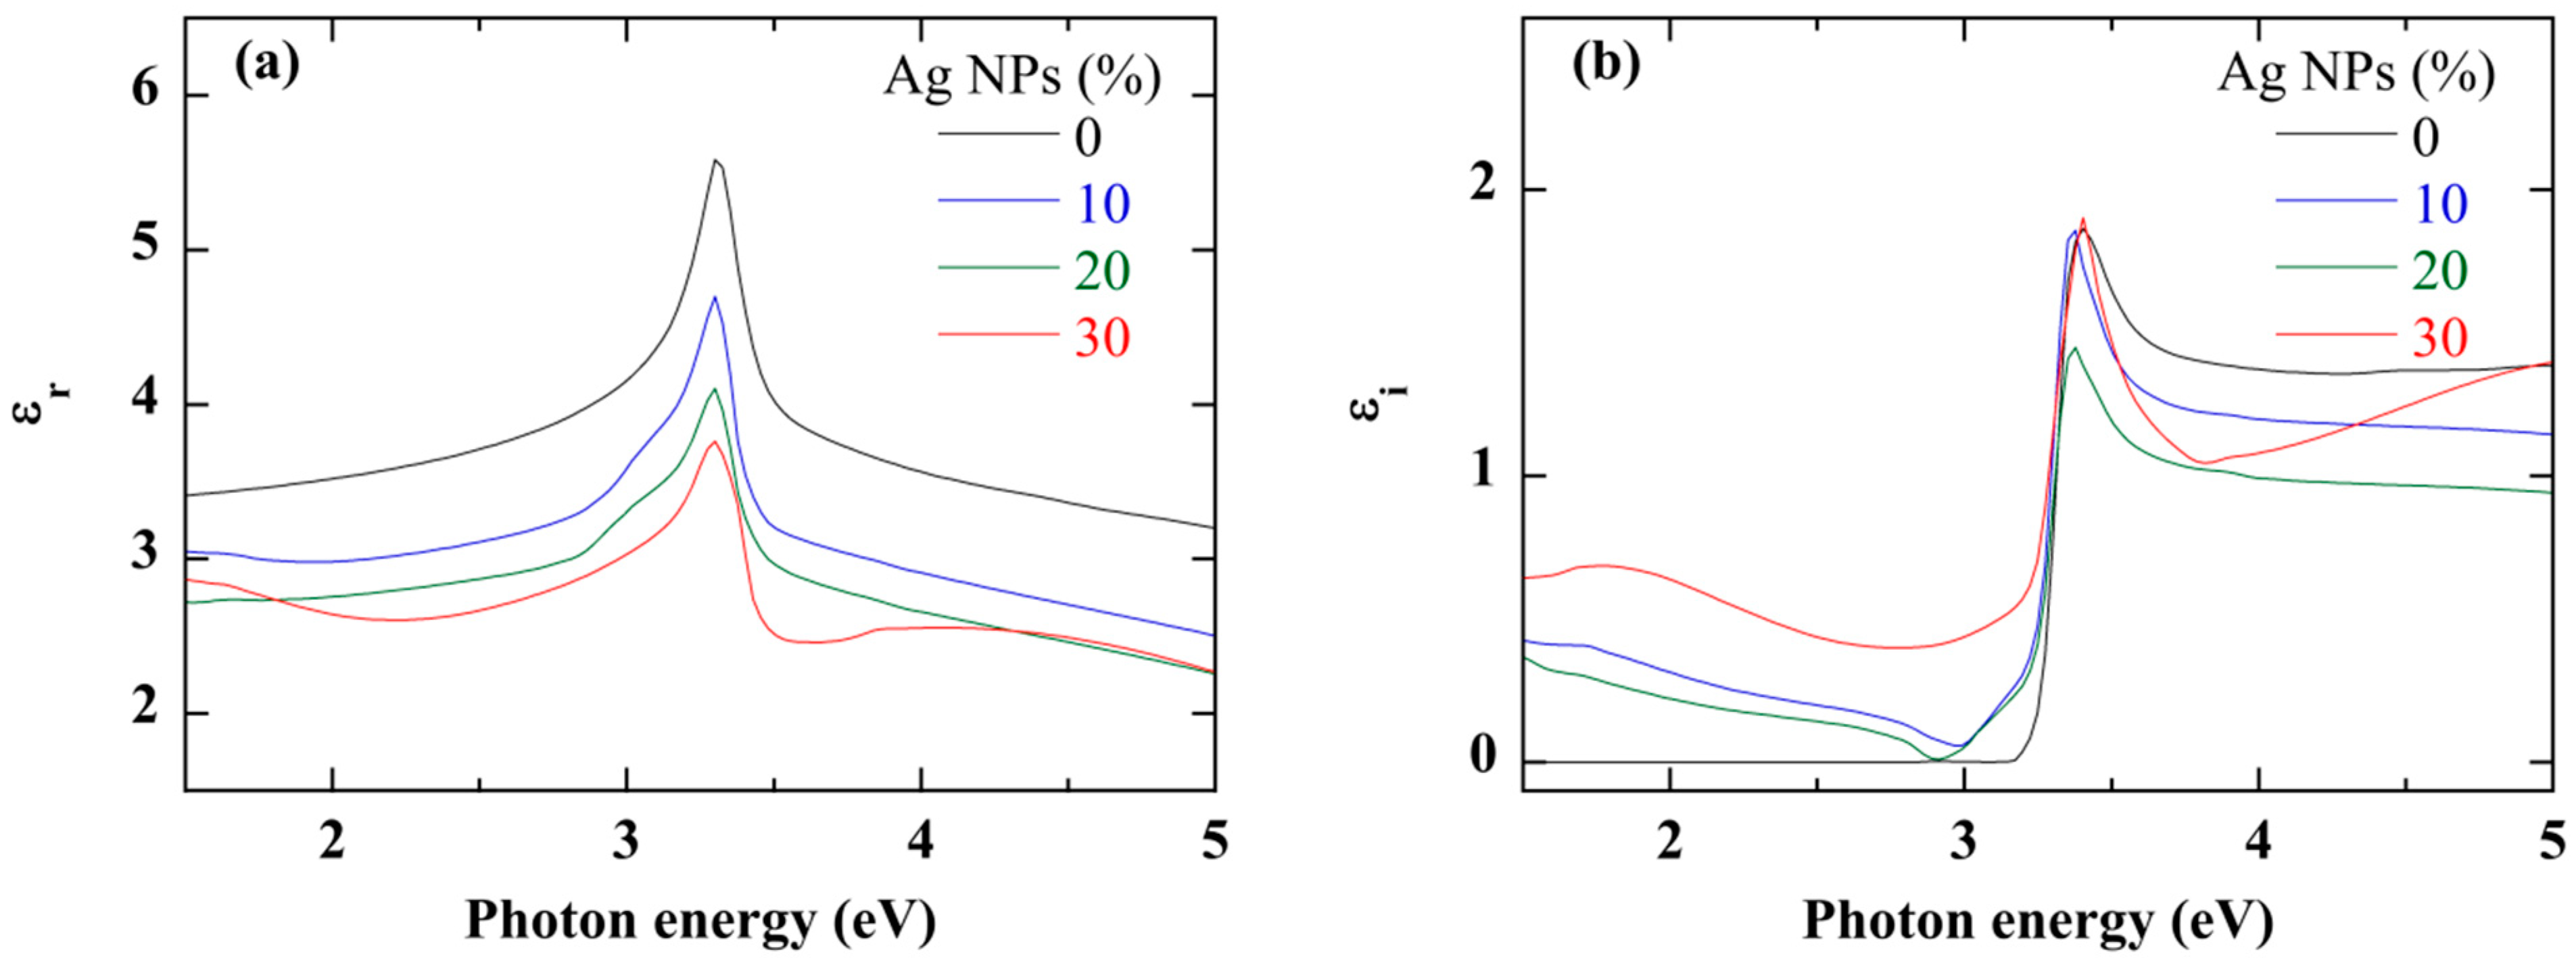
3.4. Effects of Ag NPs Ag Content on the Optical Properties of the Nanocomposite Film

The quantitative exploitation of the UV–visible spectroscopic ellipsometry measurements was performed according to the spline inversion method [28] originally developed for pure ZnO thin films. This model was adapted to the case of ZnO/Ag(NPs) nanocomposite thin films because of the modifications induced by the Ag NPs on the optical properties of the ZnO matrix, even at low content. Figure 9 plotted the thickness of the bulk layer (db) and that of the surface roughness (ds) of ZnO/Ag(NPs) nanocomposite thin films for different Ag NPs contents, derived from the ellipsometry measurements. The thickness of the bulk layer agrees with the film thickness obtained using a profilometer. The thickness of 150 nm in the case of pure ZnO film decreases to 90 nm with 5% of Ag NPs content and then progressively increases with Ag NPs content to a value of 170 nm. The incorporation of Ag NPs into the ZnO matrix increases the surface roughness of the nanocomposite film, from 25 nm in pure ZnO to a value close to 50 nm in the ZnO/Ag(NPs) film.
The real (εr) and imaginary (εi) parts of the dielectric function of the nanocomposite films are plotted in Figure 10 within a spectral photon energy (E) range such as 1.5 eV ≤ E ≤ 5 eV. Regardless of the Ag NPs content, the spectrum of the nanocomposite material is similar to that of pure ZnO with the possible exception of the highest content of Ag NPs (30%). The amplitude of εi and the intensity of the excitonic peak of the nanocomposite material are, however, lower compared to that of pure ZnO. Below the absorption edge, where the absorption is zero in the case of pure ZnO, εi shows non-zero values in the case of ZnO/Ag(NPs) nanocomposite material which increases with Ag NPs content (Figure 10b). This area corresponds to the absorption domain of Ag NPs [51,52]. Beyond this spectral zone, the amplitude of εi decreases with the increase in Ag NPs content. The singular shape of the spectrum at 30% Ag NPs seems to indicate the limit of validity of the optical model used to fit the ellipsometry measurements. The decrease in the εr amplitude by increasing the Ag NPs content is synonymous with a decrease in the compactness of the matrix (Figure 10a).
Absorption (α) measurements of ZnO/Ag(NPs) nanocomposite thin films, performed in a previous study [25], revealed significant changes with Ag NPs loading. A red-shift of the absorption onset arises since the smallest Ag NPs content is accompanied by an additional absorption in the spectral zone lower than 3 eV. The optical bandgap is an important parameter to characterize the performance of the photocatalyst with respect to the irradiation source. Figure 11 displays Tauc’s bandgap (Eg) of the ZnO/Ag(NPs) nanocomposite thin film versus the Ag NPs loading. Eg is defined as the energy at which the linear extrapolation of (α.E)2 versus the photon energy E gives 0 [53]. Eg slightly decreases from 3.22 eV for pure ZnO to 3.20 eV with 10% of Ag NPs. Beyond, Eg tends to 3.14 eV.

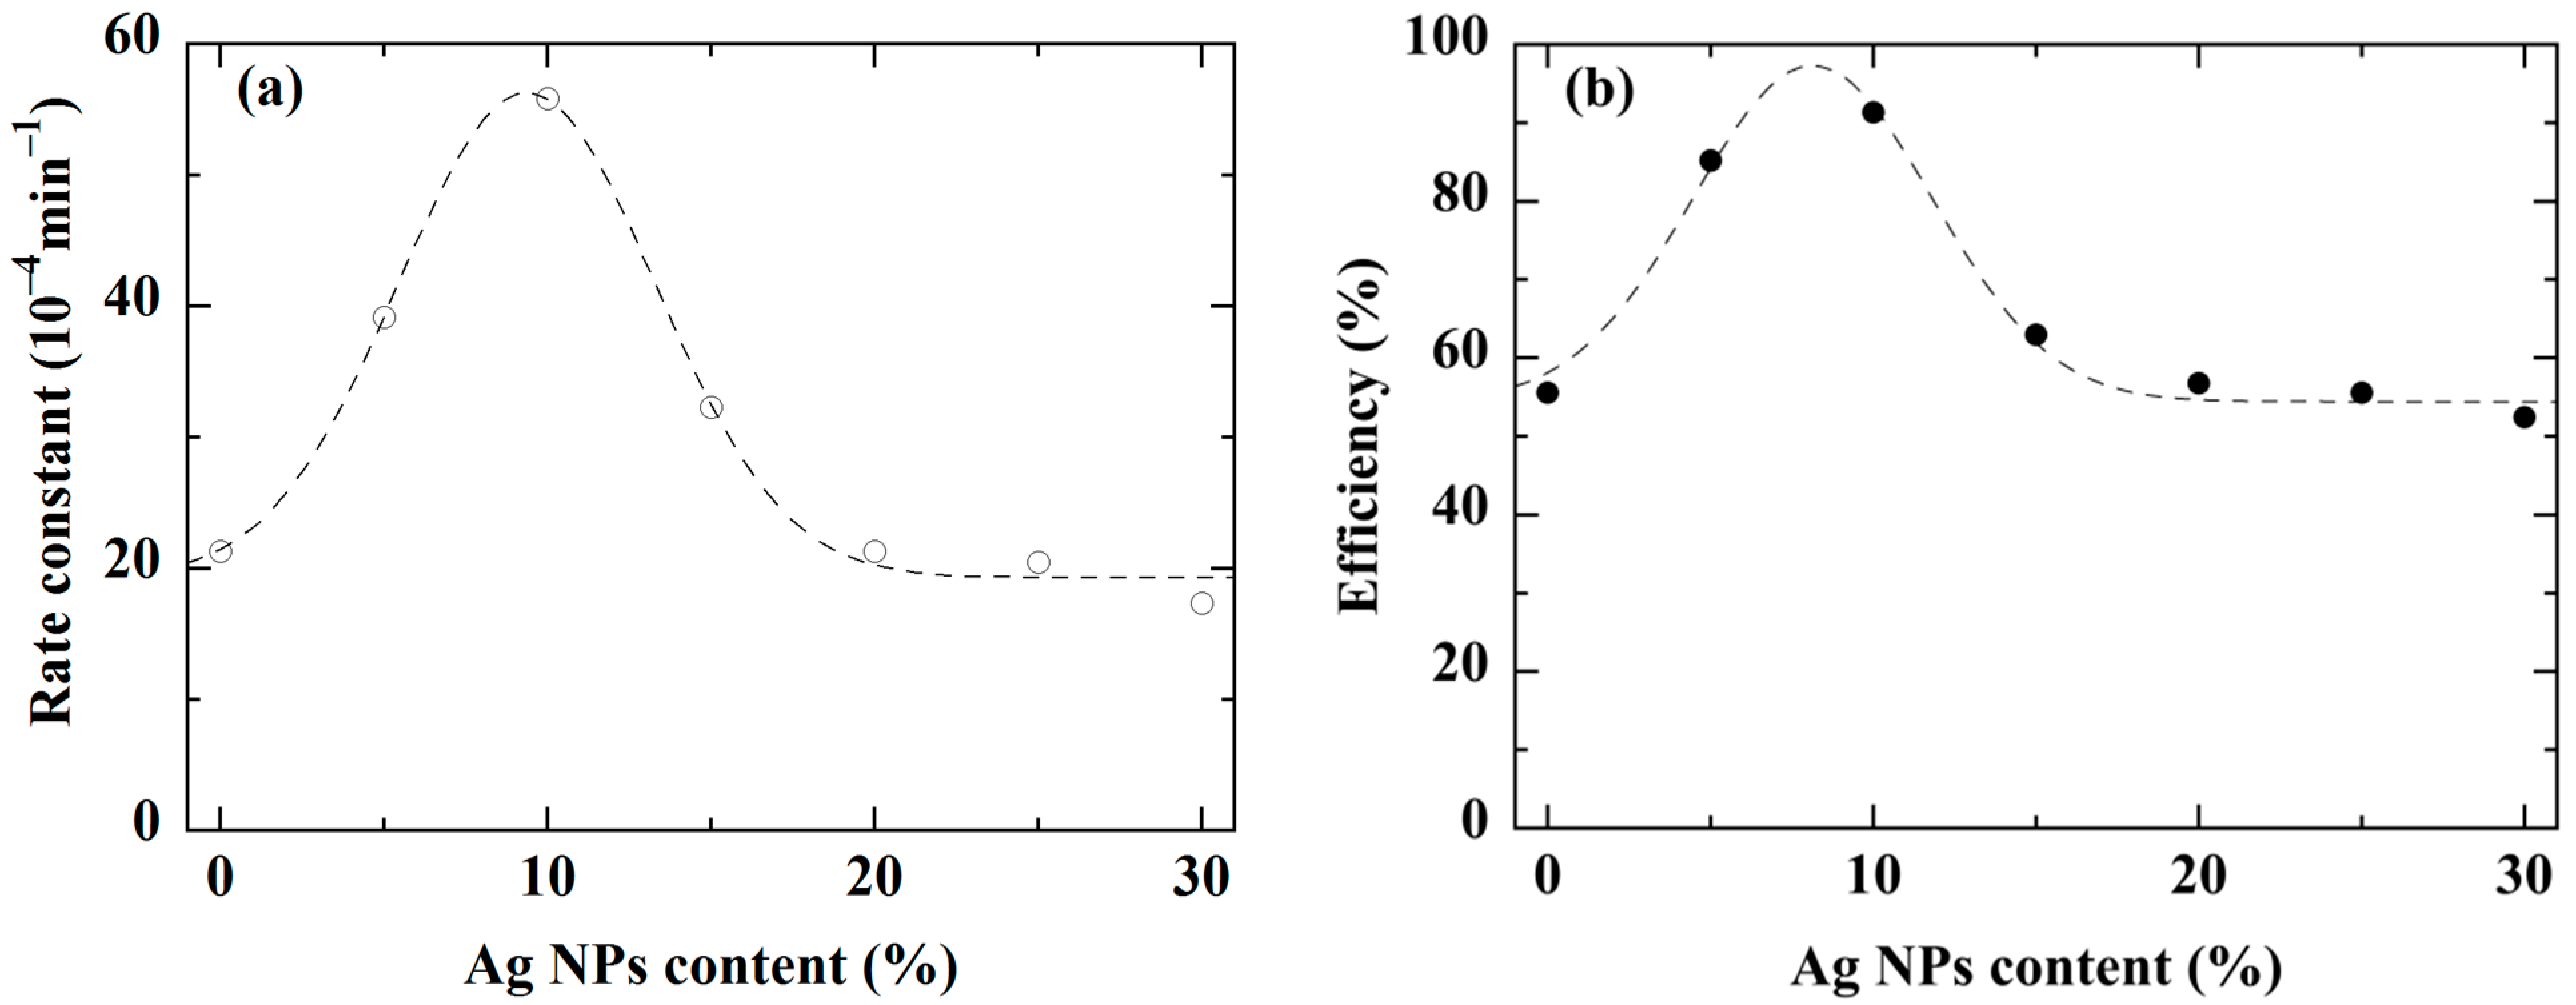
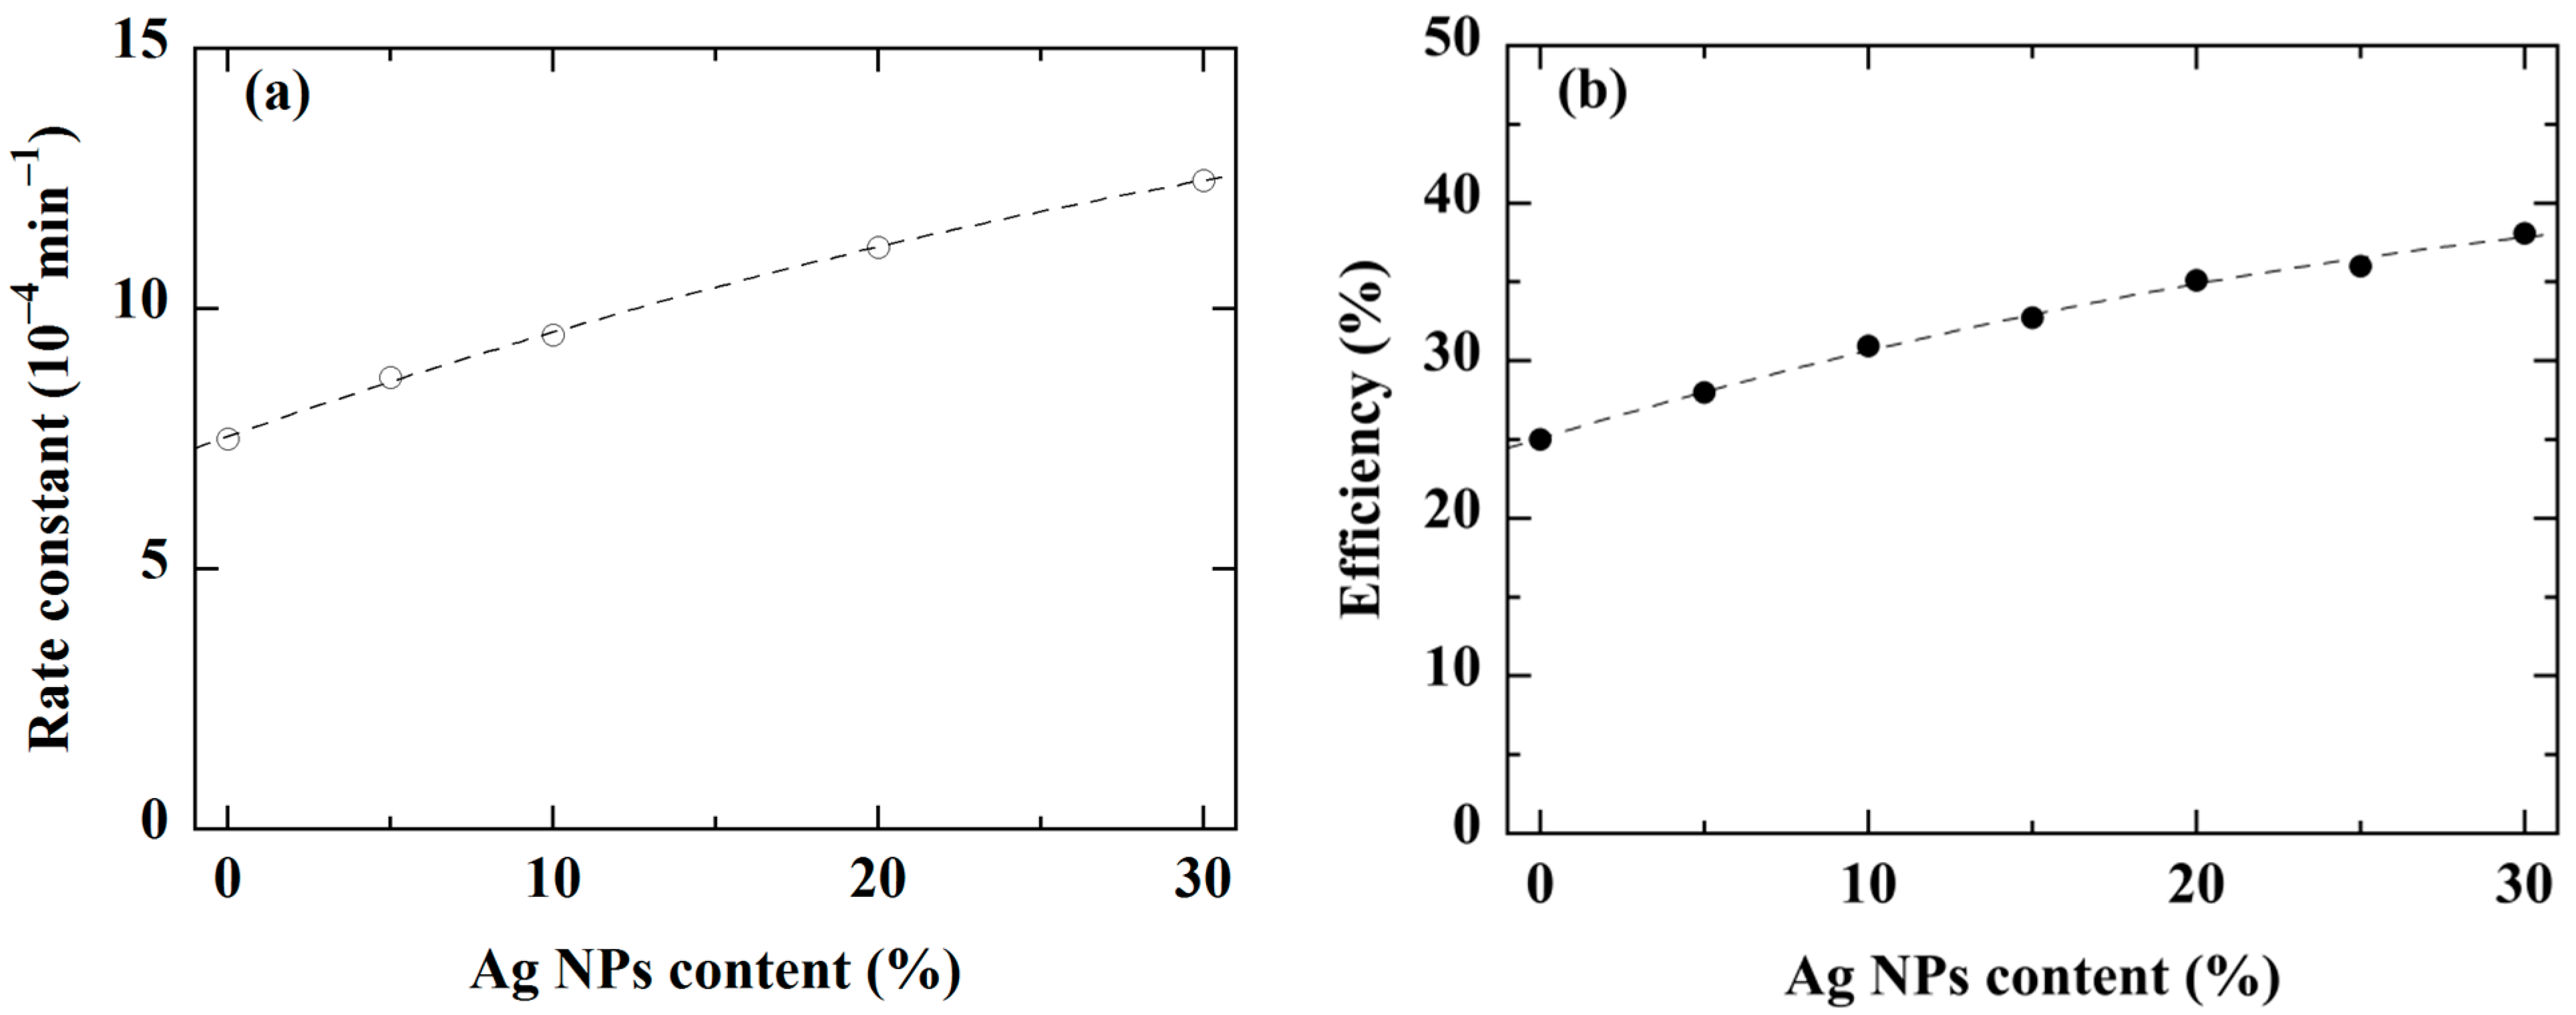
3.5. Effects of Ag NPs Ag Content on the Photocatalytic Performance

The photodegradation experiments were carried out in the framework of the experimental protocol previously described [25]. The measurement consists of tracking, over the illuminating time (t), the absorption of the band at 610 nm which is proportional to the concentration C(t) of the IC solution. The photodegradation efficiency is defined by the relative variation of C(t) with respect to the initial value C0 = 6.6 mg/L. The rate constant of photodegradation is given by the slope of −ln(C(t)/C0) versus t, assuming a pseudo-first-order kinetics. Figure 12 shows the evolution of the rate constant and the degradation efficiency of an IC solution under UV irradiation for ZnO and ZnO/Ag(NPs) films. For pure ZnO, a rate constant of 21 × 10−4 min−1 is obtained. When the Ag NPs loading increases up to 10%, the rate constant reaches 54 × 10−4 min−1. Then, it decreases to flatten at 22 × 10−4 min−1 for high Ag NPs contents (Figure 12a). Moreover, Figure 10b indicates that after 6 h of illumination, the ZnO film degrades only 50% of the dye molecules. The photocatalytic efficiency increases to more than 90% at 10% Ag NPs content. Beyond, it decreases and stabilizes at 52% at high Ag NPs concentration. Thus, UV illumination reveals that 10% of Ag NPs is an optimal loading for the nanocomposite thin film. From a morphological point of view, such photocatalytic performance improvement could be due to the decrease in the ZnO grain size. Indeed, small grain size is synonymous with a larger number of active sites in contact with the solution to be degraded. Beyond this optimum Ag NPs loading, the size of the Ag NPs exceeds 100 nm and the film becomes less dense, reducing the active surface and consequently the photodegradation rate. Moreover, the increase in the number and size of Ag NPs reduces the surface area of ZnO in contact with the solution and decreases the photodegradation efficiency.
When illuminated with a halogen lamp, Figure 13 shows that the photocatalytic performance of the nanocomposite, slowly but steadily, increases with the Ag NPs content. Thus, the degradation rate constant, 3 times lower than with UV illumination, increases steadily from 7.5 × 10⁻⁴ min−1 to 12.5 × 10⁻⁴ min−1 (Figure 13a) while the photocatalytic efficiency (Figure 13b), twice lower than with UV illumination, increases regularly with the Ag NPs content to reach 38%. Since no optimum Ag NPs content emerged from this trend, this suggests that each type of illumination involves a different photodegradation mechanism [25]. With its large bandgap, ZnO is only active in the UV. However, Figure 12 suggests that the photocatalytic performance under UV irradiation is enhanced by 10% of Ag NPs. Under white irradiation, the improvement observed in Figure 13 must essentially be due to the Ag NPs.

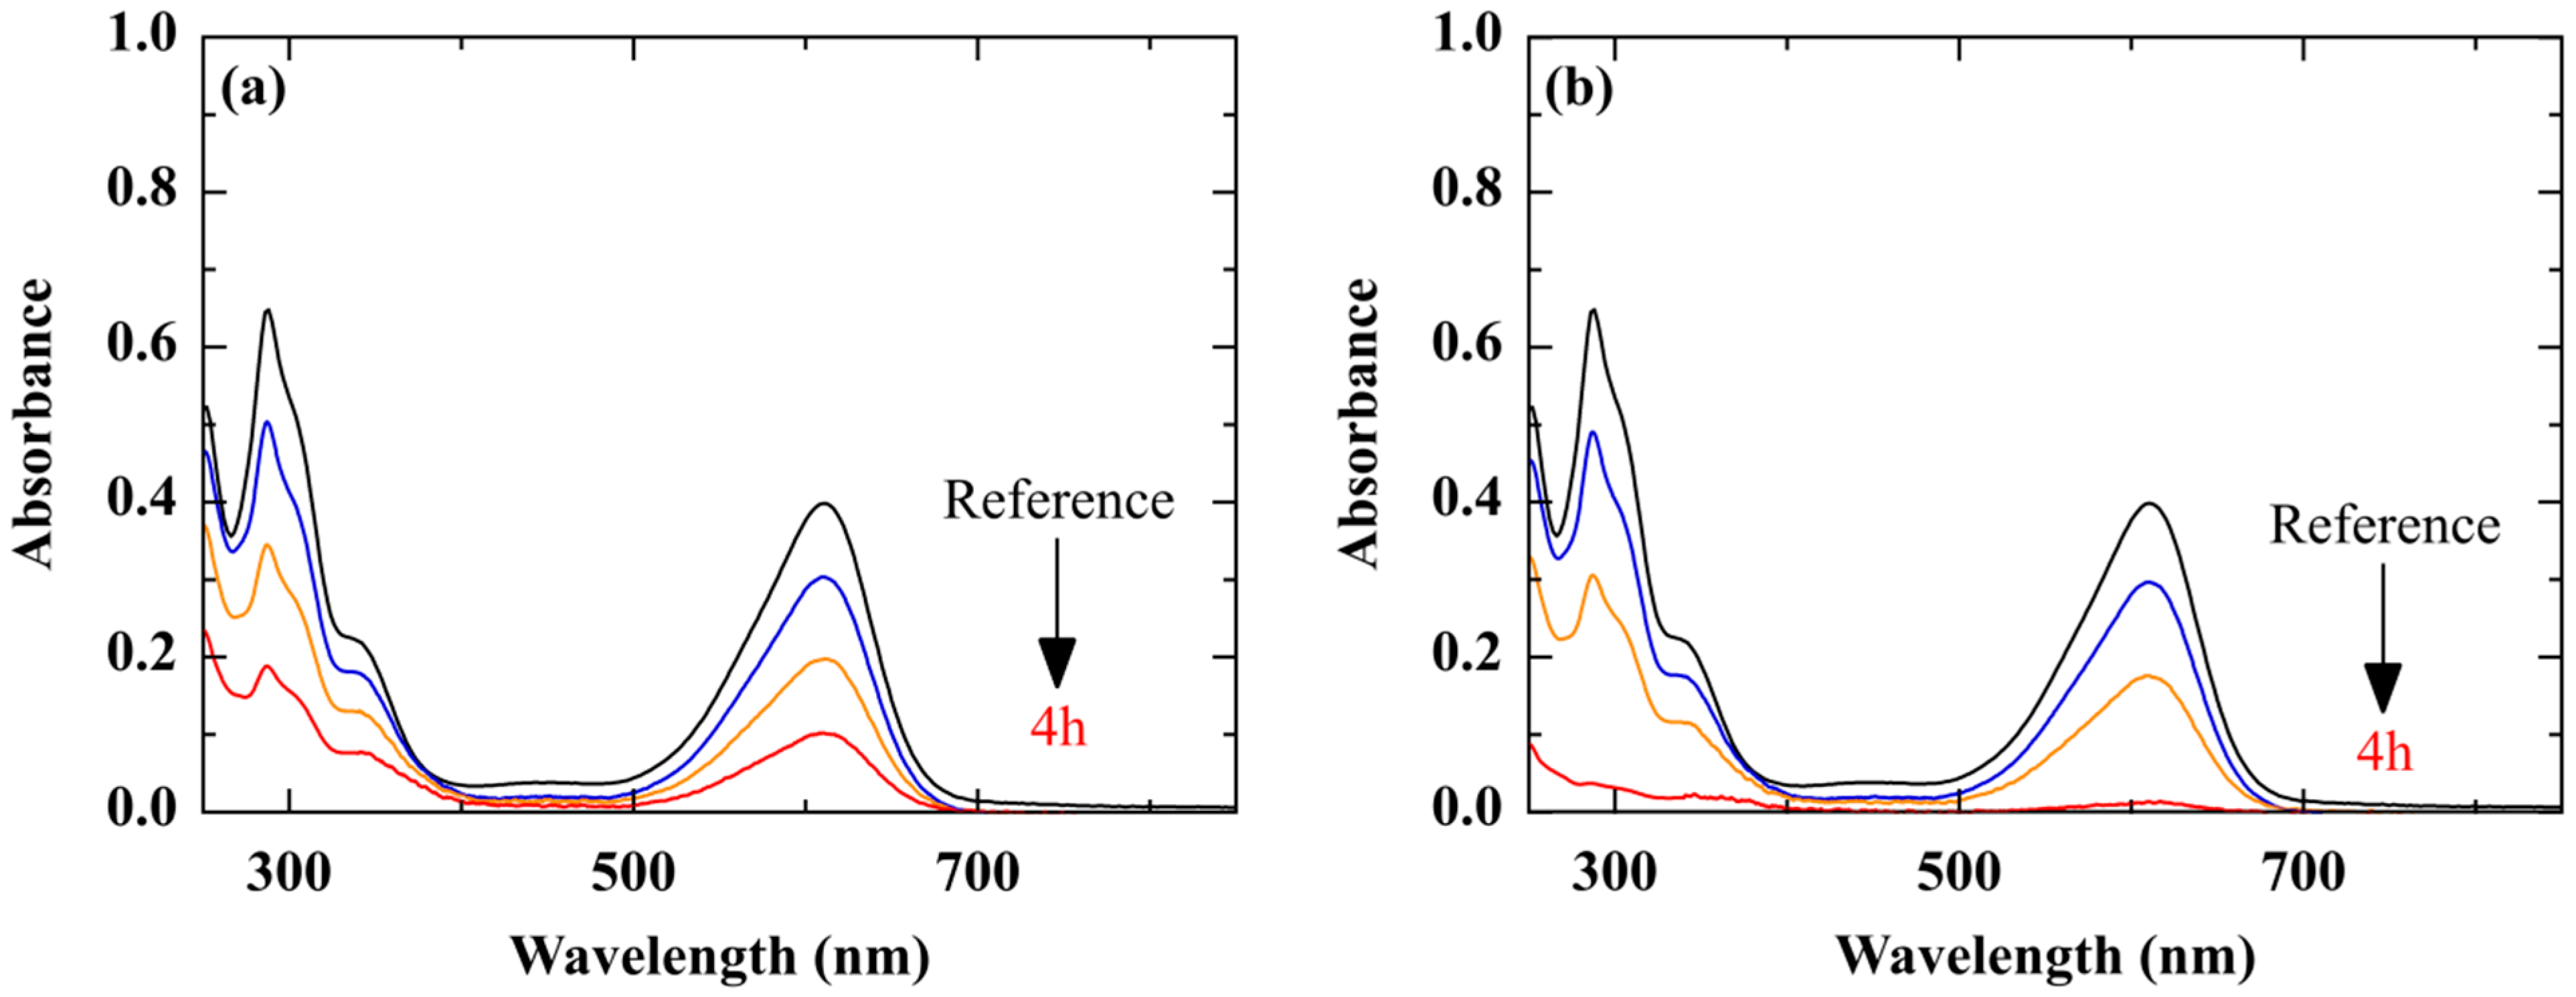
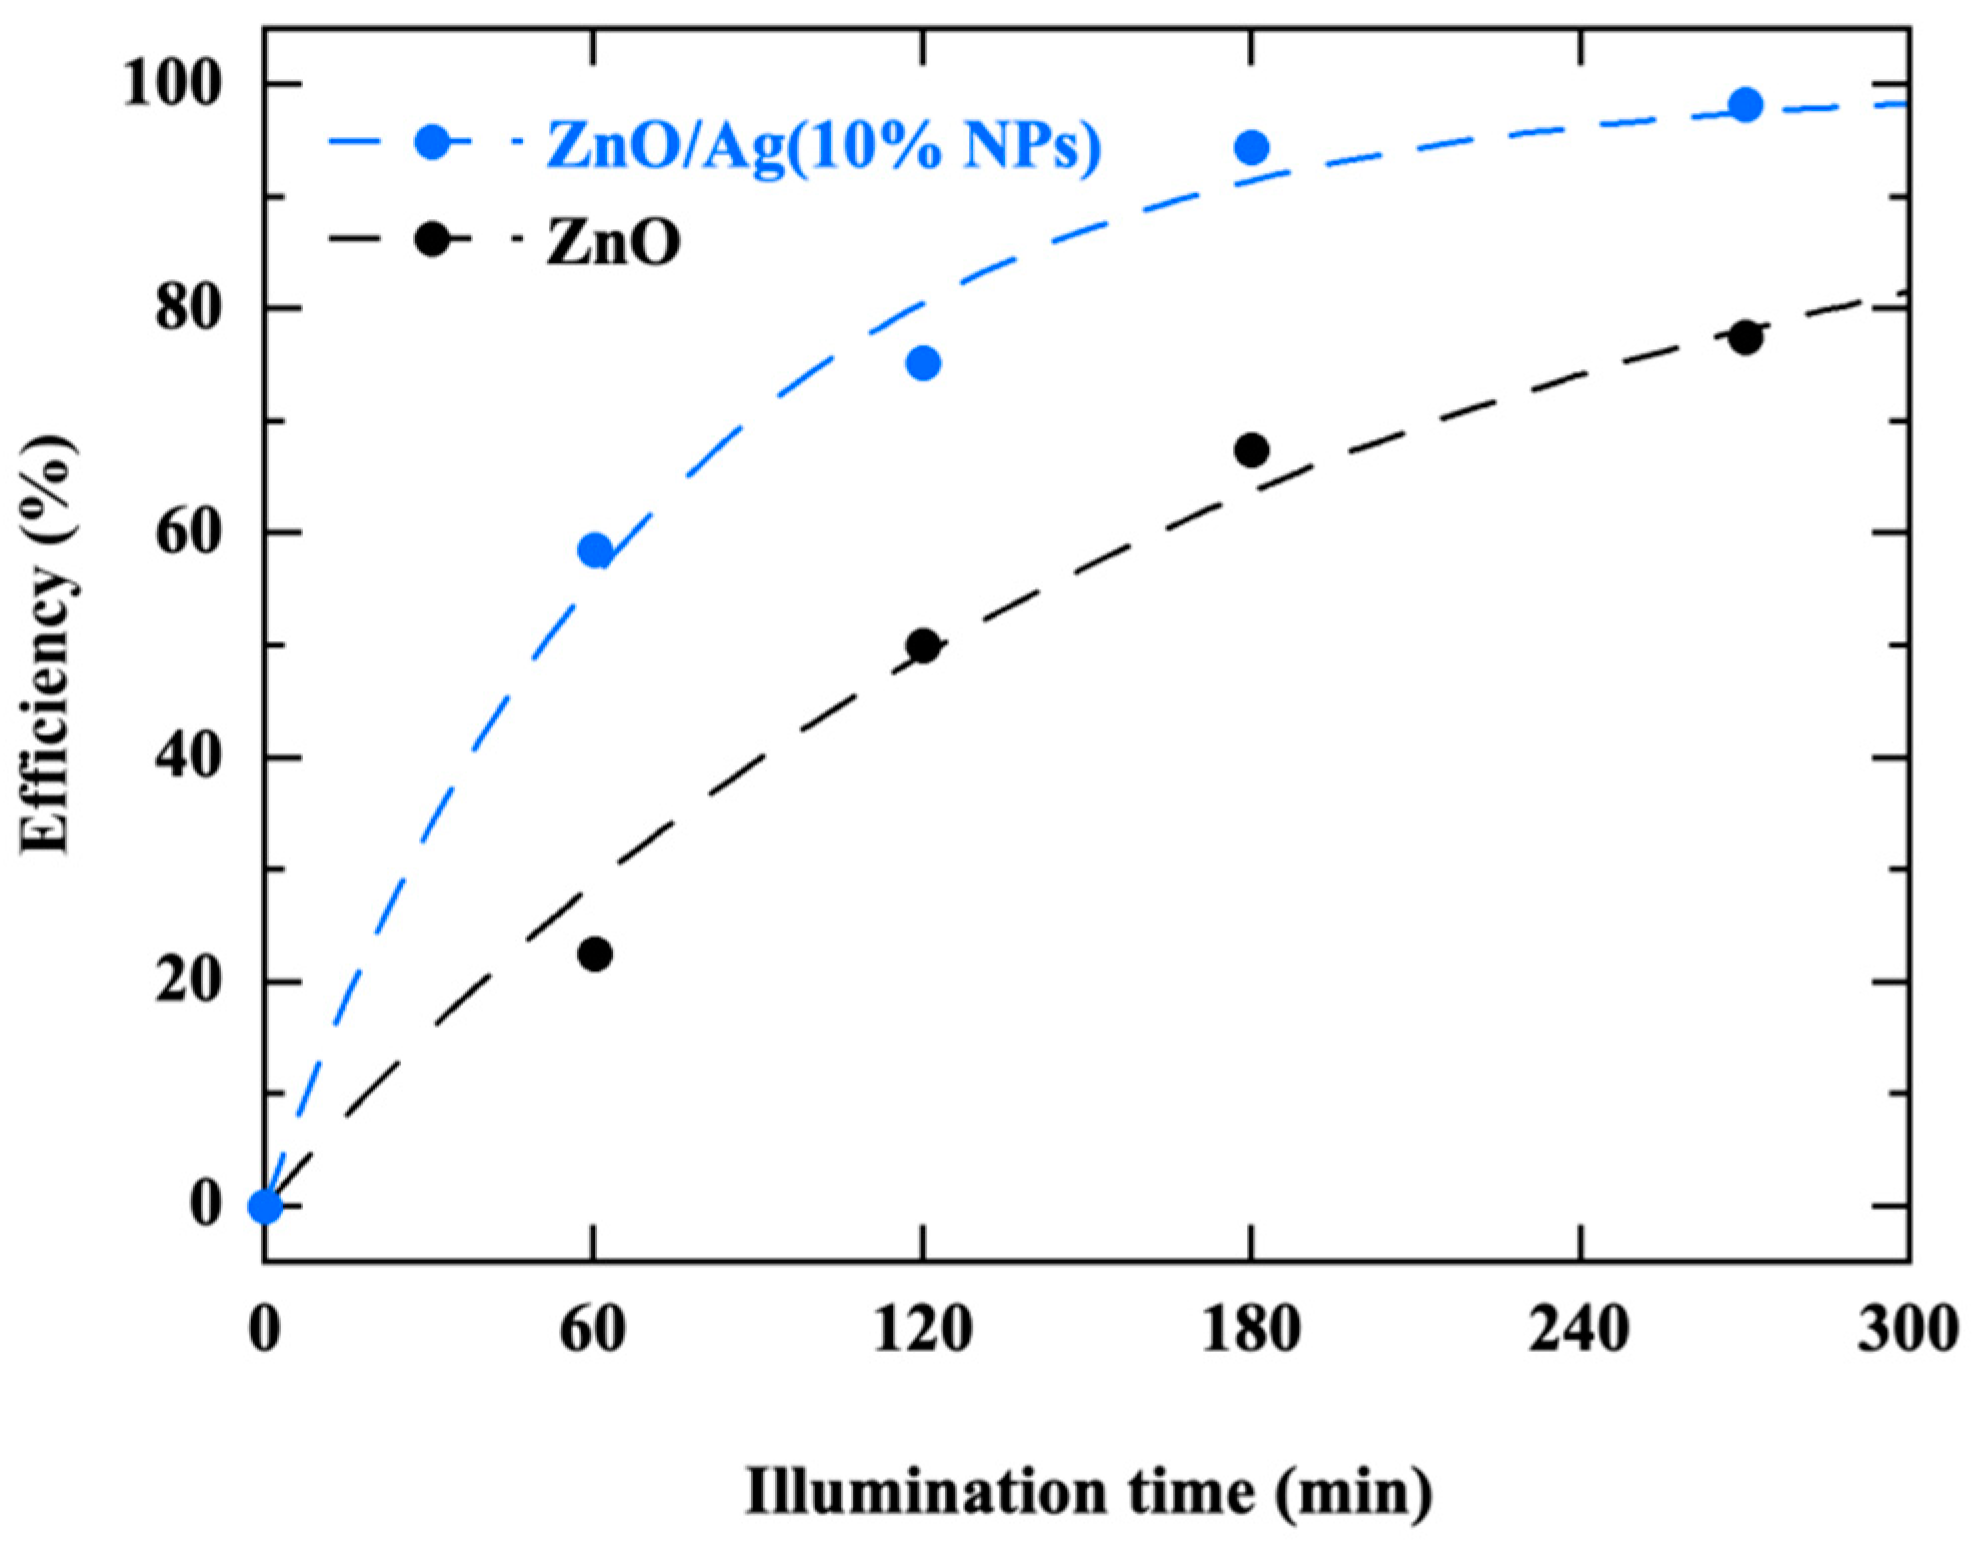
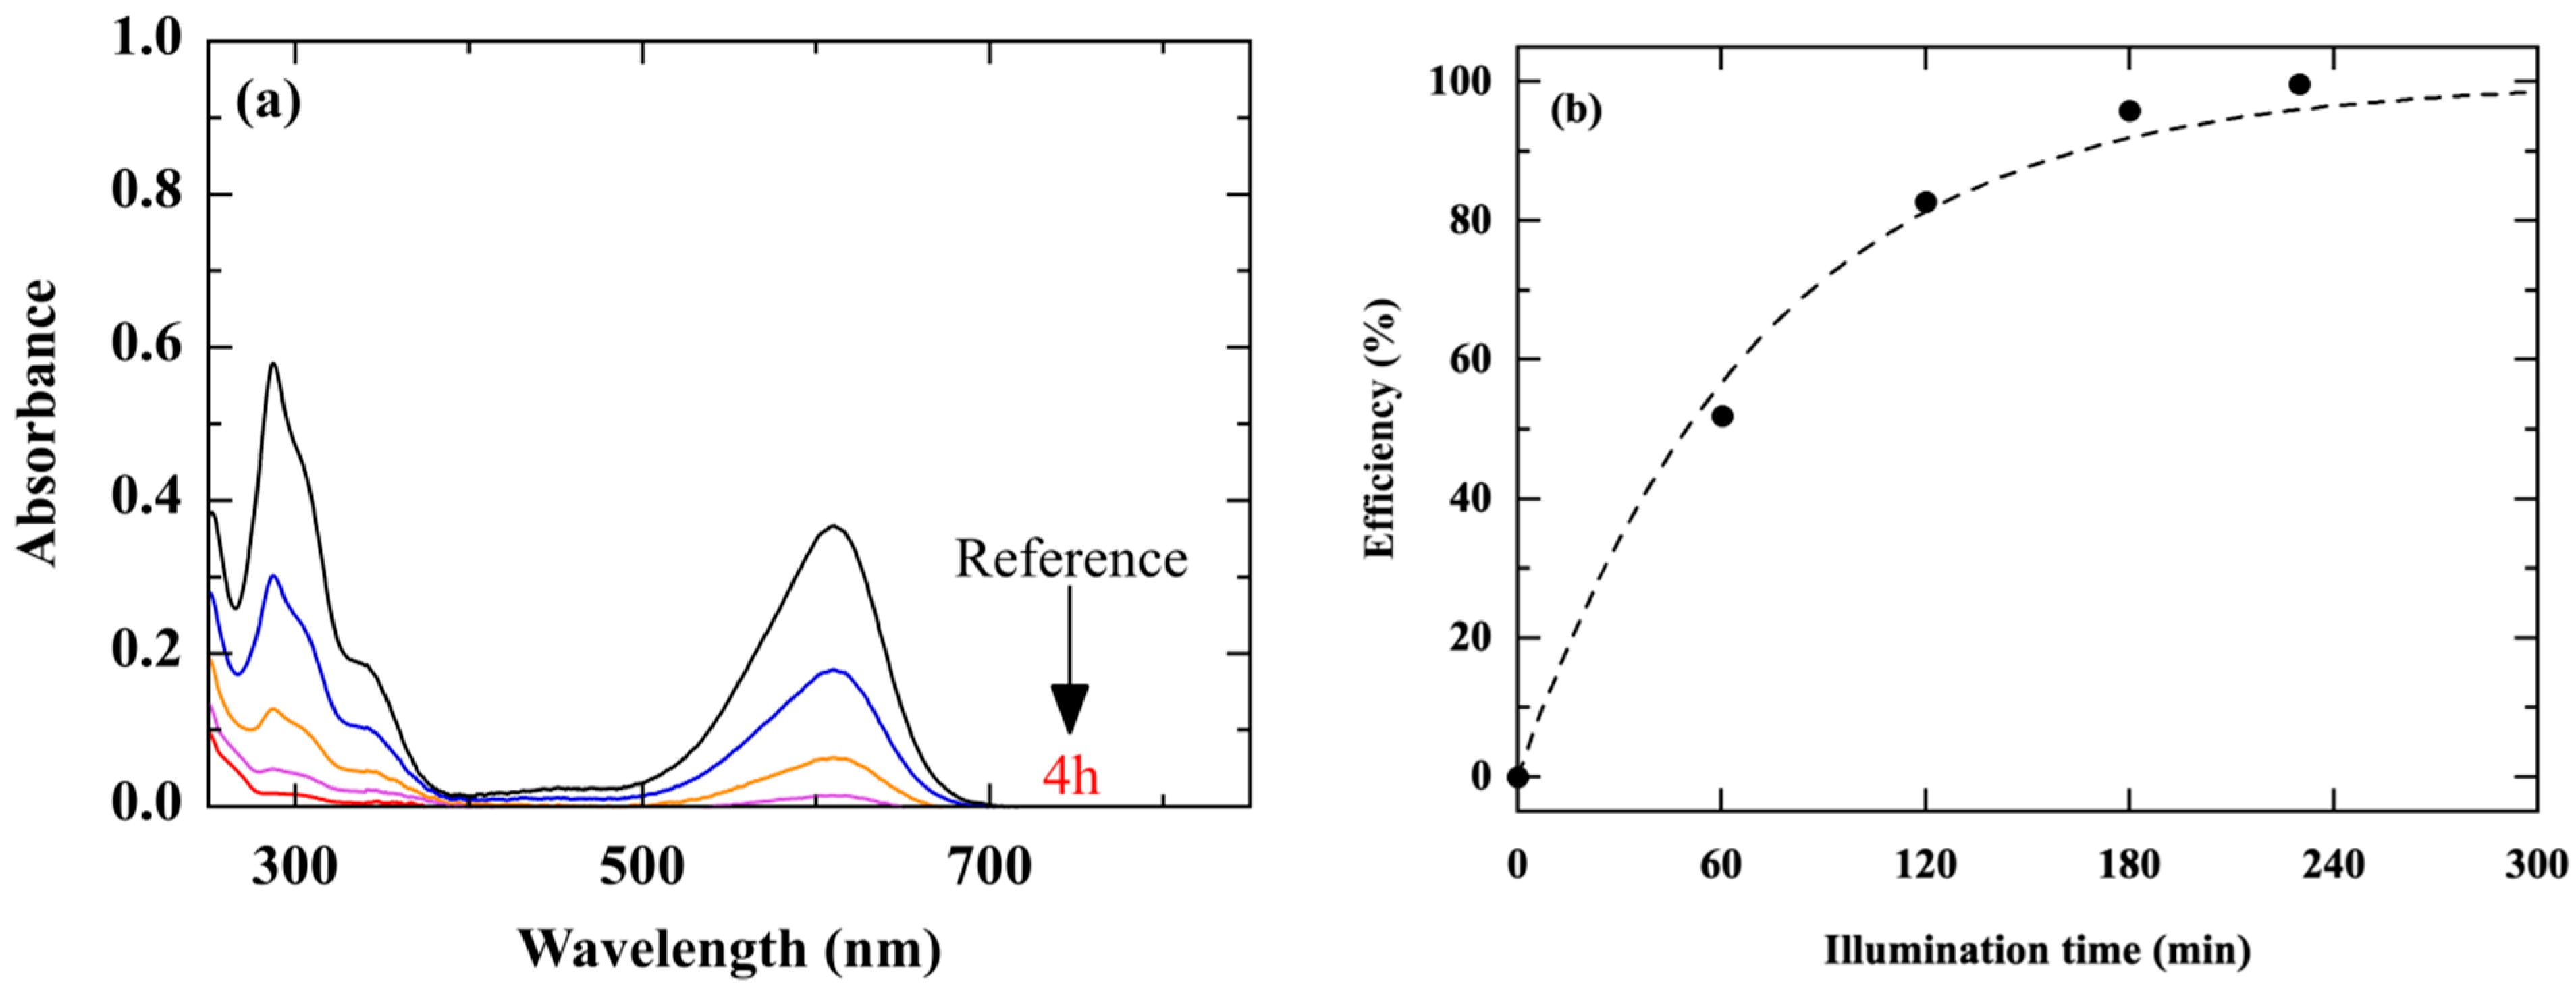
3.6. Photocatalytic Performance under Natural Conditions

As previously mentioned, the main objective of this work is to operate the fabricated photocatalysts under natural conditions, i.e., under sunlight irradiation to clean up a river water-based solution. The experiments were carried out in July, i.e., in summer and under a temperature of 30 °C, with a photocatalyst elaborated with the optimum content of Ag NPs (10%). The results of photodegradation of an IC solution, made from deionized water, by ZnO/Ag (10% NPs) are plotted in Figure 14b. For comparison, we performed the same measurements with a pure ZnO thin film as a photocatalyst (Figure 14a). Let us recall that the IC solution is characterized by absorption peaks at 280 and 610 nm, attributed to the indigoid group present as a chromophore center in the IC molecule. Our photodegradation measurements are monitored from the absorption band at 610 nm. After 4 h of sunlight exposure, Figure 14b shows almost complete degradation of the dye with the ZnO/Ag(10% NPs) photocatalyst, which is not the case with pure ZnO (Figure 14a). Figure 15 compares the photocatalytic degradation efficiency of the two photocatalysts during the 4 h of sunlight irradiation. A high photocatalytic efficiency (97%) is reached with ZnO/Ag(10% NPs) after 4 h of sunlight irradiation, with a rate constant of 15 × 10−3 min−1. In the case of pure ZnO, the efficiency does not even reach 80% with a lower rate constant of 6 × 10⁻³ min−1.
As the photocatalyst is intended to treat effluent water, we prepared an IC solution with the same initial concentration of 6.6 mg/L and the same volume, using water from the Somme river (a river in the north of France that flows into the English Channel). Figure 16 reveals a total degradation of the dye with ZnO/Ag(10% NPs) after 3 h and 50 min of sunlight irradiation, with a high degradation rate of 24 × 10−3 min−1. This performance must be attributed to different effects such as the pH value of the solution (pH = 7.8), a probable contribution of bacteria and micro-algae present in the Somme water which support the degradation of the dye simultaneously with the photocatalysis. This last effect would require further study to assess the extent of its contribution.
The stability of photocatalytic performance and reusability are critical parameters in the selection of a photocatalyst. Photodegradation experiments of the IC solution by the ZnO/Ag(10% NPs) photocatalyst were repeated in 5 cycles of 4 h each. At each cycle, the photocatalyst was carefully cleaned with deionized water and then dried in the open air at room temperature. The IC solution is prepared and stored in the dark. In order to stabilize the surface of the photocatalyst, it is kept in the dark before use. The protocol followed has been widely detailed in a previous paper [25].
Figure 17 summarizes the results of the reuse test experiments obtained with ZnO/Ag(10% NPs) under sunlight irradiation and for the degradation of an IC solution prepared with deionized water (Figure 17a) or natural water (Figure 17b). It also compares them with those obtained with pure ZnO. From this figure we can draw the following conclusions:
-
In the case of a dye solution with deionized water (Figure 17a), both photocatalysts show good stability, in terms of photodegradation efficiency, during the 5 cycles of 4 h of use. The ZnO/Ag(10% NPs) photocatalyst reaches an efficiency of 100% from the 2nd cycle. The efficiency of pure ZnO photocatalyst does not reach 80%.
-
In the case of a dye solution prepared with natural water, the efficiency of ZnO/Ag (10% NPs) reaches 100% as early as the 1st cycle. This efficiency decreases by 15% after 5 cycles. With pure ZnO, the initial photocatalytic efficiency is close to 80% in the 1st cycle and decreases to 60% after 5 cycles.
The decrease in photocatalytic performance in the case of a natural water-based solution suggests that contaminants may inhibit the active sites onto the surface of the photocatalyst over time. Indeed, the surface of the photocatalyst shows slight changes after its extended exposure to this natural water of pH = 7.8 [52]. This surface change is probably due to contamination and/or corrosion of the photocatalyst surface. Some authors achieve the same photocatalytic performances under conditions similar to ours but using photocatalysts is much more complicated to elaborate ZnO nanostructures, multi-doped ZnO, …) [53]. Finally, we also verified by preliminary measurements by high-performance liquid chromatography (HPLC) that the dye mineralization was complete and that no new products were formed.
The photocatalytic efficiency depends on the type of catalyst, the nature and the concentration of the dye, and the experimental conditions (light power, surface of the catalyst, pH of the solution, etc). Therefore, the comparison of our results with those of the literature is not easy. However, since stability and efficiency are the key factors for the industrial application of the catalyst, we list in Table 1 the results of some studies on the photodegradation of indigo carmine with ZnO-based catalysts under solar irradiation. It should be noted that in all these studies, the catalyst is in powder form, and recovery after use is a real drawback.

4. Conclusions

ZnO/Ag(NPs) nanocomposites thin films were successfully produced by a one-step sol–gel spin-coating deposition process, with Ag NPs directly included and well-dispersed in the precursor solution. Ag NPs of 20 nm in size, which remain well stable in the precursor solution, form Ag aggregates of about 100 nm and are uniformly distributed onto the surface of the nanocomposite mine film. The photocatalytic performance of ZnO/Ag(NPs) nanocomposite thin films was tested through the degradation of indigo carmine solutions under both laboratory and natural conditions. The presence of Ag NPs improves the photocatalytic performance of ZnO in both UV and visible illumination. By varying the content of Ag NPs in the nanocomposite up to 30% in mass percentage Ag/ZnO, we highlighted an optimum at 10%. The ZnO/Ag (10% NPs) photocatalyst exhibits high reliability after at least five photodegradation cycles of 4 h under laboratory conditions of use. It also shows high efficiency in the treatment of natural water-based solutions using sunlight. Further studies on the effects of different parameters such as solution pH, photocorrosion, contaminant adsorption, etc., need to be conducted to further improve this performance.

Author Contributions

Conceptualization and methodology, M.G., M.L., and A.H.; validation, M.L., M.G., and A.H.; investigation, M.K. and F.L.; writing—original draft preparation, M.K.; writing—review and editing, A.H. All authors have read and agreed to the published version of the manuscript.

Funding

This research received no external funding.

Institutional Review Board Statement

Not applicable.

Informed Consent Statement

Not applicable.

Data Availability Statement

The data presented in this study are available on request from the corresponding author.

Acknowledgments

This study was carried out within the framework of the PhD thesis of Mouna Khiari, thanks to public funding from the French regions Grand-Est and Hauts-de-France and a fruitful collaboration between the MATIM laboratory of the University of Reims (URCA) and the LPMC laboratory of the University of Amiens (UPJV).

Conflicts of Interest

The authors declare no conflict of interest.

References

  1. Ajala, O.J.; Tijani, J.O.; Salau, R.B.; Abdulkareem, A.S.; Aremu, O.S. A review of emerging micro-pollutants in hospital wastewater: Environmental fate and remediation options. Results Eng. 2022, 16, 100671. [Google Scholar] [CrossRef]
  2. Saad Algarni, T.; Abduh, N.A.Y.; Al Kahtani, A.; Aouissi, A. Photocatalytic degradation of some dyes under solar light irradiation using ZnO nanoparticles synthesized from Rosmarinus officinalis extract. Green Chem. Lett. Rev. 2022, 15, 460–473. [Google Scholar] [CrossRef]
  3. Khiari, M.; Gilliot, M.; Lejeune, M.; Lazar, F.; Hadjadj, A. Preparation of Very Thin Zinc Oxide Films by Liquid Deposition Process: Review of Key Processing Parameters. Coatings 2022, 12, 65. [Google Scholar] [CrossRef]
  4. Šuligoj, A.; Cerc Korošec, R.; Žerjav, G.; Novak Tušar, N.; Lavrenčič Štangar, U. Solar-Driven Photocatalytic Films: Synthesis Approaches, Factors Affecting Environmental Activity, and Characterization Featuresy. Top. Curr. Chem. 2022, 380, 51. [Google Scholar] [CrossRef]
  5. Sanakousara, F.M.; Vidyasagara, C.C.; Jiménez-Pérezb, V.M.; Prakashc, K. Recent progress on visible-light-driven metal and non-metal doped ZnO nanostructures for photocatalytic degradation of organic pollutants. Mater. Sci. Semicond. Process. 2022, 140, 106390. [Google Scholar] [CrossRef]
  6. Qumar, U.; Hassan, J.Z.; Bhatti, R.A.; Raza, A.; Nazir, G.; Nabgan, W.; Ikram, M. Photocatalysis vs adsorption by metal oxide nanoparticles. J. Mater. Sci. Technol. 2022, 131, 122–166. [Google Scholar] [CrossRef]
  7. Commission Regulation (EU) 2022/63 of 14 January 2022 Amending Annexes II and III to Regulation (EC) No 1333/2008 of the European Parliament and of the Council as Regards the Food Additive Titanium Dioxide (E 171) (Text with EEA Relevance). Available online: http://data.europa.eu/eli/reg/2022/63/oj (accessed on 9 November 2022).
  8. Ikram, M.; Rashid, M.; Haider, A.; Naz, S.; Haider, J.; Raza, A.; Ansar, M.T.; Uddin, M.K.; Ali, N.M.; Ahmed, S.S.; et al. A review of photocatalytic characterization, and environmental cleaning, of metal oxide nanostructured materials. Sustain. Mater. Technol. 2021, 30, e00343. [Google Scholar] [CrossRef]
  9. Ivanuša, M.; Kumer, B.; Petrovčič, E.; Štular, D.; Zorc, M.; Jerman, I.; Gorjanc, M.; Tomšič, B.; Simončič, B. Eco-Friendly Approach to Produce Durable Multifunctional Cotton Fibres Using TiO2, ZnO and Ag NPs. Nanomaterials 2022, 12, 3140. [Google Scholar] [CrossRef]
  10. Beura, R.; Pachaiappan, R.; Paramasivam, T. Photocatalytic degradation studies of organic dyes over novel Ag-loaded ZnO-graphene hybrid nanocomposites. J. Phys. Chem. Solids 2021, 148, 109689. [Google Scholar] [CrossRef]
  11. Chen, X.; Zhu, L.; Ma, Z.; Wang, M.; Zhao, R.; Zou, Y.; Fan, Y. Ag Nanoparticles Decorated ZnO Nanorods as Multifunctional SERS Substrates for Ultrasensitive Detection and Catalytic Degradation of Rhodamine B. Nanomaterials 2022, 12, 2394. [Google Scholar] [CrossRef]
  12. Phuruangrat, A.; Siri, S.; Wadbua, P.; Thongtem, S.; Thongtem, T. Microwave-assisted synthesis, photocatalysis and antibacterial activity of Ag nanoparticles supported on ZnO flowers. J. Phys. Chem. Solids 2019, 126, 170–177. [Google Scholar] [CrossRef]
  13. Babu, A.T.; Antony, R. Green synthesis of silver doped nano metal oxides of zinc & copper for antibacterial properties, adsorption, catalytic hydrogenation & photodegradation of aromatics. J. Environ. Chem. Eng. 2019, 7, 102840. [Google Scholar]
  14. Ata, S.; Shaheen, I.; Ghafoor, S.; Sultan, M.; Majid, F.; Bibi, I.; Iqbal, M. Graphene and silver decorated ZnO composite synthesis, characterization and photocatalytic activity evaluation. Diam. Relat. Mater. 2018, 90, 26–31. [Google Scholar] [CrossRef]
  15. Elsellami, L.; Djeridi, W. Charge transfer modulation (e−/h+) between TiO2, ZnO, and Ag for a superior photocatalytic performance. J. Mat. Res. 2022, 37, 897–908. [Google Scholar] [CrossRef]
  16. Munawar, K.; Mansoor, M.A.; Olmstead, M.M.; Zaharinie, T.; Mohd Zubir, M.N.; Haniffa, M.; Basirun, W.J.; Mazhar, M. Fabrication of Ag-ZnO composite thin films for plasmonic enhanced water splitting. Mater. Chem. Phys. 2020, 255, 123220. [Google Scholar] [CrossRef]
  17. Vallejo, W.; Cantillo, A.; Díaz-Uribe, C. Methylene blue photodegradation under visible irradiation on Ag-doped ZnO thin films. Int. J. Photoenergy 2020, 2020, 1627498. [Google Scholar] [CrossRef] [Green Version]
  18. Abdelsamad, A.M.; Gad-Allah, T.A.; Mahmoud, F.A.; Badawy, M.I. Enhanced photocatalytic degradation of textile wastewater using Ag/ZnO thin films. J. Water Process Eng. 2018, 25, 88–95. [Google Scholar] [CrossRef]
  19. Badawy, M.I.; Mahmoud, F.A.; Abdel-Khalek, A.A.; Gad-Allah, T.A.; Abdel Samad, A.A. Solar photocatalytic activity of sol–gel prepared Ag-doped ZnO thin films. Desalination Water Treat. 2014, 52, 2601–2608. [Google Scholar] [CrossRef]
  20. Thongsuriwong, K.; Amornpitoksuk, P.; Suwanboon, S. Photocatalytic and antibacterial activities of Ag-doped ZnO thin films prepared by a sol–gel dip-coating method. J. Sol-Gel Sci. Technol. 2012, 62, 304–312. [Google Scholar] [CrossRef]
  21. Podasca, V.E.; Damaceanu, M.D. ZnO-Ag based polymer composites as photocatalysts for highly efficient visible-light degradation of Methyl Orange. J. Photochem. Photobiol. A Chem. 2021, 406, 113003. [Google Scholar] [CrossRef]
  22. Pathak, T.K.; Kroon, R.E.; Swart, H.C. Photocatalytic and biological applications of Ag and Au doped ZnO nanomaterial synthesized by combustion. Vacuum 2018, 157, 508–513. [Google Scholar] [CrossRef]
  23. Stanley, R.; Jebasingh, J.A.; Manisha Vidyavathy, S.; Kingston Stanley, P.; Ponmani, P.; Shekinah, M.E.; Vasanthi, J. Excellent Photocatalytic degradation of Methylene Blue, Rhodamine B and Methyl Orange dyes by Ag-ZnO nanocomposite under natural sunlight irradiation. Optik 2021, 231, 166518. [Google Scholar]
  24. Hunge, Y.M.; Yadav, A.A.; Kang, S.-W.; Kim, H. Facile synthesis of multitasking composite of Silver nanoparticle with Zinc oxide for 4-nitrophenol reduction, photocatalytic hydrogen production, and 4-chlorophenol degradation. J. Alloys Compd. 2022, 928, 167133. [Google Scholar] [CrossRef]
  25. Khiari, M.; Gilliot, M.; Lejeune, M.; Lazar, F.; Hadjadj, A. Effects of ag nanoparticles on zinc oxide photocatalytic performance. Coatings 2021, 11, 400. [Google Scholar] [CrossRef]
  26. Gilliot, M.; Hadjadj, A.; Martin, J. Luminescence and ellipsometry investigations of annealing effects on nano-granular ZnO. J. Lumin. 2017, 192, 25–32. [Google Scholar] [CrossRef]
  27. Gilliot, M. Inversion of ellipsometry data using constrained spline analysis. Appl. Opt. 2017, 56, 1173. [Google Scholar] [CrossRef]
  28. Gilliot, M.; Hadjadj, A.; Stchakovsky, M. Spectroscopic ellipsometry data inversion using constrained splines and application to characterization of ZnO with various morphologies. Appl. Surf. Sci. 2017, 421, 453–459. [Google Scholar] [CrossRef]
  29. Khiari, M.; Gilliot, M.; Lejeune, M.; Lazar, F.; Hadjadj, A. ZnO/Ag nanocomposite thin films: A promising approach for dye degradation. Asp. Min. Miner. Sci. 2021, 7, 833–835. [Google Scholar]
  30. Jackson, P.; Robinson, K.; Puxty, G.; Attalla, M. In situ Fourier Transform-Infrared (FT-IR) analysis of carbon dioxide absorption and desorption in amine solutions. Energy Procedia 2009, 1, 985–994. [Google Scholar] [CrossRef] [Green Version]
  31. Znaidi, L.; Illia, G.J.A.A.; Guennic, R.L.; Sanchez, C.; Kanaev, A. Elaboration of ZnO thin films with preferential orientation by a soft chemistry route. J. Sol-Gel Sci. Technol. 2003, 26, 817–821. [Google Scholar] [CrossRef]
  32. Khan, Z.R.; Khan, M.S.; Zulfequar, M.; Khan, M.S. Optical and structural properties of ZnO thin films fabricated by sol-gel method. Mater. Sci. Appl. 2011, 2, 340–345. [Google Scholar] [CrossRef] [Green Version]
  33. Jnido, G.; Ohms, G.; Viöl, W. Deposition of Zinc Oxide Coatings on Wood Surfaces Using the Solution Precursor Plasma Spraying Process. Coatings 2021, 11, 183. [Google Scholar] [CrossRef]
  34. Nandi, S.K.; Chakraborty, S.; Bera, M.K.; Maiti, C.K. Structural and optical properties of ZnO films grown on silicon and their applications in MOS devices in conjunction with ZrO2 as a gate dielectric. Bull. Mater. Sci. 2007, 30, 247–254. [Google Scholar] [CrossRef]
  35. Oje, A.I.; Ogwu, A.A.; Mirzaeian, M.; Tsendzughul, N. Electrochemical energy storage of silver and silver oxide thin films in an aqueous NaCl electrolyte. J. Electroanal. Chem. 2018, 829, 59–68. [Google Scholar] [CrossRef] [Green Version]
  36. Yahia, S.B.; Znaidi, L.; Kanaev, A.; Petitet, J. PRaman study of oriented ZnO thin films deposited by sol–gel method. Spectrochim. Acta Part A Mol. Biomol. Spectrosc. 2008, 71, 1234–1238. [Google Scholar] [CrossRef]
  37. Arguello, C.A.; Rousseau, D.L.; Porto, S.D.S. First-order Raman effect in wurtzite-type crystals. Phys. Rev. 1969, 181, 1351–1363. [Google Scholar] [CrossRef]
  38. Wang, X.B.; Song, C.; Geng, K.W.; Zeng, F.; Pan, F. Luminescence and Raman scattering properties of Ag-doped ZnO films. J. Phys. D Appl. Phys. 2006, 39, 4992–4996. [Google Scholar] [CrossRef]
  39. Bian, H.Q.; Ma, S.Y.; Zhang, Z.M.; Gao, J.M.; Zhu, H.B. Microstructure and Raman scattering of Ag-doping ZnO films deposited on buffer layers. J. Cryst. Growth 2014, 394, 132–136. [Google Scholar] [CrossRef]
  40. Ramirez, D.; Jaramillo, F. Facile one-pot synthesis of uniform silver nanoparticles and growth mechanism. Dyna 2016, 83, 165–170. [Google Scholar] [CrossRef]
  41. Akbari-Sharbaf, A.; Ezugwu, S.; Ahmed, M.S.; Cottam, M.G.; Fanchini, G. Doping graphene thin films with metallic nanoparticles: Experiment and theory. Carbon 2015, 95, 199–207. [Google Scholar] [CrossRef]
  42. Kumar, V.S.; Kanjilal, D. Influence of post-deposition annealing on structural, optical and transport properties of nanocomposite ZnO-Ag thin films. Mater. Sci. Semicond. Process. 2018, 81, 22–29. [Google Scholar] [CrossRef]
  43. Lee, K.C.; Lin, S.J.; Lin, C.H.; Tsai, C.S.; Lu, Y.J. Size effect of Ag nanoparticles on surface plasmon resonance. Surf. Coat. Technol. 2008, 202, 5339–5342. [Google Scholar] [CrossRef]
  44. Borges, J.; Buljan, M.; Sancho-Parramon, J.; Bogdanovic-Radovic, I.; Siketic, Z.; Scherer, T.; Kübel, C.; Bernstorff, S.; Cavaleiro, A.; Vaz, F.; et al. Evolution of the surface plasmon resonance of Au:TiO2 nanocomposite thin films with annealing temperature. J. Nanoparticle Res. 2014, 16, 2790. [Google Scholar] [CrossRef]
  45. Domingues, R.P.; Rodrigues, M.S.; Lopes, C.; Pedrosa, P.; Alves, E.; Barradas, N.P.; Borges, J.; Vaz, F. Thin films composed of metal nanoparticles (Au, Ag, Cu) dispersed in AlN: The influence of composition and thermal annealing on the structure and plasmonic response. Thin Solid Film. 2019, 676, 12–25. [Google Scholar] [CrossRef]
  46. Huang, L.; Lau, S.P.; Yang, H.Y.; Leong, E.S.P.; Yu, S.F.; Prawer, S. Stable superhydrophobic surface via carbon nanotubes coated with a ZnO thin film. J. Phys. Chem. B 2005, 109, 7746–7748. [Google Scholar] [CrossRef]
  47. Ilkhechi, N.N.; Ghobadi, N.; Yahyavi, F. Enhanced optical and hydrophilic properties of V and La co-doped ZnO thin films. Opt. Quantum Electron. 2017, 49, 39. [Google Scholar] [CrossRef]
  48. Tarwal, N.L.; Patil, P.S. Superhydrophobic and transparent ZnO thin films synthesized by spray pyrolysis technique. Appl. Surf. Sci. 2010, 256, 7451–7456. [Google Scholar] [CrossRef]
  49. Sun, R.D.; Nakajima, A.; Fujishima, A.; Watanabe, T.; Hashimoto, K. Photoinduced surface wettability conversion of ZnO and TiO2 thin films. J. Phys. Chem. B 2001, 105, 1984–1990. [Google Scholar] [CrossRef]
  50. Lejeune, M.; Lacroix, L.M.; Brétagnol, F.; Valsesia, A.; Colpo, P.; Rossi, F. Plasma-based processes for surface wettability modification. Langmuir 2006, 22, 3057–3061. [Google Scholar] [CrossRef]
  51. Singh, S. Natural sunlight driven photocatalytic performance of Ag/ZnO nanocrystals. Mater. Today Commun. 2022, 33, 104438. [Google Scholar] [CrossRef]
  52. Zhao, Y.; Zhang, Y.J.; Meng, J.H.; Chen, S.; Panneerselvam, R.; Li, C.Y.; Jamali, S.B.; Li, X.; Yang, Z.L.; Li, J.F.; et al. A facile method for the synthesis of large-size Ag nanoparticles as efficient SERS substrates. J. Raman Spectrosc. 2016, 47, 662–667. [Google Scholar] [CrossRef]
  53. Tauc, J.; Grigorovici, R.; Vancu, A. Optical Properties and Electronic Structure of Amorphous Germanium. Phys. Status Solidi (B) 1966, 15, 627–637. [Google Scholar] [CrossRef]
  54. Shinde, S.G.; Patil, M.P.; Kim, G.D.; Shrivastava, V.S. Multi-doped ZnO photocatalyst for solar induced degradation of indigo carmine dye and as an antimicrobial agent. J. Inorg. Organomet. Polym. Mater. 2020, 30, 1141–1152. [Google Scholar] [CrossRef]
  55. Labhane, P.; Sonawane, S.; Patil, S.; Huse, V. Influence of Mg doping on ZnO nanoparticles decorated on graphene oxide (GO) crumpled paper like sheet and its high photo catalytic performance under sunlight. J. Phys. Chem. Solids 2018, 114, 71–82. [Google Scholar] [CrossRef]
  56. Abdel-Aziz, R.; Ahmed, M.A.; Abdel-Messih, M.F. A novel UV and visible light driven photocatalyst AgIO4/ZnO nanoparticles with highly enhanced photocatalytic performance for removal of rhodamine B and indigo carmine dyes. J. Photochem. Photobiol. A Chem. 2020, 389, 112245. [Google Scholar] [CrossRef]
  57. Namratha, K.; Byrappa, K.; Byrappa, S.; Venkateswarlu, P.; Rajasekhar, D.; Deepthi, B.K. Hydrothermal fabrication of selectively doped organic assisted advanced ZnO nanomaterial for solar driven photocatalysis. J. Environ. Sci. 2015, 34, 248–255. [Google Scholar] [CrossRef]
Figure 1. Sol–gel and spin-coating processing of ZnO nanocomposite films loaded with Ag NPs (ZnO/Ag(NPs)).
Coatings 12 01782 g001
Figure 2. FTIR absorption spectrum of ZnO precursor solution without and with 10% Ag NPs.
Coatings 12 01782 g002
Figure 3. Raman spectrum of the ZnO precursor solution, without and with 10% Ag NPs.
Coatings 12 01782 g003
Figure 4. Surface appearance of ZnO/Ag(NPs) nanocomposite thin films deposited on a c-Si substrate, with a size of about 20 × 20 mm2 and prepared with different Ag NPs contents: 0% (a), 5% (b), 10% (c), and 30% (d).
Coatings 12 01782 g004
Figure 5. SEM images of the surface morphology, at a scale of a few hundred nm, of pure ZnO thin film (a) and ZnO/Ag(NPs) nanocomposite thin films elaborated with different Ag NPs: contents: 5% (b), 10% (c), and 30% (d).
Coatings 12 01782 g005
Figure 6. Average size of ZnO grains and Ag NPs as a function of Ag NPs content in the nanocomposite deduced from SEM images.
Coatings 12 01782 g006
Figure 7. XRD diagram of pure ZnO and ZnO/Ag(NPs) nanocomposites elaborated with contents: 10% and 30% of Ag NPs.
Coatings 12 01782 g007
Figure 8. Contact angle value of c-Si substrate, ZnO thin film, and nanocomposite thin films with different Ag NPs contents.
Coatings 12 01782 g008
Figure 9. Thicknesses of the bulk layer (db) and surface roughness (ds), determined by ellipsometry, and total thickness measured by a profilometer, of ZnO/Ag(NPs) nanocomposite films with different Ag NPs contents.
Coatings 12 01782 g009
Figure 10. Real part (a) and imaginary part (b) of the dielectric function of the ZnO/Ag(NPs) nanocomposite film loaded with different contents of Ag NPs.
Coatings 12 01782 g010
Figure 11. Bandgap of pure ZnO thin film and ZnO/Ag(NPs) nanocomposite thin films. The dashed curve is provided as a guide for the eye.
Coatings 12 01782 g011
Figure 12. Rate constant (a) and photodegradation efficiency (b) of an IC solution after 6 h of illumination under UV irradiation, with a ZnO thin film and a ZnO/Ag(NPs) thin film loaded at different Ag(NPs) contents. The curves are provided as guides for the eye.
Coatings 12 01782 g012
Figure 13. Rate constant (a) and photodegradation efficiency (b) of an IC solution after 6 h of illumination under halogen lamp irradiation equipped with a UV filter, with a ZnO thin film and a ZnO/Ag(NPs) thin film loaded at different Ag(NPs) contents. The curves are provided as guides for the eye.
Coatings 12 01782 g013
Figure 14. Absorbance spectrum of a CI solution under solar irradiation over time in the presence of pure ZnO thin film (a) and ZnO/Ag(10% NPs) thin film (b).
Coatings 12 01782 g014
Figure 15. Photodegradation efficiency, over time, of an IC solution under solar irradiation by a ZnO/Ag(10% NPs) thin film and by a pure ZnO film. The curves are provided as guides for the eye.
Coatings 12 01782 g015
Figure 16. Absorbance spectrum (a) and photodegradation efficiency (b), over time, of a Somme water-based IC solution under solar irradiation and in the presence of a ZnO/Ag(10% NPs) photocatalyst.
Coatings 12 01782 g016
Figure 17. Photodegradation efficiency by a ZnO/Ag(10% NPs) photocatalyst under solar illumination of an IC solution prepared with deionized water (a) and Somme water (b), during 5 cycles of 4 h.
Coatings 12 01782 g017
Table 1. Comparison of the results of this study with those of the literature.
PhotocatalystpHIC SolutionLight SourceRate
Constant
EfficiencyStabilityReference
10–25 nm
1% Ni, C, N, S multi-doped nanospheres ZnO
3–115–15 (mg/L)Sunlight1.38–2.83
(10−2 min−1)
-−6% after 4 cyclesShinde et al. [54]
10–20 nm
Mg doped ZnO NPs on graphene oxide
-20 (mg/L)Sunlight4.97
(10−2 min−1)
97%
after 60 min
−10% after 4 cyclesLabhane et al. [55]
30–45 nm AgIO4/ZnO NPs7–1023 (mg/L)Sunlight-84%
after 110 min
−18% after 5 cyclesAbdelaziz et al. [56]
50–120 nm
(Ag+ + Pd3+) doped ZnO NPs
-8–40 (mg/L)Sunlight-58–77%after 180 min-Namratha et al. [57]
ted100 nm
ZnO/Ag(10% NPs) thin film
7.46.6 (mg/L)
(deionized water)
Sunlight1.5
(10−2min−1)
97%
after 240 min
−1% after 5 cyclesThis work
7.86.6 (mg/L)
(Somme water)
Sunlight2.4
(10−2min−1)
100%
after 240 min
−15% after 5 cyclesThis work
Publisher’s Note: MDPI stays neutral with regard to jurisdictional claims in published maps and institutional affiliations.

