Article

Phase Stability and Mechanical Properties of the Monoclinic, Monoclinic-Prime and Tetragonal REMO4 (M = Ta, Nb) from First-Principles Calculations

School of Materials Science and Engineering, Xiangtan University, Xiangtan 411105, China
*
Author to whom correspondence should be addressed.
Coatings 2022, 12(1), 73; https://doi.org/10.3390/coatings12010073
Submission received: 21 November 2021 / Revised: 26 December 2021 / Accepted: 28 December 2021 / Published: 8 January 2022
(This article belongs to the Special Issue Advances of Ceramic and Alloy Coatings)

Abstract

:
YTaO4 and the relevant modification are considered to be a promising new thermal barrier coating. In this article, phase stability and mechanical properties of the monoclinic (M), monoclinic-prime (M′), and tetragonal (T) REMO4 (M = Ta, Nb) are systematically investigated from first-principles calculations method based on density functional theory (DFT). Our calculations show that M′-RETaO4 is the thermodynamically stable phase at low temperatures, but the stable phase is a monoclinic structure for RENbO4. Moreover, the calculated relative energies between M (or M′) and T phases are inversely proportional to the ionic radius of rare earth elements. It means that the phase transformation temperature of M′→T or M→T could decrease along with the increasing ionic radius of RE3+, which is consistent with the experimental results. Besides, our calculations exhibit that adding Nb into the M′-RETaO4 phase could induce phase transformation temperature of M′→M. Elastic coefficient is attained by means of the strain-energy method. According to the Voigt–Reuss–Hill approximation method, bulk modulus, shear modulus, Young’s modulus, and Poisson’s ratio of T, M, and M’ phases are obtained. The B/G criterion proposed by Pugh theory exhibits that T, M, and M’ phases are all ductile. The hardness of REMO4 (M = Ta, Nb) phases are predicted based on semi-empirical equations, which is consistent with the experimental data. Finally, the anisotropic mechanical properties of the REMO4 materials have been analyzed. The emerging understanding provides theoretical guidance for the related materials development.

1. Introduction

The rare-earth tantalate and niobates with the formula REMO4 (M = Ta, Nb) have attracted increasing attention due to their wide application, such as biomedicine, military technology, aerospace, remote sensing, and laser [1]. Moreover, YTaO4 and the relevant modification are extensively investigated and supposed to be promising thermal barrier coatings (TBCs) [2,3,4] due to high phase stability, good mechanical properties, and thermal conductivity. Because of a ferroelastic toughening mechanism similar to the familiar ZrO2-8 mol%YO1.5 (8YSZ) materials, the high-temperature fracture toughness of YTaO4 is very well [5]. It is well known that YTaO4 has three different crystalline structures, such as monoclinic phase (M, space group I2/a), tetragonal phase (T, space group I41/a), and monoclinic-prime phase (M′, space group P2/a). The high-temperature phase transition is a second-order and displacive transformation when the equilibrium tetragonal (T) transited to the monoclinic (M) YTaO4 phase [6]. Although yttrium tantalate has more superior advantages than YSZ, it still has some shortcomings as a new thermal barrier coating. To improve the properties of the yttrium tantalate, doping and modifying are important.
In the periodic table of elements, yttrium and lanthanides belong to the same group of elements and have similar outermost electronic structures, so YTaO4 can be doped with lanthanides to change their properties. Therefore, it is of great significance to systematically study the influence of doping of lanthanide on the mechanical and thermal properties of YTaO4. Up to now, a lot of experimental researches on RETaO4 (RE = La, Nd, Gd, Dy, Yb) have been conducted. The mechanical properties of the M phase are found to be better than M’ phase, so it is necessary to stabilize the yttrium tantalate as the M phase below the phase transition temperature. It is studied that the YTaO4 would be stabilized as an M phase when doping 15–30 mol % Nb into YTaO4 materials at 1473 K [7]. It is discovered that the dopant of rare earth elements (Nd, Gd, Dy, Eu, Er, Lu, and Yb) can reduce the thermal conductivity of yttrium tantalate materials [8]. Besides, the mechanical properties and plasticity of RETaO4 (RE = Nd, La, Sm, Gd, Eu, Dy) materials are found to change regularly and become worse and worse with the decrease of atomic radius [9]. In general, yttrium tantalate materials modified by rare earth elements have many advantages, such as great mechanical properties, better thermal stability, and a larger thermal expansion coefficient [10]. Therefore, understanding the doping effects of rare earth elements and Nb on YTaO4 and its phase stability and mechanical properties are significant.
The main purpose of the present work is to systematically investigate the phase stability and mechanical properties of M-, T-, and M’-REMO4 (RE = La, Nd, Gd, Dy, Y; M = Ta, Nb) phases by the first-principles calculation method. Phase stabilities of T-, M-, and M’-RETaO4 or RENbO4 along with the various rare earth elements are studied by comparing their calculated free energies using density functional theory (DFT), and then doping effects of rare earth elements or Nb on YTaO4 are discussed. Elastic stiffness coefficient and elastic flexibility coefficient are attained by means of the strain-energy method. Bulk modulus, Young’s modulus, shear modulus, Poisson’s ratio, and hardness of T-, M-, and M’-REMO4 (RE = La, Nd, Gd, Dy, Y; M = Ta, Nb) are obtained according to the Voigt–Reuss–Hill approximation method. The B/G criterion proposed by Pugh theory is used to analyze the ductility and brittleness of REMO4 phases. Finally, the anisotropic mechanical properties of the REMO4 materials have been analyzed. It is hoped that the regularity of the YTaO4 materials doped by rare-earth elements or Nb can be determined through first-principles calculations and provide theoretical guidance for the related technological applications.

2. Methods

To theoretically investigate the effect of dopants on the relative stability and mechanical properties of REMO4 (M = Ta, Nb) phases, the first-principles calculations based on density functional theory (DFT) were carried out as implemented in the Vienna Ab-Initio Simulation Package (VASP) [11,12]. The electron-ion interactions were described through projector augmented wave (PAW) [13] and the exchange-correlation functional was constructed by the generalized gradient approximation (GGA) proposed by Perdew–Burke–Ernzerhof (PBE) [14]. The energy cut-off is 550 eV and the converge total energy is less than 1.0 meV/atom. The conjugate gradient method was chosen to relax the structure of atomic positions, cell volumes, and cell shapes. When the residual forces are less than 0.02 eV/Å, the structural relaxations cease. The tetrahedron smearing method with Blochl corrections was used to perform the final self-consistent static calculations [15], and then obtain more accurate energy. For the computation of doping effects of Nb, supercells including 96 atomic sites are used for all structures. A 2 × 1 × 2 supercell is used for the M phase, a 2 × 2 × 2 supercell is used for the M’ phase, and a 2 × 2 × 1 supercell is used for the T phase. To model the doping concentration of 25%, 50%, 75%, we choose 4, 8, and 12 Nb atoms and replace the same amount of Ta atoms in supercells, respectively. Taking YTaO4 as an example, the structures of M, M’, and T phases are listed in Figure 1.

Elastic Constants

In this work, first-principles calculations are used to calculate the mechanical properties of T-RETa(Nb)O4, M′-RETa(Nb)O4, and M-RETa(Nb)O4 phases). When a very small strain was imposed on the equilibrium crystal, it would exhibit elastic deformation. The strain and stress can be expressed as:
σ ij = 1 V 0 E V , ε / ε ij ε = 0
According to the generalized Hooke’s law, the elastic constants can be defined as the second derivative of the total energy E (V, ε) to strain,
C ijkl = σ ij ε kl = 1 V 0 2 E V , ε ε ij ε kl ε = 0
The total energy of a crystal could be expanded using the following Taylor form:
E V , ε ij = E V 0 , 0 + V 0 ij σ ij ε ij + V 0 2 ijkl C ijkl ε ij ε kl +
where E (V0, 0) is the total energy and V0 is the volume of the unstrained system. As shown in the above formula, the strain tensors subscripts (ij, kl) are explained in the Voigt notation scheme (11 = 1, 22 = 2, 33 = 3, 23 = 4, 31 = 5, and 12 = 6) [16]. Before and after the different strains, the total energy variation can be fit by using a multinomial formula. Then we can obtain a secondary coefficient. In this work, 8 distortions to the lattice cell are applied to the lattice cell, and the relaxation in all the strained unit cells was finished when the total energy was converged to less than 1.0 meV/atom.
The Young’s modulus (Y), shear modulus (G or μ), bulk modulus (B) and Poisson’s ratio (ν) of the polycrystalline crystal were acquired from independent single-crystal elastic constants. In general, the polycrystalline modulus can be approximately assessed by two methods (the Voigt method and the Reuss method) [17,18], and they are expressed as:
9 B V = C 11 + C 22 + C 33 + 2 C 12 + C 13 + C 23
1 B R = S 11 + S 22 + S 33 + 2 S 12 + S 13 + S 23
15 G V = C 11 + C 22 + C 33 C 12 + C 13 + C 23 + 3 C 44 + C 55 + C 66
15 / G R = 4 S 11 + S 22 + S 33 4 S 12 + S 13 + S 23 + 3 S 44 + S 55 + S 66
where the subscripts R and V represent the Reuss and Voigt. The elastic compliance matrices were described as {Sij}, which is obtained by the inverse matrix of the elastic constant {Cij}1. The Voigt–Reuss–Hill approximation [19], which was obtained by the average of Voigt and Reuss bounds, was considered as the best estimation of the polycrystalline elastic modulus. It was indicated as:
B H = B V + B R / 2 G H = G V + G R / 2
In addition, the Poisson’s ratio and the polycrystalline elastic modulus can be obtained using the following relationship:
Y H = 9 B H G H 3 B H + G H ν H = 3 B H 2 G H 2 3 B H + G H

3. Results

3.1. Structural Properties and Thermodynamic Properties

In the present work, structure relaxations of T, M, and M′-REMO4 (RE = Y, Dy, Gd, Nd, La; M = Ta, Nb) phases were performed. The crystal structures of M-, M’-RENbO4, and RETaO4 phases both belong to the monoclinic crystal structure, and the T phase is the tetragonal crystal. Table 1 and Table 2 list the calculated information of the crystal lattice at 0 K and the experimental data [20,21]. Our calculated results are consistently consistent with the experimental values. Both the calculations and experiments show that the small rare earth atom in RETaO4 or RENbO4 phases have small volumes. Besides, the β angle of the M phase and M’ phase also gradually decrease with the decrease of the atomic radius of RE3+.
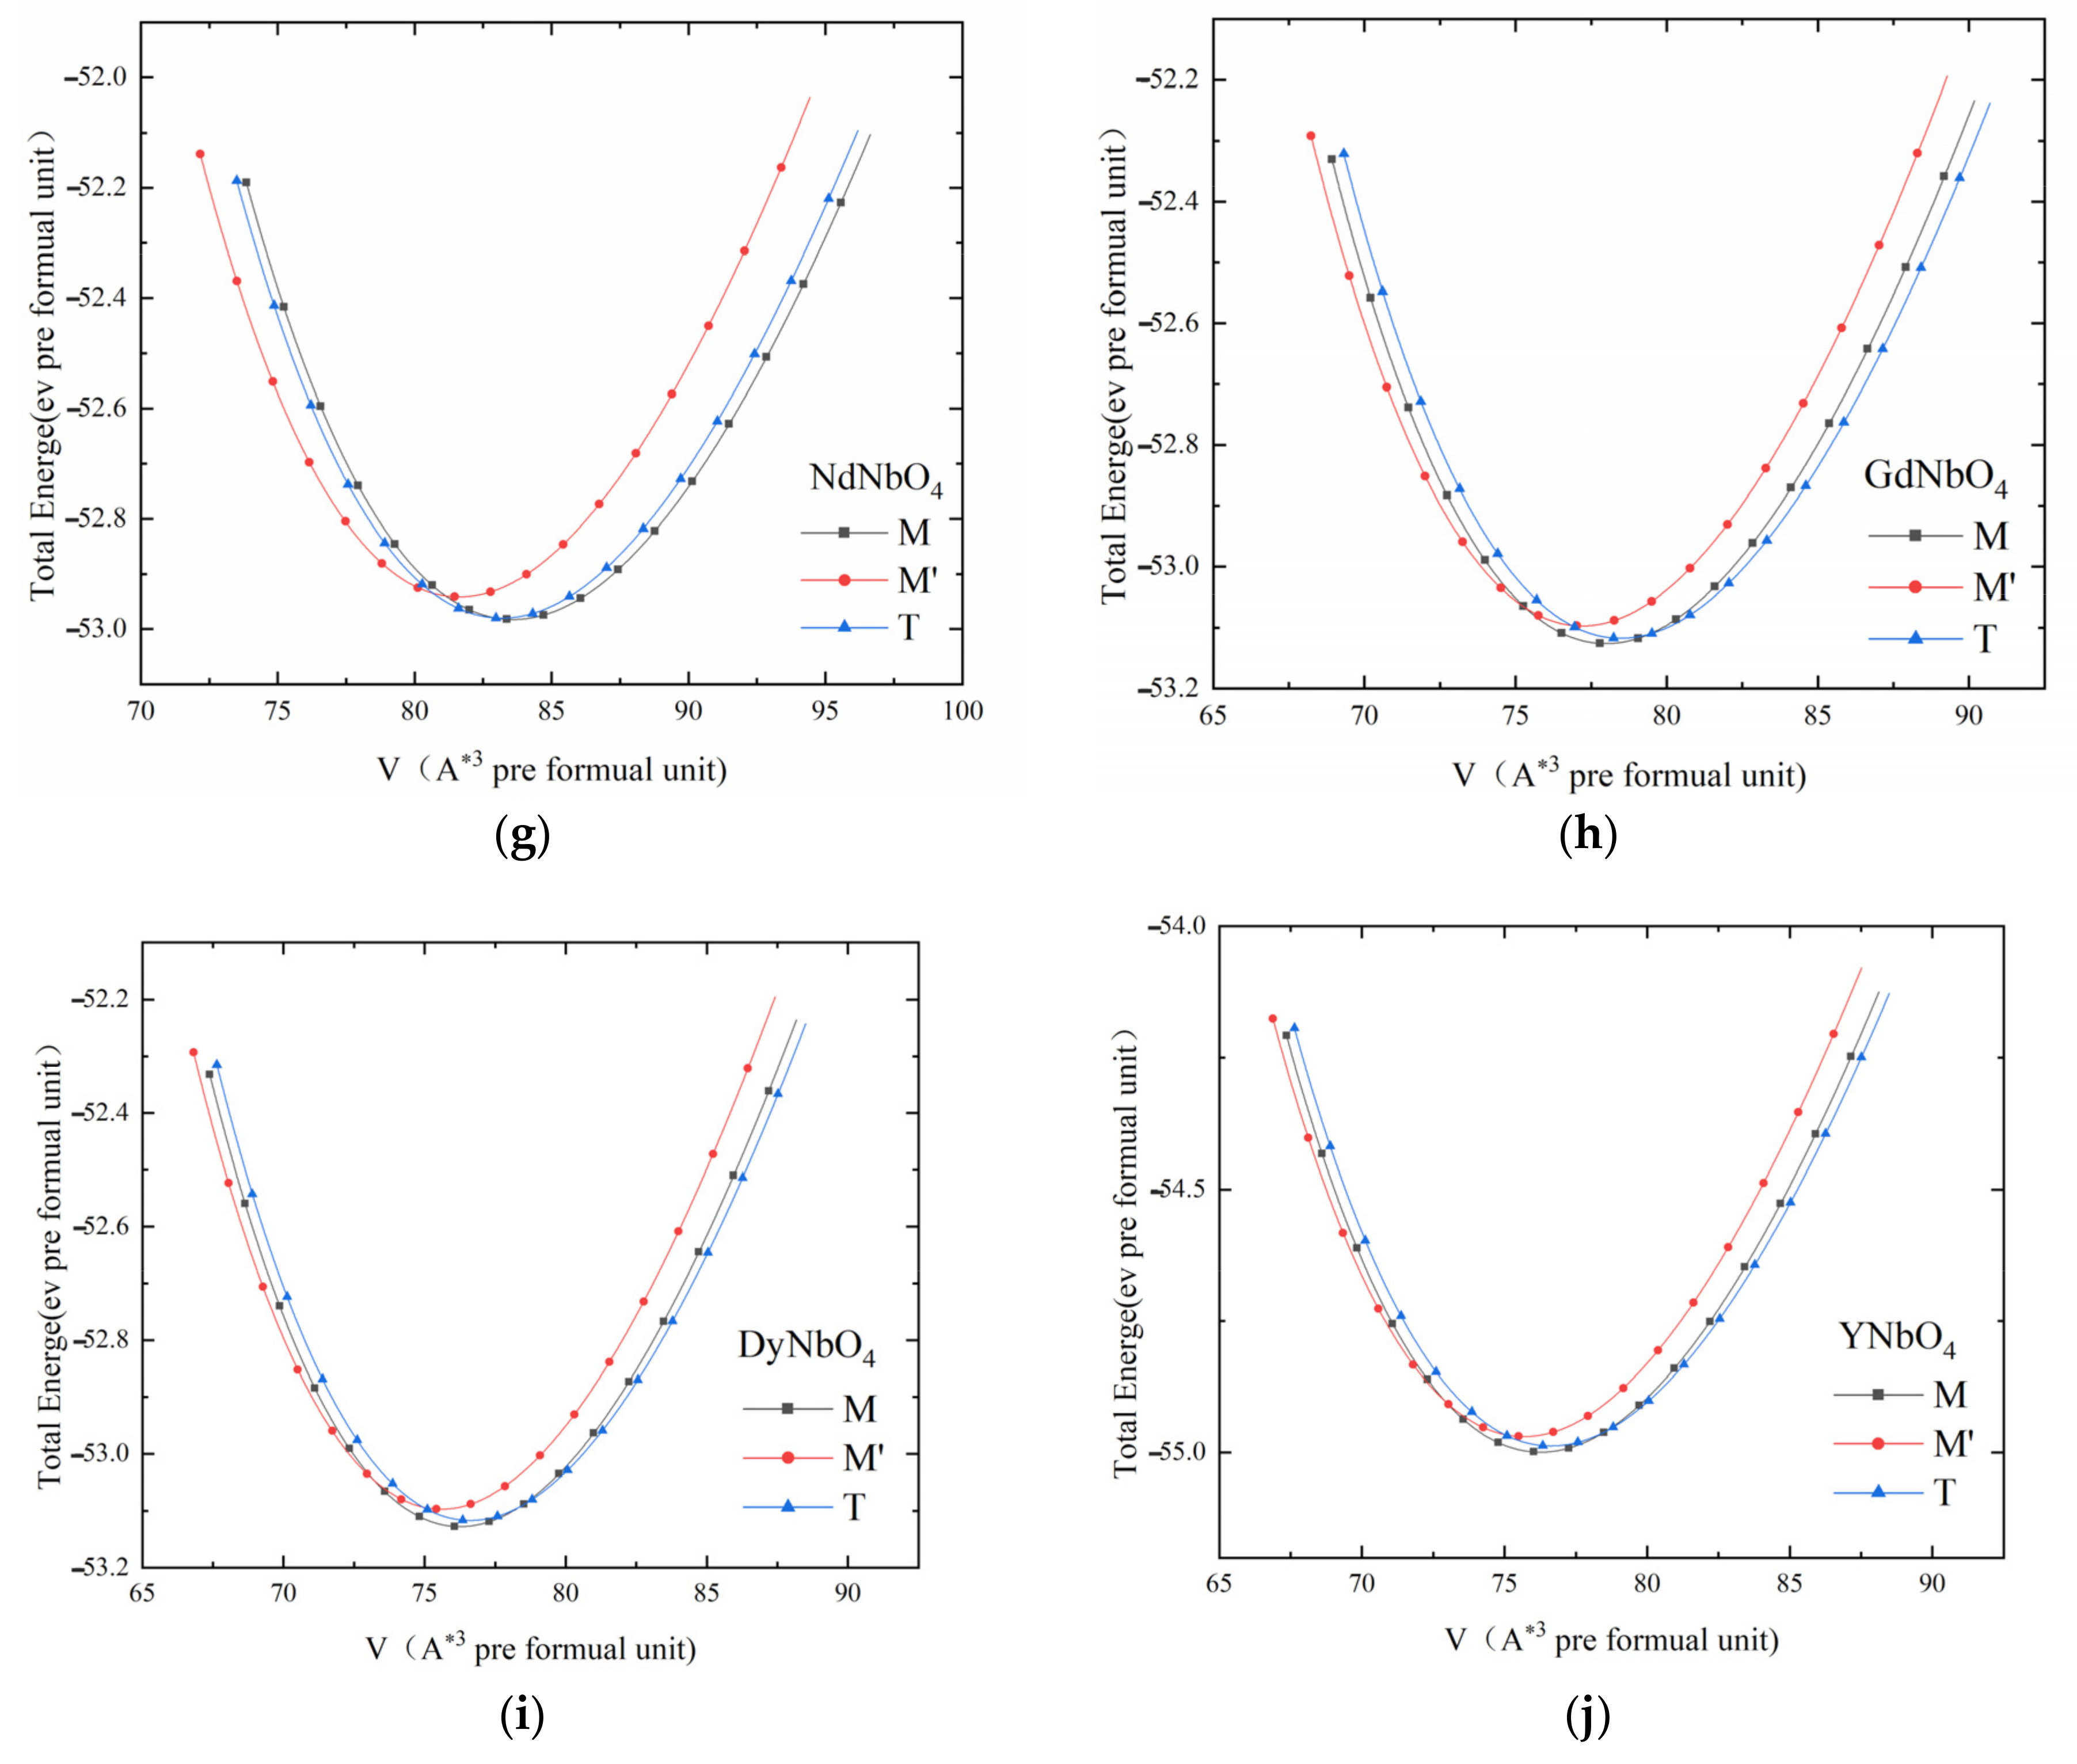
Figure 2a-j show the total energies for T, M, and M′-REMO4 (RE = Y, Dy, Gd, Nd, La; M = Ta, Nb) phases, which are changed with a function of volume at 0 K. The equation of state (EOS) is used to fit the energy-volume. As we know, there are three crystalline structures in RETaO4 materials, and they are monoclinic phase (M, space group I2/a), tetragonal phase (T, space group I41/a), and monoclinic-prime phase (M′, space group P2/a). At the high temperature, the stable phase is the T-RETaO4, and it can transform to the M phase through a displacive transformation of T→M. However, the true equilibrium phase at low temperature is the M’ phase, which only can be obtained by means of synthesizing below the temperature of T→M transformation. Therefore, the M′ phase is the low-temperature phase of the RETaO4 materials. As shown in Figure 2a–j, our calculated results show that the M phase and T phase are both less stable than the M’ phase. It implies that the M phase is metastable and the M’ phase is stable at low temperatures. This is consistent with the experimental results [22]. For RENbO4 phases, only low-temperature M and high-temperature T phases are existent in the literature. As for comparisons, the M′-RENbO4 structures are also calculated in this work. In Figure 2a–j, our calculations exhibit that the total energy of the M-RENbO4 phase is larger than that of the M′ phase, so the M phase is a true equilibrium phase at low temperature. This is consistent with the experimental results [22] that M′-RENbO4 crystalline structures do not exist in the RENbO4 phases.
Figure 3 presents the relative energies (ΔEM′→T or M→T) of M′- or M-REMO4 with respect to that of T-REMO4 for different rare-earth atoms of Y, Dy, Gd, Nd, and La. It is obvious that the relative energies are inversely proportional to the ionic radius of RE3+. The Gibbs free energy difference of M′→T or M→T phase transformation ΔGM′→T or M→T can be expressed as ΔHM′→T or M→T -ΔSM′→T or M→T*T. If the differences in the enthalpy ΔH (≈ΔE) and entropy ΔS are assumed to be substantially unchanged 4 [23] and ΔS is supposed to be similar for the different rare-earth dopants, phase transformation temperature of M′→T or M→T may increase with the decreasing ionic radius of RE3+ for Y, Dy, Gd, Nd, and La. This is consistent with the measured results using a high-temperature X-ray diffractometer by Stubičan [24]. Figure 3 presents the comparison of the experimental transformation temperature and our calculated relative energies, which indicates that the relative energies and transformation temperature decrease with the increase of the rare earth ionic radius.
As M′ and M are the stable phases at the low temperature for the RETaO4 and RENbO4 structures, respectively, adding the Nb element into the M′-RETaO4 phase should induce phase transformation of M′→M at the appropriate compositions. Based on the first-principles calculations, phase transformation of M′→M induced by the dopant of Nb is studied in this work. Figure 4 presents our calculated relative energies (ΔEM′→M) of M′-RETaxNb1−xO4 (x = 0.25, 0.5, 0.75) with respect to that of M-RETaxNb1−xO4 (x = 0.25, 0.5, 0.75) for different rare-earth atoms of Y, Dy, Gd, Nd, and La. When ΔEM′→M > 0, this means that M′ is thermodynamically stable. Conversely, when ΔEM′→M < 0, it implies that M is thermodynamically more stable than M′. In Figure 4, the M′-RETaxNb1−xO4 phase will transform into the M-RETaxNb1−xO4 phase when the composition of the dopant Nb is about 0.5. It is worth mentioning that our calculated results are related to the phase transformation at 0 K, and transformation composition may decrease at the high temperature.

3.2. Mechanical Properties

The calculated elastic constants are listed in Table 3, Table 4 and Table 5. Because the T-YTaO4 phase is tetragonal, C11, C12, C13, C33, C44, and C66 can be determined through six deformation modes [25]. As M′-YTaO4 and M-YTaO4 phases are both monoclinic, the thirteen independent elastic constants can be obtained by applying thirteen distortions [26]. The total energies are varied before and after a set of different strains (±1%, ±2%, ±3%, and ±4%), and the elastic constants were calculated by the quadratic coefficients. For stable structures, the elastic constants need to meet the mechanical stability criterion [27]. The monoclinic system criteria are C11 > 0, C22 > 0, C33 > 0, C44 > 0, C55 > 0, C66 > 0, C44C66 − 2C46 > 0, C11 + C22 + C33 + 2(C12 + C13 + C23) > 0, C22 + C33 − 2C23 > 0. The tetragonal system criteria are C11 > 0, C33 > 0, C44 > 0, C66 > 0, C11-C12 > 0, C11 + C33 − 2C13 > 0, 2C11+C33+2C12+4C13 > 0. All RETaO4 (RE = La, Nd, Gd, Dy) and RENbO4 (RE = La, Nd, Gd, Dy) materials meet the criterion of mechanical stability, and the structures are stable.
‘The polycrystalline elastic mechanical properties, such as shear modulus (G or μ), bulk modulus (B), Young’s modulus (Y), and Poisson’s ratio (ν) could be obtained through the Voigt and Reuss methods according to the calculated elastic constants. Using energy considerations, Hill [20] certificated the elastic moduli of the Voigt and Reuss methods are the upper and lower limits of polycrystalline constants. The practical elastic modulus can be estimated by the arithmetic means of these extremes. Generally, the bulk modulus is a measure of resistance to volume change by applied pressure. As seen from Figure 5 and Table 6, Table 7 and Table 8, the calculated shear modulus and bulk modulus of M-, M′-, T-RETaO4, and RENbO4 (RE = Y, Dy, Gd, Nd, La) is decreased with the increase of the rare-earth atoms, which indicate that the resistance to volume change through applied pressure is eventually lowered. Moreover, the calculated bulk modulus of rare-earth tantalate is regularly larger than and rare-earth niobates. The calculated shear modulus shows a similar trend, which means that the resistance to reversible deformations upon shear stress for RETaO4 and RENbO
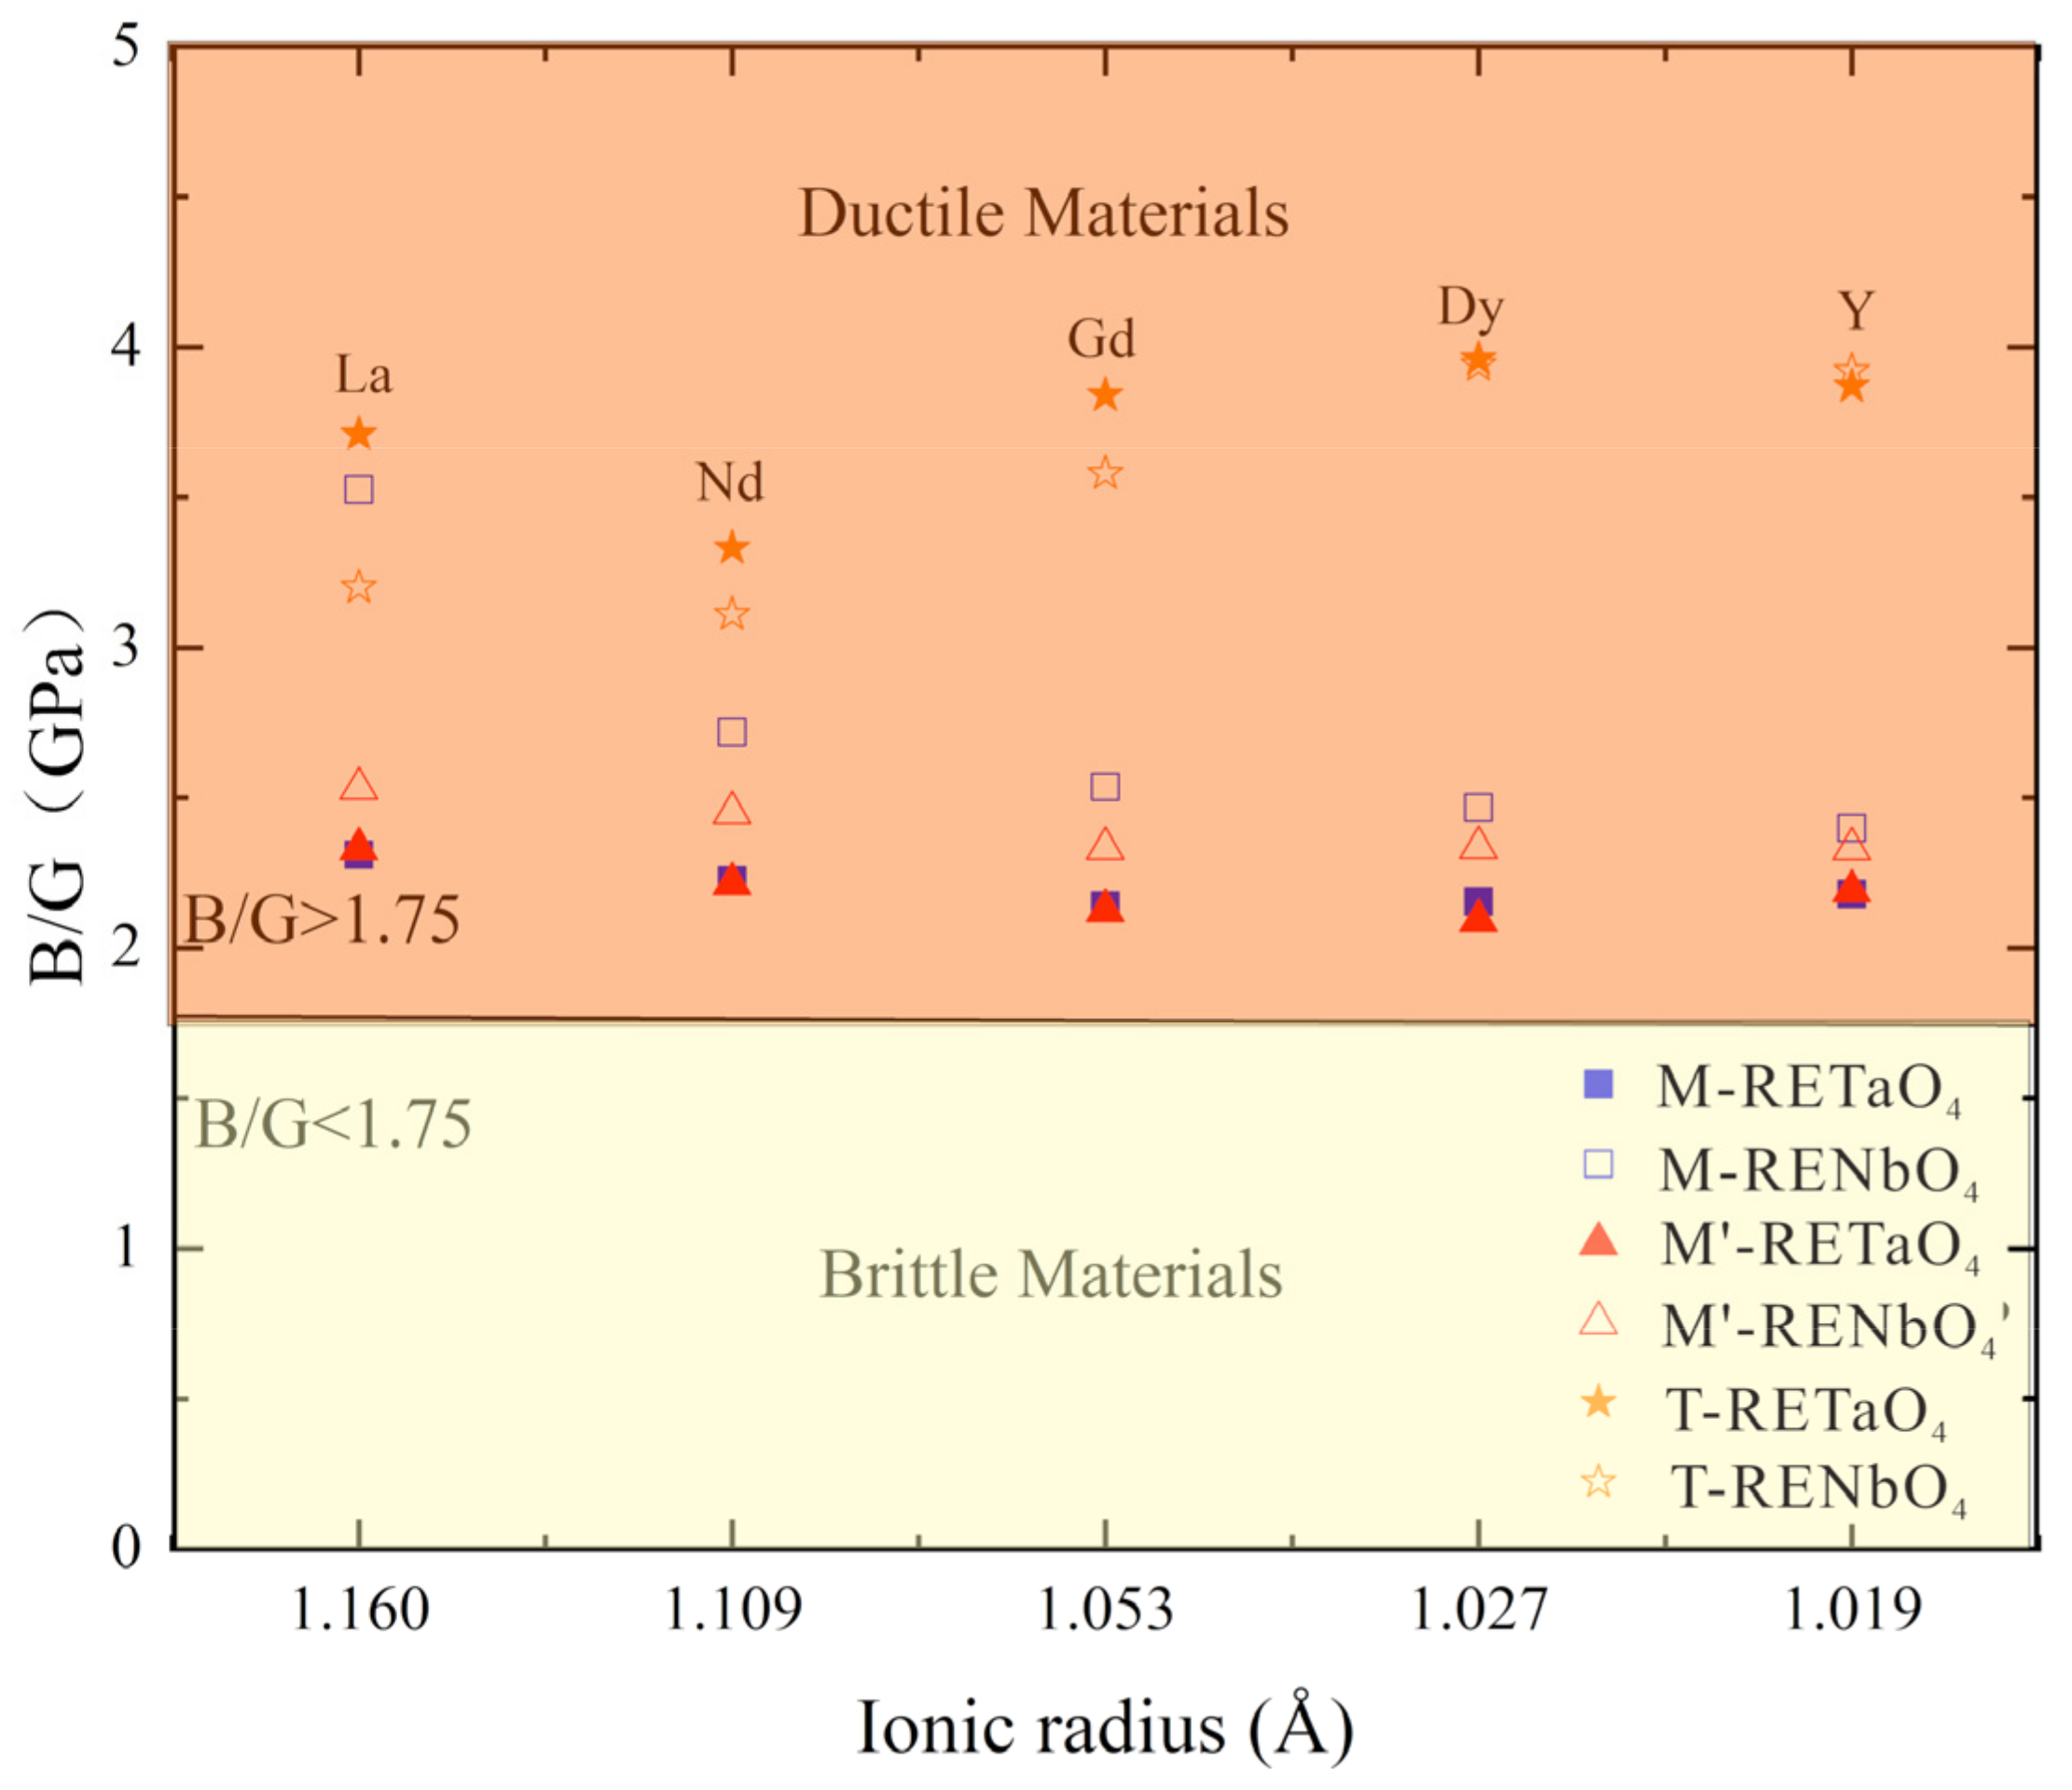
4 (RE = Y, Dy, Gd, Nd, La) is decreased with the increase of the rare-earth atoms. The ratio between bulk modulus and shear modulus, proposed by Pugh theory [28], can be used to empirically predict the brittleness and ductility of materials. A low B/G ratio is associated with brittleness, and a high value indicates its ductile nature. The empirically critical value which distinguishes ductile and brittle materials is around 1.75. In the present work, the calculated B/G of REMO4 in Figure 6 is larger than 1.75, which means that all REMO4 materials are ductile.
Young’s modulus E can be used to estimate the stiffness of materials. The calculations of M-, M′-, T-RETaO4 or RENbO4 in Figure 7 and Table 6, Table 7 and Table 8 suggest that Young’s modulus is decreased with an increase of the rare-earth atoms, which means that M-, M′-, and T-YTaO4 are the stiffest, and then followed by DyTaO4, GdTaO4, NdTaO4, and LaTaO4. Moreover, our calculated results indicate that RETaO4 is stiffer than RENbO4. Poisson’s ratio (ν) is also related to the brittleness and ductility of materials. A compound is considered brittle if the ν is <0.26 [29]. The higher value of Poisson’s ratio is, the more ductile the material is. Thus, Table 6, Table 7 and Table 8 show that all REMO4 materials are ductile. They are in good agreement with the results estimated by the B/G ratio. Besides, the value of Poisson’s ratio suggests that the ductility is inversely proportional to the rare earth atom of REMO4 materials, and RENbO4 is more ductile than RETaO4.
Hardness is a very important mechanical property in applications. Hardness is defined as the resistance of a material to deformation and may be predicted using macroscopic and microscopic models. In this work, we use the semi-empirical equations of hardness proposed by Chen et al. [30] and Tian et al. [31] were used to study the hardness of the REMO4 phases. The equations of these two models are defined as follow:
  H V = 2 ( k 2 G ) 0.585 3
H V = 0.92 k 1.137 G 0.708
where k = G/B, G and B are the shear modulus and the bulk, respectively. The obtained hardness of REMO4 phases are shown in Figure 8 and Table 6, Table 7 and Table 8 presents a comparison between the calculated and experimental results, which exhibits a good consistency. Besides, our calculations suggest that the Vickers hardness of the T phase decreases, and the single-phase gradually increase with the decrease of the atomic radius.
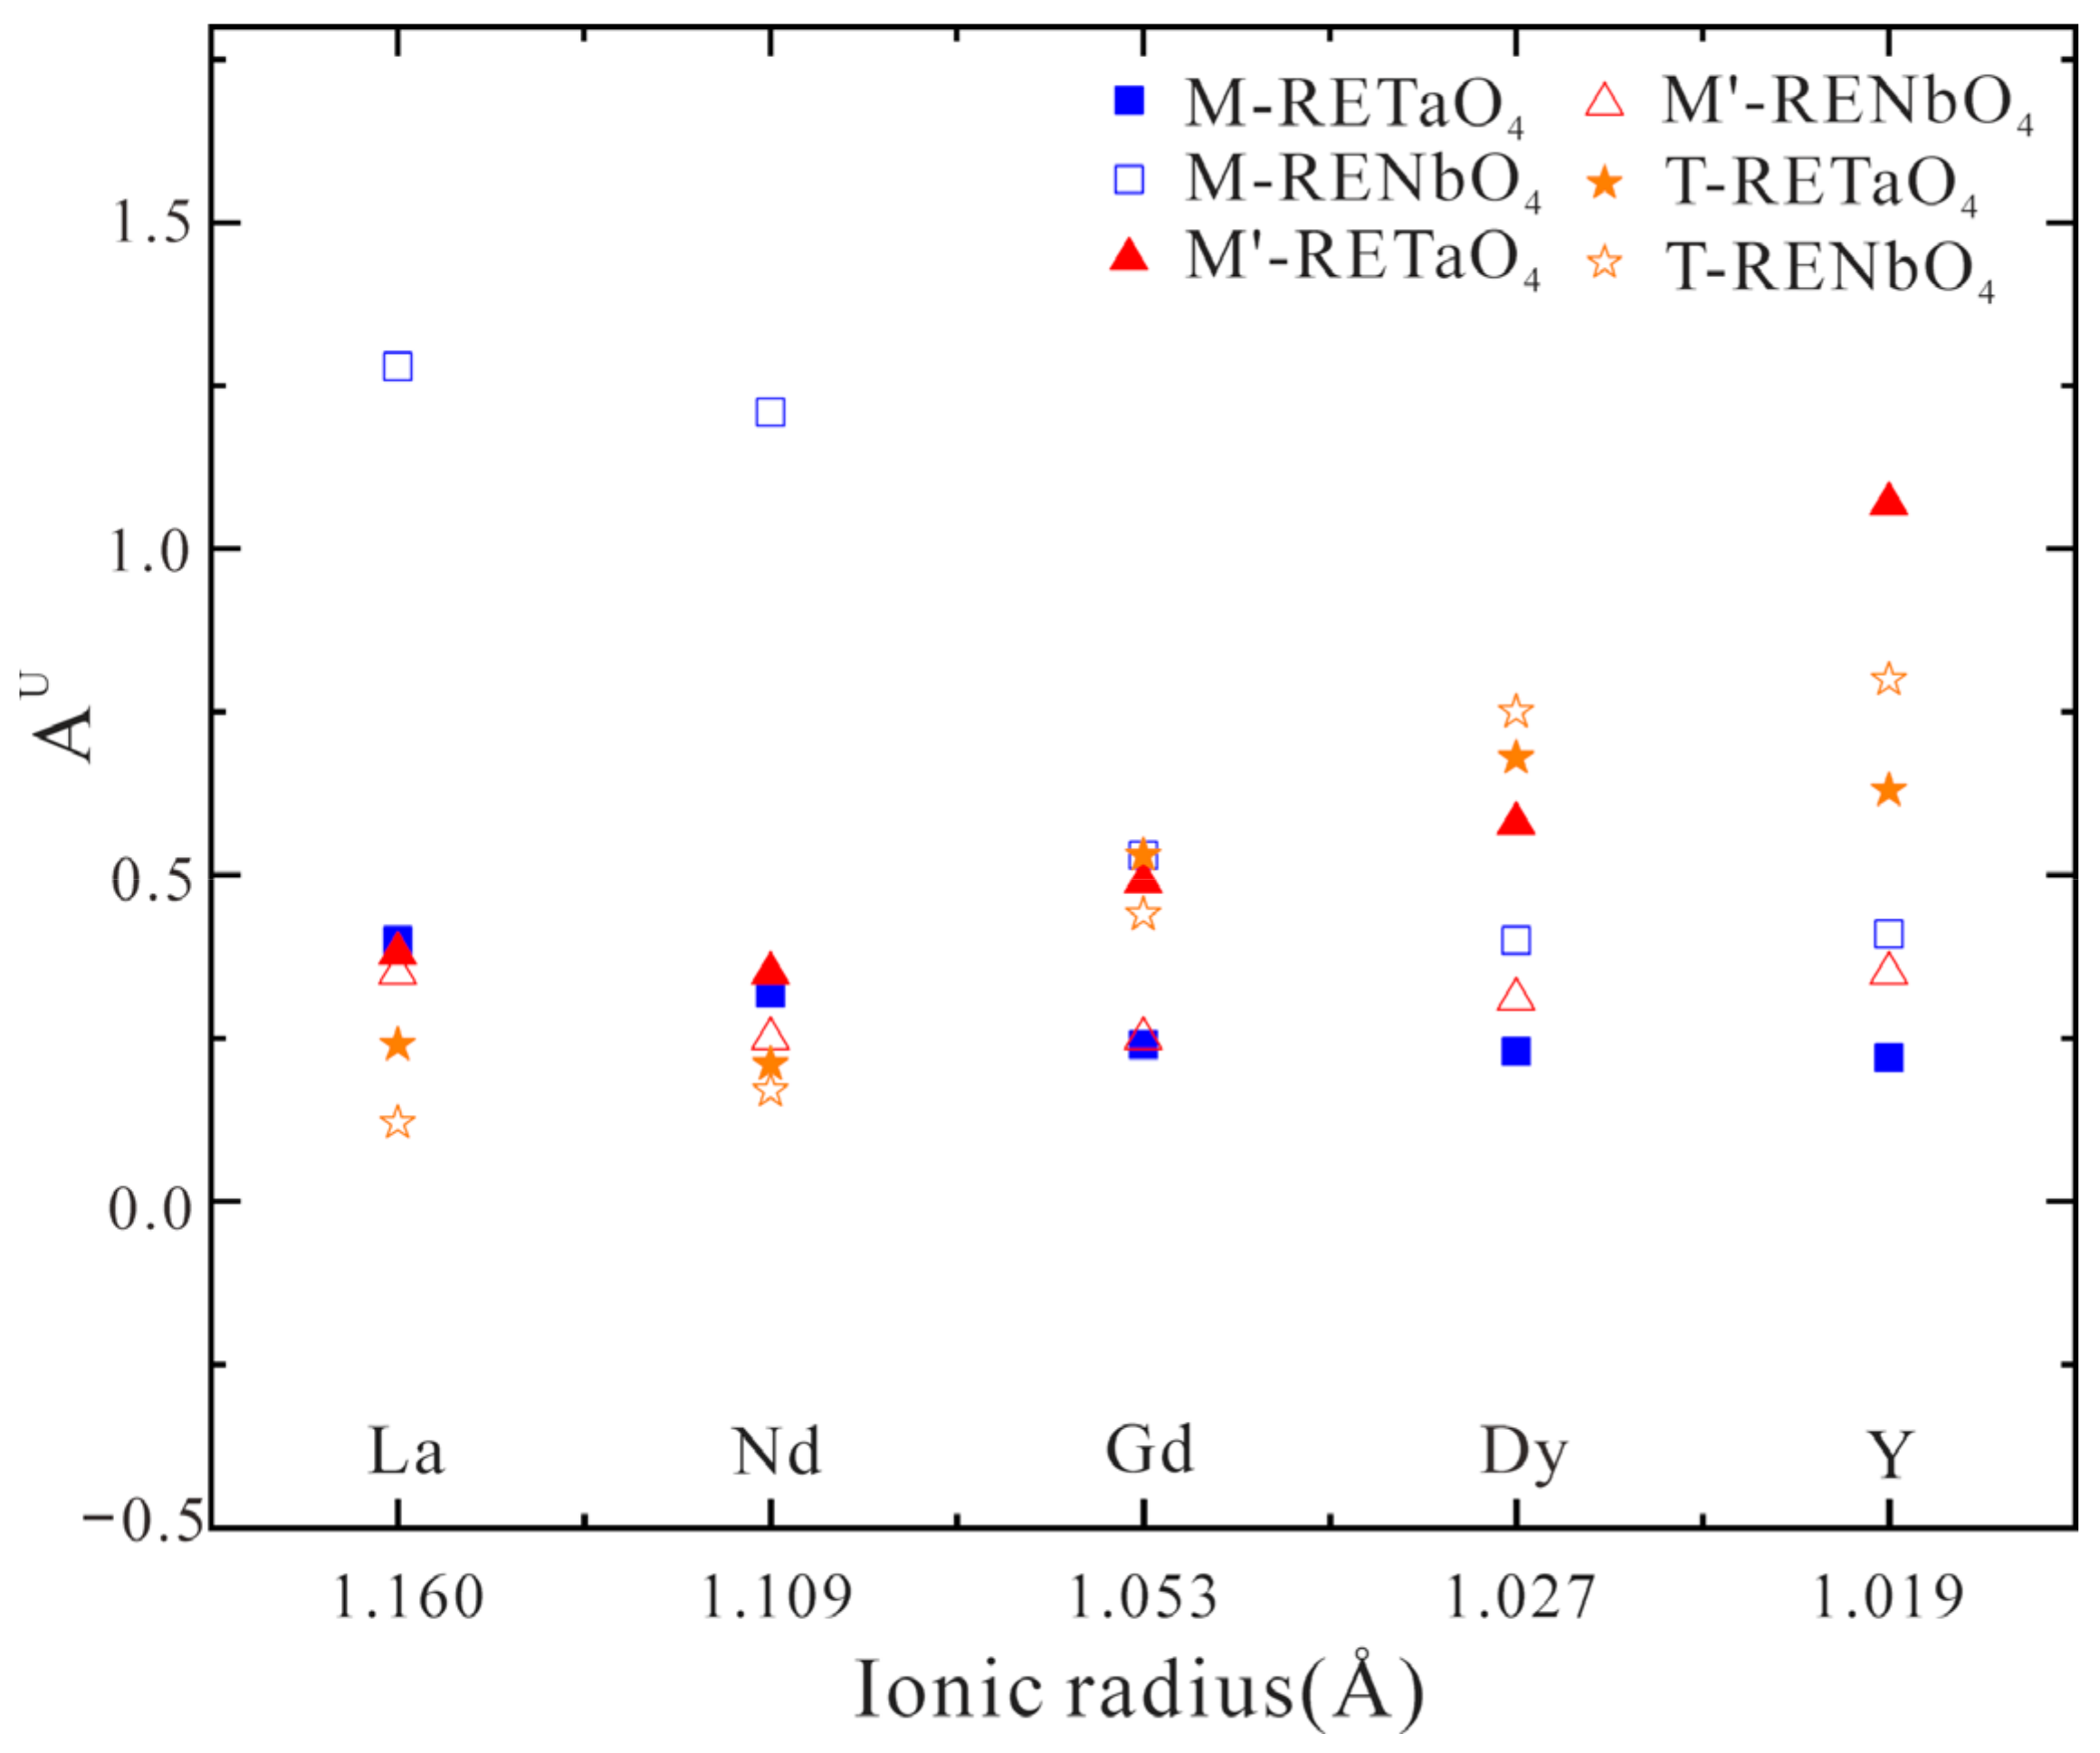
The anisotropic mechanical properties of the compounds are very important in applications. Based on the G and B values from Reuss and Voigt, Ranganathan et al. [32] proposed a universal elastic anisotropy index AU for crystal with any symmetry as shown below:
  A U = 5 G Voigt   G Reuss   + B Voigt B Reuss 6 0
AU is equal to zero when the single crystals are locally isotropic. The extent of single-crystal anisotropy can be expressed by the departure from zero indicates. The highly mechanical anisotropic properties exhibit large discrepancies from zero. The calculated elastic anisotropy is shown in Figure 9. Most values of AU are lower than 1. The larger the value of AU is, the stronger the anisotropy of the phase. The M-, M′- and T-REMO4 are anisotropic, and the elastic anisotropy of M and M′ phases is larger than the tetragonal (T) phase.

4. Conclusions

In the present work, phase stability and mechanical properties of REMO4 (RE = La, Nd, Gd, Dy, Y; M = Ta, Nb) are investigated by first-principles calculations. Some conclusions can be found. For RETaO4, the M’ phase is more stable than the M phase at low temperature, and the T phase is only stable at high temperature. For RENbO4, only the M phase is stable at low temperatures. This is consistent with the experimental results. Our calculated relative energies (ΔEM′→T or M→T) of M′- or M-REMO4 with respect to that of T-REMO4 for different rare-earth atoms are inversely proportional to the ionic radius of RE3+. This implies that the phase transformation temperature of M′→T or M→T is decreased with the increase of the rare-earth atoms, which is consistent with the experimental data. Moreover, our calculations exhibit that adding Nb into M′-RETaO4 can induce phase transformation of M′→M, and the doping concentration is about 50%. Besides, the elastic coefficient is attained by means of the strain-energy method. Bulk modulus, Young’s modulus, shear modulus, and Poisson’s ratio of T-, M-, and M’ phases are obtained according to Voigt-Reuss-Hill approximation, and anisotropic mechanical properties of the REMO4 materials have been calculated. Finally, our calculated B/G exhibits that T-, M-, and M’ phases are all ductile, and the hardness of REMO4 phases are predicted based on semi-empirical equations, which is consistent with the experimental data.

Author Contributions

Investigation, writing—original draft preparation, W.X.; data curation, Y.Y.; funding acquisition, Z.P.; writing—review and editing, funding acquisition, F.Z. All authors have read and agreed to the published version of the manuscript.

Funding

This research was funded by the National Natural Science Foundation of China (No. 51801170 and 11802257), National Postdoctoral Program for Innovative Talents (No. BX20180265), Natural Science Foundation of Hunan Province (No. 2019JJ50570), China Postdoctoral Science Foundation (No. 2019M652786), Research initiation project of Xiangtan University (No. 18QDZ24) and Research foundation of education bureau of Hunan province, No. 21B0163.

Institutional Review Board Statement

Not applicable.

Informed Consent Statement

Not applicable.

Data Availability Statement

Not applicable.

Conflicts of Interest

The authors declare no conflict of interest.

References

  1. Voloshyna, O.; Neicheva, S.V.; Starzhinskiy, N.G.; Zenya, I.M.; Gridin, S.S.; Baumer, V.N.; Sidletskiy, O.T. Luminescent and scintillation properties of orthotantalates with common formulae RETaO4 (RE = Y, Sc, La, Lu and Gd). Meter. Sci. Eng. B 2013, 178, 1491–1496. [Google Scholar] [CrossRef]
  2. Shian, S.; Sarin, P.; Gurak, M.; Baram, M.; Kriven, W.M.; Clarke, D.R. The tetragonal-monoclinic, ferroelastic transformation in yttrium tantalate and effect of zirconia alloying. Acta Mater. 2014, 69, 196–202. [Google Scholar] [CrossRef]
  3. Feng, J.; Shian, S.; Xiao, B.; Clarke, D.R. First-principles calculations of the high-temperature phase transformation in yttrium tantalate. Phys. Rev. B 2014, 90, 094102. [Google Scholar] [CrossRef]
  4. Flamant, Q.; Gurak, M.; Clarke, D.R. The effect of zirconia substitution on the high-temperature transformation of the monoclinic-prime phase in yttrium tantalate. J. Eur. Cera. Soc. 2018, 38, 3925–3931. [Google Scholar] [CrossRef]
  5. Virkar, A.V. Role of Ferroelasticity in toughening of zirconia ceramics. Key Eng. Mater. 1998, 153–154, 183–210. [Google Scholar] [CrossRef]
  6. Zhang, F.; Zhang, G.J.; Yang, L.; Zhou, Y.C.; Du, Y. Thermodynamic modeling of YO1.5-TaO2.5 system and the effects of elastic strain energy and diffusion on phase transformation of YTaO4. J. Eur. Ceram. Soc. 2019, 39, 5036–5047. [Google Scholar] [CrossRef]
  7. Brixner, L.H.; Chen, H.Y. On the structural and luminescent properties of the M′-LnTaO4 rare-earth tantalates. J. Electrochem. Soc. 1983, 130, 2435–2443. [Google Scholar] [CrossRef]
  8. Wang, J.; Yu, X.; Zhou, C.R.; Feng, J. Microstructure and thermal properties of RETaO4 (RE = Nd, Eu, Gd, Dy, Er, Yb, Lu) as promising thermal barrier coating materials. Scr. Mater. 2017, 126, 24–28. [Google Scholar] [CrossRef]
  9. Chen, L.; Wang, J.; Feng, J. Research progress of rare earth tantalate ceramics as thermal barrier coatings. Sci. China Mater. 2017, 36, 938–949. [Google Scholar]
  10. Zhu, J.T.; Lou, Z.H.; Zhang, P.; Zhao, J.; Meng, X.Y.; Xu, J.; Gao, F. Preparation and thermal properties of rare earth tantalates (RETaO4) high-entropy ceramics. J. Inorg. Mater. 2021, 36, 411–417. [Google Scholar] [CrossRef]
  11. Kresse, G.; Furthmüller, J. Efficient iterative schemes for ab initio total-energy calculations using a plane-wave basis set. Phys. Rev. B 1996, 54, 11169–11186. [Google Scholar] [CrossRef] [PubMed]
  12. Kresse, G.; Furthmüller, J. Efficiency of ab initio total energy calculations for metals and semiconductors using a planewave basis set. Comp. Mater. Sci. 1996, 6, 15–50. [Google Scholar] [CrossRef]
  13. Blöchl, P.E. Projector augmented-wave method. Phys. Rev. B 1994, 50, 17953–17979. [Google Scholar] [CrossRef] [PubMed] [Green Version]
  14. Perdew, J.P.; Burke, K.; Ernzerhof, M. Generalized gradient approximation made simple. Phys. Rev. Lett. 1996, 77, 3865–3868. [Google Scholar] [CrossRef] [Green Version]
  15. Blöchl, P.E.; Jepsen, O.; Andersen, O.K. Mproved tetrahedron method for brillouin-zone integrations. Phys. Rev. B 1994, 49, 16223–16233. [Google Scholar] [CrossRef] [PubMed]
  16. Landau, L.D.; Lifshitz, E.M. Theory of Elasticity Butterworth; Heinemann: Oxford, UK, 1999. [Google Scholar]
  17. Voigt, W. Lehrburch der Kristallphysik; Teubner: Leipzig, Germany, 1928. [Google Scholar]
  18. Reuss, A. Calculation of flow limits of mixed crystals on the basis of plasticity of single crystals. Z. Angew. Math. Mech. 1929, 9, 49–58. [Google Scholar] [CrossRef]
  19. Hill, R. The elastic behaviour of a crystalline aggregate. Proc. Phys. Soc. Sect. A 1952, 65, 349–354. [Google Scholar] [CrossRef]
  20. Sych, A.B.; Golub, M. Niobates and tantalates of tervalent elements. Russ. Chem. Rev. 1977, 46, 210. [Google Scholar] [CrossRef]
  21. Hartenbach, I.; Lissner, F.; Nikelski, T.; Meier, S.F.; Müller-Bunz, H.; Schleid, T. Über oxotantalate der lanthanide des formeltyps MTaO4 (M = La–Nd, Sm–Lu). Z. Anorg. Allg. Chem. 2005, 631, 2377–2382. [Google Scholar] [CrossRef]
  22. Mather, S.A.; Davies, P.K. Nonequilirbium phase formation in oxides prepared at low temperature: Fergusonite-related phases. J. Am. Ceram. Soc. 1995, 78, 2737–2745. [Google Scholar] [CrossRef]
  23. Zhang, F.; Wang, J.C.; Liu, S.H.; Du, Y. Effects of the volume changes and elastic-strain energies on the phase transition in the Li-Sn battery. J. Power Sources 2016, 330, 111–119. [Google Scholar] [CrossRef]
  24. Stubičan, V.S. High-temperature transitions in rare-earth niobates and tantalates. J. Am. Ceram. Soc. 1964, 47, 55–58. [Google Scholar] [CrossRef]
  25. Watt, J.P.; Peselnick, L. Clarification of the hashine shtrikman bounds on the effective elastic moduli of polycrystals with hexagonal, trigonal, and tetragonal symmetries. J. Appl. Phys. 1980, 51, 1525–1531. [Google Scholar] [CrossRef]
  26. Söderlind, P.; Klepeis, J.E. First-principles elastic properties of α-Pu. Phys. Rev. B 2009, 79, 104110. [Google Scholar] [CrossRef]
  27. Born, M. On the stability of crystals. Proc. Camb. Philos. Soc. 1940, 36, 160. [Google Scholar] [CrossRef]
  28. Pugh, S.F. XCII. Relations between the elastic moduli and the plastic properties of polycrystalline pure metals. Lond. Edinb. Dublin Philos. Mag. J. Sci. 1954, 45, 823–843. [Google Scholar] [CrossRef]
  29. Wei, N.; Zhang, X.L.; Zhang, C.G.; Hou, S.J.; Zeng, Z. First-principles investigations on the elastic and thermodynamic properties of cubic ZrO2 under high pressure. Int. J. Mod. Phy. C 2015, 26, 1550056. [Google Scholar] [CrossRef]
  30. Chen, X.Q.; Niu, H.; Li, D.; Li, Y. Modeling hardness of polycrystalline materials and bulk metallic glasses. Intermetallics 2011, 19, 1275–1281. [Google Scholar] [CrossRef] [Green Version]
  31. Tian, Y.; Xu, B.; Zhao, Z. Microscopic theory of hardness and design of novel superhard crystals. J. Meta. Hard Mater. 2012, 33, 93–106. [Google Scholar] [CrossRef]
  32. Ranganathan, S.I.; Ostoja-Starzewski, M. Universal Elastic Anisotropy Index. M. Phys. Rev. Lett. 2008, 101, 055504. [Google Scholar] [CrossRef] [PubMed] [Green Version]
Figure 1. The crystal structures of M, M’, and T phases are listed: The atom of the dark green color is Y; the yellow color is Ta, and the red color is O. (a) M’; (b) M; (c) T.
Coatings 12 00073 g001
Figure 2. (aj). Calculated total energies as a function of volume of T- and M-RENbO4 phases and M′-RENbO4 phase: (a) LaTaO4; (b) NdTaO4; (c) GdTaO4; (d) DyTaO4; (e) YTaO4; (f) LaNbO4; (g) NdNbO4; (h) GdNbO4; (i) DyNbO4; (j) YNbO4.
Coatings 12 00073 g002aCoatings 12 00073 g002b
Figure 3. Comparison of the experimental transformation temperature and our calculated relative energies for different rare-earth atoms of Y, Dy, Gd, and Nd.
Coatings 12 00073 g003
Figure 4. Calculated relative energies (ΔEM′→M) of M′-RETaxNb1−xO4 (x = 0.25, 0.5, 0.75) with respect to that of M-RETaxNb1−xO4 (x = 0.25, 0.5, 0.75) for different rare earth atoms of Y, Dy, Gd, Nd.
Coatings 12 00073 g004
Figure 5. Calculated bulk modulus and shear modulus of M-, M′-, T-RETaO4, and RENbO4 along with the ionic radius of RE3+: (a) bulk modulus; (b) shear modulus.
Coatings 12 00073 g005
Figure 6. Calculated B/G of REMO4(M = Ta, Nb) along with the ionic radius of RE3+.
Coatings 12 00073 g006
Figure 7. Calculated Young’s modulus of M-, M′-, T-REMO4 (M = Ta, Nb) along with the ionic radius of RE3+.
Coatings 12 00073 g007
Figure 8. The calculated hardness of REMO4 phases (M = Ta, Nb) along with the ionic radius of RE3+.
Coatings 12 00073 g008
Figure 9. Calculated elastic anisotropy of REMO4 phases (M = Ta, Nb) along with the ionic radius of RE3+.
Coatings 12 00073 g009
Table 1. Calculated lattice parameters (Å) of M-, M′-, and T-RETaO4 phases along with the experimental data.
PhaseAbbr.GroupabcβRemark
YTaO4TI41/a5.235.2311.06 cal
M′P2/a5.155.535.3496.40°cal
5.265.435.0896.08°exp [20]
MI2/a5.36211.0715.09395.58°cal
5.2410.895.0695.31°exp [21]
DyTaO4TI41/a5.245.2411.06 cal
M′P2/a5.345.525.1596.58°cal
P2/a5.325.485.1496.52°exp [20]
MI2/a5.3611.075.1095.51°cal
I2/a5.3510.975.0695.6°exp [21]
GdTaO4TI41/a5.275.2711.17 cal
M′P2/a5.385.555.1996.75°cal
P2/a5.365.525.1796.66°exp [20]
MI2/a5.4111.155.1195.53°cal
I2/a5.4111.075.0895.6°exp [21]
NdTaO4TI41/a5.375.3711.48 cal
M′P2/a5.475.665.2896.83°cal
P2/a5.435.605.2496.77°exp [20]
MI2/a5.5511.405.1795.47°cal
I2/a5.5111.235.1195.7°exp [21]
LaTaO4TI41/a5.445.4411.69 cal
M′P2/a5.525.775.3496.75°cal
MI2/a5.6511.575.1995.63°cal
nMP21/c7.775.597.86101.13°cal
P21/c7.765.587.81101.53°exp [20]
Table 2. Calculated lattice parameters (Å) of M-, M′-, and T-RENbO4 phases along with the experimental data.
PhaseAbbr.GroupabcβRemark
YNbO4TI41/a5.255.2511.08 cal
M′P2/a5.115.455.2996.44°cal
MI2/a5.3110.975.0794.42°cal
I2/a5.2910.945.0794.32°exp [21]
DyNbO4TI41/a5.255.2511.11 cal
M′P2/a5.155.495.3795.77°cal
MI2/a5.3411.115.1593.89°cal
I2/a5.3211.005.0794.34°exp [21]
GdNbO4TI41/a5.295.2911.22 cal
M′P2/a5.185.535.4195.85°cal
MI2/a5.3811.215.1893.74°cal
I2/a5.3711.095.1194.37°exp [21]
NdNbO4TI41/a5.385.3811.53 cal
M′P2/a5.275.665.5095.98°cal
MI2/a5.4711.515.2992.42°cal
I2/a5.4711.285.1494.32°exp [21]
LaNbO4TI41/a5.455.4511.74 cal
M′P2/a5.335.765.5595.86°cal
MI2/a5.5711.535.2094.40°exp [21]
Table 3. Elastic constants Cij for the M phases of RETaO4 and RENbO4. All quantities are in GPa.
M-RETaO4C11C22C33C44C55C66C12C13C23C16C26C36C45
La217.07168.49230.9843.2855.8656.2661.27106.5090.2125.286.27−13.88−1.14
Nd229.36193.08255.5350.6362.0267.2163.53116.6498.3821.921.88−19.63−2.09
Gd249.50212.45270.4758.1261.5783.4570.90131.8795.8413.11−2.83−20.28−4.73
Dy255.11220.50275.9857.9160.1088.9174.01136.9494.8210.69−4.04−19.74−4.96
Y257.02221.67273.3756.7257.5687.7774.78135.8793.118.91−4.74−19.08−5.23
M-RENbO4C11C22C33C44C55C66C12C13C23C16C26C36C45
La171.39154.27195.0330.2534.8233.6563.13100.7275.3934.694.56−23.703.09
Nd157.05169.74224.9029.3743.4347.4849.18117.2784.9645.258.44−23.518.18
Gd195.53194.15245.4242.1149.7569.4264.69134.6183.7429.950.79−22.302.39
Dy205.94201.75249.3245.8549.6275.9668.74140.4881.4825.77−1.20−21.930.68
Y202.58192.94248.0244.9947.8075.0165.47135.6976.7425.19−1.17−20.130.41
Table 4. Elastic constants Cij for the M’ phases of RETaO4 and RENbO4. All quantities are in GPa.
M’-RETaO4C11C22C33C44C55C66C12C13C23C16C26C36C45
La238.64162.73253.6552.0160.3159.3486.70113.5187.6616.34−13.079.78−10.43
Nd266.93178.92271.7862.9362.6766.1491.90118.9590.7815.35−14.168.47−9.67
Gd288.41176.27296.0666.7059.6671.3388.50119.3990.7314.69−15.7811.01−7.09
Dy296.31173.88304.0167.0456.0671.9784.00118.5389.1314.15−17.7211.54−6.91
Y290.40141.65298.9164.0153.0871.2274.32113.4675.8911.68−20.5910.52−8.10
M’-RENbO4C11C22C33C44C55C66C12C13C23C16C26C36C45
La235.54155.44220.4546.3753.1547.8984.43111.0384.4516.31−6.62−7.09−10.34
Nd258.48181.92240.5653.6857.2350.1091.42113.4888.8017.39−7.71−7.47−9.32
Gd280.10189.47259.8357.0357.1053.7288.91110.4492.5418.43−2.49−3.91−4.55
Dy292.68188.65271.2357.8255.6355.0588.54112.0896.5218.88−0.28−1.63−2.45
Y288.33181.77271.4356.0553.5854.0584.43110.1794.5117.74−1.31−1.75−2.21
Table 5. Elastic constants Cij for the T phases of RETaO4 and RENbO4. All quantities are in GPa.
T-RETaO4C12C11C33C44C66C13C16
La124.89163.70151.9329.6627.5271.67113.03
Nd122.49194.92172.3131.2228.6873.87147.44
Gd121.73228.82192.0529.0013.4174.4993.62
Dy120.51241.46201.2927.9311.5674.64148.69
Y118.20237.39198.3726.2512.8771.6169.08
T-RENbO4C12C11C33C44C66C13C16
La112.79 169.36151.35 31.98 34.65 72.74 128.76
Nd114.62 196.62 170.36 34.74 29.99 75.69 138.65
Gd115.24 226.54 190.83 33.89 14.65 77.27 159.76
Dy116.10 239.29 198.93 33.28 9.67 78.08 164.16
Y111.40 233.13 197.32 31.69 9.17 75.04 146.88
Table 6. Bulk modulus (GPa), shear modulus (GPa), B/G, Young modulus (GPa), Poisson ratio, and Vickers-hardness (Kg·N) for T-REMO4 (M = Ta,Nb) phases.
T-RETaO4BGB/GEνHvRemake
La111.3329.973.7182.500.38278.11cal
Nd120.9736.283.3398.950.36319.77cal
Gd130.5533.953.8493.740.38270.37cal
Dy134.2133.873.9693.710.38261.17cal
Y131.1433.863.8793.520.38268.04cal
128.952.72.45139.10.32-exp [3]
T-RENbO4BGB/GEνHvRemark
La110.5734.523.2093.800.36333.25cal
Nd120.3838.683.11104.820.35347.78cal
Gd130.0436.343.5899.720.37295.08cal
Dy134.2434.043.9496.690.38262.75cal
Y130.4133.263.9291.970.38263.96cal
Table 7. Bulk modulus (GPa), shear modulus (GPa), B/G, Young modulus (GPa), Poisson ratio, and Vickers-hardness (Kg·N) for M’-REMO4 (M = Ta,Nb) phases.
M’-RETaO4BGB/GEνHvRemark
La132.7356.962.33149.480.31481.9cal
Nd142.6664.432.21168.010.30515.73cal
Gd144.9768.232.12176.930.30542.89cal
Dy144.0068.592.10177.040.30550.51cal
Y128.6765.202.19167.340.28588.38cal
132.766.12.01170.20.29-exp [3]
M’-RENbO4BGB/GEνHv
La126.5850.022.53132.600.33434.37cal
Nd138.3256.442.45149.050.32454.79cal
Gd143.0361.342.33161.000.31484.34cal
Dy145.9862.522.33164.140.31484.391cal
Y142.5961.292.33160.750.31485.32cal
Table 8. Bulk modulus (GPa), shear modulus (GPa), B/G, Young modulus (GPa), Poisson ratio, and Vickers-hardness (Kg·N) for M-REMO4 (M = Ta,Nb) phases.
M-RETaO4BGB/GEνHvRemark
La122.0852.802.31138.450.32483.34cal
Nd134.0060.472.22157.690.31512.68cal
-----641exp [8]
Gd145.0367.752.14175.870.31537.98cal
-----610exp [8]
Dy148.8869.152.15179.610.31535.20cal
-----534exp [8]
Y148.6868.322.18177.740.30528.35cal
183.763.22.91170.10.34378exp [3]
M-RENbO4BGB/GEνHvRemark
La106.0030.053.5382.380.37286.18cal
Nd107.8539.702.72106.080.331393.53cal
Gd129.3650.992.54135.210.33433.19cal
Dy134.5354.512.47144.080.32449.5cal
Y129.9554.122.4142.570.32463.94cal
Publisher’s Note: MDPI stays neutral with regard to jurisdictional claims in published maps and institutional affiliations.

