Article

Silicate and Hydroxide Concentration Influencing the Properties of Composite Al2O3-TiO2 PEO Coatings on AA7075 Alloy

by
Mehri Hashemzadeh
1,2,*,
Keyvan Raeissi
1,*,
Fakhreddin Ashrafizadeh
1,
Amin Hakimizad
3,
Monica Santamaria
4 and
Thomas Lampke
2
1
Department of Materials Engineering, Isfahan University of Technology, Isfahan 84156-83111, Iran
2
Materials and Surface Engineering Group, Institute of Materials Science and Engineering, Department of Mechanical Engineering, Chemnitz University of Technology, 09107 Chemnitz, Germany
3
Yekta Mobaddel Pars Co., Science and Technology Campus, Yazd University, Yazd 89158-18411, Iran
4
Dipartimento di Ingegneria, Università di Palermo, Viale Delle Scienze, Ed. 6, 90128 Palermo, Italy
*
Authors to whom correspondence should be addressed.
Coatings 2022, 12(1), 33; https://doi.org/10.3390/coatings12010033
Submission received: 29 October 2021 / Revised: 19 December 2021 / Accepted: 24 December 2021 / Published: 28 December 2021

Abstract

:
This work evaluates the effect of sodium meta-silicate pentahydrate (SMS) and potassium hydroxide concentrations on properties of Al2O3-TiO2 coatings produced through plasma electrolytic oxidation in a solution containing 3 g L−1 potassium titanyl oxalate, (PTO), using a unipolar waveform with constant current density. The surface and cross-section characteristics of PEO coatings including morphology, elemental distribution, and phase composition were evaluated using FESEM, EDS, and XRD techniques. Voltage-time response indicated the concentration of SMS and KOH had a significant effect on the duration of each stage of the PEO process. More cracks and pores were formed at the higher concentrated solutions that resulted in the incorporation of solution components especially Si into the coating inner parts. Ti is distributed throughout the coatings, but it had a dominant distribution in the Si-rich areas. The coating prepared in the electrolyte containing no silicate consisted of non-stoichiometric γ-Al2O3 and/or amorphous Al2O3 phase. Adding silicate into the coating electrolyte resulted in the appearance of α-Al2O3 besides the dominant phase of γ-Al2O3. The corrosion behaviour of the coatings was investigated using the EIS technique. It was found that the coating prepared in the presence of 3 g L−1 SMS and 2 g L−1 KOH, possessed the highest barrier resistance (~10 MΩ cm2), owing to a more compact outer layer, thicker inner layer along with appropriate dielectric property because this layer lacks the Si element. It was discovered that the incorporation of Ti4+ and especially Si4+ in the coating makes the dielectric loss in the coating.

1. Introduction

The aerospace and automotive industries have extensive potential to use aluminium and its alloys owing to their high strength to weight ratio, good shape-ability, and non-magnetic characteristics. However, the weak corrosion resistance, particularly intergranular and pitting corrosion resulting from intermetallic compounds in the Al alloy matrix has largely confined the broad use of aluminium alloys [1,2]. Therefore, ceramic coatings have been employed to enhance their corrosion behaviour. Plasma electrolytic oxidation (PEO) as a cost-effective and environmentally friendly process is a powerful technique to apply a ceramic coating on light metals, particularly Al and its alloys, and improve their hardness, wear and corrosion resistance significantly [3,4]. Exertion of a high voltage during PEO creates spark discharges and various electrochemical and plasma chemical reactions, resulting in a corrosion-resistant dense layer next to the interface followed by a porous layer [5].
PEO processing parameters including electrical parameters such as type and magnitude of applied current density, frequency, duty cycle, and also electrolyte composition have a complex effect on the PEO coating properties.
One of the important challenging properties of PEO coatings is porosity, which was proposed to be created by trapped oxygen in molten oxide produced by micro-discharges [6,7]. Researchers have been trying to control the porosity of the PEO coatings by applying appropriate electrical parameters and using an optimum coating bath. Electrolyte components have a complicated effect on the PEO process since they affect pH, conductivity, substrate passivation, with consequent impact on the properties of coating (especially dielectric) properties. Other important parameters are the interaction between the electrolyte components, which could influence the incorporation of foreign species into the coating, and other interactions of incorporated species into the coating. The silicate-based solution is one of the most conventional electrolytic baths used for the production of PEO coatings. It is well-established that Na2SiO3 improves discharge characteristics including spatial density, frequency, a lifetime of micro-discharges during PEO coating of Al alloys and it also enhances the growth rate of the coating [8,9] Moreover, it increases the surface roughness [9]. Chen et al. [10] observed that the degree of polymerization of silicate ions, which influences the mechanism of coating formation, and the thermal-driven gel-forming process under sparking, depend on the concentration of NaOH and Na2SiO3. A wide range of Na2SiO3 (2–36 g·L−1) and KOH or NaOH (2–8 g·L−1) concentrations were used in the electrolytic solution for PEO of Al alloy [7,11,12,13,14,15,16]. Cheng et al. [7] prepared PEO coating in dilute (8 g L−1 Na2SiO3. 9H2O) and concentrated (36 g L−1 Na2SiO3. 9 H2O) silicate solutions, and observed that the coatings formed in the dilute solution provided better wear resistance than those formed in the concentrated solution, due to better mechanical properties of the outer layer, and fine bonding of the layers. Lee et al. [8] obtained Al2O3 PEO coating in 1 g L−1 KOH electrolytic solution by adding various concentrations of Na2SiO3 (2–14 g L−1). It was shown that the discharge characteristic was changed by the Na2SiO3 concentration, especially, higher Na2SiO3 concentration leads to the lower dielectric breakdown voltage and a decrease in the spatial density of micro-discharges (the number of discharges per unit area) and an increase in the size of micro-discharges. Yang et al. [17] investigated the effect of Na2SiO3·9 H2O concentration (0, 1.85, and 9.17 g L−1) in solutions containing 1 g L−1 NaOH and 4 g L−1 Na4P3O10 on corrosion protection of alumina coating. It is reported that the silicate deteriorated the corrosion performance of the coating, which was attributed to the poor compactness of the coating.
It was reported that the addition of titania into alumina during some processes especially plasma spray can reduce porosity and enhance the corrosion properties [18,19,20,21]. Al2O3-TiO2 is well known for its excellent toughness, high wear resistance, low thermal conductivity, and low thermal expansion. Regarding these properties, this ceramic material is widely used in textile manufacturing tooling, butterfly valves, automotive and hydraulic parts, and electrical insulations [22,23]. In our previous research, Al2O3-TiO2 PEO coatings were obtained by adding potassium titanyl oxalate, PTO, into the silicate-based electrolyte. The incorporation of TiO2 into alumina developed a more compact outer layer along with a thicker and continuous inner layer. In order to achieve high-quality coatings, it was revealed that a sufficient high entrance of Ti into the coating is required [24]. Regarding the literature, despite the significant positive effect of silicate on the PEO process, it harms the compactness of the PEO coating. However, there is no clear discussion about the possible mechanism of the Si effect on the compactness and porosity and the porosity mostly was attributed to the oxygen entrapment into the oxide. Therefore, here we are aiming to track the effect of silicate and KOH components on Al2O3-TiO2 PEO coatings. Regarding that the degree of polymerization of silicate ions depends on the silicate and hydroxide concentrations, the concentration of these components was changed in small quantities. As above mentioned, the amount of Ti-incorporated is important to have a compact alumina coating. Therefore, it is important to see whether the amount of silicate and KOH can affect the amount and distribution of Ti entered into the coatings. Regarding other research [24,25] and our observations in the trial and error phase, the incorporation of electrolyte components in bipolar waveforms is less than that of DC and the unipolar one. Therefore, it was difficult to realize the performance of the incorporated species in the coating performance. Thus, the unipolar waveform was applied to enter enough amount of electrolyte components into the coating. Another advantage of using the unipolar waveform was that the electrical parameters were less and the real effect of the composition of electrolyte on the PEO process and the coatings could be investigated properly. EIS technique was a very strong way to discover the effect of components’ effects on the dielectric properties of the obtained PEO coatings.

2. Materials and Methods

Disk-shaped samples of Al 7075 with a diameter of 20 mm and a thickness of 3 mm were used as substrate. The substrate’s composition (wt.%) included 5.8% Zn, 3.3% Mg, 1.3% Cu, 0.3% Cr, 0.4% Fe, 0.2% Mn, and balance Al. The specimens were polished by abrasive SiC papers (using the finest paper 1200 grit size) and cleaned by distilled water and ethanol after connecting to the copper wire. PEO coatings were grown in an alkaline silicate solution (Na2SiO3.5H2O, SMS) containing potassium titanyl oxalate (K2TiO(C2O4)2, PTO) and KOH. Since the effect of SMS and KOH concentration on Ti incorporation is the aim, the PTO concentration was set constant at an optimized amount of 3 g L−1 (as determined in our previous research [24]). A series of experiments was carried out with 7 samples. The baths differed in SMS and KOH concentrations. In the presence of 3 g L−1 PTO, Ti incorporation was high enough, in addition to the higher stability of the electrolytic solution. Table 1 displays the code of the specimens, the concentration of each component along with pH and conductivity of the coating baths. The codes were suggested according to the concentration of SMS and KOH in the bath.
The PEO process was conducted by utilizing a full-switching double isolated power source of 750 V/30 A capacity, (Yekta mobaddel Pars Co, Yazd, Iran). During the PEO process, the substrate was set as anode and a 7 L cylindrical stainless-steel container was applied as the cathode. The process was carried out by applying a unipolar waveform with a constant current density 6 A dm−2, 20% duty cycle, and 2 kHz frequency for 60 min. The temperature was kept constant at 20 ± 2 °C by placing the cylindrical container in a 100 L water-filled plastic-body container cooled down by an electrical pump. After the coating process, the specimens were washed with distilled water and ethanol and then dried in warm air.
The cross-sections of the coatings were cut and mounted in epoxy resin and ground down to 2400 grit size, then polished by Buehler alumina powder (0.5 µm). The morphological features, elemental composition, and distribution, and also thickness of the coatings were investigated by evaluating the surface and cross-section of the specimens using an FEI Quanta FEG-450 field emission scanning electron microscope (FESEM, FEI, Hillsboro, The United States of America (USA)) equipped with an energy-dispersive X-ray spectroscopy system (EDS, FEI, Hillsboro, OR, USA). The average thickness and porosity percent of the coatings were measured on the cross-section and surface of SEM micrographs using Image J 1.44p software (version 1.6), respectively. The thicknesses of the coatings were measured in at least ten points in each specimen and the average value with the standard deviation was reported.
The constituent phases were determined by the Bruker D8 Discover as the X-ray diffractometer (Bruker, Billerica, MA, USA) at the measurement range of 20 to 80° using a Co Kα radiation source (λ = 1.79 Å) and a LynxEye-XE detector operating at 40 kV and 40 mA. The angular step width and the step time were 0.03° and 8 s, respectively.
The corrosion behaviour of the coatings was evaluated using the electrochemical impedance spectroscopy (EIS) technique conducted with a potentiostat/galvanostat (AMETEK model PARSTAT 2273, Ametek, Berwyn, IL, USA) in 3.5 wt.% NaCl solution at pH 4, regulated by dilute HCl solution. The pH was adjusted at 4 for intensifying the corrosivity of the solution and preventing any natural healing of the coatings during long immersion times [26,27]. After 24 h immersion, the EIS response was recorded using a typical three-electrode cell including a saturated Ag/AgCl reference electrode, platinum plate as the counter electrode, and the PEO-coated sample as the working electrode. The test was performed in the frequency range from 10−2 to 105 Hz using a perturbation amplitude of 10 mV. The EIS tests were repeated 3 or 4 times, assessing that they showed meaningful reproducibility.

3. Results and Discussion

3.1. Voltage-Time Response

Figure 1 displays the change of cell voltage versus the treatment time for the coatings prepared by applying a constant average current density of 6 A dm−2 for 60 min in solutions containing different concentrations of SMS and KOH. The voltage-time transients are typically divided into four stages [28], where the border of each stage is determined by slope variation.
Stage I shows a sharp linear increase of voltage within a short time (~1.2 min) and corresponds to the formation of an initial compact film. Stage II, with the slope of 3–7 V min−1, initiates through reaching dielectric breakdown and occurrence of tiny white sparks. Stage III, with the lower slope of 2–3 V min−1, is known as the micro-arc stage when red-orange sparks occur. In stage IV, the slope is very low (≤0.7 V min−1), and relatively intensive sparks form.

3.1.1. SMS Effect on Voltage-Time Response

By increasing the SMS concentration, a remarkable decrease in the breakdown voltage occurs (see Figure 1, S0K2, S2K2, S3K2, S4K2, and S5K2 graphs). The values of breakdown voltage for the coatings grown in the solutions containing 0 and 5 g L−1 SMS are 494 and 426 V, respectively. The above-mentioned stages are not seen evidently for S0K2, while a decrease of voltage occurs in the last times of the process, indicating deterioration of the coating. As observed in the tabular inset of Figure 1, S2K2 does not experience stage III. However, in the solutions containing SMS concentrations higher than 2 g L−1, all the stages are obvious. The comparison of the voltage-time transient for S3K2 with those for S4K2 and S5K2 shows that by increasing the SMS concentration to 4 and 5 g L −1, stage IV becomes extended at the expense of stage III.
The reduction in the breakdown voltage with increasing SMS concentrations is attributed to: 1—the passive promotion of Al alloy by SMS [29] and 2—the enhancement of the ability of the bath solution for electron injection to the conduction band of the growing oxide or gaseous shell formed on the anode surface [30]. In stage I of the PEO process, ionic migration is the dominant mechanism of coating growth, which is driven by the high-filed condition built up across the oxide due to the applied potential. Once the coating reaches the critical thickness, the ionic migration stops; therefore, the applied potential is spent on the formation of the electric field within the oxide and the increase of energy level of the electrons of the species in the bath. By increasing the applied potential, the energy level of the electrons of the electroactive species in the electrolyte becomes beyond that of the conduction band of the oxide coating; therefore, electrons enter the conduction band and result in a charge carrier avalanche leading to dielectric breakdown [31]. Regarding silicate promoting Al passivation, therefore the critical thickness is achieved faster by the increase of SMS concentration, and therefore, decreases the breakdown voltage. On the other hand, by increasing the electrolyte conductivity, more anionic species, especially hydroxyl ions, array at the anode-electrolyte interface and inject more electrons into the interface, which encourages the charge-carriers avalanche [32].

3.1.2. KOH Effect on Voltage-Time Response

As shown in Figure 1, increasing KOH from 1 to 3 g L−1 (S3K1, S3K2, and S3K3 graphs) decreases the breakdown voltage and significantly extends stage IV at expense of stages II and III. Furthermore, in the presence of 3 g L−1 KOH, the duration of stage IV is longer than that of 2 g L−1 KOH (S3K2 specimen).

3.2. Coating Surface Morphology

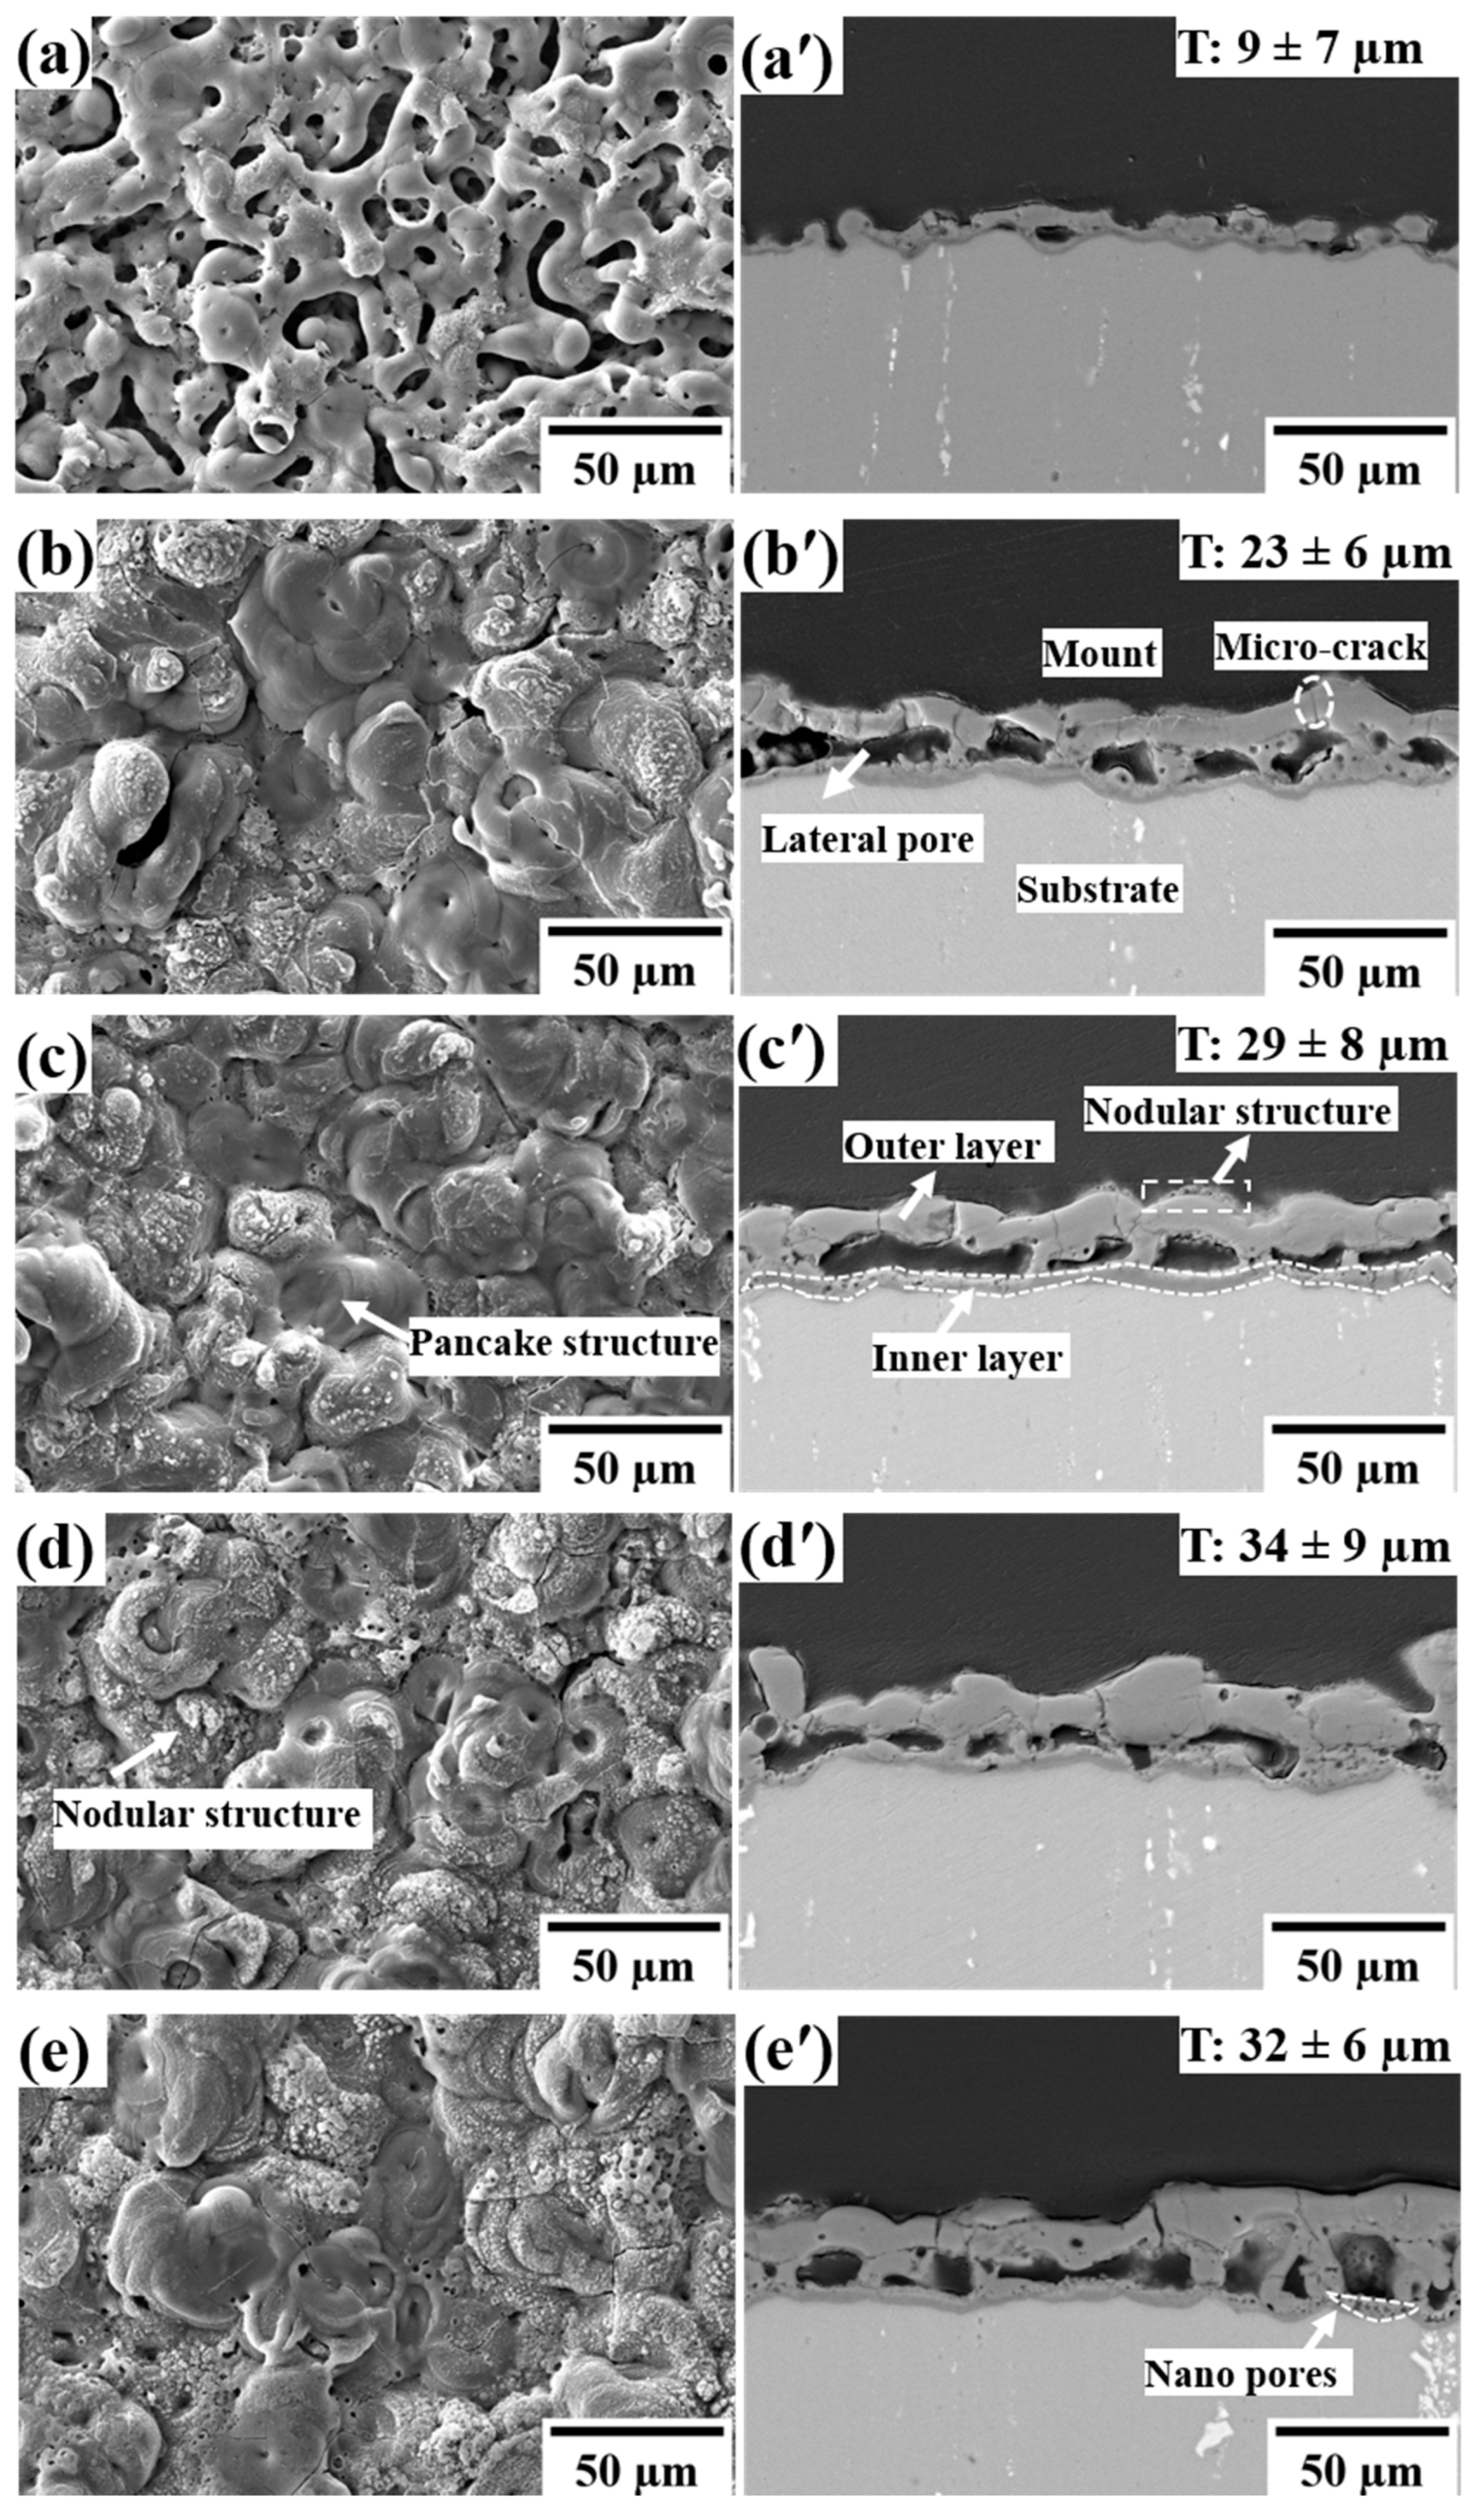
3.2.1. Effect of SMS on the Surface Morphology

Figure 2 displays the surface morphology and cross-section of the PEO coatings.
The thickness of the coatings is inserted in the related cross-section images. A coralline morphology is observed for S0K2 coating (Figure 2a), which reveals ~17% surface porosity, suggesting the low growth rate of the coating in the solution containing no SMS additive. By adding SMS, the morphology of the PEO coating undergoes a significant change. The SEM images of the coatings produced in the presence of different contents of SMS (Figure 2b–e), exhibit a pancake morphology rich in Al along with nodular structures rich in Si and Ti, as also observed in our previous work [24]. This kind of morphology reveals lower than 2% surface porosity. Micro-discharges play a major role in the development of microstructure, especially surface morphology. Hussein et al. [28] studied the type of micro-discharges occurring during the PEO process by optical emission spectroscopy in the visible and near the ultra-violet band. Three main micro-discharges were proposed including A- and C-type micro-discharges, which originate from gas discharges at the surface holes and relatively deep holes, respectively. These micro-discharges make the coating material rich in electrolyte species. There is also B-type micro-discharge raised by dielectric breakdown, which originates at the metal-oxide interface, resulting in a coating material rich in substrate species. According to the mechanism proposed by Hussein et al. [28], the molten substrate is ejected out from the substrate-coating interface through the discharge channels, then oxidized, solidified, and finally forms the pancake structure. By the increase of SMS concentration, most of the pancakes are covered by the nodules. This confirms that the nodules are majorly formed by the participation of solution constituents through interfacial micro-discharges [33].
As seen in the cross-section images (Figure 2a′–e′), the coatings have a bilayer structure: a thicker defective outer layer containing cracks and pores, and a thinner more compact, and less defective inner layer. Also, the lateral micro-pores are present at the interface of outer-inner layers. The outer layer of the S0K2 specimen is non-continuous and SMS addition into the bath results in a thicker and continuous outer layer. By increasing the SMS concentration from 2 to 4 g L−1, the coating thickness increases from 22 to 34 µm (Figure 2). However, further increase of the SMS concentration does not change the coating thickness significantly. Comparison of the cross-sections of S3K2, S4K2, and S5K2 coatings shows that SMS concentrations higher than 3 g L−1 create more nano-pores near or inside the inner layer and more cracks and pores in the outer layer.
As disclosed by Figure 2, the coating thickness (especially for the outer layer) increases with increasing SMS concentration. Alkaline solutions tend to dissolve aluminium oxide, while silicate can inhibit such a process due to the formation of a protective film over the oxide surface [34]. According to the literature, the silicate species in a given environment might be monomeric, polymeric, and amorphic ones. which are determined by pH and silicate concentration of the environment [35]. As observed in Table 1, pH values of the coating bath containing SMS are higher than 12 and SMS concentration is in the range of 2 g L−1 (0.009 mol L−1) to 5 g L−1 (0.024 mol L−1), where the monomeric anions, Si ( OH ) 3 , Si ( OH ) 2 2 , are the dominant species [35]. These silica species have a higher affinity to aluminum oxide surface and are chemisorbed and physisorbed at the surface [36]. Therefore, thanks to the consequent suppression of the anodic dissolution of oxide formed during PEO and the incorporation of silica in the coating, the presence of sodium silicate can effectively raise the coating growth rate and thus increase the coating thickness. In addition, the increment of SMS concentration promotes the conversion rate of Al substrate into Al2O3 by facilitation of frequent micro-discharge formation due to a lower breakdown voltage and thus increases the coating thickness [37].

3.2.2. Effect of KOH on Surface Morphology

SEM images from the surface and cross-section of the coatings obtained from the electrolytes containing 1 and 3 g L−1 KOH are displayed in Figure 3.
Regarding Figure 3a, the pancakes in the S3K1 specimen are free of any nodules and are larger than those of S3K2, Figure 2c. However, the S3K3 specimen has a pancake morphology covered with nodules. Increasing the KOH content raises the coating thickness (Figure 2c′ and Figure 3a′,b′), but at 3 g L−1 KOH, many nano-pores in the inner layer and more micro-cracks and nano-pores in the outer layer are formed, indicating the occurrence of deteriorating discharges. Therefore, S3K2 has less defective layers along with the thickest inner layer.
The PEO process of the S3K1 specimen is carried out under significantly higher voltage, which results in larger pancakes and deeper micro-cracks between the pancakes as compared with the S3K2 specimen (Figure 2c,c′ and Figure 3a,a′). These cracks are the potential places for interfacial micro-discharges which result in the incorporation of Si between the pancakes instead of their surface. This is confirmed by EDS mapping on the S3K1 surface (Figure 4), which shows the highest Si content between the pancakes. However, the pancakes are mostly rich in Al.
The cross-section image of S3K2 indicates that this specimen experiences better sintering, and thus, the depth of surface micro-pores and micro-cracks are low; therefore, the scattered interfacial micro-discharges occur on the pancakes’ surface and develop the nodules.
Generally, the increase of SMS and KOH concentration in the PEO bath increases the coating thickness. In addition to the reasons stated before, it is attributed to the increase of pH, as seen in Table 1, which means the raise of available OH for the formation of aluminium oxide. Despite the higher voltage during the PEO process of the S3K1 specimen, the growth rate is low, which might be due to the lower pH.

3.3. Elemental Composition Analysis

Table 2 lists the surface elemental compositions of the PEO coatings and Figure 5 presents the EDS elemental maps of Al, Si, and Ti of the coatings in the cross-sections.

3.3.1. The Effect of SMS on the Elemental Composition of the Coating

The elements on the surface of the coating produced in SMS-free solution are mainly Al, O, and Ti. As soon as SMS is added to the bath, Si is present in the coating. By increasing the SMS concentration from 2 to 3 g L−1, the incorporation of Si into the coating decreases, and in higher concentrations, it increases from ~8 to 18 at.%, while Ti does not change significantly. According to Figure 5, Al has a uniform distribution throughout the coatings. In S3K2, S4K2, and S5K2 specimens, the distribution of Ti is dominant in some areas of the inner layer and also the coating surface. In them, Si is found mainly on the top surface of the outer layer. However, in S4K2, and S5K2 specimens, Si also exists inside the pore walls located beneath the outer layer and also in the inner layer.
It is well known that the negatively charged TiO2 nanoparticles are produced in alkaline electrolytes and drawn toward the anode by electrophoretic force and mechanical admixture [38,39]. An opposite surface electrical charge contacts TiO2 nanoparticles to silica gel on the specimen surface, and then, encourages the formation of bonds between silica and TiO2 nanoparticles. TiO2 may be anchored on silica gel in two possible ways including either penetrating the pores of silica gel or adsorption on the outer layer of silica gel [40,41]. Because of TiO2 adsorption on silica gel, Ti map distribution overlaps with that of Si.
On the other hand, as explained in our previous research [24], mild B-type discharges with a uniform distribution all over the surface are critical for the incorporation of Ti into the coating. The higher existence of Si in the interior sections of S4K2, and S5K2 shows that the electrolyte reaches the inner parts of the coatings via short-circuit path in the outer layer including cracks and pores resulting from the strong B-type discharges governed at the latest times of stage IV [42]. It is interesting that despite the increase of SMS concentration from 2 to 3 g L−1, the incorporation of Si element into the coating decreased. As discussed in Section 3.2.1, Si-rich parts were seen as the nodules on the coating surface and they were created by A- and C-type micro-discharges occurring in the surficial holes. According to the cross-section images (Figure 2), the outer layer of the S3K2 specimen (Figure 2c′) is more compact and less defective than S2K2 (Figure 2b′). This means that the number of A- and C-type micro-discharges responsible for Si incorporation decreased, which resulted in the lower Si content. However, Si incorporated significantly higher in the coatings prepared from the electrolyte containing 4 and 5 g L−1 SMS, ~14 and 18 at.%, respectively. As mentioned in Section 3.1.1, silicate increases the electrolyte conductivity which enhances micro-discharge intensity by injecting electrons to the conductive band of growing oxide. Strong micro-discharges can make more micro-cracks and then promote electrolyte diffusion and Si incorporation in the inner part of the coating. On the other hand, Al2O3 can be stabilized against sintering by silica that is well known as a thermal stabilizer of alumina [43]. Beguin et al. [44] stated that silica-containing precursor grafted to alumina is capable to fill the oxygen vacancies of alumina, which are the important agents of thermal sintering, and then weakens γ-Al2O3 densification. This effect of silica on γ-Al2O3 is profitable in the preparation of porous γ-Al2O3 as a stable catalyst at high temperatures [44]. Regarding sintering as an important step in the formation of compact PEO coating [45], higher incorporation of Si in S4K2 and S5K2 retards γ-Al2O3 densification and makes more porous and more defective coating.

3.3.2. The Effect of KOH on the Elemental Composition of the Coating

According to Table 2, Similar to the effect of SMS, the incorporation of Si and Ti decreases with increasing KOH concentration from 1 to 2 g L−1, but increases in the presence of 3 g L−1 KOH. Intensive micro-discharges and then higher incorporation of Si in the coating make the defective outer layer and inner layer in the S3K3 specimen.

3.4. Phase Composition

For evaluation of SMS and KOH effect on the phase composition of the coating, the specimens were analyzed by XRD technique and the results are presented in Figure 6.
Since the coatings are porous, strong diffraction peaks of the substrate are detected. As observed, non-stoichiometric γ-Al2O3 (Al2.667O4, JCPDS card number: 01-080-1385) is the dominant phase in all specimens; since Mg and Zn existed in the substrate are released by anodic dissolution and impede the transformation of γ-Al2O3 to α-Al2O3 [46,47].

3.4.1. Effect of SMS Concentration on Phase Composition

By adding SMS into the coating solution, the intensity of γ-Al2O3 is raised and α-Al2O3 is formed. The lack of Si compounds peaks in the XRD patterns (Figure 6) indicates that this element should be incorporated as an amorphous phase due to the higher glass-forming ability of Si [48]. As reported in our previous work [24], Raman spectroscopy revealed the incorporation of Ti in the coatings as the rutile and anatase polymorph. According to Figure 6, the alumina peaks in the S0K2 specimen, especially γ-Al2O3 ones, shift to the lower angles rather than those related to other coatings. This finding can be explained by assuming the formation of a non-stoichiometric γ-Al2O3 and/or amorphous Al2O3 phase due to the possible incorporation of Ti inside the alumina (Table 2).
It is valuable to be mentioned, only α-Al2O3 is considered a thermodynamically stable polymorph of alumina and other polymorphs including γ-Al2O3 are metastable [49]. In the PEO treatment, heat and mass transfers play important roles in phase formation [50]. Metastable polymorphs, especially the γ-Al2O3, develop due to the high cooling rate of molten material in direct contact with solution and substrate. Incorporation of Ti into alumina accelerates grain boundary diffusion and grain boundary mobility, and therefore, increases the transformation of the metastable allotropes to α-Al2O3. However, S0K2 with ~11 at.% Ti contains no α-Al2O3; because another critical parameter required for transformation of metastable polymorphs to α-Al2O3 is the low thermal conductivity [51]. SMS increases the thickness and hence the heat maintaining capability of the coatings. Therefore, α-Al2O3 peaks can appear in the coating grown from the solutions containing SMS.

3.4.2. Effect of KOH Concentration on Phase Composition

The relative quantity of γ-Al2O3 and α-Al2O3 can be deduced by comparing the intensity of their strong peaks diffracted by (400) plane at 2θ = 53.801° and (113) plane at 2θ = 50.783° from γ-Al2O3 and α-Al2O3, respectively [52]. As seen in Figure 6b, given the constant amount of α-Al2O3, it can be concluded that the increase of KOH in the electrolyte raised the content of γ-Al2O3.

3.5. Corrosion Behaviour of the Coatings

The corrosion resistance of the PEO coatings was evaluated using the EIS technique in 3.5 wt.% NaCl solution adjusted at pH 4 using dilute chloric acid.

3.5.1. Effect of SMS Concentration on Corrosion Behaviour

Bode plots of impedance magnitude ׀z׀ and phase angle ( θ ) as a function of frequency (f) are presented in Figure 7.
The ingress of the corrosive solution toward the substrate leads to the local corrosion attack presented by a double layer capacitance parallel with a charge-transfer resistance at the low-frequency region [53]. Observing higher impedance values at the low-frequency region indicates suitable protection against corrosive solution [54]. The S2K2, S3K2, S4K2, and S5K2 coatings show good corrosion performance evidenced by increased ׀z׀ values at low frequencies. However, S0K2 specimens show a transmission behaviour from capacitive to resistive at the low-frequency range indicating the corrosion attack at the substrate/coating interface due to the presence of cracks, pores, or other defects in the coating inner layer that allow ingression of corrosive solution. The impedance value at low frequencies, |z|0.01 Hz, indicates that the S3K2 with the highest modulus value above 106 Ω cm2, provides the higher corrosion performance compared to other coatings.
Bode phase plots of S0K2 coating shows a wide and unsymmetrical hump of the phase angle indicating the overlap of two-time constants. Partial corrosion attack of the substrate makes this kind of impedance response [55]. Also, as seen in the Bode ׀z׀ plot, a small resistive behaviour exists at low frequencies, which indicates the ingression of corrosive solution into the coating toward the substrate. In addition, the sharp decline of θ vs. f at the low-frequency region shows a corrosion attack at the substrate/coating interface.
The S3K2 specimen exhibited two humps at high and low frequencies, however, S2K2, S4K2, and S5K2 show a capacitive loop at high frequencies and another at the middle to low frequencies. The high-frequency hump is related to the outer layer and another is raised by the inner layer. The shift of the low-frequency hump to the higher angles indicates that the inner layer of S3K2 has a higher corrosion resistance than other coatings. In the high-frequency region, shifting the hump toward high frequencies and decreasing the value of θ reflect the decrease of coating corrosion performance owing to more defects on the coating surface [56,57]. As seen before, the outer layer of S3K2 is denser than other coatings, therefore, it has a higher θ at the high-frequency region.
Based on EIS results, an equivalent electrical circuit (EC) can be offered. Different circuits are proposed due to the difference in the shape of EIS plots of the coatings, Figure 8a.
The corrosion behaviour of the S0K2 specimen is modelled using the EC in Figure 8a. In this model, Rs is uncompensated solution resistance between the coating and the solution interface, Rpore and Rct are the pore resistance and charge transfer resistance, respectively. CPEc and CPEdl are related to constant phase elements of the coating and electrical double layer, respectively. The corrosion property of other coatings is simulated by the EC in Figure 8b, in which, Rin and CPEin indicate resistance and constant phase element of the inner layer, respectively, and Rout and CPEout are related to resistance and constant phase element of the outer layer, respectively. After appropriate fitting of EIS plots, electrochemical parameters are summarized in Table 3.
As expected, the resistance of the inner barrier layer, Rin, is higher than that of the outer layer, Rout, indicates that it majorly contributes to the overall coating corrosion resistance. For this reason, corrosion protection of PEO coatings is mainly given by the inner layer. As seen, the resistance values of outer and inner layers of S3K2 coating are remarkably the highest.
The microstructure, phase composition, and density of the coatings are the main parameters that determine the corrosion behaviour of the ceramic coatings [58]. In general, more compact and thicker coatings consisting of thermodynamically stable phases would result in higher protection against corrosion agents [5]. As mentioned previously, the S3K2 specimen possesses a more compact outer layer and fewer defects along with a thicker inner layer than others. Thus, there are fewer pathways in this coating for penetration of the corrosive solution. Also, the barrier property of alumina in acid solutions highly depends on the presence of the minor constituents. Impurities such as Si4+, Ti4+, and Mg2+ cause a rise in the number of free charge carriers participating in the interfacial polarization. Si4+ has limited solubility in alumina and formed a glassy phase, in which, ionic diffusion is significantly fast. On the other hand, Si incorporation prevents the sintering of alumina and makes porous alumina. Thus, Si4+ decreases the barrier property of the coating more significantly than other ions [59]. It can be suggested that the incorporation of Si4+ in inner layers of S4K2 and S5K2 coatings provides the lower barrier property for these coatings compared to S3K2 one. As seen in Table 3, the CPE of the inner layer is higher than that of the outer layer despite the higher charge-transfer resistance of the inner layer in respect to the outer layer. The CPE model correlates with the equivalent complex relative permittivity, ε ~ ( ω ) , according to the following equation:
ε ~ ( ω ) = C x   d ε 0   A   ( j   ω ) 1 n
where C x is the CPE factor in Fsn−1 and n is an exponent, while n = 1 gives an ideal capacitor, n = 0 is related to an ohmic resistor and n = 0.5 corresponds to the Warburg element due to the diffusion process. A and d are the surface area, and the thickness of the double layer on the surface of the coating layer, respectively, and ε 0 is the permittivity of the vacuum [60]. The dielectric constant of a substance is changed by density and ingredients [61,62]. As mentioned before, the presence of Si4+, Ti4+, and Mg2+ in alumina causes a great rise of the dielectric constant, which is called dielectric loss [59]. It is valuable to notice, in a capacitor from a lossy dielectric, the dielectric absorption causes the value of ε and thus Cx to change with frequency [63]. The dielectric loss is intensified at the low-frequency region and the decay in capacitance with frequency will be more pronounced for a dielectric with the higher dielectric loss [63]. Therefore, it could be concluded that the mentioned cations added have an adverse effect on the dielectric properties of alumina.

3.5.2. Effect of KOH Concentration on Corrosion Behavior

Bode plots of ׀z׀ and ( θ ) as a function of frequency (f) related to S3K1, S3K2, and S3K3 are present in Figure 9.
S3K1 and S3K2 specimens similar to S0K2 are exposed to corrosion attack, which is observable by the transmission behaviour from capacitive to resistive and the sharp decline of θ vs. f at the low-frequency range in Bode plots of ׀z׀ and ( θ ), respectively. EC in Figure 8a is used for simulation of the corrosion behaviour of S3K1 and S3K3 specimens and Table 4 shows their electrochemical parameters. The resistance of the coating for these two specimens is significantly lower than the Rin of the S3K2 specimen due to higher defects.
To sum up, silicate and KOH significantly influence the PEO process stages. It indicates that they modify the density and intensity of micro-discharges significantly. In the lower concentration of SMS and KOH, the growth rate and the continuity of the layers, especially the outer layer, were less. This might be attributed to the low quality of micro-discharges. However, in the higher concentrations of SMS and KOH, the porosity was increased in the outer layer and inner layer. This is related to the higher incorporation of Si4+ in the layers induced by higher micro-discharges which weaken the sintering process of alumina; however, the bath related to the S3K2 specimen made a more compact outer layer and a less-defect inner layer without any incorporation of Si4+. This shows this bath has an appropriate potential to create good micro-discharges during the PEO process. It should be noticed that OH is also released in the bath by hydrolyzation of sodium metasilicate. Therefore, the KOH effect overlaps with the effect of sodium metasilicate, especially the effect on conductivity. It can be summarized that OH, as an electroactive species in the electrolyte, injects electrons to the conduction band, and thus, promotes micro discharging at lower voltages. Also, it provides OH required for alumina formation. From our point of view, one of the important effects of OH is on the PEO process stages as described in Section 3.1.2. In addition, it is valuable to be mentioned why we chose a narrow range of KOH concentrations, because it significantly affects the viscosity of bath by changing the forms of silicate species from monomeric ones to other forms (such as polymeric and amorphous ones).
It is valuable to be noticed despite the negative effect of TiO2 on dielectric properties of alumina, it was observed in our previous work [24], the coating prepared from the electrolyte without PTO had significant lower corrosion resistance than the coating prepared in the electrolytes containing 3 and 5 g L−1 PTO. The coating obtained from electrolyte without PTO had a higher thickness (~36 µm) in comparison with the coatings obtained from the electrolytes containing 3 and 5 g L−1 PTO (~29 µm). Considering that the corrosion resistance depends on various parameters including thickness, phase composition and density of the coatings, improvement of the electrochemical behaviour of Al2O3-TiO2 coating is due to the thicker and more continuous inner layer and also more compact outer layer. Now, by clarifying the role of each component in the PEO process and their effects on the properties of PEO coating in detail, it will be feasible to design complicated waveforms to reach a coating more compact with higher corrosion and wear resistance.

4. Conclusions

The effect of silicate and potassium hydroxide as the two major constituents of the PEO coating bath on Al2O3-TiO2 coatings was investigated. These components significantly changed the voltage-time response. In the absence or at a low concentration of SMS (≤2 g L−1), the micro-arc stage was absent. At low KOH concentration (1 g L−1), higher voltage made stage II significantly long in the voltage-time graph. The surface and cross-section morphology of the coatings were modified by SMS and KOH. In all coatings prepared in the presence of SMS, a pancake-nodular structure was observed except for the coating obtained from a solution containing 1 g L−1 KOH, in which Si-rich zones located mostly between the pancakes. SMS and KOH increased the growth rate and made the thicker coatings; however, at higher concentrations, they induce the formation of more pores and cracks in the coatings’ cross-sections. In this way, higher Si entered into the inner section of the coating weakens the dielectric properties of alumina. Adding SMS into the bath electrolyte increased the amount of γ-Al2O3 phase and created α-Al2O3. According to EIS results, the coating produced in the solution containing 3 g L−1 SMS and 2 g L−1 KOH provided the highest barrier resistance of ~10 MΩ cm2 thanks to more compact layers and high-purity inner layer.

Author Contributions

Conceptualization, M.S.; data curation, K.R. and F.A.; formal analysis, M.H.; investigation, M.H.; methodology, M.H., F.A. and A.H.; project administration, K.R.; software, M.H.; supervision, K.R., F.A. and T.L.; validation, M.H., K.R., F.A., A.H., M.S. and T.L.; visualization, K.R., F.A., A.H. and M.S.; writing—original draft, M.H.; writing—review and editing, M.H., K.R., F.A., A.H., M.S. and T.L. All authors have read and agreed to the published version of the manuscript.

Funding

This research received no external funding.

Institutional Review Board Statement

Not applicable.

Informed Consent Statement

Not applicable.

Data Availability Statement

Data sharing not applicable.

Conflicts of Interest

The authors declare no conflict of interest.

References

  1. Zhang, Y.; Fan, W.; Du, H.Q.; Zhao, Y.W. Corrosion behavior and structure of plasma electrolytic oxidation coated aluminum alloy. Int. J. Electrochem. Sci. 2017, 12, 6788–6800. [Google Scholar] [CrossRef]
  2. Babaei, K.; Fattah-alhosseini, A.; Molaei, M. The effects of carbon-based additives on corrosion and wear properties of Plasma electrolytic oxidation (PEO) coatings applied on Aluminum and its alloys: A review. Surf. Interfaces 2020, 21, 100677. [Google Scholar] [CrossRef]
  3. Hussein, R.O.; Nie, X.; Northwood, D.O. An investigation of ceramic coating growth mechanisms in plasma electrolytic oxidation (PEO) processing. Electrochim. Acta 2013, 112, 111–119. [Google Scholar] [CrossRef]
  4. Fattah-alhosseini, A.; Molaei, M.; Nouri, M.; Babaei, K. Review of the role of graphene and its derivatives in enhancing the performance of plasma electrolytic oxidation coatings on titanium and its alloys. Appl. Surf. Sci. Adv. 2021, 6, 100140. [Google Scholar] [CrossRef]
  5. Barati, N.; Yerokhin, A.; Golestanifard, F.; Rastegari, S.; Meletis, E.I. Alumina-zirconia coatings produced by Plasma Electrolytic Oxidation on Al alloy for corrosion resistance improvement. J. Alloys Compd. 2017, 724, 435–442. [Google Scholar] [CrossRef]
  6. Cheng, Y.; Cao, J.; Mao, M.; Xie, H.; Skeldon, P.; Snizhko, L.O.; Yerokhin, A.L.; Gurevina, N.L.; Patalakha, V.A.; Matthews, A. Key factors determining the development of two morphologies of plasma electrolytic coatings on an Al-Cu-Li alloy in aluminate electrolytes. Thin Solid Films 2016, 291, 239–249. [Google Scholar] [CrossRef] [Green Version]
  7. Cheng, Y.L.; Xue, Z.G.; Wang, Q.; Wu, X.Q.; Matykina, E.; Skeldon, P.; Thompson, G.E. New findings on properties of plasma electrolytic oxidation Coatings from study of an Al-Cu-Li alloy. Electrochim. Acta 2013, 107, 358–378. [Google Scholar] [CrossRef]
  8. Lee, J.-H.H.; Kim, S.-J.J. Effects of silicate ion concentration on the formation of ceramic oxide layers produced by plasma electrolytic oxidation on Al alloy. Jpn. J. Appl. Phys. 2016, 56, 01AB01. [Google Scholar] [CrossRef]
  9. Wang, S.; Liu, X.; Yin, X.; Du, N. Influence of electrolyte components on the microstructure and growth mechanism of plasma electrolytic oxidation coatings on 1060 aluminum alloy. Surf. Coat. Technol. 2020, 381, 125214. [Google Scholar] [CrossRef]
  10. Chen, Y.; Yang, Y.; Zhang, T.; Zhang, W.; Wang, F.; Lu, X.; Blawert, C.; Zheludkevich, M.L. Interaction effect between different constituents in silicate-containing electrolyte on PEO coatings on Mg alloy. Surf. Coat. Technol. 2016, 307, 825–836. [Google Scholar] [CrossRef]
  11. Becerik, D.A.; Ayday, A.; Kumruoğlu, L.C.; Kurnaz, S.C.; Özel, A. The effects of Na2SiO3 concentration on the properties of plasma electrolytic oxidation coatings on 6060 aluminum alloy. J. Mater. Eng. Perform. 2012, 21, 1426–1430. [Google Scholar] [CrossRef]
  12. Pezzato, L.; Brunelli, K.; Dabalà, M. Corrosion properties of plasma electrolytic oxidation coated AA7075 treated using an electrolyte containing lanthanum-salts. Surf. Interface Anal. 2016, 48, 729–738. [Google Scholar] [CrossRef]
  13. Raj, V.; Ali, M.M. Formation of ceramic alumina nanocomposite coatings on aluminium for enhanced corrosion resistance. J. Mater. Process. Technol. 2009, 209, 5341–5352. [Google Scholar] [CrossRef]
  14. Xiang, N.; Song, R.G.; Wang, C.; Mao, Q.Z.; Ge, Y.J.; Ding, J.H.; Song, R.G.; Wang, C.; Mao, Q.Z.; Ge, Y.J.; et al. Formation of corrosion resistant plasma electrolytic oxidation coatings on aluminium alloy with addition of sodium tungstate species. Corros. Eng. Sci. Technol. 2016, 51, 146–154. [Google Scholar] [CrossRef]
  15. Li, J.; Cai, H.; Jiang, B. Growth mechanism of black ceramic layers formed by microarc oxidation. Surf. Coat. Technol. 2007, 201, 8702–8708. [Google Scholar] [CrossRef]
  16. Wang, P.; Li, J.; Guo, Y.; Wang, J.; Yang, Z.; Liang, M. The formation mechanism of the composited ceramic coating with thermal protection feature on an Al-12Si piston alloy via a modified PEO process. J. Alloys Compd. 2016, 682, 357–365. [Google Scholar] [CrossRef]
  17. Yang, Z.; Zhang, X.Z.; Wu, Y.K.; Wu, G.R.; Wang, D.D.; Liu, X.T.; Han, H.P.; Su, Y.; Shen, D.J. The correlation between the Na2SiO3·9H2O concentrations and the characteristics of plasma electrolytic oxidation ceramic coatings. Ceram. Int. 2019, 45, 19388–19394. [Google Scholar] [CrossRef]
  18. Utu, I.D.; Marginean, G.; Hulka, I.; Serban, V.A.; Cristea, D. Properties of the thermally sprayed Al2O3-TiO2 coatings deposited on titanium substrate. Int. J. Refract. Met. Hard Mater. 2015, 51, 118–123. [Google Scholar] [CrossRef]
  19. Pinzón, A.V.; Urrego, K.J.; González-Hernández, A.; Rincón Ortiz, M.; Vargas Galvis, F. Corrosion protection of carbon steel by alumina-titania ceramic coatings used for industrial applications. Ceram. Int. 2018, 44, 21765–21773. [Google Scholar] [CrossRef]
  20. Wang, Y.; Tian, W.; Zhang, T.; Yang, Y. Microstructure, spallation and corrosion of plasma sprayed Al2O3-13%TiO2 coatings. Corros. Sci. 2009, 51, 2924–2931. [Google Scholar] [CrossRef]
  21. Kaseem, M.; Kwon, J.H.; Ko, Y.G. Modification of a porous oxide layer formed on an Al-Zn-Mg alloy via plasma electrolytic oxidation and post treatment using oxalate ions. RSC Adv. 2016, 6, 107109–107113. [Google Scholar] [CrossRef]
  22. Bian, H.M.; Yang, Y.; Wang, Y.; Tian, W. Preparation of nanostructured alumina-titania composite powders by spray drying, heat treatment and plasma treatment. Powder Technol. 2012, 219, 257–263. [Google Scholar] [CrossRef]
  23. Michalak, M.; Łatka, L.; Sokołowski, P.; Candidato, R.T.; Ambroziak, A. Effect of TiO2 on the microstructure and phase composition of Al2O3 and Al2O3–TiO2 APS sprayed coatings. Bull. Polish Acad. Sci. Tech. Sci. 2021, 69, 14–17. [Google Scholar]
  24. Hashemzadeh, M.; Raeissi, K.; Ashrafizadeh, F.; Hakimizad, A.; Santamaria, M. The incorporation mechanism of colloidal TiO2 nanoparticles and their effect on properties of the coatings grown on 7075 Al alloy from silicate-based solution using plasma electrolytic solution. Trans. Nonferr. Met. Soc. China 2021, 31, 3659–3676. [Google Scholar] [CrossRef]
  25. Akbari, E.; Di Franco, F.; Ceraolo, P.; Raeissi, K.; Santamaria, M.; Hakimizad, A. Electrochemically-induced TiO2 incorporation for enhancing corrosion and tribocorrosion resistance of PEO coating on 7075 Al alloy. Corros. Sci. 2018, 143, 314–328. [Google Scholar] [CrossRef]
  26. Hakimizad, A.; Raeissi, K.; Santamaria, M.; Asghari, M. Effects of pulse current mode on plasma electrolytic oxidation of 7075 Al in Na2WO4 containing solution: From unipolar to soft-sparking regime. Electrochim. Acta 2018, 284, 618–629. [Google Scholar] [CrossRef]
  27. Hakimizad, A.; Raeissi, K.; Golozar, M.A.; Lu, X.; Blawert, C.; Zheludkevich, M.L. The effect of pulse waveforms on surface morphology, composition and corrosion behavior of Al2O3 and Al2O3/TiO2 nano-composite PEO coatings on 7075 aluminum alloy. Surf. Coat. Technol. 2017, 324, 208–221. [Google Scholar] [CrossRef]
  28. Hussein, R.O.; Nie, X.; Northwood, D.O.; Yerokhin, A.; Matthews, A. Spectroscopic study of electrolytic plasma and discharging behaviour during the plasma electrolytic oxidation (PEO) process. J. Phys. D Appl. Phys. 2010, 43, 105203. [Google Scholar] [CrossRef]
  29. Yerokhin, A.L.; Nie, X.; Leyland, A.; Matthews, A.; Dowey, S.J. Plasma electrolysis for surface engineering. Surf. Coat. Technol. 1999, 122, 73–93. [Google Scholar] [CrossRef]
  30. Babaei, M.; Dehghanian, C.; Vanaki, M. Effect of additive on electrochemical corrosion properties of plasma electrolytic oxidation coatings formed on CP Ti under different processing frequency. Appl. Surf. Sci. 2015, 357, 712–720. [Google Scholar] [CrossRef]
  31. Rogov, A.B.; Huang, Y.; Shore, D.; Matthews, A.; Yerokhin, A. Toward rational design of ceramic coatings generated on valve metals by plasma electrolytic oxidation: The role of cathodic polarisation. Ceram. Int. 2021, 47, 34137–34158. [Google Scholar] [CrossRef]
  32. Simchen, F.; Sieber, M.; Lampke, T. Electrolyte influence on ignition of plasma electrolytic oxidation processes on light metals. Surf. Coat. Technol. 2017, 315, 205–213. [Google Scholar] [CrossRef]
  33. Wang, D.D.; Liu, X.T.; Wu, Y.K.; Han, H.P.; Yang, Z.; Su, Y.; Zhang, X.Z.; Wu, G.R.; Shen, D.J. Evolution process of the plasma electrolytic oxidation (PEO) coating formed on aluminum in an alkaline sodium hexametaphosphate ((NaPO3)6) electrolyte. J. Alloys Compd. 2019, 798, 129–143. [Google Scholar] [CrossRef]
  34. Lopez-Garrity, O.; Frankel, G.S. Corrosion inhibition of aa2024-t3 by sodium silicate. Electrochim. Acta 2014, 130, 9–21. [Google Scholar] [CrossRef]
  35. Asrar, N.; Malik, A.U.; Ahmed, S. Corrosion prevention with sodium silicate. Tech. Rep. 1998, 1856–1885. [Google Scholar]
  36. Gaggiano, R.; Moriamé, P.; Vandendael, I.; De Graevea, I.; Terryn, H. Silicate-based post-anodic treatment for lithographic application. Surf. Interface Anal. 2010, 42, 321–327. [Google Scholar] [CrossRef]
  37. Ko, Y.G.; Namgung, S.; Shin, D.H. Correlation between KOH concentration and surface properties of AZ91 magnesium alloy coated by plasma electrolytic oxidation. Surf. Coat. Technol. 2010, 205, 2525–2531. [Google Scholar] [CrossRef]
  38. Kaseem, M.; Min, J.H.; Ko, Y.G. Corrosion behavior of Al-1 wt% Mg-0.85 wt% Si alloy coated by micro-arc-oxidation using TiO2 and Na2MoO4 additives: Role of current density. J. Alloys Compd. 2017, 723, 448–455. [Google Scholar] [CrossRef]
  39. Kaseem, M.; Fatimah, S.; Nashrah, N.; Ko, Y.G. Recent progress in surface modification of metals coated by plasma electrolytic oxidation: Principle, structure, and performance. Prog. Mater. Sci. 2021, 117, 100735. [Google Scholar] [CrossRef]
  40. Hendrix, Y.; Lazaro, A.; Yu, Q.L.; Brouwers, H.J.H. Influence of synthesis conditions on the properties of photocatalytic titania-silica composites. J. Photochem. Photobiol. A Chem. 2019, 371, 25–32. [Google Scholar] [CrossRef]
  41. Lepore, G.P.; Persaud, L.; Langford, C.H. Supporting titanium dioxide photocatalysts on silica gel and hydrophobically modified silica gel. J. Photochem. Photobiol. A Chem. 1996, 98, 103–111. [Google Scholar] [CrossRef]
  42. Arrabal, R.; Matykina, E.; Skeldon, P.; Thompson, G.E. Incorporation of zirconia particles into coatings formed on magnesium by plasma electrolytic oxidation. J. Mater. Sci. 2008, 43, 1532–1538. [Google Scholar] [CrossRef]
  43. Mardkhe, M.K.; Huang, B.; Bartholomew, C.H.; Alam, T.M.; Woodfield, B.F. Synthesis and characterization of silica doped alumina catalyst support with superior thermal stability and unique pore properties. J. Porous Mater. 2016, 23, 475–487. [Google Scholar] [CrossRef]
  44. Beguin, B.; Garbowski, E.; Primet, M. Stabilization of alumina toward thermal sintering by silicon addition. J. Catal. 1991, 127, 595–604. [Google Scholar] [CrossRef]
  45. Lu, X.; Blawert, C.; Huang, Y.; Ovri, H.; Zheludkevich, M.L.; Kainer, K.U.; Mohedano, M.; Blawert, C.; Matykina, E.; Arrabal, R.; et al. Plasma electrolytic oxidation coatings on Mg alloy with addition of SiO2 particles. Electrochim. Acta 2016, 187, 20–33. [Google Scholar] [CrossRef]
  46. Oh, Y.-J.; Mun, J.-I.; Kim, J.-H. Effects of alloying elements on microstructure and protective properties of Al2O3 coatings formed on aluminum alloy substrates by plasma electrolysis. Surf. Coat. Technol. 2009, 204, 141–148. [Google Scholar] [CrossRef]
  47. Zhang, X.; Wu, Y.; Wang, J.; Xia, X.; Lv, Y.; Cai, G.; Liu, H.; Xiao, J.; Liu, B.; Dong, Z. Microstructure, formation mechanism and antifouling property of multi-layered Cu-incorporated Al2O3 coating fabricated through plasma electrolytic oxidation. Ceram. Int. 2020, 46, 2901–2909. [Google Scholar] [CrossRef]
  48. Li, N.; Yuan, K.; Song, Y.; Cao, J.; Xu, L.; Xu, J. Plasma electrolytic oxidation of Zircaloy-2 alloyin potassium hydroxide/sodium silicateelectrolytes: The effect of silicate concentration. Boletín Sociedad Española Cerámica Vidrio 2021, 60, 328–336. [Google Scholar] [CrossRef]
  49. Ruppi, S. Deposition, microstructure and properties of texture-controlled CVD α-Al2O3 coatings. Int. J. Refract. Met. Hard Mater. 2005, 23, 306–316. [Google Scholar] [CrossRef]
  50. Belozerov, V.; Sobol, O.; Mahatilova, A.; Subbotina, V.; Taha, A.T.; Ubeidulla, F.; Safwan, M. Effect of electrolysis regimes on the structure and properties of coatings on aluminum alloys formed by anode-cathode micro arc oxidation. Mater. Sci. 2018, 1, 43–47. [Google Scholar]
  51. Liu, W.; Bao, A.; Mao, X.; Zheng, G. Microstructure and Properties of Microarc Oxidation Ceramic Coatings on Aluminum Alloy. J. Mater. Sci. 2007, 358, 1895–1898. [Google Scholar]
  52. Khan, R.H.U.U.; Yerokhin, A.; Li, X.; Dong, H.; Matthews, A. Surface characterisation of DC plasma electrolytic oxidation treated 6082 aluminium alloy: Effect of current density and electrolyte concentration. Surf. Coat. Technol. 2010, 205, 1679–1688. [Google Scholar] [CrossRef]
  53. Franco, M.; Anoop, S.; Uma Rani, R.; Sharma, A.K. Porous Layer Characterization of Anodized and Black-Anodized Aluminium by Electrochemical Studies. ISRN Corros. 2012, 2012, 323676. [Google Scholar] [CrossRef]
  54. Xiong, J.; Sarkar, D.K.; Chen, X.G. Superhydrophobic honeycomb-like cobalt stearate thin films on aluminum with excellent anti-corrosion properties. Appl. Surf. Sci. 2017, 407, 361–370. [Google Scholar] [CrossRef]
  55. Shen, D. Electrochemical impedance spectroscopy study on corrosion inhibitor for reinforced concrete. Int. J. Electrochem. Sci. 2017, 12, 4183–4192. [Google Scholar] [CrossRef]
  56. Lee, H.S.; Singh, J.K.; Ismail, M.A. An effective and novel pore sealing agent to enhance the corrosion resistance performance of Al coating in artificial ocean water. Sci. Rep. 2017, 7, 41935. [Google Scholar] [CrossRef] [PubMed]
  57. Tiringer, U.; Durán, A.; Castro, Y.; Milošev, I. Self-Healing Effect of Hybrid Sol-Gel Coatings Based on GPTMS, TEOS, SiO2 Nanoparticles and Ce(NO3)3 Applied on Aluminum Alloy 7075-T6. J. Electrochem. Soc. 2018, 165, C213–C225. [Google Scholar] [CrossRef]
  58. Rao, Y.; Wang, Q.; Oka, D.; Ramachandran, C.S. On the PEO treatment of cold sprayed 7075 aluminum alloy and its effects on mechanical, corrosion and dry sliding wear performances thereof. Surf. Coat. Technol. 2020, 383, 125271. [Google Scholar] [CrossRef]
  59. Atlas, L.M.; Nagao, H.; Nakamura, H.H. Control of Dielectric Constant and Loss in Alumina Ceramics. J. Am. Ceram. Soc. 1963, 46, 196. [Google Scholar] [CrossRef]
  60. Holm, S.; Holm, T.; Martinsen, Ø.G. Simple circuit equivalents for the constant phase element. PLoS ONE 2021, 16, e0248786. [Google Scholar] [CrossRef] [PubMed]
  61. Campos, R.V.B.B.; Bezerra, C.L.; Oliveira, L.N.L.L.; Gouveia, D.X.; Silva, M.A.S.; Sombra, A.S.B. A Study of the Dielectric Properties of Al2O3–TiO2 Composite in the Microwave and RF Regions. J. Electron. Mater. 2015, 44, 4220–4226. [Google Scholar] [CrossRef]
  62. Zhang, Q.L.; Yang, H.; Zou, J.L.; Sun, H.P. Sintering and dielectric properties of Al2O3 ceramics doped by TiO2 and CuO. J. Electroceram. 2007, 18, 225–229. [Google Scholar] [CrossRef]
  63. Johnson, H.W.; Graham, M. High-Speed Digital Design: A Handbook of Black Magic; Prentice Hall: Englewood Cliffs, NJ, USA, 1993; Volume 155, ISBN 0133957241. [Google Scholar]
Figure 1. Voltage-time response curve recorded during the PEO process in the various coating solutions. The attached table presents the slope of different PEO stages. The stages are distinguishable by bullets at the end of stages II and III.
Coatings 12 00033 g001
Figure 2. SEM images of surfaces and cross-sections of the PEO coated specimens: (a,a′)-S0K2, (b,b′)-S2K2, (c,c′)-S3K2, (d,d′)-S4K2, (e,e′)-S5K2. Inserted values in the cross-section images are thickness, T.
Coatings 12 00033 g002
Figure 3. SEM images of surfaces and cross-sections of the PEO coated specimens: (a,a′)-S3K1, (b,b′)-S3K3. Inserted values in the cross-section images are thickness, T.
Coatings 12 00033 g003
Figure 4. SEM image and elemental map on the surface of S3K1 specimen.
Coatings 12 00033 g004
Figure 5. Elemental map on the cross-section of the PEO specimens prepared from coating solutions containing different concentrations of SMS and KOH.
Coatings 12 00033 g005
Figure 6. (a) XRD patterns of the Al 7075 substrate and the PEO coatings. γ, and α symbols are related to γ-Al2O3, and α-Al2O3, respectively. (b) shows the magnified (400) and (113) peaks of γ-Al2O3 and α-Al2O3, respectively, related to S3K1, S3K2, and S3K3 specimens.
Coatings 12 00033 g006
Figure 7. (a) Bode magnitude of impedance and (b) Bode phase plots of the PEO coatings prepared from coating solutions containing different concentrations of SMS recorded after 24 h immersion in 3.5 wt.% NaCl solution at pH 4.
Coatings 12 00033 g007
Figure 8. Equivalent circuits used for the impedance response fitting: (a) for S0K2 specimen, and (b) for S2K2, S3K2, S4K2, and S5K2 specimens.
Coatings 12 00033 g008
Figure 9. (a) Bode magnitude of impedance and (b) Bode phase plots of the PEO coatings prepared from coating solutions containing different concentrations of KOH recorded after 24 h immersion in 3.5 wt.% NaCl solution at pH 4.
Coatings 12 00033 g009
Table 1. Specimens codes, and composition, pH and conductivity of the coating solutions.
Specimen CodeSMS (g L−1)PTO (g L−1)KOH (g L−1)pHConductivity (mS cm−1)
S0K203211.374.82
S2K223212.017.15
S3K233212.138.20
S4K243212.229.19
S5K253212.2810.20
S3K133111.765.52
S3K333312.38.37
Table 2. EDS results of the PEO coatings prepared in different coating solutions.
Sample Code
% at.
S0K2S2K2S3K2S4K2S5K2S3K1S3K3
O45.441.252.643.242.14337
Na0.031.7522.42.81.22.7
Mg0.40.660.60.870.70.690.54
Al42.834.5628.131.527.735.232.9
Si-10.948.314.318.211.318.7
K0.021.541.92.4315.3
Ti10.79.36.45.35.37.78.8
Table 3. Fitting results of EIS analysis for the PEO coatings prepared from the coating solutions containing different concentrations of SMS after 24 h immersion in 3.5 wt.% NaCl solution at pH 4.
SamplesRs
(Ω cm2)
Rpore/out
(kΩ cm2)
CPEc/out
(µF s−1 cm−2)
n1Rct/in
(MΩ cm2)
CPEdl/in
(µF s−1 cm−2)
n2
S0K250 ± 170.02 ± 0.010.05 ± 0.011.00 ± 0.100.20 ± 0.19.30 ± 4.30.58 ± 0.12
S2K244 ± 146.2 ± 2.10.80 ± 0.300.70 ± 0.001.30 ± 0.151.10 ± 0.780.60 ± 0.14
S3K241 ± 1849.2 ± 22.80.17 ± 0.020.80 ± 0.0010.00 ± 0.561.53 ± 0.760.64 ± 0.04
S4K242 ± 84.3 ± 1.10.77 ± 0.410.74 ± 0.041.73 ± 0.262.77 ± 0.120.66 ± 0.04
S5K28 ± 383.5 ± 1.40.75 ± 0.400.70 ± 0.072.00 ± 1.052.30 ± 0.780.60 ± 0.07
Table 4. Fitting results of EIS analysis for the PEO coatings prepared from the coating solutions containing different concentrations of KOH after 24 h immersion in 3.5 wt.% NaCl solution at pH 4.
SamplesRs
(Ω cm2)
Rpore
(kΩ cm2)
CPEc
(µF s−1 cm−2)
n1Rct
(MΩ cm2)
CPEdl
(µF s−1 cm−2)
n2
S3K131 ± 241.9 ± 2.40.37 ± 0.080.78 ± 0.060.80 ± 0.051.40 ± 0.100.58 ± 0.06
S3K399 ± 5231.8 ± 5.00.45 ± 0.100.76 ± 0.010.65 ± 0.201.60 ± 0.350.68 ± 0.06
Publisher’s Note: MDPI stays neutral with regard to jurisdictional claims in published maps and institutional affiliations.

