Article

Corrosion Resistance of a Plasma-Oxidized Ti6Al4V Alloy for Dental Applications

by
N. Velazquez-Torres
1,
J. Porcayo-Calderon
2,
H. Martinez-Valencia
3,
R. Lopes-Cecenes
4,
I. Rosales-Cadena
1,
E. Sarmiento-Bustos
5,
C. I. Rocabruno-Valdés
1 and
J. G. Gonzalez-Rodriguez
1,*
1
Center for Research in Engineering and Applied Sciences, Autonomous University of the State of Morelos, Cuernavaca 62209, Mexico
2
Department of Chemical Engineering and Metallurgy, University of Sonora, Hermosillo 83000, Mexico
3
Institute of Physics, National Autonomous University of Mexico, Cuernavaca 62209, Mexico
4
Faculty of Chemical Sciences and Engineering, Autonomous University of the State of Morelos, Cuernavaca 62209, Mexico
5
Division of Industrial Mechanics, Emiliano Zapata Technological University of the State of Morelos, Emiliano Zapata 62565, Mexico
*
Author to whom correspondence should be addressed.
Coatings 2021, 11(9), 1136; https://doi.org/10.3390/coatings11091136
Submission received: 4 August 2021 / Revised: 7 September 2021 / Accepted: 12 September 2021 / Published: 18 September 2021
(This article belongs to the Section Corrosion, Wear and Erosion)

Abstract

:
A Ti6Al4V alloy was plasma-oxidized at 600 °C during 1, 2, 3, 5 and 8 h and corroded in an artificial saliva solution. Electrochemical evaluation was performed by using potentiodynamic polarization curves, linear polarization resistance (LPR), and electrochemical impedance spectroscopy (EIS) measurements during 100 h. Corroded specimens were characterized by using Raman spectroscopy and scanning electronic microscopy (SEM). All tests indicated that the highest corrosion resistance was obtained for specimen oxidized during 3 h since the noblest free corrosion potential, lowest passive and corrosion current density values, as well as the highest polarization resistance values were obtained under these circumstances. EIS measurements indicated that the highest impedance and phase angle values obtained for this specimen exhibited a high capacitive behavior typical of a very compact passive film.

1. Introduction

Titanium alloys are widely used in the biomedical, aerospace, food processing, and petrochemical industries because of their exceptional properties, such as good corrosion resistance, specific strength, and high temperature stability [1]. The combination of properties such as high specific strength, excellent resistance to corrosion in a good number of industrial environments, and biocompatibility have made titanium alloys very attractive to applications other than the aerospace industries [2,3,4,5,6,7,8]. Among Ti alloys, one of the most remarkable alloys is Ti6Al4V, which is especially useful as an implant material, including dental implants, in the health sector [9,10,11,12,13,14]. The corrosion and oxidation resistance of this alloy is based on the development on their surface of a mixture of TiO2 and Al2O3 oxides [15,16,17], which provide a very stable passive layer and protect the alloy against the corrosive action of substances in the environment, such as chlorides, sulphates, and acids, among others [18,19,20,21]. However, that corrosion resistance is lowered when aggressive ions such as chloride are present, which makes these alloys highly susceptible to a localized type of corrosion such as pitting. Since corrosion resistance is related to the metal surface properties, one of the ways to improve this property is by altering the alloy surface characteristics.
Among the different ways to improve the surface properties, some of the most commonly used methods involve altering the alloying chemical composition, heat treatments chemical vapor deposition (CVD), physical vapor deposition (PVD), ion implantation, sol–gel coating, anodic oxidation, laser treatment, pack cementation, etc., [22,23,24,25,26,27,28,29,30,31,32,33]. Plasma spray technology has been used to apply coatings on Ti-base alloys to improve their corrosion resistance [34,35]. The use of ions implantation such as oxygen or nitrogen by plasma has been used to improve both wear and corrosion resistance of metals. Thus, Zhang et al. [36] evaluated the corrosion resistance of plasma gas nitride nanocrystalline Inconel 718, finding that both wear and corrosion resistance properties were improved. In a similar work [37], Lee et al. pre-oxidized and nitrided a 430-type stainless steel in a plasma gas, and found that its corrosion resistance and wear properties in 0.5 M H2SO4 solution were improved with these surface treatments. Li et al. [38] evaluated the wear and corrosion properties of an active screen plasma nitride 420-type stainless steel in a temperature range 440–520 °C. They found that the nitrides layer thickness increased with increasing the temperature, improving its wear resistance, hardness, and corrosion resistance. Alphonsa et al. [39] improved the wear and corrosion resistance of 2205 duplex stainless steel by nitriding and nitro-carburizing it in a plasma gas in temperatures ranging from 350–500 °C during 4 h, finding that the best properties were reached by treating the steel at 400 °C, and these properties were decreased by increasing treating temperature.
In the particular case of Ti4Al4V alloy, some ways to modify its surface to improve its corrosion resistance include, for instance, the plasma spray [40], the double-glow plasma [41], electrophoretic deposition [42], dip coating [43], and plasma electrolytic oxidation methods [44]. In the latter, a TiO2 coating was developed by plasma electrolytic oxidation in nitrate salt. The surface morphology, phase composition, hydrophobicity, and the effects of process current frequency were examined. Thin titanium oxide, rutile and anatase, coating of 2–2.5 μm was formed on the treated Ti6Al4V alloys. The potentiodynamic polarization test evaluated the highest polarization resistance for the alloy obtained using current frequency of 150 Hz, which was 364 × 104 ohm cm2, in comparison with the pristine alloy, which was 6.93 × 10⁴ ohm cm2. Electrochemical impedance spectroscopy revealed the same behaviour. Morphology evaluation revealed that the structure of this coating contained uniform submicron porosity and its surface exhibited the highest hydrophobicity. Additionally, Cao et al. [17] used thermal oxidation, whereas Öteyaka [32] used cryogenic treatments. Cotolan [33] produced a TiO2 layer by anodizing a Ti6Al4Nb alloy in sulfuric and acetic acids, corroding them in Hank’s solution, and found better properties in the ones anodized in acetic acid. However, the use of ions implantation such as oxygen by plasma to produce oxides on the Ti6Al4V alloy has not been reported; thus, the goal of this research work is to evaluate the corrosion resistance of a plasma-oxidized Ti6Al4V alloy in artificial saliva. Even when Ti6Al4V is still used as biomedical material, in many applications V element is considered by more and more researchers as a dangerous element to human body; however, it is expected that the deposited oxide layer will decrease the V ions release in to human environment and decrease the risk for toxicity.

2. Experimental Procedure

2.1. Testing Material

For the present research work, a commercial Ti6Al4V alloy obtained from Erfahrung im Bereich der Werkstofftechnik, in Dusseldorf, Germany, containing (wt.%) 6.1 Al-4.1 V-0.07 C-0.25 Fe-0.05 N and, as balance, Ti, was used.

2.2. Plasma Oxidation

Material used for this work included a commercial Ti6Al4V bar alloy. Specimens measuring 12.2 mm in diameter and 3.0 mm in height were used. They were oxidized at vacuum, using a plasma with oxygen 99.9% using a current of 5 mA, equivalent to a temperature of 600 °C, during 1, 2, 3, 5, and 8 h. After this, they were encapsulated in commercial polymeric resin, abraded with 600 grade emery paper, and rinsed with acetone. They were analyzed in a low-vacuum scanning electronic microscope (SEM; LEO VP 1450, Mexico City, Mexico) and Senterra model Raman equipment from Bruker (Mexico City, Mexico). By using the SEM, we obtained information about the morphology and thickness of produced oxides, whereas Raman spectroscopy provided the oxides chemical composition and their different crystalline phases.

2.3. Testing Solution

The testing electrolyte used to simulate artificial saliva was the Fusayama solution composed of (g/L) 0.4 NaCl, (Baker, Mexico City, Mexico), 0.4 KCl, (Baker), 0.795 CaCl2 2H2O, (Baker), 0.005 Na2S 9H2O, (Baker), 0.69 NaH2PO4 2H2O, (Baker), and 1.0 Urea, (Baker). Tests were performed at 37 °C by using a water bath during 100 h.

2.4. Electrochemical Techniques

Potentiodynamic polarization curves, linear polarization resistance (LPR), and electrochemical impedance spectroscopy (EIS) were the employed electrochemical techniques. For this, a normally aerated three-electrodes electrochemical cell (Gamry Instruments, Queretaro, Mexico) was used, using a saturated calomel and a graphite rod as reference and auxiliary electrodes, respectively. Before starting the tests, a time of 20 min was given for the free corrosion potential value, Ecorr, to be stable. Monitoring of the Ecorr value was done during the whole testing time. For this, a potentiostat from ACM Instruments (ACM Instruments, Cumbria, UK) was used. Once the Ecorr value reached a steady state value, polarization curves were started by cathodically polarizing the specimen at 500 mV more cathodic than the Ecorr value, and these swept in to the anodic direction at a sweep rate of 1 mV/s, ending at a potential value 1000 mV more anodic than Ecorr. For the LPR experiments, specimen was polarized ±15 mV around the Ecorr value at a sweep rate of 1 mV/s every 2.5 h during 100 h. Finally, EIS measurements were performed at the Ecorr value by applying a signal amplitude ±15 mV peak-to-peak in the frequency interval of 0.01–100,000 Hz.

3. Results and Discussion

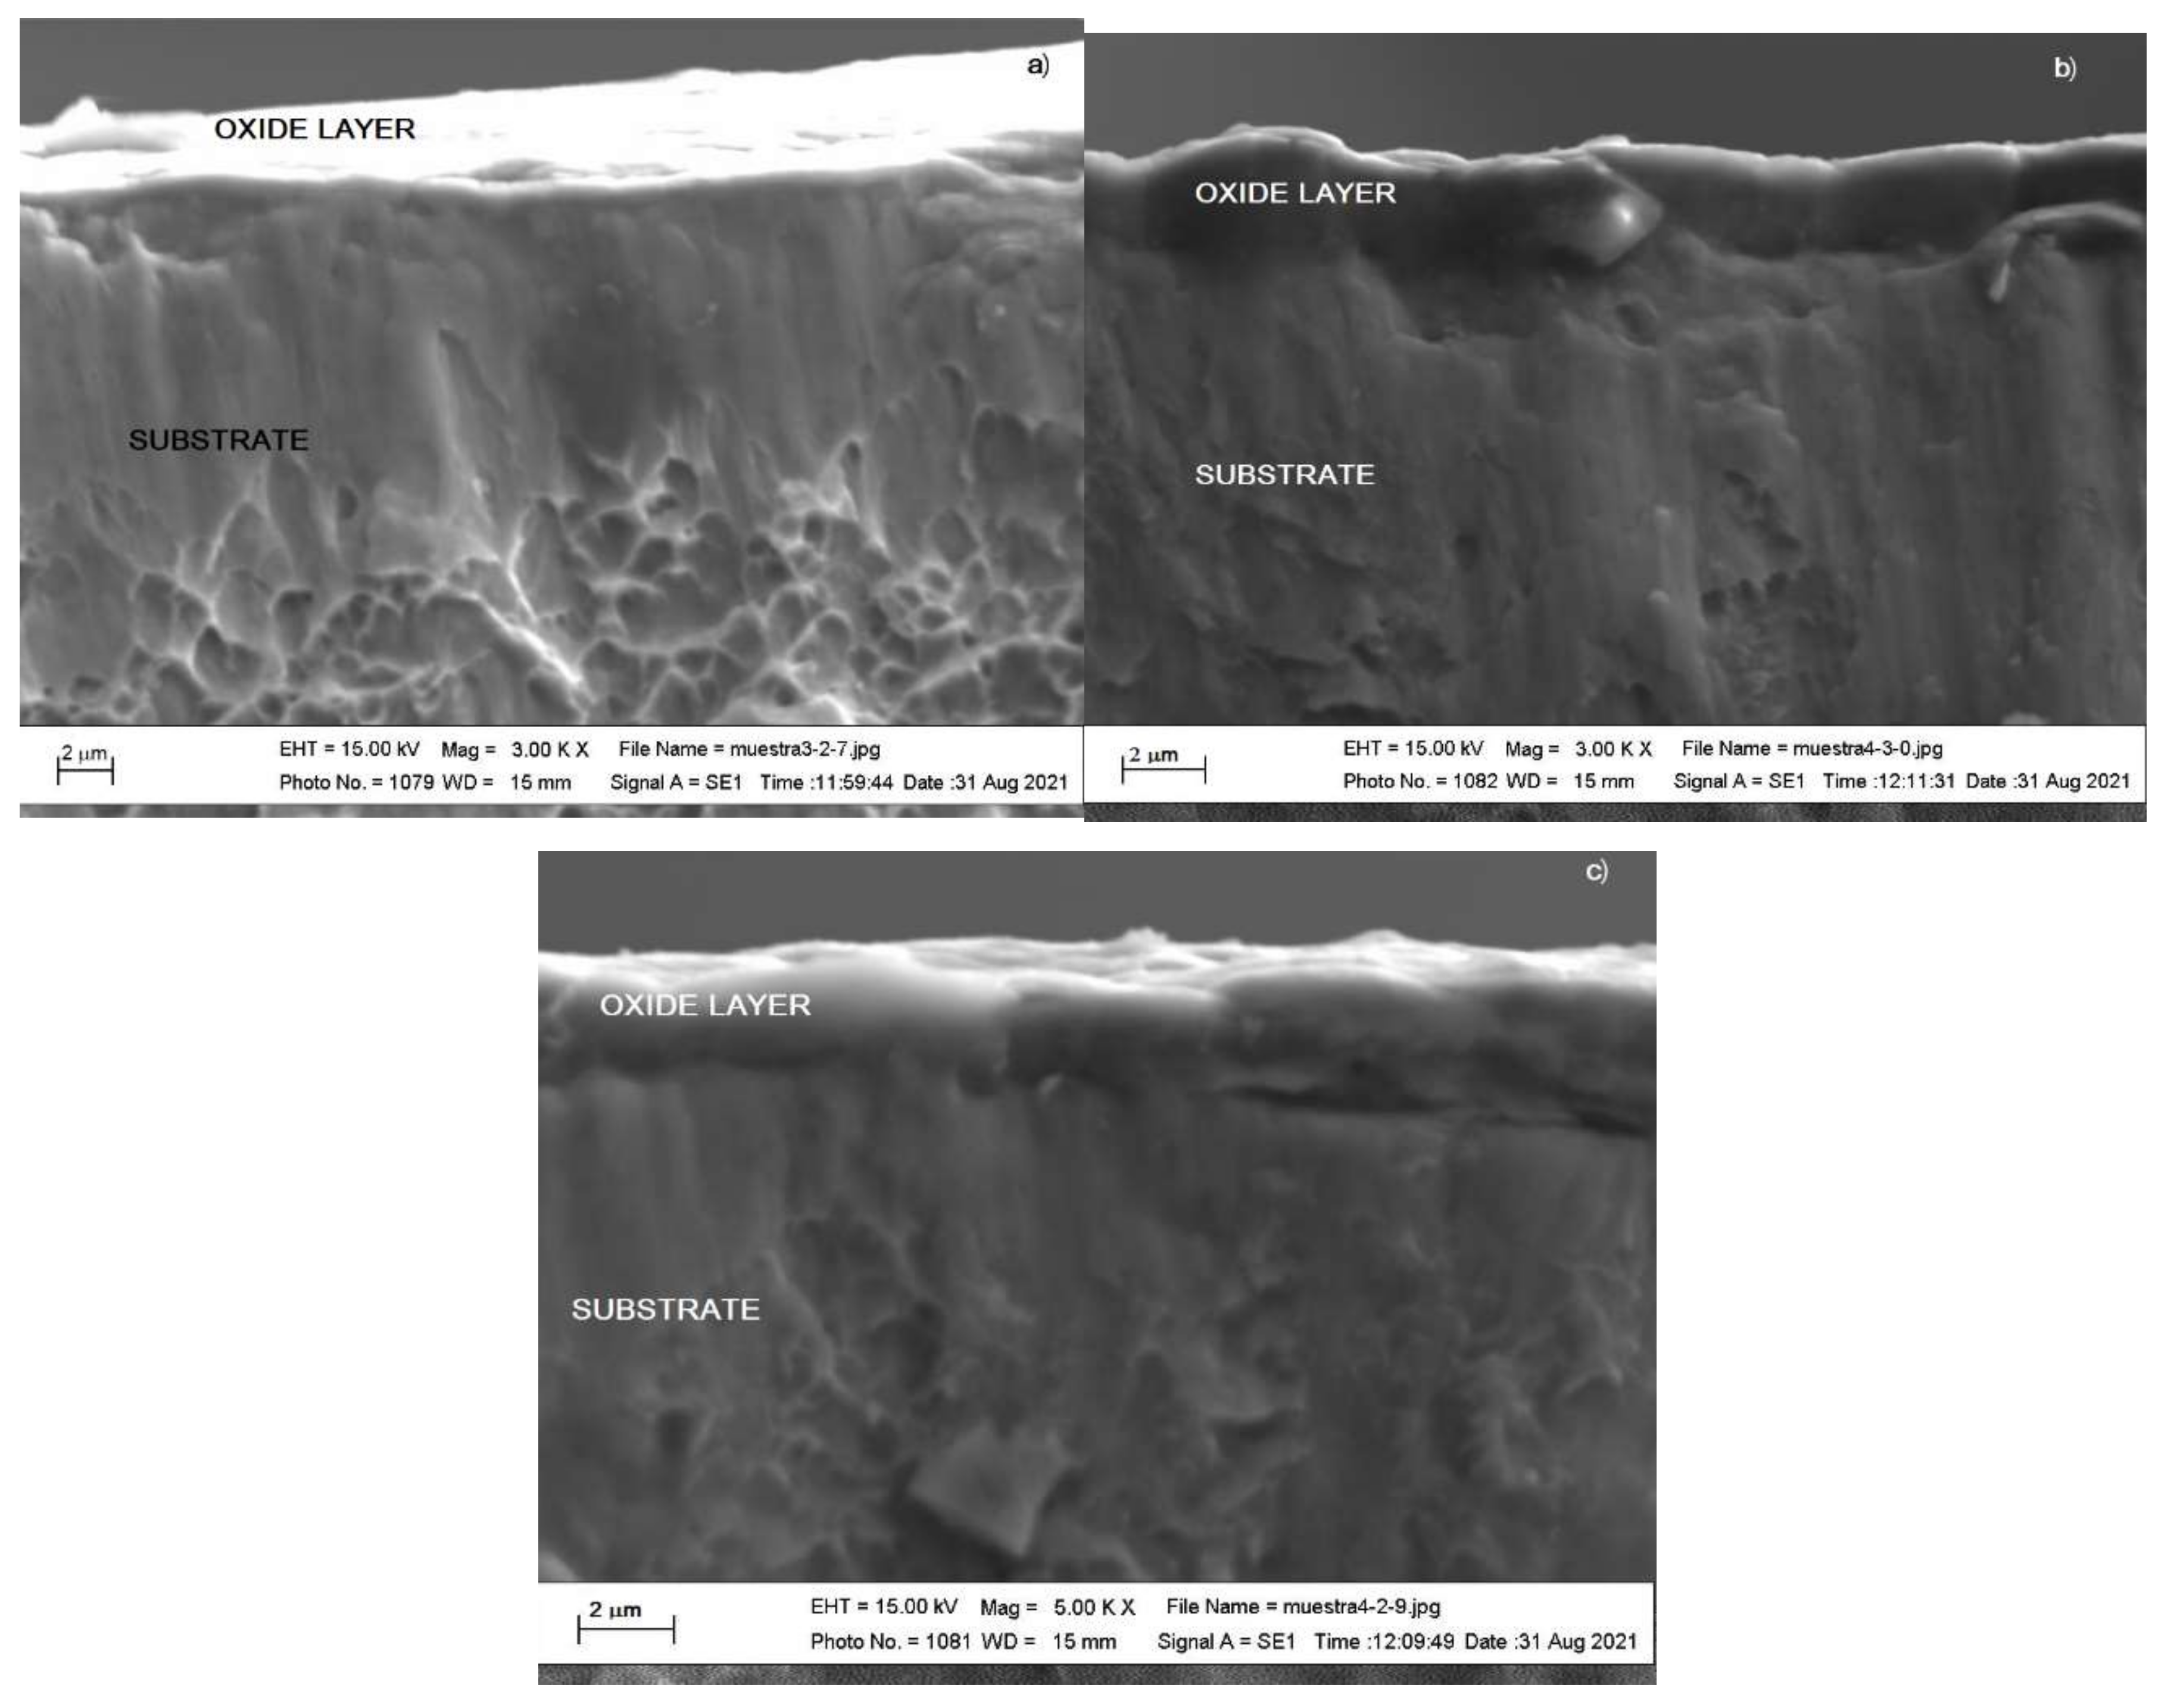
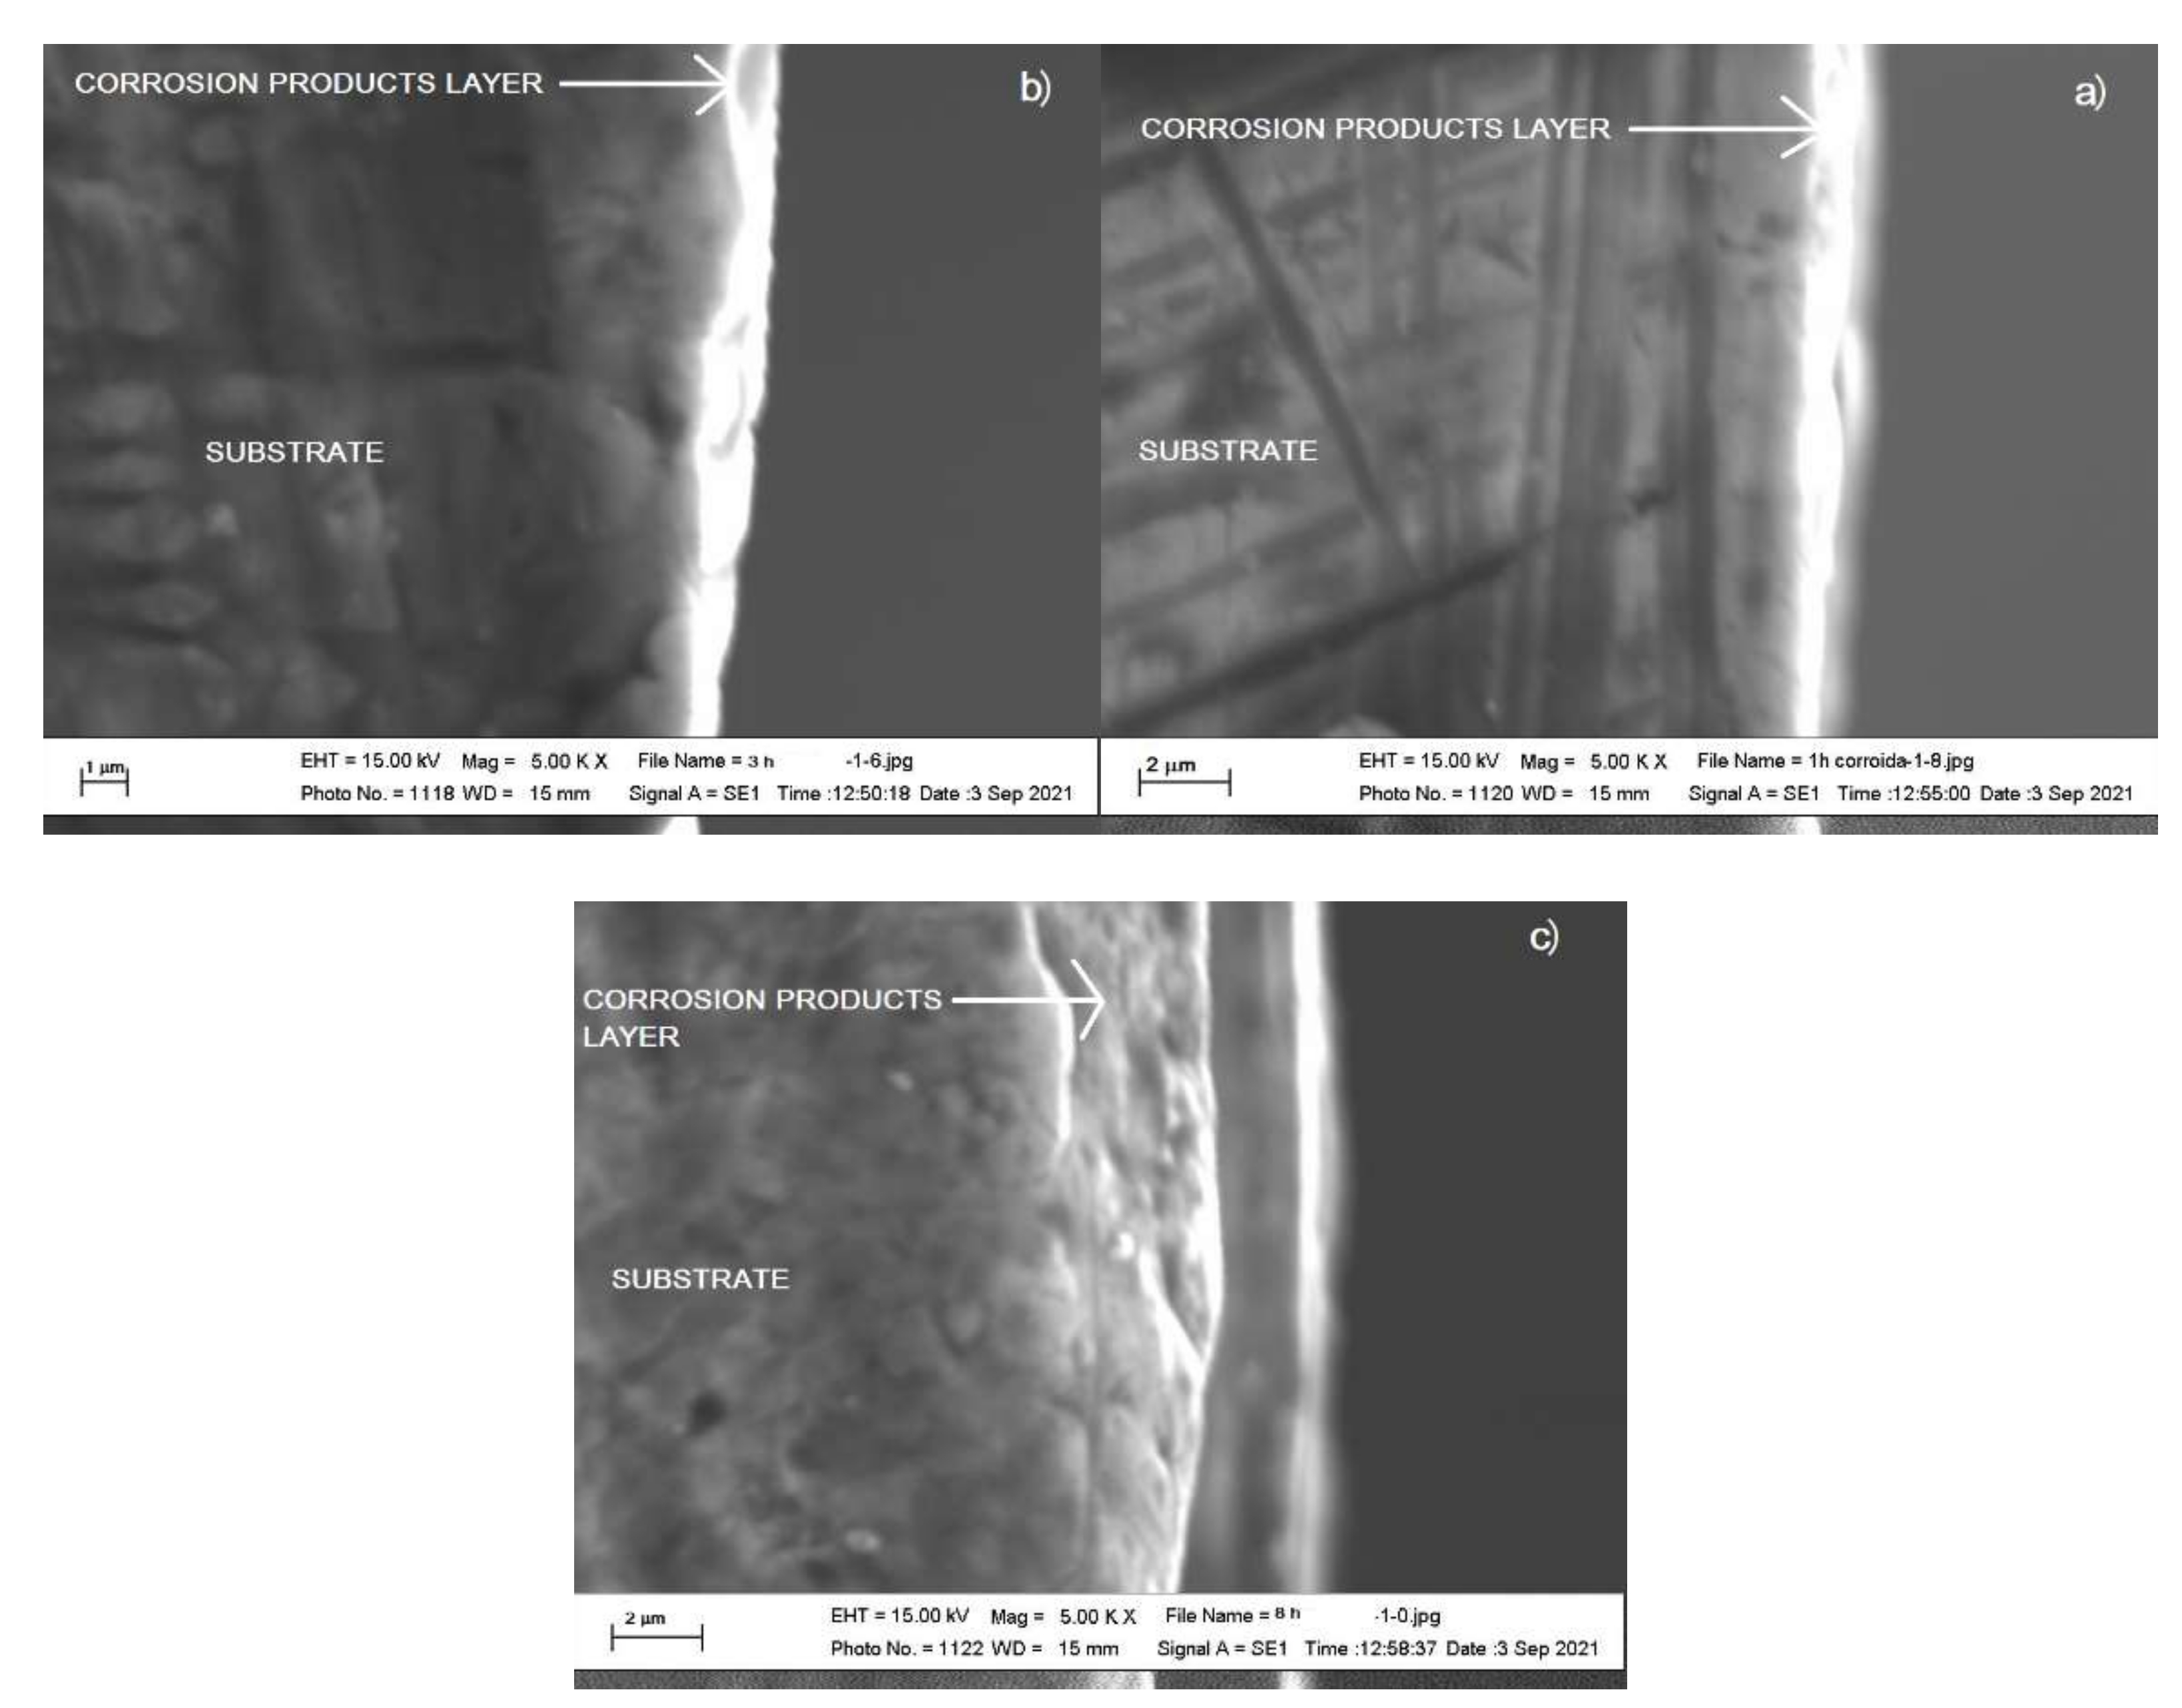
3.1. SEM Micrographs

Micrographs showing cross sections of plasma-oxidized Ti6Al4V alloys during 1, 3, and 6 h are shown in Figure 1. It is important to say that in order to obtain these micrographs, specimens were introduced into liquid nitrogen and then they were fractured. Porous dimples are observed as result of plastic deformation during specimen fracture. Figure 1 shows that specimen oxidized during 1 h shows a continuous oxide layer less than 2.00 μm in thickness, and as the oxidation time increases, the oxide layer thickness increases also, reaching a thickness around 3.0 μm for specimen oxidized during 3 h. For specimen oxidized during 8 h, a nonuniform oxide layer less than 2.0 mm in thickness was obtained, which can affect the alloy corrosion resistance. Similar coating thicknesses were obtained in the TiO2 deposition using the plasma electrolytic oxidation method [44].

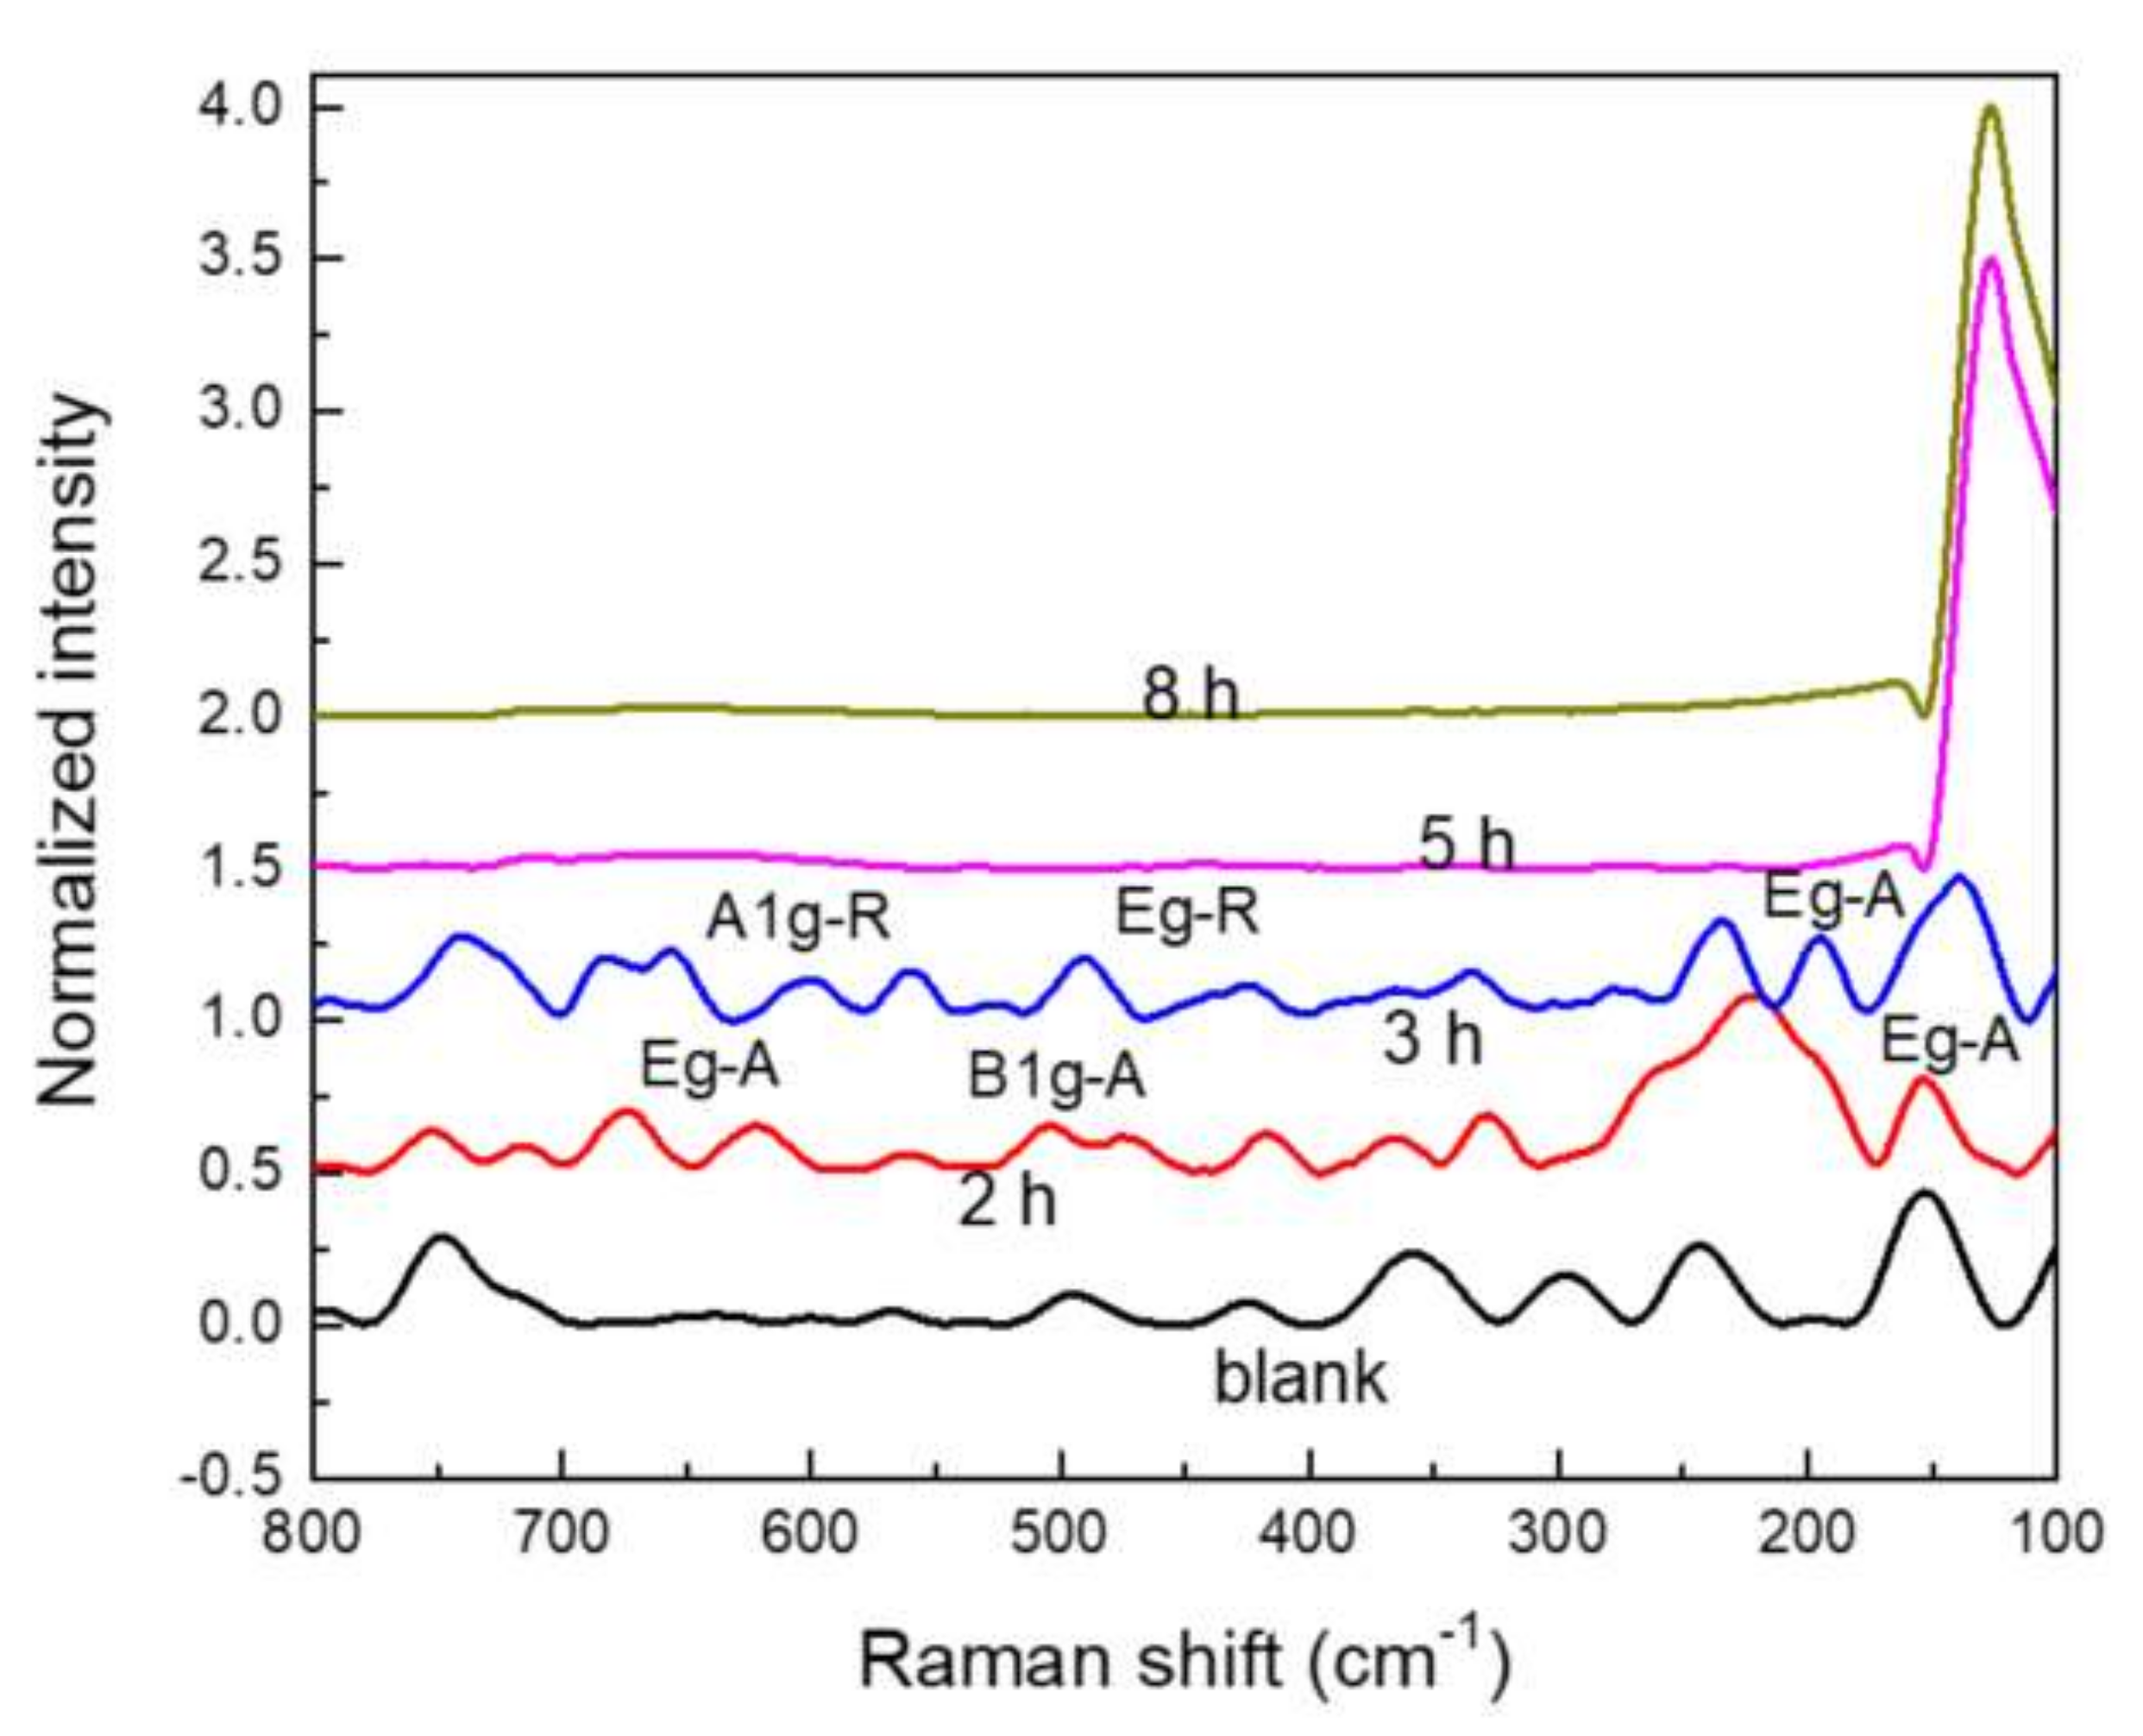
3.2. Raman Spectroscopy Characterization

Raman spectra for the plasma-oxidized specimens at different times are shown in Figure 2. For the blank, specimen without plasma oxidation, the observed signal at 416 cm−1 corresponds to the air-formed Al2O3 oxide due to the high Al reactivity with the oxygen from the air. For specimen oxidized during 2 h, there is a layer of disordered titanium oxide, TiO2 [40], corresponding to the Brookite phase with a tendency to the formation of the anatase (A) phase for the vibration modes Eg-A at 142 and 195 cm−1. Vibration mode Eg-A at 634 cm−1 can be observed to be shifted at 626 cm−1, whereas vibration modes A1g-A and B1g-A can be observed as a doublet at 513–518 cm−1, and it can be observed at 506 cm−1 also. For specimen oxidized during 3 h, the well-defined signals for the anatase (A) and rutile (R) phases can be observed. The high-frequency vibrating modes decrease, which indicates an increase in the ordered phases, mainly Eg-A vibrating modes at 142 cm−1, which corresponds to the anatase phase. Rutile phase can be observed also at the A1g-R vibrating mode at 609 cm−1, as well as the Eg vibrating mode at 440 cm−1 [41,42]. An observed wide band at 234 cm−1 corresponds to the multiphonon process, described by some authors as a transition phase [43], which can be observed on the specimen oxidized during 2 h also. For specimens oxidized during 5 and 8 h, no peaks corresponding to any oxide were observed, maybe because the plasma destroyed them, and only the lattice vibrating modes at 120 cm−1, which correspond to the alloy crystalline structure, were observed.

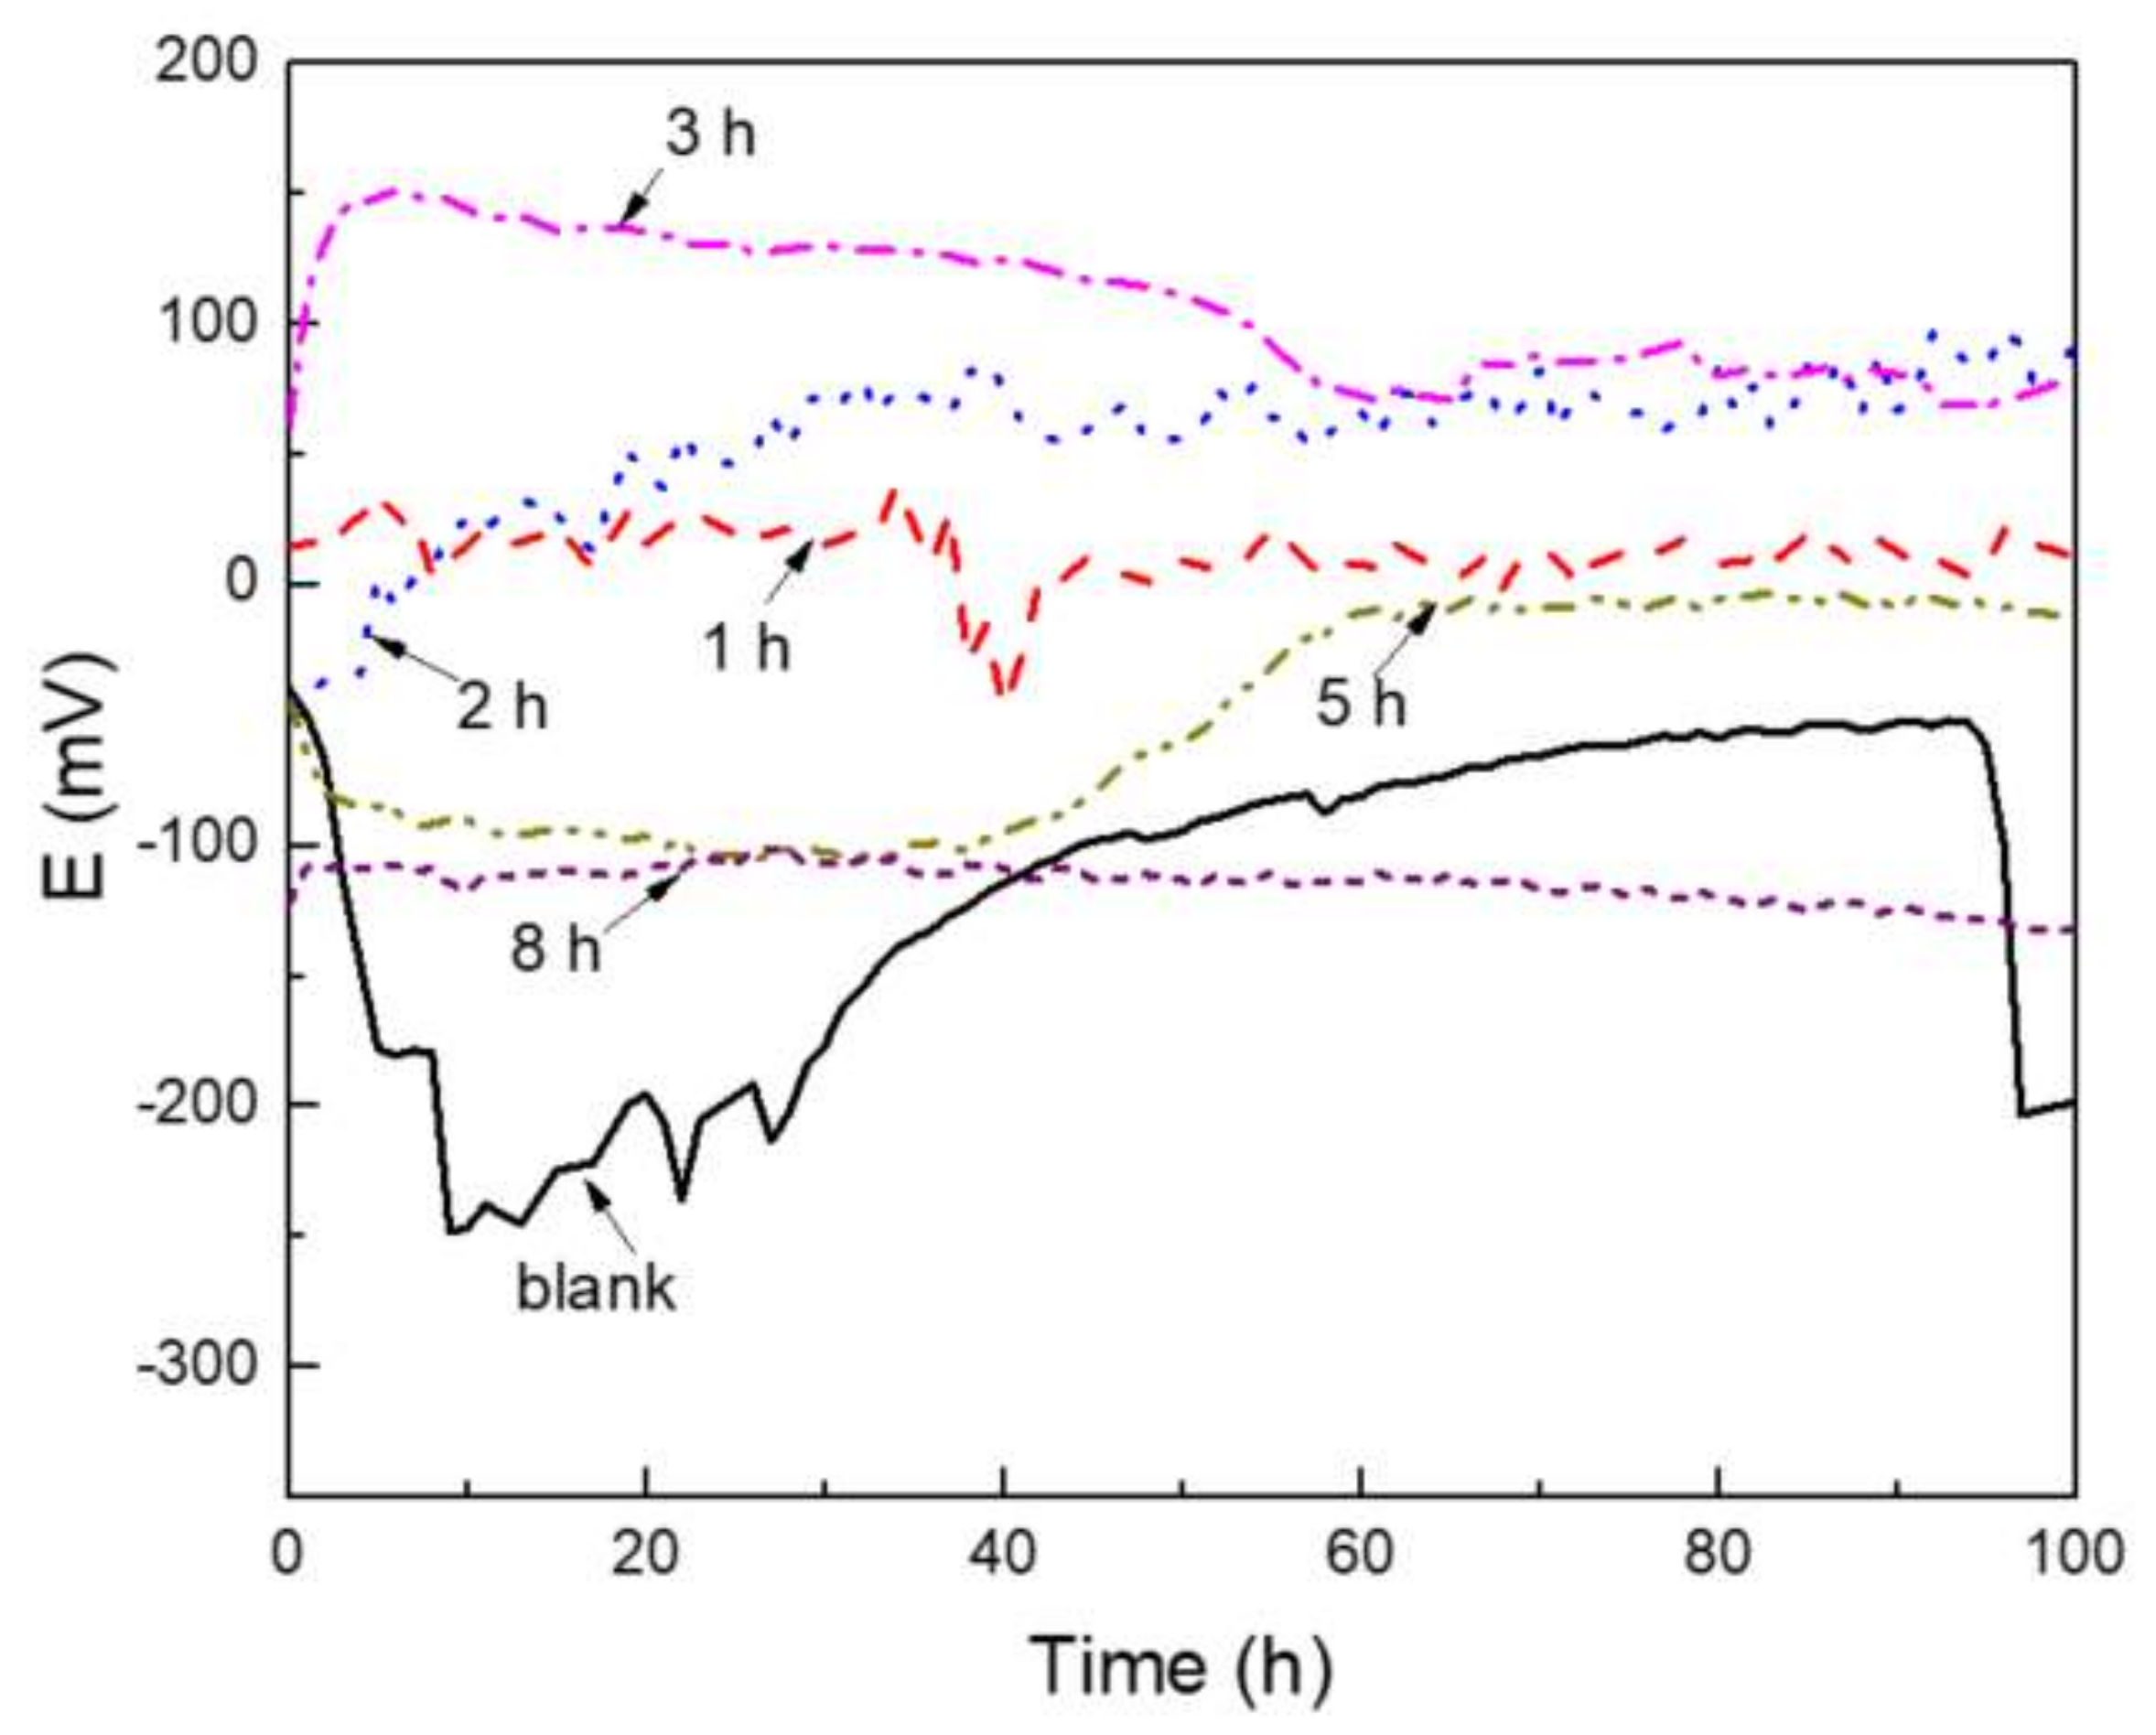
3.3. Free Corrosion Potential

The change in the Ecorr value with time in artificial saliva solution for the plasma-oxidized specimens at different times is shown in Figure 3. For the blank, specimen that was not oxidized, the Ecorr value starts in a value around −50 mV but it rapidly shifts towards more active values during the first 10 h of testing. After this time, it shifts in the opposite direction, going towards nobler values.
Öteyaka [32] reported Ecorr values between −250 and −50 mV for the same alloy but under different cryogenic heat treatments in a 0.9 M NaCl solution, whereas Lin [45] reported values between −300 and 50 mV in a Hank’s solution. Bodunrin [46] reported values between −400 and −100 mV but in a 3.5% NaCl solution. Finally, de Assis [47] reported a very stable value of 50 mV in a Hank’s solution during 60 h of testing; thus, the values reported here are similar to those reported in the literature. The shift towards more active values at the beginning of the experiment is due to the dissolution of any pre-formed protective TiO2 or Al2O3 oxides layer, whereas the shift towards nobler values is due to the establishment of protective oxides [15,16,17] and to the thickening of the oxide film improving its corrosion protection ability.
As the oxidation time increases up to 3 h, the Ecorr value shifts towards nobler values, which indicates a tendency to increase the alloy corrosion resistance. The steady state Ecorr values for the specimens oxidized during 1 h and 2 h were very close to 10 and 80 mV, respectively; specimen oxidized during 3 h started with an Ecorr value of 100 mV, but it rapidly shifted towards nobler values, very close to 150 mV, and it started to shift in a very slow fashion towards slightly more active values, reaching a steady state value of 80 mV, very close to the value obtained for specimen oxidized during 2 h. Thus, it seems that specimen oxidized during 3 h developed a much more stable protective oxide layer and it was the least susceptible to corrosion. As explained above, the shift in the noble direction is due to the formation of protective oxides, whereas the shift towards more active values is due to the dissolution of any protective oxide layer [44]. As the oxidation time increased up to 5 h or 8 h, the Ecorr values became more active, reaching the most active value for specimen oxidized during 8 h, which made this specimen the most susceptible to be corroded. As shown by the Raman spectroscopy spectra given in Figure 1, specimens oxidized during 5 h and 8 h, did not show evidence of any protective oxide layer, explaining why they exhibited the most active Ecorr values.

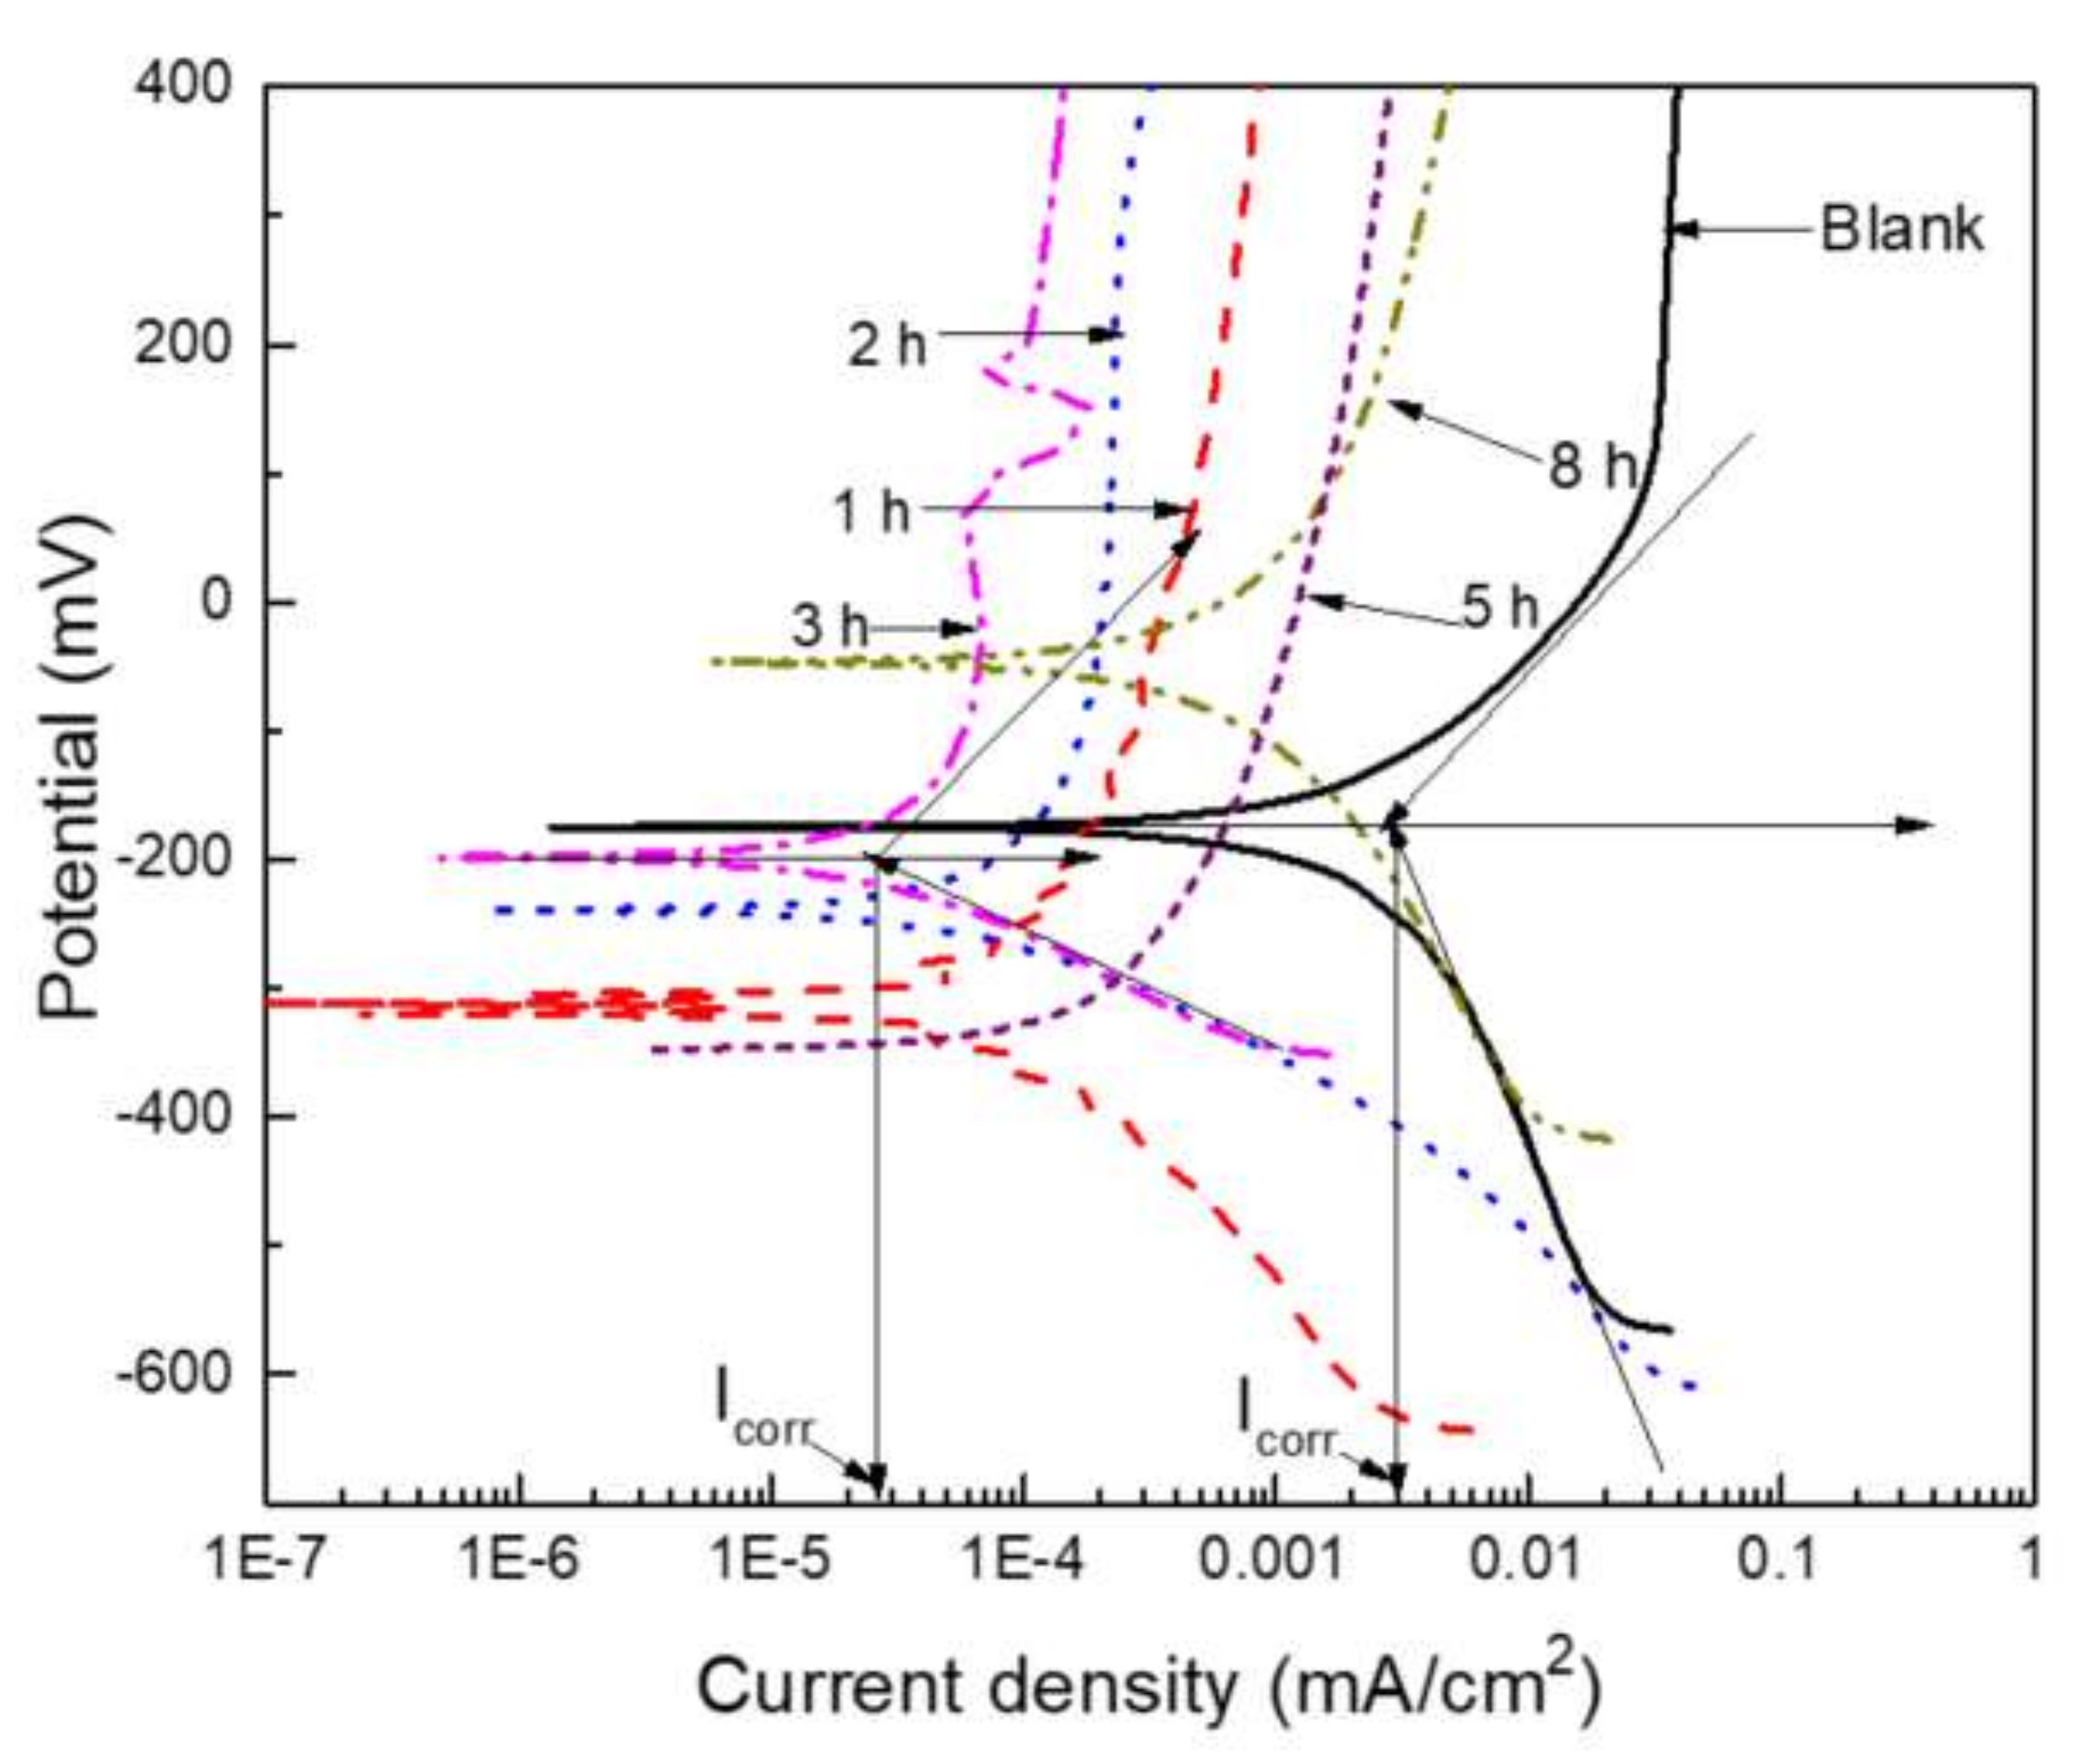
3.4. Potentiodynamic Polarization Curves

The effect of oxidation time on the polarization curves for the Ti6Al4V alloy corroded in artificial saliva solution is given in Figure 4, whereas their electrochemical parameters are given in Table 1. This figure shows schematically how the Tafel extrapolation method was used to calculate the corrosion current density value, Icorr, for the blank and specimen oxidized during 3 h. The Ecorr values determined from the polarization curves are significantly lower than those obtained from the open circuit potential measurements. This is expected, as the polarization tests were started at a cathodic potential relative to the corrosion potential, so that the passive film at the surface was at least partially removed due to the highly reducing initial potentials.
For untreated alloy, data exhibited the presence of only one passive zone, which extends over the whole tested potential interval without evidence of a pitting potential value, Epit, similar to that reported in the literature [18,19,20,21,32,45,46] interval where the passive current density, Ipas, remained more or less constant. Alloy Ti6Al4V can generate passive films containing Ti2O3, TiO (anatase), and TiO2 (rutile). Additionally, main alloying elements such as Al and vanadium (V) can also be found as Al2O3 and V2O3 in the oxide layer [48]. For specimens oxidized during 1 h and 3 h, there was a second passive layer formed at 415 mV in addition to the initially formed passive zone; however, for the later, an additional passive layer seemed to be formed at 185 mV. Corrosion current density value, Icorr, decreased as the oxidation time increased, reaching a lowest value for specimen oxidized during 3 h, as can be seen in Table 1. For higher oxidation times, an increase in the Icorr value was observed.
There was a similar trend with the passive current density value, Ipas, since the lowest value was obtained for specimen oxidized during 3 h, and this value increased for lower or higher oxidation times. De Assis [47] reported an Ipas value of 3.5 μA/cm2 in a Hank’s solution, equal to that reported by Cao [17] for a thermally oxidized Ti6AL4V alloy in 0.9% NaCl solution, very close to the value observed in this work for the untreated blank alloy. Unlike the effect of the oxidation time on the Ipas value, there was no relationship between the former and the pitting potential value, Epit, as shown in Table 1, where the highest Epit value was obtained for specimen oxidized during 1 h and 8 h, specimens that exhibited two of the highest Ipas values. Thus, it can be concluded that the best corrosion performance was obtained for specimen oxidized during 3 h, and that lower or higher times of oxidation were detrimental on the alloy corrosion resistance.

3.5. Linear Polarization Resistance

In order to have a better idea of the change on the alloy corrosion resistance with time, and taking into account that the corrosion current density value is inversely proportional to the polarization resistance value, Rp, through the Stern–Geary equation:
I corr = K / R p
where K is a constant, linear polarization resistance, experiments were carried out. The changes in the Rp value with time for the Ti6Al4V alloy oxidized at different times and corroded in artificial saliva solution are given in Figure 5.
This figure, Figure 5, clearly shows that the specimen that was not plasma-oxidized (blank) or those oxidized during 1 h and 8 h exhibited the lowest Rp values, and thus, the highest Icorr values. On the other hand, specimen oxidized during 2 h and 3 h had the best corrosion performance, since the alloy exhibited the highest Rp values at these oxidizing times, in agreement with the results obtained from polarization curves. During the first 15 h of testing, specimen oxidized during 3 h exhibited the highest Rp value, but after 15 h, the Rp value started to decrease, probably to the dissolution of the protective oxides, and after 30 h of testing, the obtained Rp value was lower than that obtained for specimen oxidized during 2 h. Specimen oxidized during 2 h exhibited an Rp value very stable with time, and remained constant during the whole test, indicating that oxides produced on this specimen were more stable than those produced for specimen oxidized during 3 h. For specimen oxidized during 5 h, the Rp value increased monotonically with time, probably due to establishment of more protective oxides. This way, LPR experiments confirm the results found in the polarization curves, i.e., the best corrosion resistance is found with specimen oxidized during 3 h; lower or higher oxidation times reduce the alloy corrosion resistance.

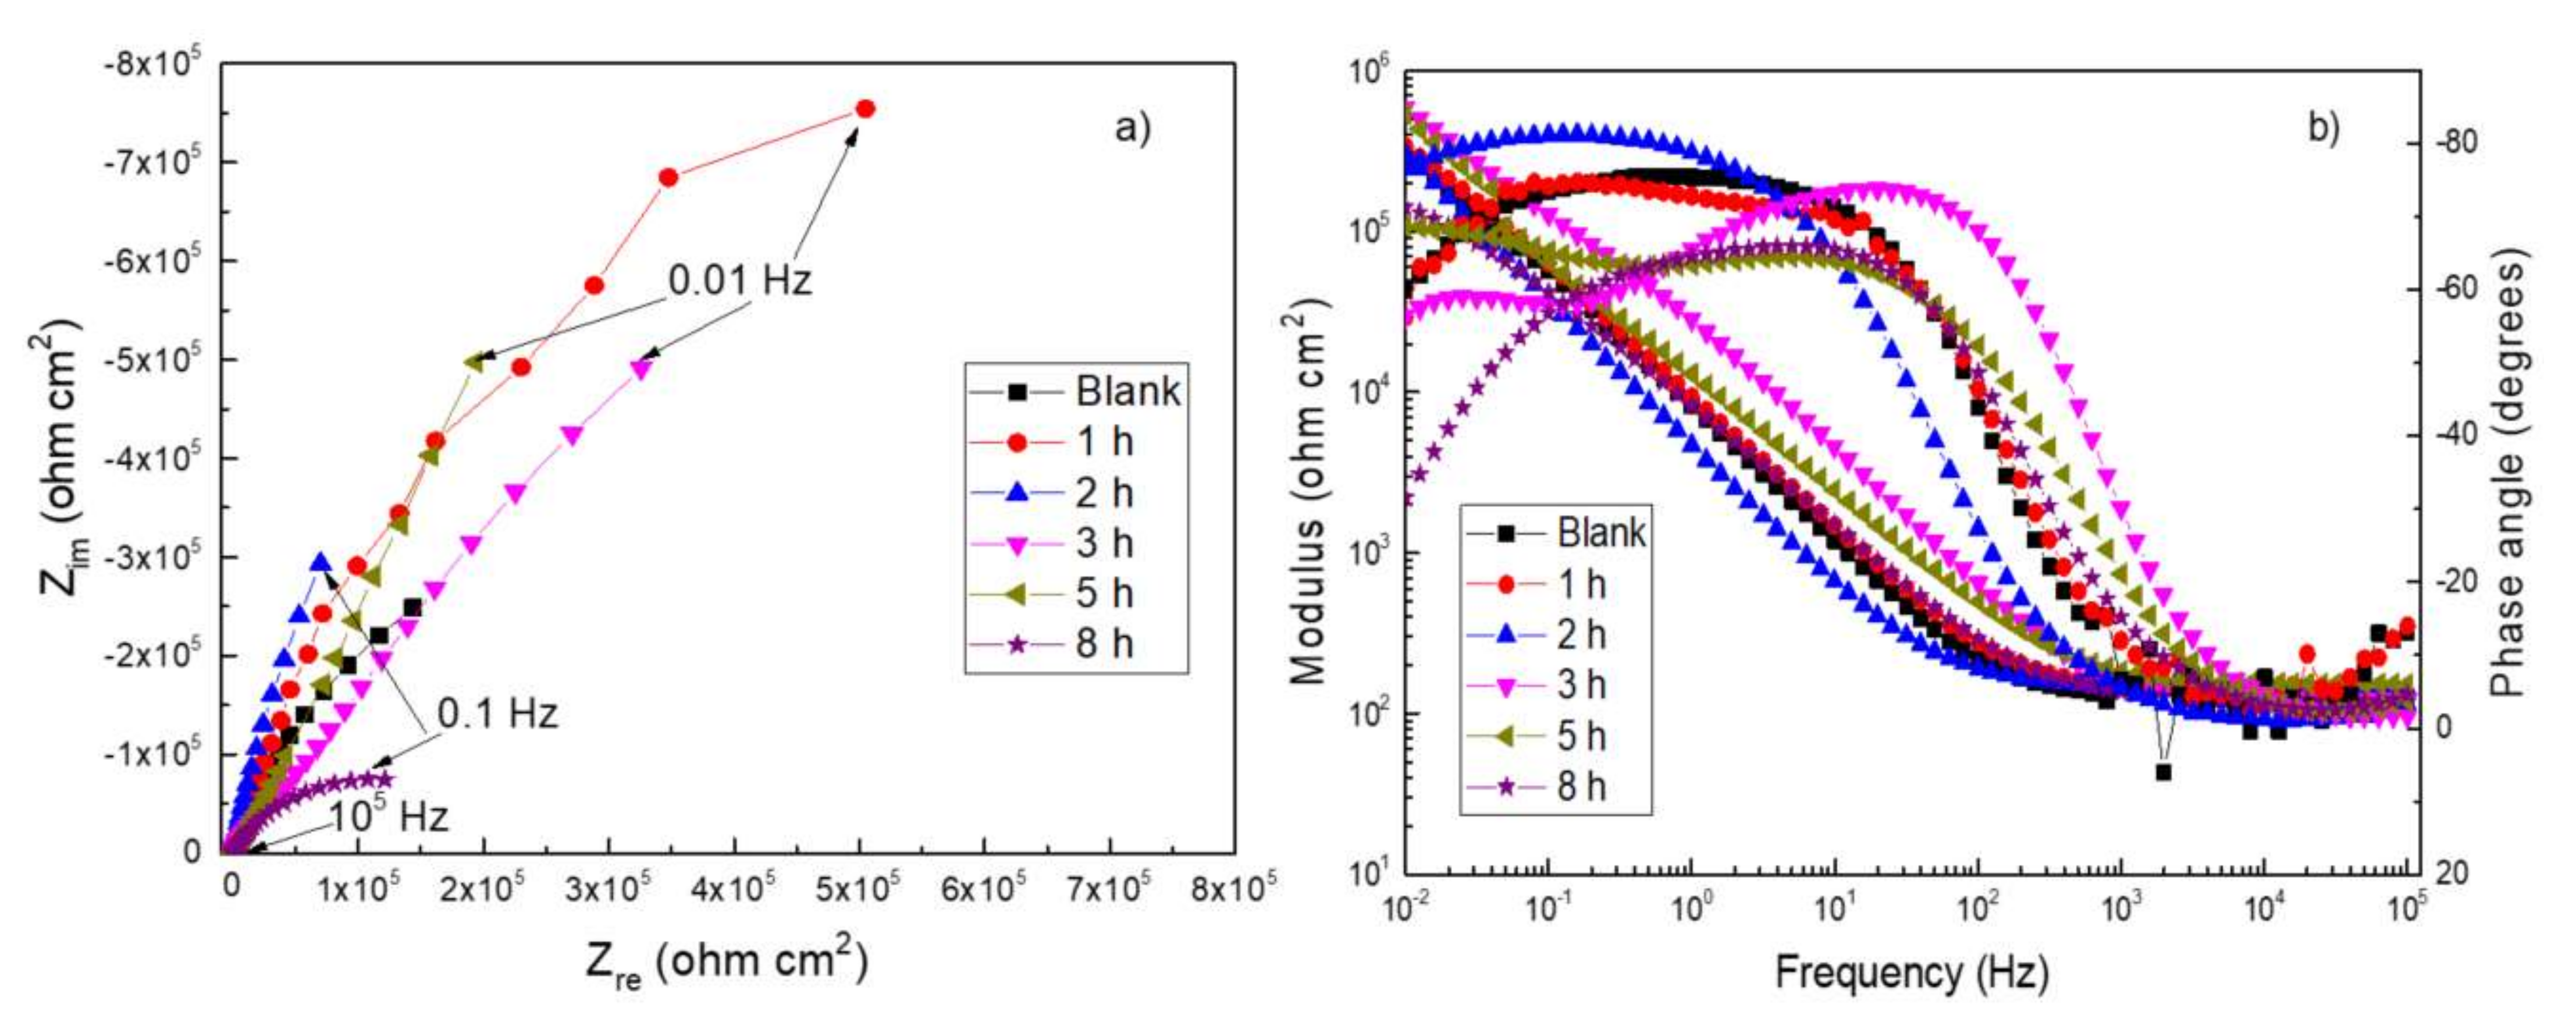
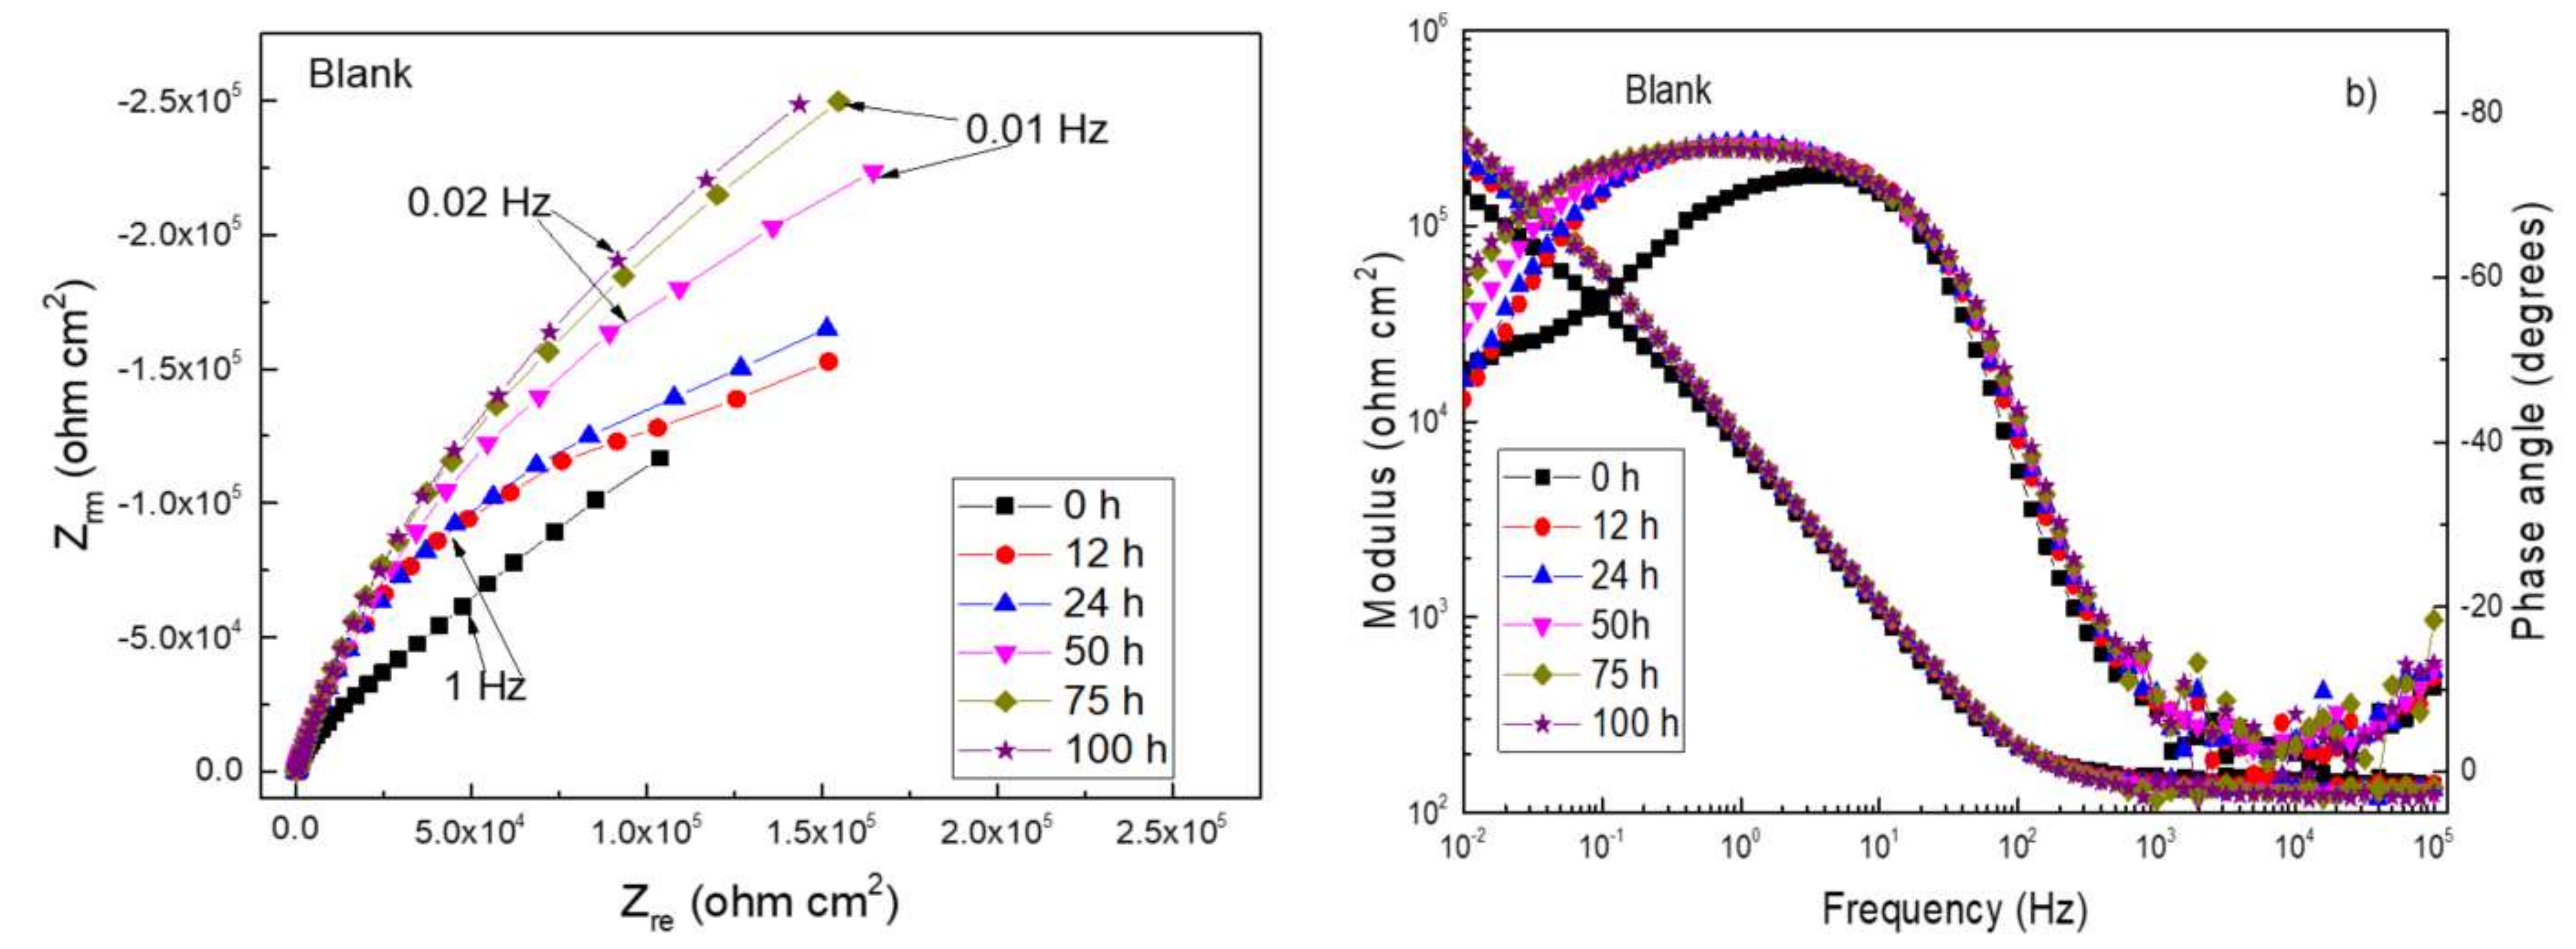
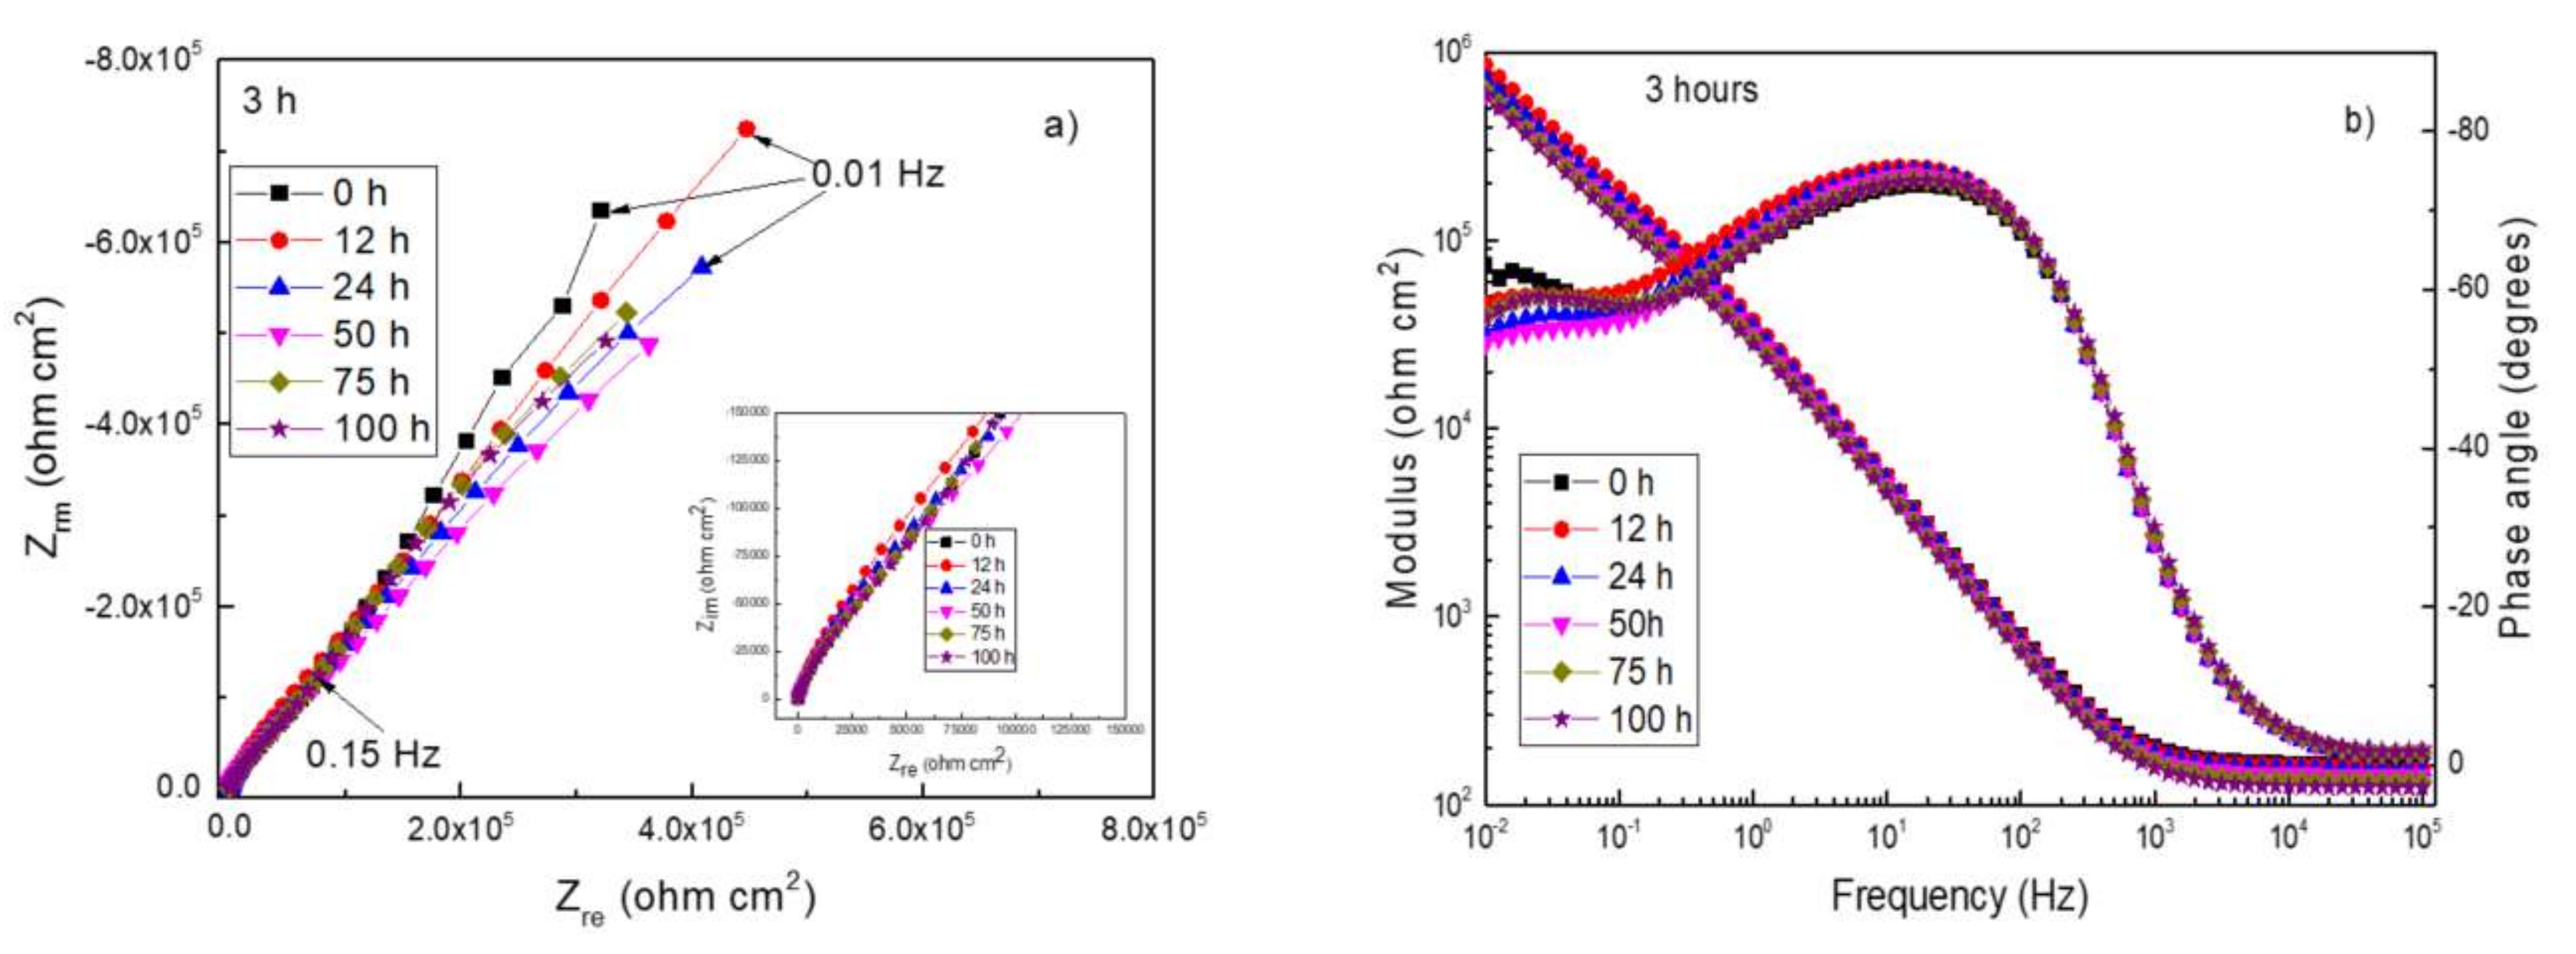
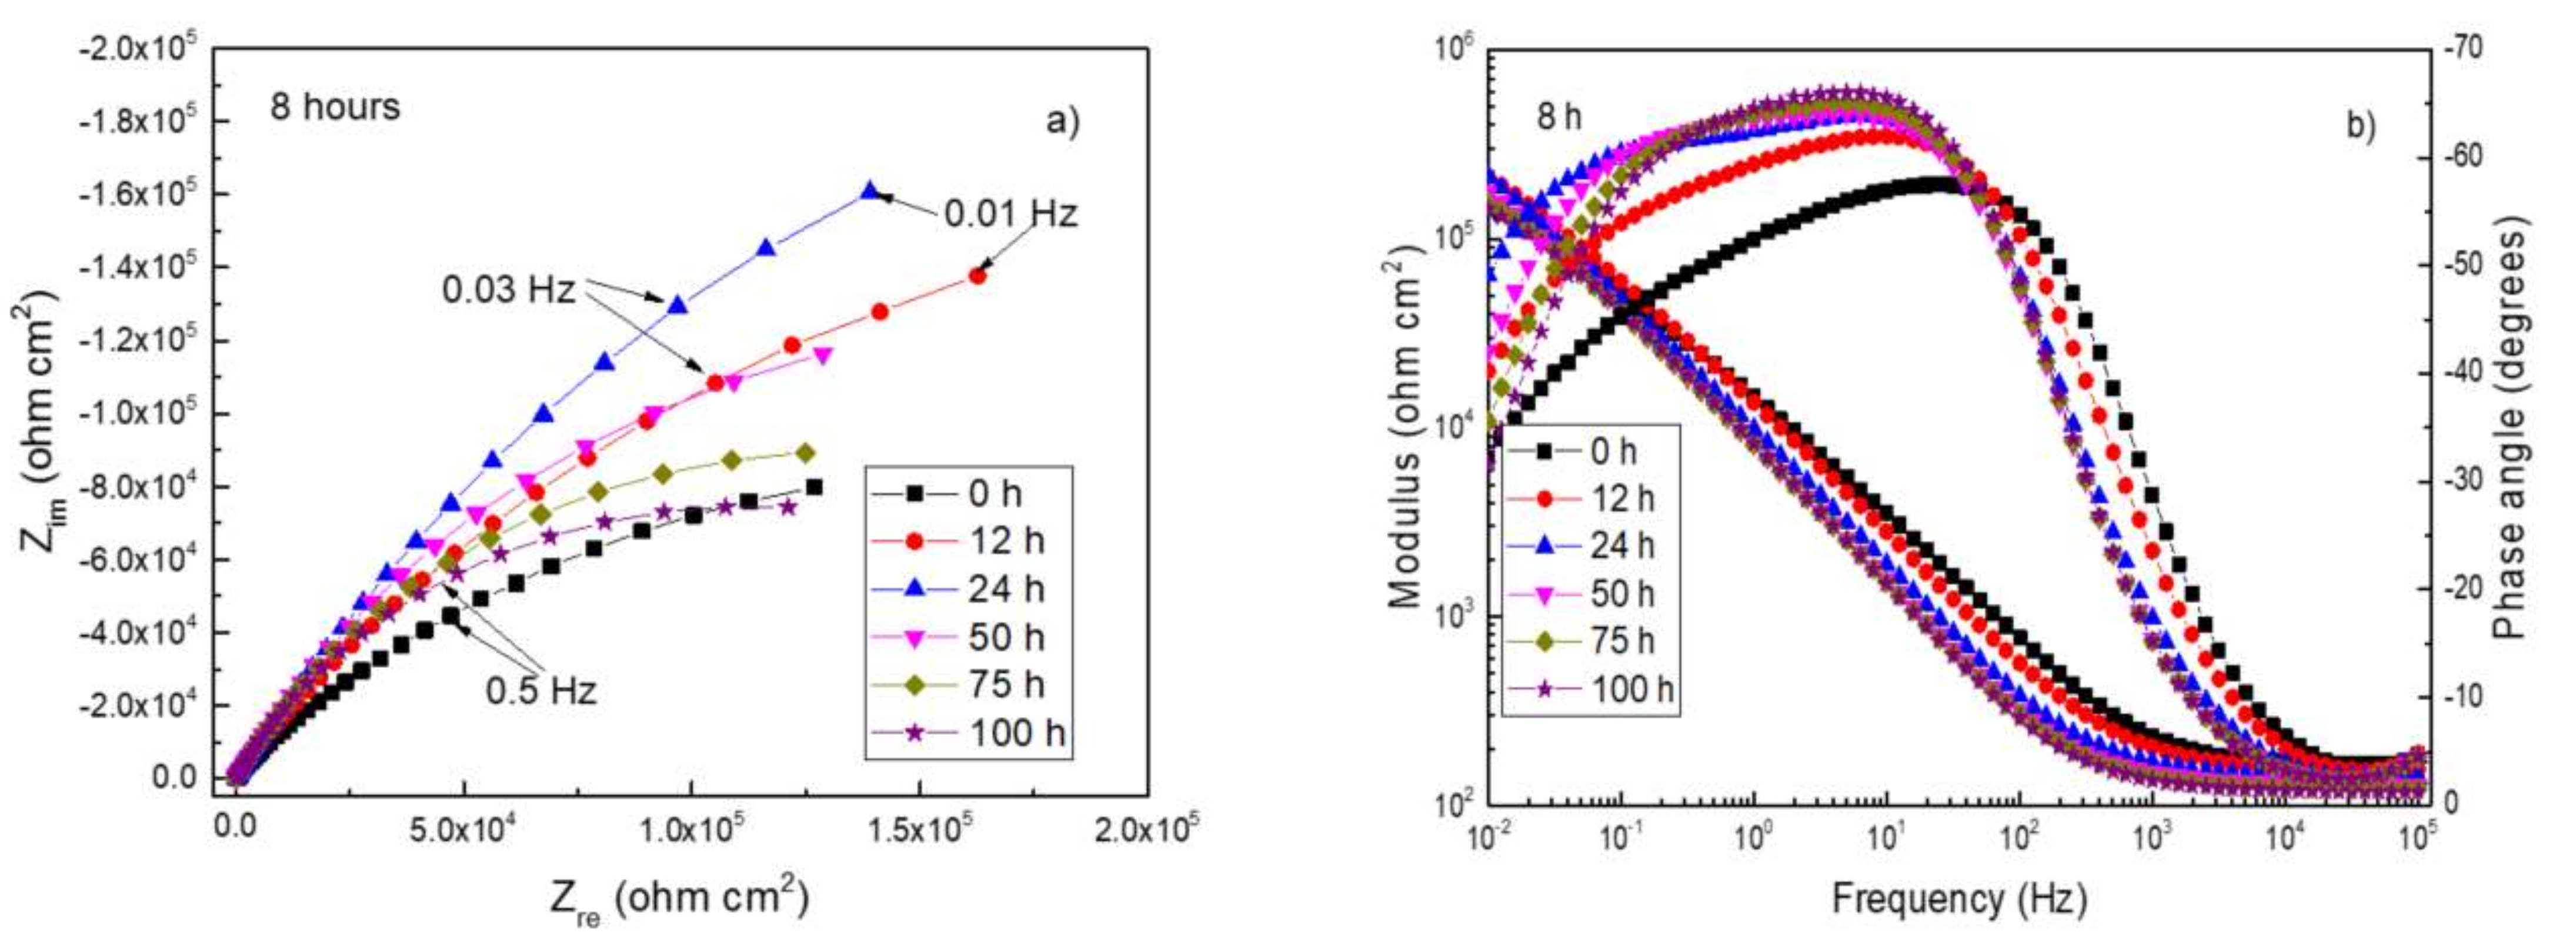
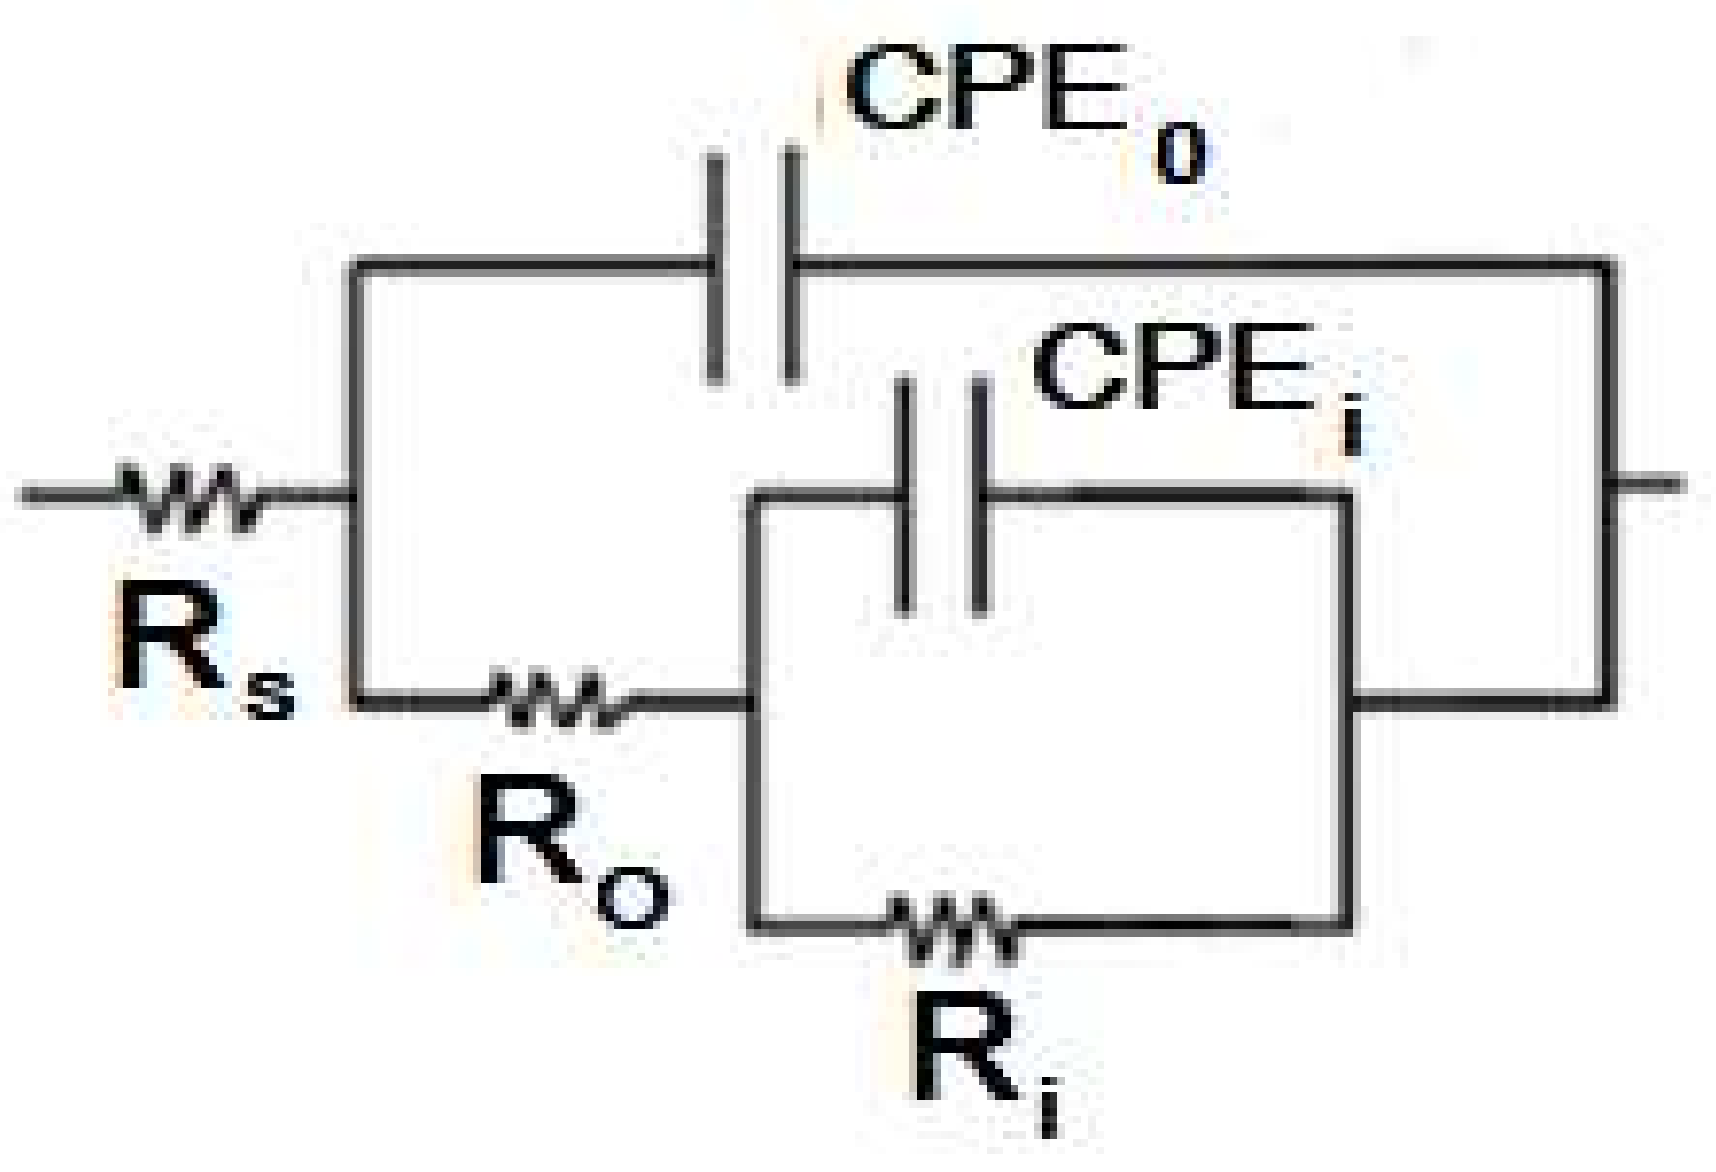
3.6. Electrochemical Impedance Spectroscopy Tests

The EIS method is usually used to characterize the uniform corrosion and the kinetic behavior between the electrode surfaces and solutions. Nyquist curves represent that the imaginary part (Zim) of the impedance is a function of the real part (Zre), which reflects the impedance of electron transfer process in the electrode surface. The Nyquist plots, which reflect the electron transfer impedance from the electrode surface to the solution, are presented in Figure 6a for untreated and plasma-oxidized Ti6Al4V alloy. Nyquist data indicate that, with the exception of specimens oxidized during 3 h, the impedance is approximately characterized by one large capacitive semicircle effect at all frequency values, indicating a charge-controlling corrosion mechanism. For specimens oxidized during 3 h, data display one depressed, capacitive semicircle at high and intermediate frequencies, followed by second capacitive semicircle at lower frequency values. Different research works have indicated that the oxide formed on Ti alloys consists of a duplex oxide, which consist of an outer porous layer and an inner compact layer, which acts as barrier layer [49,50,51]. The high-frequency loop is related to the electrochemical reactions taking place at the inner barrier layer at the electrolyte/passive film interface, whereas the low-frequency loop is related to reactions taking place at the outer porous passive film/solution interface. In these plots, a larger-radius capacitive loop corresponds to a lower corrosion rate. When the oxidation time increases up to 3 h, the capacitive loop diameter increases, which indicates that the resistance of electron transport increases, as a result of restraining or delaying the corrosion of the surface in the artificial saliva solution. The shape of the semicircle is not affected by the oxidation time, which indicates that the corrosion mechanism remained unaltered. However, the diameter of the semicircle changes with the oxidation time, which can be seen more clearly in the Bode plots, Figure 6b, where there is an increase in the impedance value as the oxidation time increases, obtaining its maximum value at a time of 3 h of treatment. For a further increase in the oxidation time, the impedance value decreases, decreasing, thus, the alloy corrosion resistance, in agreement with results given above by polarization curves and Rp measurements.
In the Bode-phase plots, the phase angle drops slightly towards lower values in the low-frequency region, indicating that the impedance consists of the solution and charge transfer resistances. The phase angle drops toward 0° at very high frequencies, indicating that the impedance is dominated by solution resistance [47]. A typical capacitive behavior with a thin passive oxide stable film formed in the surface of Ti6Al4V alloy is indicated from low-to-medium frequencies. Based on the phase angle data, it can be seen that the maximum phase angle is for samples oxidized during 2 h and 3 h, which decreases for shorter or longer oxidation time. A phase angle close to −80° that is extended over a wide interval of frequency values is characteristic of a metal covered with a very stable passive layer, typical of Ti alloys [17,18,19,20,21,45,46,47]. For specimens oxidized during 2 h and 3 h, two peaks can be clearly seen, corresponding to the double electrochemical layer and to the oxides film, respectively. It can be inferred that the passive oxide layer in Ti6Al4V alloy oxidized during 3 h serves as a more efficient barrier to corrosion and strengthens the resistance to charge transfer at the corrosion interface.
EIS data in both Nyquist and Bode formats for Ti6Al4V alloy plasma-oxidized during 0, 3, and 8 h at different testing times of exposure in artificial saliva solution are given in Figure 7, Figure 8 and Figure 9. For specimen without treatment and that oxidized during 8 h, Figure 7 and Figure 9, both Nyquist diagrams are very similar to each other. Nyquist data display one single depressed, capacitive semicircle at all frequency values with the center at the real axis and the diameters increasing as time elapsed, indicating that the corrosion mechanism remained unchanged during the whole testing time. On the other side, Bode diagrams indicate a typical capacitive behavior where the total impedance increases as time elapses whereas the phase angle value increases with time remaining constant over a wide frequency interval, close to −80°, typical of a material covered with a very stable passive film.
For specimen oxidized during 3 h, Figure 8, Nyquist diagrams show two capacitive semicircles, one located at high and intermediate frequency values, followed by a second semicircle, with a larger diameter, located at lower frequencies. The shape of the semicircles does not change with time, indicating that the corrosion mechanism remained unaltered during the whole testing time. Impedance values obtained for this specimen are the highest ones, remaining virtually unaltered as time elapses, very close to 106 ohm cm2, and two different slopes in the plots can be observed, showing the presence of two time constants. Phase angle values remain practically the same as time elapses, showing two peaks, indicating the presence of two time constants. Similar to the present work, Lavos-Valereto et al. [51] evaluated a Ti6Al7Nb alloy in Hank’s solution, and two relaxation time constants were clearly indicated by two peaks on phase angle plots. Thus, on this basis, the obtained EIS results can be simulated by using an electric circuit as shown in Figure 8. In this figure, Rs represents the solution or electrolyte resistance, Ro the outer, porous oxide layer, Co its capacitance, Ri the compact inner oxide layer, and Ci its capacitance. As the electrode has a heterogeneous structure due to surface roughness and defects, ideal capacitances, C, have been replaced by Constant phase elements, CPE. The impedance of a CPE, ZCPE, is given by following expression:
Z C P E = 1 / C j ω n
where n is between −1 and 1 and is associated to the nonuniform distribution of current due to surface heterogeneities such as defects and roughness. Table 2 gives the fitting parameters obtained from the use of the circuit shown on Figure 10.
Table 2 shows that for untreated alloy, the outer porous layer resistance, Ro, value of 154 ohm cm2 was obtained. Other studies [15,17,33] have reported values of 333, 800, and 287 ohm cm2, respectively, for this alloy in Hank´s solution, somehow different to those used in this work. This value increased as the oxidation time increased, reaching a highest value of 59,500 ohm cm2 for specimen oxidized during 3 h. A further increase in the oxidation time decreased the value for Ro. Cao [17] oxidized a Ti6Al4V alloy at 700 °C during 5 h in air, and the Ro value increased from 333 to 16,000 ohm cm2 for oxidized specimen. Similarly, Cotolan [33] produced a TiO2 layer by anodizing a Ti6Al4Nb alloy in sulfuric acid at two potentials, and the value for Ro increased from 800 ohm cm2 for untreated alloy to 3000 and 9000 ohm cm2 for alloys anodized at 1 V and 3 V, respectively. Thus, the increase in the Ro value is due to the presence of an oxide layer, as demonstrated in these reported experiments, and its increase must be related to an increase in the porous oxide thickness.
On the other side, the inner compact barrier layer resistance value, Ri, was 331,000 ohm cm2 for untreated specimen, whereas other researchers reported values of 551,000, 1.0 × 10⁶, and 6.4 × 10⁶ ohm cm2, respectively [15,17,33]. Similar to the value for the outer porous layer resistance, Ro, the value for Ri increased as the oxidation time increased, reaching its highest value for specimen oxidized during 3 h, decreasing for a further increase in the oxidation time. Meanwhile, the resistance of the inner and outer layers of specimen oxidized during 3 h was also higher than the rest of specimens, representing better protective film properties and a higher corrosion resistance.
This increase in the Ri value can be due to an increase in the thickness of both the compact inner barrier and the external porous layers. It is known that the layer thickness is inversely related to the calculated capacitance [16,50]. The thicker layer is formed on the substrate, and the harder corrosive ions penetrate throughout, resulting in a more corrosion-resistant performance. According to the simulated results shown in Table 2, the lower CPE value, and thus the thickest oxide inner and outer layers, was obtained for specimen oxidized during 3 h, which exhibited the best corrosion performance. Finally, values for no and ni close to 0.5 mean a high surface roughness due to a high dissolution rate, whereas a value close to 1 implies a low surface roughness due to a low metal dissolution rate. As shown in Table 2, the lowest values for these parameters, 0.7 and 0.8, were obtained for untreated specimen, indicating a high corrosion rate, whereas the highest value, 0.9, was obtained for specimen oxidized during 3 h, indicating a low surface roughness due to a low dissolution rate. Cross section micrographs of corroded Ti6Al4V alloy oxidized at different times are shown in Figure 11. This figure shows the layer of corrosion products formed on top of specimens oxidized at different times, but the presence of external and internal layers on such a layer is not clear. What is possible to see is that the thickness of such a layer is bigger for specimens oxidized during either 1 h or 8 h due to a high corrosion rate of substrate, whereas the film formed on top of specimen oxidized during 3 h is thinner due to a lower corrosion rate of substrate, as found above.
This way, all evidence indicates that the best corrosion performance was obtained by oxidizing the Ti6Al4V alloy during 3 h. Variation in the Ecorr value with time, Figure 2, indicates that the noblest Ecorr value was obtained for specimen oxidized during 3 h, in some cases 300 mV nobler than alloy without plasma treatment, due to the formation of a very protective external oxide layer. Polarization curves, Figure 4, show the formation of very wide passive layers in all specimens; however, the lowest passive and corrosion current density values were obtained for specimen oxidized during 3 h, between 10−8 and 10−7 A/cm2, in agreement with reported values in other research works [15,17,33]. LPR tests indicate that the highest Rp values were obtained also for specimen oxidized during 3 h; however, this value decreased after a few hours of testing, indicating the dissolution of this oxide by electrolyte; however, the final Rp value was still higher than that obtained for specimen without treatment or oxidized during 1, 5, or 8 h.
Nyquist diagrams show that the highest impedance values were for specimen oxidized during 3 h, very close to 106 ohm cm2, in agreement with the low passive corrosion current density values obtained from polarization curves, whereas the phase angle values, close to −80°, indicate a high capacitive behavior typical of a very compact passive film. The fact that the capacitive semicircles exhibited by Nyquist diagrams did not change in shape with either the oxidation time or the testing time suggests that the corrosion mechanism remained unchanged under these circumstances.

4. Conclusions

The plasma oxidation of a Ti6Al4V alloy at 600 °C during 0, 1, 2, 3, 5, and 8 h affects its corrosion resistance in artificial saliva solution. The best performance was obtained by oxidizing the alloy during 3 h since the noblest Ecorr value was obtained under these circumstances. This shift in the potential is due to the formation of more protective oxide layers. All specimens exhibited a wide passive zone; however, the lowest passive and corrosion current densities were obtained for specimen oxidized during 3 h. Highest polarization resistance values were obtained for specimen oxidized during 3 h, at least during the first 30 h of testing, probably due to a dissolution of external formed oxide layer. The corrosion mechanism remained unaltered regardless the oxidation time, obtaining impedance and phase angle values typical of a very compact passive film.

Author Contributions

N.V.-T., investigation and methodology; J.P.-C., resources and conceptualization; H.M.-V., formal analysis and writing—review; R.L.-C. and E.S.-B., data curation and supervision; I.R.-C. software and writing—original draft preparation; E.S.-B., validation; J.G.G.-R. and C.I.R.-V. project administration and resources; J.G.G.-R. funding acquisition. All authors have read and agreed to the published version of the manuscript.

Funding

This research received no external funding.

Institutional Review Board Statement

Not applicable.

Informed Consent Statement

Not applicable.

Data Availability Statement

The data presented in this study are available on request from the corresponding author.

Acknowledgments

The authors would like to acknowledge to Rene Guardian for his help in the SEM work.

Conflicts of Interest

The authors declare no conflict of interest.

References

  1. Sibum, H. Titanium and Titanium Alloys: Fundamentals and Applications; Leyens, C., Perters, M., Eds.; Wiley-VCH: Weinheim, Germany, 2003; pp. 231–244. [Google Scholar]
  2. Froes, F.H.; Friedrich, H.; Kiese, J.; Bergoint, D. The use of titanium in family automobiles: Current trends. JOM 2001, 53, 27–28. [Google Scholar]
  3. Friedrich, F.H.; Kiese, H. Titanium in the family automobile: The cost challenge. JOM 2004, 56, 40–44. [Google Scholar]
  4. Boyer, R.R. Titanium for aerospace: Rationale and applications. Adv. Perform. Mater. 1995, 2, 349–368. [Google Scholar] [CrossRef]
  5. Wang, K. The use of titanium for medical applications in the USA. Mater. Sci. Eng. A 1996, 213, 134–137. [Google Scholar] [CrossRef]
  6. Gunawarman, G.; Niinomi, M.; Akahori, T.; Souma, T.; Ikeda, M.; Toda, H. Mechanical properties and microstructures of low cost β titanium alloys for healthcare applications. Mater. Sci. Eng. C 2005, 25, 304–311. [Google Scholar] [CrossRef]
  7. Jorge, J.R.P.; Barão, V.A.; Delben, J.; Faverani, L.; Queiroz, T.; Assunção, W.G. Titanium in Dentistry: Historical Development, State of the Art and Future Perspectives. J. Indian Prosthodont. Soc. 2013, 13, 71–77. [Google Scholar] [CrossRef] [PubMed]
  8. Dutta, B.; Froes, F.H. The additive manufacturing (AM) of titanium alloys. Met. Powder Rep. 2016, 72, 96–106. [Google Scholar] [CrossRef]
  9. Muruve, N.; Feng, Y.; Platnich, J.; Hassett, D.; Irvin, R.; Muruve, D.; Cheng, F. A peptide-based biological coating for enhanced corrosion resistance of titanium alloy biomaterials in chloride-containing fluids. J. Biomater. Appl. 2017, 31, 1225–1234. [Google Scholar] [CrossRef]
  10. Chávez-Díaz, M.P.; Escudero-Rincón, M.L.; Arce-Estrada, E.M.; Cabrera-Sierra, R. Osteoblast Cell Response on the Ti6Al4V Alloy Heat-Treated. Materials 2017, 10, 445. [Google Scholar] [CrossRef] [Green Version]
  11. De Fenzo, A.; Scherillo, F.; Astarita, A.; Testani, C.; Squillace, A.; Bellucci, F. Influence of hot deformation on the electrochemical behavior of natural oxides of hipped Ti6Al4V. Corros. Sci. 2015, 94, 79–87. [Google Scholar] [CrossRef] [Green Version]
  12. Manhabosco, T.; Tamborim, S.; dos Santos, C.; Müller, I. Tribological, electrochemical and tribo-electrochemical characterization of bare and nitrided Ti6Al4V in simulated body fluid solution. Corros. Sci. 2011, 53, 1786–1793. [Google Scholar] [CrossRef] [Green Version]
  13. Pohrelyuk, I.; Tkachuk, O.; Proskurnyak, R.; Guspiel, J.; Beltowska-Lehman, E.; Morgiel, J. Influence of regulated modification of nitride layer by oxygen on the electrochemical behavior of Ti–6Al–4V alloy in the Ringer’s solution. Mater. Corros. 2019, 70, 2320–2325. [Google Scholar] [CrossRef]
  14. Assis, S.L.; Costa, I. Electrochemical evaluation of Ti-13Nb-13Zr, Ti-6Al-4V and Ti-6Al-7Nb alloys for biomedical application by long-term immersion tests. Mater. Corros. 2007, 58, 329–333. [Google Scholar] [CrossRef]
  15. de Assis, S.L.; Wolynec, S.; Costa, I. Corrosion characterization of titanium alloys by electrochemical techniques. Electrochim. Acta 2006, 51, 1815–1819. [Google Scholar] [CrossRef]
  16. Souto, R.M.; Laz, M.M.; Reis, R.L. Degradation characteristics of hydroxyapatite coatings on orthopaedic TiAlV in simulated physiological media investigated by electrochemical impedance spectroscopy. Biomaterials 2003, 24, 4213–4219. [Google Scholar] [CrossRef] [Green Version]
  17. Cao, L.; Wan, Y.; Yang, S.; Pu, J. The Tribocorrosion and Corrosion Properties of Thermally Oxidized Ti6Al4V Alloy in 0.9 wt.% NaCl Physiological Saline. Coatings 2018, 8, 285. [Google Scholar] [CrossRef] [Green Version]
  18. Aziz-Kerrzo, M.; Conroy, K.G.; Fenelon, A.M.; Farrell, S.T.; Breslin, C. Electrochemical studies on the stability and corrosion resistance of titanium-based implant materials. Biomaterials 2001, 22, 1531–1539. [Google Scholar] [CrossRef] [Green Version]
  19. Bodunrin, M.O.; Chown, L.H.; Van der Merwe, J.W.; Alaneme, K.K. Corrosion behaviour of low-cost Ti–4.5Al–xV–yFe alloys in sodium chloride and sulphuric acid solutions. Corr. Eng. Sci. Technol. 2019, 54, 637–648. [Google Scholar] [CrossRef]
  20. Lin, X.-Z.; Zhu, M.-H.; Cai, Z.-B.; Dou, B.-J.; Cui, X.-J. Torsional fretting corrosion behaviours of Ti6Al4V alloys in Hank’s simulated body fluid. Corros. Eng. Sci. Technol. 2019, 54, 298–309. [Google Scholar] [CrossRef]
  21. Hsu, R.W.-W.; Yang, C.-C.; Huang, C.-A.; Chen, Y.-S. Electrochemical corrosion properties of Ti–6Al–4V implant alloy in the biological environment. Mater. Sci. Eng. A 2004, 380, 100–109. [Google Scholar] [CrossRef]
  22. Lin, J.; Zhao, L.; Li, G.; Zhang, L.; Song, X.; Ye, F.; Chen, G. Effect of Nb on oxidation behavior of high Nb containing TiAl alloys. Intermetallics 2011, 19, 131–136. [Google Scholar] [CrossRef]
  23. Hongli, D.; Chongyu, W.; Tao, Y. First-principles investigation of the alloying effect of Ta and W on γ-TiAl. Chin. Sci. Bull. 2006, 51, 2690–2695. [Google Scholar]
  24. Fox-Rabinovich, G.; Weatherly, G.; Wilkinson, D.; Kovalev, A.; Wainstein, D. The role of chromium in protective alumina scale formation during the oxidation of ternary TiAlCr alloys in air. Intermetallics 2004, 12, 165–180. [Google Scholar] [CrossRef]
  25. Chen, C.; Feng, X.; Shen, Y. Oxidation behavior of a high Si content AleSi composite coating fabricated on Tie6Ale4V substrate by mechanical alloying method. J. Alloy Comp. 2017, 701, 27–36. [Google Scholar] [CrossRef]
  26. Wang, W.; Zhong, X.; He, Z.; Wang, Z.X.; Zhang, P.Z. Plasma niobium surface alloying of pure titanium and its oxidation at 900 °C. Chin. J. Aeronaut. 2007, 20, 111–114. [Google Scholar]
  27. Dai, J.; Zhang, F.; Wang, A.; Yu, H.; Chen, C. Microstructure and properties of Ti-Al coating and Ti-Al-Si system coatings on Ti-6Al-4V fabricated by laser surface alloying. Surf. Coatings Technol. 2017, 309, 805–813. [Google Scholar] [CrossRef]
  28. Ait-Djafer, A.Z.; Saoula, N.; Aknouche, H.; Guedouar, B.; Madaoui, N. Deposition and characterization of titanium aluminum nitride coatings prepared by RF magnetron sputtering. Appl. Surf. Sci. 2015, 350, 6–9. [Google Scholar] [CrossRef]
  29. Bahi, R.; Nouveau, C.; Beliardouh, N.; Ramoul, C.; Meddah, S.; Ghelloudj, O. Surface performances of Ti-6Al-4V substrates coated PVD multilayered films in biological environments. Surf. Coatings Technol. 2020, 385, 125412. [Google Scholar] [CrossRef]
  30. de Damborenea, J.; Arenas, M.; Larosa, M.A.; Jardini, A.L.; Zavaglia, C.A.D.C.; Conde, A. Corrosion of Ti6Al4V pins produced by direct metal laser sintering. Appl. Surf. Sci. 2017, 393, 340–347. [Google Scholar] [CrossRef]
  31. Shi, X.; Xu, L.; Wang, Q. Porous TiO2 film prepared by micro-arc oxidation and its electrochemical behaviors in Hank’s solution. Surf. Coatings Technol. 2010, 205, 1730–1735. [Google Scholar] [CrossRef]
  32. Öteyaka, M.Ö.; Çakır, F.H.; Çelik, O.N. Influence of shallow and deep cryogenic treatment on the corrosion behavior of Ti6Al4V alloy in isotonic solution. Mater. Corros. 2020, 71, 1206–1215. [Google Scholar] [CrossRef]
  33. Cotolan, N.; Pop, A.; Marconi, D.; Ponta, O.; Muresan, L.M. Corrosion behavior of TiO2-coated Ti-6Al-7Nb surfaces obtained by anodic oxidation in sulfuric or acetic acid. Mater. Corros. 2014, 66, 635–642. [Google Scholar] [CrossRef]
  34. Jia, Q.; Li, D.; Li, S.; Zhang, Z.; Zhang, N. High-Temperature Oxidation Resistance of NiAl Intermetallic Formed In Situ by Thermal Spraying. Coatings 2018, 8, 292. [Google Scholar] [CrossRef] [Green Version]
  35. Zhou, H.; Peng, C. Effect of Shroud in Plasma Spraying on Chemical Composition and Thickness of Titanium Coatings. Coatings 2021, 11, 446. [Google Scholar] [CrossRef]
  36. Zhang, H.; Qin, H.; Ren, Z.; Zhao, J.; Hou, X.; Doll, G.; Dong, Y.; Ye, C. Low-temperature nitriding of nanocrystalline Inconel 718 alloy. Surf. Coatings Technol. 2017, 330, 10–16. [Google Scholar] [CrossRef]
  37. Lee, S.-H.; Yang, T.-H.; Hyun, S.-H.; Yoon, Y.-S. Corrosion behavior of pre-oxidized and thermally nitrided stainless steel for polymer electrolyte membrane fuel cell bipolar plates. Corros. Sci. 2012, 58, 79–85. [Google Scholar] [CrossRef]
  38. Li, Y.; He, Y.; Xiu, J.; Wang, W.; Zhu, Y.; Hu, B. Wear and corrosion properties of AISI 420 martensitic stainless steel treated by active screen plasma nitriding. Surf. Coat. Technol. 2017, 329, 184–192. [Google Scholar] [CrossRef]
  39. Alphonsa, J.; Raja, V.; Mukherjee, S. Study of plasma nitriding and nitrocarburizing for higher corrosion resistance and hardness of 2205 duplex stainless steel. Corros. Sci. 2015, 100, 121–132. [Google Scholar] [CrossRef]
  40. Singh, G.; Singh, S.; Prakash, S. Surface characterization of plasma sprayed pure and reinforced hydroxyapatite coating on Ti6Al4V alloy. Surf. Coat. Technol. 2011, 205, 4814–4820. [Google Scholar] [CrossRef]
  41. Yuan, S.; Lin, N.; Zou, J.; Liu, Z.; Wang, Z.; Tian, L.; Qin, L.; Zhang, H.; Wang, Z.; Tang, B.; et al. Effect of laser surface texturing (LST) on tribological behavior of double glow plasma surface zirconizing coating on Ti6Al4V alloy. Surf. Coatings Technol. 2019, 368, 97–109. [Google Scholar] [CrossRef]
  42. Kwok, C.T.; Wong, P.; Cheng, F.; Man, H. Characterization and corrosion behavior of hydroxyapatite coatings on Ti6Al4V fabricated by electrophoretic deposition. Appl. Surf. Sci. 2009, 255, 6736–6744. [Google Scholar] [CrossRef]
  43. Yusoff, M.F.M.; Kadir, M.R.A.; Iqbal, N.; Hassan, M.A.; Hussain, R. Dipcoating of poly (ε-caprolactone)/hydroxyapatite composite coating on Ti6Al4V for enhanced corrosion protection. Surf. Coatings Technol. 2014, 245, 102–107. [Google Scholar] [CrossRef]
  44. Sobolev, A.; Zinigrad, M.; Borodiansky, K. Ceramic coating on Ti-6Al-4V by plasma electrolytic oxidation in molten salt: Development and characterization. Surf. Coat. Technol. 2021, 408, 126847. [Google Scholar] [CrossRef]
  45. Lupi, S.M.; Galinetto, P.; Albini, B.; Di Ronza, E.; Rizzo, S.; Rodriguez Baena, R. Micro-raman spectroscopy of dental Implants subjected to deferent surface treatments. Appl. Sci. 2020, 10, 2417. [Google Scholar] [CrossRef] [Green Version]
  46. Secundino-Sánchez, O.; Diaz-Reyes, J.; Sánchez-Ramírez, J.F.; Jiménez-Pérez, A.J. Structural and optical characterization of the crystalline phase transformation of electrospinning TiO2 nanofibres by high-temperatures annealing. Rev. Mex. Física 2019, 65, 459–467. [Google Scholar] [CrossRef] [Green Version]
  47. Balachandran, U.; Eror, N. Raman spectra of titanium dioxide. J. Solid State Chem. 1982, 42, 276–282. [Google Scholar] [CrossRef]
  48. Ma, W.; Lu, Z.; Zhang, M. Investigation of structural transformations in nanophase titanium dioxide by Raman spectroscopy. Appl. Phys. A 1998, 66, 621–627. [Google Scholar] [CrossRef]
  49. Benmessaoud, M.; Es-Salah, K.; Hajjaji, N.; Takenouti, H.; Srhiri, A.; Ebentouhami, M. Inhibiting effect of 2-mercaptobenzimidazole on the corrosion of Cu–30Ni alloy in aerated 3% NaCl in presence of ammonia. Corros. Sci. 2007, 49, 3880–3888. [Google Scholar] [CrossRef]
  50. Lin, J.; Ozan, S.; Munir, K.; Wang, K.; Tong, X.; Li, Y.; Li, G.; Wen, C. Effects of solution treatment and aging on the microstructure, mechanical properties, and corrosion resistance of a β type Ti–Ta–Hf–Zr alloy. RSC Adv. 2017, 7, 12309–12317. [Google Scholar] [CrossRef] [Green Version]
  51. Lavos-Valereto, I.C.; Wolynec, S.; Ramires, I.; Guastaldi, A.C.; Costa, I. Electrochemical impedance spectroscopy characterization of passive film formed on implant Ti–6Al–7Nb alloy in Hank’s solution. J. Mater. Sci. Mater. Med. 2004, 15, 55–59. [Google Scholar] [CrossRef]
Figure 1. SEM micrographs of Ti6Al4V alloy oxidized during (a) 1, (b) 3, and (c) 8 h.
Coatings 11 01136 g001
Figure 2. Raman spectra for Ti6Al4V alloy oxidized at different times.
Coatings 11 01136 g002
Figure 3. Effect of the oxidizing time on the Ecorr value for Ti6Al4V alloy corroded in artificial saliva solution.
Coatings 11 01136 g003
Figure 4. Effect of the oxidizing time on the polarization curves for Ti6Al4V alloy corroded in artificial saliva solution. In addition, schematic representation for the calculation of the Icorr values.
Coatings 11 01136 g004
Figure 5. Effect of the oxidizing time on the Rp value for Ti6Al4V alloy corroded in artificial saliva solution.
Coatings 11 01136 g005
Figure 6. Effect of the oxidizing time on the (a) Nyquist and (b) Bode diagrams for Ti6Al4V alloy corroded in artificial saliva solution during 100 h.
Coatings 11 01136 g006
Figure 7. EIS data in (a) Nyquist and (b) Bode diagrams for untreated Ti6Al4V alloy corroded in artificial saliva solution after different exposure times.
Coatings 11 01136 g007
Figure 8. EIS data in (a) Nyquist and (b) Bode diagrams for Ti6Al4V alloy oxidized during 3 h and corroded in artificial saliva solution after different exposure times.
Coatings 11 01136 g008
Figure 9. EIS data in (a) Nyquist and (b) Bode diagrams for Ti6Al4V alloy oxidized during 8 h and corroded in artificial saliva solution after different exposure times.
Coatings 11 01136 g009
Figure 10. Equivalent electric circuit used to simulate EIS data.
Coatings 11 01136 g010
Figure 11. Cross section micrographs of Ti6Al4V alloy during (a) 1, (b) 3, and (c) 8 h and corroded in artificial saliva solution.
Coatings 11 01136 g011
Table 1. Electrochemical parameters obtained from polarization curves.
Oxidation Time (h)Ecorr (mV)Icorr (mA/cm2)Epit (mV)Ipas (mA/cm2)
0 (blank)−1753.0 × 10−3-3.0 × 10⁻²
1−3059.0 × 10−511801.0 × 10−3
2−2307.0 × 10−59105.0 × 10−4
3−1802.5 × 10−511253.0 × 10−5
5−3602.0 × 10−49803.0 × 10−3
8−421.0 × 10−313401.0 × 10−2
Table 2. Electrochemical parameters used to fit EIS data.
Oxidation Time (h)Rs
(ohm m2)
CPEo
(Ssn//cm2)
noRo
(ohm m2)
CPEi
(Ssn//cm2)
niRi
(ohm m2)
0 (blank)1474.1 × 10−60.71.54 × 1028.8 × 10−50.83.31 × 105
11822.6 × 10−60.81.37 × 1043.1 × 10−70.84.4 × 105
21641.2 × 10−60.84.42 × 1042.1 × 10−70.87.9 × 105
31620.9 × 10−60.95.95 × 1041.9 × 10−70.98.5 × 105
51731.9 × 10−60.82.76 × 1042.6 × 10−70.85.4 × 105
81622.2 × 10−60.85.00 × 1033.9 × 10−70.84.0 × 105
Publisher’s Note: MDPI stays neutral with regard to jurisdictional claims in published maps and institutional affiliations.

