Article

Ecofriendly Ultrasonic Rust Removal: An Empirical Optimization Based on Response Surface Methodology

1
Hebei Provincial Key Laboratory of Heavy Machinery Fluid Power Transmission and Control, Yanshan University, Qinhuangdao 066004, China
2
Jiangsu XCMG Construction Machinery Research Institute Co., Ltd., Xuzhou 221004, China
3
State Key Laboratory of Intelligent Manufacturing of Advanced Construction Machinery, Xuzhou Construction Machinery Group, Xuzhou 221004, China
*
Author to whom correspondence should be addressed.
Coatings 2021, 11(9), 1127; https://doi.org/10.3390/coatings11091127
Submission received: 26 August 2021 / Revised: 7 September 2021 / Accepted: 7 September 2021 / Published: 16 September 2021

Abstract

:
This study shows that the hard-to-remove rust layer on the guide sleeve surface of a used cylinder can be removed using a specially developed, environmentally friendly formula for cleaning rust. Furthermore, we studied the rust removal technology that is based on ultrasonic cavitation and chemical etching. The surface morphology and structural components of the rust layer were observed using an electron microscope and an X-ray powder diffractometer. These tools were used to explore the mechanism of combined rust removal. Using response surface methodology (RSM) and central composite design (CCD), with the rust removal rate as our index of evaluation, data were analyzed to establish a response surface model that can determine the effect of cleaning temperature and ultrasonic power interaction on the rate of rust removal. Results showed that the main components of the rust layer on a 45 steel guide sleeve were α-FeOOH, γ-FeOOH, and Fe3O4. The rust was unevenly distributed with a loose structure, which was easily corroded by chemical reagents and peeled off under ultrasonic cavitation. With the increase in the cleaning temperature, the chemical reaction effect was intensified, and the cleaning ability was enhanced. With the increase in ultrasonic power, the cavitation effect was aggravated, the ultrasonic agitation was enhanced, and the rust removal rate was improved. According to response surface analysis and the application scope of the rust remover, we determined that the optimal cleaning temperature is 55 °C, and that the optimal ultrasonic power is 2880 W. The descaling rate under these parameters is 0.15 g·min−1·m−2.

1. Introduction

There are a lot of pollutants such as rust on the surface of waste construction machinery parts. It is necessary to remove the pollutants on the surface of these parts to ensure their quality when they are inspected, repaired, and assembled [1,2]. At present, single- or multiple-combined processes, such as high-pressure water jet cleaning, steam cleaning, shot blasting, high-temperature roasting, chemical cleaning, and manual polishing, are usually used for treating pollutants [3,4,5,
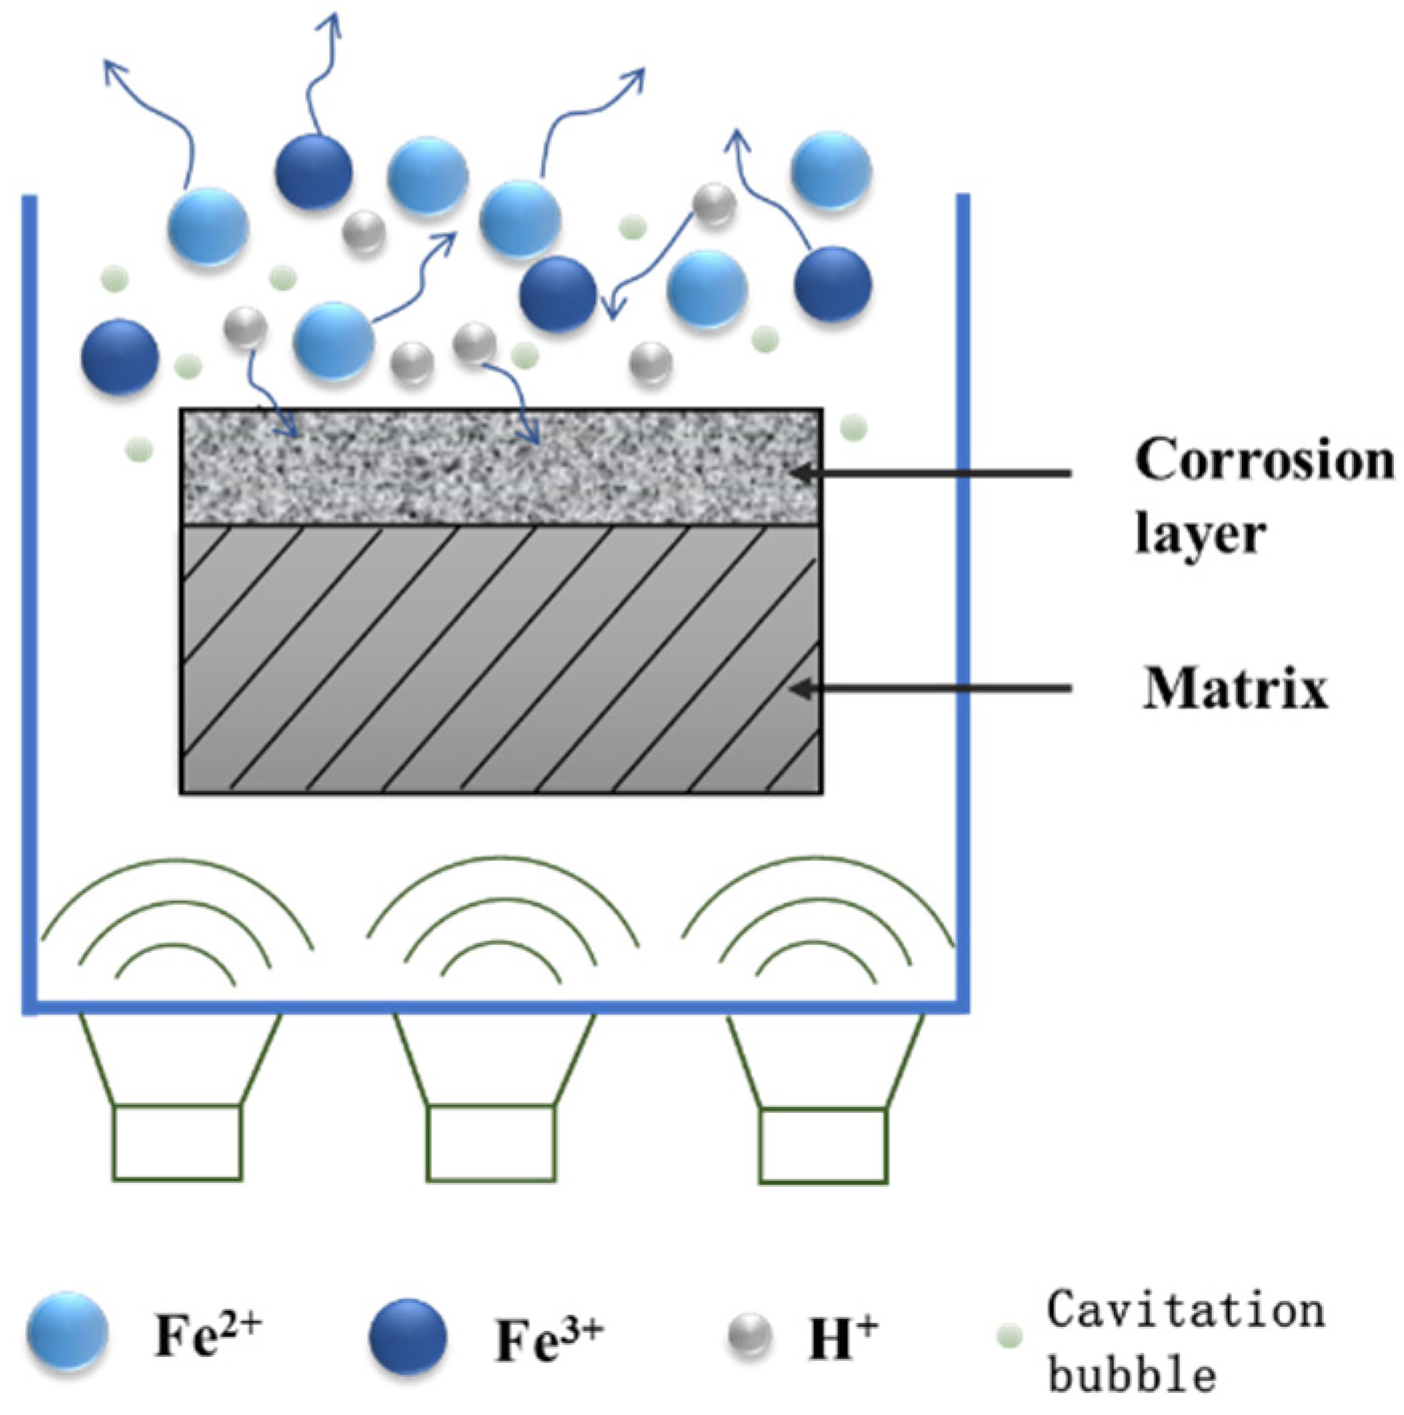
6]. However, steam cleaning and high-temperature roasting have high costs, while shot blasting easily damages the substrate. Manual polishing is low in efficiency and high in labor costs, and the cleaning effect is not obvious. We have independently developed a derusting test machine with an ultrasonic generator and a heating device to solve the problem of cleaning rust layers on surfaces. A special, environmentally friendly formula, with citric acid as the main body, has been developed and a process of ultrasonic rust removal has been used to remove the rust layer on the surface of the sample parts. Under the action of the sound field, the cavitation bubbles in the cleaning tank rapidly expand and contract, resulting in local high temperature and high pressure. This has the effect of destroying the rust layer on the sample’s surface. At the same time, the strong ultrasonic oscillation continuously agitates the cleaning liquid [7,8], accelerates the chemical interaction between the rust remover and the rust layer [9,10], and continuously dissolves and penetrates the dirt. At present, there have been many achievements in the field of ultrasonic cleaning and environmentally friendly rust removal. Zhang Baocai et al. [11] used ultrasonic compounding of molten salt cleaning technology to remove thick paint on the surface of remanufactured end caps. They combined the technology of chemical paint removal and ultrasonic cavitation, and explored the impact of cleaning temperature and ultrasonic power on the composite cleaning cycle. Wang Jian et al. [12] used the potential tracking method to study the dynamic changes in the ultrasonic pickling process of steel and the removal mechanism of the oxide layer. They found that the introduction of ultrasonic waves in the pickling process produced ultrasonic cavitation, which accelerated the reaction and greatly improved the rust removal rate. Lin Jinzhu [13] analyzed the physical and chemical properties of citric acid and the mechanism of rust removal. He pointed out the necessity and importance of using environmentally friendly acid to remove rust, laying a foundation for the establishment of a rust removal program.
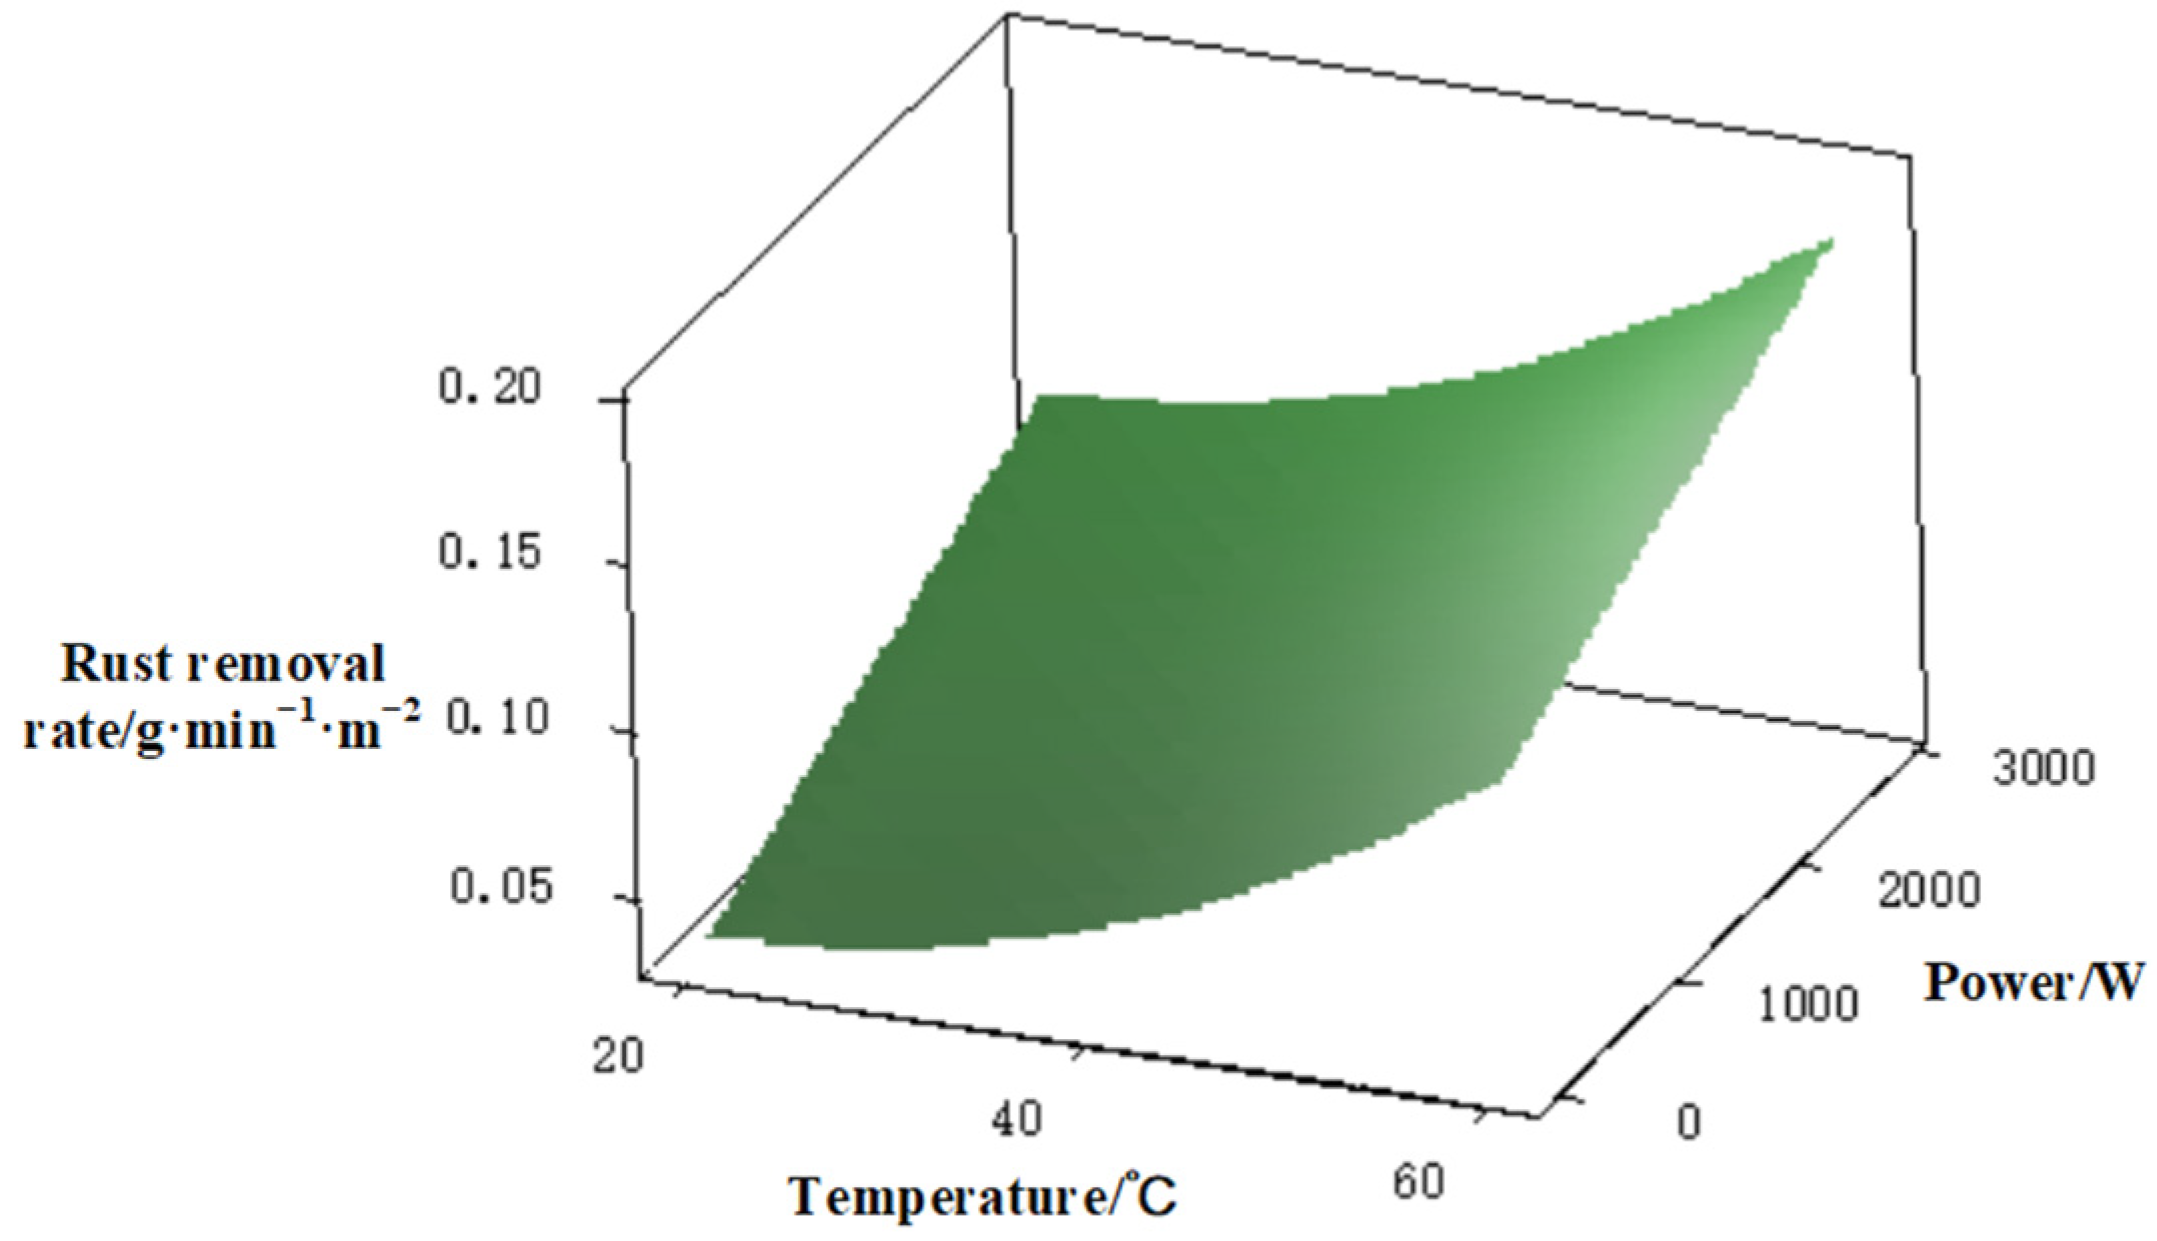
A large number of single-factor tests have proved that cleaning fluid temperature and ultrasonic power have a direct effect on the rust removal rate. However, the joint effect of the two factors on the rust removal process is rarely studied. Response surface methodology (RSM) can be used to study the effects of one or more factors by facilitating the design of a reasonable test scheme, while the optimal conditions or results in the experimental design are found by analyzing the response surface or contours [14,15]. Therefore, this experiment intends to explore the combined effect of temperature and ultrasonic power through the response surface method. Response surface methodology mainly includes central composite design (CCD) and Box–Behnken experimental design (BBD). Of these two, the most widely used is central composite design [16,17]. In the CCD test design, the test points are composed of cube points, center points, and axial points [18,19], which are sequential, efficient, and flexible [20,21]. There are many practical applications of response surface methodologies in process parameter optimization. Yan Dongping et al. [22] used the central composite design to study the effect of process parameters in the milling experiment on the cutting force of the titanium alloy TC21. Yuan Julong et al. [23] optimized the polishing process of YG8 cemented carbide inserts via a response surface methodology so as to quickly determine the best process parameters of YG8 rake face polishing. Wang Qun et al. [24] used a response surface methodology to explore the effects of potassium ferrate dosage in flocculant and water pH on the water turbidity and UV254 removal rate, and optimized process parameters by establishing a secondary response model. Therefore, not only can the RSM establish a continuous mathematical model, but it can also show the interaction between factors, which is often used in process parameter optimization.
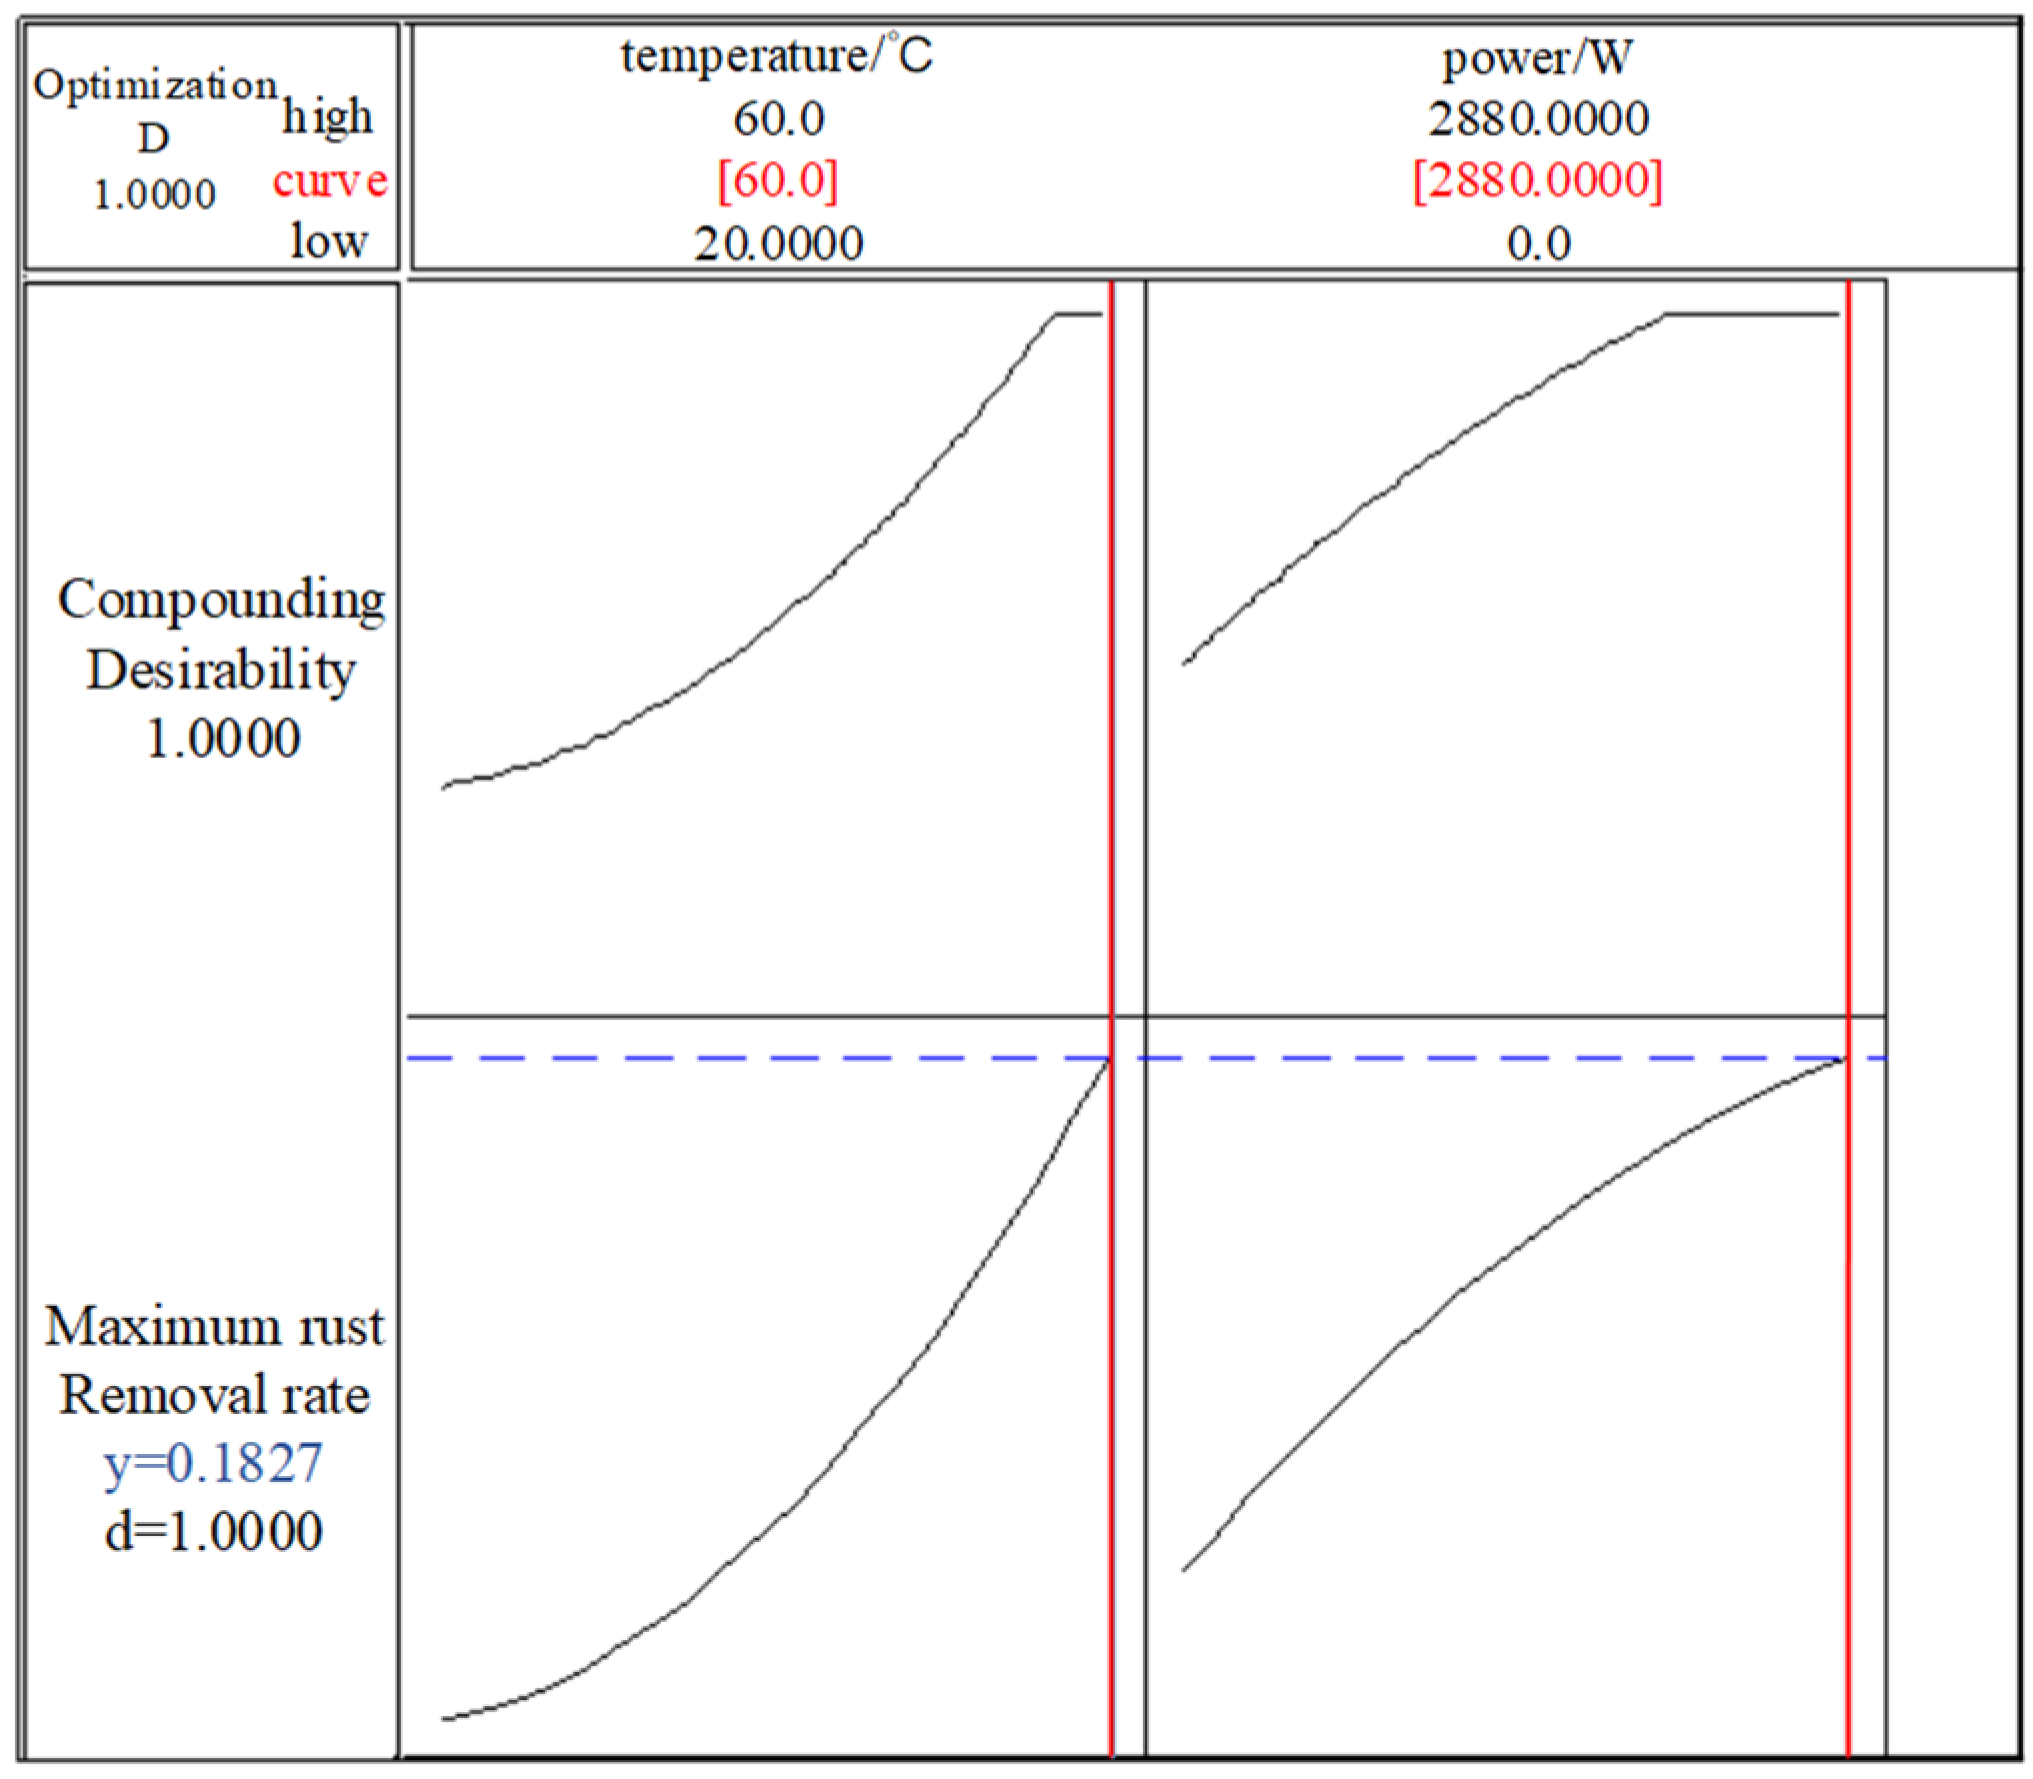
In this paper, the rust removal rate test was designed by combining RSM and CCD. A regression equation and a response surface model were established to study the effect of cleaning temperature and ultrasonic power on the rust removal rate. The optimal parameters of the rust removal process were found, and the cleaning technology was optimized, which provided theoretical support for the application of ultrasonic rust derusting technology in the remanufacturing cleaning field.

2. Experimental Procedure

2.1. Test Samples

A hydraulic cylinder guide sleeve with rust on its surface was used as the test sample. The guide sleeve was made of 45 steel and cut into 35 mm × 25 mm × 10 mm blocks for physical and chemical analysis of the rust layer. The corrosion morphology and the cross-section of the rust layer were observed using a Fei Inspection S50 scanning electron microscope (Thermo Fisher Scientific, Waltham, MA, USA), and the elements in the corrosion layer were analyzed using an Oxford X-act spectrometer. The structure and composition of iron oxide in the rust layer were analyzed using a D8 ADVANCE X-ray diffractometer (Bruker, Karlsruhe, Germany). X-ray diffraction (XRD) measurements were carried out using Cu targets and Kα radiation at 40 kV. The rust layer on the surface of the sample was scraped off, and the scraped sample was fully ground in an agate mortar. This was followed by sample preparation, and then test and result analysis.

2.2. Test Design

The sample for the process parameter optimization test was a uniformly rusted iron sheet with a size of 40 mm × 40 mm × 1 mm. The derusting formula has a main body of 30‰ citric acid, with 6–10‰ sodium dodecylbenzene sulfonate, 6–10‰ JFC (fatty alcohol-polyoxyethylene ether), and 6–10‰ benzotriazole added to perform a 45 s rust removal test. At room temperature, the formula can clean 80% of the rust layer in 45 s. If the cleaning time is extended, the derusting end point cannot be accurately determined, and the rust removal effect of each group cannot be compared. The sample was weighed using FA2004 precision electronic (Yoke Instrument, Shanghai, China) balance with a measurement accuracy of 0.1 mg. We used a self-made derusting test machine (Xuzhou Construction Machinery Group, Xuzhou, China) with an ultrasonic generator and a heating device. The ultrasonic power and cleaning temperature can be adjusted.
The lowest test temperature was the local annual average temperature. The maximum test temperature was related to the material of the derusting test machine. The tank of the machine is made of corrosion-resistant polypropylene material, and the temperature resistance of its bonding part is about 80 °C Since the machine is oriented to industrial applications and has a high frequency of use, the reliability and safety of the machine are particularly important. We chose 60 °C as the maximum heating parameter. The lowest value of power was 0, which is the value where ultrasound was not applied. The maximum power was the maximum value of the ultrasonic generator. Thus, the power regulation range was 0–2880 W, and the cleaning temperature range was 20–60 °C.

3. Results and Discussion

3.1. Response Surface Methodology

Figure 1 shows the scanning electron microscope (SEM) spectra of the rust layer surface and the cross-section, respectively. As shown in Figure 1a, the rust layer on the surface of the sample is uneven, with a maximum cross-section thickness of 66.7 μm and a minimum of 16.7 μm. There are a large number of irregular particles randomly distributed on the surface of the sample. The size of the particles is uneven, and they are connected to form a layer structure on the surface of the sample. The main components of 45 steel are Fe, C, Si, and Mn. The electron diffraction spectroscopy (EDS) results indicate that the elements of the rust layer are in accordance with 45 steel, with the exception of the O content. This shows that the main component of the rust layer is an iron oxide compound.
Iron oxides mainly include (α-β-γ-)Fe2O3, (α-β-γ-δ-)FeOOH, and Fe3O4, which have different valence, crystal form, and structure. Therefore, in order to determine the components of the rust layer, XRD was performed on the rust layer of the sample. The results show that the main components of the rust products are α-FeOOH, γ-FeOOH, and Fe3O4.
According to the SEM and XRD data, the main components of the rust layer are α-FeOOH, γ-FeOOH, and Fe3O4, and the rusted surface is loose and unevenly distributed. Therefore, the pickling agent can be continuously introduced through the act of ultrasonic pickling so that the rust layer can be peeled off from the sample surface. The mechanism of ultrasonic pickling and rust removal is shown in Figure 2.
The environmentally friendly rust remover is mainly composed of an organic acid. It not only etches the rust on the surface of the sample but also chemically reacts with Fe2+ and Fe3+ in the rust layer. Moreover, organic acids will chelate with iron oxides to form stable complexes, which sheds rust from the surface of the sample.
On the basis of chemical etching, the bond between the surface oxide layer and the substrate is destroyed by the strong oscillation from the ultrasonic waves. Because of the ultrasonic cavitation, the cavitation bubbles in the liquid shrink or expand rapidly, resulting in a huge pressure to peel off the loose rust layer on the surface of the sample. In addition, the reacted pickling solution near the rust layer leaves the sample surface through ultrasonic stirring, and the unreacted pickling solution is replenished in time to ensure the efficient and continuous derusting reaction.

3.2. Central Composite Design

3.2.1. Central Compound Test Design

In this rust-cleaning process parameter optimization experiment, the central composite design is used to optimize the cleaning temperature (X) and ultrasonic power (Y). Taking the rust removal rate as the response value (Z), a two-level full factor test is established. Four cubic points, five central points, and four axis points are selected to generate 13 sets of experiments.
The factors and levels are shown in Table 1.

3.2.2. Rust Removal Test

  • According to the generated parameters, the cleaning temperature and ultrasonic power are adjusted. There are 13 groups of test parameters. The test factors and levels are shown in Table 2.
  • According to the order of each experimental group, the rusted iron sheets are numbered and cleaned with absolute alcohol. After drying, the rusted iron sheets are weighed and marked as m0. The weighed iron sheets are then placed into the ultrasonic rust removal tank and cleaned at the specified temperature and ultrasonic frequency for 45 s. The descaling sheets are cleaned with anhydrous ethanol and weighed with electronic balance, which is marked as m1.
  • According to Formula (1), the rust removal rate of a rusted iron sheet under various process parameters is calculated.
V = m 0 m 1 S × t
In the formula, ν represents the rust removal rate (g·min−1·m−2); m0 and m1 represent the mass of the rusted sample before and after 45 s rust removal (g), respectively; S represents the sample area (m2); and t represents the rust removal time (min).
In this experiment, the rust removal rate is used to describe the cleaning effect. The higher the rust removal rate within 45 s, the better the rust removal effect.
The results of the rust removal test and the center composite test design are shown in Table 2.

3.2.3. Regression Analysis

According to the results of central composite test, a quadratic regression model is established to describe the rust removal rate under different cleaning temperature and ultrasonic power conditions. The corresponding cleaning temperature and ultrasonic power are coded and analyzed. Table 3 shows the estimated regression coefficients, with coded units for analysis. X represents cleaning temperature, and Y represents ultrasonic power.
Through analysis, it was found that the p-values corresponding to the main effect of X and Y are (X = 0.000) and (Y = 0.000), which are less than the 0.05 level of significance. The original hypothesis is rejected and the regression is significant. The p-value of X* X is (X* X = 0.016), which is less than 0.05, and the impact is significant. The p-values of Y* Y and X* Y are (Y* Y = 0.167) and (X* Y = 0.468), greater than 0.05. The impact is not significant, so it should be removed from the quadratic regression model. Y* Y and X* Y were removed, and the adjusted coefficients were redistributed, as shown in Table 4.
Table 4 shows the results of the model analysis after removing the insignificant items. The p-values of each group are all less than 0.05, and the model is generally valid.
The analysis of variance is shown in Table 5. The two determination coefficients are (R-Sq = 94.76) and (R-Sq (adjusted) = 93.01%). The difference between them is small and close to 1, which means that the regression is high. The cleaning cycle model is applicable.
Table 6 shows the estimated regression coefficient of the rust removal rate under various cleaning process parameters of a rusted iron sheet (using uncoded unit data).
According to the calculation results after coefficient correction, the modified regression equation can be obtained. The influencing factors in the equation include the first-order effect and second-order effect of cleaning temperature and the second-order effect of ultrasonic power.

3.2.4. Residual Analysis

Residual refers to the difference between the actual observed value and the regression estimated value. Residual analysis is used to analyze the reliability, periodicity, or other disturbances of the data through the information provided by the residual and further characterizes the adaptability of the model equation. The main purpose of residual diagnosis is to diagnose whether the model fits well with the data based on the status of the residuals. The residual diagram of rust removal rate is shown in Figure 3.
As is shown in Figure 3, the residuals of different process parameters conform to normal distribution from the normal probability diagram of residuals. According to the scatter plot with the predicted value of the response variable fitting to the horizontal axis of the residual, the residuals maintain equal variances and have no obvious regularity. There is no ‘funnel shape’ or ‘trumpet shape’. According to the residuals for the scatter plot with the order of observations as the horizontal axis, each point randomly fluctuates up and down the horizontal axis. In summary, the residuals under different process parameters are not abnormal.

3.2.5. Establishment of Regression Equation

After model adjustment, variance analysis, and residual diagnosis, the regression equation of rust removal rate under various cleaning parameters of the corroded iron sheet is obtained, as shown in Equation (2).
R T = 0.0560859 0.00205385 x + 0.0000219022 y + 0.0000522192 x 2 + ε
Among them, RT represents the rust removal rate, x represents the cleaning temperature, y represents ultrasonic power, and ε represents error.

3.2.6. Response Surface

The response surface of rust removal rate is shown in Figure 4.
The light green area in the upper right corner of Figure 4 shows a good rust removal rate, which is greater than 0.175 g·min−1·m−2. It can be seen from Figure 5 that the higher the cleaning temperature, the higher the rust removal rate, and the greater the ultrasonic power, the higher the rust removal rate, which is consistent with the phenomenon observed in the test. This behavior can be explained by considering the aqueous ultrasonic bath type, i.e., the acidic solution. The acid reacts with the rust layer in the rust removal tank, and the hydrogen bubbles thus generated have a peeling effect on the rust layer [25,26]. When the temperature increases, the chemical reaction rate increases, resulting in a faster rust removal rate. The vibration of the ultrasonic vibrator in the rust removal tank generates ultrasonic waves, and the ultrasonic cavitation effect appears in the liquid. When the sound energy reaches the critical point, the cavitation nucleus breaks down and produces a huge impact force, which causes the dirt on the liquid surface to decompose and peel off [27]. At the same time, due to the effect of micro-acoustic flow and local high-pressure impact, the ultrasonic high-speed stirring rust removal solution accelerates the chemical reaction on the surface of the sample, which accelerates the dissolution rate of the dirt [28]. When the ultrasonic power in the sound field increases, the cavitation effect and ultrasonic oscillation effect are intensified. The reaction between the rust remover and the rust layer is accelerated, and the rust removal rate increases.
When the cleaning temperature is at a low level, the response surface increases greatly with the increase in ultrasonic power. When the cleaning temperature is high, the increase in the response surface is small with the increase in ultrasonic power. Therefore, according to the regression equation, when the cleaning temperature is 20 °C, the rust removal efficiency is 0.036 g·min−1·m−2 without ultrasonic power. When ultrasonic power is applied, the rust removal efficiency is 0.099 g·min−1·m−2, which is 2.76 times greater than the former. When the ultrasonic power is low, the increase in the response surface is larger. When the ultrasonic power is high, the increase in the response surface is small with the increase in cleaning temperature. Therefore, according to the regression equation, when the ultrasonic power is 0, the rust removal efficiency is 0.036 g·min−1·m−2 without heating. After heating, the rust removal efficiency is 0.12 g·min−1·m−2, which is 3.37 times greater than the former. Thus, in the experimental range, the influence of temperature on the rust removal rate of 45 steel is greater than that of ultrasonic power.

3.2.7. Response Optimization

The response variable optimizer is used to obtain the minimization optimization result of the cleaning cycle of the rusty iron sheet, as shown in Figure 5.
As shown in Figure 5, the optimal value of the rust removal rate is reached when the cleaning temperature is 60 °C and the ultrasonic power is 2880 W. At this point, the rust removal rate is 0.1827 g·min−1·m−2, and the desirability (d) is 1.0000.

3.2.8. Result Verification

With the increase in temperature, the speed of chemical reaction and rust removal increases. However, in practical applications, the increase in temperature will lead to the corrosion of the substrate material by the acidic rust remover, which causes hydrogen embrittlement. Results show that the pickling temperature is generally controlled within 60~70 °C. Therefore, considering the rust removal rate and the application scope of rust remover, we can reduce the temperature appropriately and choose 55 °C as the optimal rust-cleaning temperature.
The cleaning temperature should therefore be set to 55 °C and the ultrasonic power to 2880 W. The experiment was designed to ultrasonically clean the sample cylinder guide sleeve for 45 s. Figure 6 shows the micromorphology of the sample before and after cleaning. The results show that most of the rust on the sample surface was removed after cleaning. The rust removal rate at this time is calculated to be 0.15 g·min−1·m−2.

4. Conclusions

  • This paper takes the rust of a cylinder guide sleeve as an example of how to optimize rust removal efficiency and use the environmentally friendly citric acid as an alternative to traditional cleaning chemicals for rust removal. Under the action of H+ and ultrasonic cavitation impact, the rust layer reacts and peels off.
  • The regression equation and response surface model of rust removal rate were obtained by using a central composite test method. The higher the cleaning temperature and the ultrasonic power, the higher the rust removal rate. Considering the rust removal rate and the application scope of rust remover, we chose 55 °C as the optimal rust-cleaning temperature.
  • The optimal process parameters of ultrasonic rust removal have been determined. The cleaning temperature is 55 °C, the ultrasonic power is 2880 W, and the descaling rate under the optimal parameters is 0.15 g·min−1·m−2.

Author Contributions

Conceptualization, L.Z. and B.H.; methodology, B.H.; investigation, S.W. and G.W.; writing—original draft preparation, B.H.; writing—review and editing, L.Z. and B.H.; supervision, X.Y. and G.W. All authors have read and agreed to the published version of the manuscript.

Funding

This research was funded in part by the National Key Research and Development Program 2019YFB2005302 and 2019YFB2005301.

Institutional Review Board Statement

Not applicable.

Informed Consent Statement

Not applicable.

Data Availability Statement

Not applicable.

Acknowledgments

Not applicable.

Conflicts of Interest

The authors declare no conflict of interest.

References

  1. Xu, B. Remanufacturing of construction machinery and its key technology. Constr. Mach. Equip. 2009, 40, 1–7. [Google Scholar]
  2. Liu, S.W. Research on Cleaning Technology of Remanufacturing Blank. Ph.D. Thesis, Department Mechanical Design and Theory Engineering, Shanghai Jiaotong University, Shanghai, China, 2010. [Google Scholar]
  3. Kiyak, M.; Altan, M.; Altan, E. Prediction of chip flow angle in orthogonal turning of mild steel by neural network approach. Int. J. Adv. Manuf. Technol. 2006, 33, 251–259. [Google Scholar] [CrossRef]
  4. Zhao, H.H. Study on Preparation and Properties of Water-Based Rust Conversion Agent; Tianjin University of Science and Technology: Tianjin, China, 2017. [Google Scholar]
  5. Niemczewski, B. Influence of concentration of substances used in ultrasonic cleaning in alkaline solutions on cavitation intensity. Ultrason. Sonochem. 2009, 16, 402–407. [Google Scholar] [CrossRef] [PubMed]
  6. Bi, C.X.; Yang, W.; Meng, M.L. Research on ultrasonic derusting technology for ferrous metal parts of armored equipment. Equip. Manuf. Technol. 2009, 1, 105–107. [Google Scholar]
  7. Qin, S.S. Research and Application of Ultrasonic Cleaning for Remanufacturing. Ph.D. Thesis, Department Industry Engineering, Shandong University, Jinan, China, 2012. [Google Scholar]
  8. Zhang, M.C. Study on Influence Factors of Ultrasonic Cleaning and Cavitation Field; Shaanxi Normal University: Xian, China, 2013. [Google Scholar]
  9. Cao, Y.Y.; Lin, S.Y. Study on the Interaction Between Two Ultrasonic Cavities. J. Shaanxi Norm. Univ. 2010, 38, 46–50. [Google Scholar]
  10. Collazo, A.; Novoa, X.R.; Pérez, C.; Puga, B. The corrosion protection mechanism of rust converters: An electrochemical impedance spectroscopy study. Electrochim. Acta 2010, 55, 6156–6162. [Google Scholar] [CrossRef]
  11. Zhang, C.; Sun, Y.H.; Jia, X.J.; Li, F.Y.; Yang, M.B.; Xin, B.L.; Wang, X.; Wang, G.C. Research and process optimization of paint removal technology based on molten salt ultrasonic composite. Surf. Technol. 2018, 47, 280–287. [Google Scholar]
  12. Wang, J.; Fu, M.; Ding, P.D.; Zhang, M.H. Study on ultrasonic pickling process of iron and steel. Surf. Technol. 2004, 33, 30–32. [Google Scholar]
  13. Lin, J.Z. Application analysis of citric acid in chemical cleaning. Guizhou Chem. Ind. 2011, 36, 33–35. [Google Scholar]
  14. Shao, M.W.; Wang, J.; Qiao, X.; Li, X.G.; Zhao, H. Friction sensitivity theory of solid propellant based on response surface central composite design. Chin. J. Energetic Mater. 2019, 26, 509–515. [Google Scholar]
  15. Wang, G.; Wang, X.; Song, X.; Zheng, X. Comparison of BBD and CCD in optimization of preparation conditions of mercaptoacetylated chitosan by Response Surface Methodology. J. Environ. Eng. 2018, 12, 2502–2511. [Google Scholar]
  16. Wang, Y.F.; Wang, C.G. Theory and application of response surface methodology. J. Minzu Univ. China 2005, 14, 236–240. [Google Scholar]
  17. Li, J.F. Optimization of Extraction Process of Low Grade Ionic Rare Earth by Response Surface Methodology; Jiangxi University of Science and Technology: Ganzhou, China, 2018. [Google Scholar]
  18. Sun, C.; Ning, J.; Song, Z.X.; Xie, P.; Tang, Z.S. Optimization of extraction process of total flavonoids from seabuckthorn pomace by central composite design response surface methodology. Mod. Chin. Med. 2018, 20, 74–82. [Google Scholar]
  19. Zi, J.Y.; Zhang, S.P.; Li, Y.Q.; Zhou, W. Optimization of diesel engine performance parameters based on response surface design. Small Intern. Combust. Engine Veh. Technol. 2020, 49, 28–34. [Google Scholar]
  20. Zhang, Z.H.; Zhen, H.; Guo, W. A comparative study of three types of central composite design in response surface methodology. J. Shenyang Aerosp. Univ. 2007, 24, 87–91. [Google Scholar]
  21. Liu, W.; Zhang, Y.; Cheng, T.C.; Wang, H.Y. Optimization design of exhaust manifold response surface based on face center combination. Mech. Strength. 2021, 43, 137–144. [Google Scholar]
  22. Yan, D.P.; Jiang, B. Optimization of milling parameters for titanium alloy TC21 based on response surface methodology. Tool Eng. 2016, 50, 18–22. [Google Scholar]
  23. Yuan, J.L.; Mao, M.J.; Li, M.; Liu, S.; Wu, F. Optimization of chemical mechanical polishing process parameters for YG8 cemented carbide blade based on response surface methodology. China Mech. Eng. 2018, 29, 2290–2297. [Google Scholar]
  24. Wang, Q.; Chai, B.; Lu, X.H.; Bai, X.F.; Liu, L.J. Optimization of coagulation effect by potassium ferrate pre oxidation by response surface methodology. Technol. Water Treat. 2017, 43, 42–46. [Google Scholar]
  25. Bi, C.X.; Yang, W.; Lu, M.L. Research on ultrasonic rust removal technology for ferrous metal parts of armored equipment. Equip. Manuf. Technol. 2009, 30, 105–107. [Google Scholar]
  26. Bi, J.C.; Zhang, X.D.; Xu, F. Neutral Rust Remover. China Patent 103,938,217, 2 July 2014. [Google Scholar]
  27. Sun, Y.; Huang, S.Y.; Mao, Y.L.; Zhu, L.H. Crushing effect of near wall ultrasonic cavitating micro jet on fine particles. China Mech. Eng. 2019, 30, 2953–2960. [Google Scholar]
  28. Huang, S.Y. Study on the Crushing Effect of Ultrasonic Cavitation Near the Wall in Rotating Flow Field on Fine Particles; Zhejiang University of Technology: Hangzhou, China, 2019. [Google Scholar]
Figure 1. The surface rust characterization of the corroded specimen: (a) SEM picture of rust layer surface. (b) SEM picture of rust layer section. (c) EDS diagram of rust layer surface. (d) Corroded specimen of test. (e) XRD spectrum of corrosion layer.
Coatings 11 01127 g001
Figure 2. Schematic diagram of ultrasonic descaling process.
Coatings 11 01127 g002
Figure 3. Residual diagram of rust removal rate under various cleaning parameters.
Coatings 11 01127 g003
Figure 4. Evolution of rust removal rate with respect to cleaning temperature and ultrasonic power under various cleaning parameters.
Coatings 11 01127 g004
Figure 5. Optimization of rust removal rate under various cleaning parameters.
Coatings 11 01127 g005
Figure 6. SEM surface morphology of the cylinder guide sleeve: (a) before rust cleaning; (b) after rust cleaning.
Coatings 11 01127 g006
Table 1. Test factor level table.
FactorCodeVariable Level
−1−0.700.71
Cleaning temperature (/°C)X2026405460
Ultrasonic power (/W)Y0432144024482880
Table 2. Center composite test design and the rust removal test results.
NumberXYCleaning Temperature/(°C)Ultrasonic Power/(W)Rust Removal Rate/(g·min−1·m−2)
1004014400.087
2014028800.119
3106014400.158
40.7−0.7544320.095
5004014400.083
6004014400.098
7−0.7−0.7264320.044
8004014400.105
90−14000.058
10−0.70.72624480.090
11004014400.089
120.70.75424480.153
13−102014400.069
Table 3. Estimated regression coefficient of rust removal rate under various cleaning parameters.
TermCoefficientStandard Error of CoefficientT-Value (abs.)p-Value (abs.)
Constant0.09230.003625.3300.000
X0.03000.002910.4220.000
Y0.02230.00297.7390.000
X* X0.00980.00313.1790.016
Y* Y−0.00480.0031−1.5400.167
X* Y0.00310.00410.7670.468
Table 4. Estimated regression coefficient of rust removal rate under various cleaning process parameters of corroded iron sheet (removal of insignificant items).
TermCoefficientStandard Error of CoefficientT-Value (abs.)p-Value (abs.)
Constant0.08900.003128.7450.000
X0.03000.00309.9060.000
Y0.02230.00307.3560.000
X* X0.01040.00323.2400.010
Table 5. Variance analysis of rust removal rate under various cleaning process parameters (R-Sq = 94.76%, R-Sq (forecast) = 89.30%, R-Sq (adjustment) = 93.01%).
SourceFreedomSeq SSAdj SSAdj MSF-Value (abs.)p-Value (abs.)
Regression30.0119670.0119670.00398954.250.000
Linear20.0111950.0111950.00559776.120.000
X10.0072160.0072160.00721698.140.000
Y10.0039790.0039790.00397954.110.000
Square10.0007720.0007720.00077210.500.010
X* X10.0007720.0007720.00077210.500.010
Error90.0006620.0006620.000074
Misfit50.0003520.0003520.0000700.910.553
Pure error40.0003100.0003100.000078
Total120.012629
Table 6. Regression coefficient of the rust removal rate under various cleaning process parameters of a rusted iron sheet (using uncoded unit data).
TermCoefficient
Constant0.0560859
X−0.00205385
Y0.0000219022
X* X0.0000522192
Publisher’s Note: MDPI stays neutral with regard to jurisdictional claims in published maps and institutional affiliations.

