Article

Anodic ZnO Microsheet Coating on Zn with Sub-Surface Microtrenched Zn Layer Reduces Risk of Localized Corrosion and Improves Bioactivity of Pure Zn

Institute for Surface Science and Corrosion, Department of Materials Science and Engineering, University of Erlangen-Nürnberg, Martensstrasse 7, 91058 Erlangen, Germany
*
Author to whom correspondence should be addressed.
Coatings 2021, 11(5), 486; https://doi.org/10.3390/coatings11050486
Submission received: 24 March 2021 / Revised: 12 April 2021 / Accepted: 16 April 2021 / Published: 21 April 2021
(This article belongs to the Section Bioactive Coatings and Biointerfaces)

Abstract

:
Zinc-based alloys are emerging as an alternative to magnesium- and iron-based alloys for biodegradable implant applications, due to their appropriate corrosion performance and biocompatibility. However, localized corrosion occurring on the zinc surface, which is generally associated with restricted mass transport at specific surface sites, such as in confined crevices, declines mechanical strength and can lead to the failure of implant materials. In order to improve corrosion behavior and bioactivity, we explore the effect of a ZnO microsheet coating fabricated on pure Zn via anodic oxidization. Samples were characterized with Scanning Electron Microscope (SEM) (including Energy Dispersive Spectroscopy (EDS), X-ray Photoelectron spectroscopy (XPS), Fourier Transform Infrared Spectroscopy (FTIR), and X-ray Diffraction (XRD)). The microstructured surface consists of parallel Zn trenches on the bottom and ZnO/Zn3O(SO4)2 sheets on the top. This layer shows favorable Ca-phosphate precipitation as well as bovine serum albumin (BSA) adsorption properties. Electrochemical experiments indicate an increased corrosion resistance of surface-modified Zn by the presence of BSA in simulated body fluid. Most noteworthily, localized corrosion that has been previously observed for pure Zn in BSA-containing electrolytes does not occur on the Zn/ZnO-coated surface.

1. Introduction

Recently, zinc and its alloys have spurred great interest thanks to their physiological function and suitable biodegradation rate [1,2,3,4]. As an essential element for humans, Zn plays a crucial role in biological functions, including the synthesis of enzymes as well as signal transduction, bone formation, and the maintenance of immune and nervous systems [5]. The standard electrode potential of the three most researched biodegradable metals (Mg/Zn/Fe) is −2.37, −0.76, and −0.44 V, respectively [6]. As corrosion of Mg may be too fast (especially in the initial stage of biodegradation), and Fe has been reported to corrode too slowly in the biological environment, Zn may be considered a promising candidate for clinical requirements in term of degradation rate [7]. The main drawback of Zn-based materials is their insufficient mechanical properties; however, Zn-Mg, Zn-Cu, and other alloys are being developed to solve this problem [8,9,10]. Cytotoxicity of Zn is Zn2+ concentration-dependent; burst release of Zn2+ showed a negative effect on cell proliferation [11,12,13]. The concentration of Zn2+ depends on the degradation rate of Zn; thus, it is essential to regulate the corrosion behavior of Zn-based metals.
In this study, we therefore investigate the influence of an anodically grown oxide layer on Zn on its corrosion behavior in simulated body fluid (SBF). Anodic oxidation is a facile and well-established method to fabricate a protective coating on the surface of metals. In the case of Zn, ZnO is the main product of anodization in many electrolytes [14,15,16,17,18]. ZnO itself has excellent properties as a biomaterial, such as antibacterial activity and enhancement of bone formation [1,18,19,20]. Anodization can also be used for the fabrication of nanostructured layers (e.g., nanotubular or nanoporous oxide layers) on many metals and alloys [20]. Such nanostructured surfaces have been shown to be advantageous for biological performance [21]. In our previous work [16], ZnO nanotube layers were fabricated on the surface of pure Zn. Long-term immersion measurements in SBF indicate a stronger Ca-phosphate precipitation on the ZnO nanotube coating, demonstrating a better apatite formation ability compared to bare Zn. Guillory et al. [22] studied anodic ZnO layer on pure Zn, showing a higher corrosion resistance for the anodized Zn as compared with electropolished Zn; moreover, localized corrosion that was observed on electropolished Zn (in immersion test in Hank’s solution for 28 days) could be suppressed by the anodic layer. In addition, ZnO-coated layered Zn showed a better performance in in vivo tests. Bordbar-Khiabani et al. [23] prepared a ZnO coating by plasma electrolytic oxidation, with a beneficial effect on the corrosion and metal release.
In the present work, a dual structured Zn/ZnO layer was fabricated on pure Zn via anodization. The aim was to inhibit the initial burst release of Zn2+ by the presence of a coating on Zn, as well as to improve the bioactivity of pure Zn by structuring the surface. The influence of anodization parameters on the morphology of the layer is presented. Ca-phosphate formation was investigated via long-term immersion measurements in simulated body fluid. Albumin is the most abundant protein in blood plasma. In the physiological environment, implant materials are in contact with not only inorganic components of blood, but also with many organics, such as amino acids, proteins, and cells. In this study, we therefore studied the effect of BSA on corrosion of the anodically treated surfaces in comparison with bare Zn. BSA adsorption was studied by long-term immersion and subsequent surface analysis.

2. Experimental

2.1. Materials

Zinc foil (99.99%) (CAS number: 7440666) with a thickness of 0.125 mm was purchased from Advent Research Materials Ltd. (Oxford, UK). The chemical composition of simulated body fluid is shown in Table 1; the pH was adjusted to 7.42–7.45 with HCl and Tris. Bovine serum albumin (BSA, 66 kDa, CAS number: 9048468, St. Louis, MO, USA) was purchased from Sigma Aldrich, and 6.6 g/L was used in SBF/BSA electrolyte.

2.2. Fabrication of Dual Structured ZnO Layer

Zinc foil was cut into 12.5 × 12.5 mm2 sized samples that then were ground up to a 1200 SiC finish. Subsequently, samples were cleaned in ethanol and acetone (1:1) in an ultrasonic bath and dried in a nitrogen stream before anodization. An O-ring cell with a working area of 0.785 cm2 was used for anodization treatment. Pure Zn was used as anode, while platinum foil served as cathode. A low concentration of (NH4)2SO4 (6.8 mM aqueous solution) was used as electrolyte. The volume of the electrolyte for anodization was set as 30 mL/sample. The anodization process was carried out under different times (30 s–30 min) and voltages (1–30 V, DC) at room temperature (20–24 °C). After that, samples were cleaned with deionized water and ethanol to remove the residual electrolyte and water on the surface. Finally, the samples were annealed at 400 °C in air for 2 h.

2.3. Long Term Immersion Test

Corrosion behavior and Ca-phosphate precipitation ability were investigated via long-term immersion measurement (up to 21 days). Two electrolytes were used as a pseudo-physiological solution: SBF and SBF + 6.6 g/L BSA. A CO2 incubator (New Brunswick, Galaxy 14S, St. Albans, UK) was used to carry out the immersion test. The temperature was set as 37 °C, and a humid environment with 5% CO2 was used as the working condition. In order to inhibit microbial growth, samples were disinfected with ethanol, and culture tubes and the incubator chamber were sterilized with isopropanol. Samples were immersed in 20 mL/cm2 electrolyte for different periods (3, 7, 14, and 21 days). The electrolytes were refreshed every 24 h. The samples were washed with deionized water three times and then dehydrated with ethanol after the immersion test.

2.4. Surface Morphology and Chemical Composition

A scanning electron microscope (SEM, Hitachi S4800, Hitachi, Japan) was used to study the surface morphology of both anodization samples and immersion test samples. Ion milling (IM4000, Hitachi, Japan) was used to prepare cross-sectional samples. Fourier transform infrared spectroscopy (FTIR, Shimadzu, Kyoto, Japan), X-ray photoelectron spectrometer (XPS, PHI 5600, Waltham, MA, USA), and X-ray diffractometer (XRD, Phillips, Amsterdam, Netherlands) were used to further characterize the chemical compositions. BSA adsorption on the Zn/ZnO sample was determined via time-of-flight secondary ion mass spectrometry (TOF-SIMS, ION-TOF, Münster, Germany). The measured area was 100 × 100 μm2; the primary ion dose density (PIDD) was set as 5 × 10¹¹ ion/cm2. Three different surface sites were measured for each sample.

2.5. Electrochemical Measurements

An electrochemical workstation (Zahner, IM6-ex, Kronach, Germany) was applied for characterizing the corrosion behavior of as-prepared samples at room temperature. A conventional three-electrode system and an O-ring cell were used for electrochemical measurements. Ag/AgCl (3M KCl) was used as a reference electrode, while a Pt sheet served as a counter electrode. SBF without and with 6.6 g/L BSA were used as electrolytes, and 50 mL of electrolyte was used for each sample. First, the open circuit potential (OCP) was measured for one hour for stabilizing the system. Electrochemical impedance spectroscopy (EIS) measurements were carried out in a frequency range from 105–10−2 Hz with an amplitude of +/− 10 mV. The scan rate for potentiodynamic polarization curves was 1 mV/s in a potential range from −2 to 0 V.

3. Results

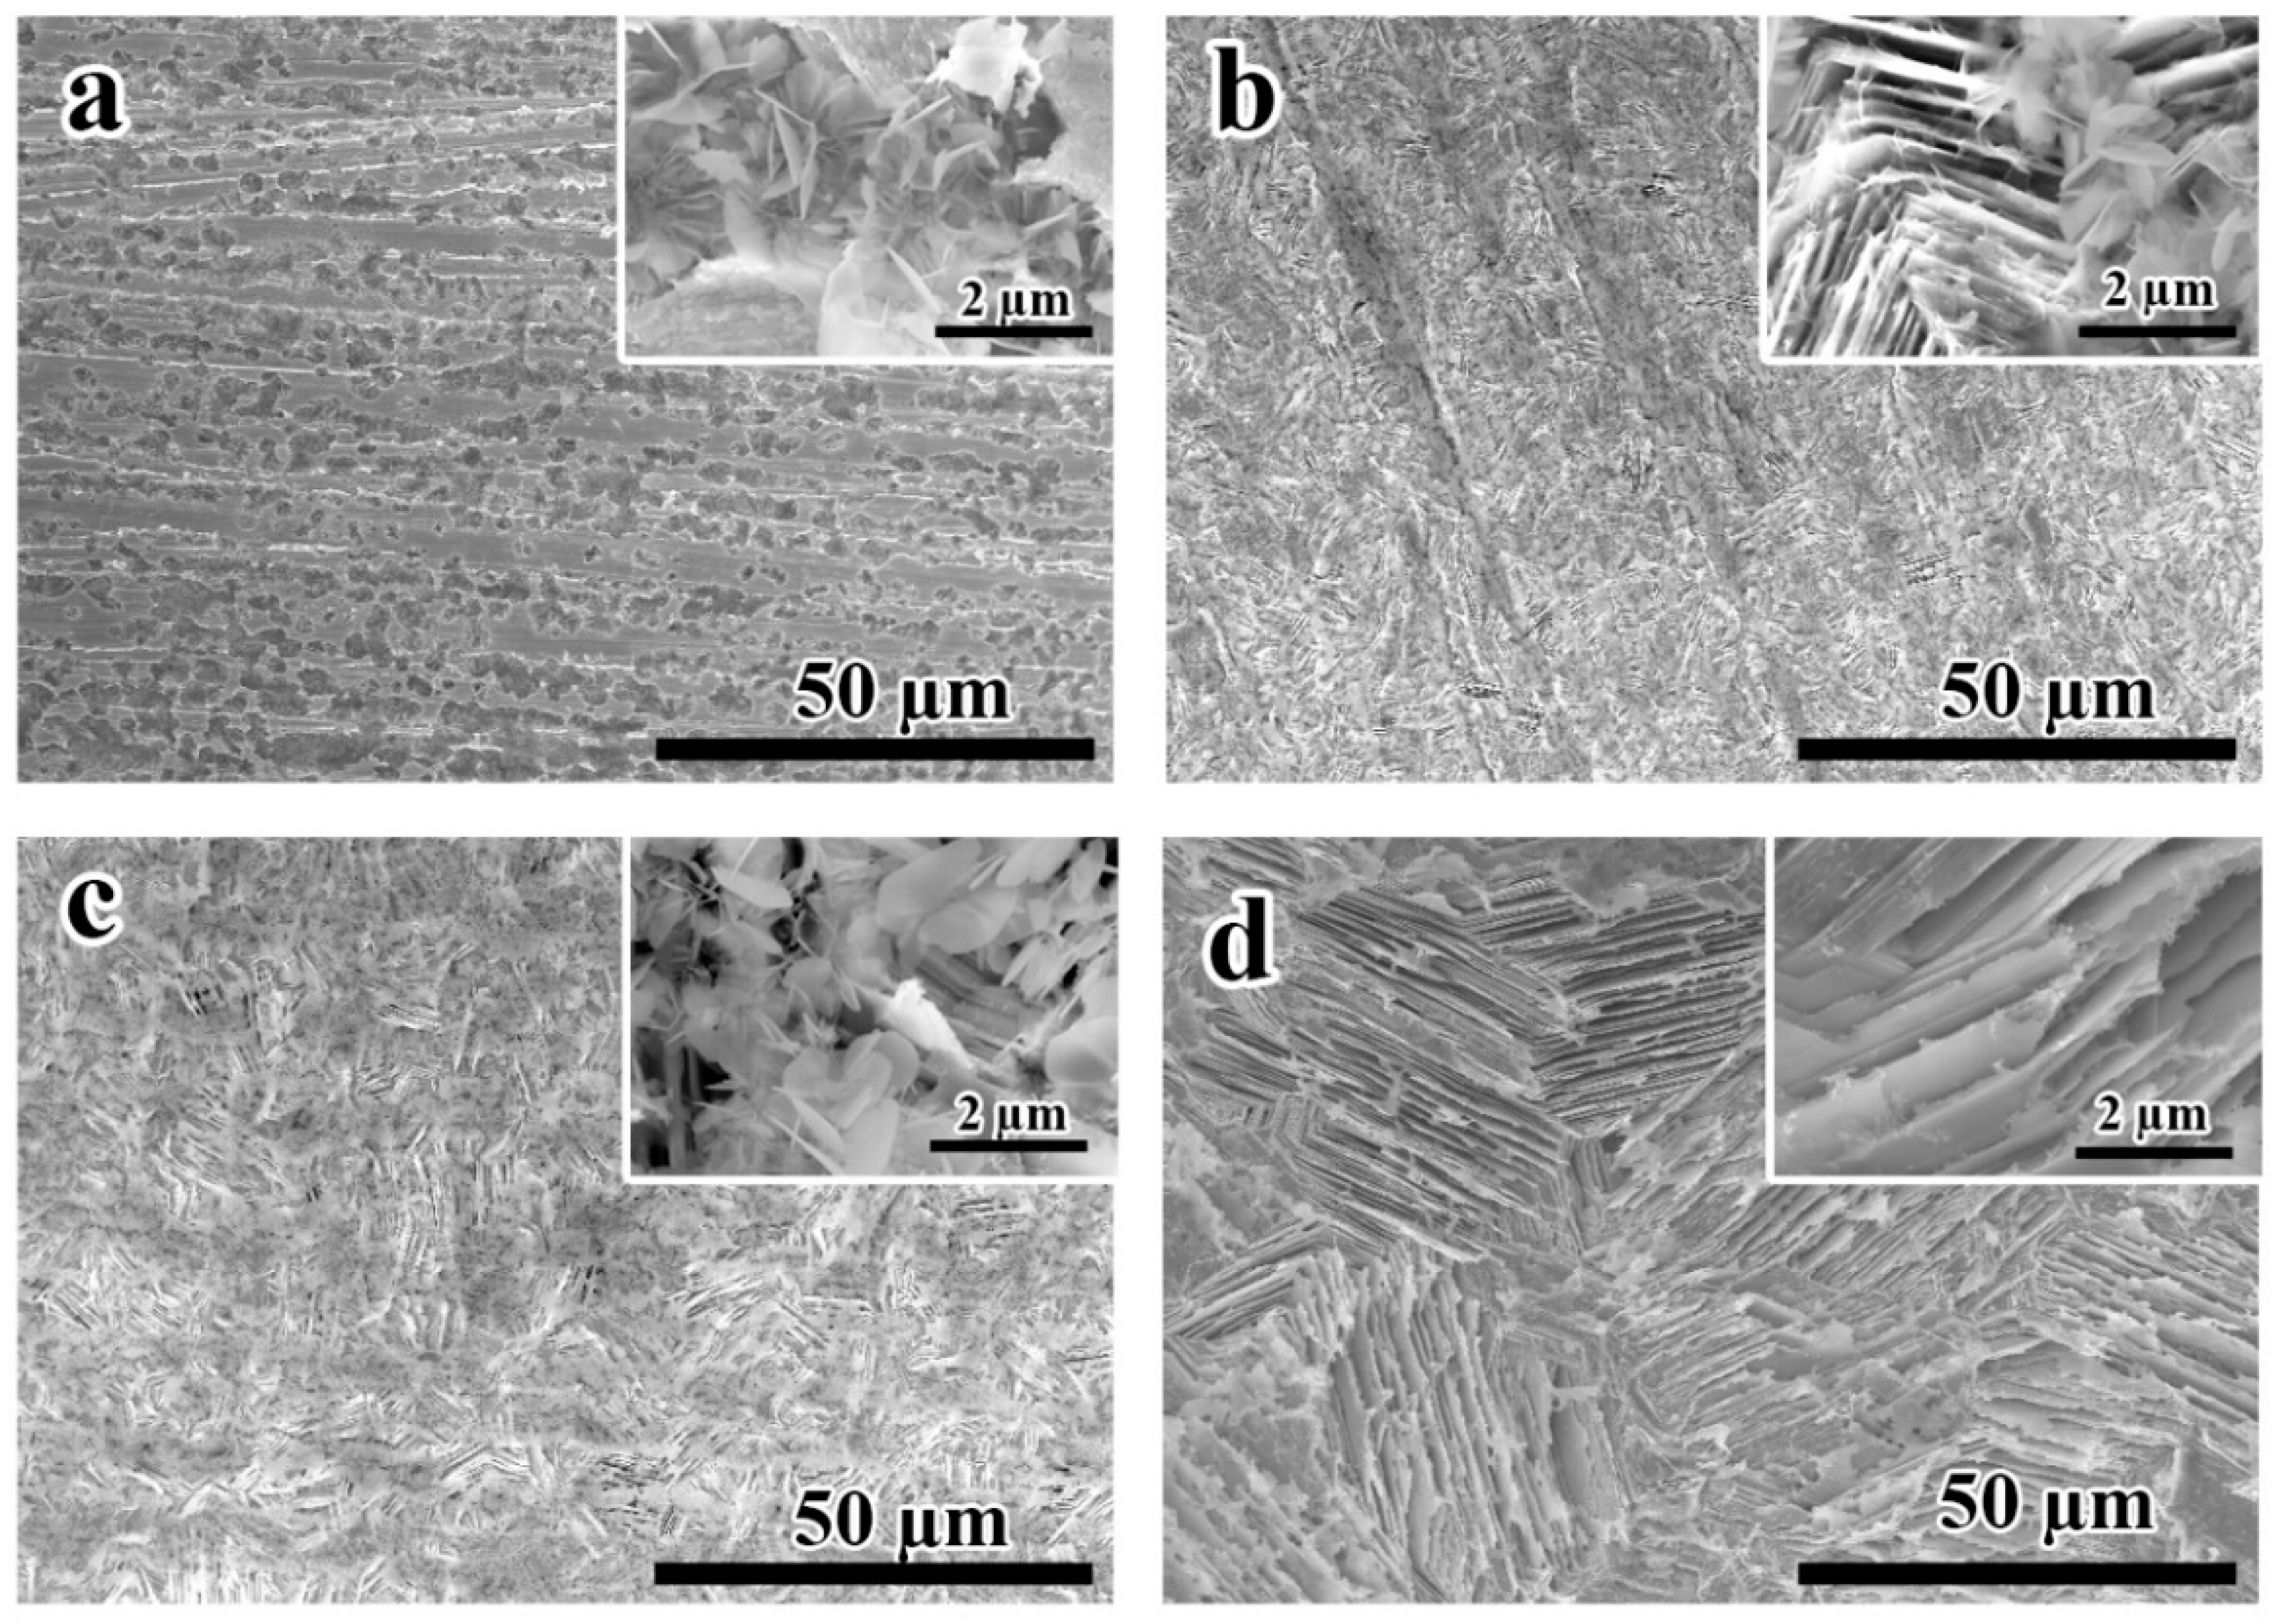
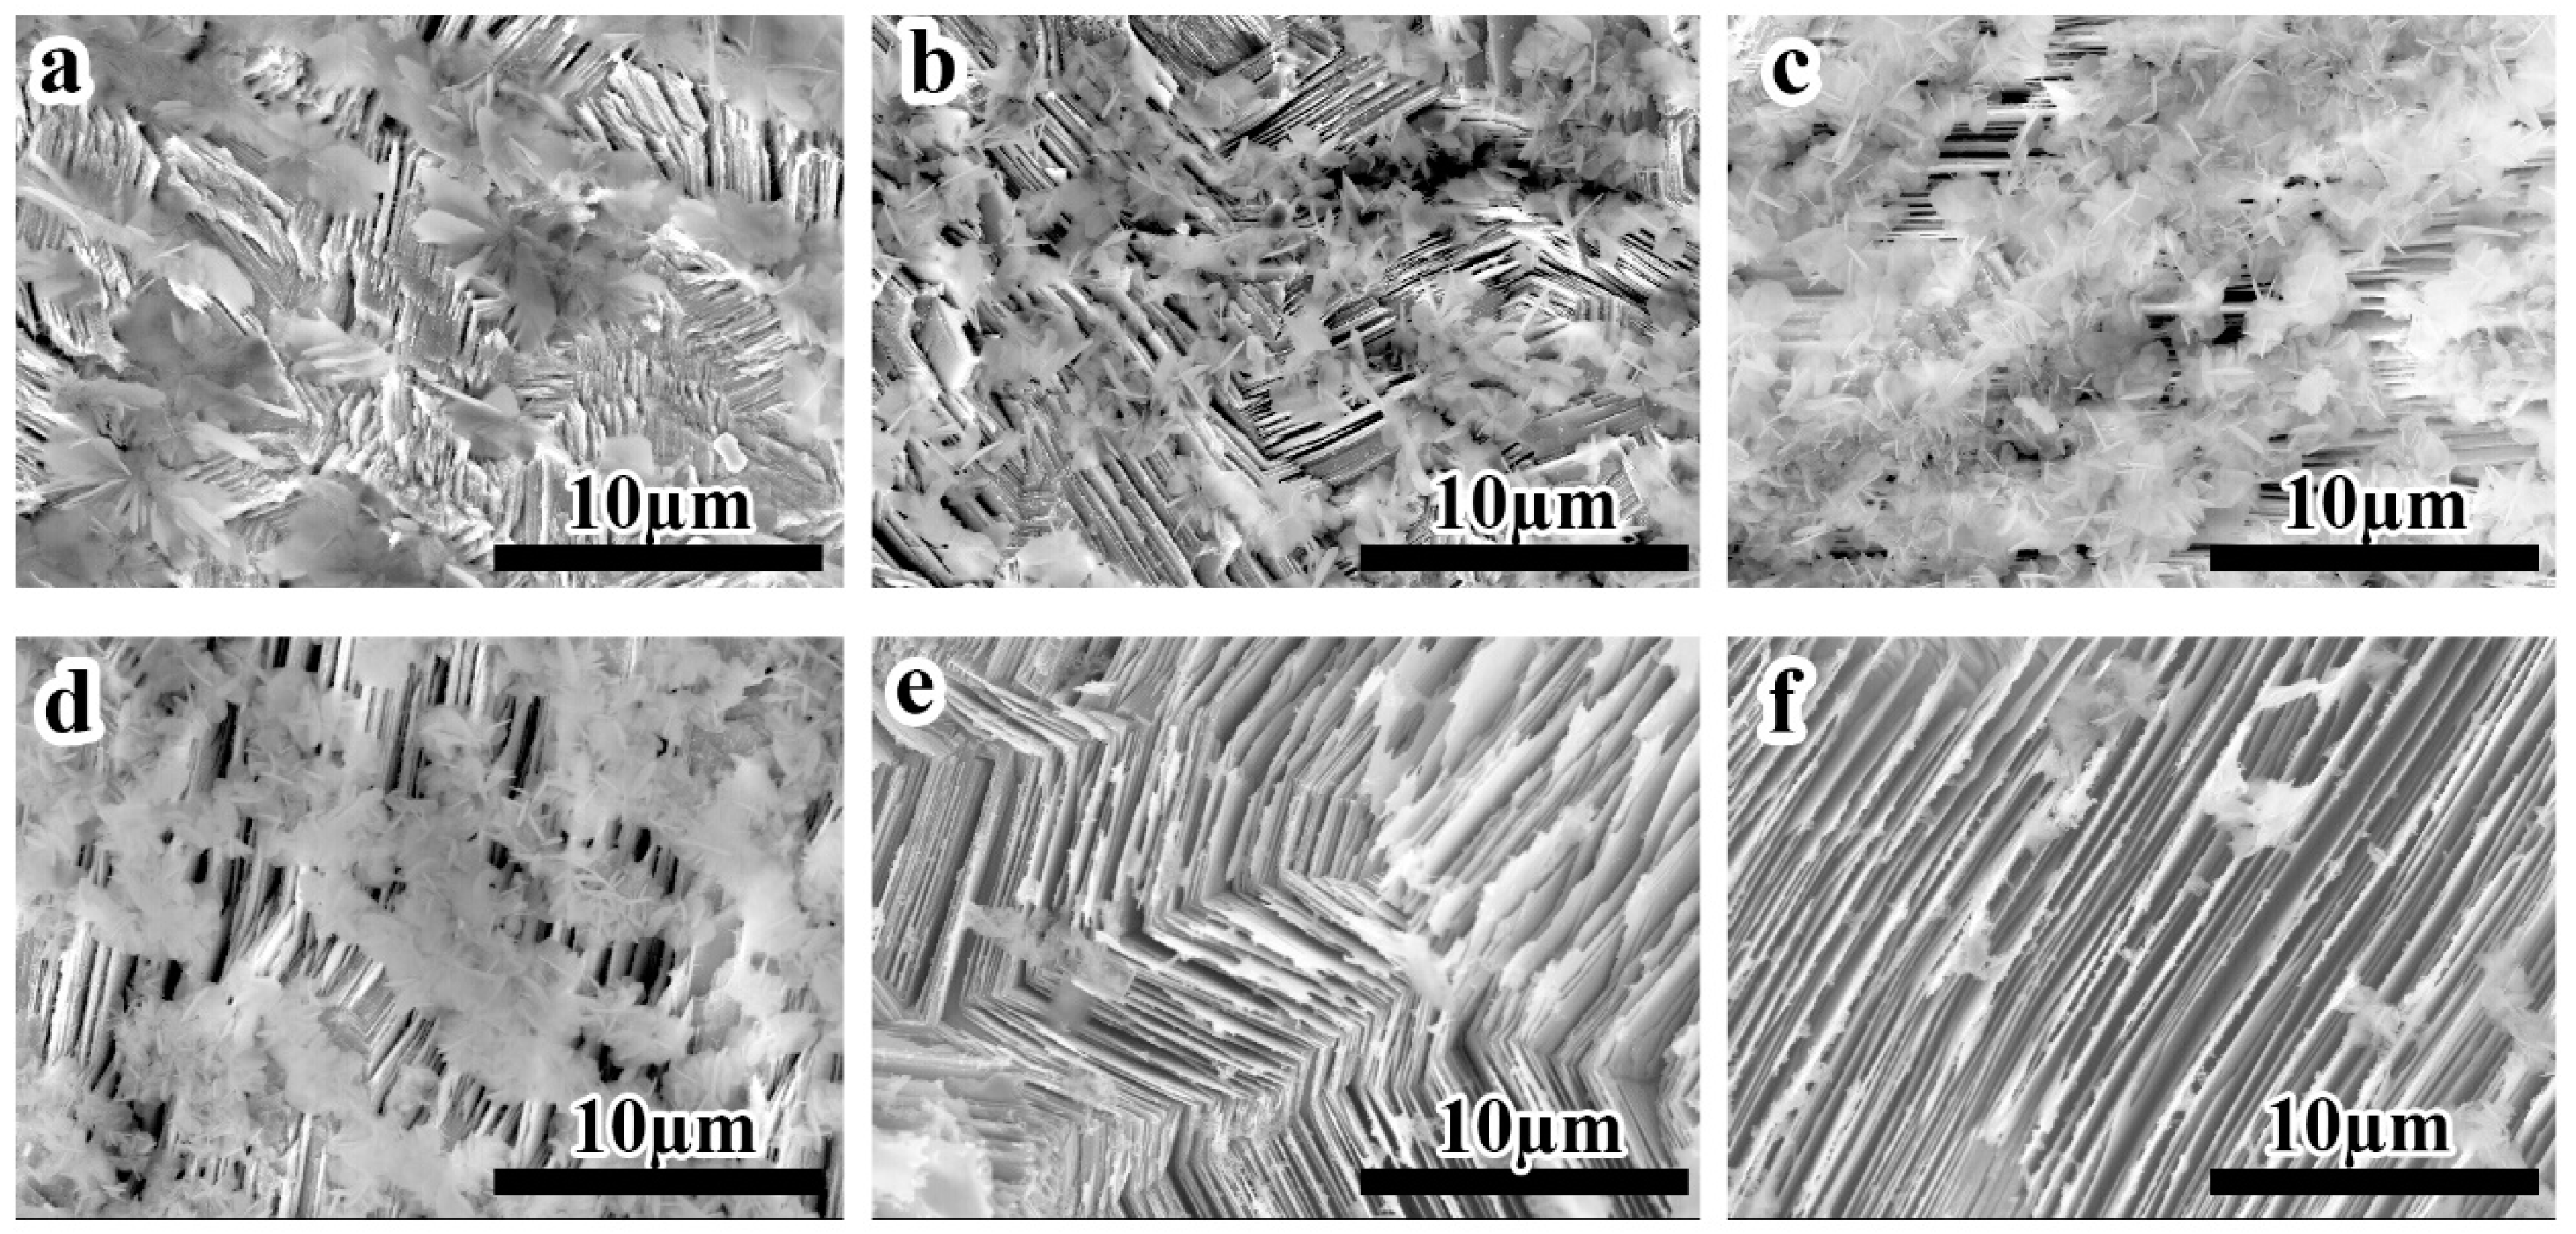
3.1. Surface Morphology

Figure 1 shows the surface and cross-section morphology of samples anodized in 6.8 mM (NH4)2SO4 at 10 V for 15 min. The sample surface is fully covered with microsheets (Figure 1a); the size of the uniformly distributed microsheets is around 3 μm, whereas the thickness of the sheet is in the nanometric scale range. A structure with parallel Zn trenches is seen beneath the microsheets (Figure 1c,d), the thickness of the trenched Zn region is around 500 nm. It has been reported that pure Zn showed a trenching morphology after etching in sulfuric acid [24]; the parallel trenches observed in this work may hence have resulted from anodizing in acidic (NH4)2SO4 solution.
To elucidate the formation mechanism of this dual structure, anodization was carried out for different durations and voltages. Figure 2 shows the SEM images of Zn after anodization in 6.8 mM (NH4)2SO4 under 10 V for different times. As seen in Figure 2a, scratches from the original surface treatment are still observed after anodization for 30 s; at the same time, microsheets are preferentially formed inside the scratches. Possibly the residual compressive strains introduced by the grinding process contributed to this site-specific growth. The high magnification image inserted in Figure 2a indicates the size of the initial microsheets being approximately 1 μm. With a longer duration, more microsheets are formed on the surface (Figure 2b). Nearly full coverage of the Zn surface with increasing size of the sheets is observed after 8-min treatment (Figure 2c). Interestingly, sheets disappeared after a longer anodization time of 30 min, and only the trenched surface (that otherwise is present beneath the sheet layer) is observed (Figure 2d). In general, the reactions occurring during anodization of Zn are as follows:
Zn → Zn2+ + 2e
2H2O → O2 + 4H+ + 4e
The Zn2+ (formed in Reaction (1)) at the interface of Zn and the electrolyte is the material source for the sheets. At the same time, the pH on the interface decreases due to Reaction (2). It should be mentioned that the low concentration electrolyte used in this study is more pH-sensitive than buffered systems often used in anodization. With the extension of anodization, sheets are dissolved in the acidic electrolyte.
Figure 3 shows the surface morphology resulting from anodization at different voltages ranging from 1 to 30 V. It is clear that sheets and parallel trenches are not well grown under low voltage (Figure 1a,b), indicating only a weak etching effect of the electrolyte under these conditions. Well-grown sheets were observed on the surface under 10 and 15 V (Figure 1c,d). However, fewer sheets are precipitated for anodization at 15 V and with further increase of voltage (20 and 30 V), sheets are no longer observed on the surface (Figure 1e,f). Under high voltage. Reaction (2) is enhanced; therefore, acidification of the electrolyte inhibits the growth of the sheets. These results indicate that the formation of sheets is controlled by growth and dissolution processes. Well-grown sheets were here fabricated by anodization at 10 V for 15 min; all further experiments were hence carried out for samples treated under these optimized conditions.

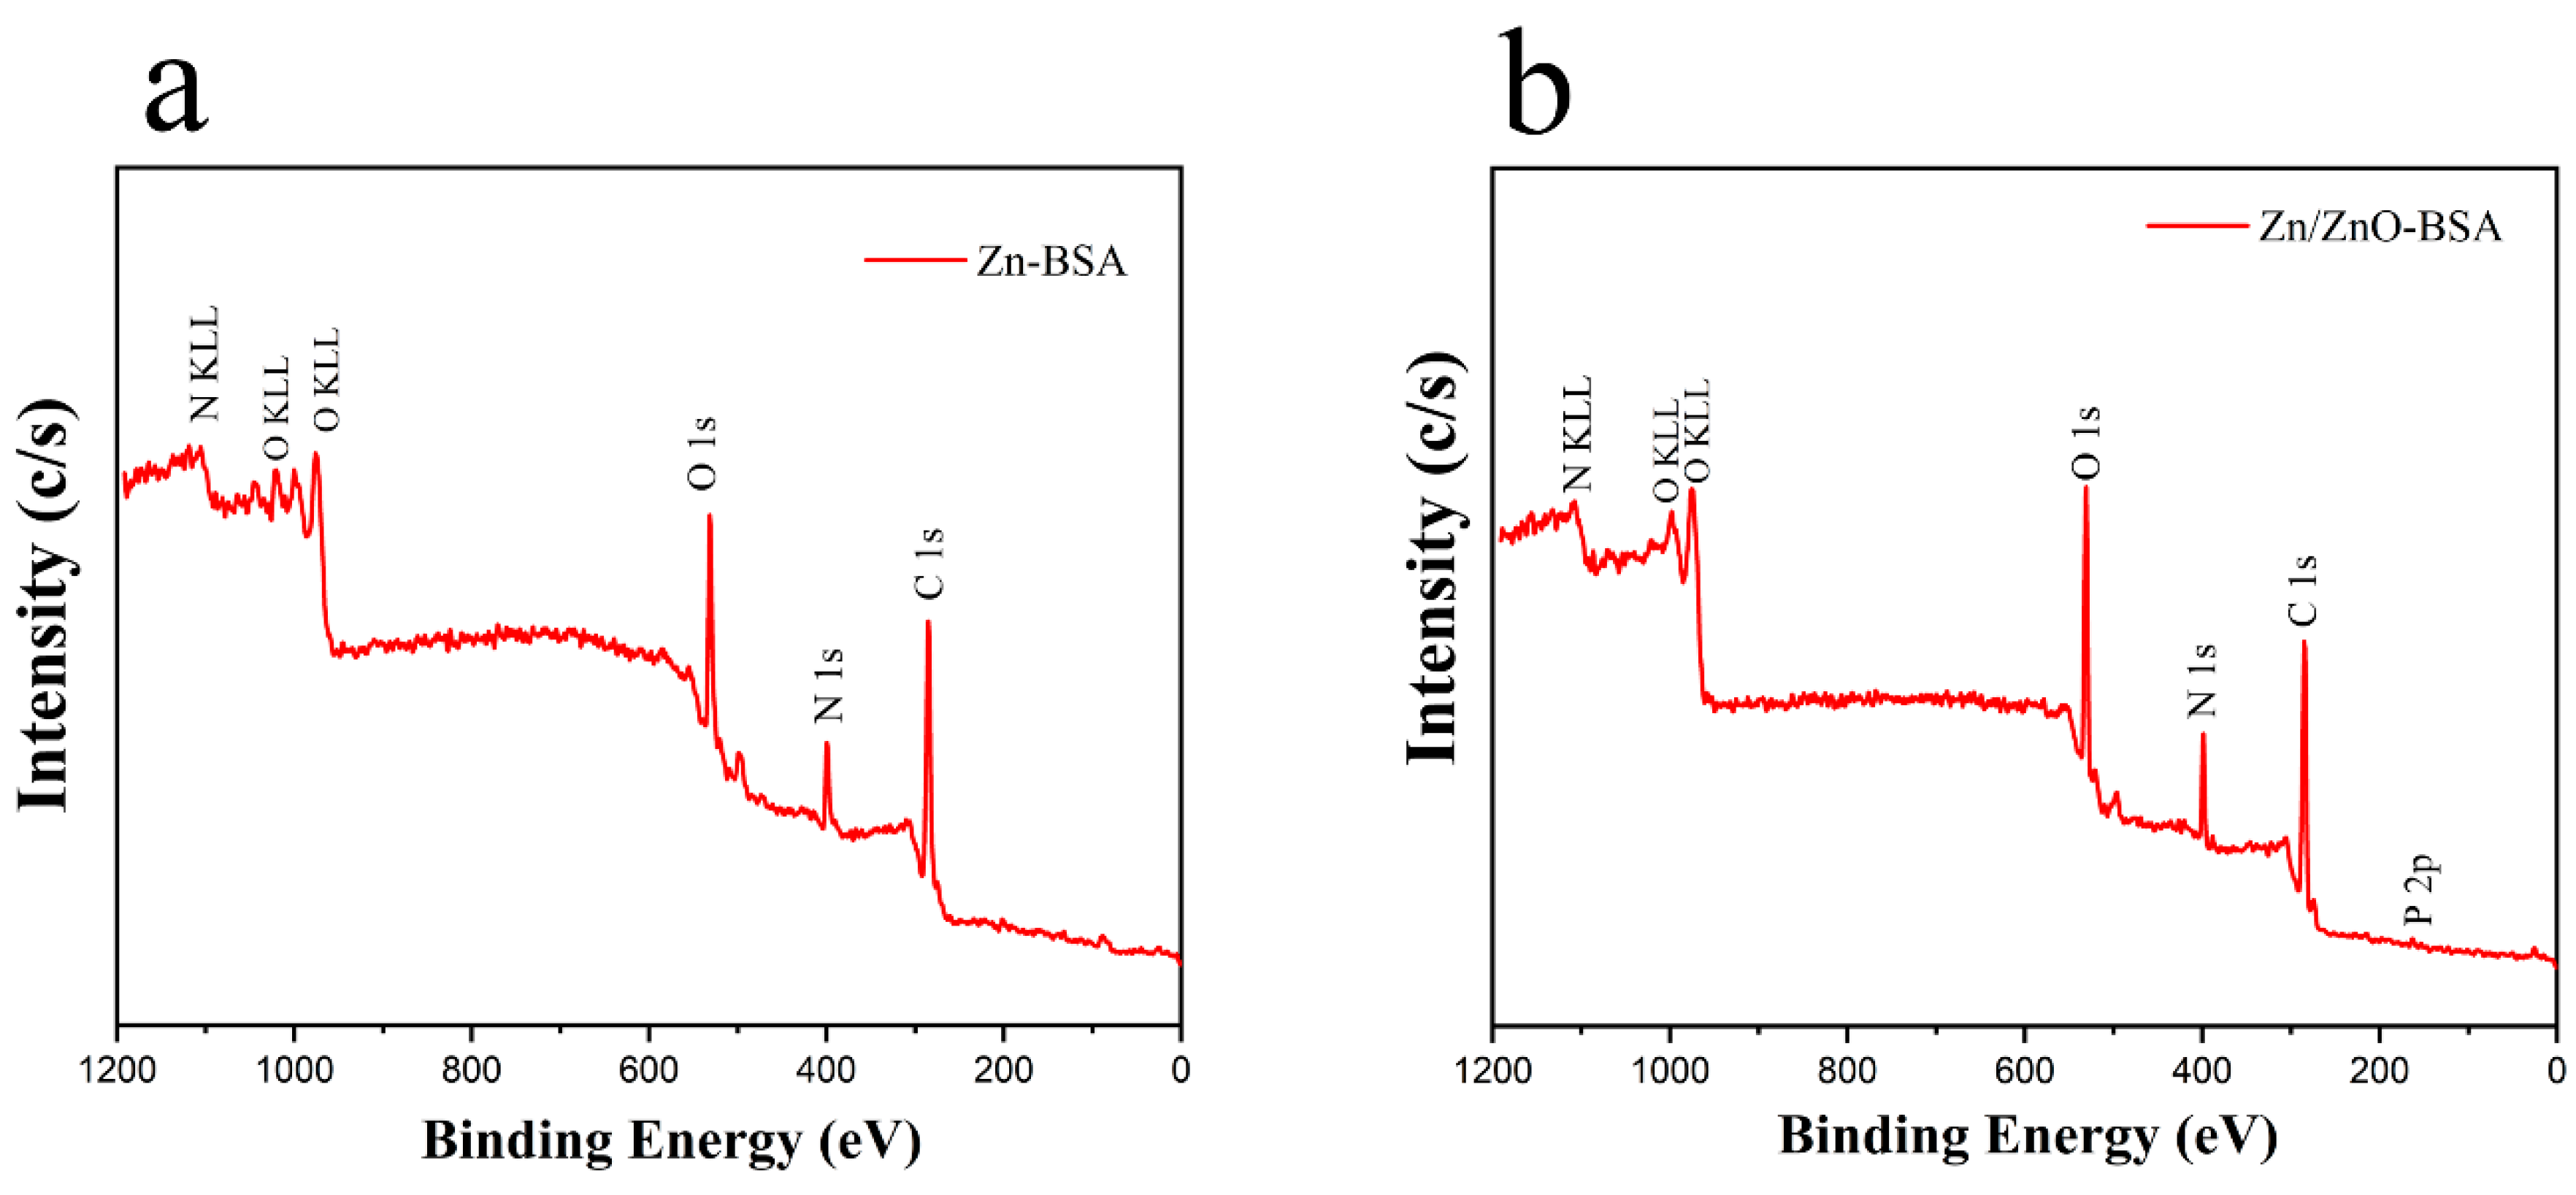
3.2. XRD, FTIR, and XPS Measurements

The chemical composition of the surface layers was determined with XRD, FTIR, and XPS (Figure 4). XRD patterns are shown in Figure 4a; Zn4SO4(OH)6·H2O was detected after anodization at 10 V for 15 min (PDF# 39-0690). However, after annealing in air at 400 °C for 2 h, Zn4SO4(OH)6·H2O was no longer detected. Instead, ZnO (PDF #21-1486) and weak Zn3O(SO4)2 (PDF #31-1469) peaks were detected, indicating a decomposition of Zn4SO4(OH)6·H2O into ZnO and Zn3O(SO4)2 during the annealing treatment.
Figure 4b shows the FTIR spectra for pure Zn as well as for the anodized and annealed sample. The absorption band at around 430 cm−1 is associated with the vibration of Zn-O in ZnO [25]. Bands at around 600 and 1050 cm−1 can be assigned to the bending modes and vibration of SO42− [26]. The band at about 625 cm−1 is attributed to Zn-OH vibration in Zn(OH)2 [27]. ZnO absorbs water in the air forming traces Zn(OH)2 on the surface of the samples.
A survey spectrum of XPS is shown in Figure 4c; zinc, oxygen, sulfur, and carbon are detected on the surface, the carbon signal mostly resulting from contamination in air. The high resolution spectrum Zn2p is shown in Figure 4d; it can be deconvoluted to Zn(OH)2 at 1022.8 eV, ZnO at 1022 eV, and Zn3O(SO4)2 at 1021.2 eV [28,29].
Combining the findings on the surface morphology and chemical composition, the growth mechanism of this dual structure can be concluded as follows:
In the initial stage of anodization, released Zn2+ (Reaction (1)) on the surface reacts with H2O forming ZnO (Reaction (3)); reaction between SO42− and ZnO induces the formation of Zn4SO4(OH)6·H2O (Reaction (4)) [27,30]. Due to the layered type crystal structure, zinc hydroxy-sulfate exhibits a sheet geometry.
Zn2+ + H2O → ZnO + 2H+
3ZnO + Zn2+ + SO42− + 7H2O → Zn4SO4(OH)6·H2O
With the extension of anodization, the size of the sheets increased. At the same time, the pH on the surface decreases due to Reaction (2), and longer anodization times and high voltages enhance this reaction. In addition, the complexation reaction between Zn2+ and NH4+ also contributes to the decrease of pH (Reaction (5)). Zinc hydroxy-sulfate is not stable and dissolves in the acidified environment (Reaction (6)).
Zn2+ + NH4+ → Zn(NH3)42+ + 4H+
Zn4SO4(OH)6·H2O + 6H+ → 4Zn2+ + SO42− + 10H2O
The samples used in the work were annealed at 400 ℃ in air. By annealing, zinc hydroxy-sulfate loses the adsorbed water at about 104 ℃ (Reaction (7)) and becomes fully dehydrated at 371.7 ℃ [26] (Reaction (8)). Hence, the dual structured layer consists of parallel Zn trenches on the bottom and ZnO/Zn3O(SO4)2 sheets on the top.
Zn4(SO4)(OH)6·H2O → ZnSO4:3Zn(OH)2+ H2O
2[ZnSO4·3Zn(OH)2] → 5ZnO + Zn3O(SO4)2 + 6H2O

3.3. Electrochemical Measurements: Corrosion Behavior

In order to investigate the influence of the sheet surface layer on the corrosion behavior, electrochemical measurements for pure Zn and the anodized samples were carried out in SBF without and with BSA. Figure 5a shows the Nyquist plots of Zn and Zn/ZnO in both electrolytes, revealing that the semicircle radius of the capacitive loop increases with addition of BSA in SBF for both Zn and Zn/ZnO; hence, in these short-term experiments, BSA in solution slows down corrosion. In absence of BSA, bare Zn shows a slightly higher corrosion resistance than the anodized sample. On the contrary, in the BSA-containing solution, not only is a much higher corrosion resistance is seen for both samples, but in this case, the anodized sample also shows a slower corrosion rate. This can be seen also in Figure 5b, indicating that the impedance module at low frequencies shows the highest value for Zn/ZnO in SBF+BSA; hence, the highest corrosion resistance is observed for this system. Potentiodynamic polarization curves (Figure 5c) show a passivation zone for pure Zn under anodic polarization in both electrolytes, addition of BSA seems to suppress the formation of this protective layer, as the anodic current density is increased by addition of BSA. Acceleration of Zn dissolution by the addition of BSA may be due to the coordination of BSA and Zn2+ [31]. For Zn/ZnO, the polarization curves are insensitive to the presence of BSA in the electrolyte. Compared with pure Zn, the higher corrosion current density for Zn/ZnO in both electrolytes (due to the higher cathodic current densities) most probably is related to a larger specific surface area of the rough surface formed in the anodization process. The anodic layer also seems to suppress passivation of Zn; this is in agreement with our previous findings on the effect of anodic nanotube layers on the electrochemical behavior of Zn [16]. The effect of BSA in electrolyte on the electrochemical behavior is more clearly seen in the impedance spectra than in the potentiodynamic polarization curves. This may be due to the fact that during polarization in a large potential range, stronger reactions take place at the sample/electrolyte interface than during the impedance measurements. This dynamic interface may then hinder protein adsorption on the surface, and therefore the inhibiting effect of adsorbed BSA is better observed in the impedance spectra.

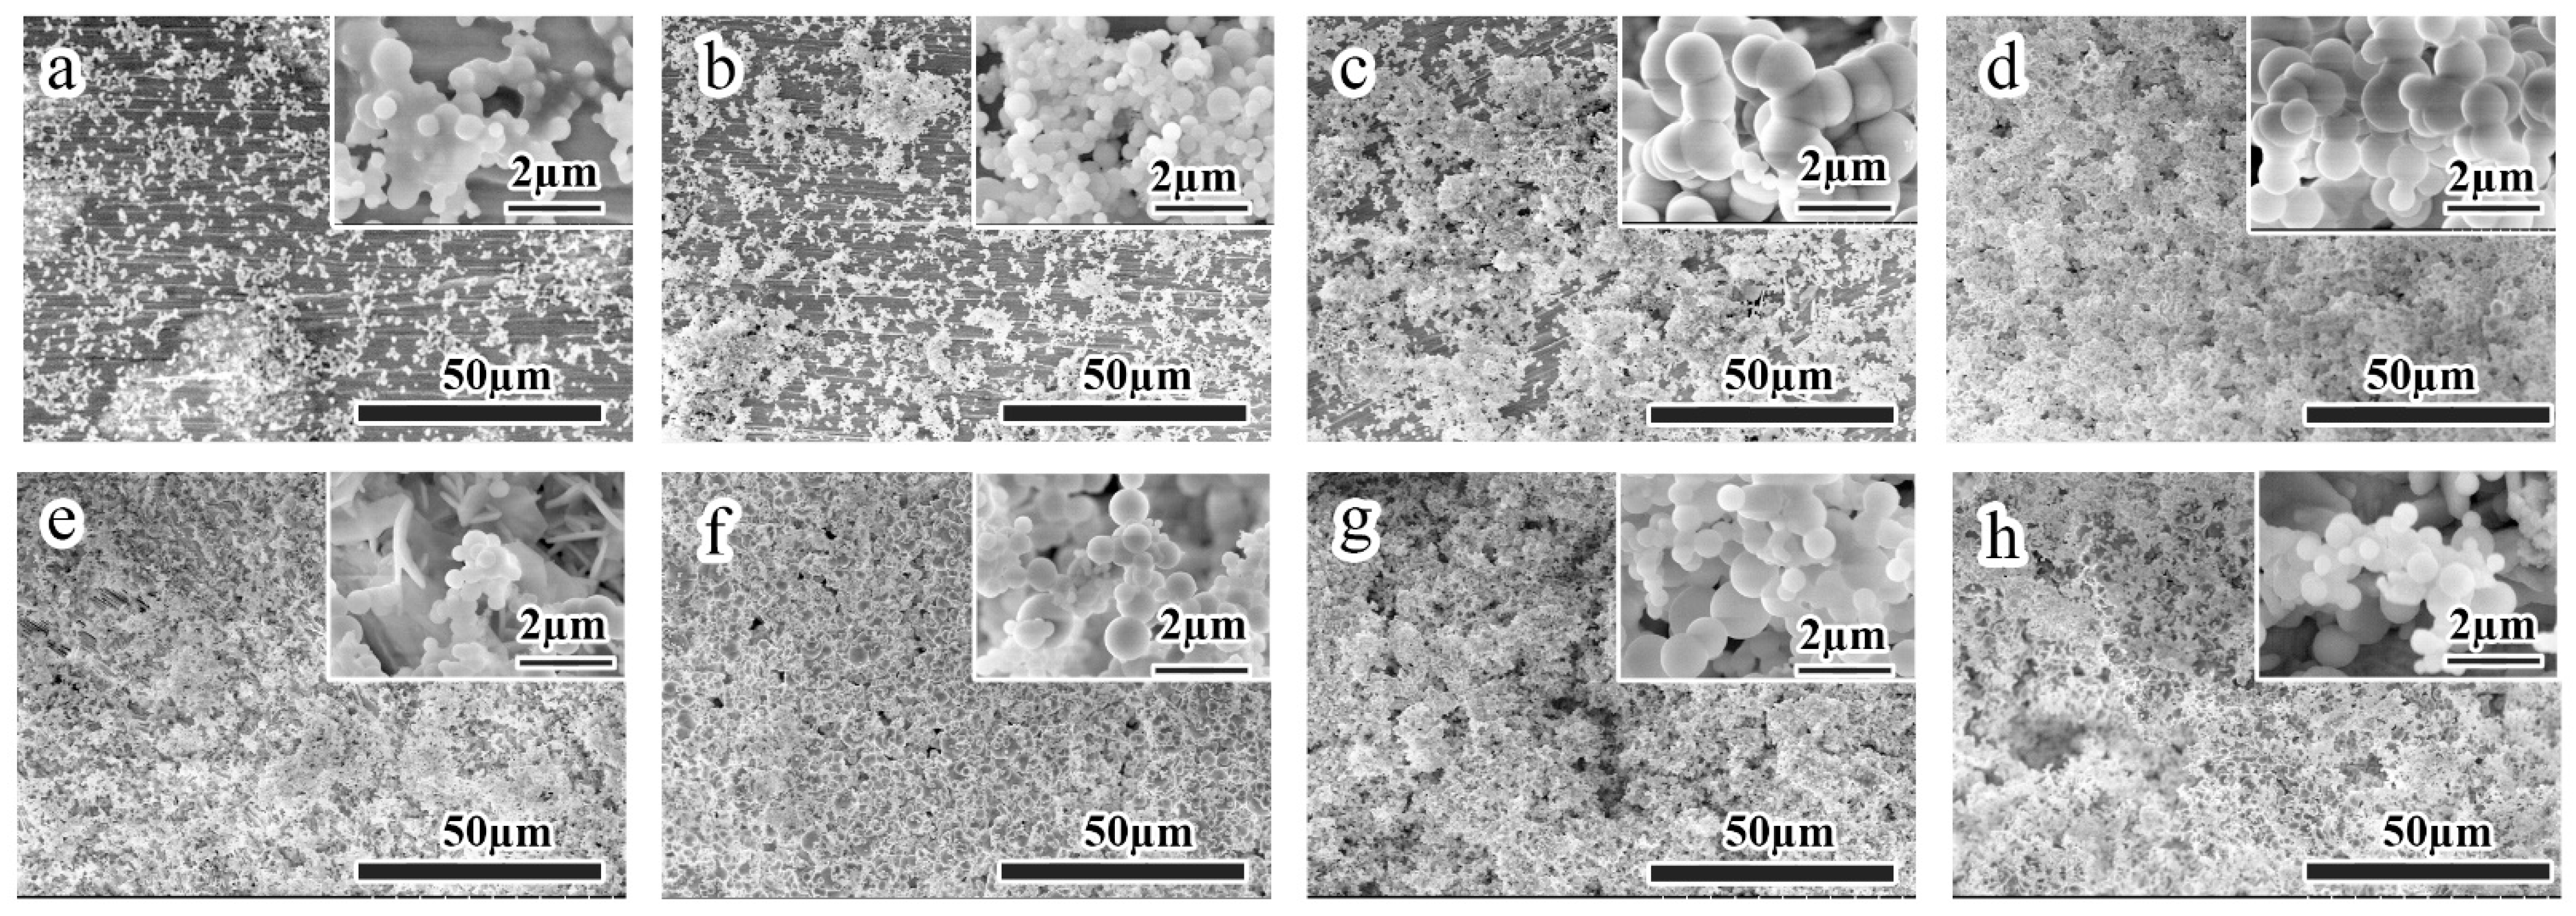
3.4. Bioactivity: Ca-Phosphate Precipitation
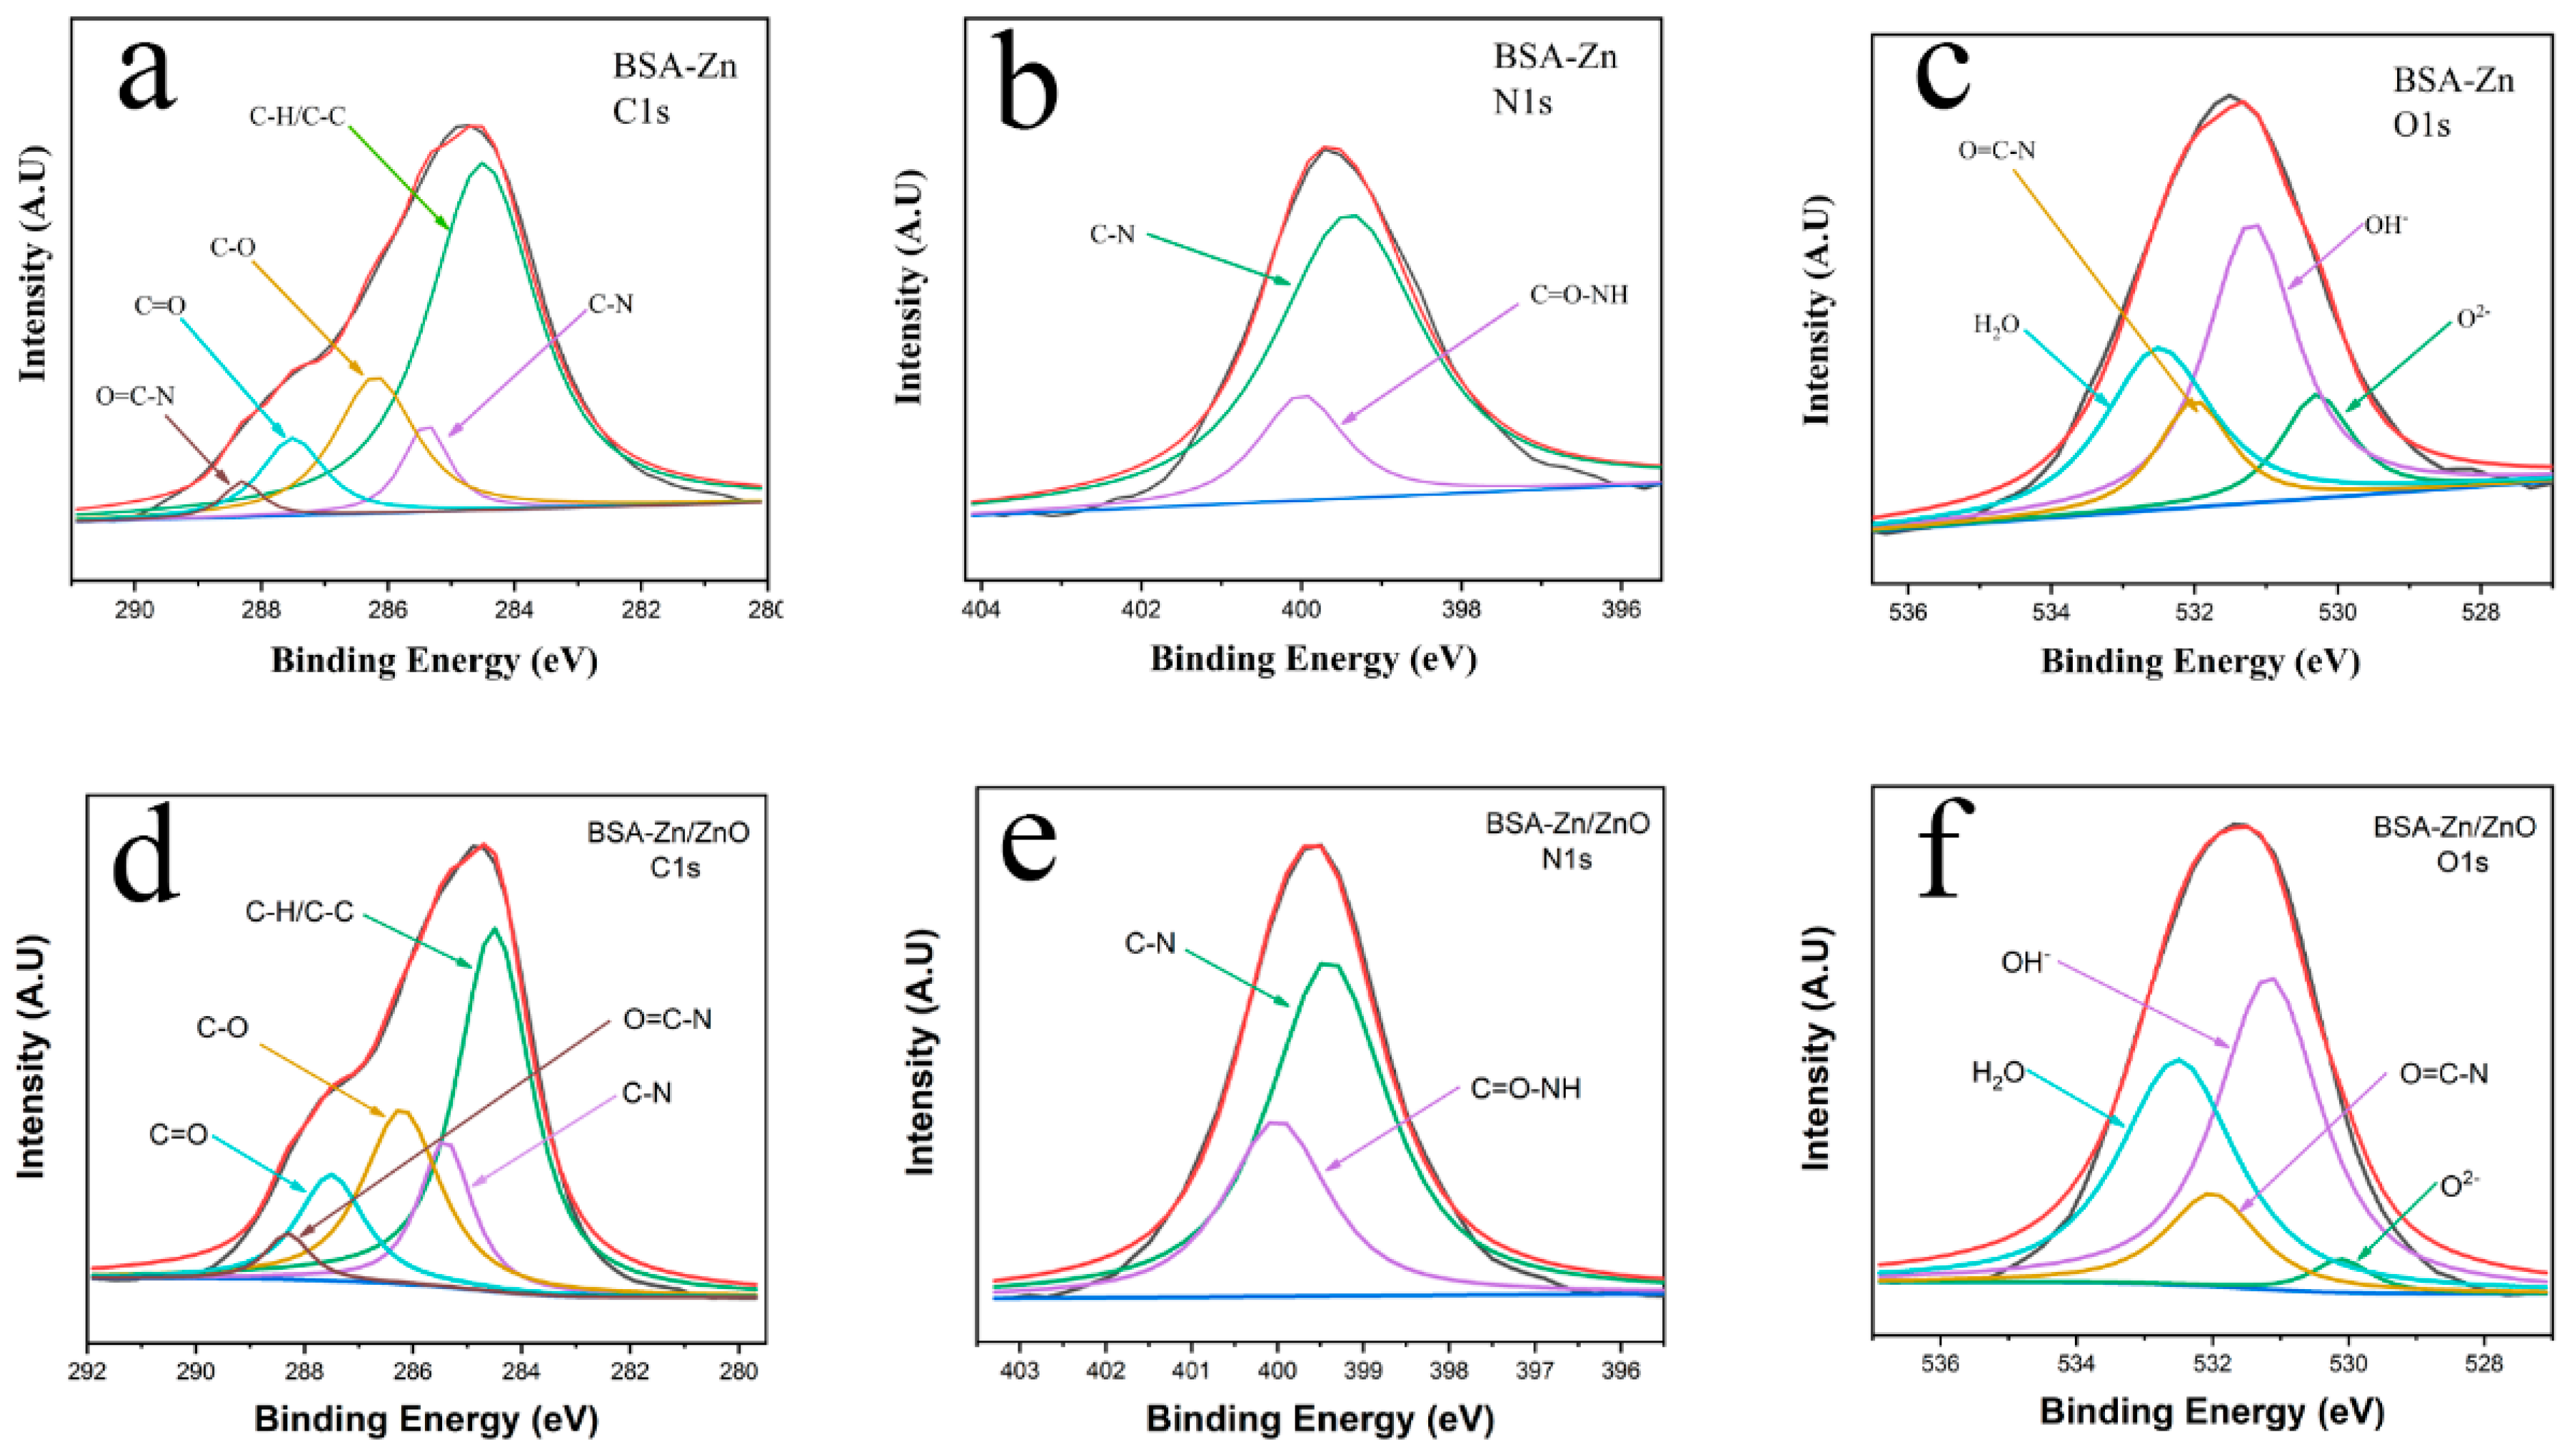
Figure 6 shows SEM images of both pure Zn and Zn/ZnO samples immersed in SBF at different intervals. Spherical particles are aggregated on the surface of Zn/ZnO after three days of immersion and fully cover the substrate after seven days of immersion. As a comparison, on the surface of bare Zn, much less coverage by precipitates is observed after three and seven days of immersion. EDS analysis (Table 2) shows clearly more Ca-phosphate precipitation with prolongation of immersion time for bare Zn (increasing amount of Ca and P detected on the surface). Noteworthy is the significant acceleration of Ca-phosphate precipitation for the anodized sample (Figure 6a,b and Table 2).

3.5. BSA Adsorption

In presence of albumin in solution (SBF/BSA), both bare Zn and the anodized Zn/ZnO coated samples exhibit a different behavior compared to immersion in pure SBF as shown in SEM images in Figure 7. More fine particles are observed, and the sheets are almost fully covered by precipitates after three days of immersion. As indicated by EDS data (Figure 7k,l), only traces of Ca-phosphate are observed on the surface, despite the longer immersion period (21 days) in SBF/BSA, demonstrating that BSA inhibits Ca-phosphate formation. With the extension of immersion duration, more carbon-containing species are detected on the surface. In addition, more N was detected on the surface of Zn/ZnO as compared with bare Zn, particularly for the first three days, indicating stronger BSA adsorption on Zn/ZnO.
A rougher surface is observed beneath the Ca-phosphate precipitation layer for the Zn/ZnO sample (Figure 7j). This is, however, due to the anodization process. The cross-section of Zn/ZnO after immersion in SBF/BSA (Figure 7j) shows the residual ZnO/Zn3O(SO4)2 coating on the surface, and the original Zn trenches and corrosion products/precipitation are observed on the surface. No indication of new localized corrosion sites can be detected. This is in stark contrast to the finding of localized corrosion occurring on the surface of bare Zn during immersion in SBF/BSA (Figure 7i).
In order to study the effect of BSA on surface chemistry in more detail, FTIR measurements were carried out (Figure 8). Comparing the spectra for samples immersed for 21 days in SBF/BSA for both bare Zn and Zn/ZnO, clear differences can be observed. The bands located at around 580 and 1000 cm−1 correspond to PO43− [32], bands at about 1380 and 1450 cm−1 are assigned to CO32− [28,33]. The band around 3300 cm−1 relates to O-H. FTIR spectra demonstrate that the main inorganic precipitations are Ca-phosphate with traces of ZnO and carbonate species. Bands located at around 2900 cm−1 are related to C-H. Three bands located at around 1650, 1550, and 1250 cm−1 correspond to Amide I, Amide II, and Amide III, respectively [34]. FTIR data therefore demonstrate adsorption of BSA on the surface of Zn/ZnO.
Additionally, XPS was carried out for further insights on the chemical composition of the surface. Figure 9 depicts the XPS survey spectra for both bare Zn and Zn/ZnO samples in SBF/BSA after 21 days of immersion. Only signals of C, N, O, and P are present after immersion. The signals of Zn, Ca, and P were not detected after immersion in SBF/BSA. Considering the high surface sensitivity of XPS, it can be concluded that samples were covered with BSA after the immersion test. Figure 10 shows high-resolution XPS spectra of C, N, and O for both pure Zn and Zn/ZnO after immersion. The signal of C1s can be deconvoluted to C-H/C-C, C-N, C-O, C=O, and C=C-N [32,34]. The N1s spectrum was fitted to C-N and C=O-NH [35]. O1s spectra were deconvoluted to O2−, OH, O=C-N, and H2O [36,37]; the presence of H2O and O2− is attributed to adsorbed water in the air and the formed ZnO, respectively. Table 3 shows atomic concentration from XPS spectra, indicating that more N is detected on the surface of Zn/ZnO as compared with bare Zn.
Finally, TOF-SIMS offers further proof of BSA adsorption. Figure 11 shows positive ion spectra of BSA adsorbed on both bare Zn and Zn/ZnO after immersion in SBF/BSA for 21 days. Typical peaks for BSA are identified and labeled in Figure 11. CH4N+ at 30 is assigned to glycine, leucine, or lysine, C4H10N+ at 72 is related to valine, and C7H7O+ at 110 and C8H10N+ at 120 is contributed to histidine/arginine and phenylalanine, respectively. The selected positive ion fragments and corresponding amino acids are listed in Table 4 [38,39,40]. It is obvious that the intensity of the signals detected on pure Zn is one order of magnitude lower than that of Zn/ZnO, indicating more BSA adsorption on the surface of Zn/ZnO—this result is in good agreement with SEM and FTIR measurements.

4. Discussion

An ideal corrosion behavior for biodegradable metals should be uniform dissolution mode. However, bare Zn suffers from localized corrosion in a physiological environment [41,42]. The current work was therefore designed to improve Ca-phosphate precipitation ability and protein adsorption behavior, as well as optimize the corrosion behavior of Zn. In SBF, more Ca-phosphate is indeed detected on the surface of Zn/ZnO compared to pure Zn after immersion for 21 days (Figure 6 and Table 2); the accelerated precipitation of Ca-phosphate for the anodic sample is very clearly seen after three days of immersion. This can be due to the increased specific surface area after the anodization treatment, with the Zn trenches structure on the bottom and ZnO/Zn3O(SO4)2 sheets on the top. The microstructured layer hence provides more binding sites during the nucleation process for Ca-phosphate precipitation. The XPS and TOF-SIMS data demonstrate BSA adsorption on the surface. A stronger BSA adsorption is observed on the surface of Zn/ZnO; this result is in good agreement with EDX and FTIR measurements. The amount of nitrogen from XPS (Table 3) for the Zn/ZnO sample is higher as compared with bare Zn, also indicating more BSA adsorbed on the surface of the anodized sample. The results moreover indicate the suppressing effect of Ca-phosphate precipitation by BSA in electrolytes. One reason may be a physical shielding effect by adsorbed BSA on the sample surface. Hence, fewer binding sites are available for Ca-phosphate precipitation. A second reason can be a chelating process between BSA and Ca2+, which depletes free Ca2+ to some extent. Moreover, the presence of BSA in SBF enhances the localized corrosion for pure Zn (Figure 7), but for the Zn/ZnO sample, no obvious localized corrosion was observed after immersion. This can be due to a protective effect of the anodization layer, as both ZnO and Zn3O(SO4)2 are more stable as compared with pure Zn. In summary, the results clearly indicate that the here-presented anodization treatment can significantly enhance the bioactivity of Zn (accelerated precipitation of Ca-phosphate during immersion in SBF), enhance protein (BSA) adsorption, optimize the corrosion behavior, and most noteworthily, reduce the risk of localized corrosion.

5. Conclusions

In this work, we study the growth of an anodic ZnO microsheet coating via anodization on Zn and explore its influence on the corrosion behavior and biological performance in simulated body fluid (SBF) in the absence and presence of bovine serum albumin (BSA). The anodic treatment with optimized parameters leads to the formation of a ZnO microsheet coating with a sub-surface microtrenched Zn layer. Electrochemical measurements indicate that the presence of BSA in solution can slow down corrosion in short-term measurements. Moreover, the anodized samples show a better corrosion resistance in BSA containing SBF as compared with bare Zn according to electrochemical impedance spectroscopy. Long-term immersion tests in SBF (+BSA) demonstrate that the anodic microstructured coating accelerates the precipitation of Ca-phosphate on the surface and increases BSA adsorption; hence, rendering the Zn surface beneficial properties in view of its use in biomedical applications. Moreover, the anodic ZnO microsheet coating prevented the occurrence of localized corrosion that has been observed for pure Zn in BSA-containing SBF.

Author Contributions

Conceptualization, H.D. and S.V.; methodology, H.D. and S.V.; investigation, H.D.; data curation, H.D. and S.V.; writing original draft, H.D.; supervision, S.V.; resources, S.V.; review and editing, S.V.; All authors have read and agreed to the published version of the manuscript.

Funding

This research was funded by China Scholarship Council (201706990017).

Institutional Review Board Statement

Not applicable.

Informed Consent Statement

Not applicable.

Data Availability Statement

The raw/processed data required to reproduce these findings cannot be shared at this time as the data also forms part of an ongoing study.

Acknowledgments

The authors thank Helga Hildebrand for XPS and TOF-SIMS measurement and Sebastian Hagen for ion milling.

Conflicts of Interest

The authors declare no conflict of interest.

References

  1. Su, Y.; Cockerill, I.; Wang, Y.; Qin, Y.; Chang, L.; Zheng, Y. Zinc-Based Biomaterials for Regeneration and Therapy. Trends Biotechnol. 2018, 37, 428–441. [Google Scholar] [CrossRef]
  2. Witte, F. The history of biodegradable magnesium implants: A review. Acta Biomater. 2010, 6, 1680–1692. [Google Scholar] [CrossRef]
  3. Virtanen, S. Biodegradable Mg and Mg alloys: Corrosion and biocompatibility. Mater. Sci. Eng. B 2011, 176, 1600–1608. [Google Scholar] [CrossRef]
  4. Zhou, J.; Yang, Y.; Frank, M.A.; Detsch, R.; Boccaccini, A.R.; Virtanen, S. Accelerated Degradation Behavior and Cytocompatibility of Pure Iron Treated with Sandblasting. ACS Appl. Mater. Interfaces 2016, 8, 26482–26492. [Google Scholar] [CrossRef]
  5. O’Connor, J.P.; Kanjilal, D.; Teitelbaum, M.; Lin, S.S.; Cottrell, J.A. Zinc as a therapeutic agent in bone regeneration. Materials 2020, 13, 2211. [Google Scholar] [CrossRef]
  6. Zheng, Y.F.; Gu, X.N.; Witte, F. Biodegradable metals. Mater. Sci. Eng. R 2014, 77, 1–34. [Google Scholar] [CrossRef]
  7. Dong, H.; Lin, F.; Boccaccini, A.R.; Virtanen, S. Corrosion behavior of biodegradable metals in two different simulated physiological solutions: Comparison of Mg, Zn and Fe. Corros. Sci. 2021, 182, 109278. [Google Scholar] [CrossRef]
  8. Li, G.; Yang, H.; Zheng, Y.; Chen, X.H.; Yang, J.A.; Zhu, D.; Ruan, L.; Takashima, K. Challenges in the use of zinc and its alloys as biodegradable metals: Perspective from biomechanical compatibility. Acta Biomater. 2019, 97, 23–45. [Google Scholar] [CrossRef] [PubMed]
  9. Liu, Y.; Zheng, Y.; Chen, X.H.; Yang, J.A.; Pan, H.; Chen, D.; Wang, L.; Zhang, J.; Zhu, D.; Wu, S.; et al. Fundamental Theory of Biodegradable Metals—Definition, Criteria, and Design. Adv. Funct. Mater. 2019, 29, 1–21. [Google Scholar] [CrossRef]
  10. Mostaed, E.; Sikora-Jasinska, M.; Ardakani, M. Towards revealing key factors in mechanical instability of bioabsorbable Zn-based alloys for intended vascular stenting. Acta Biomater. 2020, 105, 319–335. [Google Scholar] [CrossRef] [PubMed]
  11. Kubásek, J.; Vojtěch, D.; Jablonská, E.; Pospíšilová, I.; Lipov, J.; Ruml, T. Structure, mechanical characteristics and in vitro degradation, cytotoxicity, genotoxicity and mutagenicity of novel biodegradable Zn-Mg alloys. Mater. Sci. Eng. C 2016, 58, 24–35. [Google Scholar] [CrossRef]
  12. Yang, H.; Qu, X.; Lin, W.; Wang, C.; Zhu, D.; Dai, K.; Zheng, Y. In vitro and in vivo studies on zinc-hydroxyapatite composites as novel biodegradable metal matrix composite for orthopedic applications. Acta Biomater. 2018, 71, 200–214. [Google Scholar] [CrossRef] [PubMed]
  13. Murni, N.S.; Dambatta, M.S.; Yeap, S.K.; Froemming, G.R.A.; Hermawan, H. Cytotoxicity evaluation of biodegradable Zn-3Mg alloy toward normal human osteoblast cells. Mater. Sci. Eng. C 2015, 49, 560–566. [Google Scholar] [CrossRef]
  14. Zaraska, L.; Mika, K.; Syrek, K.; Sulka, G.D. Formation of ZnO nanowires during anodic oxidation of zinc in bicarbonate electrolytes. J. Electroanal. Chem. 2017, 801, 511–520. [Google Scholar] [CrossRef]
  15. Illy, B.N.; Ingham, B.; Toney, M.F.; Nandhakumar, I.; Ryan, M.P. Understanding the selective etching of electrodeposited ZnO nanorods. Langmuir 2014, 30, 14079–14085. [Google Scholar] [CrossRef] [Green Version]
  16. Dong, H.; Zhou, J.; Virtanen, S. Fabrication of ZnO nanotube layer on Zn and evaluation of corrosion behavior and bioactivity in view of biodegradable applications. Appl. Surf. Sci. 2019, 494, 259–265. [Google Scholar] [CrossRef]
  17. Shrestha, N.K.; Lee, K.; Hahn, R.; Schmuki, P. Anodic growth of hierarchically structured nanotubular ZnO architectures on zinc surfaces using a sul fi de based electrolyte. Electrochem. Commun. 2013, 34, 9–13. [Google Scholar] [CrossRef]
  18. Dong, J.; Liu, Z.; Dong, J.; Ariyanti, D.; Niu, Z.; Huang, S.; Zhang, W.; Gao, W. Self-organized ZnO nanorods prepared by anodization of Zinc in NaOH electrolyte. RSC Adv. 2016, 6, 72968–72974. [Google Scholar] [CrossRef]
  19. Hambidge, K.M.; Krebs, N.F. Zinc Deficiency: A Special Challenge. J. Nutr. 2007, 137, 1101–1105. [Google Scholar] [CrossRef] [Green Version]
  20. Kowalski, D.; Kim, D.; Schmuki, P. TiO2 nanotubes, nanochannels and mesosponge: Self-organized formation and applications. Nano Today 2013, 8, 235–264. [Google Scholar] [CrossRef]
  21. Kulkarni, M.; Mazare, A.; Park, J.; Gongadze, E.; Killian, M.S.; Kralj, S.; von der Mark, K.; Iglič, A.; Schmuki, P. Protein interactions with layers of TiO2 nanotube and nanopore arrays: Morphology and surface charge influence. Acta Biomater. 2016, 45, 357–366. [Google Scholar] [CrossRef] [PubMed]
  22. Guillory, R.J.; Sikora-Jasinska, M.; Drelich, J.W.; Goldman, J. In Vitro Corrosion and in Vivo Response to Zinc Implants with Electropolished and Anodized Surfaces. ACS Appl. Mater. Interfaces 2019, 11, 19884–19893. [Google Scholar] [CrossRef] [PubMed]
  23. Bordbar-Khiabani, A.; Ebrahimi, S.; Yarmand, B. In-vitro corrosion and bioactivity behavior of tailored calcium phosphate-containing zinc oxide coating prepared by plasma electrolytic oxidation. Corros. Sci. 2020, 173, 108781. [Google Scholar] [CrossRef]
  24. Far, S.H.E.; Rahimi, A.; Chaghazardi, M.; Davoodi, A. Microstructure characterization and electrochemical corrosion behavior of Zn and Zn/Mg alloys in H2SO4 solution. J. Cent. South Univ. 2015, 22, 2007–2013. [Google Scholar] [CrossRef]
  25. Staminirova, T.; Petrova, N.; Kirov, G. Thermal decomposition of zinc hydroxy-sulfate-hydrate minerals. J. Therm. Anal. Calorim. 2016, 125, 85–96. [Google Scholar] [CrossRef]
  26. Darezereshki, E.; Alizadeh, M.; Bakhtiari, F. A novel thermal decomposition method for the synthesis of ZnO nanoparticles from low concentration ZnSO4 solutions. Appl. Clay Sci. 2011, 54, 107–111. [Google Scholar] [CrossRef]
  27. Wang, L.; Liu, G.; Zou, L.; Xue, D. Phase evolution from rod-like ZnO to plate-like zinc hydroxysulfate during electrochemical deposition. J. Alloys Compd. 2010, 493, 471–475. [Google Scholar] [CrossRef]
  28. Liu, X.; Yang, H.; Xiong, P.; Li, W.; Huang, H.H.; Zheng, Y. Comparative studies of Tris-HCl, HEPES and NaHCO3/CO2 buffer systems on the biodegradation behaviour of pure Zn in NaCl and SBF solutions. Corros. Sci. 2019, 157, 205–219. [Google Scholar] [CrossRef]
  29. Liu, X.; Yang, H.; Liu, Y.; Xiong, P.; Guo, H.; Huang, H.H.; Zheng, Y. Comparative Studies on Degradation Behavior of Pure Zinc in Various Simulated Body Fluids. JOM 2019, 71, 1414–1425. [Google Scholar] [CrossRef]
  30. Zhao, J.; Wang, X.; Liu, J.; Meng, Y.; Xu, X.; Tang, C. Controllable growth of zinc oxide nanosheets and sunflower structures by anodization method. Mater. Chem. Phys. 2011, 126, 555–559. [Google Scholar] [CrossRef]
  31. Blindauer, C.A.; Harvey, I.; Bunyan, K.E.; Stewart, A.J.; Sleep, D.; Harrison, D.J.; Berezenko, S.; Sadler, P.J. Structure, properties, and engineering of the major Zinc binding site on human albumin. J. Biol. Chem. 2009, 284, 23116–23124. [Google Scholar] [CrossRef] [PubMed] [Green Version]
  32. Wagener, V.; Virtanen, S. Protective layer formation on magnesium in cell culture medium. Mater. Sci. Eng. C 2016, 63, 341–351. [Google Scholar] [CrossRef] [PubMed]
  33. Chen, Y.; Zhang, W.; Maitz, M.F.; Chen, M.; Zhang, H.; Mao, J.; Zhao, Y.; Huang, N.; Wan, G. Comparative corrosion behavior of Zn with Fe and Mg in the course of immersion degradation in phosphate buffered saline. Corros. Sci. 2016, 111, 541–555. [Google Scholar] [CrossRef]
  34. Liu, L.; Meng, Y.; Volinsky, A.A.; Zhang, H.; Wang, L. Influences of albumin on in vitro corrosion of pure Zn in artificial plasma. Corros. Sci. 2019, 153, 341–356. [Google Scholar] [CrossRef]
  35. Torres, B.E.; Carvalho, M.L.; Seyeux, A.; Cristiani, P.; Tribollet, B.; Marcus, P.; Bautista, B.E.T.; Carvalho, M.L.; Seyeux, A.; Zanna, S.; et al. Effect of protein adsorption on the corrosion behavior of 70Cu-30Ni alloy in artificial seawater to cite this version: HAL Id: Hal-01018382. Bioelectrochemistry 2014, 97, 34–42. [Google Scholar] [CrossRef] [Green Version]
  36. Vanea, E.; Simon, V. Applied Surface Science XPS study of protein adsorption onto nanocrystalline aluminosilicate microparticles. Appl. Surf. Sci. 2011, 257, 2346–2352. [Google Scholar] [CrossRef]
  37. Wan, P.; Lin, X.; Tan, L.; Li, L.; Li, W.; Yang, K. Influence of albumin and inorganic ions on electrochemical corrosion behavior of plasma electrolytic oxidation coated magnesium for surgical implants. Appl. Surf. Sci. 2013, 282, 186–194. [Google Scholar] [CrossRef]
  38. Hedberg, Y.S.; Killian, M.S.; Blomberg, E.; Virtanen, S.; Schmuki, P.; Wallinder, I.O. Interaction of Bovine Serum Albumin and Lysozyme with Stainless Steel Studied by Time-of-Flight Secondary Ion Mass Spectrometry and X-ray Photoelectron Spectroscopy. Langmuir 2012, 28, 16306–16317. [Google Scholar] [CrossRef] [PubMed]
  39. Wagner, M.S.; Castner, D.G. Characterization of Adsorbed Protein Films by Time-of-Flight Secondary Ion Mass Spectrometry with Principal Component Analysis. Langmuir 2001, 17, 4649–4660. [Google Scholar] [CrossRef]
  40. Wald, J.; Mu, C.; Wahl, M.; Hannig, M.; Kopnarski, M.; Ziegler, C. ToF-SIMS investigations of adsorbed proteins on dental titanium. Phys. Status Solidi A Appl. Mater. Sci. 2010, 207, 831–836. [Google Scholar] [CrossRef]
  41. Törne, K.; Larsson, M.; Norlin, A.; Weissenrieder, J. Degradation of zinc in saline solutions, plasma, and whole blood. J. Biomed. Mater. Res. Part. B 2016, 104B, 1141–1151. [Google Scholar] [CrossRef] [PubMed]
  42. Yang, H.; Wang, C.; Liu, C.; Chen, H.; Wu, Y.; Han, J.; Jia, Z.; Lin, W.; Zhang, D.; Li, W.; et al. Evolution of the degradation mechanism of pure zinc stent in the one-year study of rabbit abdominal aorta model. Biomaterials 2017, 145, 92–105. [Google Scholar] [CrossRef] [PubMed]
Figure 1. SEM micrographs of samples after anodization at 10 V for 15 min: (a,b) top-view with different magnifications. (c,d) cross-section with different magnifications.
Coatings 11 00486 g001
Figure 2. SEM micrographs of different anodization time: (a) 30 s, (b) 3 min, (c) 8 min, and (d) 30 min.
Coatings 11 00486 g002
Figure 3. SEM micrographs after anodization for 15 min under different voltage: (a) 1 V, (b) 5V, (c) 10 V, (d) 15 V, (e) 20 V, and (f) 30 V.
Coatings 11 00486 g003
Figure 4. Characterization of as-prepared samples after annealing at 400 °C for 2 h: (a) XRD patterns of pure Zn and Zn/ZnO, (b) FTIR spectra of Zn and Zn/ZnO, (c) XPS spectra of Zn/ZnO, and (d) high-resolution XPS spectra of Zn/ZnO.
Coatings 11 00486 g004
Figure 5. Electrochemical measurements for Zn and Zn/ZnO in SBF and SBF/BSA: (a) EIS: Nyquist plots, (b) EIS: Bode plots; (c) Potentiodynamic polarization curves.
Coatings 11 00486 g005
Figure 6. SEM micrographs of samples after immersion in SBF: (ad) Zn in SBF for three days, seven days, 14 days, and 21 days; (eh) Zn/ZnO in SBF for three days, seven days, 14 days, and 21 days. The scale bar for all images is 50 and 2 µm for insert images.
Coatings 11 00486 g006
Figure 7. SEM micrographs of samples after immersion in SBF/BSA: (ad) Zn for 3 days, 7 days, 14 days, and 21 days; (eh) Zn/ZnO for 3 days, 7 days, 14 days, and 21 days. (i,j) Cross-section of Zn and Zn/ZnO after 21 days immersion; (k,l) EDS data for Zn and Zn/ZnO after 21 days immersion.
Coatings 11 00486 g007
Figure 8. FTIR spectra of Zn and Zn/ZnO after 21 days immersion in SBF/BSA.
Coatings 11 00486 g008
Figure 9. XPS survey spectra for samples after immersion for 21 days in SBF/BSA: (a) Zn and (b) Zn/ZnO.
Coatings 11 00486 g009
Figure 10. High-resolution XPS spectra for samples after 21 days immersion in SBF/BSA, bare Zn: (a) C1s, (b) N1s, and (c) O1s; and Zn/ZnO: (d) C1s, (e) N1s, and (f) O1s.
Coatings 11 00486 g010
Figure 11. TOF-SIMS measurement of samples after immersion in SBF/BSA: (a) Zn, (b): Zn/ZnO.
Coatings 11 00486 g011
Table 1. Chemical composition of SBF.
Substance/CAS NumberConcentration (mg L−1)Substance/CAS NumberConcentration (mg L−1)
NaCl/7647-14-57990MgCl2·6H2O/7791-18-6300
NaHCO3/144-55-8350CaCl2·2H2O/10035-04-8360
KCl/7447-40-7230Na2SO4/7757-82-670
K2HPO4·3H2O/16788-57-1
Tris/77-86-1
230
6044.7
HCl (1 M)/7647-01-0≈40 mL
Table 2. EDS data for samples after different times of immersion in SBF (At.%).
COCaPZn
Zn in SBF
Day 39.3330.032.998.9731.90
Day 75.1127.393.488.5954.59
Day 1413.0233.733.7511.5937.38
Day 2111.1244.613.6713.0526.39
Zn/ZnO in SBF
Day 39.0442.013.5912.3229.21
Day 78.4134.404.6011.9238.00
Day 1413.6442.224.3012.1527.22
Day 2111.4238.454.0213.1031.53
Table 3. Atomic concentration in XPS spectra.
CNOSZn
Zn-BSA67.8611.0019.210.090.78
Zn/ZnO-BSA63.5612.7523.050.090.54
Table 4. Selected positive ion fragments and corresponding amino acids.
Mass (m/z)FragmentCorresponding Amino Acids
120C8H10N+phenylalanine
110C5H8N3+histidine, arginine
107C7H7O+tyrosine
98C4H4NO2+asparagine
91C7H7+phenylalanine
86C5H12N+isoleucine, leucine
84C4H6NO+glutamine
73C2H7N3+arginine
72C4H10N+valine
70C3H4NO+asparagine
60C2H6NO+serine
59CH5N3+arginine
56C3H6N+lysine
45CHS+cysteine
44C2H6N+alanine
43C3H7+isoleucine, leucine,
30CH4N+glycine, leucine, lysine
29C2H5+isoleucine
Publisher’s Note: MDPI stays neutral with regard to jurisdictional claims in published maps and institutional affiliations.

