Article

Preparation of Coating on the Titanium Surface by Micro-Arc Oxidation to Improve Corrosion Resistance

1
Department of Foundation, Naval University of Engineering, Wuhan 430033, China
2
Institute of Special Services, Naval Research Academy, Beijing 100072, China
3
School of Chemical Engineering and Technology, Sun Yat-sen University, Zhuhai 519082, China
*
Author to whom correspondence should be addressed.
Coatings 2021, 11(2), 230; https://doi.org/10.3390/coatings11020230
Submission received: 18 January 2021 / Revised: 30 January 2021 / Accepted: 2 February 2021 / Published: 15 February 2021
(This article belongs to the Collection Feature Paper Collection in Corrosion, Wear and Erosion)

Abstract

:
In this paper, two kinds of micro-arc oxidation (MAO) coatings on TA2 with different thickness were prepared by controlled oxidation time and then were characterized for their composition, crystalline structure, and surface morphology. The effect of MAO treatment on electrochemical corrosion behaviors of TA2 in 3.5% NaCl solution were studied by the electrochemical measurements including open circuit potential (OCP), electrochemical impedance spectroscopy (EIS) and potentiodynamic polarization curves. The results indicate that the electrochemical behavior of MAO coating is related to the coating structure. OCP can be used to evaluate the porosity of MAO coating. More positive OCP indicates coating with lower porosity and larger resistance obtained from EIS. The MAO treatment can significantly enhance the corrosion resistance of TA2, but the thickness increase of MAO coating could not further improve the corrosion resistance. In addition, because of the increase in effective surface area, the MAO treatment may enhance the cathode action of TA2 when the galvanic cell is composed of TA2 and other more negative metal, which in turn promotes the corrosion of negative metal.

1. Introduction

Titanium and its alloys are expected to be ideal materials for marine application because of their excellent characteristic such as high strength, low density (high specific strength), higher corrosion resistance and no magnetism [1,2]. However, various metals are used simultaneously for marine engineering structure in order to meet the industrial requirements. Titanium is a noble metal, and it has a positive potential and good biocompatibility in seawater. The applications of titanium and its alloys can cause some problems, such as galvanic corrosion and marine biofouling in the sea water [3,4], which are harmful to the safety running of marine engineering equipment [4]. Galvanic corrosion can quickly accelerate anodic metal corrosion through a galvanic cell, then causing the failure of engineering equipment [5,6]. Xavier [7] studied the galvanic corrosion of copper/titanium in aircraft structures, and found that the corrosion products contained nanoscale Cu and Ti oxide layers which had a positive effect on corrosion resistance of Cu/Ti galvanic couple.
Galvanic corrosion can be controlled using coating or an insulation material which can separate the coupled samples [8]. Moreover, the use of coating can be a better choice, and it also can improve the specimens’ corrosion resistance. Micro arc oxidation (MAO) [9], thermal spraying [10], laser cladding [11], etc. are widely used to fabricate a coating on the surface of Ti. MAO has been commonly utilized to prepare some useful coatings with different oxide layers on the surface of the various metals like Ti, Al, Mg, and Zr and their alloys, to improve corrosion resistance, tribological properties, biocompatibility, and thermal properties [9,12,13,14,15,16,17,18,19,20,21,22,23,24,25]. Porous MAO coating firmly adheres to the metal substrate, which can effectively increase electrical insulation of metals and their alloys due to the lower conductivity of oxides coating [26]. Furthermore, the high porosity and surface roughness of the MAO coatings can significantly improve the adhesive force of organic coating prepared on the surface of titanium and its alloys [27]. Therefore, the preparation of MAO coating on titanium and its alloys can be effective to decrease or even eliminate the galvanic effect composed of Ti and other more negative metals.
In this study, two MAO coatings with different thickness on pure Ti have been fabricated in Na2SiO3 based electrolyte by controlling the oxidation time. The prepared coatings were characterized using 3D digital microscope, X-ray Diffraction (XRD) and scanning electron microscope (SEM). Open circuit potential (OCP), electrochemical impedance spectroscopy (EIS) and potentiodynamic polarization were used to investigate the electrochemical corrosion behavior as well as the relationship between the structure and electrochemical behavior of coating. The aims of this work are to improve the corrosion resistance of Ti and control the galvanic corrosion between Ti and the other metals (such as steel) in the marine environment, then increase the service life of ships and warships.

2. Experimental Details

2.1. Preparation and Characterization of Micro-Arc Oxidation Samples

Samples (20 mm × 20 mm × 5 mm) were prepared using a commercial pure titanium named TA2. The TA2 was produced in Baotai Co. Ltd.; Nanjing, China. All samples were ground using SiC abrasive papers (280#~1500#) and then rinsed with distilled water and degreased ultrasonically with acetone sequentially. For MAO, an electrolyte containing 9.25 g/L Na2SiO3·9H2O and 1.375 g/L KOH was used, and a 30 kW pulse power supply with the frequency of 50 Hz was used. TA2 samples and stainless steel acted as cathode and anode, respectively. A bipolar asymmetric voltage was selected with +500 V in the positive half cycle and −40 V in the negative half cycle. The samples were taken out at 3 min and 10 min oxidation time, respectively, according to authors’ experience. The as-obtained two MAO samples were labeled as MAO-1 and MAO-2, respectively.
The surface and cross-section morphologies of MAO coatings were observed using Keyence VHX-5000 3D digital microscope (Keyence Corporation, Osaka, Japan) and Quanta-200 scanning electron microscope (SEM) (Thermo Fisher (FEI) Scientific, Waltham, MA, USA). The distribution of Ti, O, and Si elements was determined by energy dispersive spectrometer (EDS) (OXFORD, Oxford, Britain). The coating phase compositions were investigated by X-ray diffraction (XRD) using X’Pert PRO X-ray diffractometer (Thermo Fisher(FEI) Scientific, Waltham, MA, USA) with Cu Kα radiation.

2.2. Electrochemical Measurements

In order to investigate the electrochemical behavior of MAO coating on TA2, the electrochemical measurements including open circuit potential (OCP), electrochemical impedance spectroscopy (EIS) and potentiodynamic polarization were done. The test solution was 3.5% NaCl solution prepared with analytical grade chemicals and distilled water. A saturated calomel reference electrode (SCE) was used, and the counter electrode was a platinum plate (20 mm × 20 mm). The electrochemical measurements were conducted at a temperature of 30 ± 1 °C·using an electrochemical workstation (Corrtest CS350). The MAO samples were connected using a copper wire and sealed with epoxy resin with only one working surface. The area of working surface was 4 cm2 (20 mm × 20 mm). The OCP of MAO sample was measured as a function of time for 3.5 days. The EIS tests were carried out at OCP, with a potential amplitude of 10 mV, in the frequency ranged between 10−2 and 105 Hz. The potentiodynamic polarization was performed after 9 days immersion in 3.5% NaCl solution, over the potential range −1 to 3 V vs. SCE at a scan rate of 2 mV s−1. After the potentiodynamic polarization tests, the morphologies of the MAO coatings were observed. Three parallel specimens were used in electrochemical measurements and marked −1#, −2#, and −3#, respectively.

2.3. Galvanic Corrosion Experiment between MAO-2 and Steel

In order to investigate the effect of MAO on galvanic corrosion between steel and TA2 in 3.5% NaCl solution, a high strength low alloy steel (labeled as S) was used to form galvanic couple (GC) with MAO-2 samples, and the untreated TA2 was used as control. The nominal composition (in mass fraction) of the test steel is ≤0.11% C, 0.5−0.8% Si, 0.5−0.8% Ni, 0.6−0.9% Cr, 0.4−0.6% Cu, ≤0.015% S, ≤0.025% P, and Fe, the balance.
The schematic diagram of galvanic corrosion measurement between MAO electrodes and steel electrode is shown in Figure 1. All the areas of working surface of S, TA2, and MAO-2 samples were 4 cm2. The distance between steel and TA2 or MAO samples was 5 cm. The working surface of steel and TA2 samples were ground using SiC abrasive paper (280#~1000#). Prior to the test, the working surface of steel, TA2, and MAO-2 sample were washed with absolute ethanol and acetone, respectively. The galvanic potential and current of S/MAO-1 and S/MAO-2 GC together with S/TA2 GC were measured with time, respectively. EIS of S/MAO-2 and S/TA2 GC were also measured.

3. Results and Discussion

3.1. Microstructural Characterization

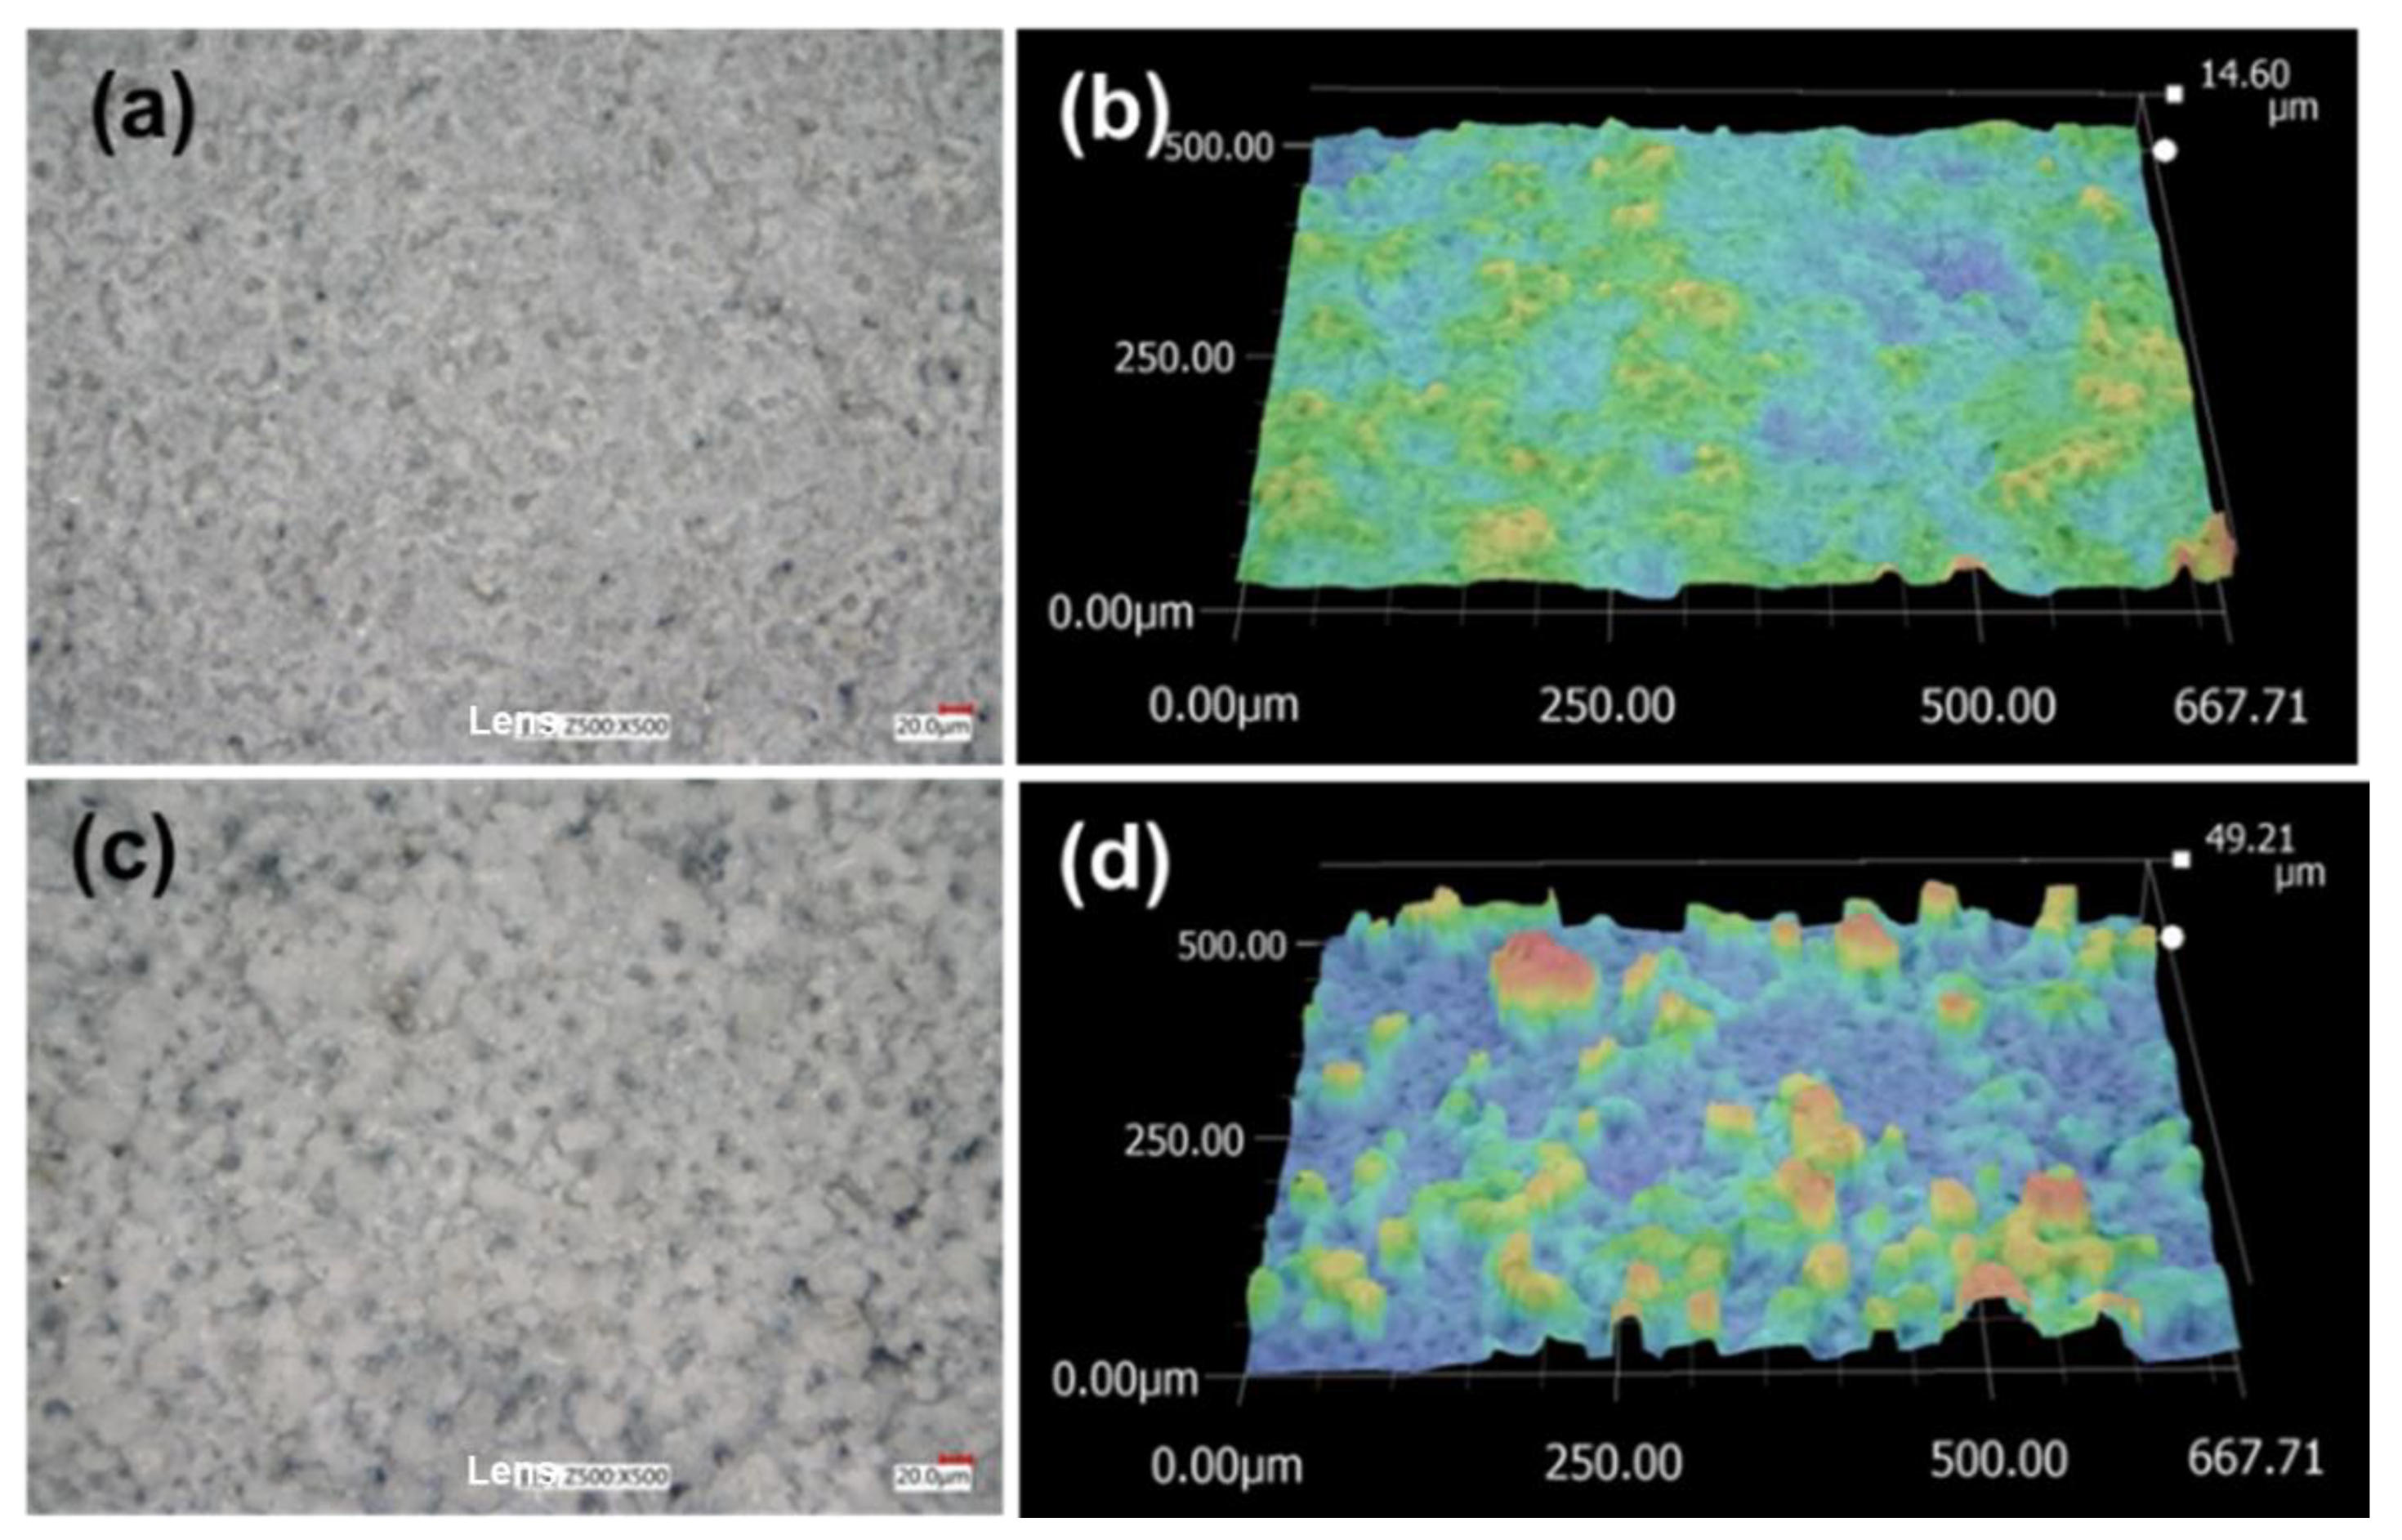
The surface 2D and 3D morphologies of MAO-1 and MAO-2 coating prepared by micro-arc oxidation with different time are shown in 
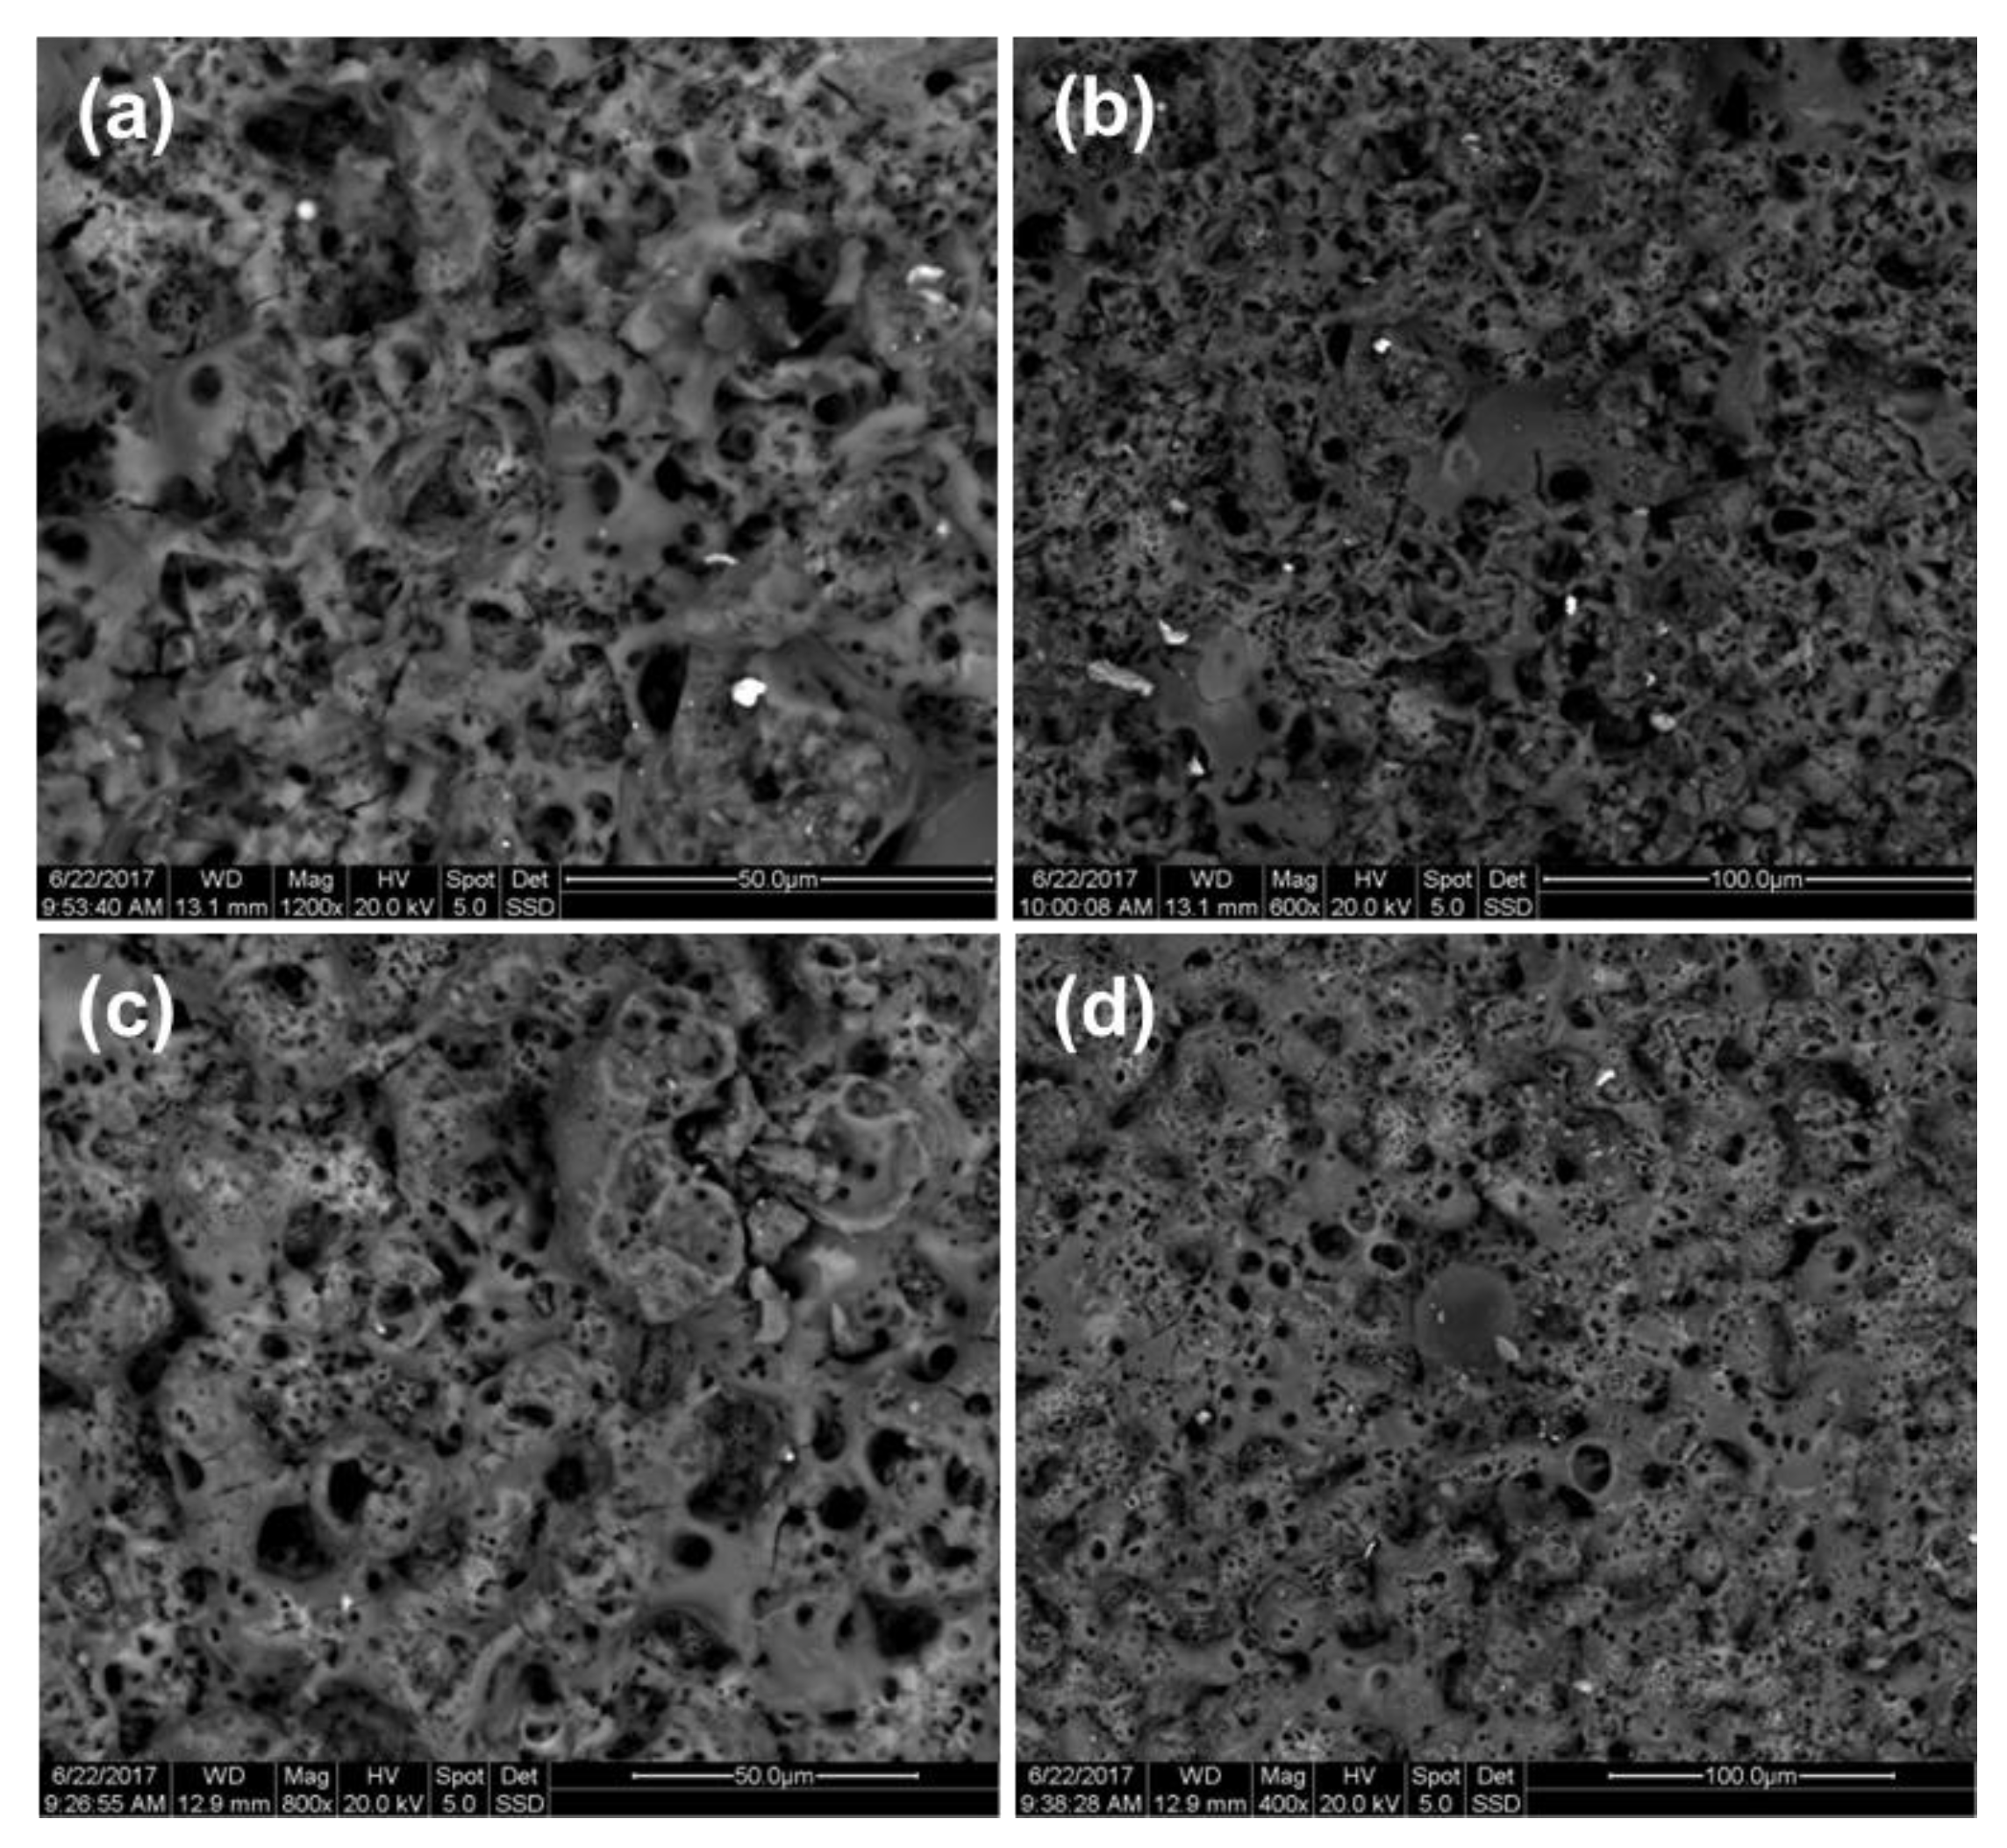
Figure 2, and the corresponding SEM images are shown in Figure 3. It is seen that the prepared two coatings are heterogeneous, and the surface roughness of MAO-2 coating is higher than that of MAO-1 coating due to the higher altitude of Z-axis with the value of 49.21 μm (Figure 2). The porous microstructure of two coatings have been observed in Figure 3, which indicating that the prepared coating using micro-arc oxidation is not compact. The porous microstructure has a negative effect against steel corrosion. The porosity and pore size of MAO-2 coating are higher than that of MAO-1 coating, suggesting that the increase of micro-arc oxidation time promotes the increase of surface pore size as well as inhomogeneity (Figure 3), and the total surface morphologies of two coatings change little on the whole (Figure 2 and Figure 3).
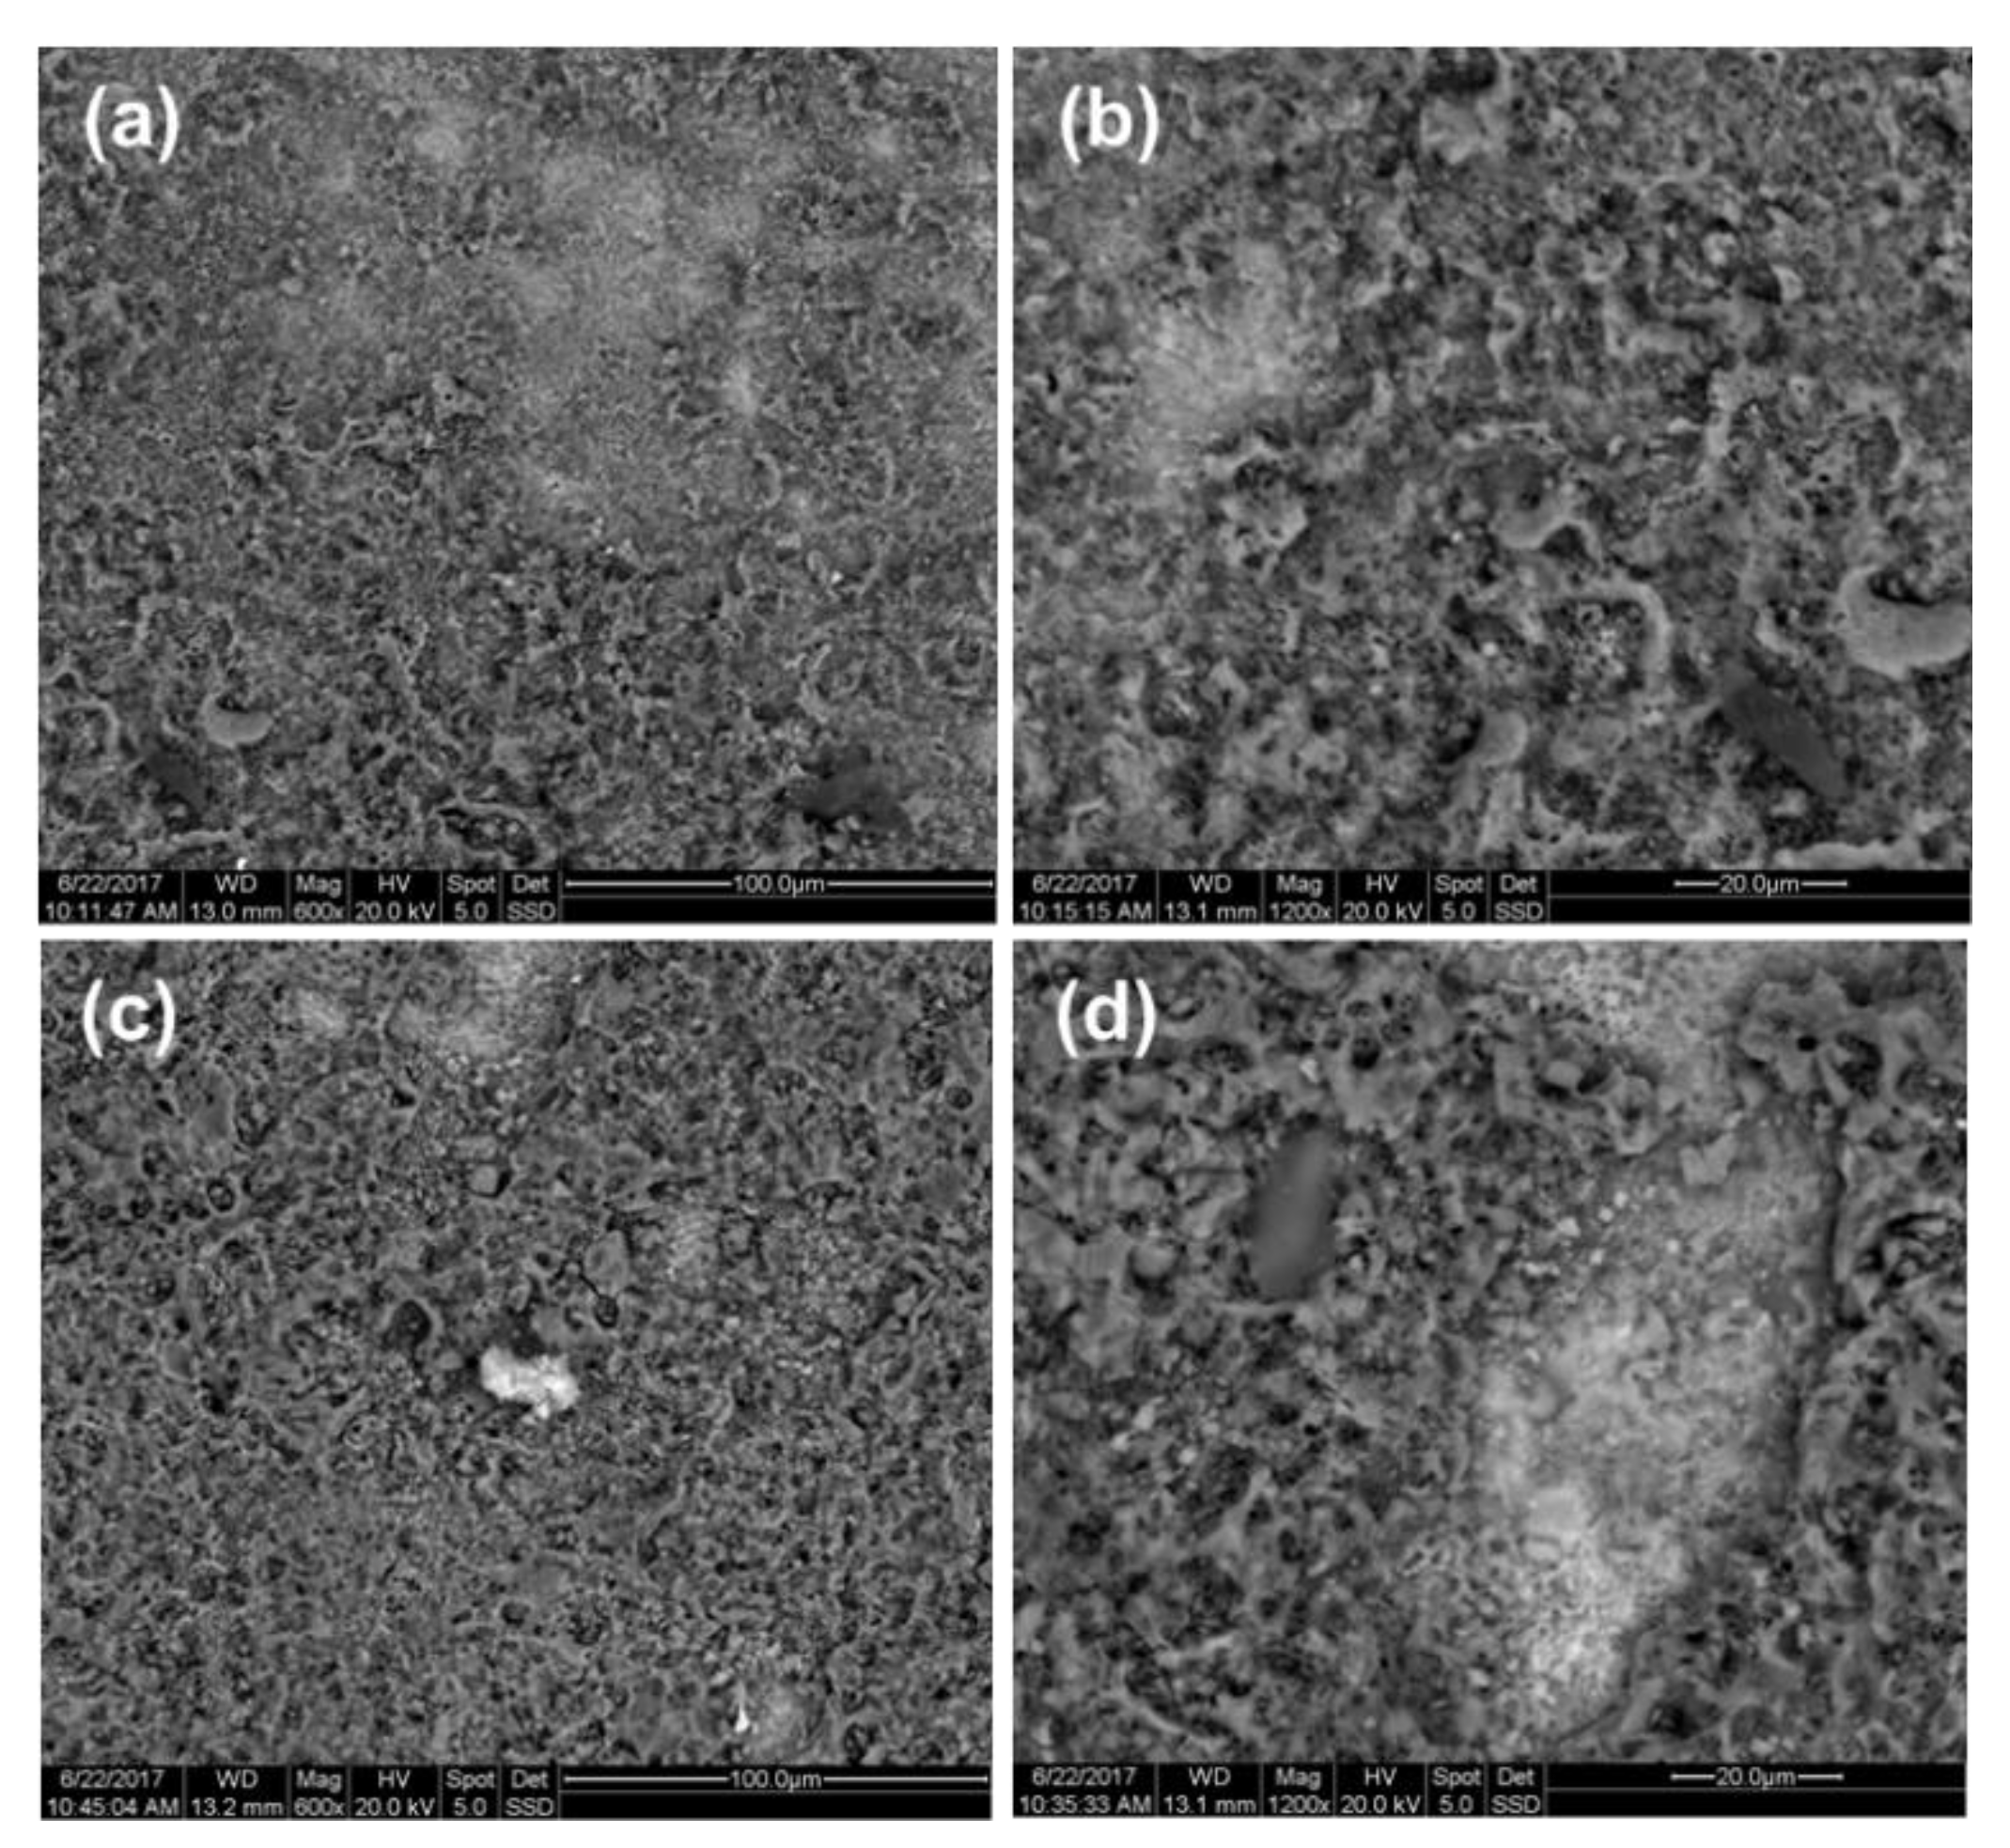
The surface loose layers of the two MAO coatings were ground off using 1500# abrasive paper, and the corresponding SEM images of coatings are shown in Figure 4. It is observed that there are more micropores for MAO-2 coating existing in the barrier layer compared with that of MAO-1 coating. Some areas are compact which can be found in the amplification images of Figure 4b,d, and some loose films on the coating surface fall off. After grounding, it is found that the surface of both the two coatings is still heterogeneous. These also suggest that the prepared coatings using micro-arc oxidation are loose and porous. From the above results, it is suggested that the prepared coatings by MAO contain amounts of micro pores in the films.
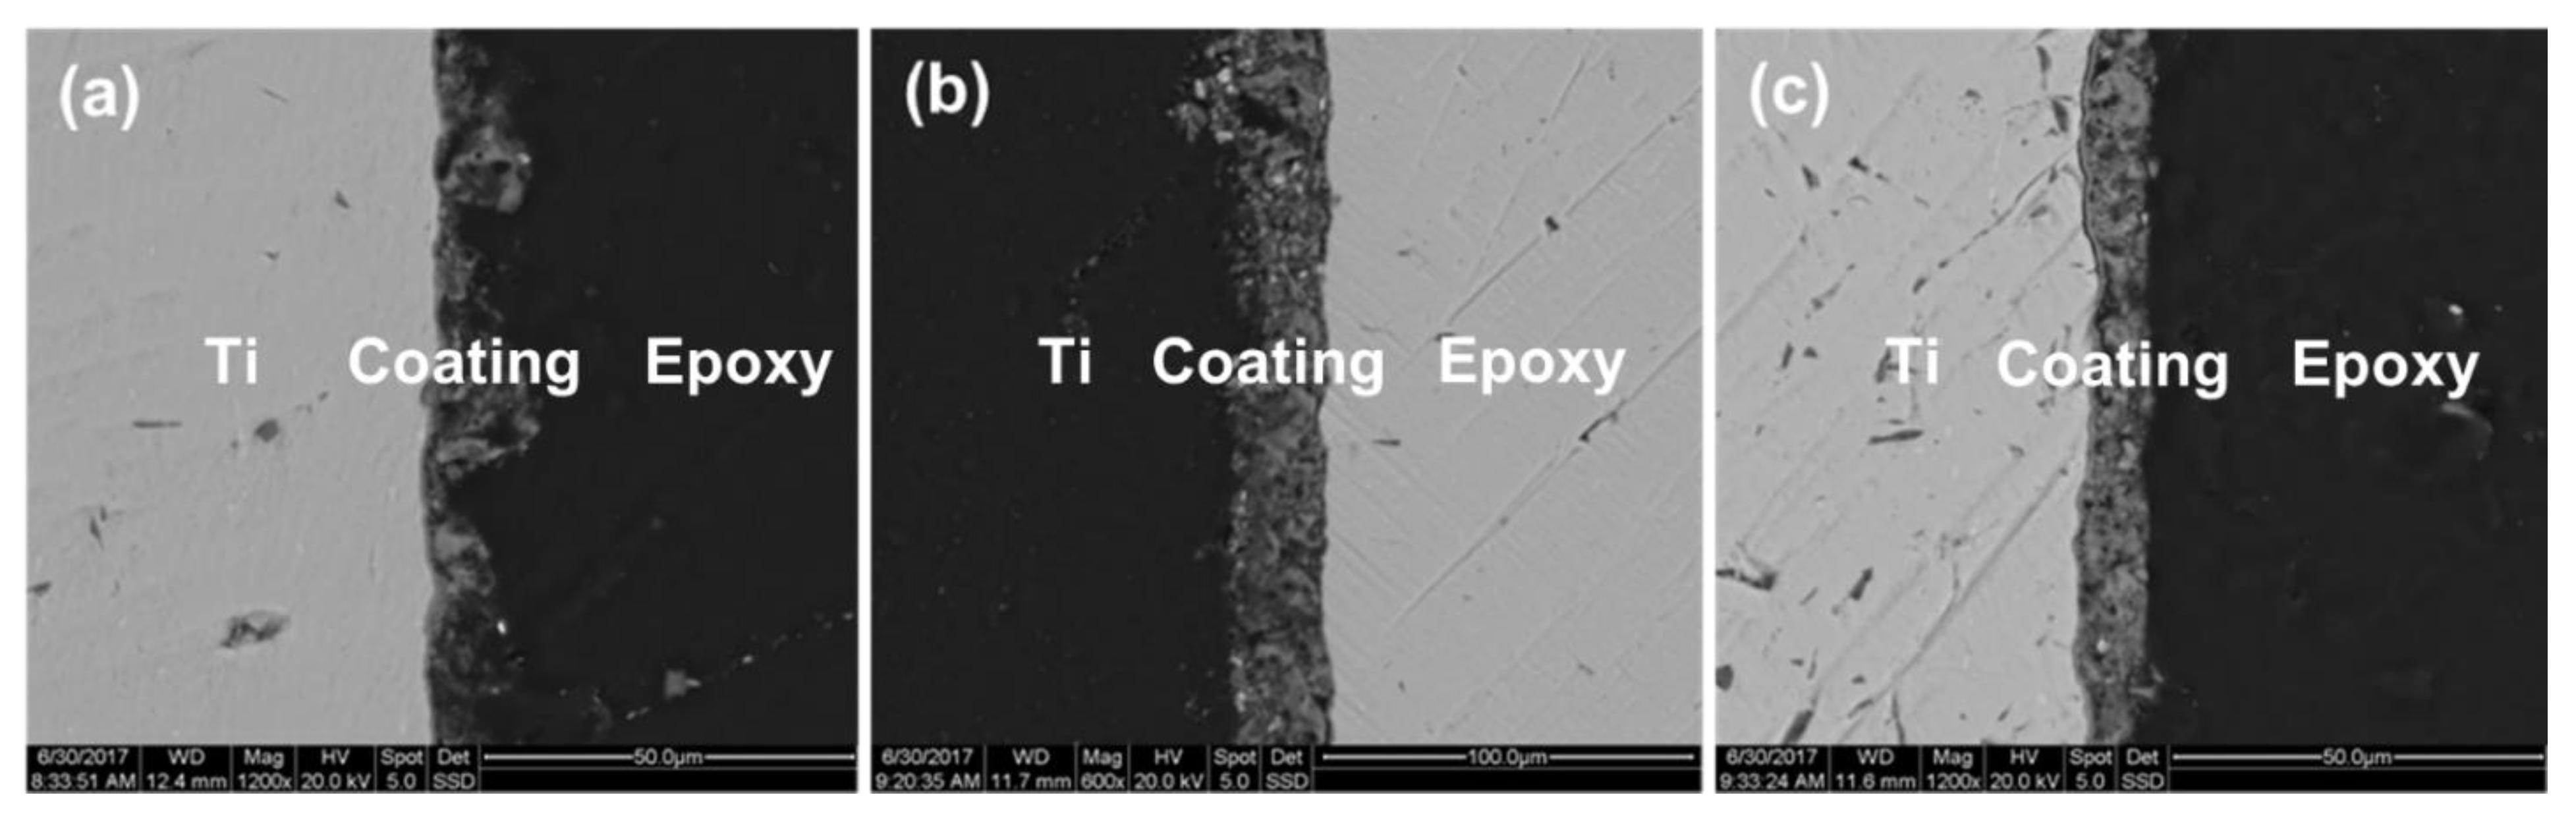
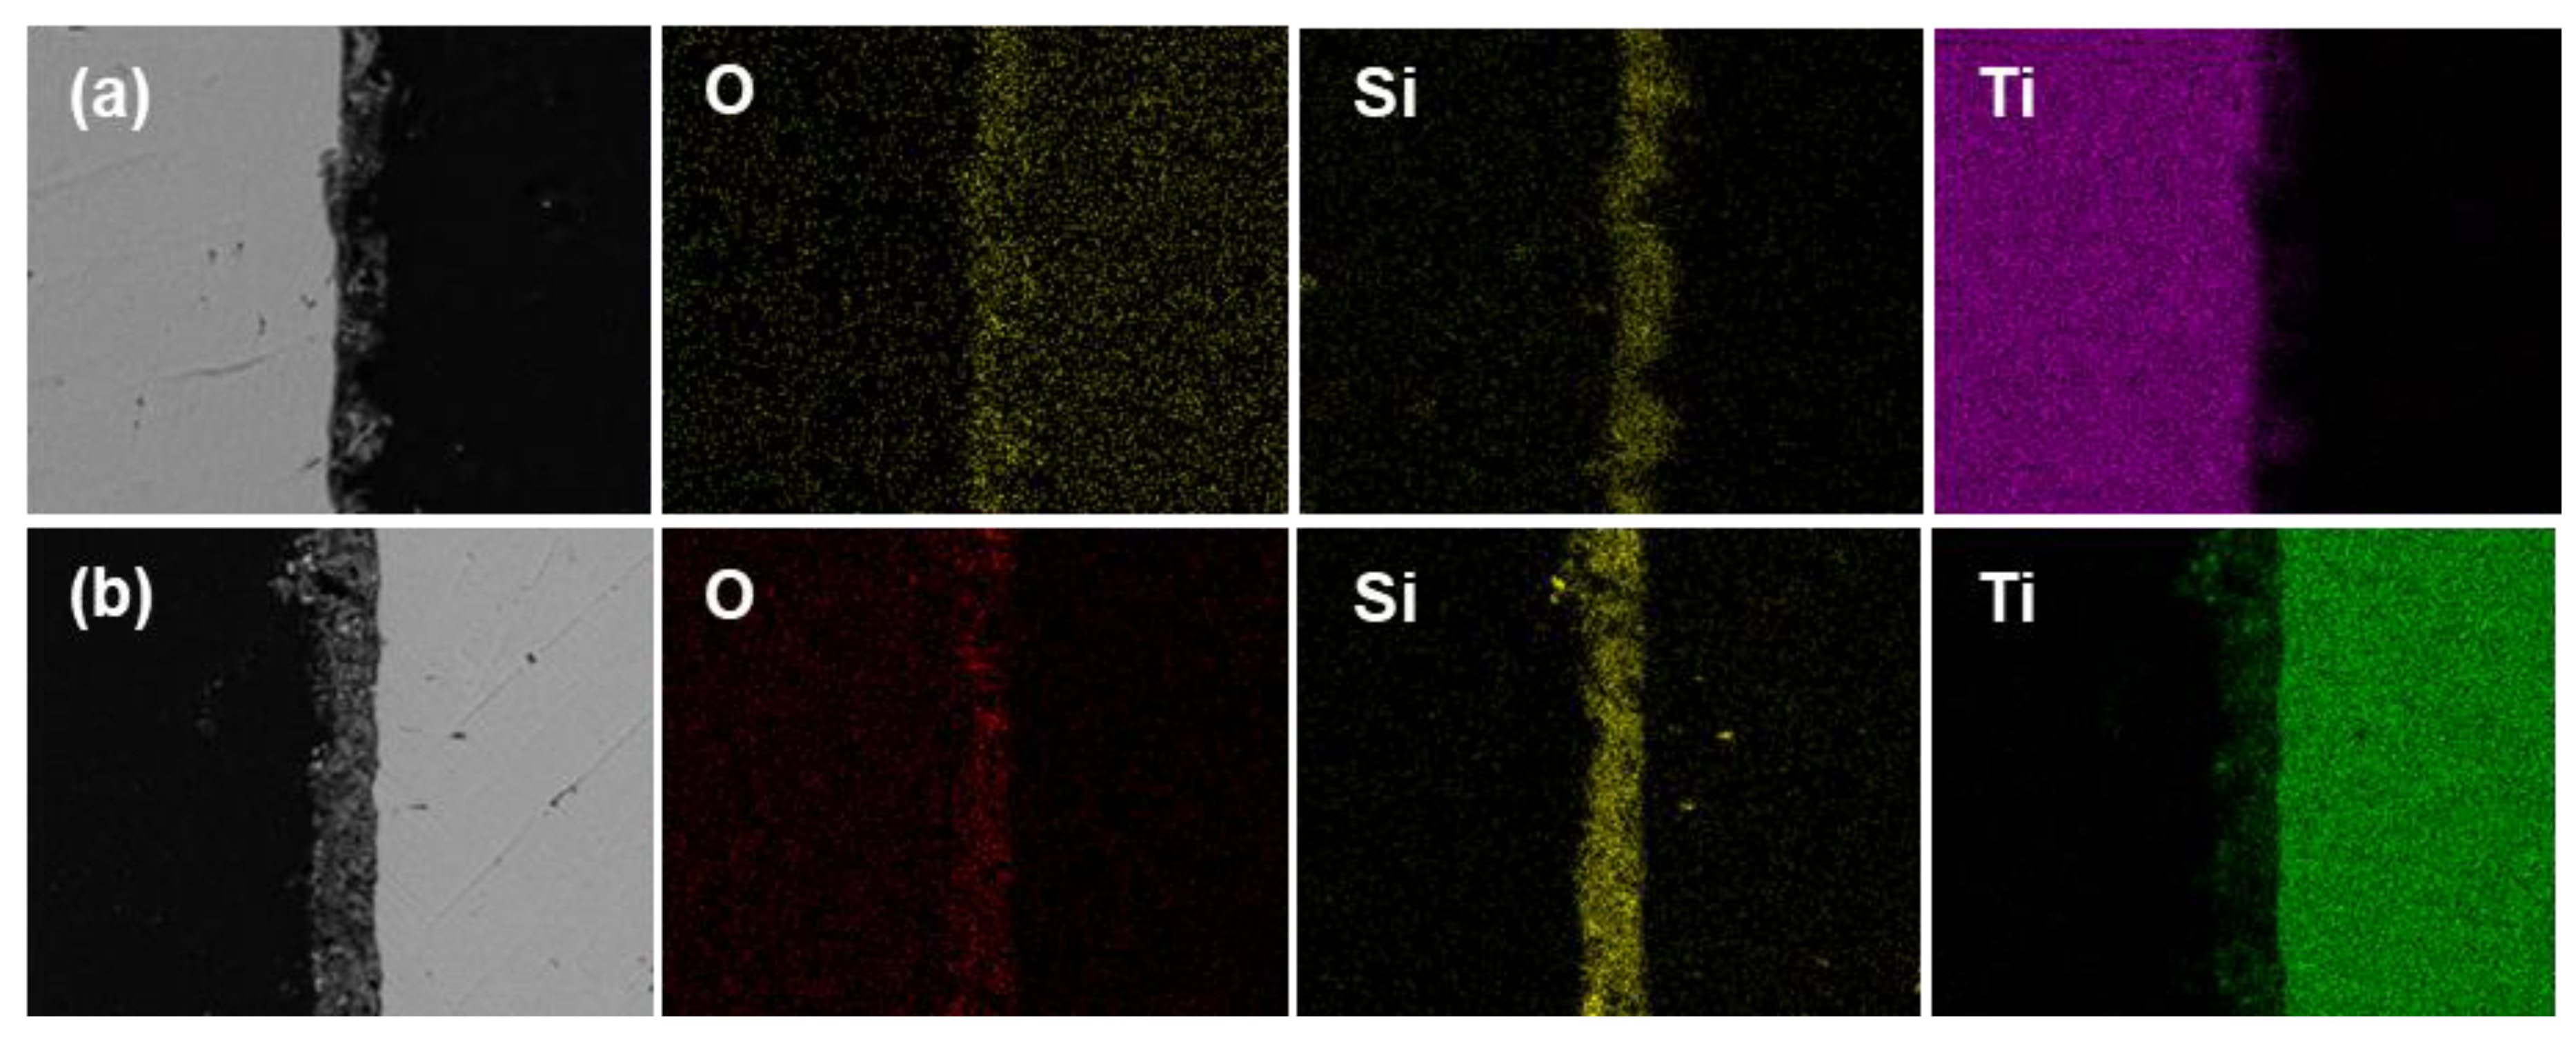
The cross-section SEM images of MAO-1 and MAO-2 coatings by micro-arc oxidation with different time are shown in Figure 5, and the corresponding EDS elemental mapping analyses results are shown in Figure 6. The MAO coatings are composed of inner barrier layer and outer porous layer. The thickness of barrier layer is small with a value of less than 2 μm. The porous layer is heterogeneous. The thicknesses of MAO-1 and MAO-2 coating are about 10 and 25 μm, respectively, and the thickness of MAO-2 coating is more homogeneous compared with the MAO-1 coating. The above results show that the extension of oxidation time can increase the thickness of MAO coating, which mainly increases the thickness and porosity of porous layer. Chemical compositions of cross-section MAO coatings were measured by energy dispersive X-ray spectrometer (EDS) attached to SEM. The MAO-1 and MAO-2 coatings are mainly composed of O and Ti elements with a large amount of Si element, which originated from the used electrolytes (Figure 6). The EDS analysis results show that Na2SiO3 take part in the coating formation during the MAO process, and the MAO coatings are mainly composed of oxide of titanium and compound of silicon.
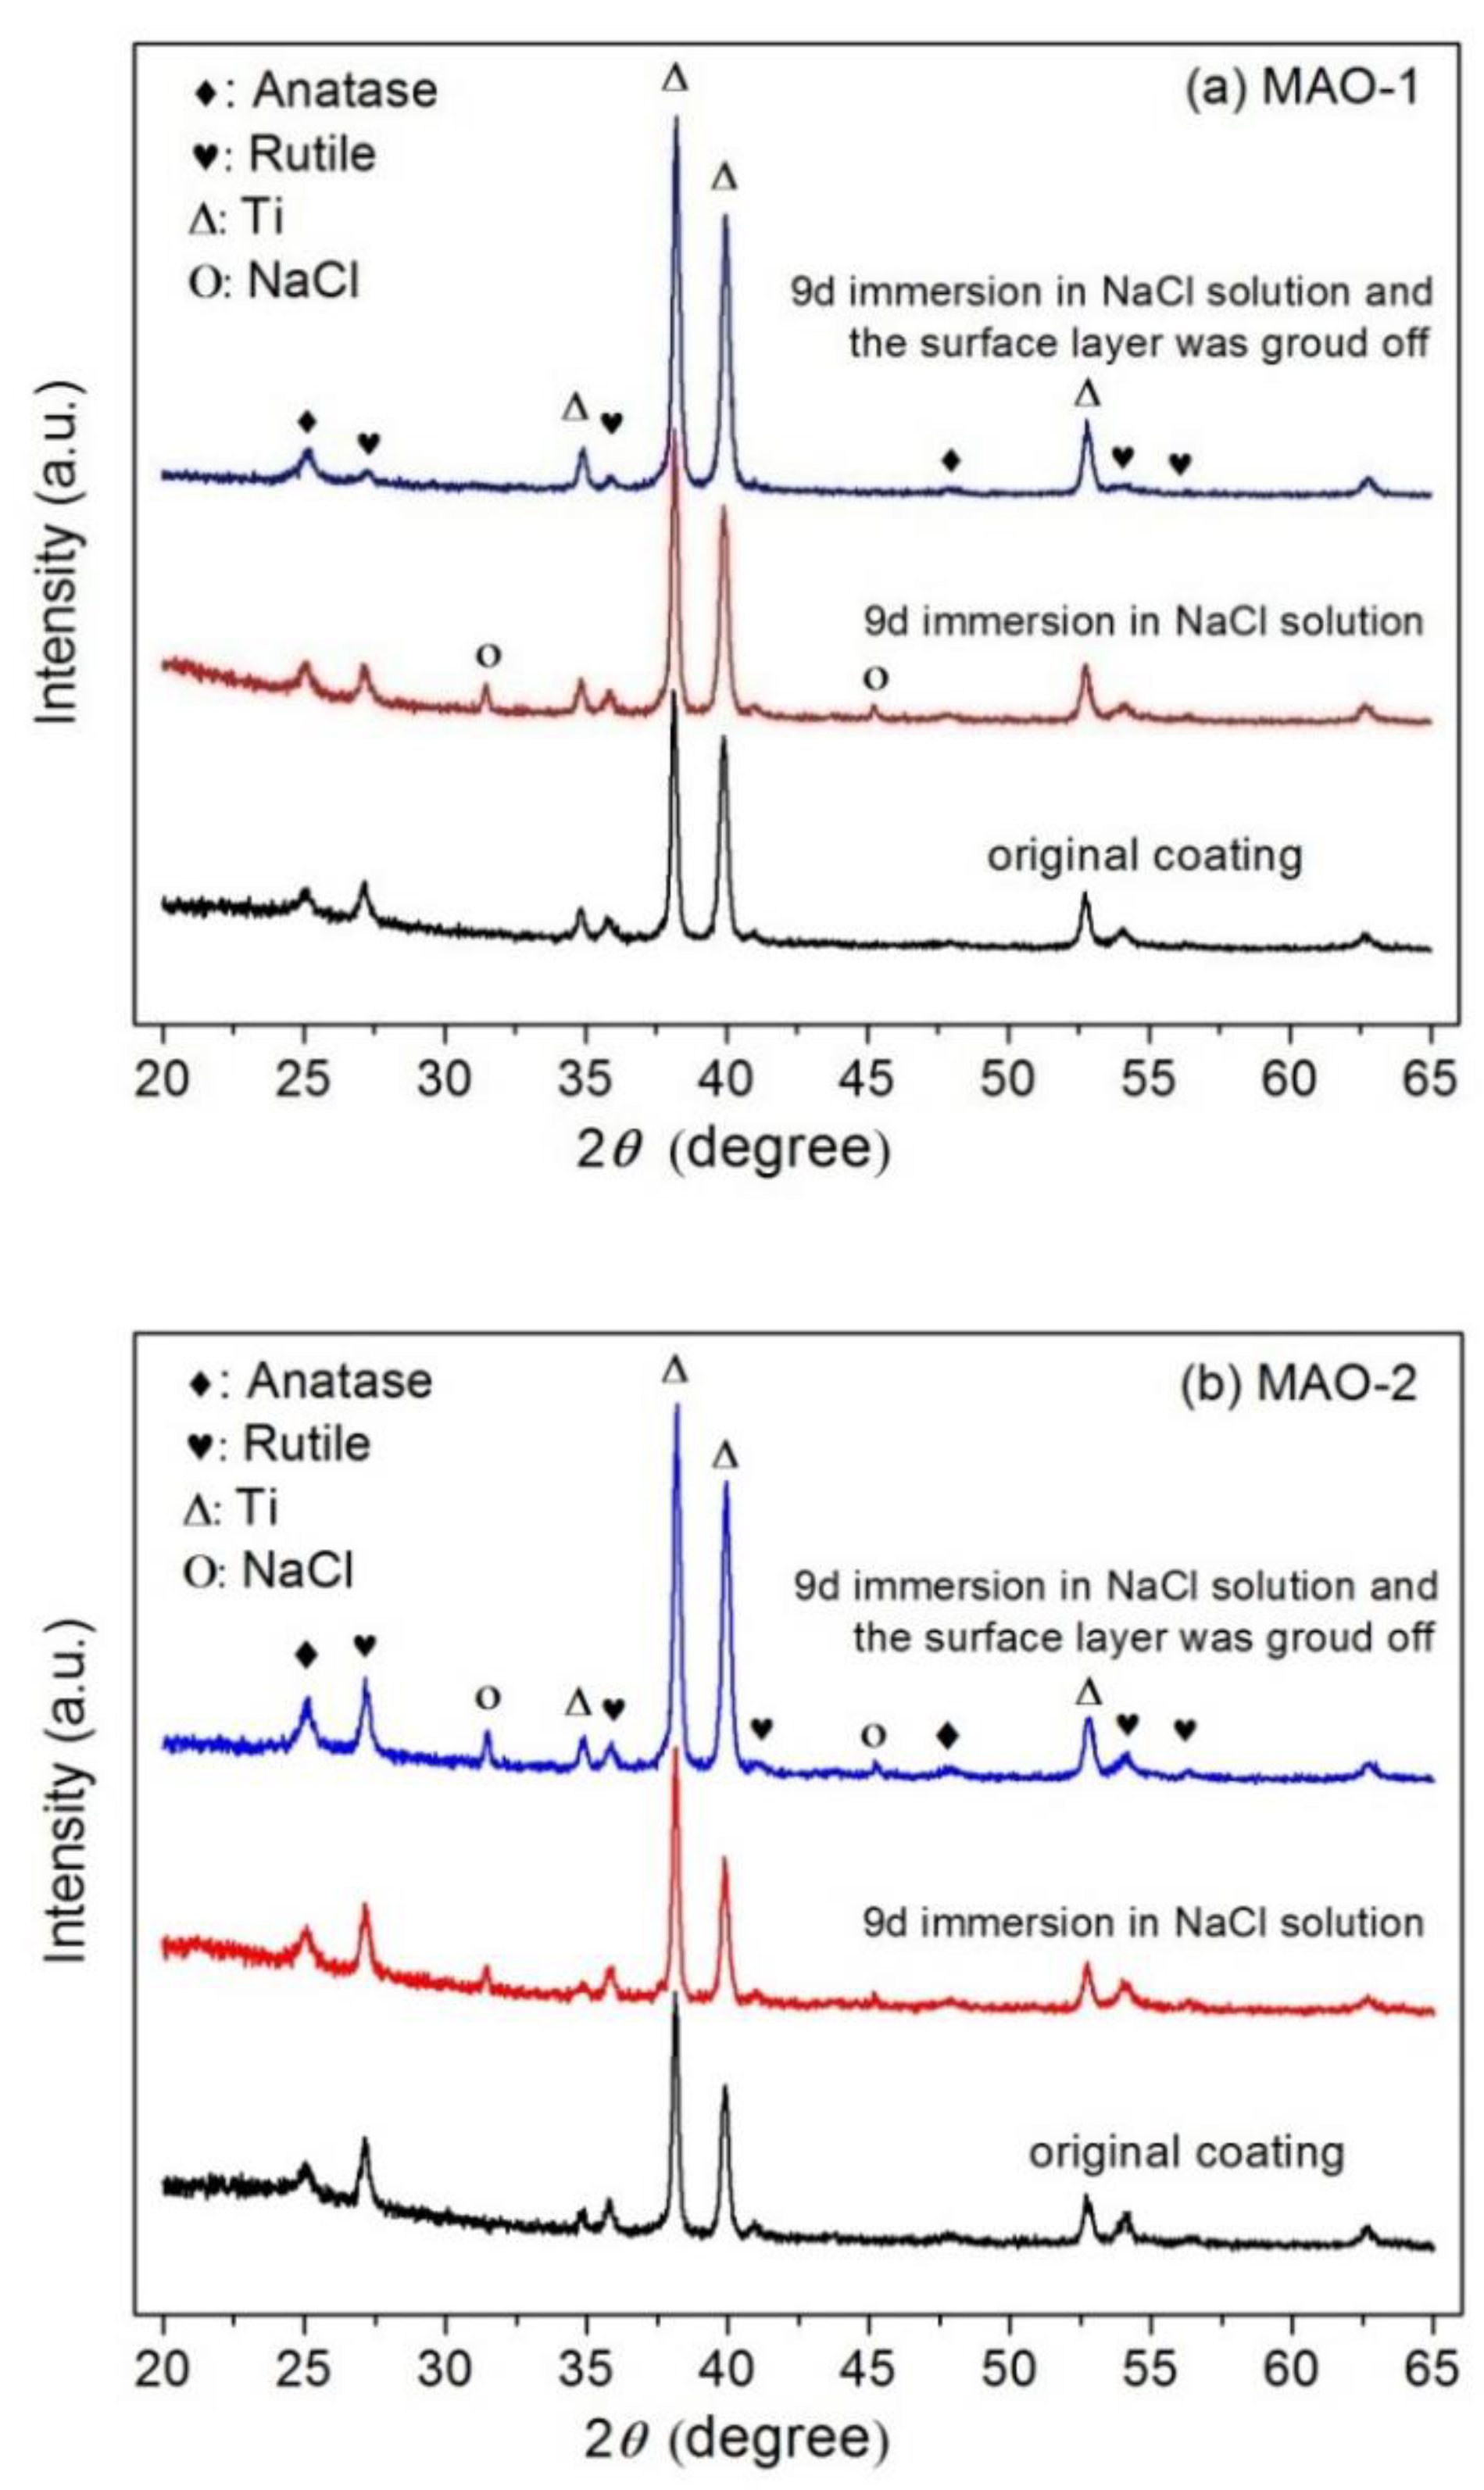
The phase structures of the MAO coatings are analyzed by XRD. Figure 7 illustrates the XRD patterns of the MAO coatings and the MAO coatings after 9 days immersion in 3.5% NaCl solution. 2θ = 27.44 and 25.303 are the characteristic peaks of rutile-TiO2 and anatase-TiO2, respectively. No obvious characteristic peak of Si compound was found in XRD patterns. According to the previous EDS results, the main phase crystals of MAO-1 and MAO-2 coatings are rutile-TiO2 and anatase-TiO2. The Si compounds in coating are amorphous silicate, in which cannot be detected by XRD. Figure 7 also shows the XRD patterns of the MAO coatings without surface thin layer which was ground off using 1500# abrasive paper. In the inner layer of MAO coating, the main phase crystals of MAO-1 and MAO-2 coatings both are rutile-TiO2 and anatase-TiO2, but the phase percentage of rutile in MAO-2 is higher than that in MAO-1. The oxidation time of MAO-2 is 10 min, while it is 3 min for MAO-1. With the increase of oxidation time, anatase-TiO2 can gradually transforms to rutile-TiO2 [11].
While the MAO samples are immersed in 3.5% NaCl solution, Na+ and Cl penetrate into porous MAO coating, which results in the existence of residual NaCl in MAO coating. After the MAO samples were rinsed with distilled water and clean ultrasonically in distilled water, the residual NaCl still was found in inner layer of MAO-2 coating but not found in inner layer of MAO-2 coating. This is because that the porosity and thickness of MAO-2 coating are higher than that of MAO-1. Because the porosity of MAO-2 is higher than that of MAO-1, the amount of Na+ and Cl penetrating into porous MAO-2 coating is higher than that into MAO-1 coating, so that the residual NaCl in MAO-2 coating more difficult be cleaned. Increasing oxidation time also results in the increase of porosity of inner barrier layer of MAO-2, which can be one of the reasons for the residual NaCl existing in inner layer of MAO-2 coating.

3.2. Electrochemical Behavior

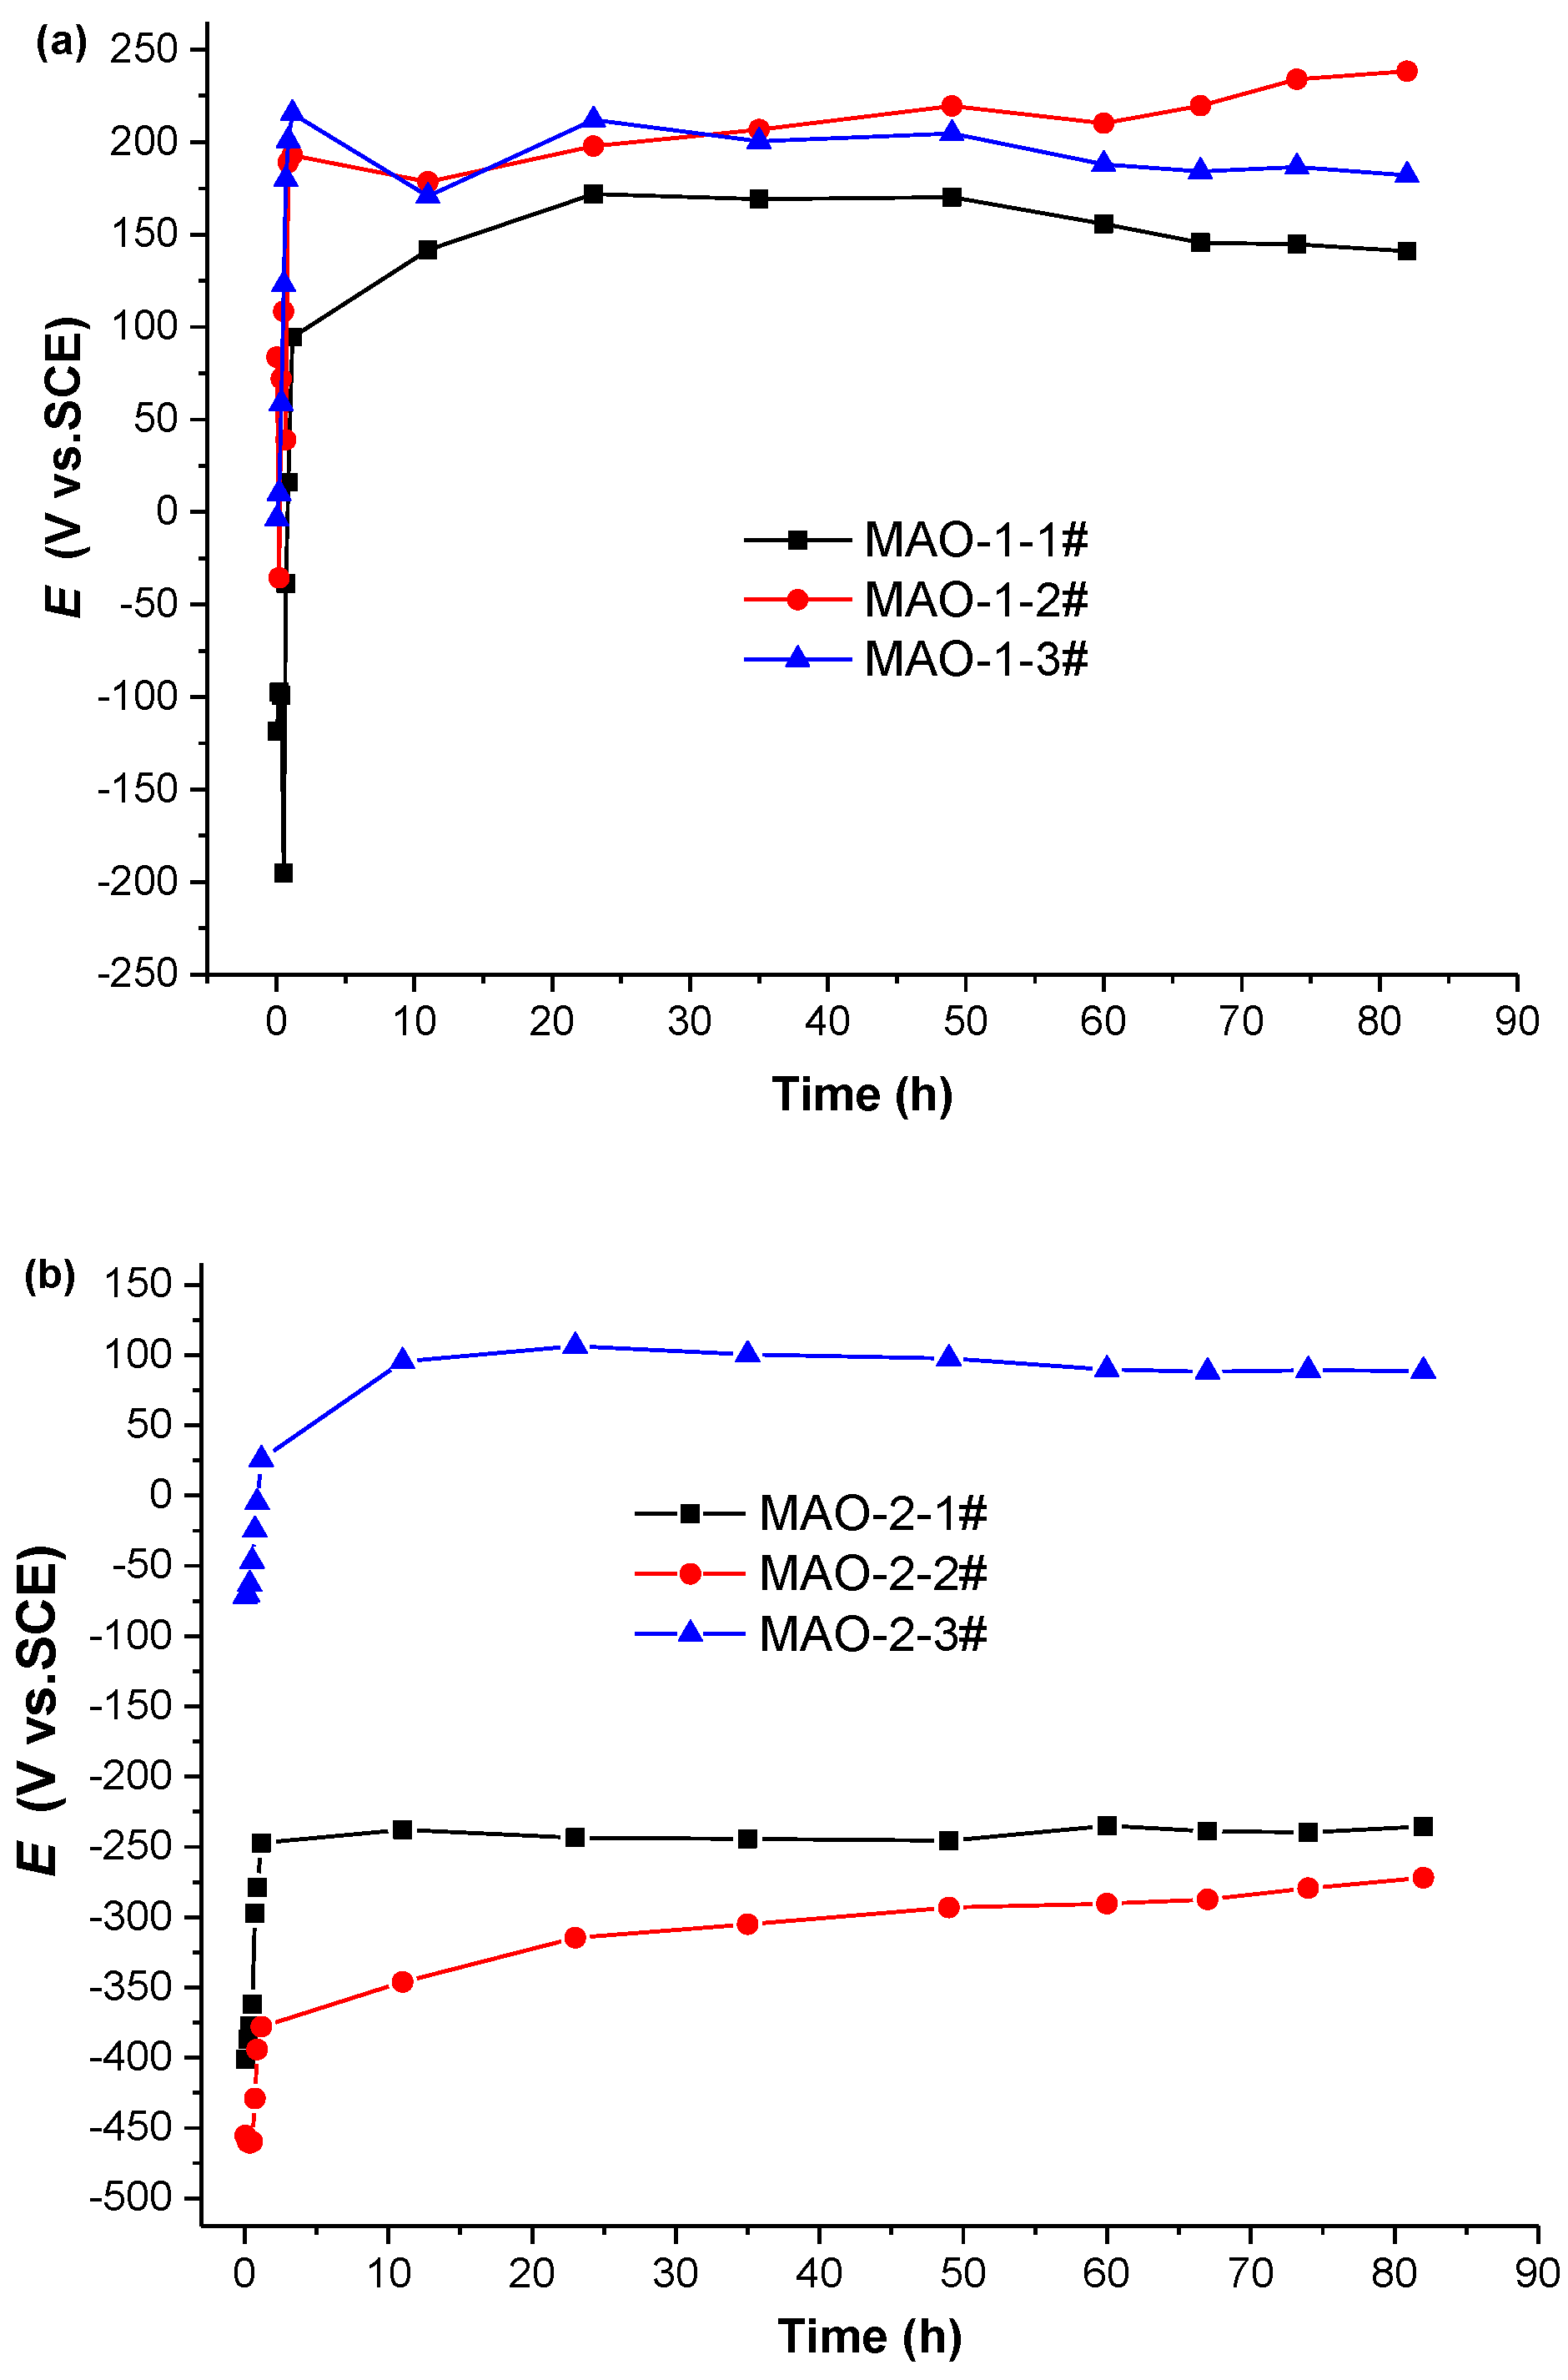
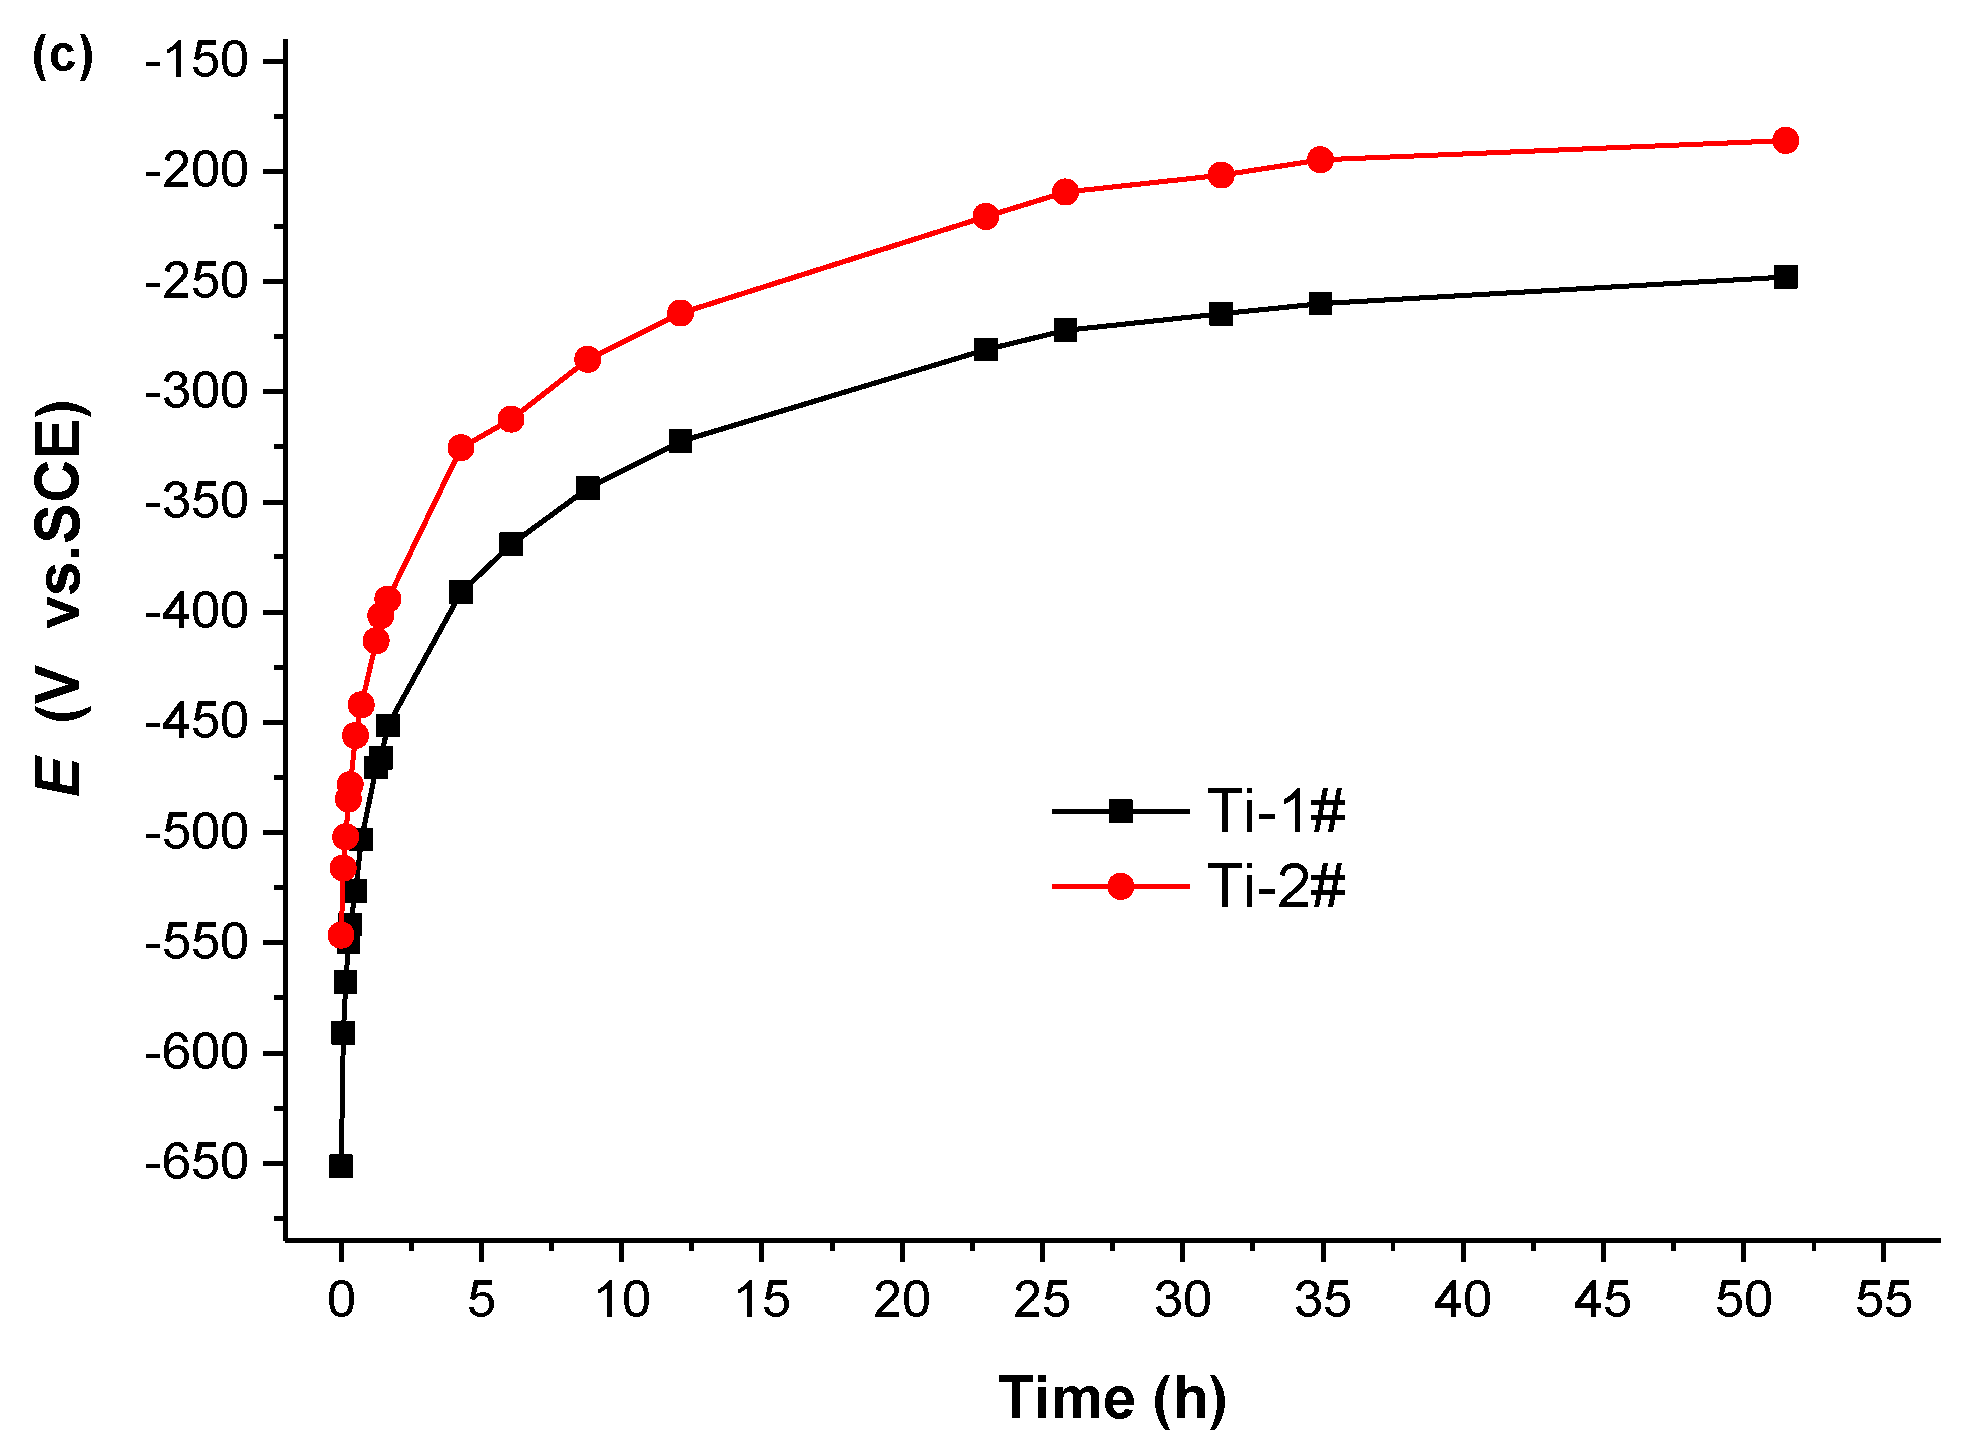
The OCP of MAO-1 and MAO-2 sample together with the bare TA2 specimen in 3.5% NaCl solution were measured, and the changes of OCP with time are shown in Figure 8. It is observed that the OCP of TA2 specimen tends to be stable after 30 h immersion, and the stabilized OCP is about −220 mV vs. SCE. For MAO-1 specimen, the OCP of parallel samples have good reproducibility. At the beginning of immersion, the OCP of MAO-1 is more positive than that of untreated TA2, and the difference value of initial OCP between MAO-1 and untreated TA2 is about 400 mV. After 1 h immersion, the OCP of MAO-1 tended to be stable, and the stabilized value is about 190 mV, which is significantly more positive than that of untreated TA2. According to the OCP of MAO-2 specimen, there are obvious differences among three parallel samples, and all the initial OCP of MAO-2 are more negative than those of MAO-1. The initial OCP of MAO-2-3# are close to MAO-1 and more positive than those of MAO-2-1# and MAO-2-2#. The OCP of MAO-2-1# and MAO-2-2# are slightly more positive than those of untreated TA2. The stable OCP of MAO-2-3# is about 90 mV, which is smaller than that of MAO-1. The stable potential of MAO-2-1# and MAO-2-2# are about −240 mV and −280 mV, respectively, which are approximately equal to bare TA2 specimen.
The above results illuminate that there are obvious differences between MAO coating and self-passive film on TA2. The differences between the two MAO coatings are related to their porous structures and thickness. The porosity percentage and pore size of MAO-1 coating are lower; the thickness of MAO-1 coating is significantly higher than that of self-passive film, leading the penetration of the corrosive ions to be difficult as well as the enhancement of OCP of MAO-1 specimen. However, the porosity percentage of the MAO-2 coating is higher, and its inner barrier layer may also be porous, which makes the ions to easy penetrate the coating so that the OCP values of MAO-2 specimen are approximately equal to the bare TA2 specimen. In addition, the difference of OCP among MAO-1, MAO-2, and bare TA2 specimens may also be related to the silicate existing in the MAO coating.
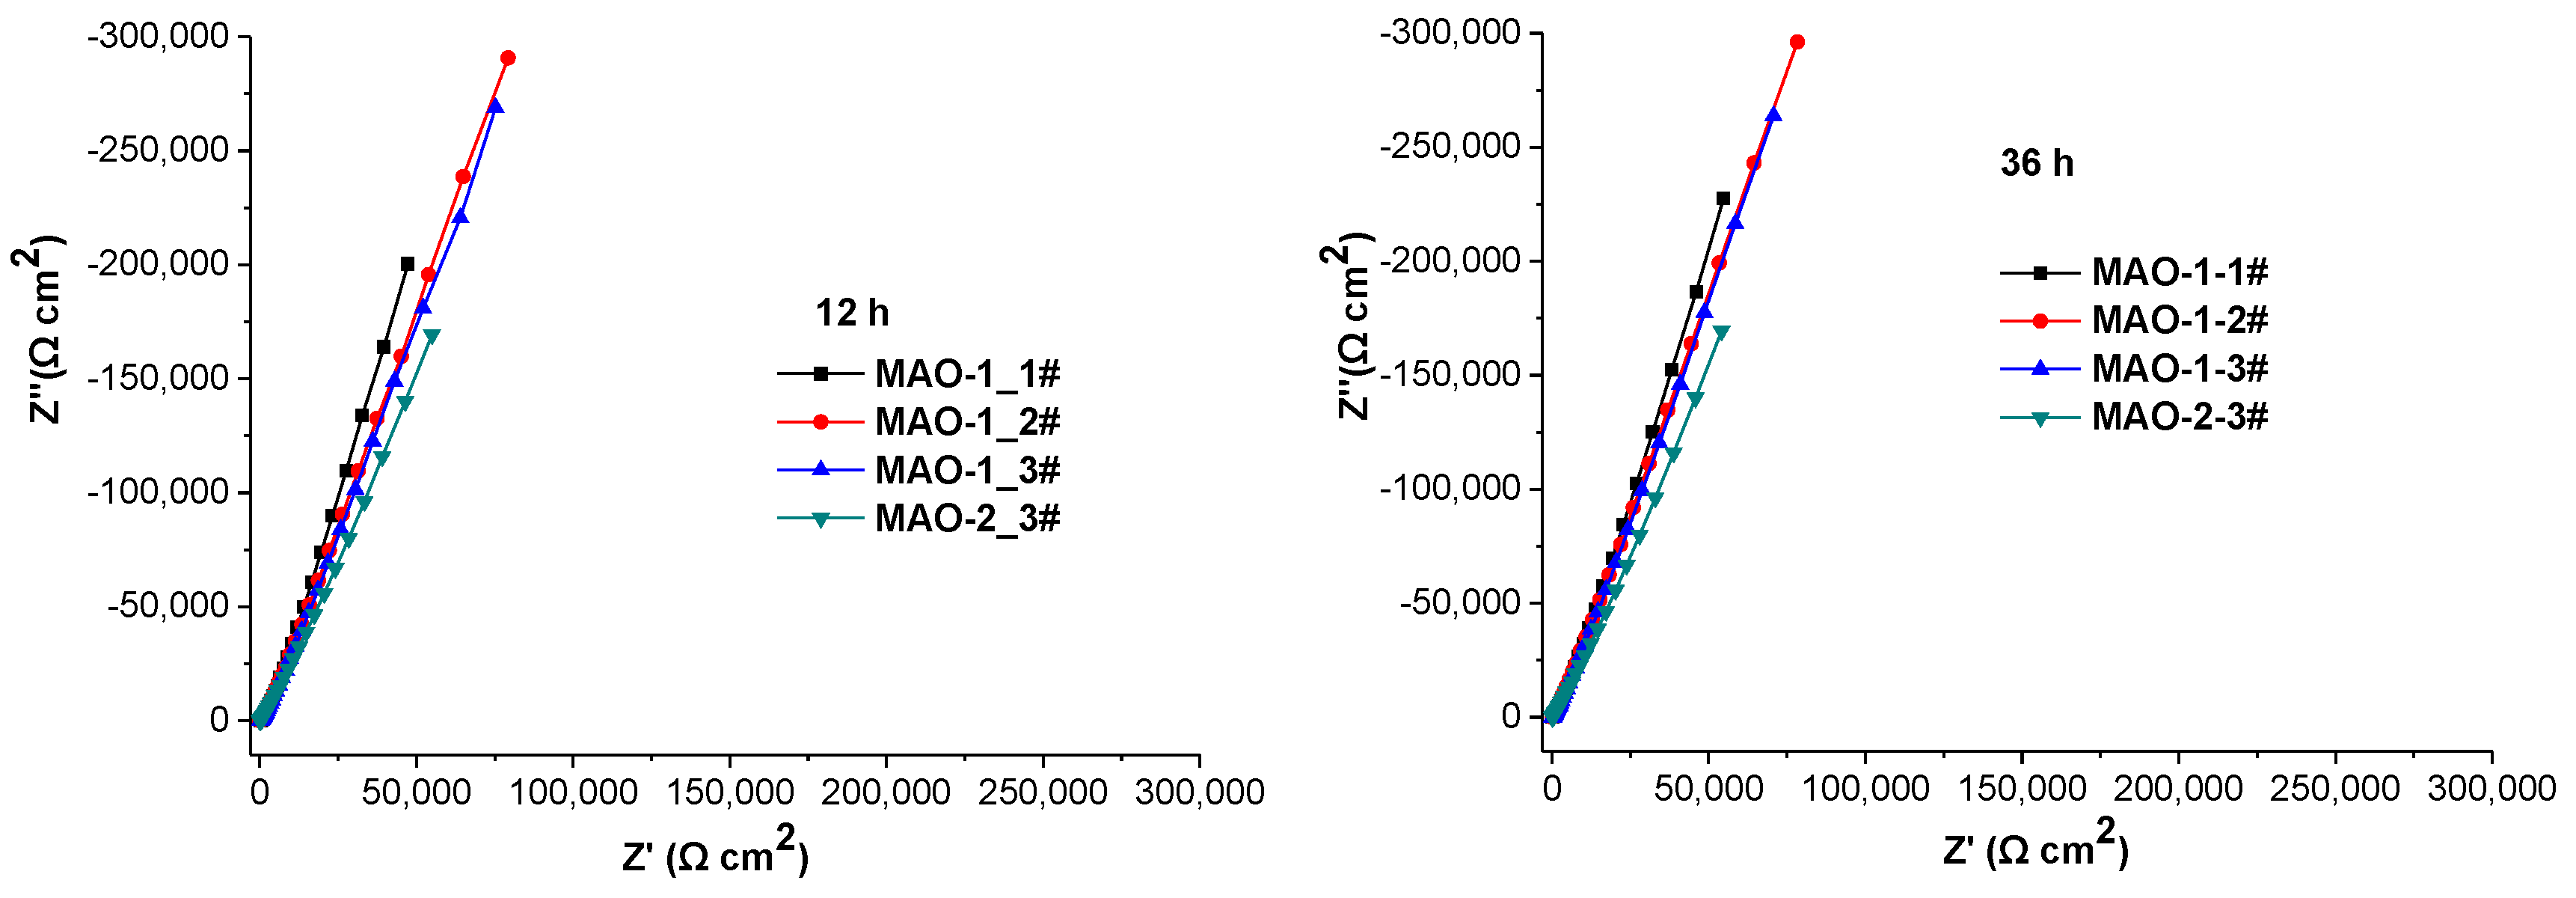
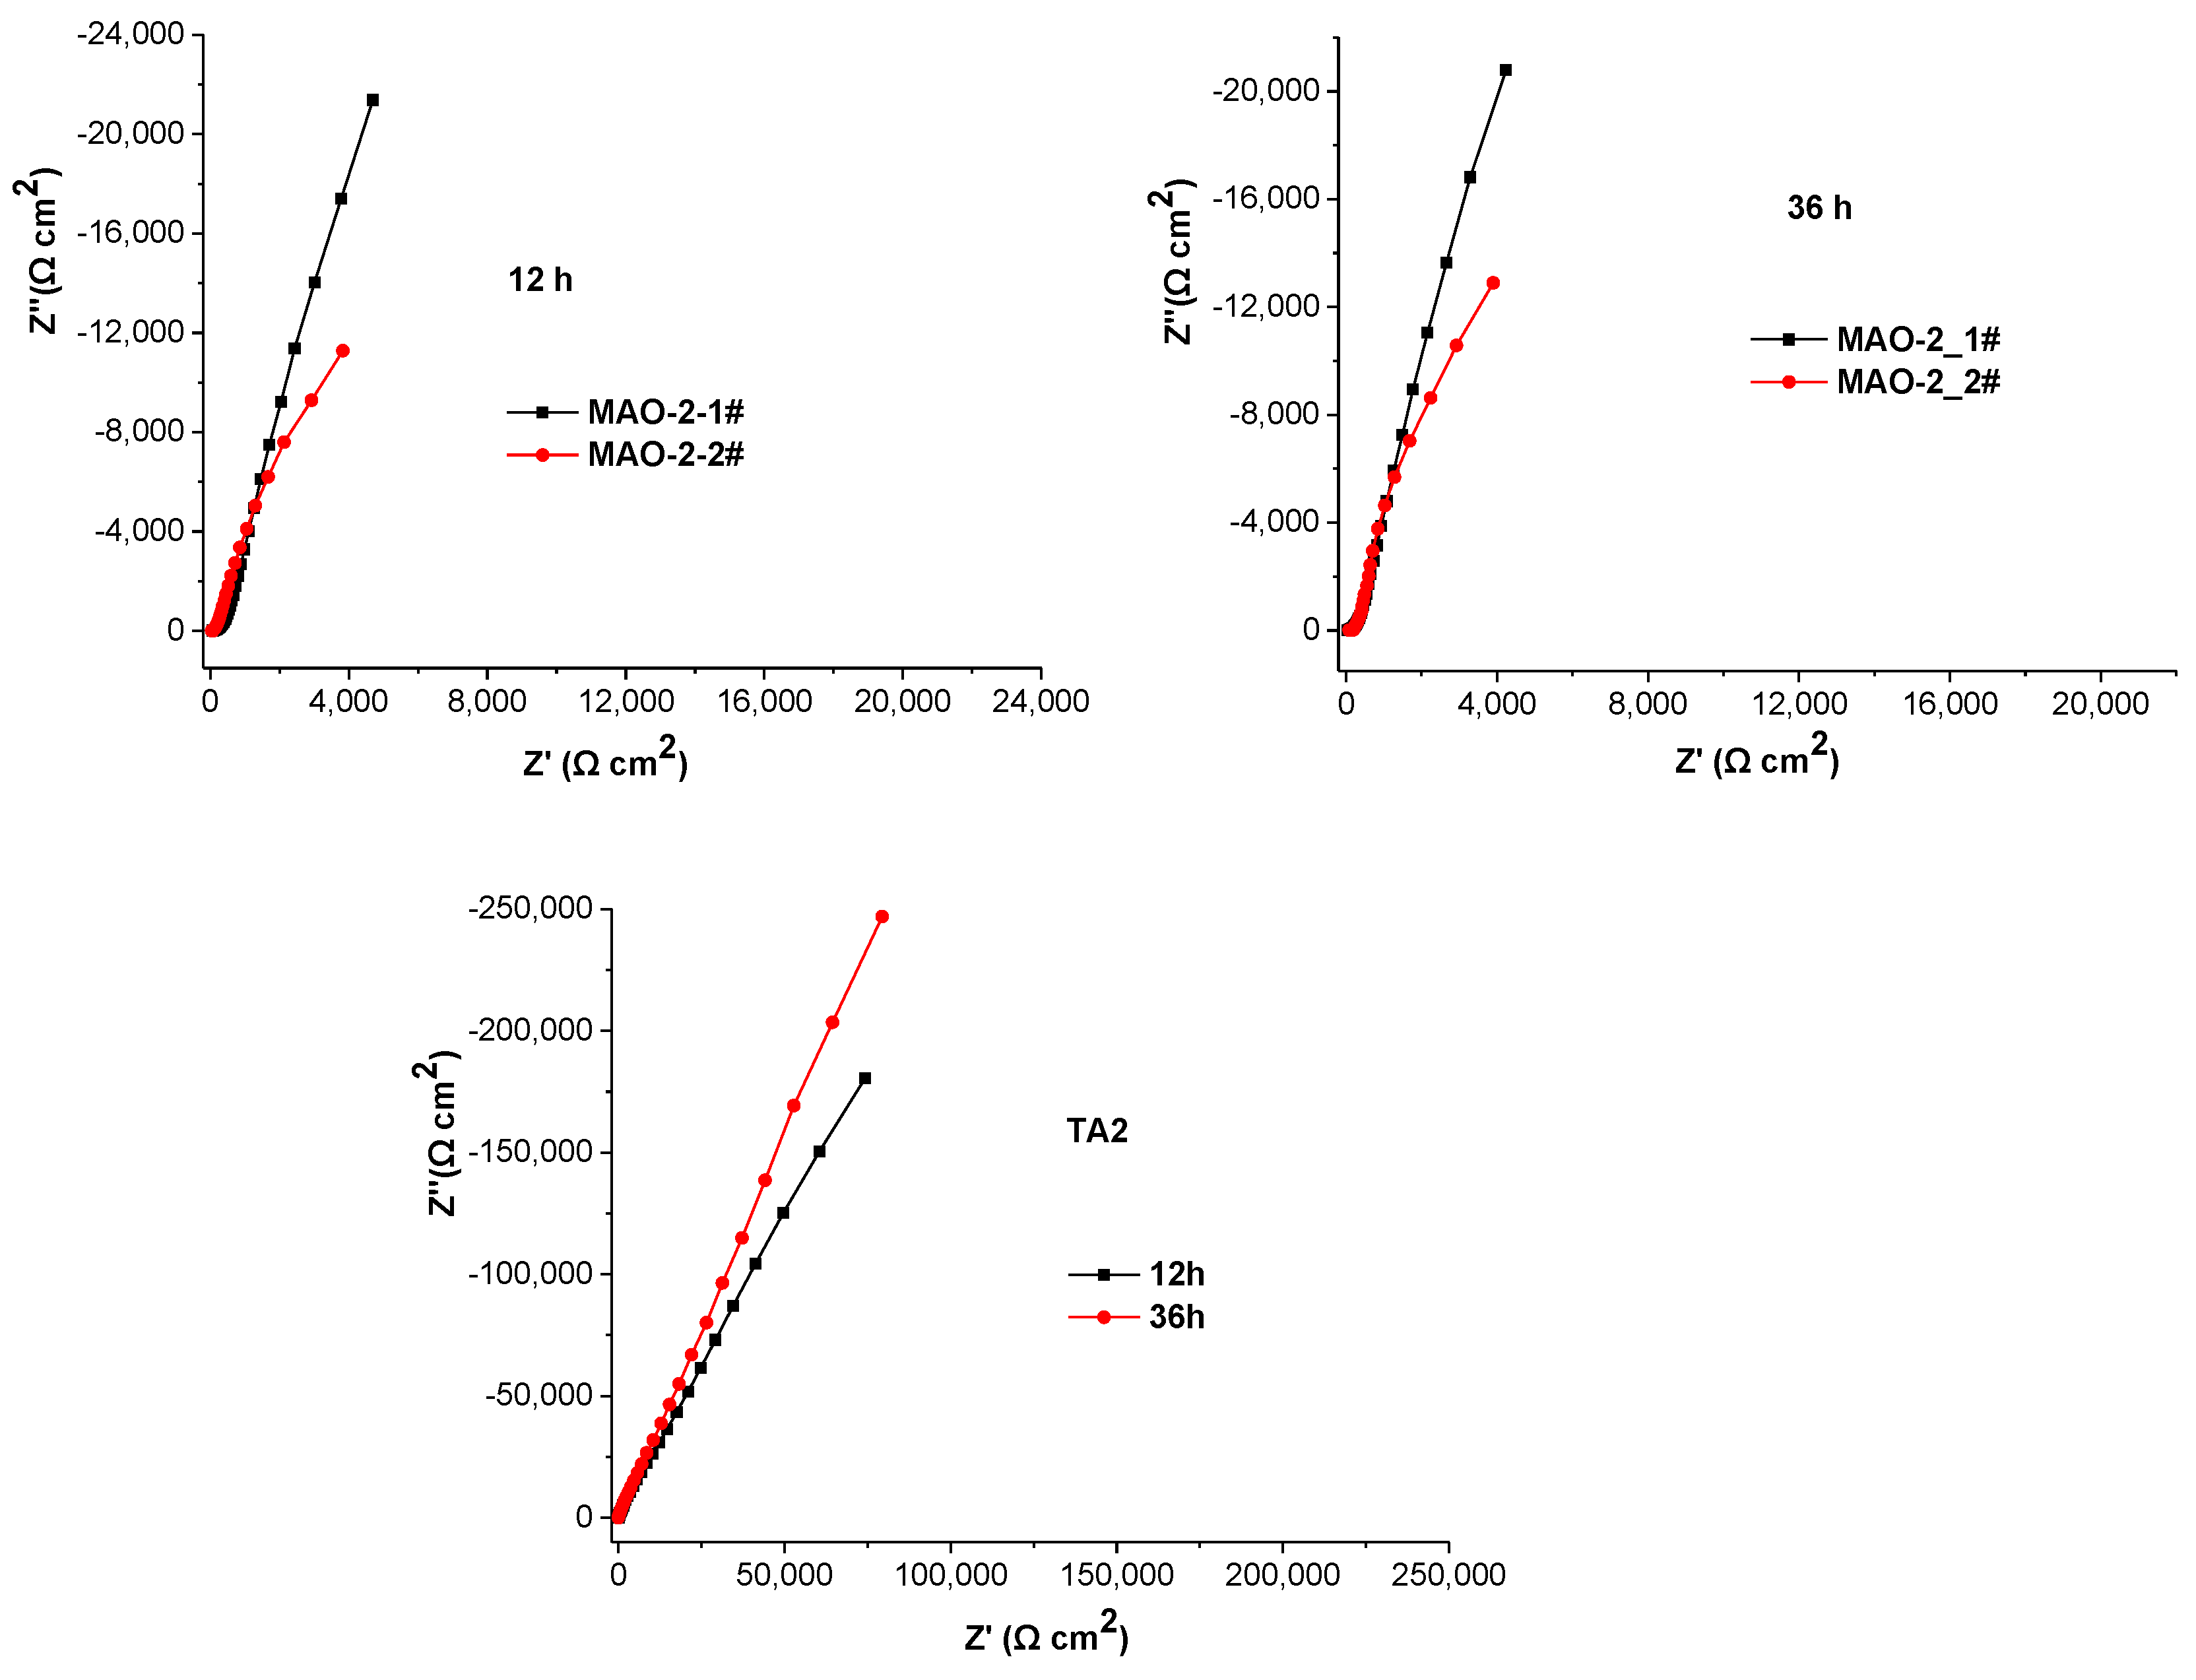
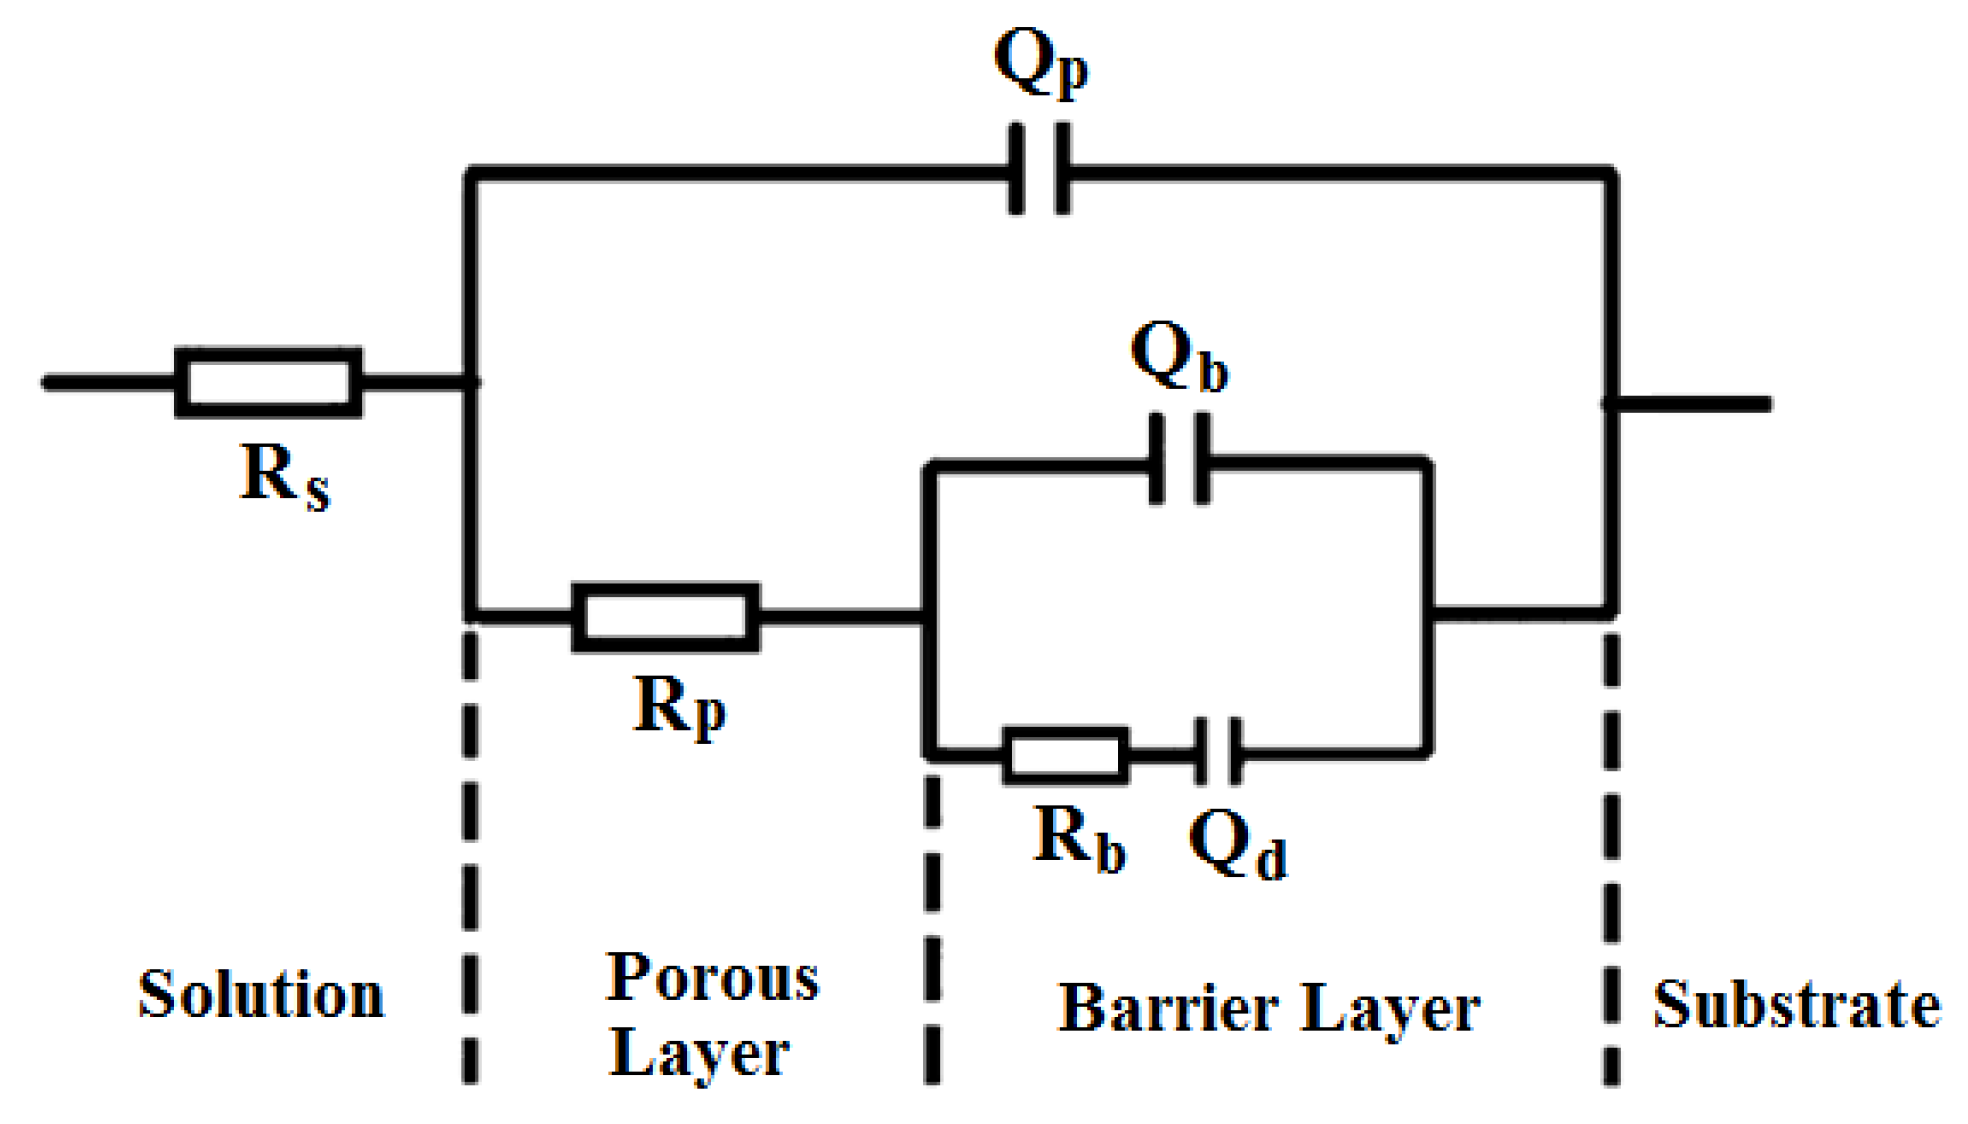
The EIS spectra of MAO and bare TA2 specimens are measured after immersion in 3.5% NaCl solution for 12 and 36 h, respectively. The Nyquist plots of EIS are shown in Figure 9. The EIS spectrum is always analyzed by the simulation of data using a suitable equivalent circuit model. Some equivalent circuits were proposed to simulate data for MAO coatings in solutions [8,12,13,14,15,16,17]. According to the EIS of MAO coating in 3.5% NaCl solution, the equivalent circuit model Rs(Qp(Rp(Qb(RbQd)))) (Figure 10) is chosen to simulate data using ZSimpWin software. The model consists of resistance elements for solution (Rs), porous layer (Rp), barrier layer (Rb), and constant phase elements for the porous (Qp) and barrier (Qb) layers. In addition, a phase element (Qd) is added in series Rb to demonstrate the diffusion of ions through the oxide layer [17].
The passive film on bare TA2 specimen is similar to the inner barrier layer of MAO coating on TA2. The equivalent circuit model Rs(Qb(RbQd)), which is obtained by discarding the elements for porous layer of the equivalent circuit model Rs(Qp(Rb(Qb(RbQd)))), was used to fit the EIS spectra of bare TA2 specimen. In this model, the elements for passive film on bare TA2 specimen also labelled with subscript band Qd the phase element, demonstrating the diffusion of ions through the passive film.
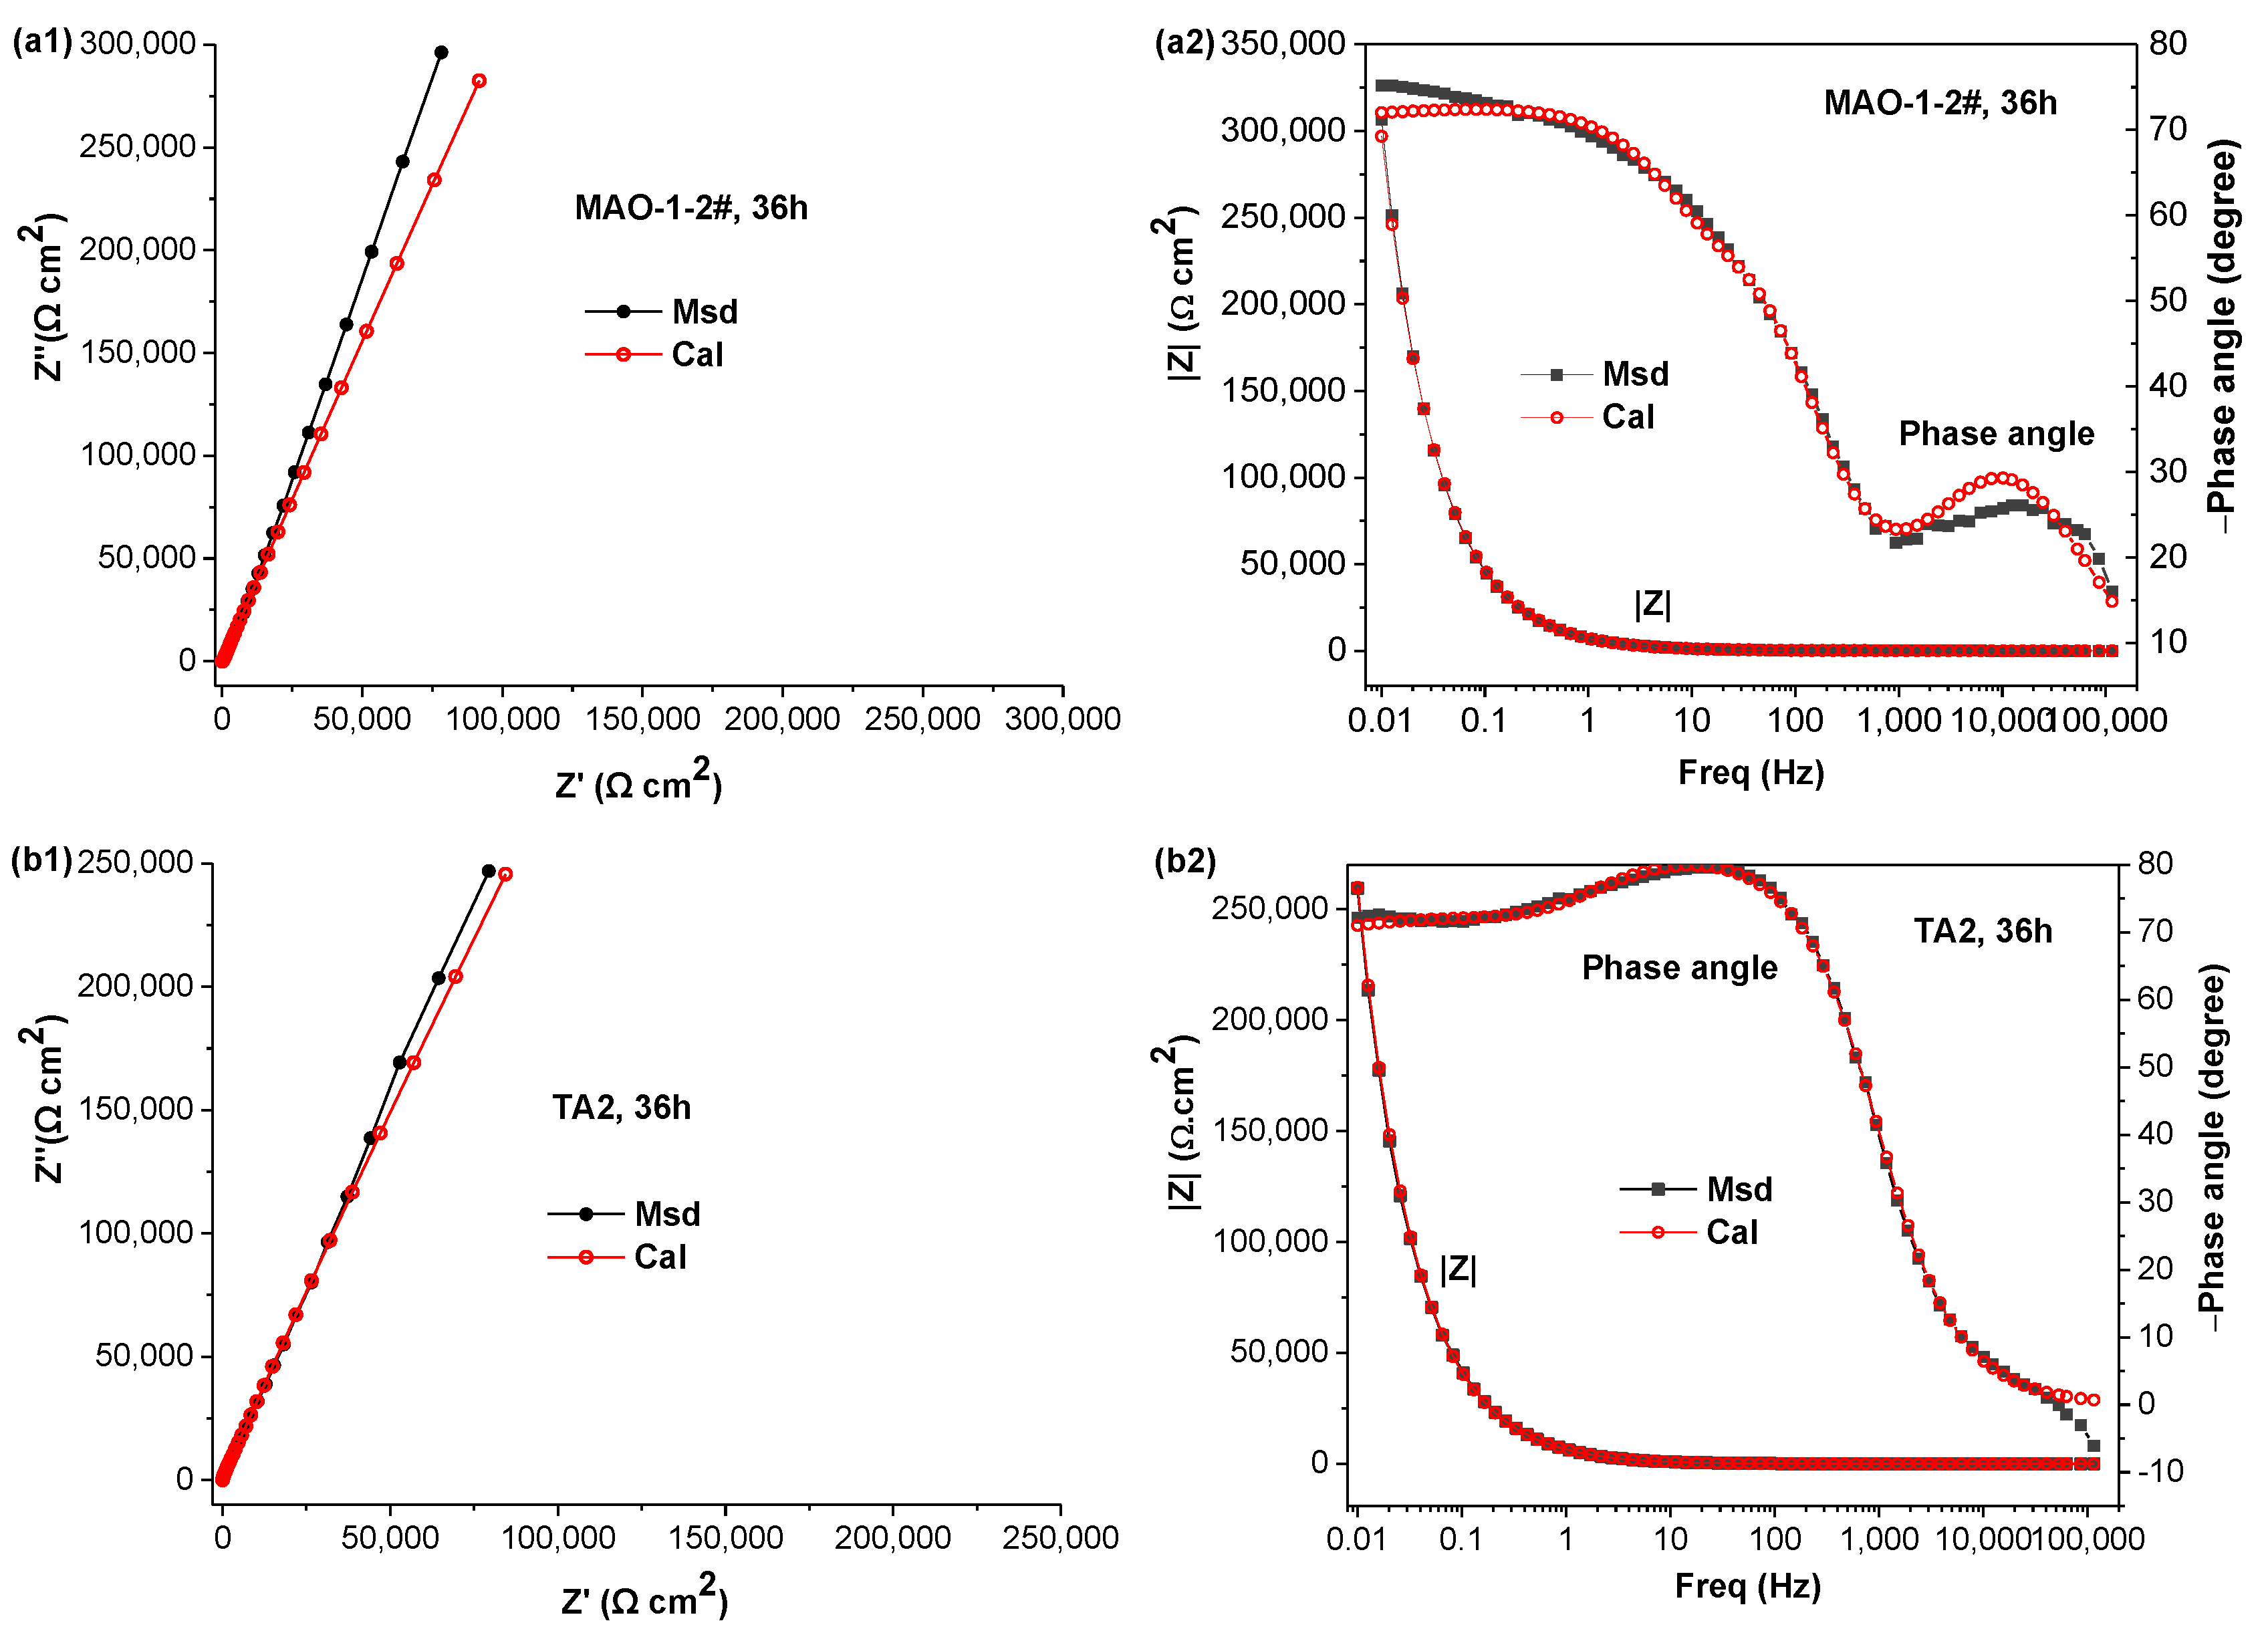
The fitting plots of the EIS spectra measured after 36 h immersion are shown in Figure 11. It is seen that the simulated data achieved by the above two models are in a good agreement with the experimental results, which illustrates that the models are able to interpret the electrochemical behavior of double layer MAO coatings and passive film on bare TA2, respectively.
The fitting parameters of EIS data are shown in Table 1. Figure 9 and Table 1 show that the EIS of parallel MAO-1 samples have a good reproducibility, but there are differences of the EIS spectra for the parallel MAO-2 samples. The resistance value (Rb + Rp) of MAO-2-3# is significantly greater than that of MAO-2-1# and MAO-2-2#, but significantly less than that of MAO-1 samples.
Compared with the previous OCP results of MAO, it can be seen that the results of resistances well correspond with OCP. The OCP values of MAO-2 specimen are lower than those of MAO-1 specimen, and the resistance values (Rb + Rp) of MAO-2 coatings are also lower than MAO-1 specimen. The OCP of MAO-2-1# and MAO-2-2# specimens are small, and their resistance values (Rb + Rp) are also obviously low. The resistance Rb for inner barrier layer of MAO-1 is significantly higher than that of MAO-2, and the resistance Rp for outer porous layer of MAO-1 is also significantly higher than that of MAO-2-1# and MAO-2-2#. The above impedance behaviors of MAO-1 and MAO-2 are related to the porosity of coating. MAO-2-1# and MAO-2-2# coating have relatively high porosities, and their resistances in 3.5% NaCl solution are relatively low. The above analyses show that OCP can be used to evaluate the porosity of MAO coating, more positive OCP indicates the coating with lower porosity. In addition, the poor reproducibility of the above electrochemical tests of MAO-2 indicates that there are obvious differences of microstructure and property among three parallel samples, which illuminates that the increase of oxidation time may reduce the stability of MAO coating due to the thickness increase of coating.
The fitted parameters of the EIS spectrum (Figure 11) of bare TA2 specimen measured after 36 h immersion are listed as follow: Rb = 21680 Ω·cm2, Qd = 1.319 × 10⁻⁵ F·cm−2, nd = 0.6829; Qb = 0.00002504 F·cm−2, nb = 0.9177. The electrochemical impedance parameters of the EIS spectrum of MAO-1-2# sample measured after 36 h immersion are listed as follows: Rb = 3193 Ω·cm2, Qd = 7.905 × 10⁻⁶ F·cm−2, nd = 0.8489, Qb = 0.00001723 F·cm−2, nb = 0.8327. The values of Rb and Qd of untreated TA2 are significantly larger than those of MAO-1-2#, which reveals that the compactness of passive film is significantly higher than that of inner barrier layer of MAO coating.
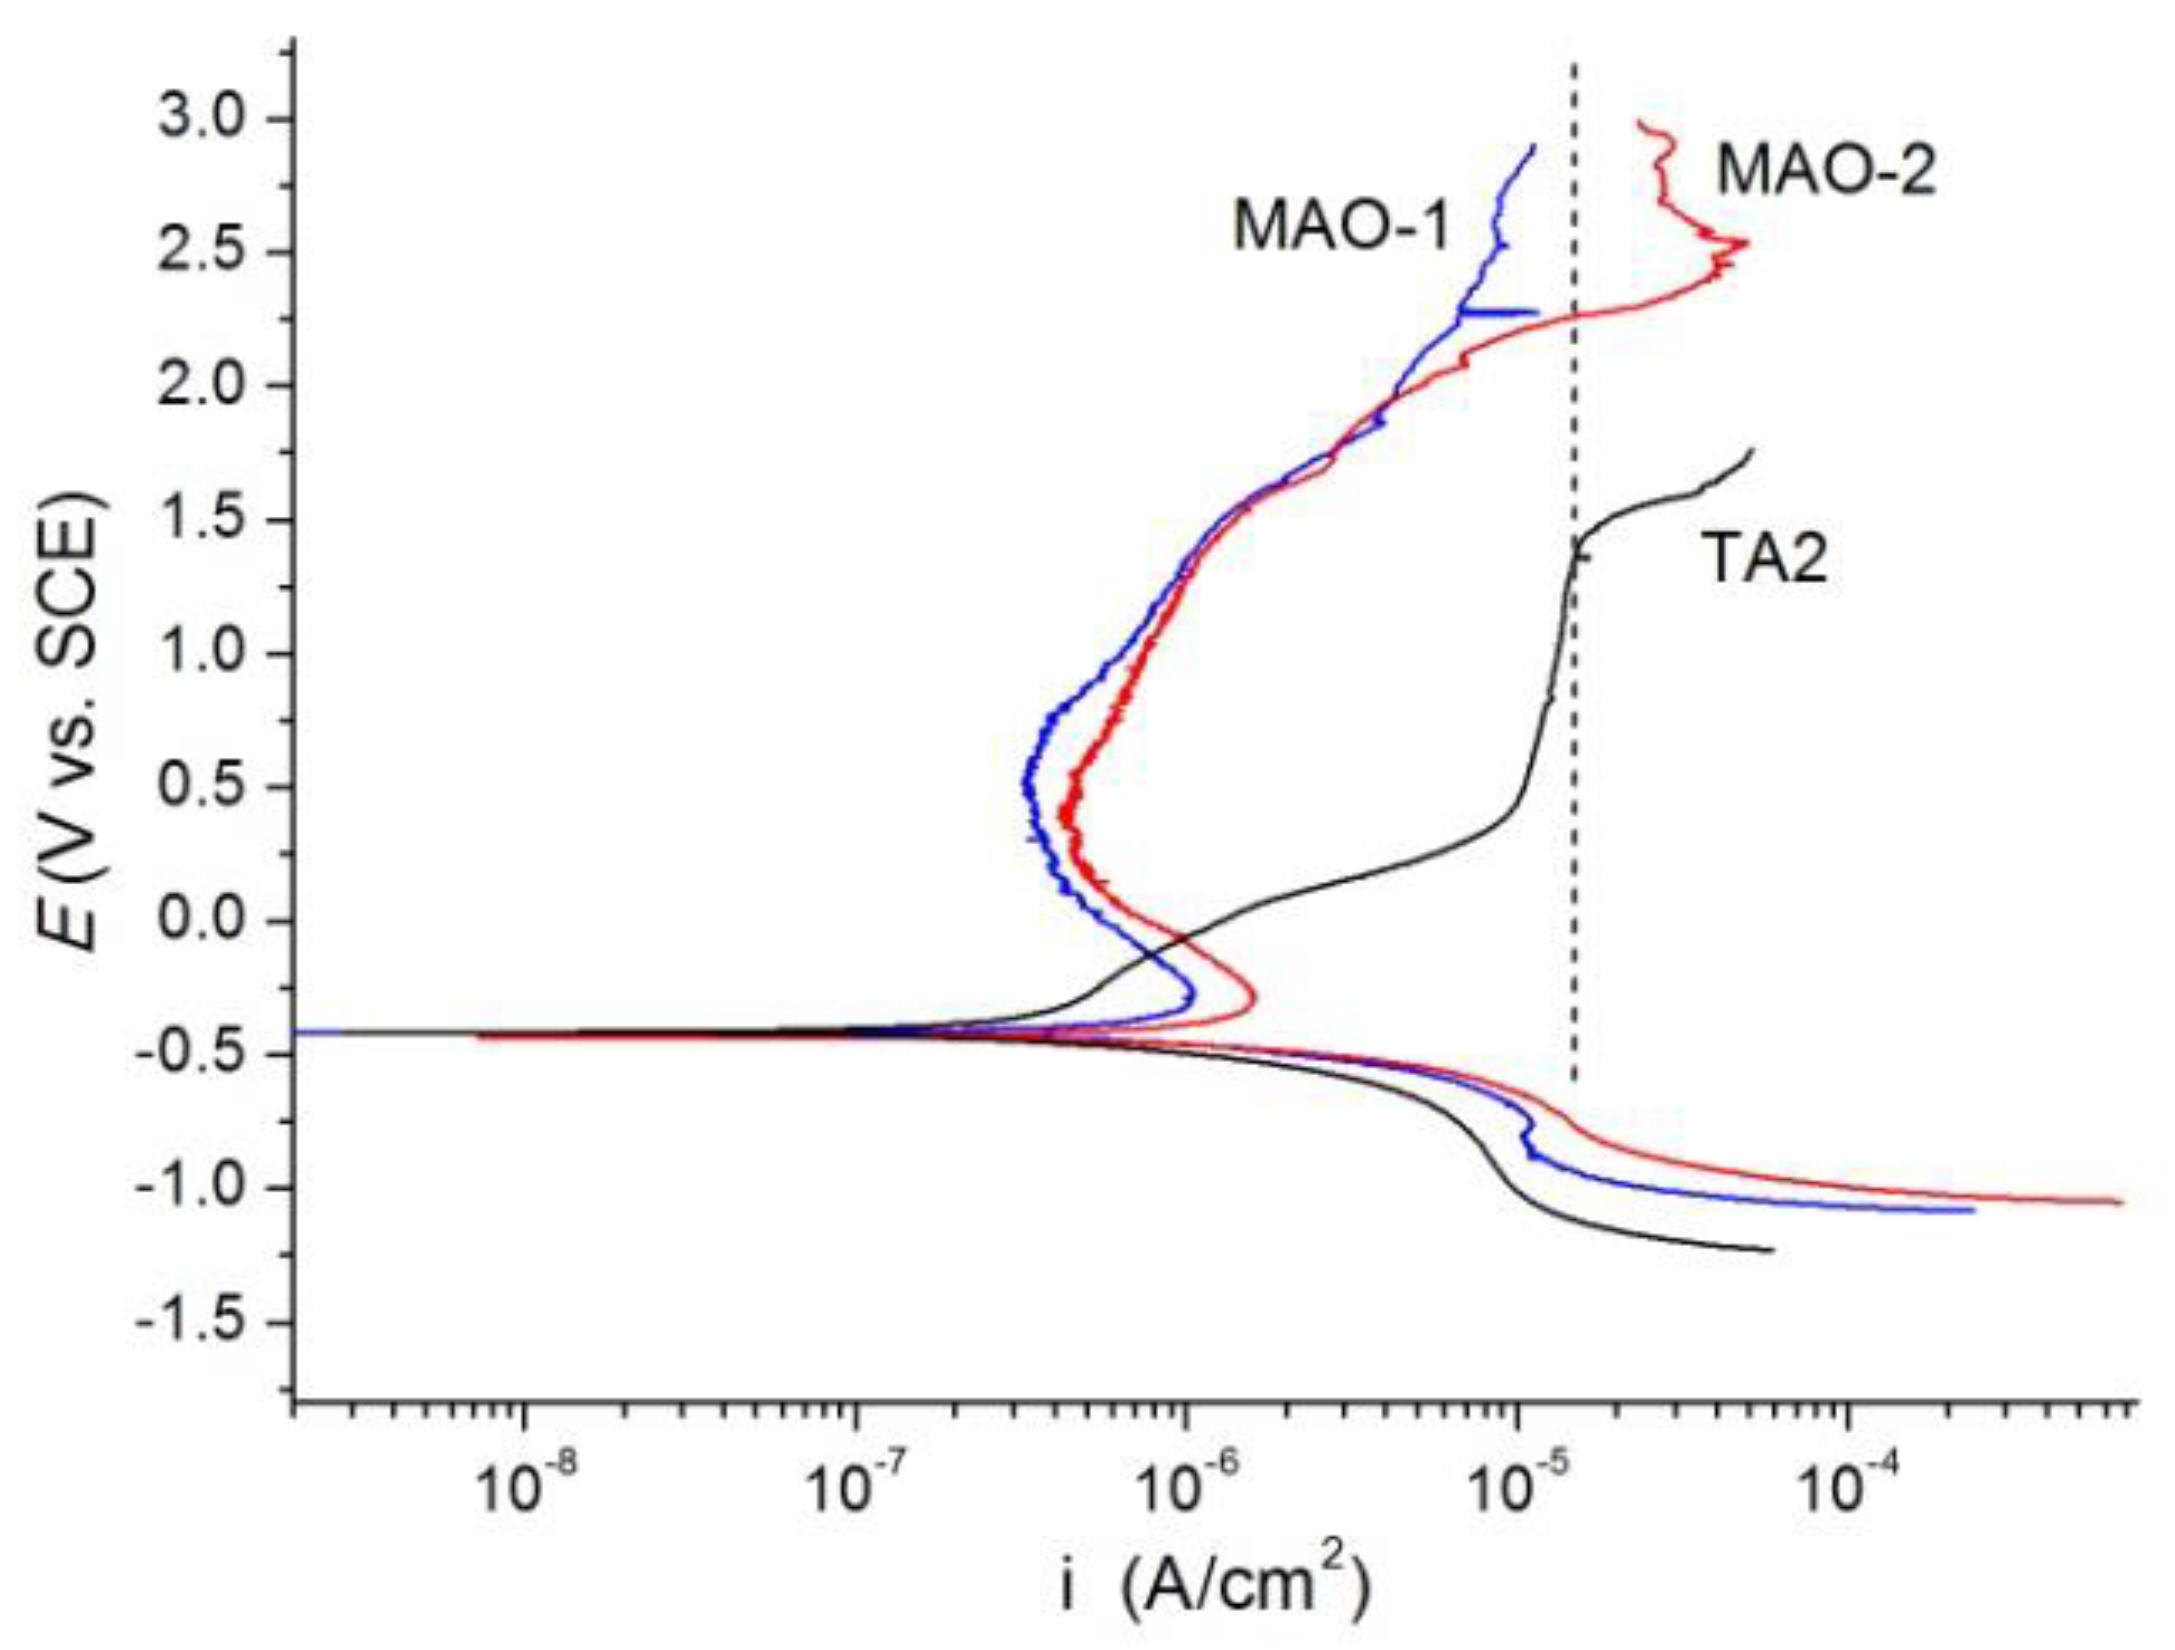
The potentiodynamic polarization curves of MAO-1, MAO-2, and bare TA2 specimens are shown in Figure 12. According to the polarization curves within the potential ranged from −0.8 to −0.45 V vs. SCE, the slope of the curve of MAO-2 is slightly smaller than that of MAO-1, and the slope of the curve of MAO-1 is slightly smaller than that of TA2. To be exact, the cathodic polarizability of MAO-2 is slightly smaller than that of MAO-1, and the cathodic polarizability of MAO-1 is slightly smaller than that of TA2. This may bring about the influence on the effect of galvanic cell composed of TA2 and other more negative metals (such as steel). For the anodic branches, it is seen that the bare TA2 electrode is activation control while the MAO electrodes are passivated. These indicate that the presence of MAO coating can enhance the passivation of TA2, leading a small corrosion current density. Moreover, it was also found that the passivation current density of MAO-1 specimens is smaller than that of MAO-2 specimens, indicating that the protective effect of MAO-1 coating is better. Some small fluctuations at the end of the anodic curves are found, which can be caused by the broken and the subsequent selfreparing of surface films due to high polarization potential. The presence of passivation is caused by the formation of TiO2 film. Even though the TiO2 film is not compact, its conductivity is not good. The passivation of Ti is the primary reason leading a high corrosion resistance. The protective effect of TiO2 film is good compared with the bare specimen. Therefore, MAO coating can significantly improve the corrosion resistance, but increase in thickness of MAO coating cannot cause further increase of corrosion resistance.
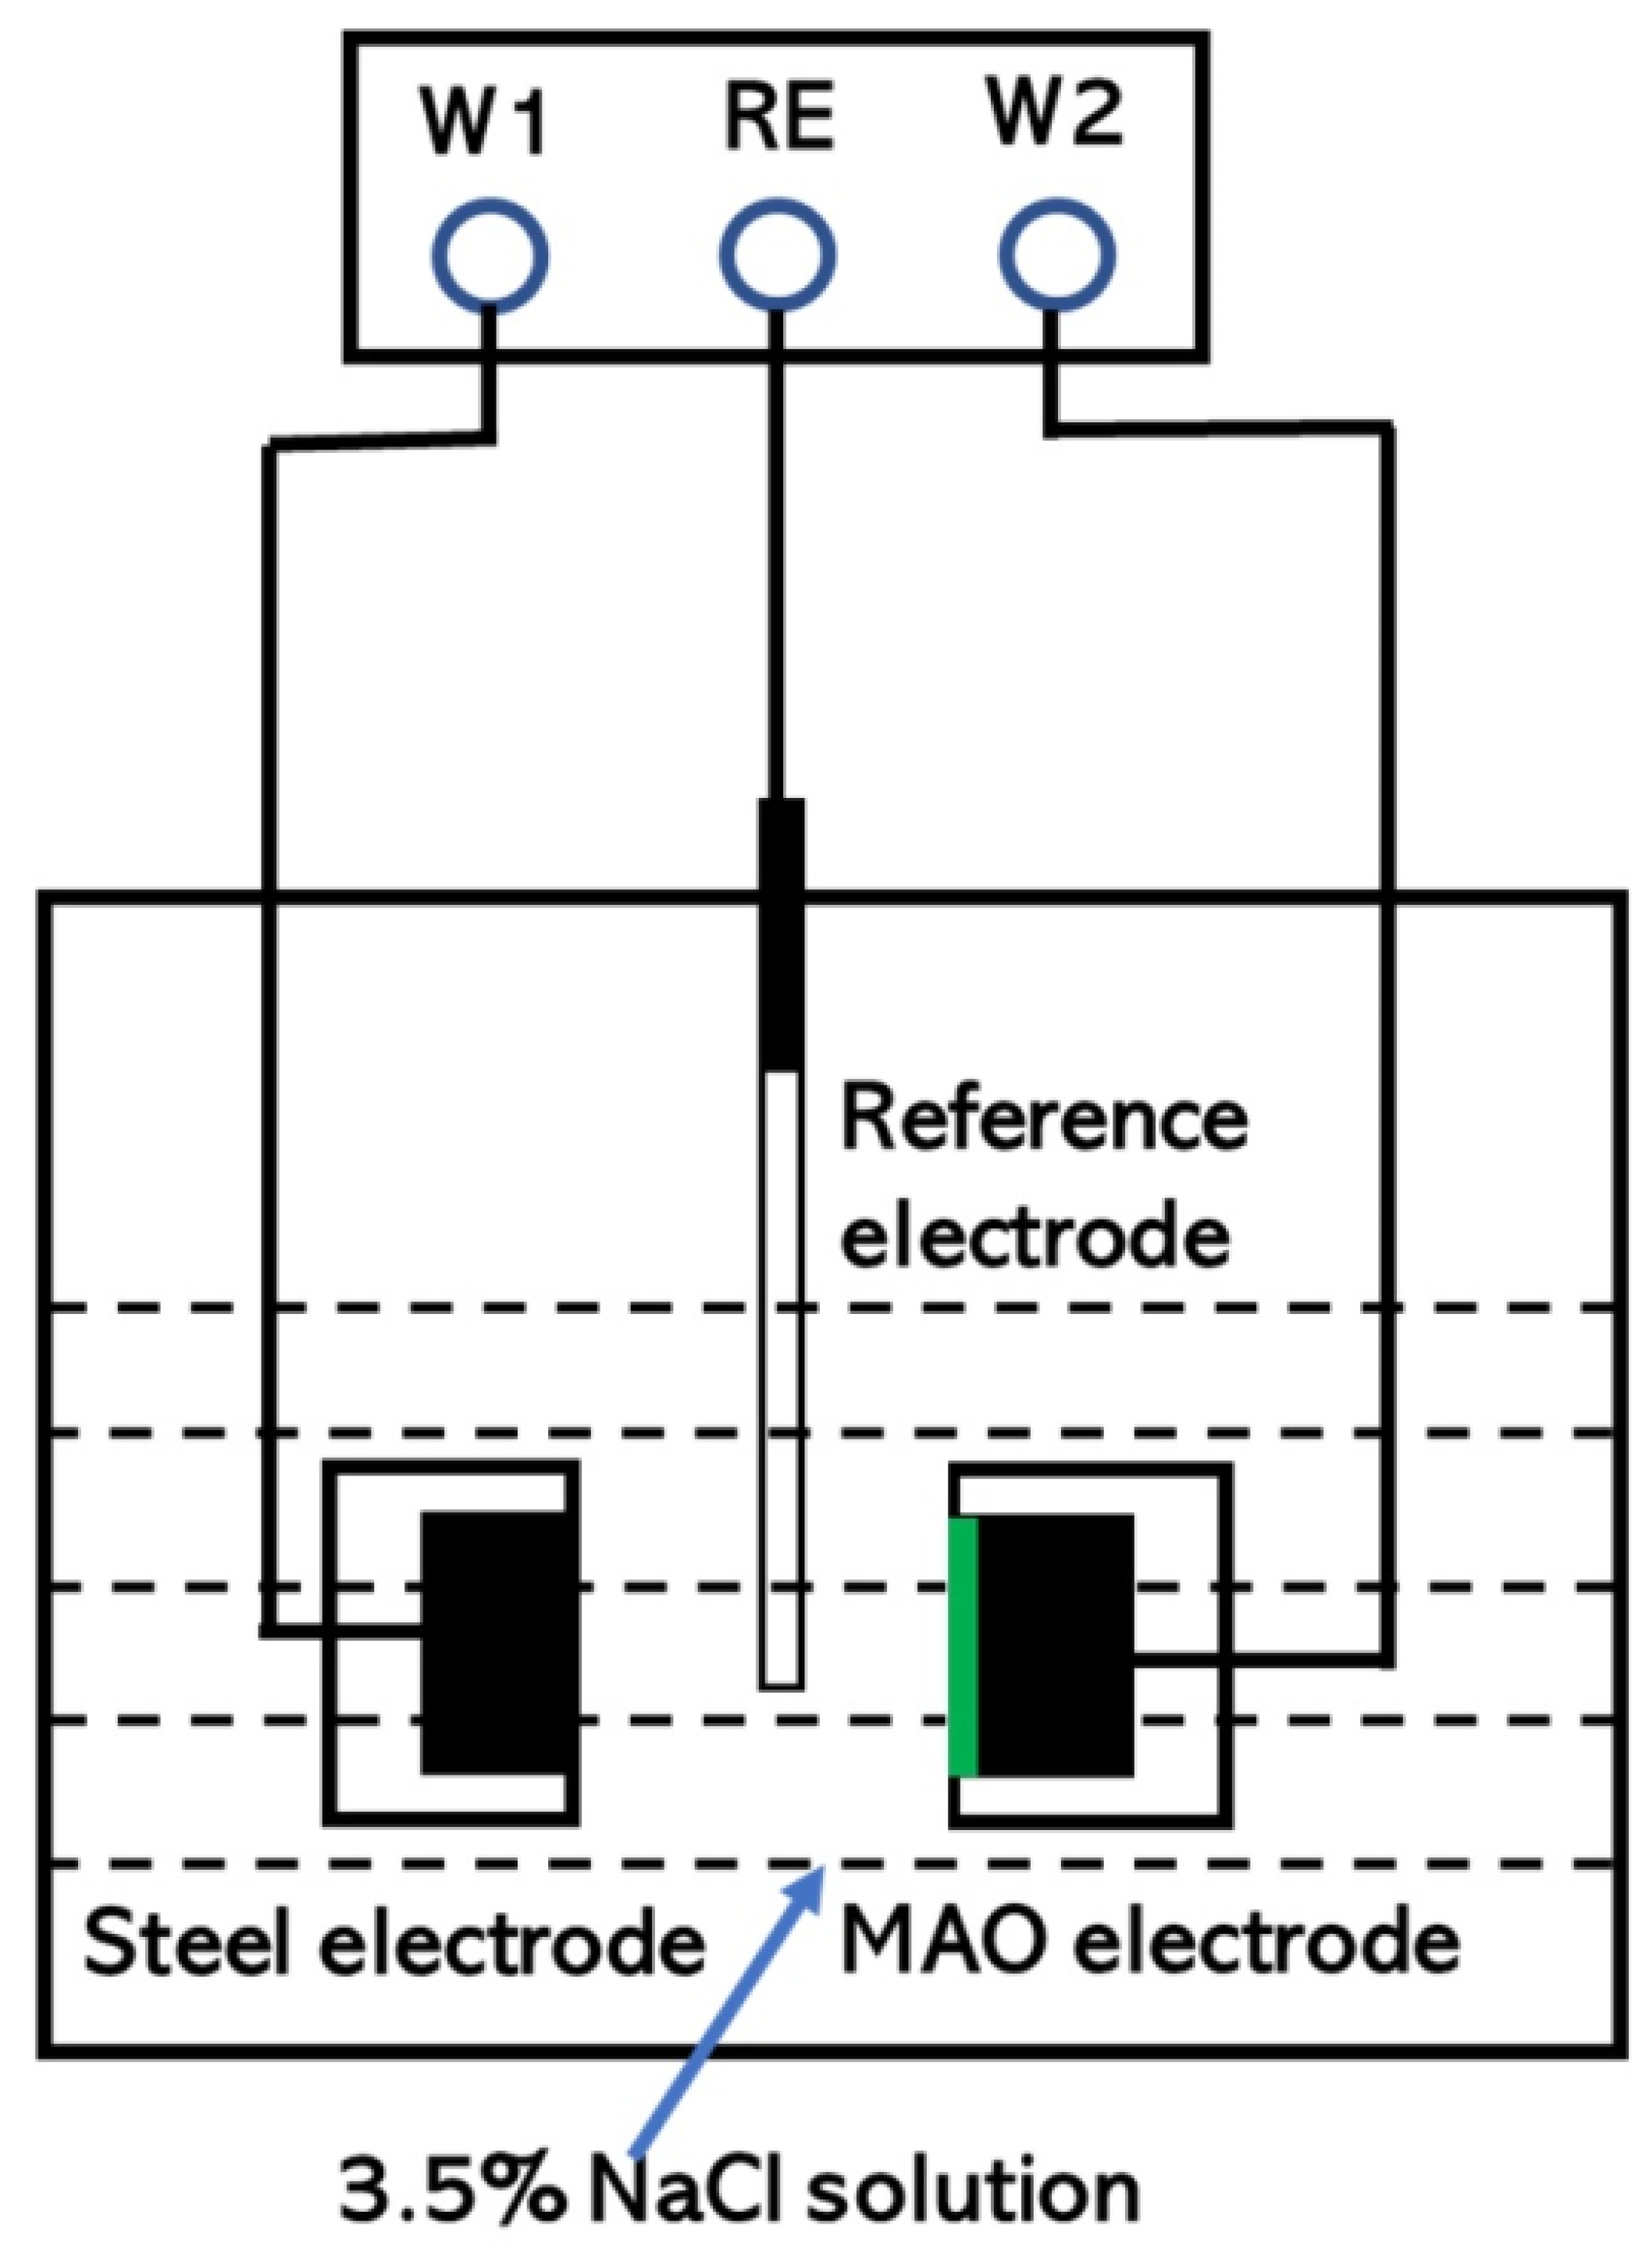
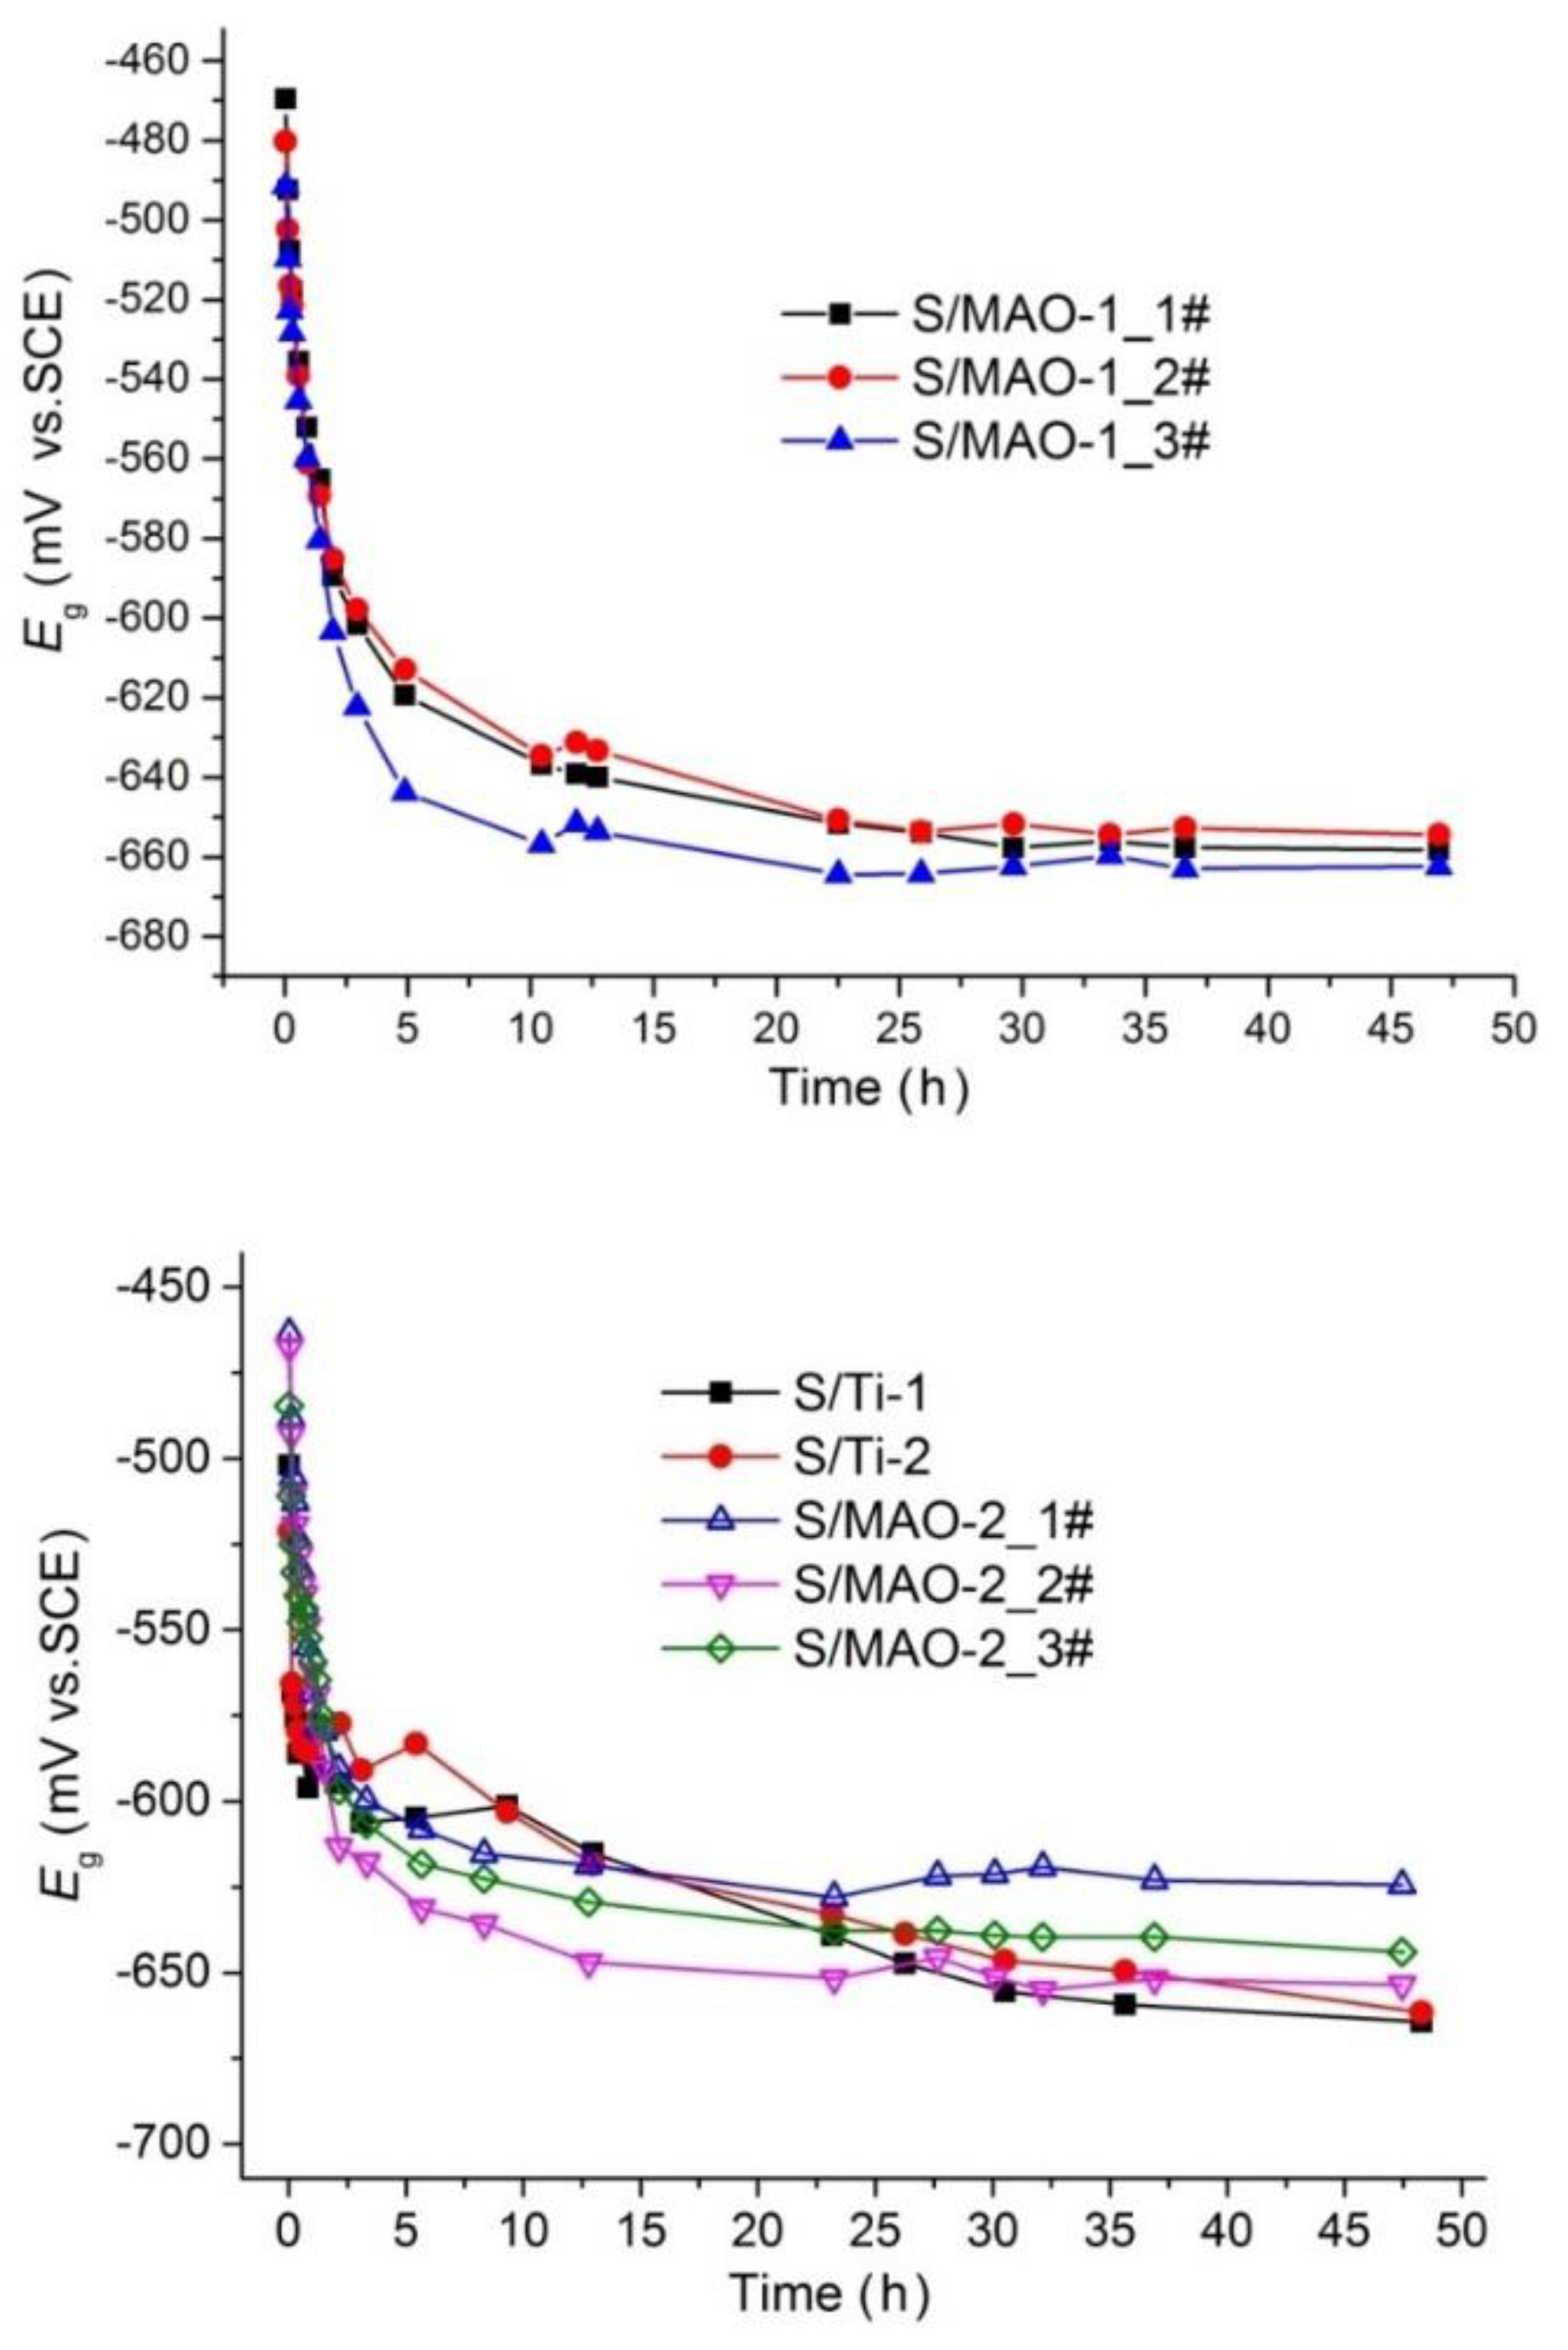
In order to investigate the effect of MAO treatment on galvanic corrosion, 10CrNiCu steel was used to construct the galvanic couples with bare TA2 and MAO specimens, and all the area ratios of two coupled specimens are 1:1. The galvanic potentials of 10CrNiCu/TA2, 10CrNiCu/MAO-1 and 10CrNiCu/MAO-2 couple in 3.5% NaCl solution after 48 h immersion at room temperature are shown in Figure 13, and the corresponding galvanic potential values stay at −663.0, −657.3, and −640.6 mV (vs. SCE), respectively. This shows that the MAO coatings enhance the cathode action of TA2 in the above galvanic cell. This is attributable to the porosity of MAO coating which increases the effective surface area and promotes the cathode reaction on TA2. At the beginning, the galvanic potentials of S/TA2 and S/MAO couples all decreased rapidly, and the galvanic potential changes little after around 5 h. After 30 h, the galvanic potential of S/TA2 became stable, and its galvanic potential at 48 h is around −662 mV vs. SCE. After around 12 h, the galvanic potential of S/MAO became stable, and galvanic potential of S/MAO-1 and S/MAO-2 couples at 48 h is around −655 and −640 mV vs. SCE, respectively. The noticeable difference of galvanic potential among parallel S/MAO-2 couples existed, which should be related to the MAO-2 coating. By comparison of the changes of galvanic potential, the galvanic potential of S/MAO couples can become more positive than that of S/TA2 couple with the increase of test time.
S/MAO-1, S/MAO-2, and S/TA2 galvanic couple (GC) were immersed in 3.5%NaCl solution. The curves of galvanic potential (Eg) and galvanic current (Ig) of S/MAO-1, S/MAO-2, and S/TA2 couple varied with test time were obtained and are shown in Figure 14; all surface areas of S samples are 4 cm2. At the beginning, the galvanic current of S/MAO couple is significantly less than that of S/TA2 couple, but the galvanic currents of S/MAO couples increase obviously with the increase of test time. The average galvanic current of S/MAO-2 couple at 48 h has exceeded that of S/TA2 couple, and the galvanic current of S/MAO-1 couple samples at 48 h are higher than those of S/TA2 couples.
It can be seen from the above results that the corrosion can occur even if after coupled of MAO specimens and steel. The galvanic effect of MAO specimens and steel is weak due to the lower conductivity of TiO2. However, the surface TiO2 films are not compact, leading to a big real surface area. The surface area is an important factor influencing the galvanic corrosion. The increase of cathodic area can promote the formation of a galvanic cell with a big cathode and a small anode [28]. Then, the galvanic effect will be enhanced, leading a higher galvanic current density for the coupled specimens of MAO and steel. This illuminates that the only use of MAO coating cannot inhibit the galvanic corrosion of Ti and the other metals. In addition, TiO2 films promote the passivation of Ti, so that the stability of Ti is improved. This can also be a reason causing the increase of galvanic corrosion.
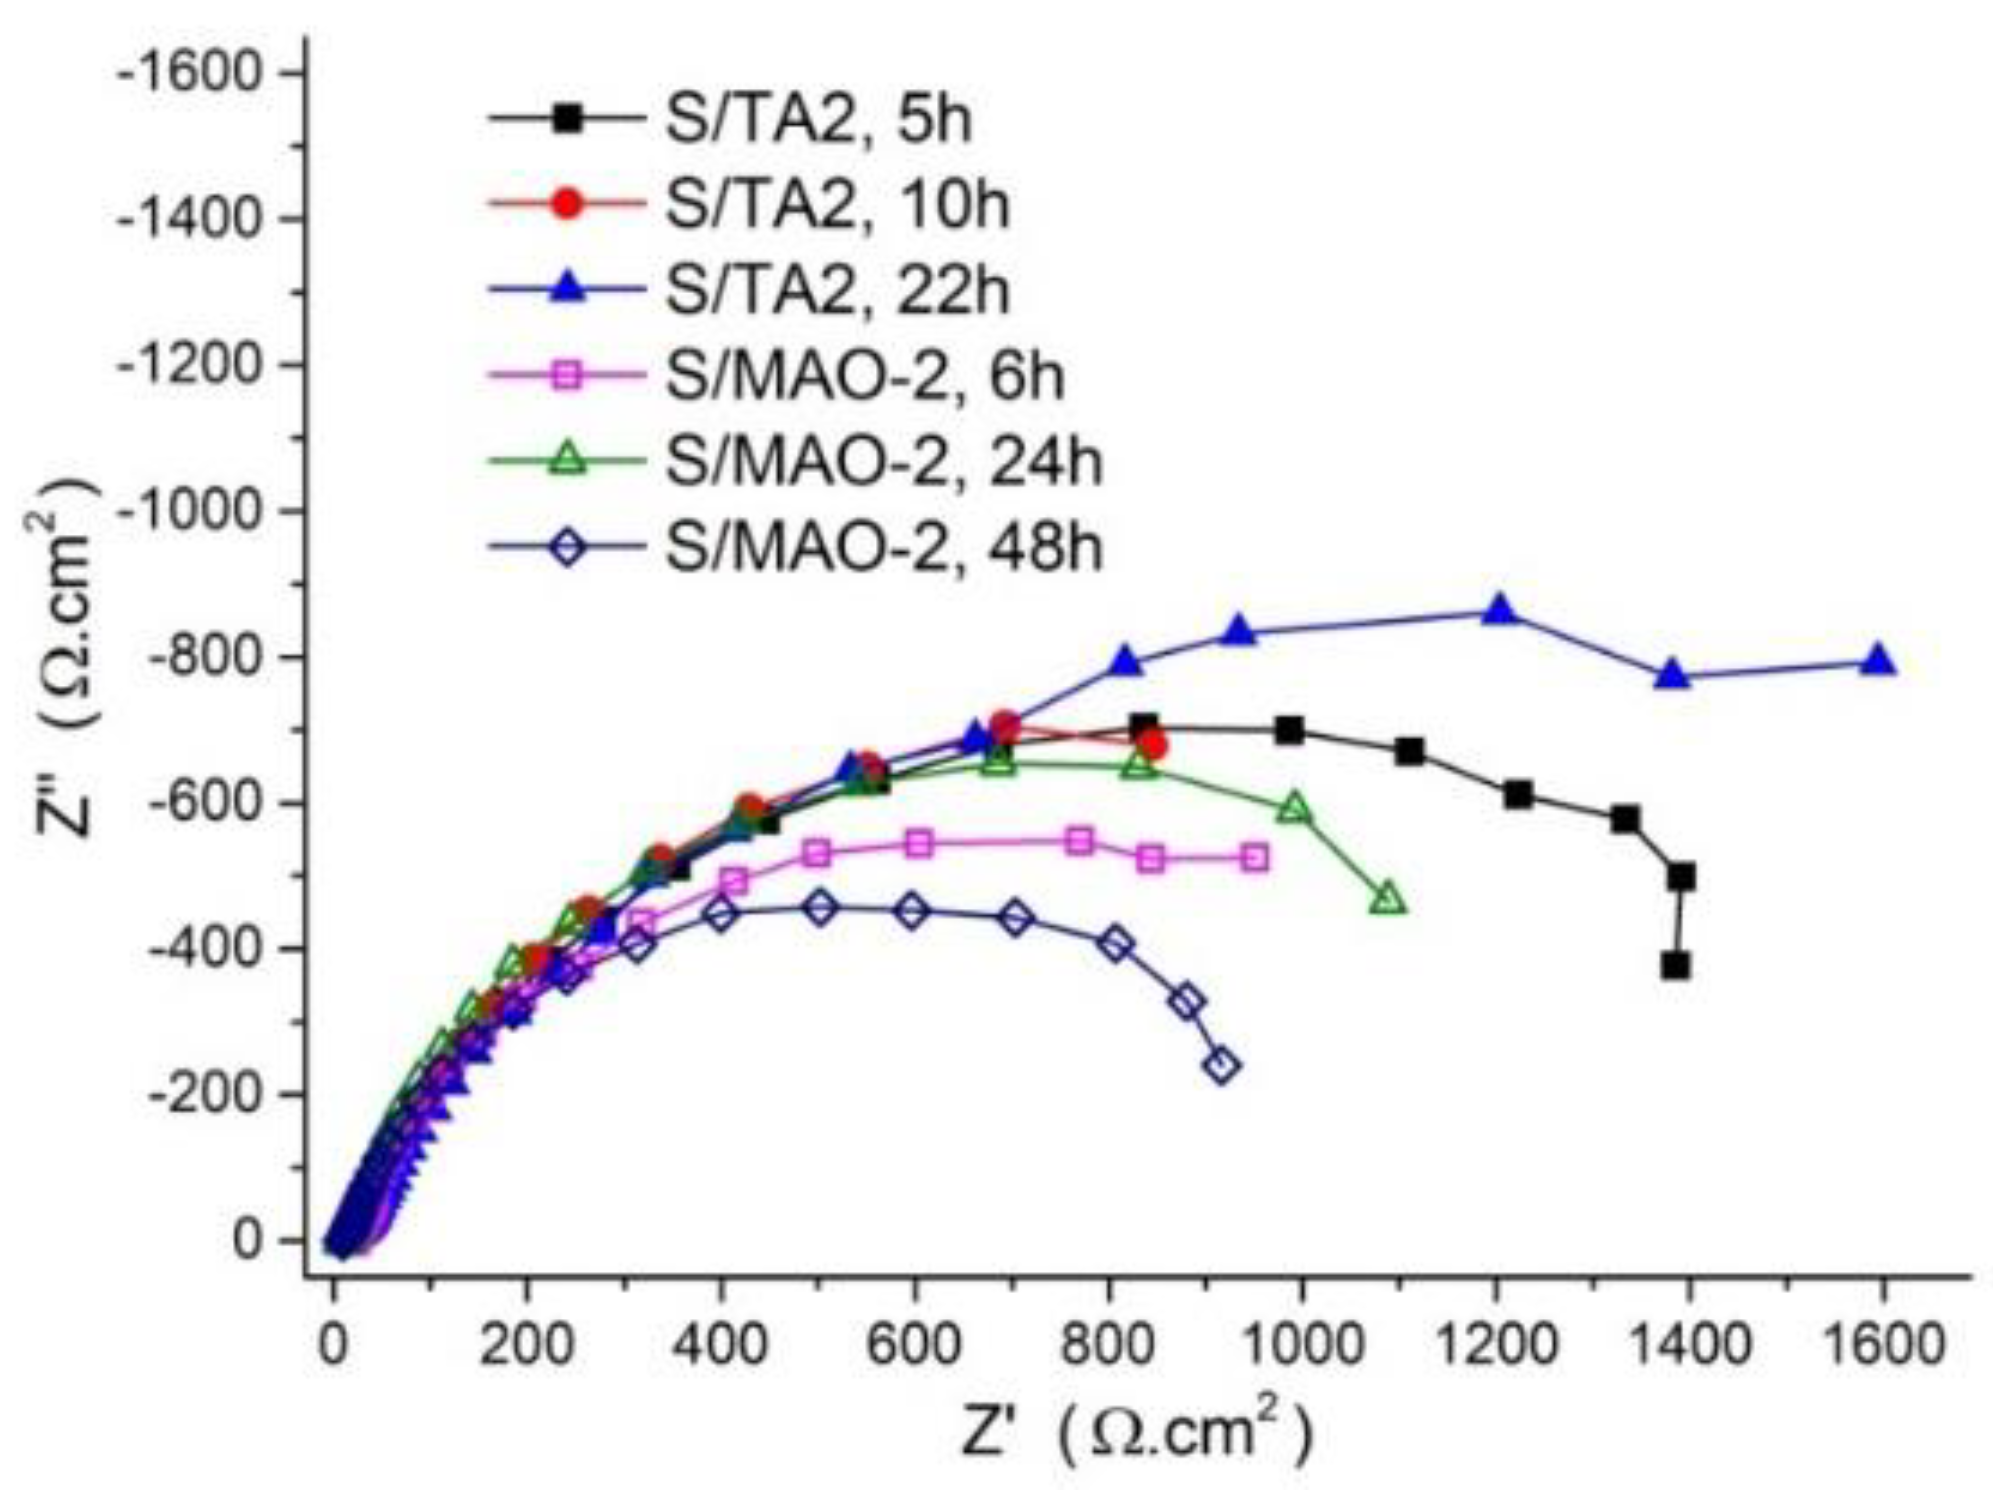
The EIS spectra of S/TA2 and S/MAO-2 couple in 3.5% NaCl solution were measured, and the corresponding Nyquist plots of EIS are shown in Figure 15. The equivalent circuit model Rs(QgRg)(Q1R1) was used to simulate data with ZSimpWin software. (QgRg) represents the impedance of galvanic couple, and Rg represents the polarization resistance of couple. (Q1R1) represents the impedance of counter electrode. The Rg of S/TA2 couple at 5, 12, and 22 h are 1715, 1708, and 2101 Ω·cm2, respectively. The Rg of S/MAO-2 couple at 6, 24, and 48 h are 1327, 1418, and 1014 Ω·cm2, respectively. The corrosion resistances of TA2 and its treated with MAO are excellence; therefore, the polarization resistance Rg of couple can be regarded as the polarization resistance of steel sample in the test couples. The results of EIS show that the polarization resistance of S in S/MAO-2 is obviously less than that of S in S/TA2; that is to say, the corrosion rate of S in S/MAO-2 is obviously larger than that of S in S/TA2. The MAO treatment of TA2 promotes galvanic corrosion between steel and TA2, which corresponds to the measure results of galvanic current densities (Figure 14).
This works preparing two coatings by MAO and can effectively improve the corrosion resistance of Ti due to the passivation. However, it cannot impede the galvanic corrosion of coated Ti and the other metals. Therefore, this study indicates that the organic semiconductor coating cannot be applied to decrease the galvanic effect of Ti and the other metals.

4. Conclusions

Two MAO coatings with different thickness on TA2 were prepared using micro arc oxidation with 3 and 10 min, respectively. The thicknesses of the obtained MAO coatings are 10 and 25 μm, respectively. The increase of oxidation time can improve the thickness of MAO coating, but the porosity of coating is improved. The composition of prepared coatings is composed of rutile-TiO2, anatase-TiO2 and amorphous silicate. From the results of electrochemical measurements, it is seen that the higher the porosity of MAO coating, the more negative the OCP values in 3.5% NaCl solution. OCP can be used to evaluate the porosity of MAO coating, and the more positive OCP indicates the coating with lower porosity. The MAO can significantly improve the corrosion resistance of TA2, but the thickness increase of MAO coating cannot lead to the improvement of the corrosion resistance. In addition, the MAO treatment may enhance the cathode action of TA2 when the galvanic cell is composed of TA2 and other more negative metal, thus promoting the corrosion of negative metal.

Author Contributions

Data curation, Y.H.; Writing–original draf, Y.H. and H.L.; funding acquisition, H.L.; Formal analysis, Z.W.; Investigation, Y.H., J.A., and S.B.; Writing-review and editing, H.L. All authors have read and agreed to the published version of the manuscript.

Funding

This research was funded by the Fundamental Research Funds for the Central Universities (No. 19lgzd18), National Natural Science Foundation of China (No. 51901253), Guangdong Basic and Applied Basic Research Foundation (No. 2019A1515011135).

Institutional Review Board Statement

Not applicable.

Informed Consent Statement

Not applicable.

Data Availability Statement

The data presented in this study are available on request from the corresponding author. The data are not publicly available as the data also forms part of an ongoing study.

Conflicts of Interest

The authors declare no conflict of interest.

References

  1. Geetha, M.; Singh, A.K.; Asokamani, R.; Gogia, A.K. Ti based biomaterials, the ultimate choice for orthopaedic implants—A review. Prog. Mater Sci. 2009, 54, 397–425. [Google Scholar] [CrossRef]
  2. Niinomi, M. Biologically and mechanically biocompatible titanium alloys. Mater. Trans. 2008, 49, 2170–2178. [Google Scholar] [CrossRef] [Green Version]
  3. Anandkumar, B.; George, R.P.; Kamaraj, K.; Parvathavarthini, N.; Mudali, U.K. Electrochemical studies on the passive film integrity of titanium under seawater biofilms. Trans. Indian Inst. Met. 2017, 70, 1075–1081. [Google Scholar] [CrossRef]
  4. Parrott, R. Potential hazards from undetected corrosion in complex equipment: A case study of the destructive separation of an offshore heat exchanger. Eng. Fail. Anal. 2014, 44, 424–440. [Google Scholar]
  5. Hu, S.; Liu, R.; Liu, L.; Cui, Y.; Oguzie, E.E.; Wang, F. Effect of hydrostatic pressure on the galvanic corrosion of 90/10 Cu-Ni alloy coupled to Ti6Al4V alloy. Corros. Sci. 2020, 163, 108242. [Google Scholar] [CrossRef]
  6. Hur, S.Y.; Jeon, J.M.; Kim, K.T.; Kim, Y.S. Control of galvanic corrosion between A516Gr.55 steel and AA7075T depending on NaCl concentration and solution temperature. Corros. Sci. Technol. 2020, 19, 281–287. [Google Scholar]
  7. Xavier, J.R. Galvanic corrosion of copper/titanium in aircraft structures using a cyclic wet/dry corrosion test in marine environment by EIS and SECM techniques. SN Appl. Sci. 2020, 2, 1–10. [Google Scholar] [CrossRef]
  8. Bardal, E. Corrosion and protection. Surf. Coat. Technol. 2004, 18, 385–390. [Google Scholar]
  9. Fazel, M.; Salimijazi, H.R.; Golozar, M.A. A comparison of corrosion, tribocorrosion and electrochemical impedance properties of pure Ti and Ti6Al4V alloy treated by micro-arc oxidation process. Appl. Surf. Sci. 2015, 324, 751–756. [Google Scholar] [CrossRef]
  10. Baltatu, M.S.; Vizureanu, P.; Sandu, A.V.; Munteanu, C.; Istrate, B. Microstructural analysis and tribological behavior of Ti-based alloys with a ceramic layer using the thermal spray method. Coatings 2020, 10, 1216. [Google Scholar] [CrossRef]
  11. Yang, L.; Yang, X.; Zhang, T.; Sun, R. Optimization of microstructure and properties of composite coatings by laser cladding on titanium alloy. Ceram. Int. 2021, 47, 2230–2243. [Google Scholar]
  12. Gnedenkov, S.V.; Vovna, V.I.; Gordienko, P.S.; Sinebryukhov, S.L.; Cherednichenko, A.I.; Shchukarev, A.V. Chemical composition of antifriction micro-arc oxide coatings on titanium alloy BT16. Prot. Met. 2001, 37, 168–172. [Google Scholar] [CrossRef]
  13. Wang, Y.; Yu, H.; Chen, C.; Zhao, Z. Review of the biocompatibility of micro-arc oxidation coated titanium alloys. Mater. Des. 2015, 85, 640–652. [Google Scholar] [CrossRef]
  14. Ping, W.; Ting, W.; Hao, P.; Yang, G.X. Effect of NaAlO2 concentrations on the properties of micro-arc oxidation coatings on pure titanium. Mater. Lett 2016, 170, 171–174. [Google Scholar] [CrossRef]
  15. Teng, F.Y.; Tai, I.C.; Wang, M.W.; Wang, Y.J.; Hung, C.C.; Tseng, C.C. The structures, electrochemical and cell performance of titania films formed on titanium by micro-arc oxidation. J. Taiwan Inst. Chem. Eng. 2014, 45, 1331–1337. [Google Scholar] [CrossRef]
  16. Babaei, M.; Dehghanian, C.; Taheri, P.; Babaei, M. Effect of duty cycle and electrolyte additive on photocatalytic performance of TiO2-ZrO2 composite layers prepared on CP Ti by micro arc oxidation method. Surf. Coat. Technol. 2016, 307, 554–564. [Google Scholar]
  17. Shokouhfar, M.; Allahkaram, S.R. Effect of incorporation of nanoparticles with different composition on wear and corrosion behavior of ceramic coatings developed on pure titanium by micro arc oxidation. Surf. Coat. Technol. 2017, 309, 767–778. [Google Scholar] [CrossRef]
  18. Shokouhfar, M.; Dehghanian, C.; Montazeri, M.; Baradaran, A. Preparation of ceramic coating on Ti substrate by plasma electrolytic oxidation in different electrolytes and evaluation of its corrosion resistance: Part II. Appl. Surf. Sci. 2012, 258, 2416–2423. [Google Scholar] [CrossRef]
  19. Shokouhfar, M.; Dehghanian, C.; Baradaran, A. Preparation of ceramic coating on Ti substrate by plasma electrolytic oxidation in different electrolytes and evaluation of its corrosion resistance. Appl. Surf. Sci. 2011, 257, 2617–2624. [Google Scholar] [CrossRef]
  20. Khanmohammadi, H.; Allahkaram, S.R.; Munoz, A.I.; Towhidi, N. The influence of current density and frequency on the microstructure and corrosion behavior of plasma electrolytic oxidation coatings on Ti6Al4V. J. Mater. Eng. Perform. 2017, 26, 931–944. [Google Scholar] [CrossRef]
  21. Durdu, S.; Usta, M. Characterization and mechanical properties of coatings on magnesium by micro arc oxidation. Appl. Surf. Sci. 2012, 261, 774–782. [Google Scholar] [CrossRef]
  22. Babaei, M.; Dehghanian, C.; Vanaki, M. Effect of additive on electrochemical corrosion properties of plasma electrolytic oxidation coatings formed on CP Ti under different processing frequency. Appl. Surf. Sci. 2015, 357, 712–720. [Google Scholar] [CrossRef]
  23. Cheng, Y.L.; Cao, J.H.; Mao, M.K.; Peng, Z.M.; Skeldon, P.; Thompson, G.E. High growth rate, wear resistant coatings on an Al–Cu–Li alloy by plasma electrolytic oxidation in concentrated aluminate electrolytes. Surf. Coat. Technol. 2015, 269, 74–82. [Google Scholar] [CrossRef]
  24. Narayanan, T.S.; Park, I.S.; Lee, M.H. Strategies to improve the corrosion resistance of microarc oxidation (MAO) coated magnesium alloys for degradable implants: Prospects and challenges. Prog. Mater Sci. 2014, 60, 1–71. [Google Scholar] [CrossRef]
  25. Li, Q.; Yang, W.; Liu, C.; Wang, D.; Liang, J. Correlations between the growth mechanism and properties of micro-arc oxidation coatings on titanium alloy: Effects of electrolytes. Surf. Coat. Technol. 2017, 316, 162–170. [Google Scholar] [CrossRef]
  26. Hung, J.C.; Ku, C.Y.; Ger, M.D.; Fen, Z.W. Fabrication of an electrode insulation layer for electrochemical machining by using hot dip aluminizing and micro-arc oxidation method. Procedia Cirp 2016, 42, 390–395. [Google Scholar]
  27. Dziaduszewska, M.; Shimabukuro, M.; Seramak, T.; Zielinski, A.; Hanawa, T. Effects of micro-arc oxidation process parameters on characteristics of calcium-phosphate containing oxide layers on the selective laser melted Ti13Zr13Nb alloy. Coatings 2020, 10, 745. [Google Scholar] [CrossRef]
  28. Zhang, G.A.; Yu, N.; Yang, L.Y.; Guo, X.P. Galvanic corrosion behavior of deposit-covered and uncovered carbon steel. Corros. Sci. 2014, 86, 202–212. [Google Scholar] [CrossRef]
Figure 1. Schematic diagram of galvanic corrosion measurement between micro-arc oxidation (MAO) electrodes and steel electrode.
Coatings 11 00230 g001
Figure 2. Surface 2D and 3D morphologies of prepared coating by micro-arc oxidation with different time (a,b) MAO-1; (c,d) MAO-2 coating.
Coatings 11 00230 g002
Figure 3. SEM images of prepared coating by micro-arc oxidation with different time: (a,b) MAO-1 and (c,d) MAO-2 coating.
Coatings 11 00230 g003
Figure 4. Surface SEM images of prepared coating by micro-arc oxidation with different time after their surface loose layers were ground off: (a,b) MAO-1 and (c,d) MAO-2 coating.
Coatings 11 00230 g004
Figure 5. Cross-section SEM images of the prepared coating by micro-arc oxidation with different time: (a) MAO-1 coating, (b) MAO-2 coating, and (c) MAO-2 coating after its surface thin layer was ground off.
Coatings 11 00230 g005
Figure 6. EDS elemental mapping analyses of cross-section of prepared coating by micro-arc oxidation with different time: (a) MAO-1 and (b) MAO-2 coating.
Coatings 11 00230 g006
Figure 7. The XRD patterns of the MAO coatings and the MAO coatings after 9 days immersion in 3.5% NaCl solution: (a) MAO-1 and (b) MAO-2 coating.
Coatings 11 00230 g007
Figure 8. The changes of OCP with time for different coating specimen immersion in 3.5% NaCl solution: (a) MAO-1, (b) MAO-2, and (c) bare TA2.
Coatings 11 00230 g008aCoatings 11 00230 g008b
Figure 9. Nyquist plots of EIS of MAO-1, MAO-2 and bare TA2 specimens measured after immersion in 3.5% NaCl solution for 12 and 36 h, respectively.
Coatings 11 00230 g009aCoatings 11 00230 g009b
Figure 10. The diagram of equivalent circuit model Rs(Qp(Rp(Qb(RbQd)))) [17].
Coatings 11 00230 g010
Figure 11. Fitting Nyquist and Bode graph of EIS spectra of (a1,a2) MAO-1-2# and (b1,b2) untreated TA2 after 36 h immersion in 3.5%NaCl solution. Equivalent circuit model Rs(Qp(Rp(Qb(RbQd)))) and Rs(Qb(QdRb) were used to fit the spectrum of MAO-1-2# and bare TA2 specimens, respectively.
Coatings 11 00230 g011
Figure 12. Potentiodynamic polarization curves of MAO-1, MAO-2, and bare TA2 specimens after 9 days immersion in 3.5% NaCl solution.
Coatings 11 00230 g012
Figure 13. Change curves of galvanic potential of S/MAO-1, S/MAO-2, and S/TA2 couples with time in 3.5% NaCl solution.
Coatings 11 00230 g013
Figure 14. Change curves of galvanic current of S/MAO-1, S/MAO-2, and S/TA2 couples with time in 3.5% NaCl solution.
Coatings 11 00230 g014
Figure 15. Nyquist diagrams of EIS for S/MAO-2 coupled together with S/TA2 coupled with time in 3.5% NaCl solution.
Coatings 11 00230 g015
Table 1. The Fitting resistance values of EIS data of MAO specimens measured after 12 and 36 h immersion in 3.5% NaCl solution, respectively.
SampleMAO-1-1#MAO-1-2#MAO-1-3#MAO-2-1#MAO-2-2#MAO-2-3#
Rp (Ω·cm2)12 h254.8235.6313.469.341.4190.4
Rb (Ω·cm2)12 h172818422048309.4182.6502.6
Rp (Ω·cm2)36 h156.5170.3266.370.336.5149.1
Rb (Ω·cm2)36 h169531932463213.8102.9479.9
Publisher’s Note: MDPI stays neutral with regard to jurisdictional claims in published maps and institutional affiliations.

