Article

Deposition of Zinc Oxide Coatings on Wood Surfaces Using the Solution Precursor Plasma Spraying Process

Laboratory of Laser and Plasma Technologies, University of Applied Sciences and Arts, Von-Ossietzky-Str. 99, 37085 Göttingen, Germany
*
Author to whom correspondence should be addressed.
Coatings 2021, 11(2), 183; https://doi.org/10.3390/coatings11020183
Submission received: 15 January 2021 / Revised: 28 January 2021 / Accepted: 1 February 2021 / Published: 4 February 2021

Abstract

:
In the present work, the solution precursor plasma spray (SPPS) process was used to deposit zinc oxide (ZnO) coatings on wood surfaces using zinc nitrate solution as precursor to improve the hydrophobicity and the color stability of European beech wood under exposure to ultraviolet (UV) light. The surface morphology and topography of the wood samples and the coatings were characterized by scanning electron microscopy (SEM) and atomic force microscopy (AFM). The formation of ZnO was detected with the help of X-ray photoelectron spectroscopy (XPS) and by Fourier transform infrared (FTIR) spectroscopy. The FTIR spectra of the coated samples showed the typical Zn–O band at 445 cm−1. According to the XPS analysis, the coatings consist of two different Zn-containing species: ZnO and Zn(OH)2. Variation of the deposition parameters showed that the most significant parameters affecting the microstructure of the coating were the solution concentration, the deposition scan speed, and carrier gas flow rate. The wettability behaviors of the coated wood were evaluated by measuring the water contact angle (WCA). The coatings that completely covered the wood substrates showed hydrophobic behaviors. UV-protection of wood surfaces after an artificial UV light irradiation was evaluated by color measurements and FTIR spectroscopy. The ZnO-coated wood surfaces were more resistant to color change during UV radiation exposure. The total color change decreased up to 60%. Additionally, the FTIR spectra showed that the wood surfaces coated with ZnO had more stability. The carbonyl groups formation and C=C-bonds consumption were significantly lower.

1. Introduction

Wood is an excellent and widely used sustainable building material for many products in the building industry and in furniture construction [1]. However, when exposed to outdoor conditions, wood surfaces are prone to degradation under solar ultraviolet (UV) radiation, leading to an alteration and discoloration of the surfaces, which in turn affects the aesthetic appearance [2,3]. To prevent this kind of aesthetic degradation resulting from UV irradiation in outdoor applications, the deposition of functional coatings for wooden surfaces might be an efficient solution.
Zinc oxide-based coatings are a suitable candidate for the UV-protection of wood in exterior applications because zinc oxide has excellent ultraviolet absorption due to its band gap of 3.4 eV, which corresponds to 360 nm. Moreover, it is a well-known cost-effective material that is easy to synthesize, chemically inert, nontoxic, and environmentally friendly [4,5]. Several techniques are used to fabricate the ZnO thin films on wood, such as the sol gel method [6], the chemical bath deposition method [7], ultrasonication [8,9], microwave-assisted hydrothermal [10,11], and plasma-enhanced chemical vapor deposition of thin barrier films on the wood surface [12]. Recently, functional protective coatings were deposited on wood surfaces using atmospheric pressure plasma technology [13,14]. In the past twenty years, various plasma spray processes have been developed. Among them, the solution precursor plasma spraying (SPPS) process is applied in order to generate finely structured coatings of metal oxides with sub-microstructured and nanostructured features [15,16]. These coatings are formed by injecting smaller droplets (sprayed or atomized) of solution precursors into the plasma jet. Many types of liquid precursors can be used as the starting materials, such as solutions of metal precursors, which are mostly prepared by using different metallic salts, e.g., nitrates and acetates, with the addition of a solvent such as water, ethanol, or isopropanol [15,16].
In the case of a ZnO coating via the SPPS deposition method, several works [17,18,19,20,21,22,23] have reported the use of different Zn-based compounds as precursors, among which the most widely used compounds are zinc nitrate (Zn(NO3)2·6H2O), zinc chloride (ZnCl2), zinc acetate (Zn(OAc)2·2H2O), and zinc acetylacetonate (Zn(C5H7O2)2·xH2O). However, on the basis of current knowledge, no complete investigation has been reported for ZnO thin films deposited on wood surfaces by atmospheric pressure plasma jet (APPJ) via the SPPS method.
In the present paper, zinc oxide coatings were deposited on wood and glass surfaces via the SPPS method using aqueous solutions of zinc nitrate hexahydrate salt, and the effect of various deposition parameters on the microstructures of the obtained coatings and their chemical compositions was investigated. In addition, uncoated and coated wood surfaces were irradiated with UV light to find out how effective the UV protection of the coatings is and what chemical changes occur on the wooden surface.

2. Materials and Methods

2.1. Materials

Samples of defect-free European beech (Fagus sylvatica L.) wood in the size of 76 mm × 26 mm × 4 mm (longitudinal × radial × tangential) were cut from the same board and stored before coating for one week at 20 °C and 65% relative humidity. In addition, samples of ordinary microscope glass slides were used for roughness measurements and the chemical composition of the coatings by FTIR. The glass samples were first cleaned with acetone and isopropanol before the deposition.
Zinc nitrate hexahydrate salt (Zn(NO3)2·6H2O, Sigma Aldrich, St. Louis, MO, USA; 99.99%; molecular weight: 297.49 g/mol) dissolved in distilled water was used as the precursor. Three different concentrations of the zinc nitrate solution were prepared: 0.5, 1.1, and 1.8 M, where M stands for mol/L.

2.2. Coating Deposition

The deposition of ZnO coatings via the solution precursor plasma spray process uses an atmospheric pressure plasma jet (APPJ) system (Reinhausen Plasma GmbH, Regensburg, Germany), which has already been described in our previous papers [24,25]. During the deposition, the plasma parameters were a plasma power of 2 kW, a pulse frequency of 50 kHz with a duration of 5–10 μs, a plasma ignition voltage of approximately 15 kV, and an effective voltage of 2–3 kV. Compressed air was used as the plasma working gas with a flow rate fixed at 40 L/min. The diameter of the torch nozzle was 4 mm and the distance between the torch nozzle and the surface of the substrate amounted to 20 mm. The temperature of the effluent plasma is around 1200 °C at the ground electrode and can reach a temperature of around 150 °C at a distance of 20 mm from the ground electrode, as determined by Köhler [14]. The solution precursor was atomized and added to the plasma at the end of the torch, using compressed air as a carrier gas with two flow rates of 14 and 17 L/min. Three deposition scan speeds at 30, 40, and 60 mm/s were applied.
The expected thermal decomposition pathways of Zn(NO3)2·6H2O in the plasma plume can be divided into two major phases. In the first phase, at temperatures between 100 and 150 °C, the solvent is evaporated and Zn(NO3)2 is formed under dehydration [18,26]:
Zn(NO3)2·6H2O → Zn(NO3)2 + 6H2O.
A conversion of zinc nitrate to zinc hydroxide (Zn(OH)2) can occur above the temperature of 150 °C [18,26]. In the second phase, pyrolysis occurs at a temperature in the range of 300–500 °C and yields ZnO [26]:
2Zn(NO3)2 → 2ZnO + 4NO2 + O2.

2.3. Characterization

The morphology of the atmospheric plasma-sprayed ZnO coatings was investigated by scanning electron microscopy (SEM, Microscope JEOL JSM-5600, at 12 kV, JEOL Ltd., Tokyo, Japan). In order to avoid charging effects, the coated samples were sputtered with a thin gold film (ca. 18 nm).
The topography and the roughness of the surfaces were investigated by atomic force microscopy (AFM, Nanosurf Easy Scan2, Nanosurf AG, Liestal, Switzerland). All AFM topographic images were measured in noncontact mode with a resolution of 512 points per line. The images were processed and analyzed using Gwyddion 2.19 software (CMI, Brno, Czech Republic).
Attenuated total reflectance Fourier transform infrared spectroscopy (ATR–FTIR) measurements were performed by using a PerkinElmer Frontier spectrometer equipped with an attenuated total reflectance (ATR) module (Golden Gate Single Reflection Diamond ATR, Specac, Fort Washington, PA, USA) in order to identify the chemical composition of the wood surfaces before and after coating, and to investigate the chemical changes of the wood surfaces after exposure to the UV radiation. Additionally, FTIR analysis was performed using the potassium bromide (KBr) pellet technique to compare the coating materials with reference materials without any contamination. All spectra were recorded between 4000 and 400 cm−1 at a resolution of 4 cm−1, and a total of 64 scans were made.
X-ray photoelectron spectroscopy (XPS) spectra were recorded by an instrument (XPS, PHI 5000 VersaProbe II, ULVAC-PHI, Chigasaki, Japan) equipped with monochromatic Al Kα excitation radiation with a photon energy of 1486.6 eV to analyze the surface elemental composition of the ZnO-coated wood. Survey spectra were captured at a pass energy of 187.85 eV with a step size of 0.4 eV and detailed spectra were made at 23.5 eV with a step size of 0.1 eV. The spot size was 200 µm in diameter for all spectra. The XPS high-resolution spectra were processed and fitted by PHI MultiPak software (Version 9.6.1, ULVAC-PHI, Chigasaki, Japan) using Gaussian–Lorentzian functions by taking the carbon C1s peak at 284.8 eV as a reference.
A mobile surface analyzer (MSA) (Krüss GmbH, Hamburg, Germany) was applied to measure the water contact angle on the wood surfaces. Here, droplets of distilled water with a volume of 1 µL were used. The values of the contact angle were recorded 10 s after dosing at room temperature. For each of the surfaces, five droplets were used for the contact angle measurements.
The color stability of the beech wood surfaces was determined using a UVA-365 lamp (Herolab GmbH, Wiesloch, Germany) with an electrical input of 8 W and light intensity of 950 µW/cm2. Three samples each from the coated and unmodified wood samples were exposed to UVA (365 nm) light for a total of 170 h in a laboratory-made chamber at room temperature. Color measurements were carried out on the CIE-L*a*b* color system by using an EOS 600D digital camera (Canon Inc., Tokyo, Japan) and Photoshop CS6 software to determine the color difference of the coated and uncoated wood during the UV irradiation. Pictures of samples were taken after each UV exposure interval of 10 h. The coordinate L* in the CIE-L*a*b* system represents the lightness and ranges from 0 (black) to 100 (white), while a* and b* are the chromaticity indices of color. The +a* value refers to red and the −a* value to green, while the +b* and –b* values refer to yellow and blue, respectively. The total color difference ∆E* is defined as follows:
ΔE* = (ΔL*2 + Δa*2 + Δb*2)1/2
where Δ means the differences between the color coordinates of the wood sample before and after UV irradiation.

3. Results and Discussion

3.1. Characterization of Coatings by SEM

The SEM-images in Figure 1 show the morphology of the uncoated wood and the coated wood samples, prepared at different deposition parameters. The surface of the natural beech wood sample is smooth. In all coated wood samples, a growth of plasma-sprayed ZnO coatings on the wood substrates was observed. At a magnification of 2000×, it can be clearly seen that the wood surface is partially covered with a coating that consists of spherical-shaped particles. The corresponding image at a higher magnification of 7000× showed that the spherical particles were in the size range of 1–3 μm.
In order to obtain further information about the influence of the deposition parameters on the morphology of the coatings, SEM images of coated glass surfaces were made (Figure 2). The same deposition parameters were used for the coating of the glass samples as for the wood samples. Since the glass samples have a lower surface roughness, the effect of the parameter variation is more clearly visible.
The concentration of the precursor solutions determines the characteristics of the obtained coatings. Keeping the deposition scan speed constant at 60 mm/s (Figure 2, row 1), the coating material starts to grow on the substrate at low precursor concentration of 0.5 M, but the surface of the substrate is not well covered. At a 1.1 M precursor concentration, the coating continues to grow and some microagglomerations are present on the surface of the substrate, but the surface of the substrate is still not well covered (row 2). After decreasing the deposition scan speed to 40 mm/s and keeping the precursor concentration constant at 1.1 M (row 3), the microagglomerations become bigger and start to bond together, forming the coatings, and the substrates become well covered but still not completely. Keeping the scan speed constant (40 mm/s), while increasing the precursor concentration to 1.8 M (row 4), the substrates are still not completely covered with the coating. The density of the two-pass coatings (column 2) is higher than that of the one-pass coatings (column 1). The density of the coating increased as the carrier gas flow rate increased from 14 to 17 L/min, as can be seen in columns 1 and 3, respectively.

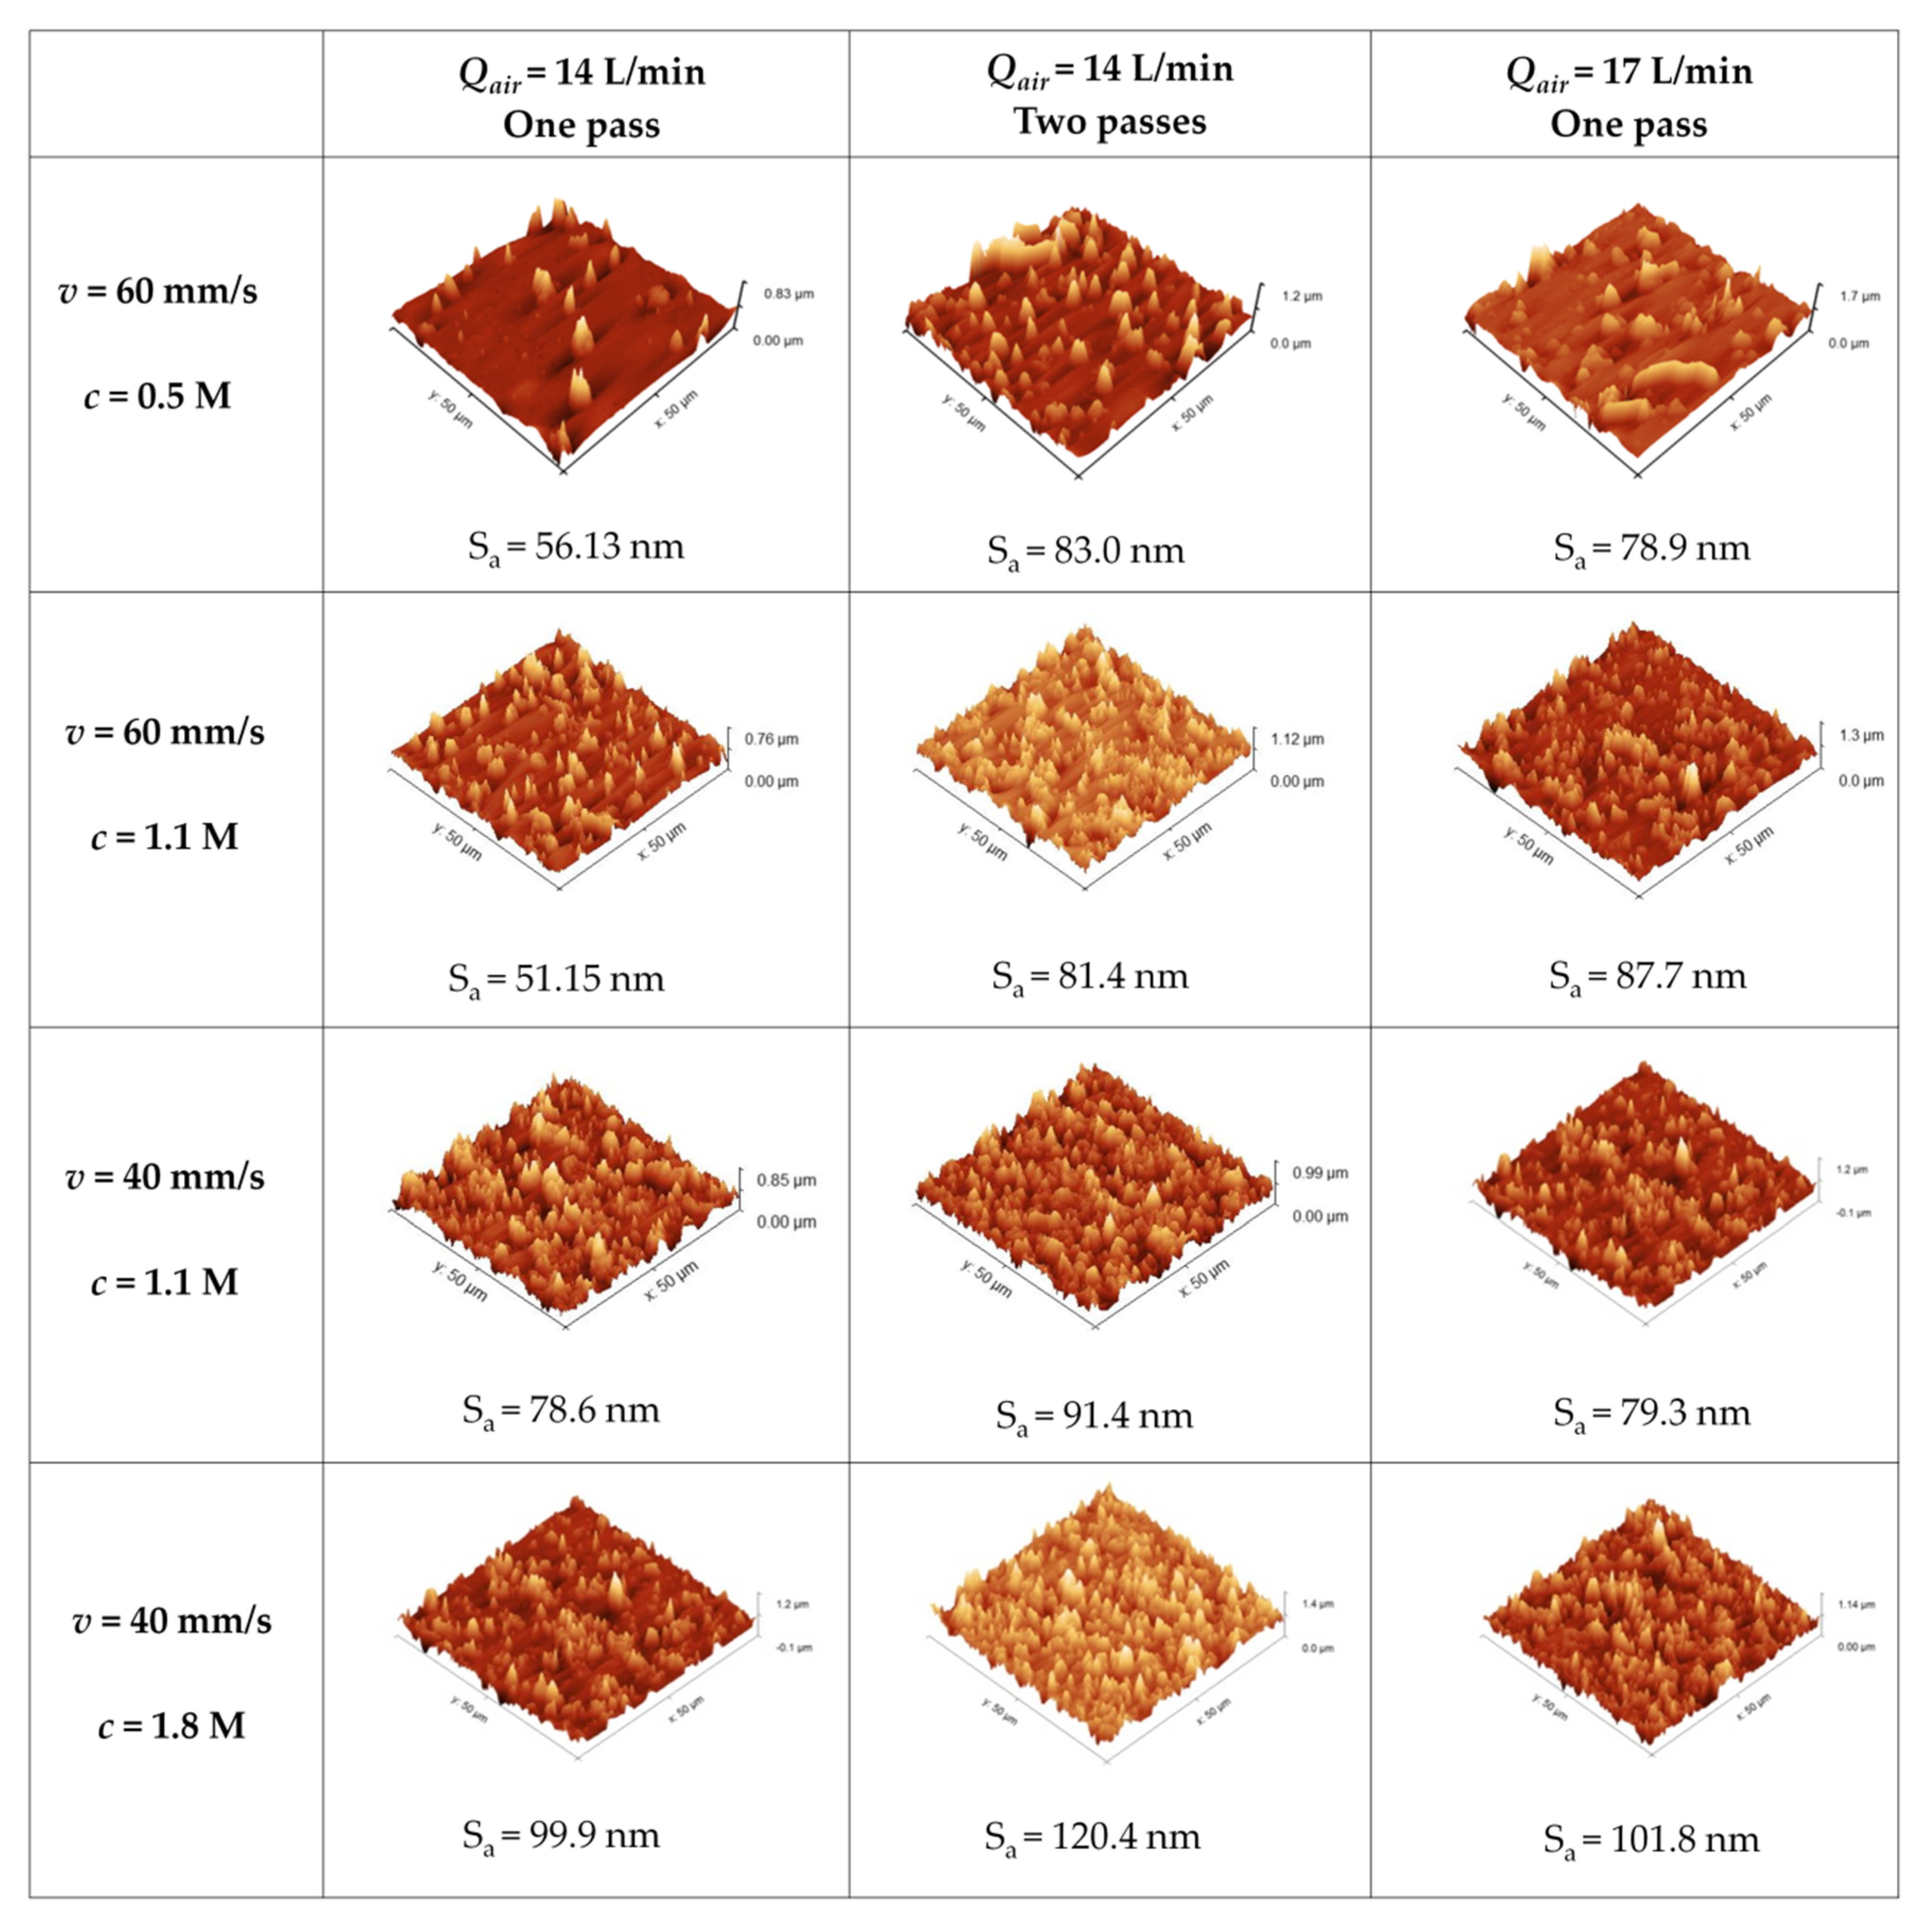
3.2. Characterization of Coatings by AFM

The surface topography and roughness of the coatings were further examined by AFM. In order to better recognize the differences, coated glass samples were used again. Figure 3 presents the 3D AFM images and the average surface roughness of the coated glass substrates on an area of 50 µm × 50 μm. As can be seen, the coated substrates revealed the presence of microagglomeration growth on the surface, which was also apparent in the SEM micrographs. In most cases, the average surface roughness of the coated glass surfaces increased as the precursor concentrations, number of deposition passes, carrier gas flow rates, and deposition time increased. As can be seen, the effect of the carrier gas flow rate is high at shorter deposition times and low at longer deposition times. All four parameters influence each other, which means the whole parameter set has to be considered for an optimal coating result.
Therefore, to produce dense coatings that completely cover the wood substrates, several passes of the plasma jet over the wood substrate are necessary. In addition, a reduction of the deposition scanning speed and the use of the high concentration of 1.8 M with the high carrier gas flow rate of 17 L/min are also necessary. Figure 4 presents the coated glass substrates obtained at a concentration of 1.8 M, carrier gas flow rate of 17 L/min, and at the deposition scan speed of 30 mm/s for one, two and three scan passes. As can be seen, under these conditions three passes were required to cover the surface of the glass substrate completely. A reduction of the deposition scan speeds to less than 30 mm/s is not possible, since the wood samples are burned in this case.

3.3. Characterization of Coatings by FTIR

The chemical composition of the coated wood samples was examined by FTIR spectroscopy. The FTIR spectra are given in Figure 5. The IR spectrum of pure ZnO particles (Figure 5a) showed two characteristic peaks: a broad and very weak peak at 3431 cm−1 corresponding to the O–H stretching vibration of hydroxyl groups, and the strong absorption peak at 445 cm−1 corresponding to the Zn–O stretching vibration [26,27]. The FTIR spectrum of zinc nitrate hexahydrate Zn(NO3)2·6H2O is shown in Figure 5b. The spectrum mainly contains peaks of the nitrate groups and the hydroxyl units. Three regions of vibrational modes can be distinguished in the spectrum: the region between 3650 and 3000 cm−1 (OH vibrations), the region between 3000 and 1700 cm−1 (combination and overtone modes of nitrate vibrations), and the region between 1650 and 750 cm−1 (nitrate vibrations). The broad peak between 3200 and 3600 cm−1 is attributed to the O–H stretching vibrations. The two very strong peaks at 1384 and 1347 cm−1 are assigned to the N–O stretching vibrations of the nitrate ion (NO3). In addition, the peaks at 2767, 2096, 1764, and 824 cm−1 arise from the nitrate group. There is no appearance of a peak at 445 cm−1 [26,28,29].
Figure 5c shows the FTIR–ATR spectra of the coated wood at different deposition parameters in comparison to the uncoated wood spectrum. As can be seen, the intensity of the typical absorption bands of wood (2892 cm−1 for C–H stretching vibration, 1734 cm−1 for C=O stretching vibration, and 1031 cm−1 for C–O stretching vibration) decreases with an increasing covering rate of the surface. The FTIR–ATR spectrum of the thin coated wood (at v = 40 mm/s; one pass) was only slightly different from that of the uncoated wood. The obvious differences were the strengthening of the peaks at 1596 and 1318 cm−1, which can be attributed to coordinated water and nitrate ion (NO3), respectively. A very weak peak that appears at about 440 cm−1 corresponds to Zn–O. In contrast, nearly all wood peaks are missing from the FTIR spectrum of the thicker coated wood (at v = 30 mm/s; 3 passes). The broad peaks that are observed between 3600 and 3200 cm−1 are attributed to the stretching vibrations of –OH groups and coordinated water. The peaks at 1490 and 1313 cm−1 are attributed to the N=O stretching vibrations of the coordinated nitrate group and the nitrate ion, respectively. The peak at 700 cm−1 can be assigned to Zn–OH. In addition, the FTIR–ATR spectrum of the coated sample shows a peak at 445 cm−1, which corresponds to the Zn–O [26,28,29]. Therefore, the resulting coating contained ZnO and Zn(OH)2 particles that were linked on the wood surface.
The FTIR–KBr technique was used to compare the coating materials with pure ZnO powder and the zinc nitrate salt. For this purpose, some coatings were carefully scraped from the glass substrate to obtain powder samples for the preparation of the KBr pellets. Figure 5d shows the IR spectra of the coatings deposited at the following conditions: (v = 40 mm/s; c = 1.1 M; one pass) and (v = 30 mm/s; c = 1.8 M; three passes). Both spectra exhibited obviously broad peaks in the 3600–3400 cm1 region, corresponding to the -OH stretching vibrations. The weak band at around 1623 cm−1 is assigned to the bending vibrations of H2O molecules. The sharp peaks at 1384 cm−1 and 1347 cm−1 are assigned to the stretching vibration mode of NO3. The peak at 716 cm−1 is attributed to the stretching vibration of Zn–OH. The peak located at 445 cm−1 corresponds to the Zn–O [26,28,29].

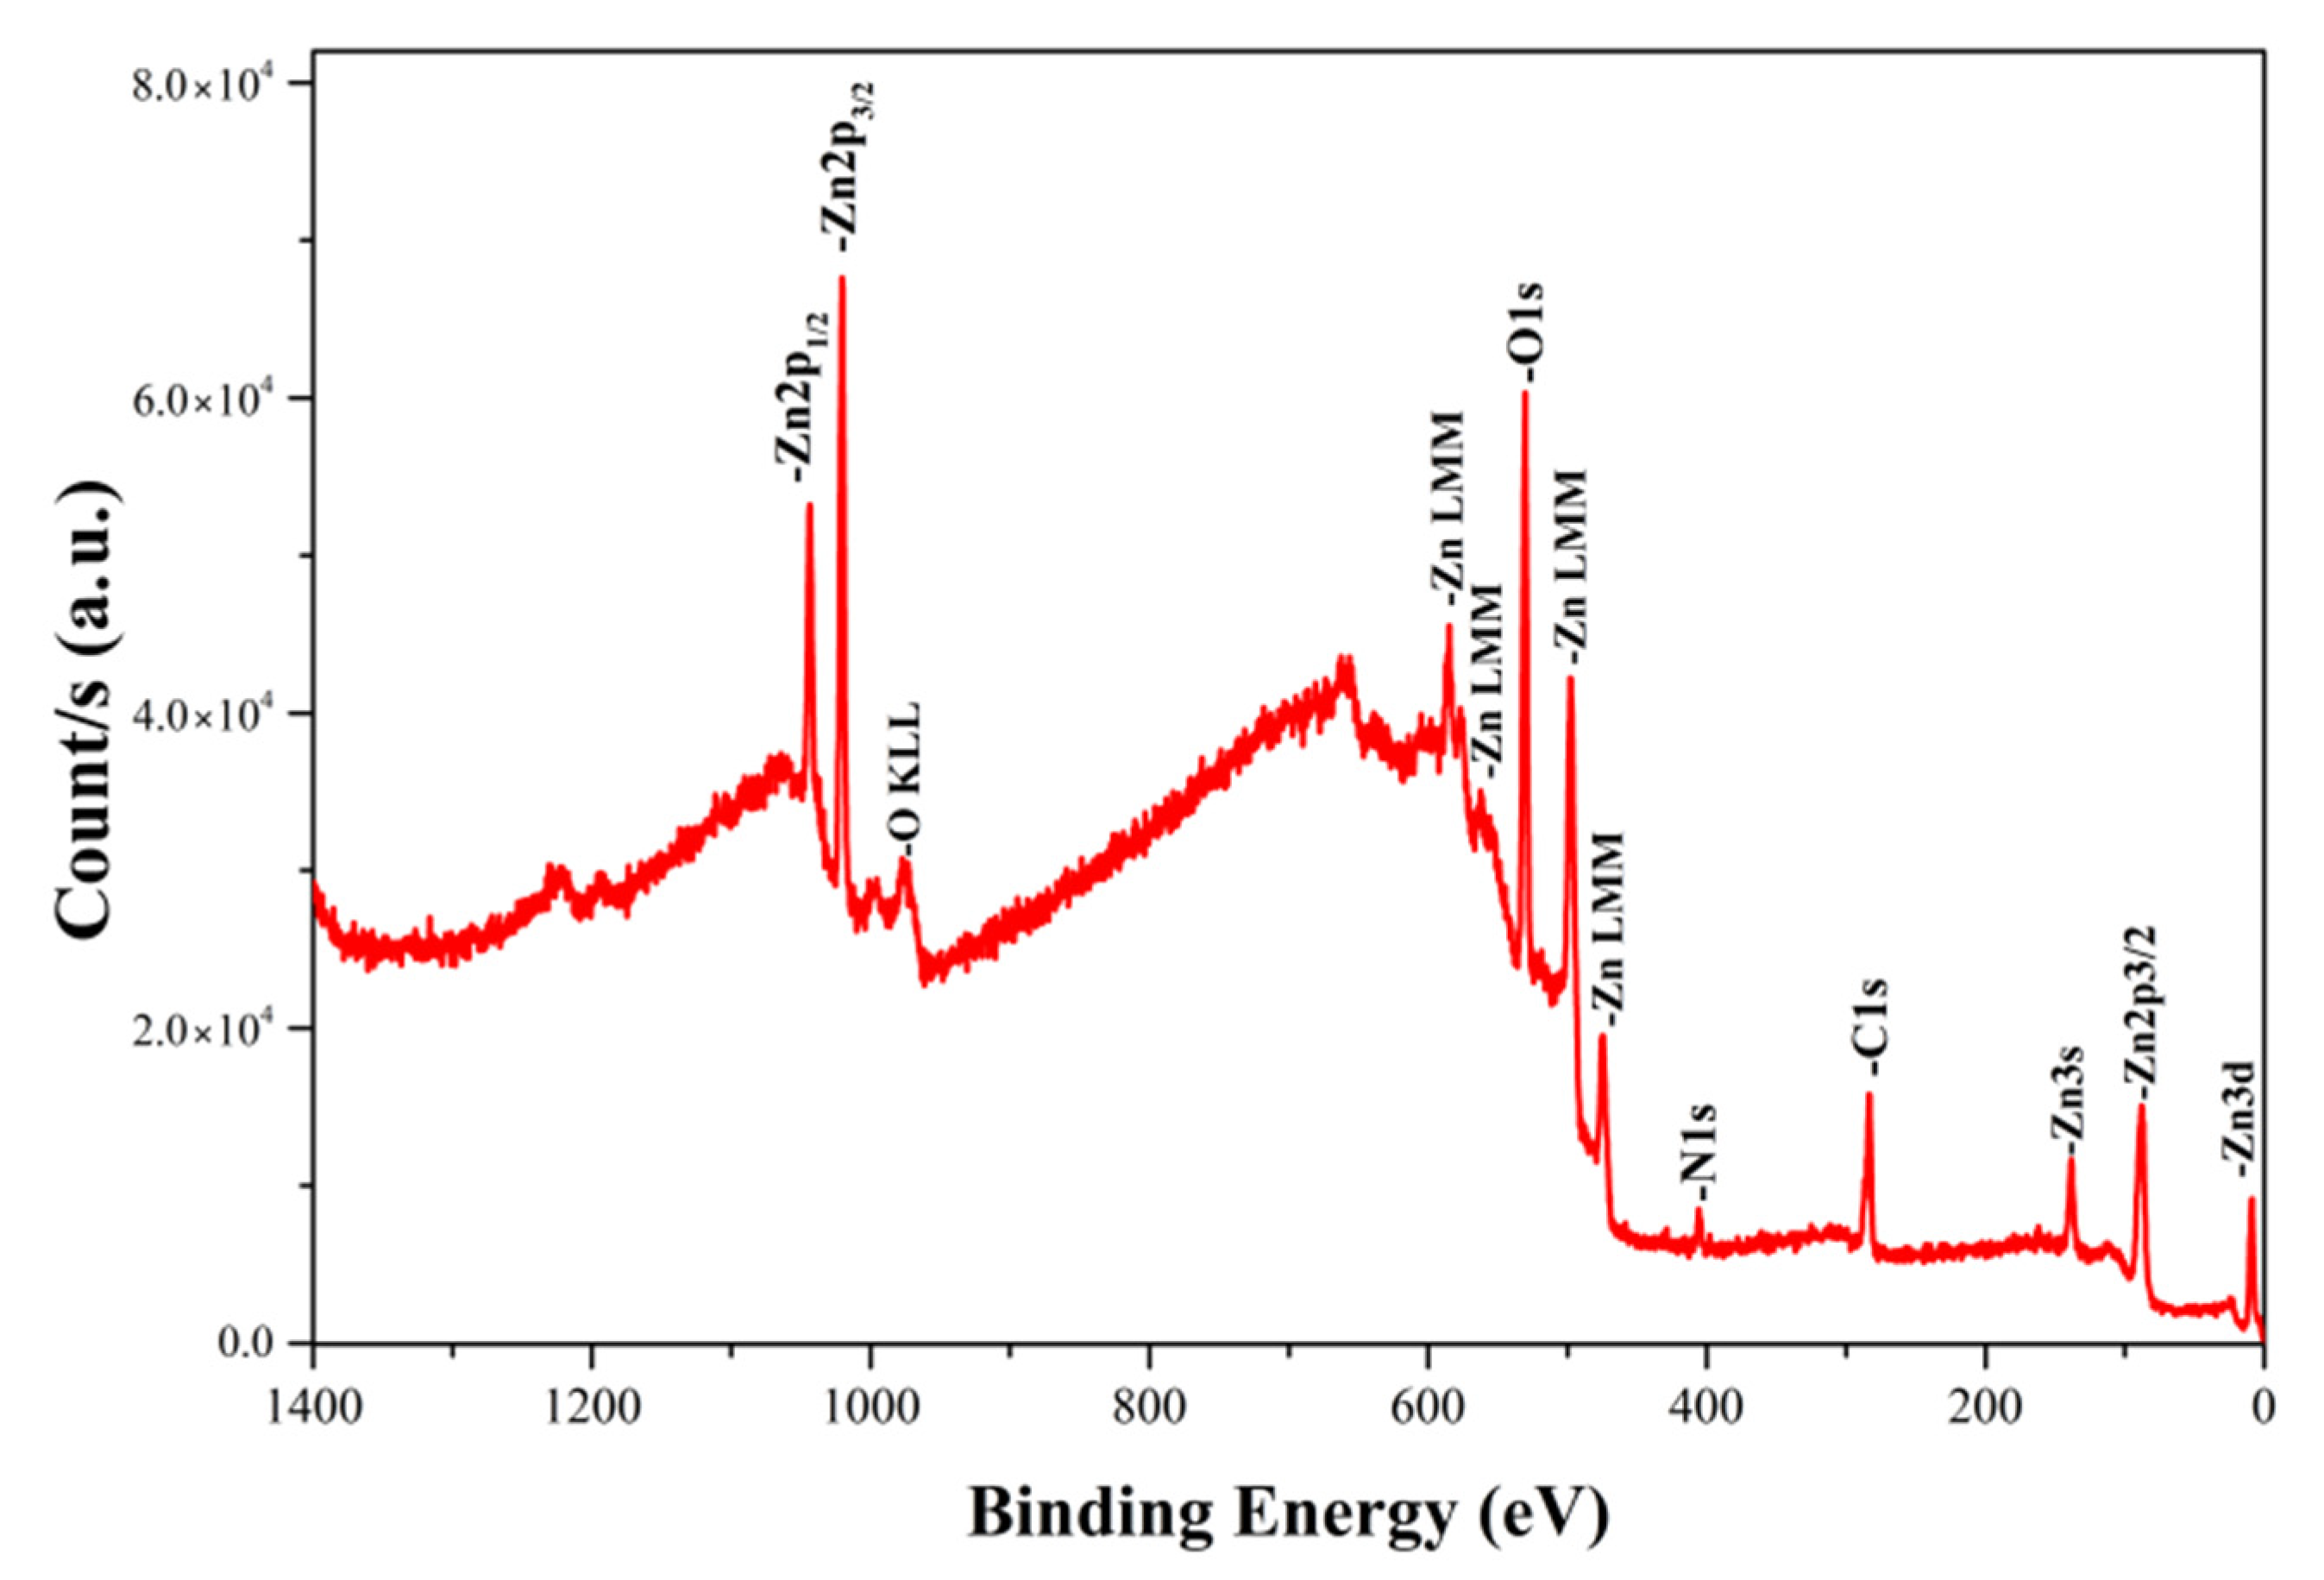
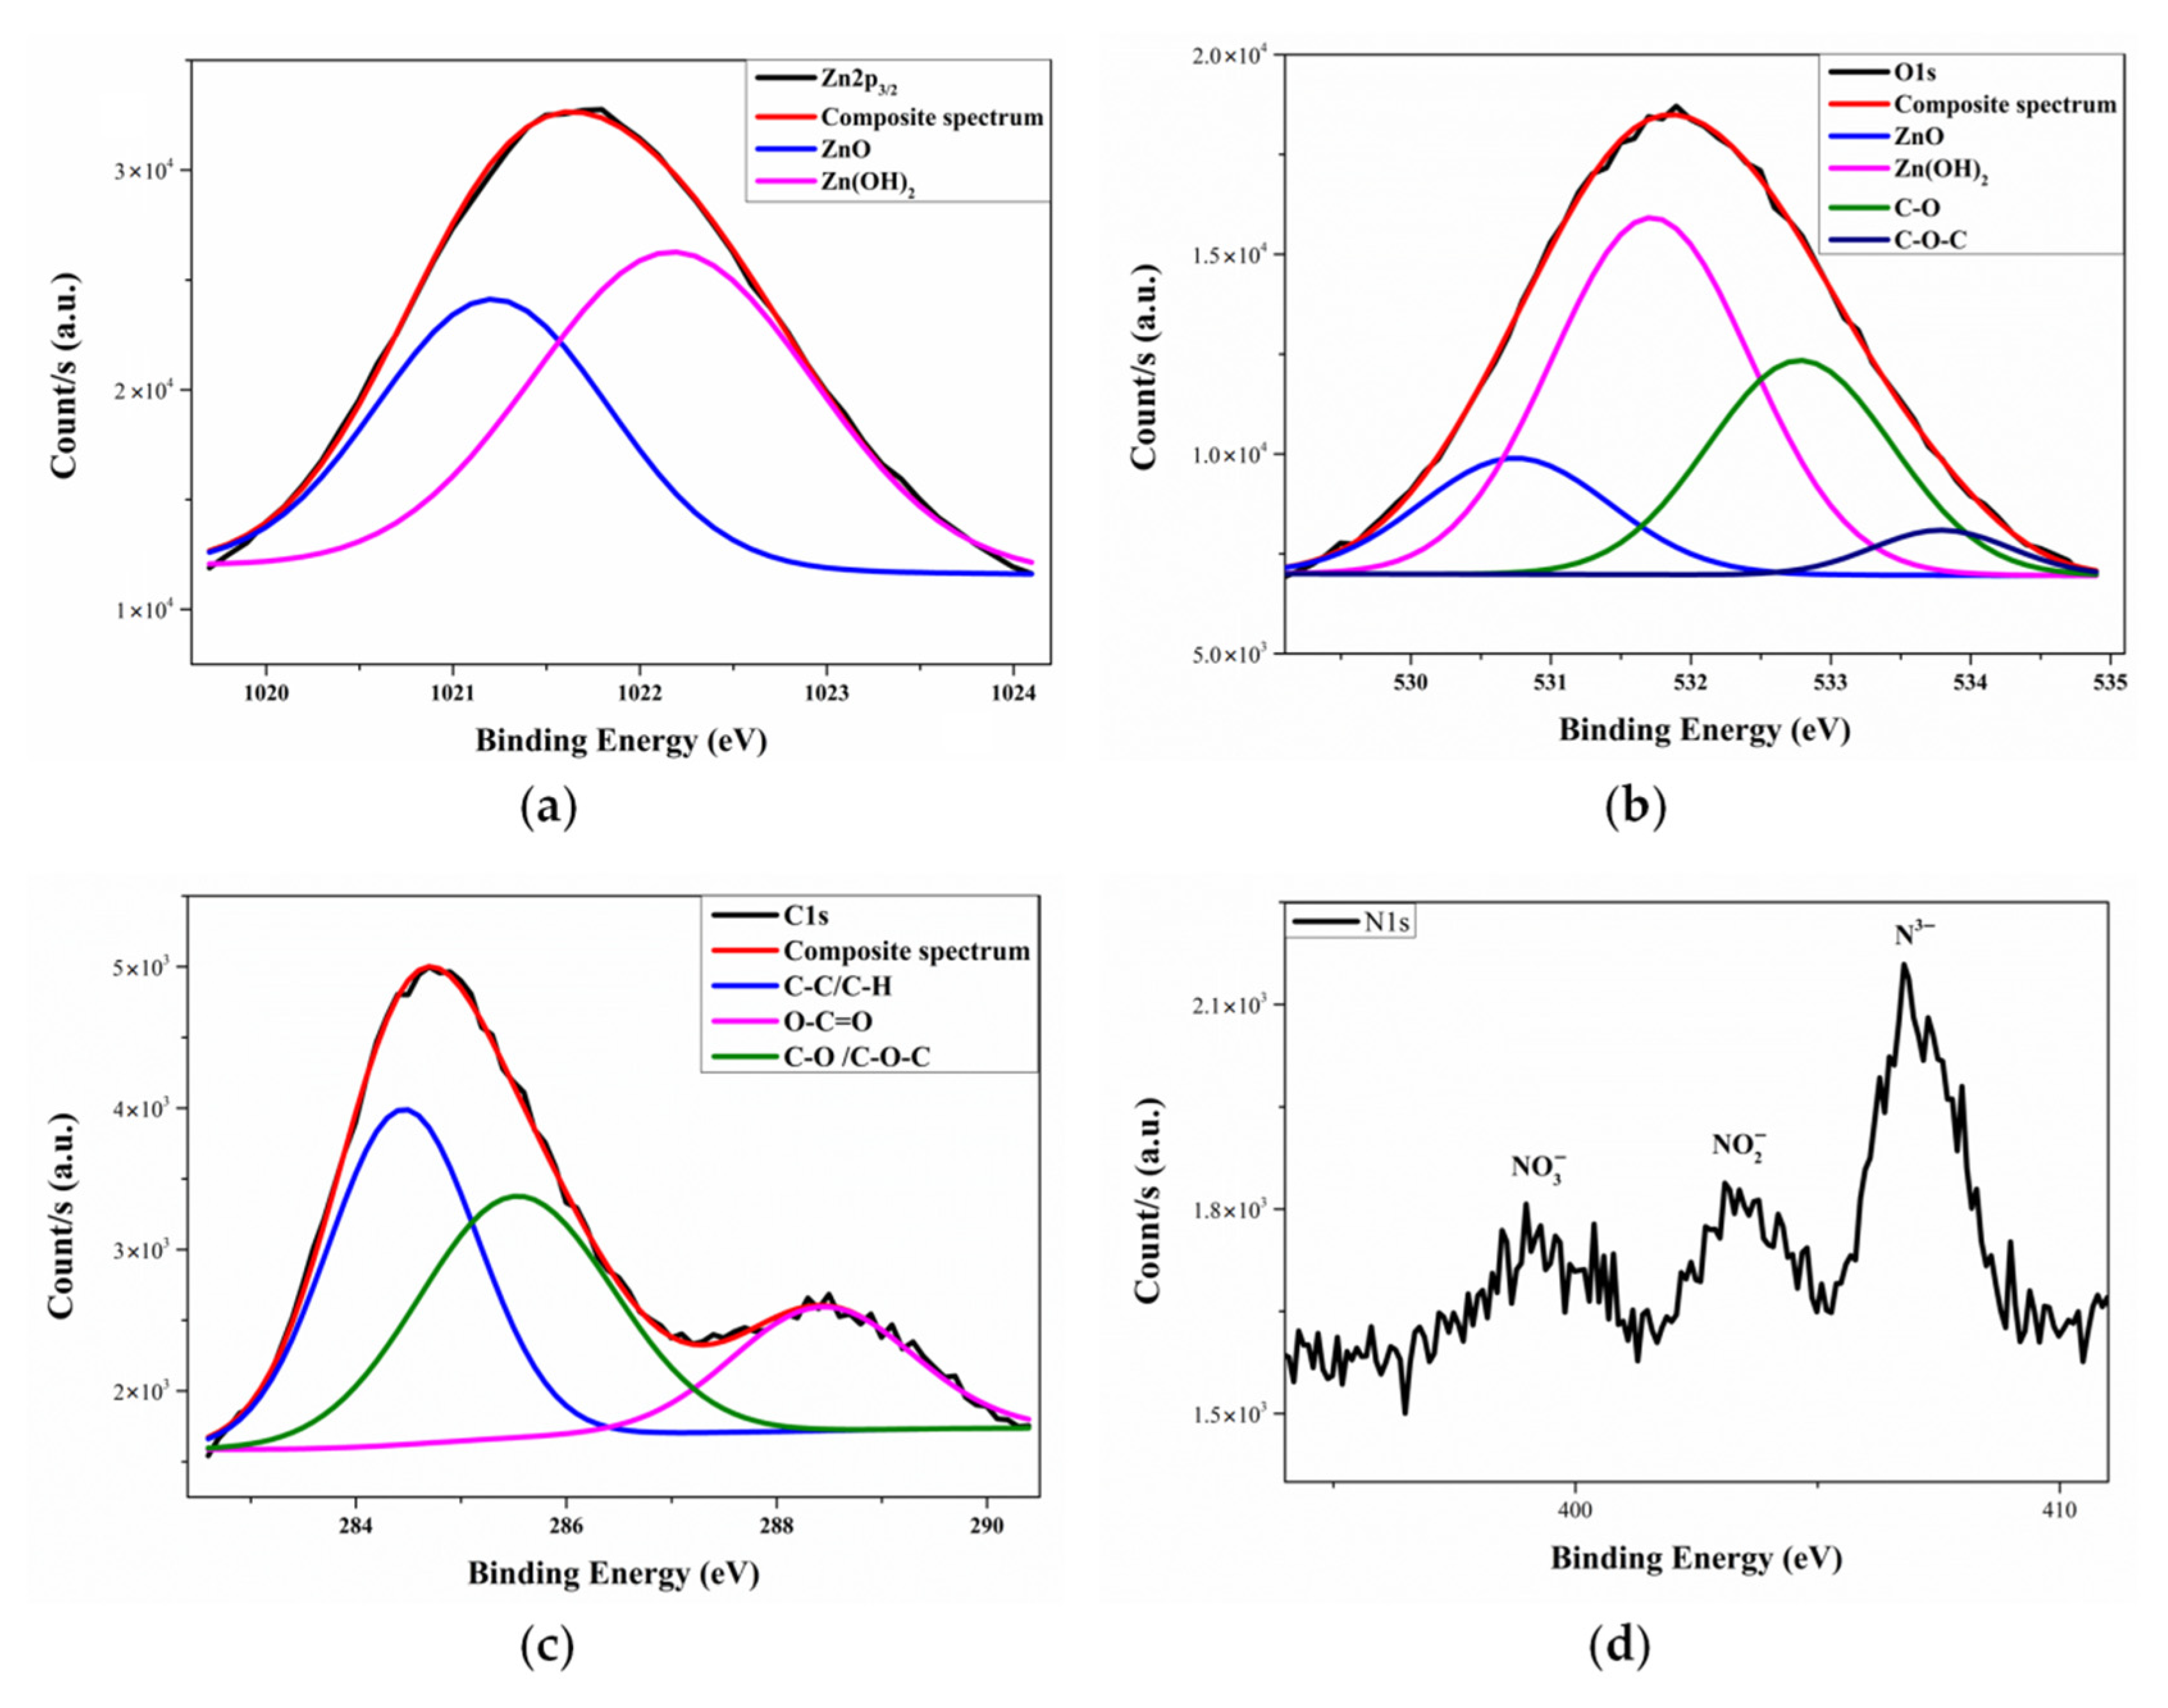
3.4. Characterization of Coatings on Wood by XPS

To further support the FTIR results, the chemical composition and chemical state of the deposited coatings on wood were analyzed by X-ray photoelectron spectroscopy (XPS). The survey spectrum of a deposited coating (concentration of 1.8 M at deposition speed 30 mm/s, carrier gas Qair = 17 L/min, and 3 passes) is shown in Figure 6. The peaks at 284, 400, 530, and 1021 eV correspond to C1s, N1s, O1s, and Zn2p, respectively. In contrast to the IR results, which do not provide any quantitative information, a very small nitrogen content (<1 atom%) and a relatively high zinc content (approximately 17 atom%) were determined using XPS. These concentration values agree better with the SEM and AFM results.
The high-resolution XPS spectra of the C1s, O1s, and Zn2p3/2 are shown in Figure 7 and the surface elements’ chemical state and the atomic percentage of the obtained coating estimated from the XPS spectra are given in Table 1.
As evident in Figure 7a, the high-resolution XPS spectrum of Zn2p3/2 is fitted by two peaks located at a binding energy of 1021.21 and 1022.18 eV, and can be attributed to the ZnO and Zn(OH)2, respectively [23,27,29]. It can be clearly seen in Figure 7b that the high-resolution XPS spectrum of O1s is fitted by four peaks located at 530.75, 531.72, 532.78, and 533.79 eV, corresponding to the Zn–O bonding of the ZnO structure, Zn(OH)2, C–O or C=O, and C–O–C, respectively [23,26,29]. The high-resolution XPS spectrum of C1s is shown in Figure 7c. The C1s peak is fitted by three peaks located at the binding energy of 284.55, 285.66, and 288.52 eV, corresponding to C–C, C–O, and C=O, respectively [23,27,29]. The high-resolution spectrum of N1s is shown in Figure 7d. The spectrum reveals three components at the binding energies 398, 403, and 406 eV, which correspond to N3−, NO2, and NO3, respectively [23]. The results in Table 1 show that the amount of Zn(OH)2 in the coating is slightly higher than that of ZnO. The Zn/O ratio calculated from the peak areas of Zn and O of the Zn–O state (530.75 and 1021.21 eV) is 1. For Zn(OH)2, a Zn/O ratio of 0.44 is obtained, probably caused by a hydrate phase.
Table 2 presents the atomic percentage of the element Zn on the coated substrate surfaces. The atomic percentage of the element Zn increases with an increase of precursor concentration, the carrier gas flow rates, and the number of scan passes, and with the decrease of the deposition scanning speed.
The dense coatings that completely covered the wood substrates were obtained from the concentration of 1.8 M and by reducing the deposition scanning speed to 30 mm/s with the carrier gas flow rate of 17 L/min for one, two, and three scan passes. These coatings have a higher atomic percentage of the element Zn—namely 14.1%, 13.2% and 17.3% for the coated wood samples with one, two, and three scan passes, respectively.

3.5. Contact Angle Measurements

Water contact angle (WCA) measurements of the coated wood surfaces were carried out and some examples of the images of water droplets with a size of 1 µL on the surfaces are shown in Figure 8 and Figure 9. As expected, all samples that were not completely covered with coating showed hydrophilic behaviors with a WCA less than 60°.
However, the coatings that completely covered the wood substrates showed hydrophobic behaviors with WCAs of 85° ± 5°, 92° ± 3°, and 120° ± 4° for the coated wood samples with one, two, and three scan passes, as can be seen in Figure 9.

3.6. UV Protection Test

To evaluate the UV-protection ability of the plasma-sprayed ZnO-containing coatings on the beech wood samples, the wood samples were exposed to UV irradiation for 170 h and their color change was monitored over time. These investigations were primarily made to evaluate the process parameters for the production of the coatings and not to evaluate the long-term stability of the coatings for outdoor applications. The results of the color measurements of the wood samples after UV irradiation are summarized in Table 3. The difference in the total color variation ΔE* between the coated samples from the precursor with a concentration of 1.1 M and the uncoated sample was insignificant; the ΔE* values were a little bit smaller than the value of the uncoated samples, as can be seen in Figure 10a. However, all ΔE* values of the coated samples from the precursor with a concentration of 1.8 M were smaller than the value of the uncoated samples. The wood sample that was completely covered with coating showed better UV protection with ΔE* = 3.8, as can be seen in Figure 10b. The results presented above indicate the effectiveness of plasma-sprayed ZnO-containing coatings for the stabilization of wood surfaces against UV degradation.
The images of the uncoated and the coated beech wood samples before and after 170 h of UV irradiation are shown in Figure 11. Here, we can clearly note that all of the wood samples showed a change of color after the UV irradiation. However, the sample deposited under the conditions c = 1.8 M, Qair = 14 L/min, v = 30 mm/s, and 3 passes exhibited a small improvement in the UV resistance.
The effect of UV radiation on the chemical structure of the wood surfaces was evaluated by FTIR–ATR spectroscopy. An evaluation was performed by comparing the FTIR spectra of the wood samples before and after the artificial UV irradiation test. FTIR spectra in the region from 1800 to 1100 cm−1 of the uncoated wood and ZnO-coated wood are shown in Figure 12. The UV irradiation led to significant changes in the FTIR spectra of the wood surface without coating. A decrease in the intensity of the peak at 1423 cm−1—corresponding to C–H deformation in the aromatic ring in lignin—also indicates severe degradation of lignin [2,3,7,8,9]. The lignin band at 1505 cm−1—corresponding to C=C stretching—decreased after 170 h of UV irradiation. Furthermore, the absorption band at 1736 cm−1—corresponding to carbonyl groups (C=O)—increased after the UV irradiation, indicating an increased formation of carbonyl group-containing compounds due to the photodegradation of lignin [2,3,7,8,9].
UV irradiation of the coated wood samples leads to minor changes in the intensities of the peaks in the IR spectra. An increase in the peak intensity of carbonyl groups at 1736 cm−1 was observed in coated samples (at c = 1.8 M, Qair = 17 L/min, v = 40 mm/s, 1 pass) and (at c = 1.8 M, Qair = 17 L/min, v = 30 mm/s, 1 pass) after the irradiation, whereas there were no noticeable changes in the intensity in this position in the spectrum of the coated samples (at c = 1.8 M, v = 30 mm/s, three passes), as shown in Figure 12d. This is because all wood peaks disappeared from the FTIR–ATR spectrum of the wood surface after the coating with ZnO (at c = 1.8 M, v = 30 mm/s, three passes), which completely covered the wood surface (see Figure 5c). Therefore, to analyze the changes in the chemical structure of wood after the exposure to UV radiation, it is also necessary to remove the ZnO coating, which was not possible in our case.

4. Conclusions

Zinc oxide coatings were successfully deposited on wood substrates via the SPPS method by using APPJ and were evaluated with respect to their UV-protection efficiency and water repellency. It was possible to control the process through the plasma deposition parameters. The most significant factors affecting the plasma spray coating of zinc oxide are the solution concentration, the deposition scan speed, and the carrier gas flow rate. The FTIR results showed the formation of ZnO and Zn(OH)2, which was confirmed by XPS investigations. Protection against UV radiation was determined by UV tests. The changes of color in the wood surfaces during UV exposure were measured using the CIE-L*a*b* color system. The wood sample which was completely covered with coating showed good UV protection. All wood samples not completely covered with coating showed hydrophilic behaviors with a WCA below 60°, whereas the completely covered wood samples showed hydrophobic behaviors. These results indicate the feasibility of fabricating protective ZnO coatings on wood surfaces via SPPS using the atmospheric pressure plasma jet.

Author Contributions

Conceptualization, G.J.; methodology, G.J.; validation, G.J., G.O. and W.V.; investigation, G.J.; resources, G.O. and W.V.; writing—original draft preparation, G.J.; writing—review and editing, G.J., G.O. and W.V. All authors have read and agreed to the published version of the manuscript.

Funding

This research was funded by the Lower Saxony Ministry of Science and Culture (MWK). The authors thank the German Research Foundation (DFG) INST 196/11-1 for financial support.

Institutional Review Board Statement

Not applicable.

Informed Consent Statement

Not applicable.

Data Availability Statement

Data available on request.

Acknowledgments

The authors further thank Roger Skarsten for proofreading the manuscript.

Conflicts of Interest

The authors declare no conflict of interest.

References

  1. Falk, B. Wood as a sustainable building material. For. Prod. J. 2009, 59, 6. [Google Scholar]
  2. Hon, D.N.S. Weathering and photochemistry of wood. In Wood and Cellulosic Chemistry; Hon, D.N.S., Shirashi, N., Eds.; Marcel Decker Ink.: New York, NY, USA, 2001; pp. 525–555. [Google Scholar]
  3. Pandey, K.K. A note on the influence of extractives on the photo-discoloration and photo-degradation of wood. Polym. Degrad. Stab. 2005, 87, 375–379. [Google Scholar] [CrossRef]
  4. Weichelt, F.; Beyer, M.; Emmler, R.; Flyunt, R.; Beyer, E.; Buchmeiser, M. Zinc oxide based coatings for the UV-protection of wood for outdoor applications. Macromol. Symp. 2011, 301, 23–30. [Google Scholar] [CrossRef]
  5. Wang, Z.L. Nanostructures of zinc oxide. Mater. Today 2004, 7, 26–33. [Google Scholar] [CrossRef]
  6. Favarim, H.R.; Leite, L.O. Performance of ZnO nanoparticles for fire retardant and UV protection of pine wood. BioResources 2018, 13, 6963–6969. [Google Scholar]
  7. Guo, H.; Fuchs, P.; Cabane, E.; Michen, B.; Hagendorfer, H.; Romanyuk, Y.E.; Burgert, I. UV-protection of wood surfaces by controlled morphology fine-tuning of ZnO nanostructures. Holzforschung 2016, 70, 699–708. [Google Scholar] [CrossRef]
  8. Salla, J.; Pandey, K.K.; Srinivas, K. Improvement of UV resistance of wood surfaces by using ZnO nanoparticles. Polym. Degrad. Stabil. 2012, 97, 592–596. [Google Scholar] [CrossRef]
  9. Nair, S.; Nagarajappa, G.B.; Pandey, K.K. UV stabilization of wood by nano metal oxides dispersed in propylene glycol. J. Photochem. Photobiol. B 2018, 183, 1–10. [Google Scholar] [CrossRef]
  10. De Peres, M.L.; de Avila Delucis, R.; Amico, S.C.; Gatto, D.A. Zinc oxide nanoparticles from microwave-assisted solvothermal process: Photocatalytic performance and use for wood protection against xylophagous fungus. Nanomater. Nanotechnol. 2019, 9, 1–8. [Google Scholar] [CrossRef] [Green Version]
  11. Fu, Y.; Fu, W.; Liu, Y.; Zhang, G.; Liu, Y.; Yu, H. Comparison of ZnO nanorod array coatings on wood and their UV prevention effects obtained by microwave-assisted hydrothermal and conventional hydrothermal synthesis. Holzforschung 2015, 69, 1009–1014. [Google Scholar] [CrossRef]
  12. Denes, A.R.; Young, R.A. Reduction of weathering degradation of wood through plasma–polymer coating. Holzforschung 1999, 53, 632–640. [Google Scholar] [CrossRef]
  13. Wallenhorst, L.; Gurau, L.; Gellerich, A.; Militz, H.; Ohms, G.; Viöl, W. UV-blocking properties of Zn/ZnO coatings on wood deposited by cold plasma spraying at atmospheric pressure. Appl. Surf. Sci. 2018, 434, 1183–1192. [Google Scholar] [CrossRef]
  14. Köhler, R.; Sauerbier, P.; Militz, H.; Viöl, W. Atmospheric pressure plasma coating of wood and mdf with polyester powder. Coatings 2017, 7, 171. [Google Scholar] [CrossRef] [Green Version]
  15. Jordan, E.H.; Jiang, C.; Gell, M. The solution precursor plasma spray (SPPS) process: A review with energy considerations. J. Therm. Spray Tech. 2015, 24, 1153–1165. [Google Scholar] [CrossRef]
  16. Unabia, R.; Candidato, R., Jr.; Pawłowski, L. Current progress in solution precursor plasma spraying of cermets: A review. Metals 2018, 8, 420. [Google Scholar] [CrossRef] [Green Version]
  17. Hsu, C.; Li, H.; Lien, S.; Chen, J.; Cheng, I.; Hsu, C. Deposition of ZnO thin films by an atmospheric pressure plasma jet-assisted process: The selection of precursors. IEEE Trans. Plasma Sci. 2015, 43, 670–674. [Google Scholar]
  18. Shutov, D.A.; Rybkin, V.V.; Ivanov, A.N. Synthesis of zinc oxide powders in plasma–solution systems. High Energy Chem. 2017, 51, 65–69. [Google Scholar] [CrossRef]
  19. Tummala, R.; Guduru, R.K.; Mohanty, P.S. Solution precursor plasma deposition of nanostructured ZnO coatings. Mater. Res. Bull. 2011, 46, 1276. [Google Scholar] [CrossRef]
  20. Dom, R.; Sivakumar, G.; Hebalkar, N.Y.; Joshi, S.V.; Borse, P.H. Deposition of nanostructured photocatalytic zinc ferrite films using solution precursor plasma spraying. Mater. Res. Bull. 2012, 47, 562–570. [Google Scholar] [CrossRef]
  21. Yu, Z.; Moussa, H.; Liu, M.; Schneider, R.; Moliere, M.; Liao, H. Solution precursor plasma spray process as an alternative rapid one-step route for the development of hierarchical ZnO films for improved photocatalytic degradation. Ceram. Int. 2018, 44, 2085–2092. [Google Scholar] [CrossRef]
  22. Candidato, R.T.; Ontolan, J.P.; Carpio, P.; Pawłowski, L.; Vequizo, R.M. Effects of precursor composition used in solution precursor plasma spray on the properties of ZnO coatings for CO2 and UV light sensing. Surf. Coat. Technol. 2019, 371, 395–400. [Google Scholar] [CrossRef]
  23. Galmiz, O.; Stupavska, M.; Wulff, H.; Kersten, H.; Brablec, A.; Cernak, M. Deposition of Zn-containing films using atmospheric pressure plasma jet. Open Chem. 2014, 13, 198–203. [Google Scholar] [CrossRef]
  24. Jnido, G.; Ohms, G.; Viöl, W. Deposition of TiO2 Thin films on wood substrate by an air atmospheric pressure plasma jet. Coatings. 2019, 9, 441. [Google Scholar] [CrossRef] [Green Version]
  25. Jnido, G.; Ohms, G.; Viöl, W. One-step deposition of polyester/tio2 coatings by atmospheric pressure plasma jet on wood surfaces for uv and moisture protection. Coatings 2020, 10, 184. [Google Scholar] [CrossRef] [Green Version]
  26. Nagaraju, G.; Nagabhushana, H.; Basavaraj, R.B.; Raghu, G.K.; Suresh, D.; Rajanaika, H.; Nagabhushana, H.; Sharma, S.C. Green, nonchemical route for the synthesis of ZnO superstructures, evaluation of its applications toward photocatalysis, photoluminescence, and biosensing. Cryst. Growth Des. 2016, 16, 6828–6840. [Google Scholar]
  27. Jain, G.; Macia-Montero, M.; Velasumy, T.; Maguire, P.; Mariotti, D. Porous zinc oxide nanocrystalline film deposition by atmospheric pressure plasma: Fabrication and energy band estimation. Plasma Processes Polym. 2017, 14, 1700052. [Google Scholar] [CrossRef]
  28. Singh, S.C. Effect of oxygen injection on the size and compositional evolution of ZnO/Zn(OH)2 nanocomposite synthesized by pulsed laser ablation in distilled water. J. Nanopart. Res. 2011, 13, 4143–4152. [Google Scholar] [CrossRef]
  29. Winiarski, J.; Tylus, W.; Winiarska, K.; Szczygieł, I.; Szczygieł, B. XPS and FT-IR characterization of selected synthetic corrosion products of zinc expected in neutral environment containing chloride ions. J. Spectrosc. 2018, 2018, 1–14. [Google Scholar] [CrossRef] [Green Version]
Figure 1. Scanning electron microscope (SEM) images with a magnification of 2000× (scale bar 10 µm) and with a magnification of 7000× (scale bar 2 µm) of uncoated and coated wood surfaces.
Coatings 11 00183 g001
Figure 2. SEM images with a magnification of 2000× (scale bar 10 µm) of the coated glass surfaces at different deposition parameters.
Coatings 11 00183 g002
Figure 3. Three-dimensional atomic force microscopy (AFM) images of the coated glass surfaces at different deposition parameters.
Coatings 11 00183 g003
Figure 4. SEM images with a magnification of 2000× (scale bar 10 µm) and 3D AFM images with the surface roughness of the coated glass surfaces at different numbers of passes.
Coatings 11 00183 g004
Figure 5. (a) Fourier transform infrared spectroscopy (FTIR) spectrum of the pure ZnO, (b) FTIR spectrum of the zinc nitrate hexahydrate salt, (c) FTIR–ATR (attenuated total reflectance) spectra of the uncoated and coated wood samples, (d) FTIR spectra of the coatings.
Coatings 11 00183 g005
Figure 6. X-ray photoelectron spectroscopy (XPS) survey spectra of a coated wood sample (c = 1.8 M, v = 30 mm/s, Qair = 17 L/min, 3 passes).
Coatings 11 00183 g006
Figure 7. High-resolution XPS spectra of (a) Zn2p3/2, (b) O1s, (c) C1s, (d) N1s.
Coatings 11 00183 g007
Figure 8. Water contact angle (WCA) on the surfaces of coated wood obtained (a) at c = 1.1 M, Qair = 17 L/min, 2 passes, v = 40 mm/s; (b) at c = 1.8 M, Qair = 14 L/min, 1 pass, v = 40 mm/s; (c) at c = 1.8 M, Qair = 17 L/min, 2 passes, v = 40 mm/s.
Coatings 11 00183 g008
Figure 9. Water contact angle on the surfaces of coated wood obtained at c = 1.8 M, Qair = 17 L/min, and v = 30 mm/s for (a) 1 pass; (b) 2 passes; (c) 3 passes.
Coatings 11 00183 g009
Figure 10. Change of total color ΔE* of coated and uncoated wood samples depending upon the time of irradiation (a) concentration of 1.1 M and (b) concentration of 1.8 M.
Coatings 11 00183 g010
Figure 11. Visual appearance of coated and uncoated samples, before and after 170 h of UV irradiation: (a) control beech wood; (b) coated at v = 40 mm/s, Qair = 17 L/min, 1 pass; (c) coated at v = 30 mm/s, Qair = 17 L/min, 1 pass; (d) coated at v = 30 mm/s, Qair = 17 L/min, 3 passes.
Coatings 11 00183 g011
Figure 12. FTIR–ATR spectra, in the region from 1800 to 1200 cm−1, of the ZnO-coated and uncoated wood samples, before and after UV irradiation: (a) uncoated wood; (b) coated at v = 40 mm/s, Qair = 17 L/min, 1 pass; (c) coated at v = 30 mm/s, Qair = 17 L/min, 1 pass; (d) coated at v = 30 mm/s, Qair = 17 L/min, 3 passes.
Coatings 11 00183 g012
Table 1. Surface elemental composition, peak position, and atomic percentage of the coated wood surface determined using XPS analysis.
ElementAssignmentPeak Position (eV)Peak Area (%)Atomic Percentage
ZnZn–O1021.2141.17.1
Zn(OH)21022.1858.910.2
OZn–O530.7515.97.1
Zn(OH)2531.7251.122.9
C–O532.7828.512.8
C-O-C533.794.52.0
CC–C/C–H284.5545.517.1
C–O/C–O–C285.6636.613.8
O–C=O288.5217.96.7
NN2398 -0.26
NO2403
NO3406
Table 2. Atomic percentage of Zn for the coatings obtained at different deposition parameters.
Deposition Scan SpeedPrecursor Concentration14 L/min
One Pass
14 L/min
Two Passes
17 L/min
One Pass
17 L/min
Two Passes
60 mm/s0.5 M 2.32.62.73.2
1.1 M3.65.13.9-
40 mm/s1.1 M4.97.35.6-
1.8 M7.610.26.412.2
Table 3. Differences in color measurements before and after 170 h exposure to UV radiation.
SampleΔL*Δa*Δb*ΔE*Protection Efficiency
Uncoated wood−4.12 ± 0.521.39 ± 0.477.10 ± 0.428.34 ± 0.18-
c = 1.1 M; Qair = 14 L/min; v = 40 mm/s; 1 pass−2.72 ± 0.431.17 ± 0.696.02 ± 0.596.74 ± 0.6719%
c = 1.1 M; Qair = 14 L/min; v = 40 mm/s; 2 passes−2.39 ± 0.271.35 ± 0.425.48 ± 0.706.16 ± 0.5226%
c = 1.1 M; Qair = 17 L/min; v = 40 mm/s; 1 pass−2.68 ± 0.051.33 ± 0.255.67 ± 0.326.41 ± 0.2123%
c = 1.8 M; Qair = 17 L/min; v = 40 mm/s; 1 pass−1.31 ± 0.370.37 ± 0.535.31 ± 0.115.51 ± 0.0834%
c = 1.8 M; Qair = 17 L/min; v = 30 mm/s; 1 pass−1.08 ± 0.750.49 ± 0.765.04 ± 0.685.25 ± 0.5837%
c = 1.8 M; Qair = 14 L/min; v = 30 mm/s; 3 passes0.05 ± 1.62−0.18 ± 0.542.95 ± 0.093.19 ± 0.0361%
Publisher’s Note: MDPI stays neutral with regard to jurisdictional claims in published maps and institutional affiliations.

