
Comparison and Selection of Data Processing Methods for the Application of Cr3+ Photoluminescence Piezospectroscopy to Thermal Barrier Coatings


Abstract
:
1. Introduction
2. Materials and Experiments
3. Models and Methods
3.1. The Theoretical Model of Cr3+ Photoluminescence Piezospectroscopy
3.2. Data Processing Methods
4. Results and Discussion
4.1. Results of the Numerical Experiments
4.2. Results of the Calibration Experiments
4.3. Discussion
- The fitting results show that the Psd-Voigt function is not sensitive enough to small stress when fitting the Cr3+ photoluminescence spectrum, even though its GOF is relatively high. Both Gaussian and Lorentzian functions can accurately identify the peak shifts corresponding to different stresses.
- The unilateral pursuit of Psd-Voigt function fitting process is to achieve a GOF that is as high as possible by adjusting the Lorentzian–Gaussian weight ratio, which has no physical meaning. Due to the loss of a unified standard for mutual comparison, the Psd-Voigt function is insensitive and inaccurate for stress analysis.
- The applicability of any fitting function to spectral analysis is determined by the generation mechanism of the spectrum. The line type of the Cr3+ fluorescence characteristic peak was more similar to the Lorentzian line type because of the single mechanism of fluorescence generation, which is confirmed by the fitting phenomena and the results.
- Comparatively speaking, Lorentzian fitting is proven to be the most applicable method.
5. Conclusions
Author Contributions
Funding
Institutional Review Board Statement
Informed Consent Statement
Data Availability Statement
Conflicts of Interest
References
- Clarke, D.R.; Oechsner, M.; Padture, N.P. Thermal-barrier coatings for more efficient gas-turbine engines. MRS Bull. 2012, 37, 891–899. [Google Scholar] [CrossRef] [Green Version]
- Hardwicke, C.U.; Lau, Y.C. Advances in thermal spray coatings for gas turbines and energy generation: A review. J. Therm. Spray Technol. 2013, 22, 564–576. [Google Scholar] [CrossRef]
- Clarke, D.R.; Phillpot, S.R. Thermal barrier coating materials. Mater. Today 2005, 8, 22–29. [Google Scholar] [CrossRef]
- Jiang, P.; Fan, X.; Sun, Y. Bending-driven failure mechanism and modelling of double-ceramic-layer thermal barrier coating system. Int. J. Solids Struct. 2017, 130, 11–20. [Google Scholar] [CrossRef]
- Miller, R.A. Oxidation-based model for thermal barrier coating life. J. Am. Ceram. Soc. 1984, 67, 517–521. [Google Scholar] [CrossRef]
- Widjaja, S.; Limarga, A.M.; Yip, T.H. Modeling of residual stresses in a plasma-sprayed zirconia/alumina functionally graded-thermal barrier coating. Thin Solid Films 2003, 434, 216–227. [Google Scholar] [CrossRef]
- Padture, N.P. Thermal barrier coatings for gas-turbine engine applications. Science 2002, 296, 280–284. [Google Scholar] [CrossRef] [PubMed]
- Wellman, R.G.; Nicholls, J.R. Erosion, corrosion and erosion–corrosion of EB PVD thermal barrier coatings. Tribol. Int. 2008, 41, 657–662. [Google Scholar] [CrossRef] [Green Version]
- Evans, H.E. Oxidation failure of TBC systems: An assessment of mechanisms. Surf. Coat. Technol. 2011, 206, 1512–1521. [Google Scholar] [CrossRef]
- Bengtsson, P.; Persson, C. Modelled and measured residual stresses in plasma sprayed thermal barrier coatings. Surf. Coat. Technol. 1997, 92, 78–86. [Google Scholar] [CrossRef]
- Jiang, P.; Fan, X.; Sun, Y. Thermal-cycle dependent residual stress within the crack-susceptible zone in thermal barrier coating system. J. Am. Ceram. Soc. 2018, 101, 4256–4261. [Google Scholar] [CrossRef]
- Guo, H.; Kuroda, S.; Murakami, H. Microstructures and properties of plasma-sprayed segmented thermal barrier coatings. J. Am. Ceram. Soc. 2006, 89, 1432–1439. [Google Scholar] [CrossRef]
- Civera, M.; Fragonara, L.Z.; Surace, C. An experimental study of the feasibility of phase-based video magnification for damage detection and localisation in operational deflection shapes. Strain 2020, 56, e12336. [Google Scholar] [CrossRef]
- Lima, C.R.C.; Dosta, S.; Guilemany, J.M. The application of photoluminescence piezospectroscopy for residual stresses measurement in thermally sprayed TBCs. Surf. Coat. Technol. 2017, 318, 147–156. [Google Scholar] [CrossRef]
- Sohn, Y.H.; Schlichting, K.; Vaidyanathan, K. Nondestructive evaluation of residual stress for thermal barrier coated turbine blades by Cr3+ photoluminescence piezospectroscopy. Metall. Mater. Trans. A 2000, 31, 2388–2391. [Google Scholar] [CrossRef]
- Selcuk, A.; Atkinson, A. The evolution of residual stress in the thermally grown oxide on Pt diffusion bond coats in TBCs. Acta Mater. 2003, 51, 535–549. [Google Scholar] [CrossRef]
- Chen, C.; Guo, H.; Gong, S. Sintering of electron beam physical vapor deposited thermal barrier coatings under flame shock. Ceram. Int. 2013, 39, 5093–5102. [Google Scholar] [CrossRef]
- Ma, Q.; Clarke, D.R. Stress measurement in single-crystal and polycrystalline ceramics using their optical fluorescence. J. Am. Ceram. Soc. 1993, 76, 1433–1440. [Google Scholar] [CrossRef]
- Christensen, R.J.; Lipkin, D.M.; Clarke, D.R. Nondestructive evaluation of the oxidation stresses through thermal barrier coatings using Cr3+ piezospectroscopy. Appl. Phys. Lett. 1996, 69, 3754–3756. [Google Scholar] [CrossRef] [Green Version]
- Nychka, J.A.; Clarke, D.R. Damage quantification in TBCs by photo-stimulated luminescence spectroscopy. Surf. Coat. Technol. 2001, 146, 110–116. [Google Scholar] [CrossRef]
- Schlichting, K.W.; Vaidyanathan, K.; Sohn, Y.H.; Jordan, E.H.; Gell, M.; Padture, N.P. Application of Cr3+ photoluminescence piezo-spectroscopy to plasma-sprayed thermal barrier coatings for residual stress measurement. Mater. Sci. Eng. A 2000, 291, 68–77. [Google Scholar] [CrossRef]
- Shen, Z.; Zhong, B.; He, L.; Xu, Z.; Mu, R.; Huang, G. LaZrCeO/YSZ TBCs by EB-PVD: Microstructural evolution, residual stress and degradation behavior. Mater. Chem. Front. 2019, 3, 892–900. [Google Scholar] [CrossRef]
- Jiang, P.; Yang, L.; Sun, Y.; Li, D.; Wang, T. Nondestructive measurements of residual stress in air plasma-sprayed thermal barrier coatings. J. Am. Ceram. Soc. 2020. [Google Scholar] [CrossRef]
- Clarke, D.R.; Christensen, R.J.; Tolpygo, V. The evolution of oxidation stresses in zirconia thermal barrier coated superalloy leading to spalling failure. Surf. Coat. Technol. 1997, 94–95, 89–93. [Google Scholar] [CrossRef]
- Selcuk, A.; Atkinson, A. Analysis of the Cr3+ luminescence spectra from thermally grown oxide in thermal barrier coatings. Mater. Eng. 2002, 335, 147–156. [Google Scholar] [CrossRef]
- Manero, A.; Selimov, A.; Wischek, J.; Fouliard, Q.; Meid, C. Piezospectroscopic evaluation and damage identification for thermal barrier coatings subjected to simulated engine environments. Surf. Coat. Technol. 2017, 323, 30–38. [Google Scholar] [CrossRef]
- Zhu, W.; Zhang, Z.B.; Yang, L.; Zhou, Y.C.; Wei, Y.G. Spallation of thermal barrier coatings with real thermally grown oxide morphology under thermal stress. Mater. Des. 2018, 146, 180–193. [Google Scholar] [CrossRef]
- Wei, Z.Y.; Cai, H.N.; Li, C.J. Comprehensive dynamic failure mechanism of thermal barrier coatings based on a novel crack propagation and TGO growth coupling model. Ceram. Int. 2018, 44, 22556–22566. [Google Scholar] [CrossRef]
- Wei, Z.Y.; Cai, H.N.; Meng, G.H.; Tahir, A.; Zhang, W.W. An innovative model coupling TGO growth and crack propagation for the failure assessment of lamellar structured thermal barrier coatings. Ceram. Int. 2019, 46, 1532–1544. [Google Scholar] [CrossRef]
- Fabisiak, K.; Los, S.; Paprocki, K.; Szybowicz, M.; Dychalska, A. Orientation dependence of cathodoluminescence and photoluminescence spectroscopy of defects in chemical-vapor-deposited diamond microcrystal. Materials 2020, 13, 5446. [Google Scholar] [CrossRef]
- Sonntag, J.; Li, J.; Plaud, A.; Loiseau, A.; Barjon, J.; Edgar, J.H.; Stampfer, C. Excellent electronic transport in heterostructures of graphene and monoisotopic boron-nitride grown at atmospheric pressure. 2D Mater. 2020, 7, 031009. [Google Scholar] [CrossRef] [Green Version]
- Zhao, S.; Ren, Z.; Zhao, Y.; Xu, J.; Zou, B.; Hui, Y.; Zhu, L.; Zhou, X.; Cao, X. The application of Eu3+ photoluminescence piezo-spectroscopy in the LaMgAl11O19/8YSZ:Eu double-ceramic-layer coating system. J. Eur. Ceram. Soc. 2015, 35, 249–257. [Google Scholar] [CrossRef]
- Li, Q.; Qiu, W.; Tan, H.; Guo, J.; Kang, Y. Micro-Raman spectroscopy stress measurement method for porous silicon film. Opt. Lasers Eng. 2010, 48, 1119–1125. [Google Scholar] [CrossRef]
- Xu, C.; Xue, T.; Qiu, W.; Kang, Y. Size effect of the interfacial mechanical behavior of graphene on a stretchable substrate. ACS Appl. Mater. Interfaces 2016, 8, 27099–27106. [Google Scholar] [CrossRef] [PubMed]
- Lei, Z.K.; Kang, Y.L.; Cen, H.; Hu, M.; Qiu, Y. Residual stress on surface and cross-section of porous silicon studied by micro-Raman spectroscopy. Chin. Phys. Lett. 2005, 22, 984–986. [Google Scholar] [CrossRef]
- Qiu, W.; Cheng, C.L.; Liang, R.R.; Zhao, C.W.; Lei, Z.K.; Zhao, Y.C.; Ma, L.L.; Xu, J.; Fang, H.J.; Kang, Y.L. Measurement of residual stress in a multi-layer semiconductor heterostructure by micro-Raman spectroscopy. Acta Mech. Sin. 2016, 32, 805–812. [Google Scholar] [CrossRef]
- Dou, W.; Xu, C.; Guo, J.; Du, H.; Qiu, W.; Xue, T.; Kang, Y.; Zhang, Q. Interfacial mechanical properties of double-layer graphene with consideration of the effect of stacking mode. ACS Appl. Mater. Interfaces 2018, 10, 44941–44949. [Google Scholar] [CrossRef]
- Qiu, W.; Ma, L.; Li, Q.; Xing, H.; Cheng, C.; Huang, G. A general metrology of stress on crystalline silicon with random crystal plane by using micro-Raman spectroscopy. Acta Mech. Sin. 2018, 34, 1095–1107. [Google Scholar] [CrossRef]
- Syassen, K. Ruby under pressure. High Pressure Res. 2008, 28, 75–126. [Google Scholar] [CrossRef]
- Moss, S.C.; Newnham, R. The chromium position in ruby. Z. Kris. 1964, 120, 359–363. [Google Scholar] [CrossRef]
- Grabner, L. Spectroscopic technique for the measurement of residual stress in sintered Al2O3. J. Appl. Phys. 1978, 49, 580–583. [Google Scholar] [CrossRef]
- Forman, R.A.; Piermarini, G.J.; Barnett, J.D.; Block, S. Pressure measurement made by the utilization of ruby sharp-line luminescence. Science 1972, 176, 284–285. [Google Scholar] [CrossRef] [PubMed]
- Piermarini, G.J.; Block, S.; Barnett, J.; Forman, R. Calibration of the pressure dependence of the R1 ruby fluorescence line to 195 kbar. J. Appl. Phys. 1975, 46, 2774–2780. [Google Scholar] [CrossRef]
- Eggert, J.H.; Goettel, K.A.; Silvera, I.F. Ruby at high pressure. I. Optical line shifts to 156 GPa. Phys. Rev. B 1989, 40, 5724–5732. [Google Scholar] [CrossRef] [PubMed]
- McClure, D.S. Optical spectra of transition-metal ions in corundum. J. Chem. Phys. 1962, 36, 2757–2779. [Google Scholar] [CrossRef]
- Sugano, S.; Tsujikawa, I. Absorption spectra of Cr3+ in Al2O3 Part B. experimental studies of the Zeeman effect and other properties of the line spectra. J. Phys. Soc. Jpn. 1958, 13, 899–910. [Google Scholar] [CrossRef]
- Fukuchi, T.; Eto, S.; Okada, M.; Fujii, T. Evaluation of applicability of compact excitation light source to detection of thermally grown oxide layer in thermal barrier coating for gas turbines. Electr. Eng. Jpn. 2015, 190, 1–8. [Google Scholar] [CrossRef]
- Wang, X.; Lee, G.; Atkinson, A. Investigation of TBCs on turbine blades by photoluminescence piezospectroscopy. Acta Mater. 2009, 57, 182–195. [Google Scholar] [CrossRef]
- Dassios, K.G.; Galiotis, C. Fluorescence studies of polycrystalline Al2O3 composite constituents: Piezo-spectroscopic calibration and applications. Appl. Phys. A Mater. 2004, 79, 647–659. [Google Scholar] [CrossRef]
- Huang, M.; Yan, H.; Chen, C.; Song, D.; Heinz, T.F.; Hone, J. Phonon softening and crystallographic orientation of strained graphene studied by Raman spectroscopy. Proc. Natl. Acad. Sci. USA 2009, 106, 7304–7308. [Google Scholar] [CrossRef] [PubMed] [Green Version]
- Sun, Y.; Li, J.; Zhang, W.; Wang, T.J. Local stress evolution in thermal barrier coating system during isothermal growth of irregular oxide layer. Surf. Coat. Technol. 2013, 216, 237–250. [Google Scholar] [CrossRef]
- Sun, Y.; Zhang, W.; Li, J.; Wang, T. Local stress around cap-like portions of anisotropically and nonuniformly grown oxide layer in thermal barrier coating system. J. Mater. Sci. 2013, 48, 5962–5982. [Google Scholar] [CrossRef]
- Sridharan, S.; Xie, L.D.; Jordan, E.H.; Gell, M. Stress variation with thermal cycling in the thermally grown oxide of an EB-PVD thermal barrier coating. Surf. Coat. Technol. 2004, 179, 286–296. [Google Scholar] [CrossRef]
- Kenyon, P.; Andrews, L.; McCollum, B.; Lempicki, A. Tunable infrared solid-state laser materials based on Cr 3+ in low ligand fields. IEEE J. Quantum Electron. 1982, 18, 1189–1197. [Google Scholar] [CrossRef]
- Zhang, W.; Li, Z.; Baxter, G.W.; Collins, S.F. Stress- and temperature-dependent wideband fluorescence of a phosphor composite for sensing applications. Exp. Mech. 2017, 57, 57–63. [Google Scholar] [CrossRef] [Green Version]


| Fitting Function | Psd-Voigt | Gaussian | Lorentzian | |
|---|---|---|---|---|
| GOF | Simulated data | 0.9994 | 0.9808 | 0.9986 |
| Measured data | 0.9991 | 0.9804 | 0.9986 | |
| ПU | R1 (cm−1/GPa) | R2 | R2 (cm−1/GPa) | R2 |
|---|---|---|---|---|
| Preset value | −1.45 | - | −1.45 | - |
| Psd-Voigt | −1.85 ± 0.16 | 0.8964 | −1.42 ± 0.17 | 0.8118 |
| Gaussian | −1.45 ± 4.68 × 10⁻⁶ | 1 | −1.46 ± 7.45 × 10⁻⁵ | 1 |
| Lorentzian | −1.45 ± 5.99 × 10⁻⁶ | 1 | −1.46 ± 7.71 × 10⁻⁶ | 1 |
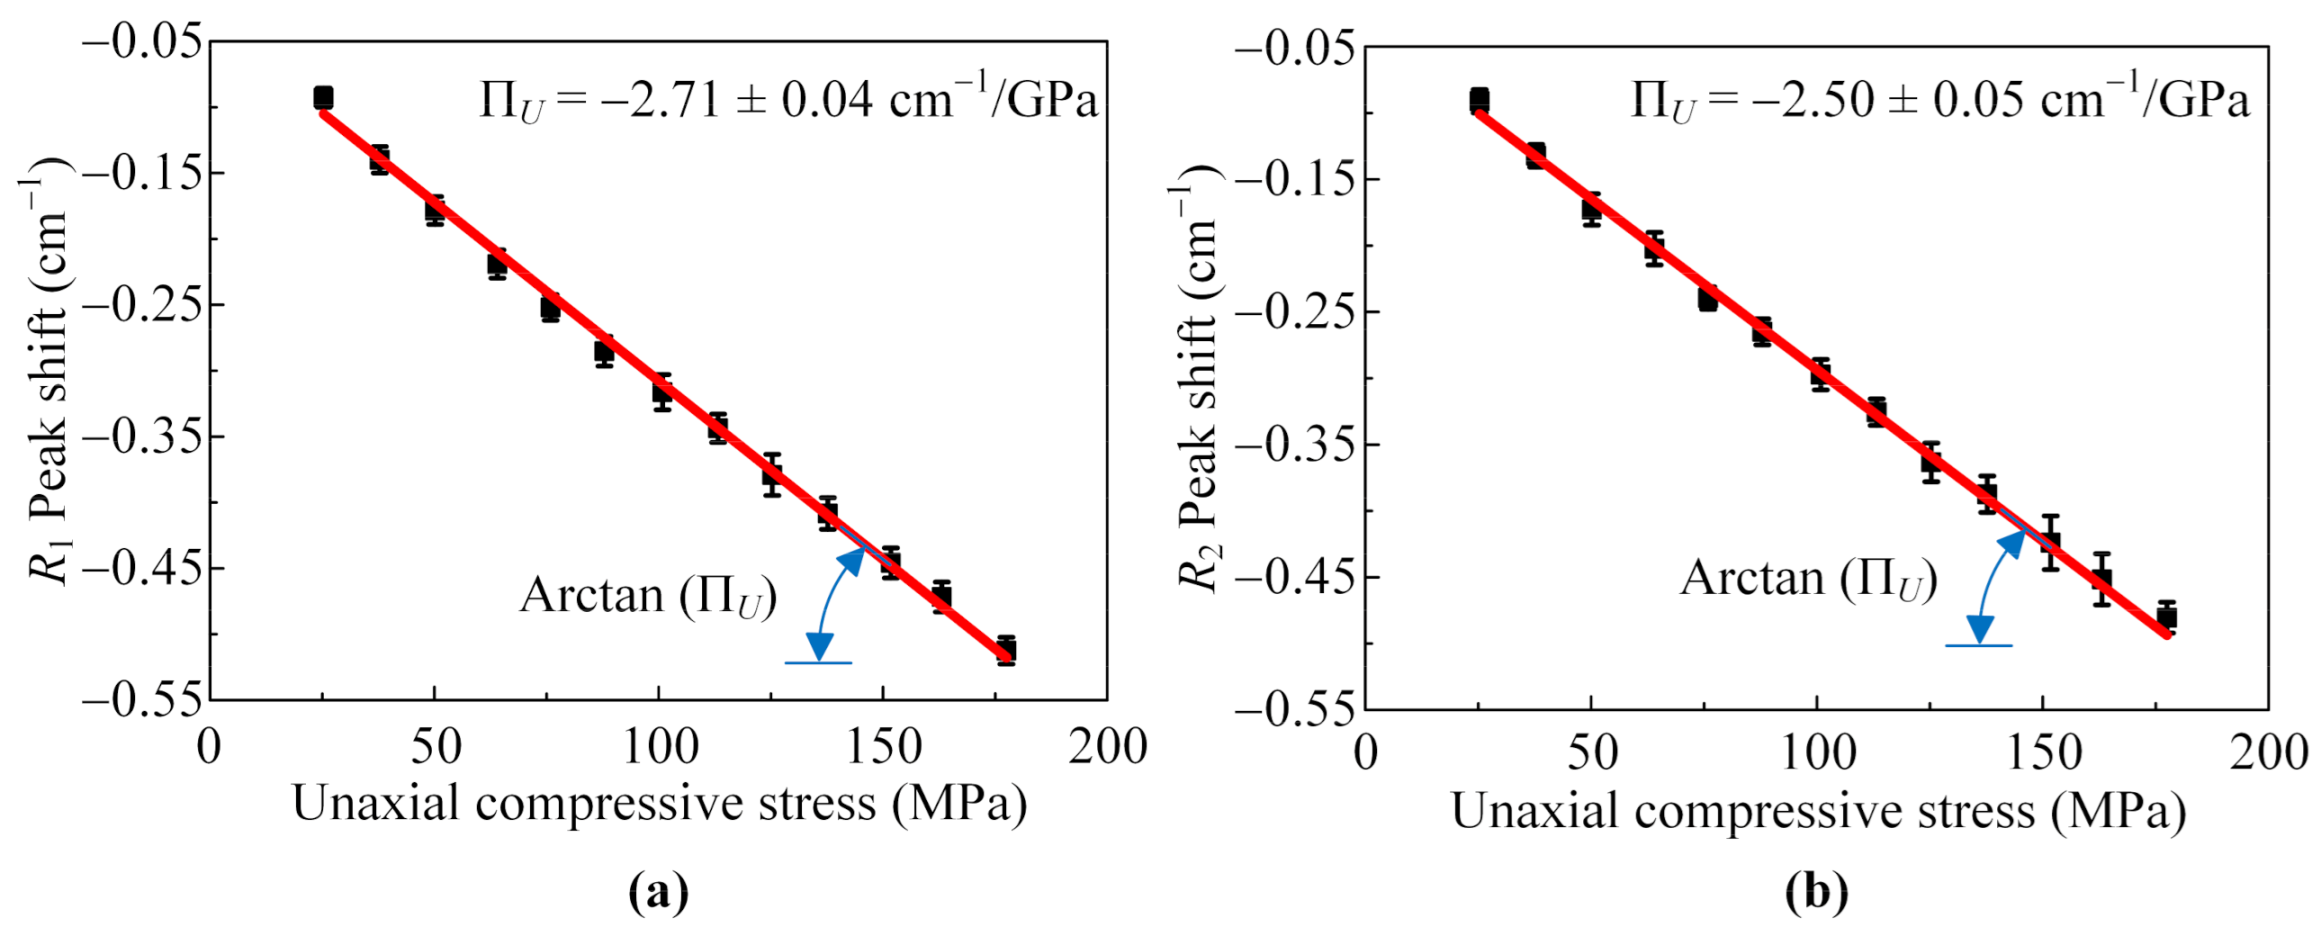
| ПU | R1 (cm−1/GPa) | R2 | R2 (cm−1/GPa) | R2 |
|---|---|---|---|---|
| Ma, 1993 [18] | −2.54 | - | −2.53 | - |
| Psd-Voigt | −2.91 ± 0.16 | 0.9684 | −2.70 ± 0.13 | 0.9732 |
| Gaussian | −2.71 ± 0.05 | 0.9969 | −2.50 ± 0.04 | 0.9966 |
| Lorentzian | −2.71 ± 0.04 | 0.9970 | −2.50 ± 0.05 | 0.9961 |
Publisher’s Note: MDPI stays neutral with regard to jurisdictional claims in published maps and institutional affiliations. |
© 2021 by the authors. Licensee MDPI, Basel, Switzerland. This article is an open access article distributed under the terms and conditions of the Creative Commons Attribution (CC BY) license (http://creativecommons.org/licenses/by/4.0/).
Share and Cite
Lu, N.; Zhang, Y.; Qiu, W. Comparison and Selection of Data Processing Methods for the Application of Cr3+ Photoluminescence Piezospectroscopy to Thermal Barrier Coatings. Coatings 2021, 11, 181. https://doi.org/10.3390/coatings11020181
Lu N, Zhang Y, Qiu W. Comparison and Selection of Data Processing Methods for the Application of Cr3+ Photoluminescence Piezospectroscopy to Thermal Barrier Coatings. Coatings. 2021; 11(2):181. https://doi.org/10.3390/coatings11020181
Chicago/Turabian StyleLu, Ning, Yanheng Zhang, and Wei Qiu. 2021. "Comparison and Selection of Data Processing Methods for the Application of Cr3+ Photoluminescence Piezospectroscopy to Thermal Barrier Coatings" Coatings 11, no. 2: 181. https://doi.org/10.3390/coatings11020181