Article

Electrodeposition of Cu-Ag Alloy Films at n-Si(001) and Polycrystalline Ru Substrates

1
Department of Materials Science and Engineering, University of Virginia, Charlottesville, VA 22904, USA
2
MacDermid Alpha, 245 Freight Street, Waterbury, CT 06702, USA
*
Author to whom correspondence should be addressed.
Coatings 2021, 11(12), 1563; https://doi.org/10.3390/coatings11121563
Submission received: 30 November 2021 / Revised: 15 December 2021 / Accepted: 16 December 2021 / Published: 20 December 2021

Abstract

:
Electrodeposition of Cu-Ag films from acidic sulfate bath was conducted at n-Si(001) and polycrystalline Ru substrates. Significant nucleation overpotential of 0.4 V is observed with the Cu-Ag bath at n-Si(001) substrate, whereas the electrodeposition of Cu-Ag at Ru substrate is influenced by Ru oxides at the surface. Incomplete coverage of Si substrate by Cu-Ag deposit was observed from the deposition systems without Ag(I), or with 0.1 mM Ag(I), comparing with the compact Cu-Ag film obtained with the deposition bath containing 0.01 mM Ag(I). Layered and faceted Cu-Ag deposit was observed at small Cu deposition overpotential with the Ru substrate. Phase composition of the Cu-Ag deposits at n-Si(001) substrate from electrolyte with various Ag(I) concentrations is examined by XRD. Limited solubility of Ag (0.4 at.%) was observed in fcc-Cu until phase separation occurs. The classical model for nucleation kinetics in electrodeposition was used to examine the potentiostatic transients of the Cu-Ag electrodeposition at n-Si(001) substrate.

1. Introduction

Characterized by its complete immiscibility at room temperature [1], the Ag-Cu alloys have been used in fields such as bactericides [2], decorative artifacts (depletion gilding) [3,4], electrocatalysis (H2O2 reduction [5], ammonia oxidation [6], and CO as well CO2 reduction [7,8,9,10]), electrical contacts (interconnects [11], flexible electronics [12] and conductive inks [13]), sensors (electrochemical [14,15] or based on localized surface plasmon resonance [16,17,18,19]), usually in the form of nano-particles or core-shell nanowires. To the best of our knowledge, the Cu-Ag alloys have been synthesized using electron beam co-evaporation [1,20], magnetron sputtering [21], co-incipient wetness and co-impregnation [6,14], direct mixing of nanoparticles, mechanical alloying [22,23], laser ablation and irradiation [16,17], Cu electrodeposition followed by galvanic replacement with Ag [5,7,12], and electroless deposition [2,13,15,24].
Since both Ag and Cu could be easily electrodeposited, several works have used electrochemical codeposition to synthesize Ag-Cu alloys [9,10,11,18,19,25,26,27,28,29]. Among these works, ionic liquid [30], cyanide [10,11], alkaline pyrophosphate-iodide [26,28], alkaline ammonia [29], simple sulfate nitrate [18,19,25,27], or acidic baths with organic ligands [9,27] were used to electrodeposit Cu-Ag alloy. Morphology of the deposit are usually aiming for the nanoparticles or dendrites [5,9,10,18,19,25,26], while smooth Cu-Ag thin films were achieved at low electrodeposition rates [25,29]. It is worth noting that due to complete immiscibility of Cu-Ag at room temperature, unlike alloy electrodeposition system with complete miscibility (e.g., Au-Ag [31,32,33]), underpotential codeposition does not occur in the Cu-Ag electrodeposition system.
According to Budevski et al., Cu electrodeposits grow in a Frank–Van der Merwe mode at the Ag substrate under a wide range of overpotential, whereas the underpotential deposition of Cu at Ag is not well pronounced [34]. Bernasconi et al. showed the formation of Ag precipitates in the electrodeposited Cu-rich Cu-Ag alloy using transmission electron microscope (TEM), evidencing the instability of electrodeposited Cu-Ag alloy (probably due to internal stresses and spinodal phenomena [26]). Phase separation with Cu islands on top of Ag-rich phase is observed in the film electrodeposited from a simple acidic bath on Au substrates [27].
In our previous works, we have estimated the thickness/duration of the initial deposits/stage [35] and the appearance of an early Cu(II)/Cu(0) deposition peak [36]. In this work, we will investigate the CV profiles of the Cu-Ag deposition baths with Ru and n-Si(001) substrates, and characterize the phase composition and morphology of the Cu-Ag deposits.

2. Experimental

2.1. Substrates

Freshly cut Si(001) wafer pieces coated with 5 nm Ta adhesion layer and 100 nm (0001)-textured polycrystalline Ru were used as Ruthenium substrates. For Silicon substrates, H-terminated heavily doped n-Si(001) with resistivity <0.005 Ω/cm were used. Before use, the n-Si(001) wafer pieces were cleaned by methylene chloride, acetone, and ethanol for 20 min each, followed by etching in 30% HF solution for 2 min and rinsing in Milli-Q water. In-Ga solder was used to establish ohmic contact between the back-side of n-Si(001) substrate and the metallic support. The exposed are of the substrate for all experiments, is ~1 cm2.

2.2. Electrolytes

Two acidic sulfate baths were used: (1) electrolytes of 0.5 M H2SO4 + 0.3 M CuSO4 + 0~2 mM AgNO3 were used for the electrochemical measurement with Ru substrate; (2) electrolytes of 10 mM CuSO4 + 0.5 M H2SO4 + 0–0.5 mM AgNO3 were used for the electrochemical measurements with n-Si(001) substrates.

2.3. Electrochemical Setup

A 3-electrode system (self-made) with 300 mL beaker without any stirring is used for the electrochemical experiments. Working electrode (Ru or Si substrates) and anode (Pt mesh) are placed vertically with 1 cm apart. Reference electrode (Saturated mercurous sulfate, VSMSE, 0.64 V vs. SHE) was separated from the bulk deposition bath by a Luggin capillary was used as the reference electrode. EG&G PAR 273 potentiostat/galvanostat was used to control the electrode potential at the cathode during Cyclic-voltammetry (CV) measurement and potentiostatic electrodeposition. Note that n-Si(001) substrate is exposed to the background illumination of the surroundings during all electrochemical tests.

2.4. Materials Characterization

Elemental composition of the Cu-Ag films was investigated using an energy dispersion spectrometer (EDS, Oxford Instruments, Abingdon, UK) attached to a JEOL JSM-6700F field emission scanning electron microscope (FE-SEM, Field Electron and Ion Company, Hillsboro, OR, USA). Phase composition is examined with the X-ray diffraction (XRD) data collected with a Panalytical X’Pert diffractometer (Malvern Panalytical, Malvern, UK) with filtered Cu Kα (λ = 1.5418 Å) as the X-ray source. Bragg-Brentano θ–2θ geometry with film normal (a.k.a. Si(001)) as the direction of the reciprocal vectors for the diffracted planes was used for all XRD measurements [27].
The XRD profiles were evaluated using the CrystalDiffract (v6.8.2) package of the CrystalMaker (v10.4.5) suite [37,38] with the Cu Kα set as the X-ray source, supported with the crystal structures of Cu (ICSD-43493), Ag (ICSD-44387), and Si (ICSD-51688) from the ICSD databases [39]. Due to an incomplete filtering of Cu Kβ during XRD measurement, the diffraction pattern of Si was also calculated with the wavelength of Cu Kβ (λ = 1.3922 Å) [40,41].

3. Results

3.1. Cu-Ag at Ruthenium Substrates

Cu-Ag electrodeposition was firstly investigated at polycrystalline (0001)-textured Ru substrates. The CV results (starting at 0.1 VSMSE) are shown in Figure 1a [39]. Considering that some minor reactions may occur before the bulk reduction of Cu(II), the current of the cathodic branch of the CV profiles is plotted in log-scale, shown in Figure 1b.
Due to the Ru surface oxide, the open-circuit potential (OCP) of the pristine and activated Ru substrates are higher than the redox potential of Cu(II)/Cu at −0.35 VSMSE and Ag(I)/Ag at −0.03 VSMSE. Therefore, it is unfeasible to use the OCP to evaluate the onset potential of Cu or Ag deposition. A Cu-only electrolyte (black lines in Figure 1) shows several cathodic features in the scan (Figure 1b): small features at −0.35 VSMSE and −0.15 VSMSE correspond to the reduction of surface Ru-oxide; the bump at −0.5 VSMSE is also attributed to the reduction of surface Ru-oxide, whereas the majority of deposition current negative to −0.6 VSMSE corresponds to the bulk Cu(II)/Cu(0) reduction. Cu deposition and dissolution peaks are discontinuous and very close with each other’s (difference less than 0.05 V, Figure 1a), indicating that the nucleation overpotential for Cu deposition at Ru is small. When Ag(I) is added to the Cu deposition bath, an additional peak occurs at −0.2 VSMSE, corresponding to the reduction of Ag(I)/Ag. Comparing with the redox potential of Ag(I)/Ag at −0.034 V, Ag(I)/Ag reduction starts at a more negative potential, indicating the impact of oxide at Ru substrate surface on the nucleation and growth of Ag nucleus.
The SEM images of the deposits on Ru substrate are shown in Figure 2. A series of images starting at −0.38 VSMSE down to −0.85 VSMSE. At −0.38 VSMSE, the deposit is pure Ag, with a small grain size. At −0.405 VSMSE, the Ag content in the deposit is about 72%. Among these grains there are some elongated crystals. The deposits obtained at −0.42 to −0.65 VSMSE are Cu rich with at 90%–97% and large layered crystals are observed. In this potential regime, well-grown grains are seen. The grain morphology is faceted at small Cu depositions overpotentials, which is a characteristic of Cu electrodeposition [42,43,44]. Below the redox potential of the Ru surface oxide, the films are compact, with smaller grain sizes at higher deposition overpotentials. The deposit grown at −0.85 VSMSE shows a powdery morphology, seemingly evolving to a dendritic Ag-Cu film.

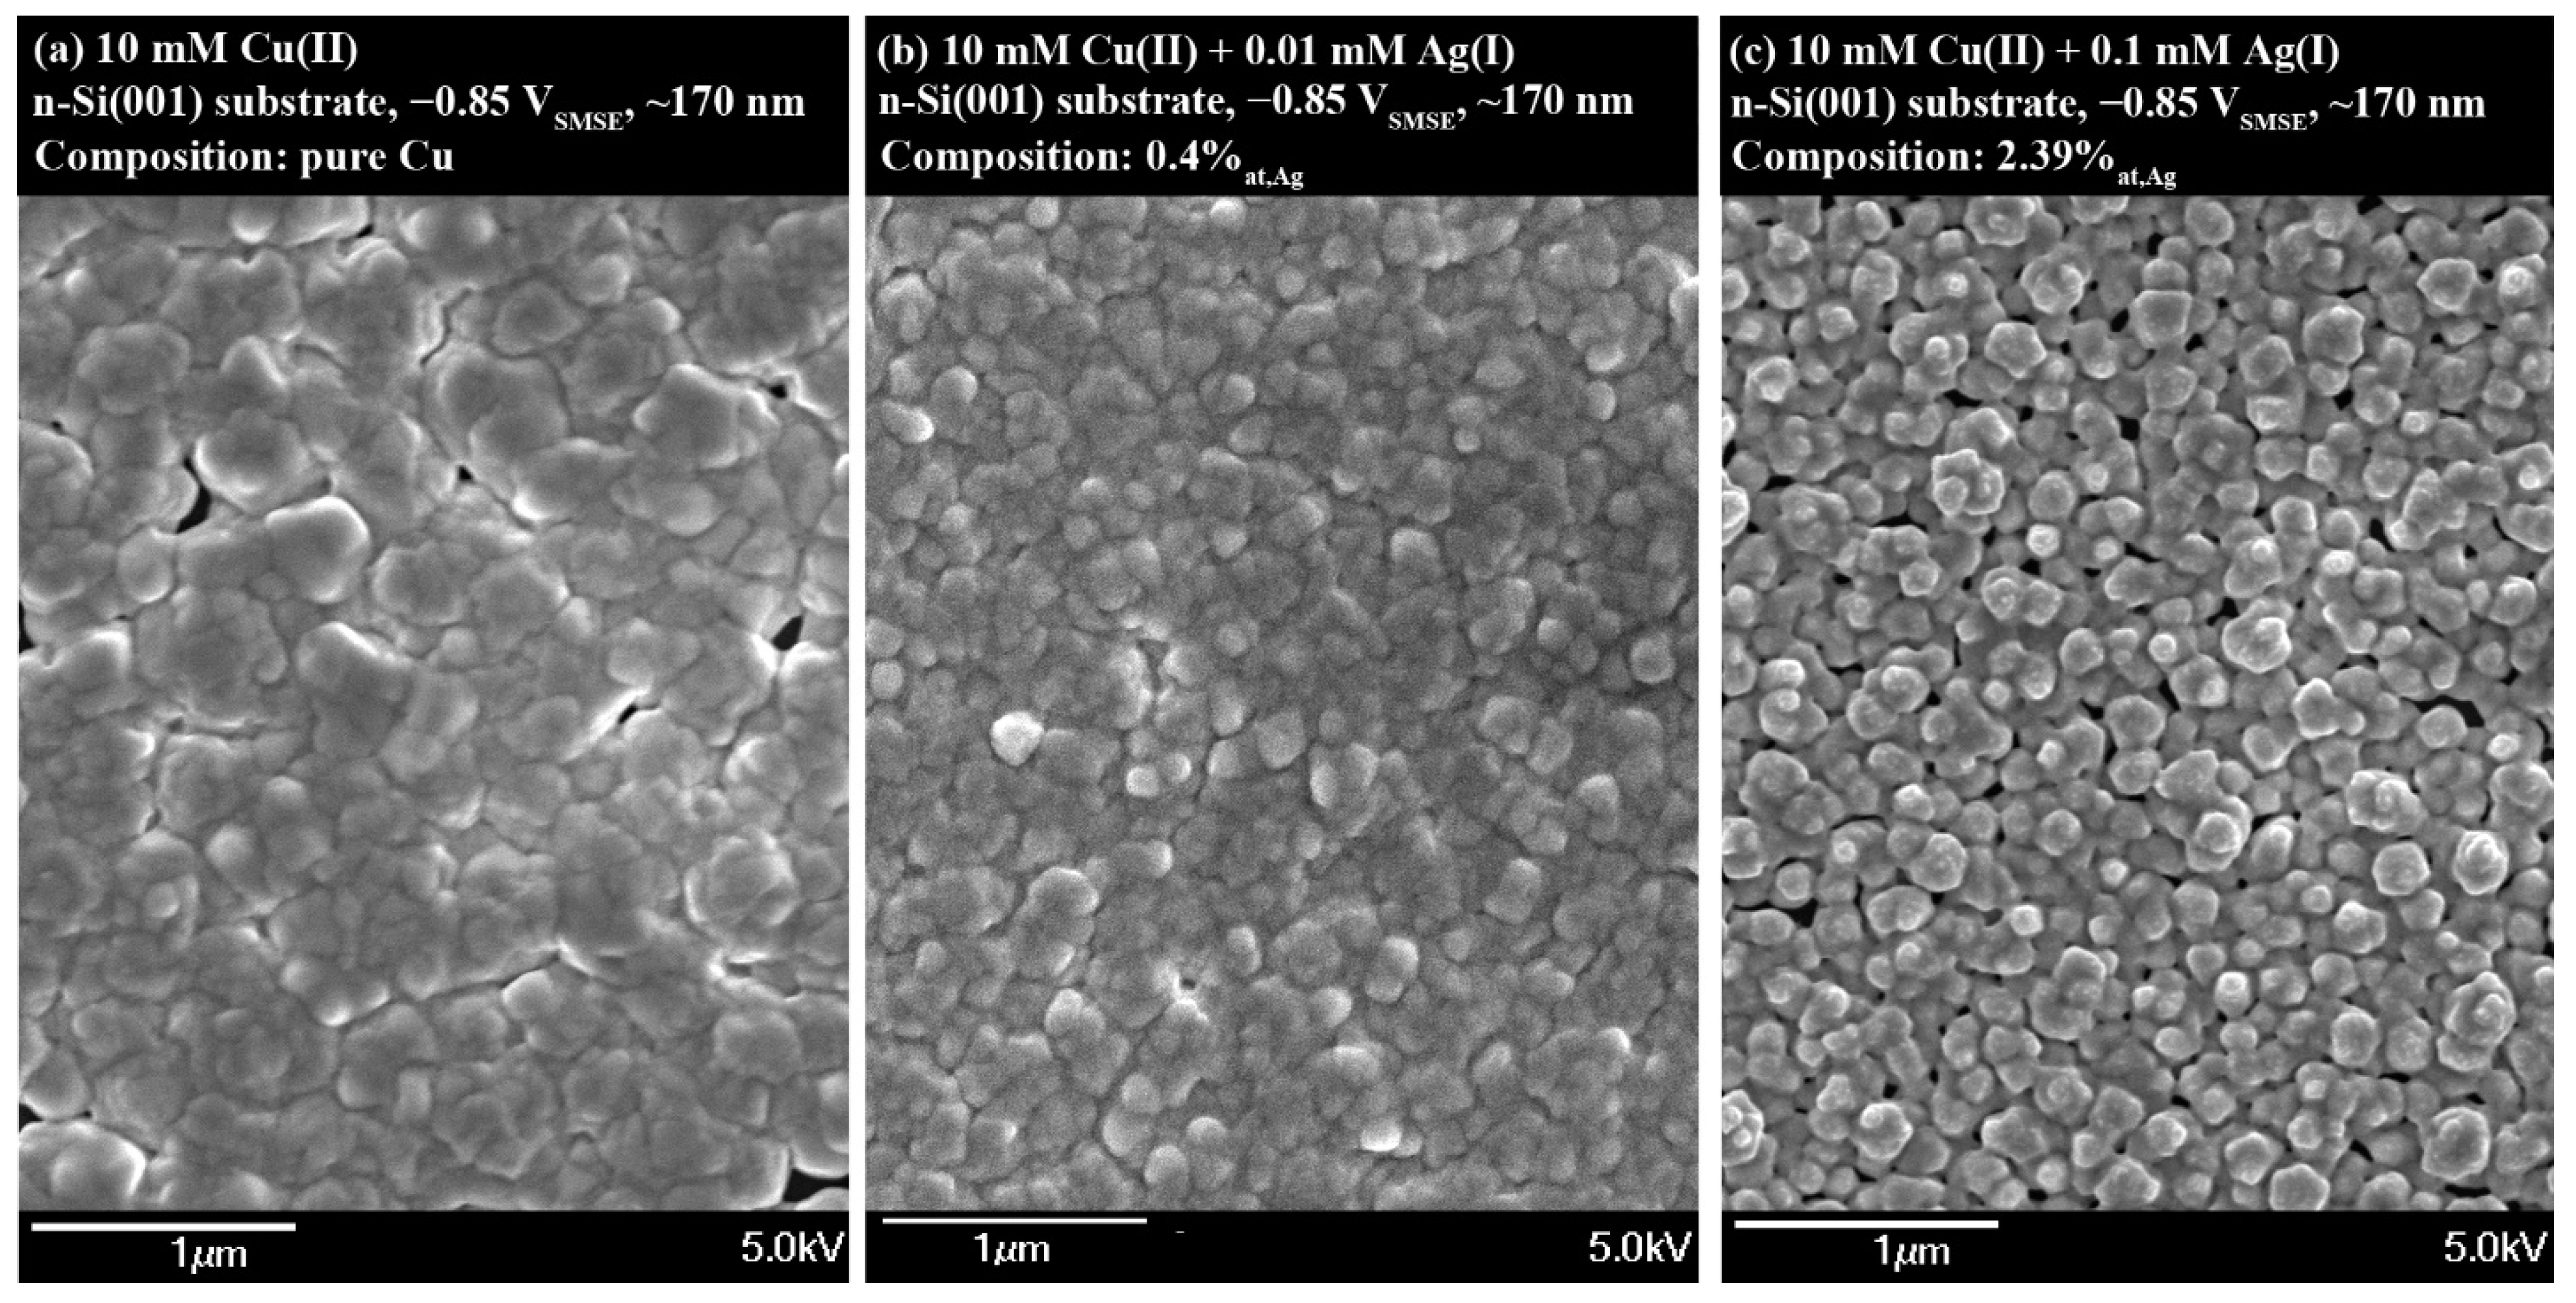
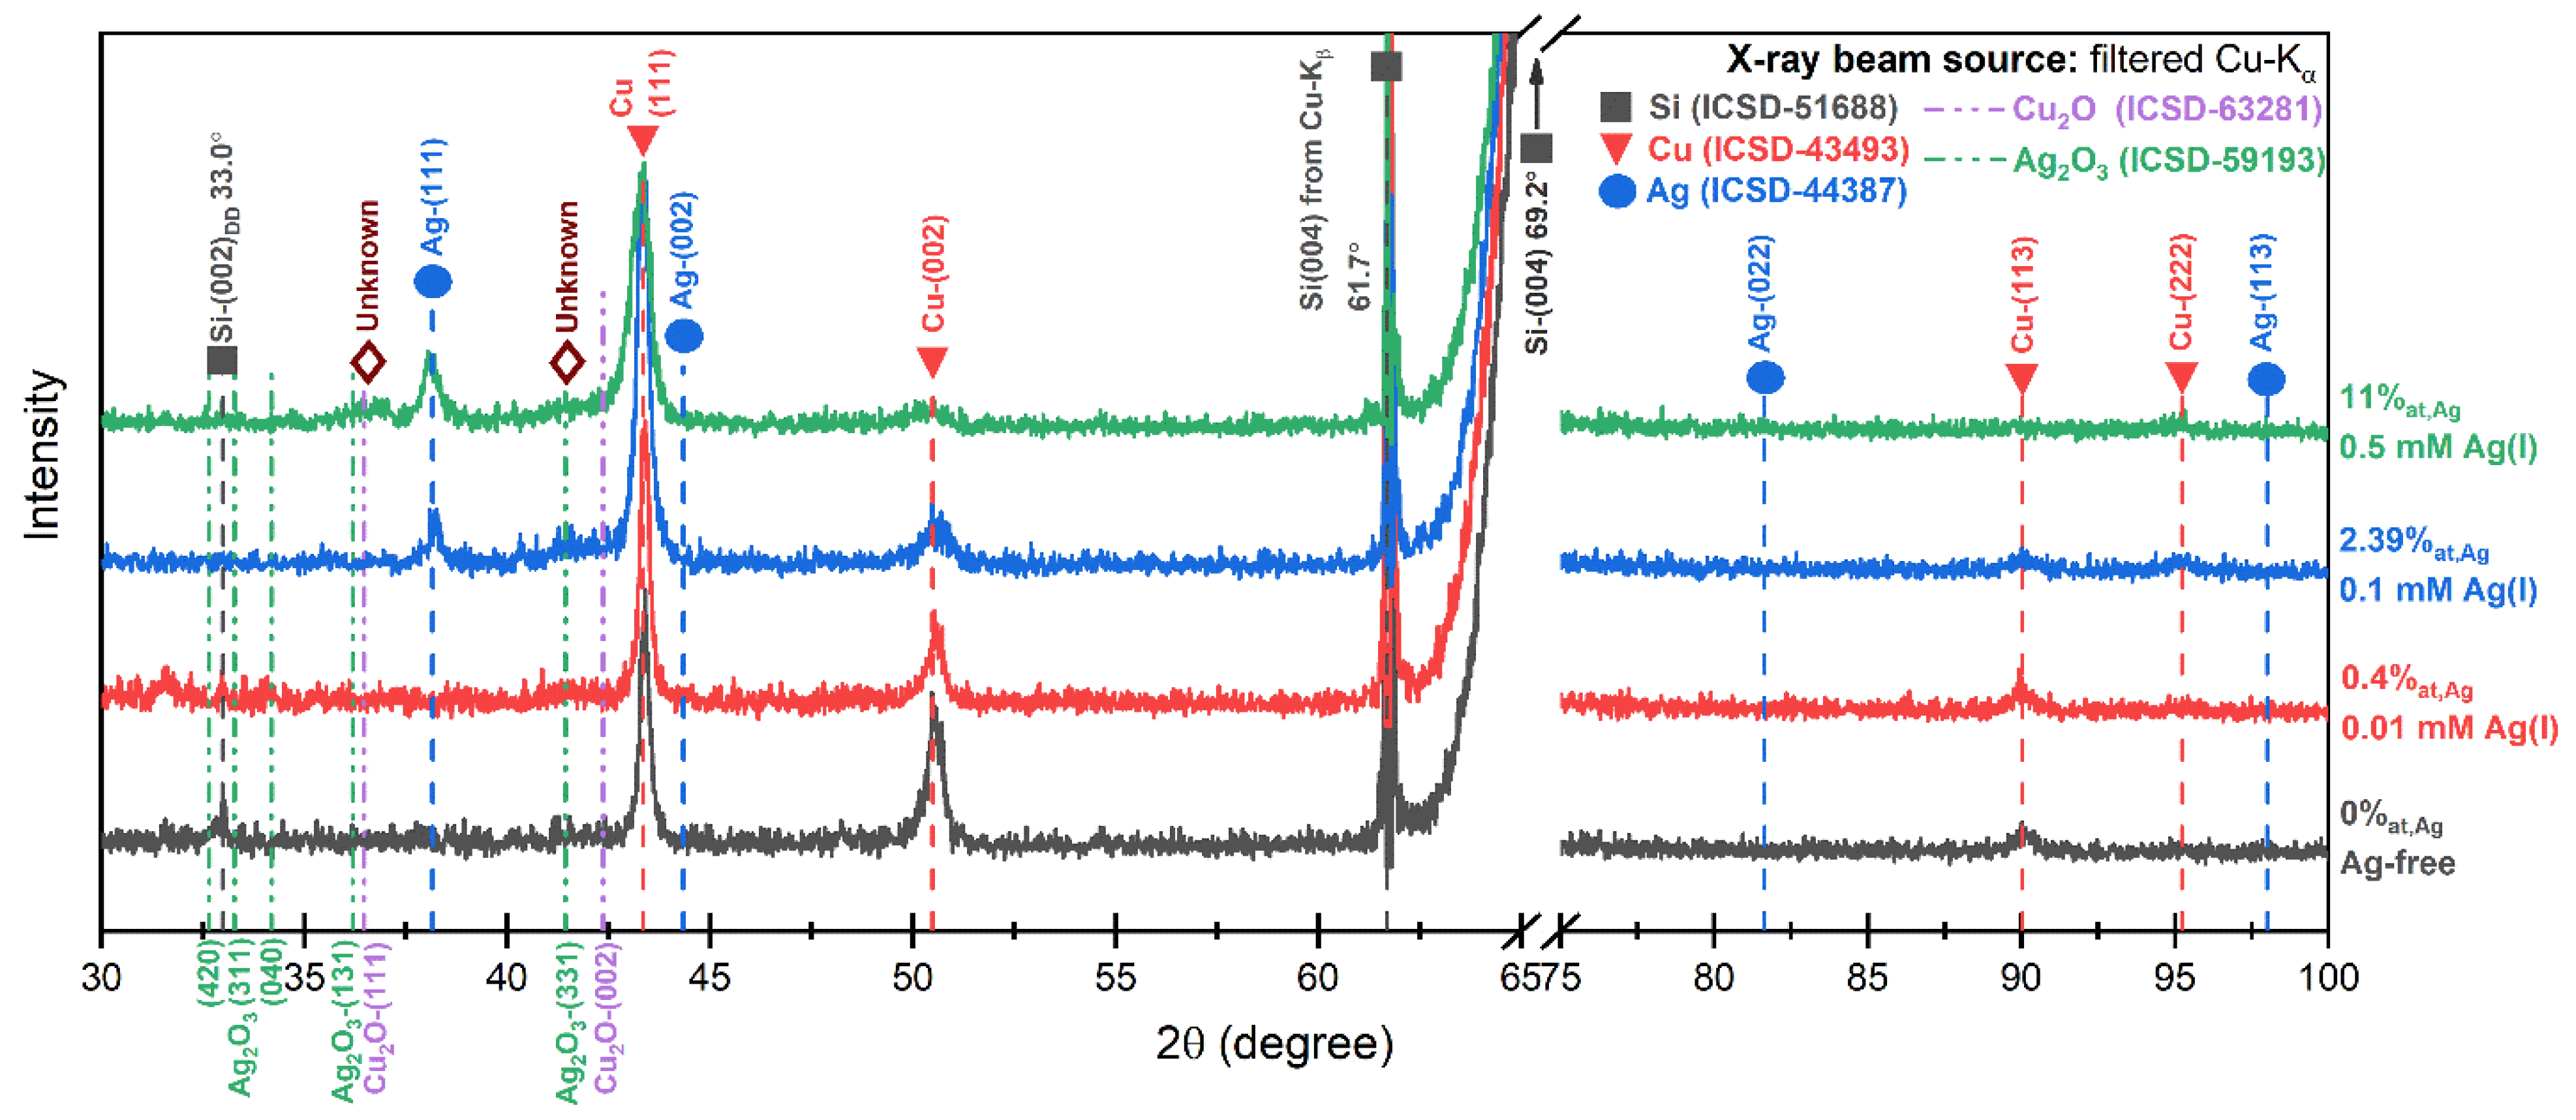
3.2. Cu-Ag at Si(001) Substrates

Electrodeposition of Ag-Cu at n-Si(001) substrate was also examined. Figure 3 presents a set of CVs profiles of 10 mM CuSO4 + 0.5 M H2SO4 + 0~0.5 mM AgNO3 electrolytes with Si(001) substrates, where both Cu and Ag depositions show sluggish nucleation rate, evidenced by their large nucleation overpotentials. The CV profile in the Cu-only electrolyte shows a reduction peak with the largest overpotential, followed in order by electrolytes added with 0.01 mM, 0.5 mM, 0.1 mM or 0.05 mM Ag+. The large Cu deposition overpotential (~0.25 V) could be caused by (1) the Cu nucleation overpotential, due to the poor wettability of Cu nuclei at n-Si(001) substrate, or (2) the flat-band potential of n-Si(001), probably limiting the electron flow, which is required for the accumulation of electrons at the surface of n-Si substrate and thus the reduction of the Cu(II) in the electrolyte, at the metal/semiconductor interface [45].
The Ag reduction starts at −0.3 VSMSE, becoming stronger when Ag(I) concentration is increased. The Cu(II)/Cu(0) reduction is depolarized following the addition of a small amount of AgNO3. The degree of depolarization does not show a monotonic trend with respect to the concentration of Ag(I). Such depolarization is due to the AgNO3 and is cannot be predicted by thermodynamics, because Cu-Ag shows a large positive heat of mixing (ΔHmix(Cu-Ag) > 0), which would result in a positive shift of the reduction potential, opposite to the experimental data. We suspect that this behavior is related to the area of the deposit/electrolyte interface: high Ag concentration may lead to form large and dispersed Ag grains due to secondary nucleation (since adatom diffusivity of Ag is very fast), whereas at low Ag concentration the reduced Cu could stabilize the small Ag nuclei. In addition, catalytic effect of Ag on the Cu(II)/Cu(I) step of the Cu electrodeposition may also lead to the depolarized Cu(II) reduction peak [36].
In the returning anodic scan of Cu-Ag bath at n-Si(001) substrate, the integral of the Cu dissolution peak is much less than the forward one (tabulated in the insert table of Figure 3). With a Cu-only deposition bath at n-Si(001), based on the CV profile, the anodic scan show only 8.2% deposited Cu (estimated by the thicknesses in Figure 3) is oxidized and dissolved. Adding Ag(I) into Cu deposition bath significantly weakens the Cu dissolution peak: with 0.5 mM Ag(I) in the 10 mM CuSO4 deposition bath, only 0.68% Cu is retrieved in the anodic scan of the CV test.
The onset of hydrogen evolution reaction (HER) occurs around −1.07 VSMSE, indicating a significant overpotential (~0.35 V) for HER. This might be due to the sluggish HER at Cu deposits [46,47,48,49].
Figure 4 shows the SEM images of the films. The film does not fully cover the Si substrate, indicating poor wettability of the metallic deposit at the Si substrate. The decrement in grain size with higher [Ag+] is clearly observed: Without Ag(I), the films show apparent crystal size of the order of 0.5 µm, while the addition of Ag(I) decreases the apparent grain size down to 0.2–0.3 µm. This could imply an increased nucleus density at the initial stage of the deposition when Ag(I) is present. However, it is also possible that Ag precipitates act as barrier for growth of Cu grains, resulting in a smaller grain size [25,50].
The XRD patterns of the films are shown in Figure 5. It is found that Ag solubility is about 1 at.% using Vegard’s law, higher than 0.08 at.% in the Cu-Ag phase diagram at room temperature [1], showing that Cu-Ag deposit forms a super-saturated solid solution. Ag precipitates out when the concentration of AgNO3 is 0.1 mM or higher. The alloy Bragg peaks consistently shift in 2θ as the Ag content increased, indicating that the lattice parameter increases with higher Ag content, as shown indeed in Figure 5.
With single crystal Si(001) substrates, some forbidden diffractions will occur due to the usually negligible phenomenon of multi-diffraction [51]. The reciprocal vector of the multi-diffracted plane is the sum of these allowed diffractions. The Si(002) peak at 2θ = 33° reflects this phenomenon. The unexplained peak at 2θ = 62° from the substrate, stated in our previous works, is actually Si(004), but with the Cu Kβ X-ray as the X-ray source, a small portion of Cu Kβ will leak through the X-ray filter in the diffractometer with Cu Kα source. Combining with extremely high structural factor of single crystal Si(004) diffraction, the Cu Kβ peak of Si(004) is visible alongside its Cu Kα peak [40,41].
Two unknown, small XRD peaks are located at 2θ = 36.6° and 41.4°. We attempted to fit these two peaks with simple crystal structures, but without success. The peak at 37° overlaps with the (111) peak of Cu2O (purple vertical lines). However, as a derivative of an fcc structure, the (200) peak of Cu2O misses the observed peak at 41°. Another notable candidate for the two peaks is textured Ag2O3 (green vertical lines), as the peaks increase with increasing Ag fraction in the film. Both Cu2O and Ag2O3 phases show noticeable deviation from the observed profile.

4. Discussion

4.1. Cu Dissolution Peak at n-Si(001)

Initially, the decreasing of the Cu dissolution peak in the anodic branch of CV scan (Figure 3) with n-Si(001) substrate was interpreted in terms of the passivation of Cu deposits by cementing of nobler residual Ag. However, the CV profile of similar Cu-Ag bath at Ru or Au substrate [36] shows a significant amount of charge passed during deposition and dissolution of Cu peaks (Figure 1). Furthermore, the CV profile of the Cu-only electrolyte at n-Si(001) substrate (without any Ag in the deposition system) also shows a strong decreasing of Cu dissolution peak at the returning anodic scan. Therefore, the Ag cementation is not the dominant cause for the decreasing of Cu dissolution peak in Figure 3.
Hindrances during Cu dissolution may also be caused by the positive Schottky barrier between deposited Cu and the n-Si(001) [52,53]. Complete suppression of Cu dissolution peak in the anodic scan was observed by Oskam et al. and Krumm et al. with lightly doped n-Si substrates (1–10 Ω/cm) tested in the dark [45,54]. However, rather than a completely disappeared Cu dissolution current, our result (Figure 3) shows a weak Cu dissolution peak in the anodic scan with n-Si(001) substrate, similar to several other works [55,56]. This behavior is caused by the illumination on the n-Si(001) substrate during deposition [54]: Muñoz et al. observed that illuminating the lightly doped n-Si(001) substrate may lead to the appearance of Cu dissolution peak in the anodic scan [49]. The doping level and surface chemistry (impacted by n-Si substrate preparation method) [57,58] might also impact the structure of Schottky barrier.
Thus, we consider that this decrease of the Cu dissolution peak would be originated by Cu deposits detachment from the Si substrate, related to the poor wettability of Cu grains at Si(001) substrate [59]. The Cu-electrolyte interface energy (~73 mJ/m2 [60] or <90° wetting angle [61]) has smaller surface energy than the Cu-Si substrate (>1 J/m2 with Si(111) [62]). Therefore, Cu atoms at higher energy region close to Cu-Si interface (bottom of the Cu particles) would dissociate faster than the rest of the Cu particle. When the contact between Cu and Si substrate is lost, the remaining particles will drop to the electrolyte, which causes lost in the amount of Cu that is electrochemically dissolved in the anodic scan. Furthermore, when Ag is presented, due to the immiscibility of Ag in Cu, the energy of Cu at the Cu-Si interface will be furtherly increased, and thus more Cu particles detach the substrate during the reverse anodic scan.

4.2. Nucleation Kinetics at Initial Stage of CuAg at n-Si(001)

The classical model for nucleation (quasi-steady state hemispherical diffusion field around each nucleus + a nucleation kinetics) is suitable for the potentiostatic transient before the significant overlapping of diffusion zones from different nuclei [63,64,65]. According to the classical model, we assume a hemispherical growth for individual nucleus, where the slope of these linear regions could indicate the nucleation rate I(t) of the electrodeposition system:
J ( t ) zF = 2 3 π ( 2 D i C i 0 ) 3 / 2 V m 1 / 2 t 1 / 2 · 0 t   I ( t ) d τ
For the scenarios of constant nucleation rate (progressive nucleation, I(t) = AηN), and constant nucleation density (instantaneous nucleation, I(t) = Nδ(t)), we have the potentiostatic transient from the classical models:
Progressive nucleation : J ( t ) zF = 2 3 π A η N ( 2 D i C i 0 ) 3 / 2   · ( V m ) 1 / 2 t 3 / 2     t 3 / 2 Instantaneous nucleation : J ( t ) zF = π N ( 2 D i C i 0 ) 3 / 2   · ( V m t ) 1 / 2     t 1 / 2
Note that z is the average charge transferred for depositing one atom of Ag-Cu alloy, Vm is the molar volume of the deposit, N is a constant related to nucleation density, and Aη is a constant related to the statistical frequency for nucleating at one given nucleation site.
Plotting potentiostatic transients in log-log fashion (Figure 6), we can directly observe the nucleation kinetics by checking the slopes of the linear regions. The fitting results with the potentiostatic transient of Cu-only electrolyte show that the system follows a time dependence of t0.75, which implies a nucleation rate I(t)∝t−0.75. On the contrary, the linear region of the potentiostatic transient with Cu-Ag bath shows a time dependence (t0.30), which implies a nucleation rate I(t)∝t−1.2.

4.3. Impact of Nucleation Kinetics on the Cu-Ag Morphology

Electrodeposition of Cu-Ag at both Ru (passivated by surface oxides) and Si (with weak interaction between Si and metals) substrates. At lower deposition overpotential, a compact Ag-rich film is achieved. This phenomenon could be caused by the dense Ag nuclei in the initial stage of electrodeposition, since the Ag(I)/Ag(0) reduction is under a very large deposition overpotential (>0.3 V) which could lead to rapid Ag nucleation kinetics. However, the film deposited at more negative applied potential (−0.42 VSMSE) shows a layered structure. Considering the complete immiscibility of Cu and Ag in the phase diagram, nucleation of Cu-rich phase at the Ag-rich initial deposit can be difficult. The difficulty of nucleation of the Cu-rich phase, combining with the low deposition kinetics of Cu due to small deposition overpotential of 0.1 V, could cause difficulty in the Cu(II) reduction and shorten the life-time of Cu(0) adatoms at the exposed fraction of the Ag-rich phase, especially when Cu(II) could be easily reduced and incorporated at the as-formed Cu deposits. The faceted grains also imply the limited nucleation density of Cu-rich deposit at Ag-rich initial deposit, since the earlier Cu(111) deposits are able to expand with great advantage and incorporated the newly formed small nuclei via secondary nucleation. At higher deposition overpotentials, the nucleation density of Cu-rich phase at the Ag-rich initial deposit is high, so that these Cu nuclei is able to expand and cover the entire substrate in their lateral growth.
On the other hand, incomplete coverage of the n-Si(001) substrate is still observable at a deposition overpotential of 0.4 V. Despite the very negative deposition overpotential the system is capable to accumulate more electrons in the conduction band of the n-Si(001) substrate. The hindrance in the interaction between Si and Cu adatom leads to sluggish nucleation kinetics of Cu and slower growth rate of each Cu grain along the Si substrate. From Figure 4, adding 0.01 mM Ag(I) leads to a fully covered Si substrate with Cu deposits. This phenomenon could be caused by the enhancement of Cu nucleation with rapidly formed Ag nuclei at the n-Si(001) substrate during the initial stage of electrodeposition (see Figure 6). However, when Ag(I) concentration in the deposition bath is higher, the Ag adatoms might contaminate the edges of the Cu deposit, and thus lead to an incomplete coverage of the Si substrate with less-faceted Cu grains.

5. Conclusions

Based on the CV profiles with Cu-Ag electrodeposition baths, significant nucleation overpotentials were observed at Ru (passivated by the surface Ru oxide) and Si (with poor wettability of metal deposits) substrates. Different from CV profiles with n-Si(001) in the dark by Oskam et al., we did not observe the disappearance of Cu dissolution peak in the reverse anodic scan with n-Si(001) under illumination. Significant loss of deposits was observed in the reverse anodic CV scan, which is explained by the detachment of Cu-Ag grains due to their weak bonding to the Si(001) substrate. XRD shows that the Cu-Ag deposit is a mechanical mixture of Cu-fcc and Ag-fcc phases. Supersaturated Cu-fcc with 1 at.% Ag was found by comparing observed lattice parameter with the pure Cu-fcc phase using Vegard’s law. Layered structure of the deposits was observed under SEM. Such morphology might be caused by sluggish nucleation kinetics of Cu at n-Si(001) substrate or Ag-rich initial phase at Ru substrate.

Author Contributions

Conceptualization, W.S. and G.Z.; Data curation, W.S.; Funding acquisition, G.Z.; Investigation, W.S.; Methodology, W.S., Y.S. and G.Z.; Project administration, G.Z.; Resources, G.Z.; Visualization, Y.S.; Writing—original draft, Y.S. and G.Z.; Writing—review and editing, Y.S. and G.Z. All authors have read and agreed to the published version of the manuscript.

Funding

This research received no external funding.

Institutional Review Board Statement

Not applicable.

Informed Consent Statement

Not applicable.

Data Availability Statement

This study did not report any data.

Acknowledgments

Y.S. thanks Y.X. for communicating with W.S. about the raw data in this draft.

Conflicts of Interest

The authors declare no conflict of interest.

References

  1. Barmak, K.; Lucadamo, G.A.; Cabral, C.; Lavoie, C.; Harper, J.M.E. Dissociation of dilute immiscible copper alloy thin films. J. Appl. Phys. 2000, 87, 2204–2214. [Google Scholar] [CrossRef]
  2. Valodkar, M.; Modi, S.; Pal, A.; Thakore, S. Synthesis and anti-bacterial activity of Cu, Ag and Cu-Ag alloy nanoparticles: A green approach. Mater. Res. Bull. 2011, 46, 384–389. [Google Scholar] [CrossRef]
  3. Oudbashi, O.; Shekofteh, A. Chemical and microstructural analysis of some Achaemenian silver alloy artefacts from Hamedan, western Iran. Period. Mineral. 2015, 84, 419–434. [Google Scholar]
  4. Giurlani, W.; Zangari, G.; Gambinossi, F.; Passaponti, M.; Salvietti, E.; Di Benedetto, F.; Caporali, S.; Innocenti, M. Electroplating for decorative applications: Recent trends in research and development. Coatings 2018, 8, 260. [Google Scholar] [CrossRef] [Green Version]
  5. Kang, Y.; Chen, F. Preparation of Ag–Cu bimetallic dendritic nanostructures and their hydrogen peroxide electroreduction property. J. Appl. Electrochem. 2013, 43, 667–677. [Google Scholar] [CrossRef]
  6. Gang, L.; Anderson, B.G.; van Grondelle, J.; van Santen, R.A.; van Gennip, W.J.H.; Niemantsverdriet, J.W.; Kooyman, P.J.; Knoester, A.; Brongersma, H.H. Alumina-Supported Cu-Ag Catalysts for Ammonia Oxidation to Nitrogen at Low Temperature. J. Catal. 2002, 206, 60–70. [Google Scholar] [CrossRef]
  7. Wang, L.; Higgins, D.C.; Ji, Y.; Morales-Guio, C.G.; Chan, K.; Hahn, C.; Jaramillo, T.F. Selective reduction of CO to acetaldehyde with CuAg electrocatalysts. Proc. Natl. Acad. Sci. USA 2020, 117, 12572–12575. [Google Scholar] [CrossRef] [Green Version]
  8. Ishimaru, S.; Shiratsuchi, R.; Nogami, G. Pulsed Electroreduction of CO2 on Cu-Ag Alloy Electrodes. J. Electrochem. Soc. 2000, 147, 1864. [Google Scholar] [CrossRef]
  9. Hoang, T.T.H.; Verma, S.; Ma, S.; Fister, T.T.; Timoshenko, J.; Frenkel, A.I.; Kenis, P.J.A.; Gewirth, A.A. Nanoporous Copper–Silver Alloys by Additive-Controlled Electrodeposition for the Selective Electroreduction of CO2 to Ethylene and Ethanol. J. Am. Chem. Soc. 2018, 140, 5791–5797. [Google Scholar] [CrossRef]
  10. Choi, J.; Kim, M.J.; Ahn, S.H.; Choi, I.; Jang, J.H.; Ham, Y.S.; Kim, J.J.; Kim, S.-K. Electrochemical CO2 reduction to CO on dendritic Ag–Cu electrocatalysts prepared by electrodeposition. Chem. Eng. J. 2016, 299, 37–44. [Google Scholar] [CrossRef]
  11. Kim, M.J.; Lee, H.J.; Yong, S.H.; Kwon, O.J.; Kim, S.-K.; Kim, J.J. Facile formation of Cu-Ag film by electrodeposition for the oxidation-resistive metal interconnect. J. Electrochem. Soc. 2012, 159, D253. [Google Scholar] [CrossRef]
  12. Wei, Y.; Chen, S.; Lin, Y.; Yang, Z.; Liu, L. Cu–Ag core–shell nanowires for electronic skin with a petal molded microstructure. J. Mater. Chem. C 2015, 3, 9594–9602. [Google Scholar] [CrossRef]
  13. Lee, C.; Kim, N.R.; Koo, J.; Lee, Y.J.; Lee, H.M. Cu-Ag core–shell nanoparticles with enhanced oxidation stability for printed electronics. Nanotechnology 2015, 26, 455601. [Google Scholar] [CrossRef] [PubMed]
  14. Sreedhar, N.Y.; Sunil Kumar, M.; Krishnaveni, K. Sensitive determination of chlorpyrifos using Ag/Cu alloy nanoparticles and graphene composite paste electrode. Sens. Actuators B 2015, 210, 475–482. [Google Scholar] [CrossRef]
  15. Easow, J.S.; Selvaraju, T. Unzipped catalytic activity of copper in realizing bimetallic Ag@Cu nanowires as a better amperometric H2O2 sensor. Electrochim. Acta 2013, 112, 648–654. [Google Scholar] [CrossRef]
  16. Bharati, M.S.S.; Chandu, B.; Rao, S.V. Explosives sensing using Ag–Cu alloy nanoparticles synthesized by femtosecond laser ablation and irradiation. RSC Adv. 2019, 9, 1517–1525. [Google Scholar] [CrossRef] [Green Version]
  17. Navas, M.P.; Soni, R.K. Laser-Generated Bimetallic Ag-Au and Ag-Cu Core-Shell Nanoparticles for Refractive Index Sensing. Plasmonics 2015, 10, 681–690. [Google Scholar] [CrossRef]
  18. Clarke, O.J.R.; St. Marie, G.J.H.; Brosseau, C.L. Evaluation of an Electrodeposited Bimetallic Cu/Ag Nanostructured Screen Printed Electrode for Electrochemical Surface-Enhanced Raman Spectroscopy (EC-SERS) Investigations. J. Electrochem. Soc. 2017, 164, B3091–B3095. [Google Scholar] [CrossRef]
  19. Li, D.; Liu, J.; Wang, H.; Barrow, C.J.; Yang, W. Electrochemical synthesis of fractal bimetallic Cu/Ag nanodendrites for efficient surface enhanced Raman spectroscopy. Chem. Commun. 2016, 52, 10968–10971. [Google Scholar] [CrossRef] [Green Version]
  20. Wagner, C.N.J.; Light, T.B.; Halder, N.C.; Lukens, W.E. Structure of a Vapor-Quenched AgCu Alloy. J. Appl. Phys. 1968, 39, 3690–3693. [Google Scholar] [CrossRef]
  21. Chen, H.; Zuo, J.-M. Structure and phase separation of Ag–Cu alloy thin films. Acta Mater. 2007, 55, 1617–1628. [Google Scholar] [CrossRef]
  22. Uenishi, K.; Kobayashi, K.F.; Ishihara, K.N.; Shingu, P.H. Formation of a super-saturated solid solution in the Ag-Cu system by mechanical alloying. Mater. Sci. Eng. A 1991, 134, 1342–1345. [Google Scholar] [CrossRef]
  23. Najafabadi, R.; Srolovitz, D.J.; Ma, E.; Atzmon, M. Thermodynamic properties of metastable Ag-Cu alloys. J. Appl. Phys. 1993, 74, 3144–3149. [Google Scholar] [CrossRef] [Green Version]
  24. Tsuji, M.; Hikino, S.; Tanabe, R.; Matsunaga, M.; Sano, Y. Syntheses of Ag/Cu alloy and Ag/Cu alloy core Cu shell nanoparticles using a polyol method. Cryst. Eng. Comm. 2010, 12, 3900–3908. [Google Scholar] [CrossRef]
  25. Strehle, S.; Menzel, S.; Wendrock, H.; Acker, J.; Wetzig, K. Microstructural investigation of electrodeposited CuAg-thin films. Microelectron. Eng. 2003, 70, 506–511. [Google Scholar] [CrossRef]
  26. Bernasconi, R.; Hart, J.L.; Lang, A.C.; Magagnin, L.; Nobili, L.; Taheri, M.L. Structural properties of electrodeposited Cu-Ag alloys. Electrochim. Acta 2017, 251, 475–481. [Google Scholar] [CrossRef]
  27. Liang, D.; Shao, W.; Zangari, G. Selection of Phase Formation in Electroplated Ag-Cu Alloys. J. Electrochem. Soc. 2016, 163, D40–D48. [Google Scholar] [CrossRef]
  28. Bernasconi, R.; Nobili, L.; Magagnin, L. Electrodeposition of Supersaturated CuAg Alloys in Pyrophosphate-Iodide Electrolytes. ECS Trans. 2014, 58, 53–60. [Google Scholar] [CrossRef]
  29. Jeon, Y.; Choe, S.; Kim, H.C.; Kim, M.J.; Kim, J.J. Electrodeposition of Cu-Ag films in ammonia-based electrolyte. J. Alloys Compd. 2019, 775, 639–646. [Google Scholar] [CrossRef]
  30. Reyna-González, J.M.; Reyes-López, J.C.; Aguilar-Martínez, M. Silver and silver–copper electrodeposition from a pyridinium-based ionic liquid. Electrochim. Acta 2013, 94, 344–352. [Google Scholar] [CrossRef]
  31. Ruffino, F.; Torrisi, V.; Grillo, R.; Cacciato, G.; Zimbone, M.; Piccitto, G.; Grimaldi, M. Nanoporous Au structures by dealloying Au/Ag thermal-or laser-dewetted bilayers on surfaces. Superlattices Microstruct. 2017, 103, 28–47. [Google Scholar] [CrossRef]
  32. Guisbiers, G.; Mendoza-Cruz, R.; Bazán-Díaz, L.; Velázquez-Salazar, J.J.; Mendoza-Perez, R.; Robledo-Torres, J.A.; Rodriguez-Lopez, J.-L.; Montejano-Carrizales, J.M.; Whetten, R.L.; José-Yacamán, M. Electrum, the Gold–Silver Alloy, from the Bulk Scale to the Nanoscale: Synthesis, Properties, and Segregation Rules. ACS Nano 2016, 10, 188–198. [Google Scholar] [CrossRef] [PubMed]
  33. Oyamatsu, D.; Nishizawa, M.; Kuwabata, S.; Yoneyama, H. Underpotential deposition of silver onto gold substrates covered with self-assembled monolayers of alkanethiols to induce intervention of the silver between the monolayer and the gold substrate. Langmuir 1998, 14, 3298–3302. [Google Scholar] [CrossRef]
  34. Budevski, E.B.; Staikov, G.T.; Lorenz, W.J. 4.3 3D Phase Formation on UPD Modified Foreign Substrate Sufaces. In Electrochemical Phase Formation and Growth; John Wiley & Sons: Hoboken, NJ, USA, 2008; pp. 180–199. [Google Scholar]
  35. Shao, W.; Sun, Y.; Giurlani, W.; Innocenti, M.; Zangari, G. Estimating electrodeposition properties and processes: Cu-Ag alloy at n-Si(001) and Ru substrates from acidic sulfate bath. Electrochim. Acta 2022, 403, 139695. [Google Scholar] [CrossRef]
  36. Shao, W.; Sun, Y.; Xu, Y.; Zangari, G. Depolarization of Cu electrodeposition from acidic sulfate bath in the presence of Ag: A cyclic-voltammetry study. Electrochim. Acta 2022, 403, 139695. [Google Scholar]
  37. Ueda, M.; Mito, Y.; Ohtsuka, T. Electrodeposition of Sb-Te Alloy in AlCl3-NaCl-KCl Molten Salt. Mater. Trans. 2008, 49, 1720–1722. [Google Scholar] [CrossRef]
  38. Tsai, Y.-D.; Hu, C.-C. Composition Control of the Eutectic Sn-Based Alloys: Sn-Ag, Sn-Cu, Sn-Ag-Cu, From Simple Plating Baths. J. Electrochem. Soc. 2011, 158, D527. [Google Scholar] [CrossRef]
  39. Allmann, R.; Hinek, R. The introduction of structure types into the Inorganic Crystal Structure Database ICSD. Acta Crystallogr. Sect. A Found. Crystallogr. 2007, 63, 412–417. [Google Scholar] [CrossRef] [Green Version]
  40. Cullity, B.D.; Stock, S.R. Elements of X-Ray Diffraction; Prentice Hall: Upper Saddle River, NJ, USA, 2001. [Google Scholar]
  41. Gupta, A.; Paramanik, D.; Varma, S.; Jacob, C. CVD growth and characterization of 3C-SiC thin films. Bull. Mater. Sci. 2004, 27, 445–451. [Google Scholar] [CrossRef] [Green Version]
  42. Grujicic, D.; Pesic, B. Electrodeposition of copper: The nucleation mechanisms. Electrochim. Acta 2002, 47, 2901–2912. [Google Scholar] [CrossRef]
  43. Isa, N.C.; Mohd, Y.; Zaki, M.M.; Mohamad, S.S. Characterization of copper coating electrodeposited on stainless steel substrate. Int. J. Electrochem. Sci 2017, 12, 6010–6021. [Google Scholar]
  44. Shao, W.; Zangari, G. Dendritic Growth and Morphology Selection in Copper Electrodeposition from Acidic Sulfate Solutions Containing Chlorides. J. Phys. Chem. C 2009, 113, 10097–10102. [Google Scholar] [CrossRef]
  45. Krumm, R.; Guel, B.; Schmitz, C.; Staikov, G. Nucleation and growth in electrodeposition of metals on n-Si (111). Electrochim. Acta 2000, 45, 3255–3262. [Google Scholar] [CrossRef]
  46. Holze, R. Table 5.2. Exchange current densities and rate constants in aqueous systems at miscellaneous surfaces: Datasheet from Landolt-Börnstein—Group IV Physical Chemistry. In Electrochemical Thermodynamics and Kinetics; Springer: Berlin/Heidelberg, Germany; Volume 9A, Available online: https://materials.springer.com/lb/docs/sm_lbs_978-3-540-45316-1_23 (accessed on 10 December 2021). [CrossRef]
  47. Pentland, N.; Bockris, J.O.M.; Sheldon, E. Hydrogen Evolution Reaction on Copper, Gold, Molybdenum, Palladium, Rhodium, and Iron. J. Electrochem. Soc. 1957, 104, 182. [Google Scholar] [CrossRef]
  48. Gossner, K.; Mansfeld, F. Die pH-Abhängigkeit der kathodischen Wasserstoffabscheidung an Kupfer, Silber und Gold. Z. Phys. Chem. 1968, 58, 19–35. [Google Scholar] [CrossRef]
  49. Muñoz, E.C.; Schrebler, R.S.; Cury, P.K.; Suárez, C.A.; Córdova, R.A.; Gómez, C.H.; Marotti, R.E.; Dalchiele, E.A. The Influence of Poly(ethylene oxide) and Illumination on the Copper Electrodeposition Process onto n-Si(100). J. Phys. Chem. B 2006, 110, 21109–21117. [Google Scholar] [CrossRef] [PubMed]
  50. Barna, P.B.; Radnóczi, G. 3—Structure formation during deposition of polycrystalline metallic thin films. In Metallic Films for Electronic, Optical and Magnetic Applications; Barmak, K., Coffey, K., Eds.; Woodhead Publishing: Sawston, UK, 2014; pp. 67–120. [Google Scholar]
  51. Zaumseil, P. High-resolution characterization of the forbidden Si 200 and Si 222 reflections. J. Appl. Crystallogr. 2015, 48, 528–532. [Google Scholar] [CrossRef] [PubMed] [Green Version]
  52. Ziegler, J.; Reitzle, A.; Bunk, O.; Zegenhagen, J.; Kolb, D. Metal deposition on n-Si (111): H electrodes. Electrochim. Acta 2000, 45, 4599–4605. [Google Scholar] [CrossRef]
  53. Balsano, R.; Matsubayashi, A.; LaBella, V.P. Schottky barrier height measurements of Cu/Si(001), Ag/Si(001), and Au/Si(001) interfaces utilizing ballistic electron emission microscopy and ballistic hole emission microscopy. AIP Adv. 2013, 3, 112110. [Google Scholar] [CrossRef]
  54. Oskam, G.; Long, J.; Natarajan, A.; Searson, P. Electrochemical deposition of metals onto silicon. J. Phys. D Appl. Phys. 1998, 31, 1927. [Google Scholar] [CrossRef]
  55. Khelladi, M.; Mentar, L.; Azizi, A.; Sahari, A.; Kahoul, A. Electrochemical nucleation and growth of copper deposition onto FTO and n-Si (100) electrodes. Mater. Chem. Phys. 2009, 115, 385–390. [Google Scholar] [CrossRef]
  56. Quiroga Argañaraz, M.B.; Vázquez, C.I.; Lacconi, G.I. Copper electrodeposition onto hydrogenated Si(111) surfaces: Influence of thiourea. J. Electroanal. Chem. 2010, 639, 95–101. [Google Scholar] [CrossRef]
  57. Tao, M.; Udeshi, D.; Agarwal, S.; Maldonado, E.; Kirk, W. Negative Schottky barrier between titanium and n-type Si (001) for low-resistance ohmic contacts. Solid-State Electron. 2004, 48, 335–338. [Google Scholar] [CrossRef]
  58. Oskam, G.; Vereecken, P.M.; Searson, P.C. Electrochemical Deposition of Copper on n-Si/TiN. J. Electrochem. Soc. 1999, 146, 1436. [Google Scholar] [CrossRef]
  59. Ruffino, F.; Grimaldi, M. Atomic force microscopy study of the growth mechanisms of nanostructured sputtered Au film on Si (111): Evolution with film thickness and annealing time. J. Appl. Phys. 2010, 107, 104321. [Google Scholar] [CrossRef]
  60. Villamil, R.; Cordeiro, G.; Matos, J.; D’Elia, E.; Agostinho, S. Effect of sodium dodecylsulfate and benzotriazole on the interfacial behavior of Cu/Cu (II), H2SO4. Mater. Chem. Phys. 2003, 78, 448–452. [Google Scholar] [CrossRef]
  61. Foadi, F.; ten Brink, G.H.; Mohammadizadeh, M.R.; Palasantzas, G. Roughness dependent wettability of sputtered copper thin films: The effect of the local surface slope. J. Appl. Phys. 2019, 125, 244307. [Google Scholar] [CrossRef]
  62. Feng, X.; Mo, Y.; Zhao, Y.; Jiang, S. Understanding the temperature and size dependence of the contact angle of Cu/Si(111): A molecular dynamics study. Comput. Mater. Sci. 2018, 150, 222–229. [Google Scholar] [CrossRef]
  63. Astley, D.; Harrison, J.; Thirsk, H. Electrocrystallization of mercury, silver and palladium. Trans. Faraday Soc. 1968, 64, 192–201. [Google Scholar] [CrossRef]
  64. Sluyters-Rehbach, M.; Wijenberg, J.H.O.J.; Bosco, E.; Sluyters, J.H. The theory of chronoamperometry for the investigation of electrocrystallization: Mathematical description and analysis in the case of diffusion-controlled growth. J. Electroanal. Chem. 1987, 236, 1–20. [Google Scholar] [CrossRef]
  65. Scharifker, B.R.; Mostany, J. Electrochemical Nucleation and Growth. In Encyclopedia of Electrochemistry; Bard, A.J., Ed.; John Wiley & Sons: Hoboken, NJ, USA, 2007; pp. 512–539. [Google Scholar]
Figure 1. (a) Cyclic voltammograms from 0.3 M CuSO4 + 0.5 M H2SO4 with and without addition of 2 mM AgNO3 at activated or pristine Ru substrates [36]. Note that the Figure 1 (b) shows the current of the cathodic scans in log-scale.
Coatings 11 01563 g001
Figure 2. The SEM images of the Cu-Ag films deposited at Ru substrate at various potentials. Film thickness is ~170 nm, estimated from total charge passed during electrodeposition with 70% efficiency. Deposition bath is 0.3 M CuSO4 + 2 mM AgNO3 + 0.5 M H2SO4.
Coatings 11 01563 g002
Figure 3. Cyclic voltammograms on n-Si(100) with 10 mM CuSO4 + 0.5 M H2SO4 + 0~0.5 mM AgNO3.
Coatings 11 01563 g003
Figure 4. The morphology of thick films deposited from 0.5 M H2SO4 + 10 mM CuSO4 solutions with addition of 0~0.1 mM AgNO3 at n-Si(001) substrate, nominal thickness of films is about 170 nm.
Coatings 11 01563 g004
Figure 5. XRD patterns of films with various compositions (deposited at −0.85 V in the solution 0.5 M H2SO4 + 10 mM CuSO4 with various concentration of AgNO3).
Coatings 11 01563 g005
Figure 6. Potentiostatic transients and the fitting of transients from 10 mM CuSO4 + 0.5 M H2SO4 (a,c) without or (b,d) with the addition of 0.1 mM AgNO3 based on classical model [35]. The peak time is roughly 4s and the peak current is roughly −0.003 A/cm2.
Coatings 11 01563 g006
Publisher’s Note: MDPI stays neutral with regard to jurisdictional claims in published maps and institutional affiliations.

