Article

Energy, Economic and Environmental Assessment of Thermal Barrier Application in Building Envelope Structures

Department of Building Services, Faculty of Civil Engineering, Slovak University of Technology (STU) in Bratislava, 810 05 Bratislava, Slovakia
*
Author to whom correspondence should be addressed.
Coatings 2021, 11(12), 1538; https://doi.org/10.3390/coatings11121538
Submission received: 12 November 2021 / Revised: 3 December 2021 / Accepted: 8 December 2021 / Published: 14 December 2021

Abstract

:
Thermal engineering requirements for building structures are becoming more and more strict. Thermal barriers (TBs) are energy-active elements integrated into the building structure in which a heat transfer medium (water or air) flows. A survey of the scientific literature on the subject points to the fact that this is a very topical and promising area of research and, so far, most studies on TBs are based on calculations, computer simulations and experimental measurements. Few studies have focused on the economic and environmental aspects of TB use. Following the research results presented by authors from all over the world, as well as our contributions in this scientific field that are described in a European patent, three utility models and scientific articles, in this study we have focused on the evaluation of the TB in terms of energy performance, economic efficiency and environmental friendliness by comparing the use of a classical envelope wall with the required thickness of thermal insulation meeting the normative requirements for thermal resistance R ((m2K)/W) and a perimeter wall with an integrated TB significantly eliminating the thermal insulation thickness. We evaluate the use of the thermal barrier using: economic indicator one, where we compare the cost of heat delivered to the TB in a structure with significantly eliminated thermal insulation and the saved cost of thermal insulation at the standard thickness; economic indicator two, where we compare the cost of heat delivered to the TB in a structure with significantly eliminated thermal insulation with the potential gain from the sale of the useful area of the building gained compared to the area at the normative thickness of thermal insulation; and economic indicator three, where we compare the cost of heat delivered to the TB in a structure with significantly eliminated thermal insulation with the cost of grey energy at the normative thickness of thermal insulation. Based on a parametric study based on theoretical assumptions, it can be concluded that the thermal barrier shows a very promising and efficient solution in terms of the evaluation of economic indicators one to three, which are even more significant if we use heat for the TB from renewable energy sources (RES) or waste heat.

1. Introduction

Directive 2018/844/EU [1] amending Directive 2010/31/EU [2] on the energy performance of buildings and Directive 2012/27/EU [3] on energy efficiency introduced into our legislation the term, “nearly Zero Energy Building (nZEB)”. According to this directive, all new buildings approved after 2020 must meet these criteria. In addition to tightening the requirements for thermal technical properties of building envelopes to reduce the energy performance of buildings, increased use of renewable energy sources (RES) and the reduction of greenhouse gas emissions, especially CO2, is required.
Thermal technical requirements for building structures are specified in the standard STN 73 0540-2 + Z1 + Z2 [4]. In order to meet these requirements, it is necessary to design building structures with a sufficient thickness of thermal insulation, e.g., for a reinforced concrete wall that is 200 mm thick, more than 200 mm of insulation is required.
Thermal barriers are energetically active elements integrated in facade construction in which the heat transfer medium (water or air) flows. From a technical point of view, this regards pipes or ducts, which are located between the statically load-bearing and thermal insulation part of the facade. The thermal barrier is one of the functions of facades with integrated energy-active elements. The heat required to cover the heat losses of the interior remains the same for both alternative solutions (normative building construction and construction with TBs), with the difference that in the case of a facade with an integrated thermal barrier, part of the required heat eliminates the thickness of the thermal insulation of the building construction.

2. Description of the Known State of the Art and Contribution to the Advancement of Knowledge on the Field

One of the earliest references to the thermal barrier (TB) is associated with the ISOMAX system (by Dr. E. Krecké), which uses solar energy captured by the energy roof, stored in a ground heat storage tank, and is applied to the thermal barrier in the walls and roof of buildings to eliminate heat loss. Similarly, it also uses geothermic energy for cooling [5,6,7,8].
Krzaczek and Kowalczuk [9] presented the concept of indirect heating and cooling of residential buildings using a TB, which was used to stabilize and reduce the heat flux towards the exterior throughout the year. The main aim of their paper was to investigate the thermal performance and stability of the thermal barrier. They used computer simulation to investigate and analyze the TB. The advantages of the TB heating and cooling technique were outlined. In their scientific paper [10], they state that the critical point of the new thermal barrier technique of indirect heating and cooling of buildings under construction is to maintain a constant temperature throughout the year. Such an effect can be achieved by using the proposed Gain Scheduling Control (GSC) system, which implements a new Fuzzy-Mixing Gain-Scheduling (FMGS) strategy based on the idea of fuzzy mixing (weighting) the local (modal) value of certain (automatically designed) control parameters. An important advantage of this approach is that the same scheme can be used for both planning of strengthening the regulator and fuzzy mixing of the feed fluids in the temperature optimization process. Experiments show the excellent performance and efficiency of the proposed heating, ventilation and air conditioning (HVAC) control system.
Meggers, Baldini and Leibundgut [11] describe a developed system that uses low-temperature geothermic heat directly in the building wall to reduce heat loss through heat transfer. Active low-energy geothermal insulation systems minimize the need for exergy and maximize the use of renewable geothermic heat from the ground. The fluid is pumped into a small pipe network in the outer layer of the wall structure, which is connected to the ground source of heat. This decouples the building from the outside temperature, eliminating large peak demands and reducing the need for primary energy. Steady state analysis shows that at a design temperature of −10 °C, a 6 cm thick active insulation system had an equivalent performance to 11 cm of passive insulation. A comparison of the heating performance of a building with this active insulation system versus a building with static insulation of the same thickness showed a 15% reduction in annual electricity consumption. The paper gives an overview of the operation and analysis of the low exergy concept and its modelled performance.
Xie, Zhu and Xu [12], based on a numerical simulation, compare the thermal performance of TBs under typical hot summer weather conditions with conventional external walls and roofs. The results show that the use of a TB can significantly reduce the external heat transfer and lower the internal wall surface temperature, thus improving the thermal comfort of the occupants. They presented the effect of water temperature and pipe spacing on heat transfer through this construction with TBs. The internal surface heat transfer could be reduced by about 2.6 W/m2 when the water temperature was reduced by 1 °C for a brick wall with pipes placed inside. When the spacing of the pipes was reduced by 50 mm, the surface heat flux could also be reduced by about 2.3 W/m2.
Ibrahim, Wurtz, Biwole and Achard [13] present the design of a novel system of embedded tubes in the external surface of walls to capture solar energy in winter from the radiated walls of a building, and to use this energy by means of a heat transfer medium to eliminate the heat loss of the walls that are not exposed to solar radiation. This model was investigated using computer simulation. The results showed that the reduction in the annual heating load for a house using this system, compared to a house without this system, was between 28% and 43% for new houses and 15–20% for old houses for Mediterranean climates. In other climates the reductions were between 6% and 26%. Heat loss through the northern facade was reduced by 60–88% in Mediterranean climates and by 20–50% in other climates.
Xie, Xu, Li and Zhu in [14] describe a frequency-domain active building envelope model (FDFD) with TBs, which can directly predict the frequency thermal response of the active building envelope with integrated pipes and provide some important guidelines for system control and system sizing. This paper presents an experimental validation of this model in the time domain using Fourier series analysis. An experimental test rig has been developed to measure the thermal response of a building envelope embedded in ductwork under predefined conditions. The results show that the calculated time-domain thermal responses of the active building envelope with integrated pipes using the FDFD model agree well with the experimental measurements.
Li, Xu and Sun [15] present research focused on application of a TB with a ground source-coupled heat exchanger. A real-scale building energy simulation platform was developed to estimate the energy saving potential. The results of the study show that the energy saving potential of the proposed system varies depending on the climatic regions.
Niu and Yu [16] focused their research on a TB formed from a network of capillary pipes with applications for supplementary heating and cooling. The location of the capillary pipe network inside the wall significantly affected the thermal and energy performance of the building wall. The wall could operate with a wide range of water temperatures and the optimal placement of the tube network was relatively constant in different regimes. The power contribution of the wall varied from 2 to 39 W as the outside air temperature changed and was higher in summer than in winter.
Shen and Li [17] describe a comprehensive numerical model to simulate the conjugate heat transfer through the building envelope with TBs throughout the summer. The model was validated with experimental data and then applied to a case study. The performance of a new building envelope with TBs in different orientations in three typical cities in China is analyzed using cooling water produced from evaporative cooling. The results show that the cooling pipes are efficient in three typical cities in China, especially in Beijing, where the reduced heat gain in the cooling period reached 17.4 kWh per square meter of wall. The reduction rate of total electricity consumption was 51.9% and 58.9% in Shanghai and Guangzhou, respectively. Integrated active pipes (TBs) are more suitable for orientations with more solar radiation than the roof and western wall. The study will help to develop a comprehensive understanding of the dynamic performance of building envelopes with TBs using evaporative cooling.
Yu, Niu, Guo and Woradechjumroen [18] focused their research on the dependence of the thermal performance of a TB building envelope on water temperature and flow rate. Their results suggest that the thermally activated wall can be effective in stabilizing the indoor surface temperature, compensating the heat gain, and supplying cooling energy to the space in summer. Total energy cost, energy benefit and efficiency should be considered when using these innovations. This article illustrates how low-grade energy can be actively used as a means to achieve net-zero energy buildings.
Shen and Li [19] proposed air-to-water heat pumps for low-temperature heating water production for active thermal protection of a building to reduce heating energy consumption. They developed a numerical model to simulate the dynamic heat transfer in a structure with integrated piping, and the model was verified by experiment. The energy consumption and operating cost of the new system were analyzed for different water temperatures. Seasonal performance in winter conditions is evaluated in different cities and orientations. The results show that water temperature has a significant effect on the system performance and room temperature water is recommended. Overall, the proposed system with TBs is effective as an auxiliary heating system.
Šimko, Krajčík, Šikula, Šimko and Kalús [20] describe numerical simulations and experiments for a thermally active wall with tubes arranged in milled channels in the thermal insulation. The advantage of this system is its suitability for installation in new and existing buildings in the form of prefabricated thermal insulation panels attached to their facades. The study shows that by actively controlling the supply water temperature it is possible to alternate the function of the wall between space heating and a thermal barrier. The wall system has the potential to significantly reduce heat loss when used as a thermal barrier. When operated as space heating, the placement of the tubes in the thermal insulation reduced the heating performance by 50% compared to systems with the tubes placed in the concrete core and by 63% for tubes arranged in a layer below the surface. It is important that the pipes arranged in channels are embedded in a thermally conductive material. Failure to do so may result in a significant reduction in heating performance due to imperfect contact between the tubes and the radiant surface and also due to the air gap that may form around the tubes. Insulation thickness, pipe spacing and supply water temperature also have a significant effect on heating performance, whereas the thickness of the concrete core does not.
Kisilewicz, Fedorczak–Cisak and Barkanyi [21] present preliminary results and analyses of research conducted in an experimental dwelling house in Nyiregyhaza, Hungary. The building is equipped with an innovative system of direct connection of a ground heat exchanger with a wall heat exchanger. In 2012, the author of the system, Tamas Barkanyi, was awarded a patent for active thermal insulation of buildings. In this paper, the authors attempted to answer the following question: To what extent can an active insulation system replace the commonly used standard passive insulation systems? Initial research results lead to the conclusion that active thermal insulation significantly improves the insulation parameters of the external wall. In the periods analysed, the total amount of heat loss through the external wall was reduced 53% in February and 81% in November. The equivalent heat transfer coefficient Ueq of the analysed wall was dependent on the local weather conditions and was 0.047 W/(m2K) in November and 0.11 W/(m2K) in March, while the standard value of the heat transfer coefficient was 0.282 W/(m2K). The positive research results obtained should form the basis for the implementation of the innovative system in the NZEB buildings.
Jiang, Li, Lyu, Wang and Shi [22] developed a numerical model of a series wall with integrated piping (TB) considering water temperature changes in the piping. The load reduction and energy efficiency of TBs under different climatic conditions and designs were numerically studied. The effect of flow velocity and flow path on TB performance was also investigated. The results showed that water temperature affected the internal load more than the external temperature and the TB has the potential to reduce the load compared to a conventional wall when the water temperature was below 30 °C in summer or above 12 °C in winter. There is an optimum flow velocity or flow path that maximized the energy efficiency of the TB system.
Kalús, Gašparík, Janík, Kubica and Št’astný [23] present an innovative solution and application of active thermal protection of buildings using thermal insulation panels with active heat transfer control in the form of a contact insulation system. The thermal insulation panels are part of a prefabricated lightweight external envelope which, together with a low-temperature heating and high-temperature cooling system, creates an indoor environment. The energy source is usually renewable energy or process waste heat. The research and development of an innovative facade system with active thermal protection is in the phase of computer simulations and preparation of laboratory measurements of thermal insulation panels with different combinations of energy functions. The theoretical assumptions, calculation procedure and parametric study of three basic design solutions of combined energy wall systems in the function of low-temperature radiant heating and high-temperature radiant cooling are presented in this paper.
Kalús, Janík and Kubica [24] conducted research on combined building-energy systems such as an energy roof, ground source heat storage and active thermal protection on the experimental house EB2020. They describe the theoretical procedure for calculating the efficiency of the energy roof, comparison with a classical solar collector, experimental measurements of the energy roof during one season and evaluation of the measured data. The application of an energy roof requires lower investment costs than conventional solar collectors, but experimental measurements have shown that the energy gain and the achieved outlet working fluid temperatures are significantly lower. For higher roof energy efficiency, it is advisable to consider installing a dark roof covering and installing multiple circuits with the appropriate orientation according to cardinal directions. This may be subject to further research also with respect to the TB application.
Krajčík, Arıcı, Šikula and Šimko [25] investigated water-based wall systems for space heating and cooling and thermal barriers (TB) for the reduction of buildings’ thermal load. Their review provided a general overview of the research, grouping it into subtopics that were discussed in detail. For space heating and cooling, subtopics included: thermal performance; thermal comfort; renewable energy; use in building retrofit; and combination with phase change materials (PCMs). In the case of TBs, the discussion primarily regarded: the principle of operation; types and designs; and performance. A classification system was proposed separately for wall-mounted heating and cooling systems and TBs based on suggestions found in the scientific literature. Advantages and disadvantages were summarized and design recommendations for wall-mounted systems were provided. It was shown that, in certain cases, radiant wall systems may be preferable to radiant floors and ceilings, but further comparisons would be useful to provide conclusive evidence. In the case of TBs, the studies uniformly declare that TBs reduce building heat loads and energy demands.
From the review of the scientific literature, it is clear that this is a very actual and perspective area of research and so far most studies on the TB are based on calculations, computer simulations and experimental measurements. Few studies have focused on the economic and environmental aspects of TB use. Following the research results presented by authors from all over the world and our contributions in this scientific field described in a European patent, three utility models and scientific articles [25,26,27,28], in this study we focus on the evaluation of the TB in terms of energy consumption, economic efficiency and environmental friendliness by comparing the use of a classical envelope wall with the required thickness of thermal insulation meeting the normative requirements for thermal resistance R ((m2K)/W) and an envelope wall with an integrated TB significantly eliminating the thickness of the thermal insulation.

3. Thermal Barrier in Building Structures

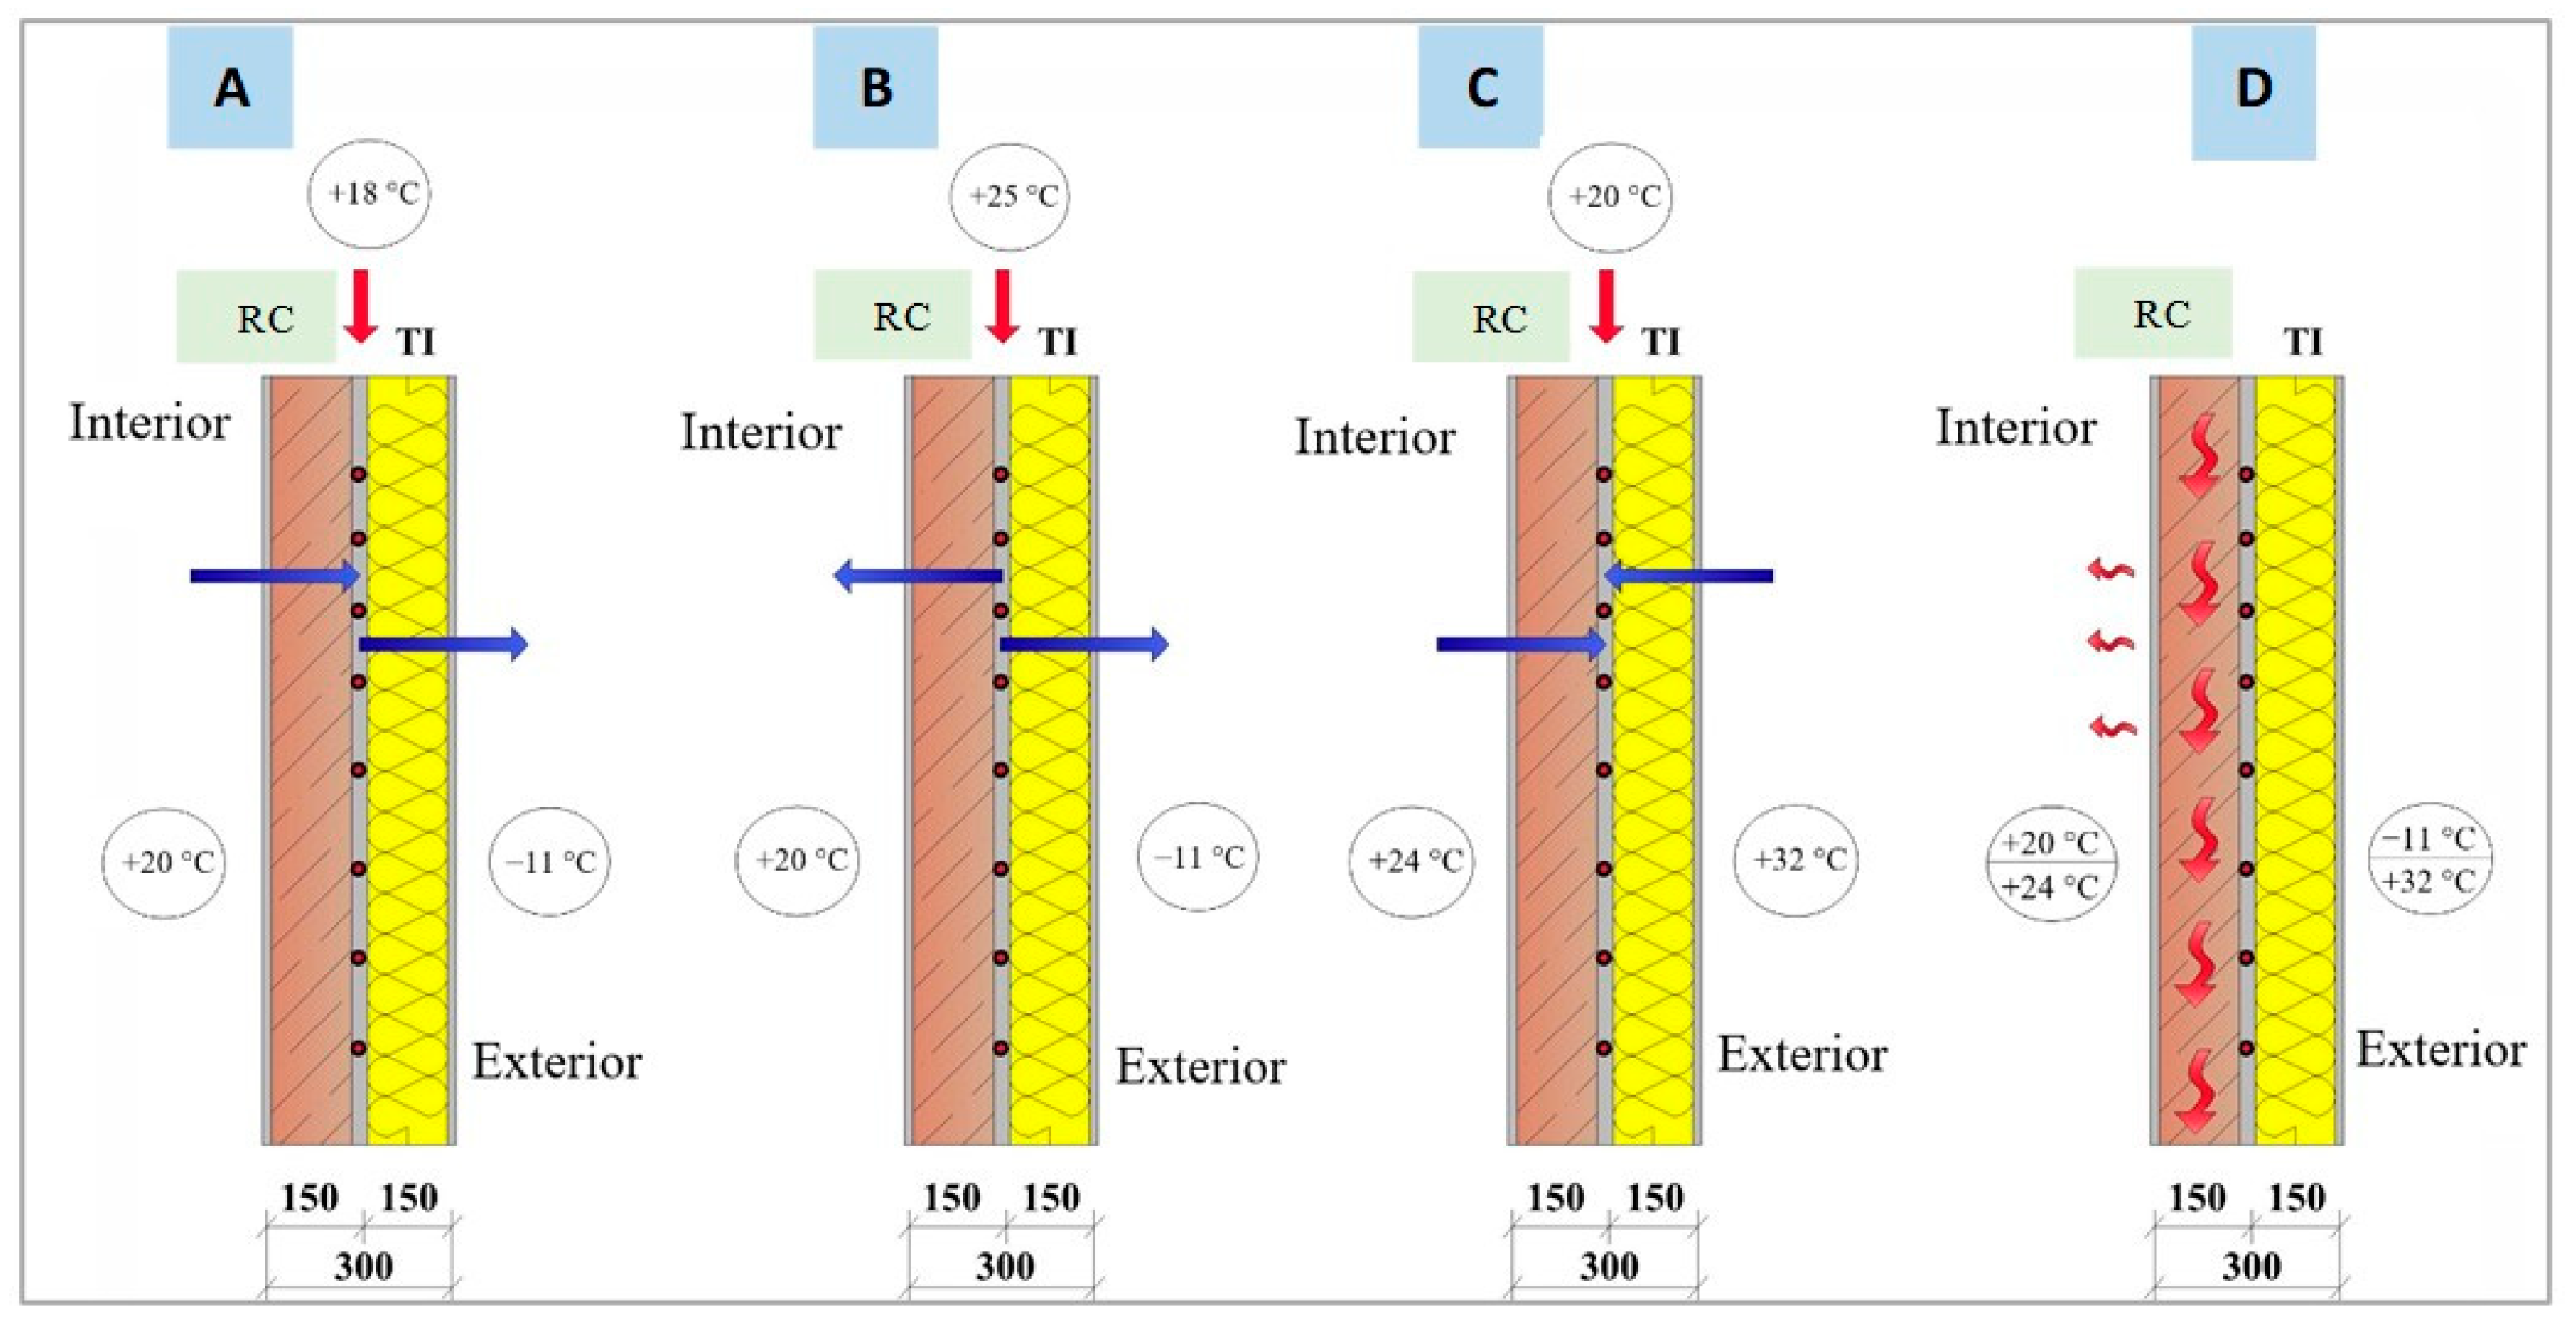
3.1. The Function of the Thermal Barrier

The function of the thermal barrier will be described on a multi-layered fragment of the perimeter wall, which consists of a reinforced concrete load-bearing part and thermal insulation made of expanded polystyrene (EPS) facade polystyrene, the overall composition of which is described in Figure 1. Thermal barriers are energy-active elements integrated into the facade structure in which the heat transfer medium (water or air) flows. In technical terms, it is a register of pipes or ducts located between the statically load-bearing and the thermal insulation part of the facade.
When calculating the thermal resistance R ((m2K)/W) and the heat transfer coefficient U (W/(m2K)) of a multilayer building structure, the temperatures between the individual layers are calculated. The idea of using a thermal barrier to eliminate the thickness of thermal insulation is based on the knowledge of temperatures between individual layers, specifically between the statically load-bearing and thermal insulation layer of the building structure, Layer No. 3, Figure 1 [4].
The thermal resistance of the j-th structure is calculated:
R i = d j λ j
where:
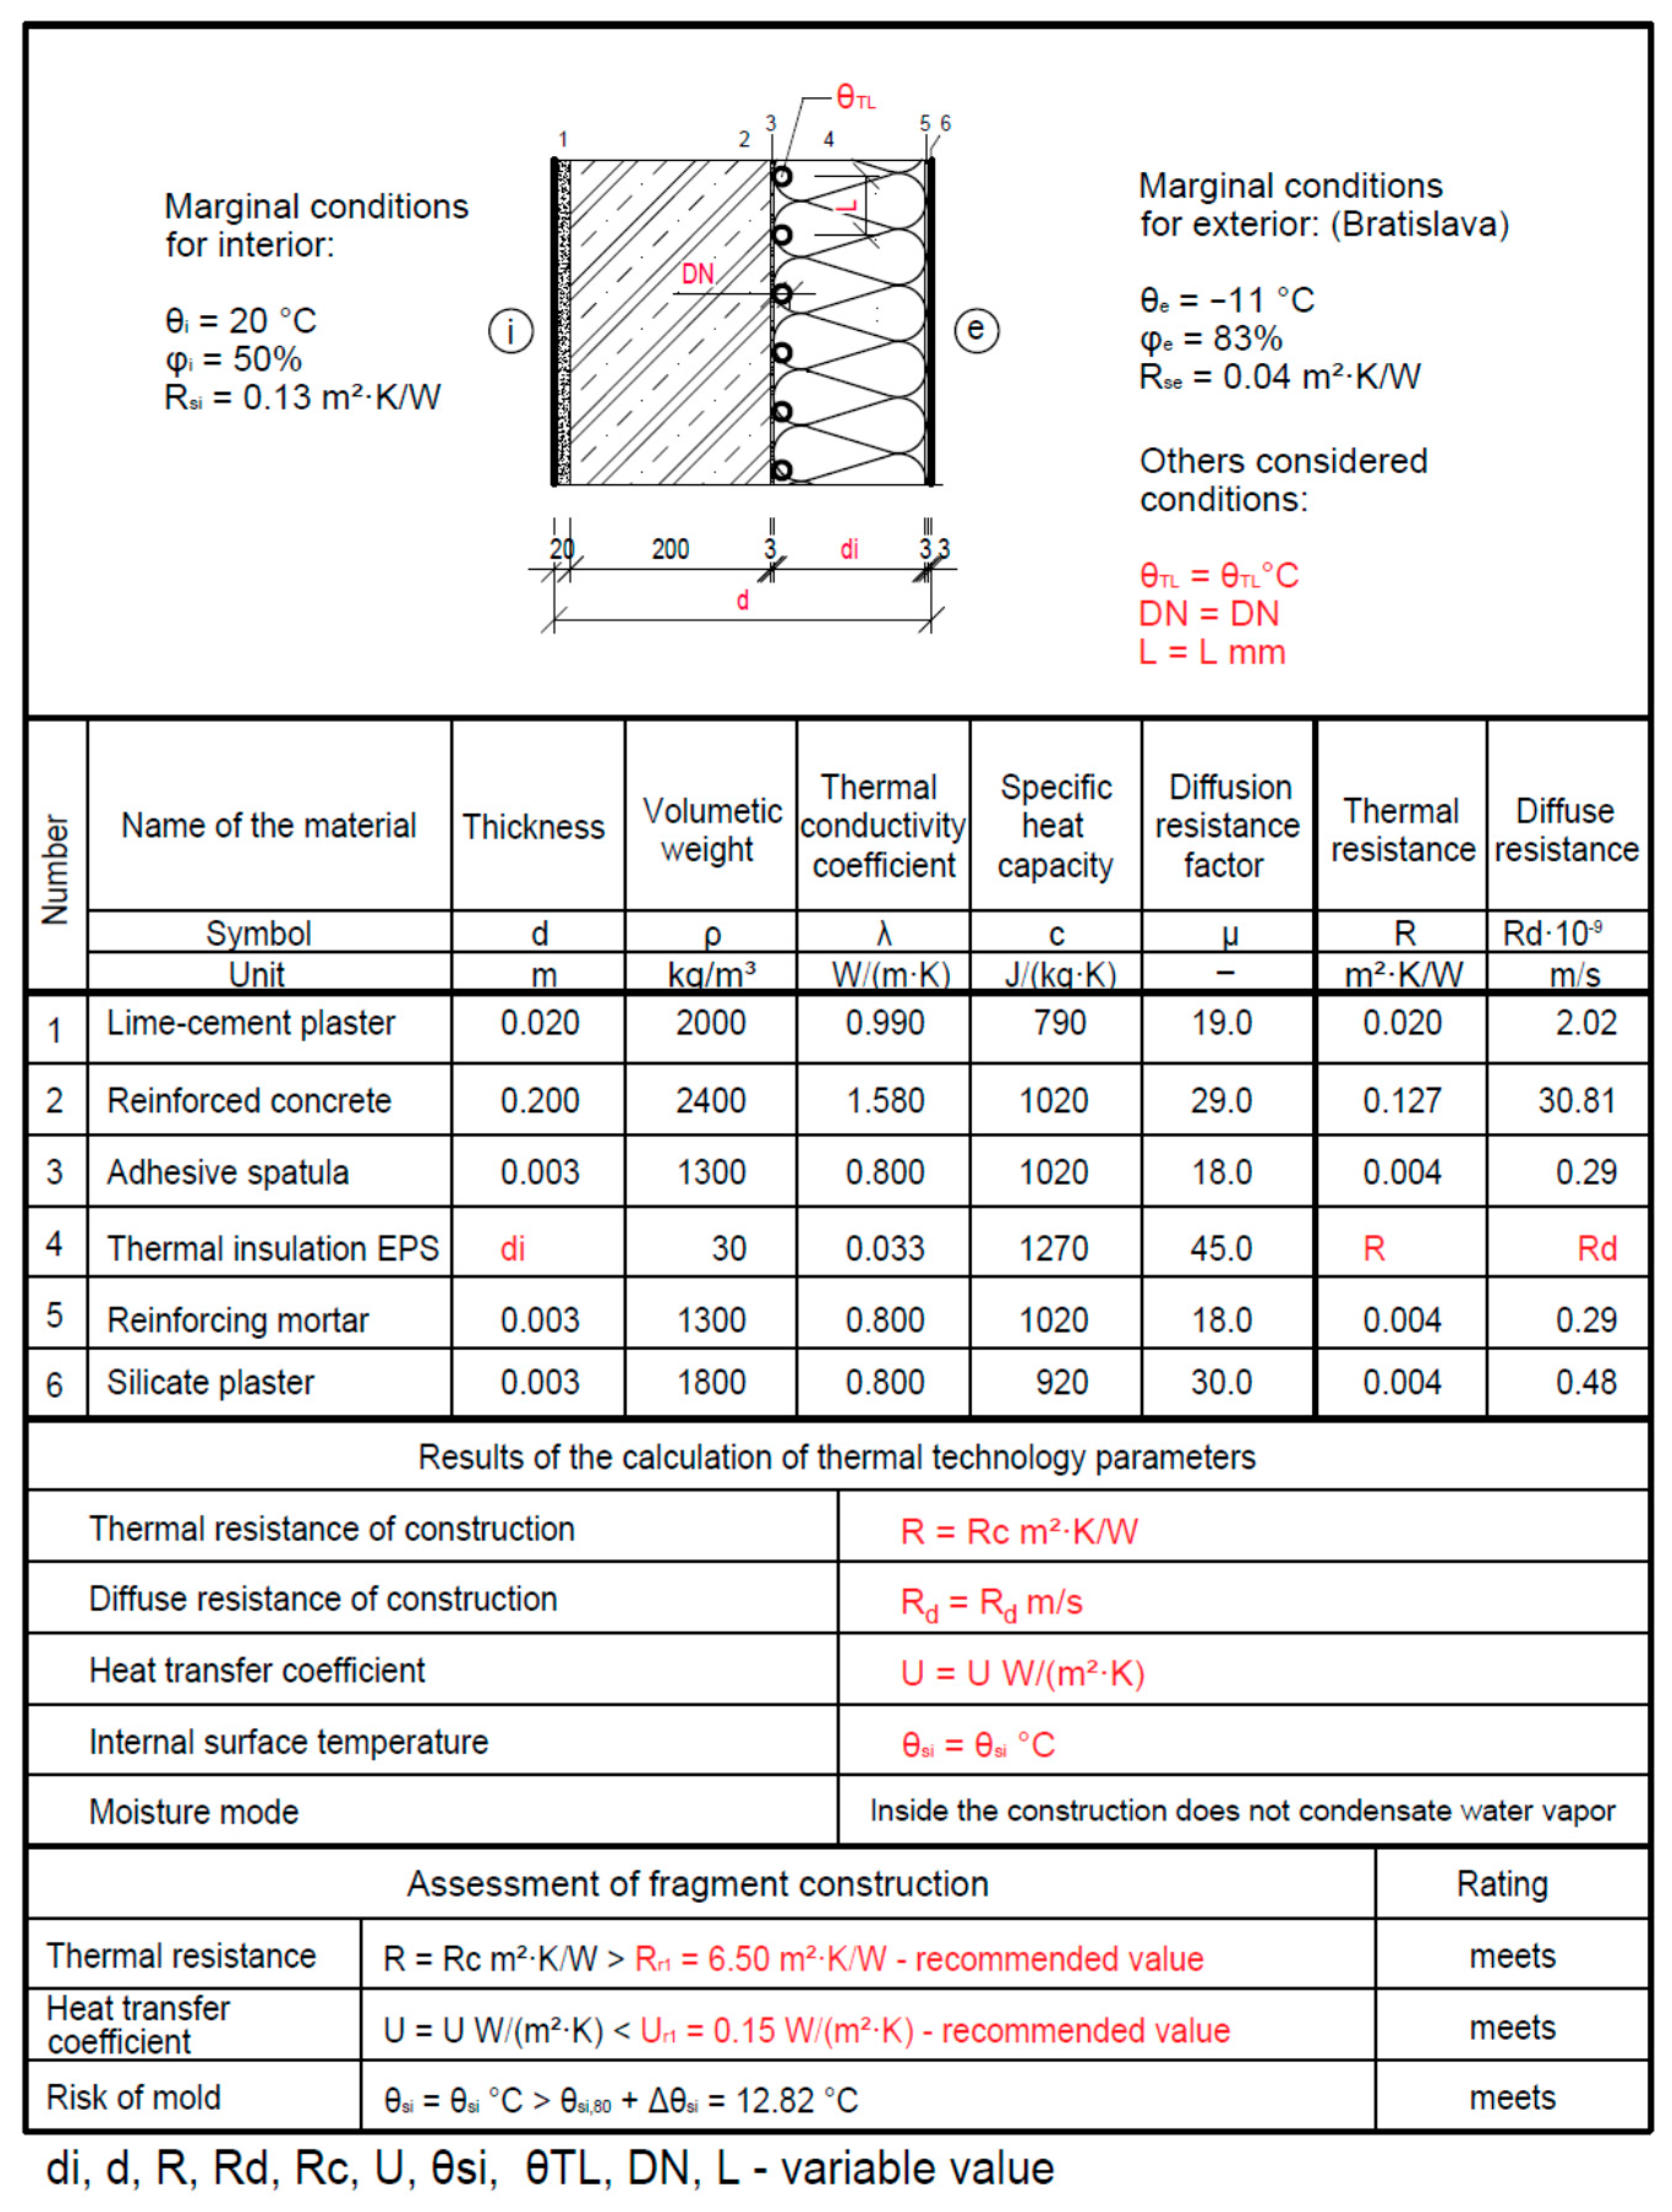
  • Ri—thermal resistance of the j-th layer of the structure ((m2K)/W),
  • dj—thickness of the j-th layer of the structure (m),
  • λj—coefficient of thermal conductivity of the j-th layer of the structure (W/(mK)) [4].
The thermal resistance of a multilayer structure shall be calculated:
Rc = ∑Ri
R = Rsi + Rc + Rse
where:
  • Rj—thermal resistance of the j-th layer of the structure ((m2K)/W),
  • Rc—total thermal resistance of the structure ((m2K)/W),
  • Rsi—thermal resistance to heat transfer at the internal surface of the structure ((m2K)/W),
  • Rse—thermal resistance to heat transfer at the external surface of the structure ((m2K)/W),
  • R—thermal resistance of the structure ((m2K)/W) [4].
The value of the heat transfer coefficient of a multilayer structure is calculated as follows:
U = 1 R s i + R + R s e  
where:
  • U—heat transfer coefficient of the structure (W/(m2K)),
  • Rsi—thermal resistance to heat transfer at the internal surface of the structure ((m2K)/W),
  • R—thermal resistance of the structure ((m2K)/W),
  • Rse—thermal resistance to heat transfer at the external surface of the structure ((m2K)/W) [4].
The temperature in the j-th layer of the structure is calculated:
θj = θiU × iθe) × (Rsi + ∑Rj)
where:
  • θj—temperature in the j-th layer of the structure (°C),
  • θi—internal design temperature (°C),
  • θe—outdoor design temperature in winter (°C),
  • U—heat transfer coefficient of the structure (W/(m2K)),
  • Rsi—thermal resistance to heat transfer at the internal surface of the structure ((m2K)/W),
  • ∑Rj—sum of thermal resistances of the j-th layers of the structure ((m2K)/W) [4].
The function of the thermal barrier is to reach the required temperature representing the standard value of thermal resistance R ((m2K)/W) between the statically load-bearing and thermal insulation layers of the building structure and thus reduce the thickness of thermal insulation. For example, in the exemplary construction, the temperature between the statically load-bearing and thermal insulation layer of the building structure is at a thermal insulation thickness of 50 mm θ3 = 15.28 °C and at the standard value at a thermal insulation thickness of 210 mm θ3 = 18.70 °C. This means that the heat supplied in the form of a heat transfer medium to this layer, which increases its temperature by Δθ = 3.42 °C, eliminates the thickness of the thermal insulation by 160 mm (see Figure 2). In other words: the thermal barrier creates a building structure with energetically active elements with the function of active control of the heat transfer through this construction. We assume that the building structure under consideration with a thermal barrier temperature between the load-bearing part and the thermal insulation of θ3 = 18.70 °C has an equivalent thermal resistance Requivalent ((m2K)/W) at a smaller thickness TI equal to the standard thermal resistance Rstandard ((m2K)/W).
The graphs in Figure 3 and Figure 4 show that the higher the temperature between the statically load-bearing and thermal insulation layer of the building structure, the higher the thermal resistance R ((m2K)/W) and vice versa the lower the heat transfer coefficient U (W/(m2K)). Specifically, in our example of a facade, this temperature is θ3 = 18.7 °C to meet the standard requirement for thermal resistance (thermal insulation is 210 mm).

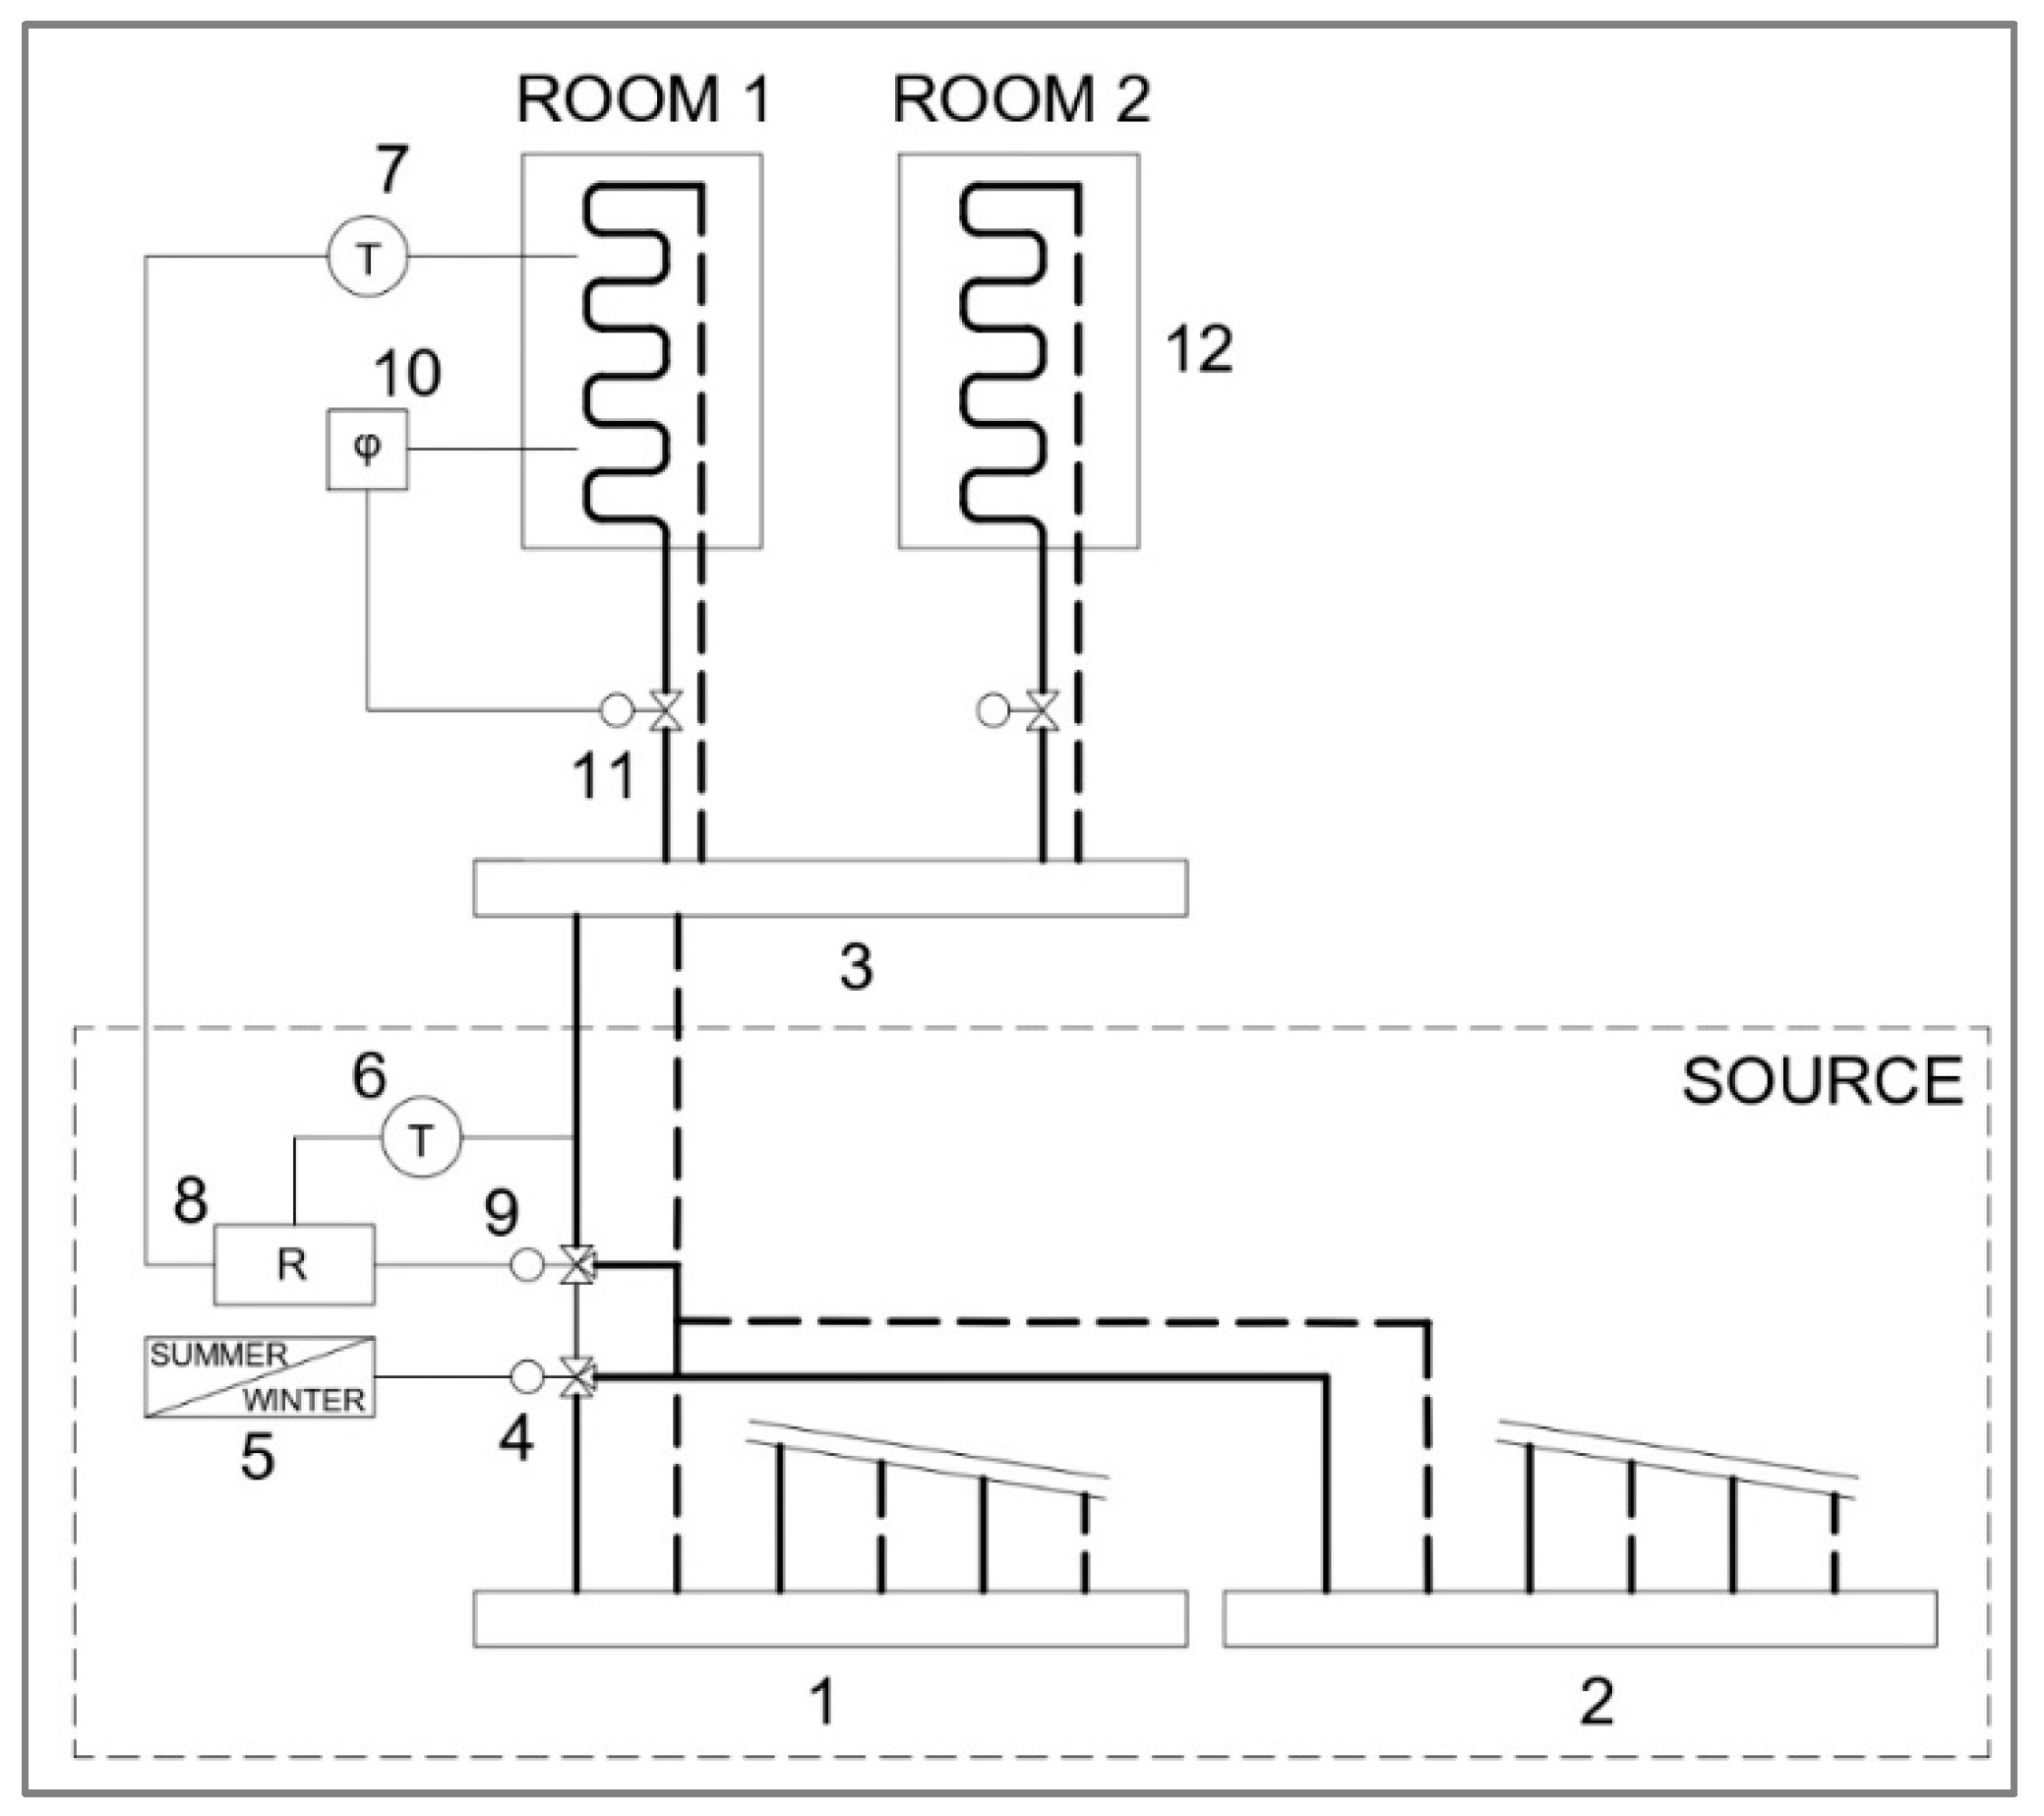
3.2. Continuous Control of the Heating/Cooling Supply Temperature According to the Temperature at the Level of the Thermal Barrier

If the energy system consists of several consumer circuits with different heat supply requirements, the heating water temperature at the outlet of the source circuit is regulated according to the requirement of the circuit with the highest priority (highest required flow temperature). In Figure 5 is a two-pipe thermal barrier system with summer–winter operation switching.
In the case of a thermal barrier, it is recommended to use a qualitative temperature control of the heating or cooling water, which is usually located directly in the source space at the outlet of the central manifold and the heating/cooling collector (1) and (2). The circuit shall be supplemented by a temperature sensor at the level of the thermal barrier (7), and installed in the reference room. The required temperature at the thermal barrier level shall be set by the controller depending on whether it is winter or summer. It is recommended to divide the rooms with thermal barrier into zones according to NW–SE or NE–SW orientation. The controller (8) calculates the required temperature of the heat transfer medium (6) according to the temperature at the level of the thermal barrier and then controls the actuation of the three-way mixing valve (9). Each thermal barrier circuit is equipped with a two-way actuated control valve in the inlet pipe (11) at the outlet of the zone manifold/collector (3). If the thermal barrier is also operated in cooling mode, a contact humidity sensor (10) shall be installed in the coldest part of the system, usually in the supply line, as a protection against condensation. When the set humidity value is reached, the cooling water supply is shut off (passive protection). When installing under plaster, it is recommended to use a compensation pipe to ensure air access.

4. Energy, Economic and Environmental Analysis of the Use of the Thermal Barrier

In the energy, economic and environmental analysis of the thermal barrier function—a facade with integrated energy-active elements, which eliminates the thickness of thermal insulation, under the condition of achieving the required equivalent value of thermal resistance Requivalent ((m2K)/W) equal to the standard value of thermal resistance Rstandard ((m2K)/W) —we calculated, analyzed and compared the specific heat flux from the TB qTB (W/m2), the annual heat demand for the thermal barrier QTB (kWh/ year), the cost of delivered heat for TB PHEAT-TB (€/m2year), the price of EPS facade polystyrene PEPS (€/m2), the grey energy ΔGE (kWh/m3) and the time required for the higher economic efficiency of the thermal barrier (TB) (years), with the economic indicator No. 1 (EI1) to No. 3 (EI3) for different operating times: 24, 16 and 8 h per day. The equations are described for a fragment of a building structure with a TB with an area of 1 m2. We have used a simplified calculation of the economic efficiency and modified the equations for application in this study [26,27].
The specific heat flux from the TB is calculated:
qTB = Ue × jθe)
where:
  • qTB—specific heat flux from the TB (W/(m2)),
  • Ue—coefficient of heat transfer of the structure from the thermal insulation towards the exterior (W/(m2K)),
  • θj—temperature in the j-th layer of the structure (°C)
  • θe—outdoor computational temperature in winter (°C) [26,27].
The annual heat demand for a TB with a fragment area of 1 m2 is calculated:
Q TB = t   ×   3600   ×   ε   ×   Φ HL ×   θ i θ e , p r θ i θ e   ×   d   ×   10 6
Q TB = ( t ×   3600   ×   ε   ×   Φ HL   ×   θ i θ e , p r θ i θ e   ×   d   ×   10 6 )   ×   277 , 778
where:
  • QTB—annual heat demand for a TB with a fragment area of 1 m2 (GJ/year, kWh/year),
  • t—TB operation time per day (8, 16, 24 h),
  • ΦHL—heat input of TB (kW), ΦHL= qTB × A/1000 (kW)
    • qTB—specific heat flux from TB (W/m2)
    • A—area = 1 m2,
  • ε—coefficient of non-present of operation, type of control and heating mode (−),
    • ε = 0.80 central control,
    • ε = 0.75 central zonal control,
    • ε = 0.70 central control and individual control,
  • θi—indoor design temperature (°C)
  • θe—outdoor winter design temperature (°C)
  • θe,pr—average outdoor air temperature in the heating period (°C),
  • d—number of days in the heating period, Bratislava = 208 days (−) [26,27].
The annual heat demand for a TB with a fragment area of 1 m2 using RES or waste heat is calculated:
QTB, RSE or WH = QTB × (RSE or WH)/100
QTB, RSE or WH = (QTB × (RSE or WH)/100) × 277,778
where:
  • QTB, RSE or WH—annual heat demand for a TB with a fragment area of 1 m2 using RES or waste heat (GJ/year, kWh/year),
  • QTB—annual heat demand for a TB with a fragment area of 1 m2 (GJ/year, kWh/year),
  • RES—delivered heat from RES to TB (%),
  • WH—delivered heat from WH to TB (%).
Calculation of the annual cost of heat delivered to a TB with a fragment area of 1 m2:
PHEAT-TB = QTB × PHEAT
PHEAT-TB, RSE or WH = QTB, RSE or WH × PHEAT
where:
  • PHEAT-TB—annual cost of heat delivered to a TB with a fragment area of 1 m2 (€/year),
  • PHEAT-TB, RSE or WH—annual cost of heat delivered to a TB with a fragment area of 1 m2 using RES or waste heat (€/year),
  • QTB, RSE or WH—annual heat demand for TB using RES or waste heat (GJ/year, kWh/year)
  • QTB—annual heat demand for TB (GJ/year, kWh/year),
  • PHEAT—unit price for heat, natural gas, electricity and other energy carriers (€/kWh).
The following graphs and tables show: the development of prices of electricity (source: Eurostat [29]), Figure 6 and Figure 7; natural gas (source: Eurostat [29]), Figure 8 and Figure 9; prices for heat supply (source: https://www.teplarenzilina.sk/zakaznicka-zona/ceny-tepla [28]), Table 1; and the price for facade EPS (source: Price list of thermal insulation and accessories ISOVER [30]), Table 2.
Figure 10 shows the dependence of the temperature in the layer of thermal barrier θ3 (°C), the thermal resistance of the building structure R ((m2K)/W), the specific heat flux from the TB qTB (W/m2) and the price of the facade polystyrene EPS PEPS (€/m2) from thermal insulation thickness. For example, for a building structure with TB and a thermal insulation thickness of 50 mm, the following is true:
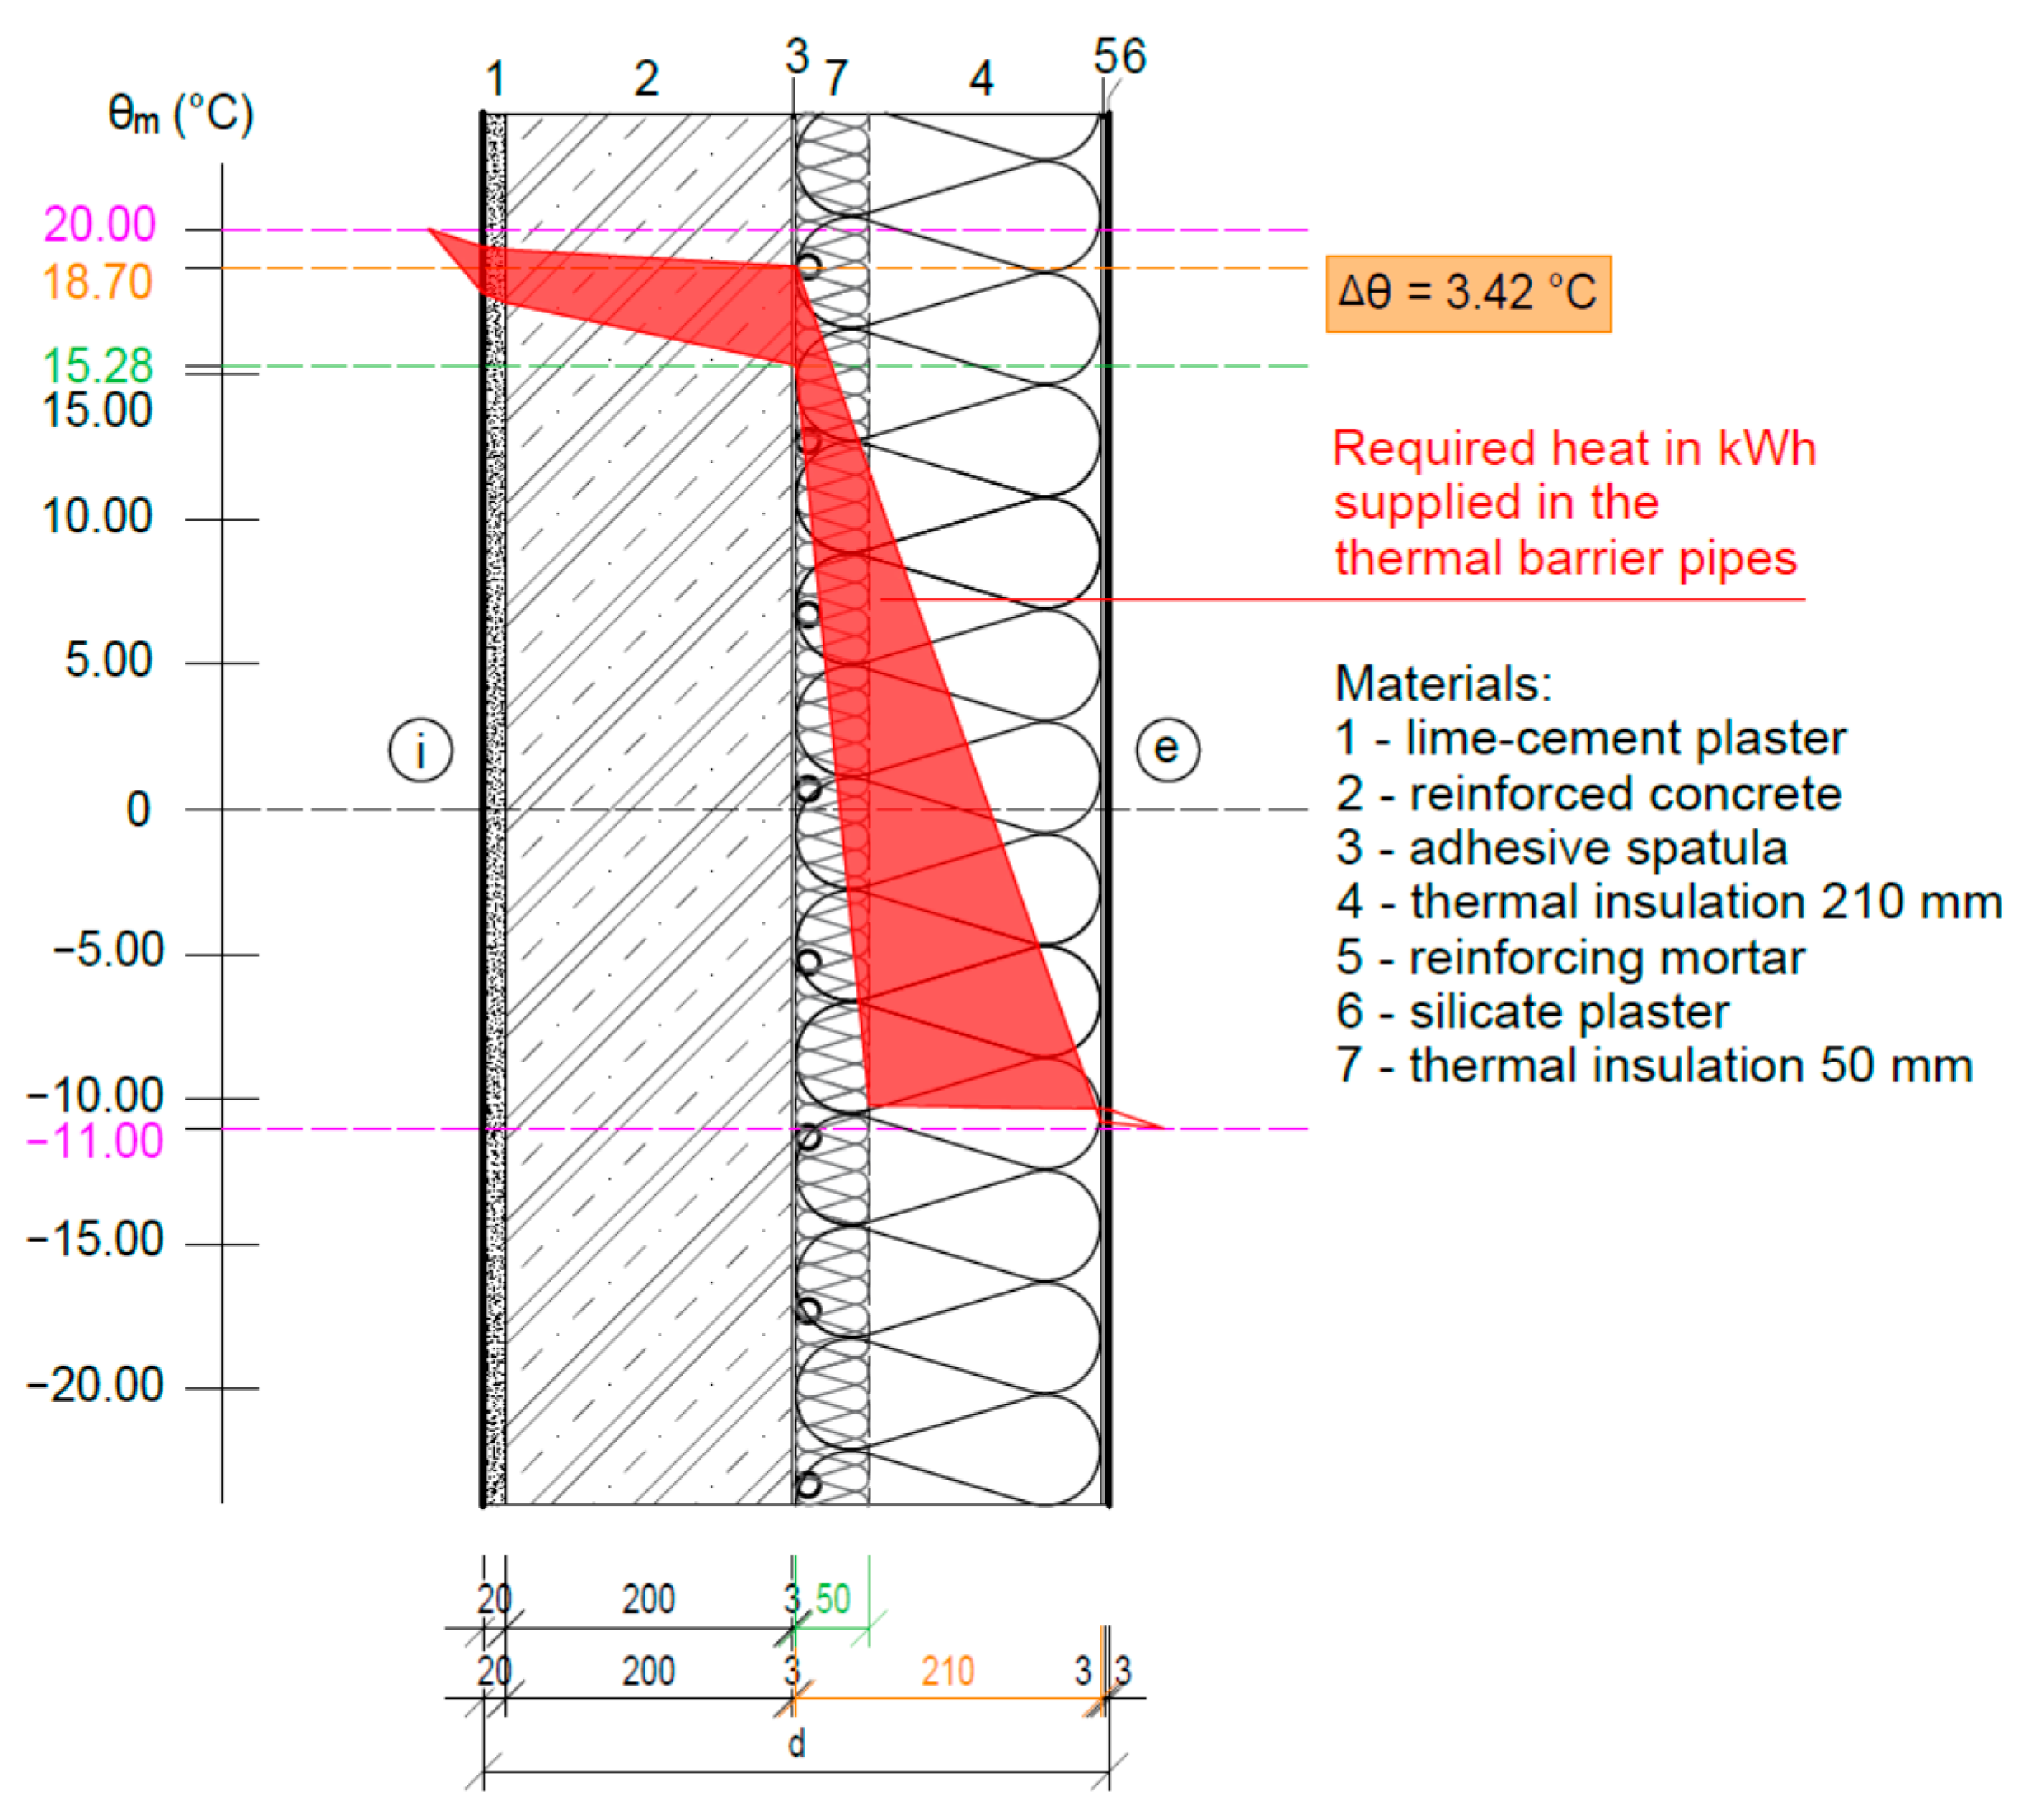
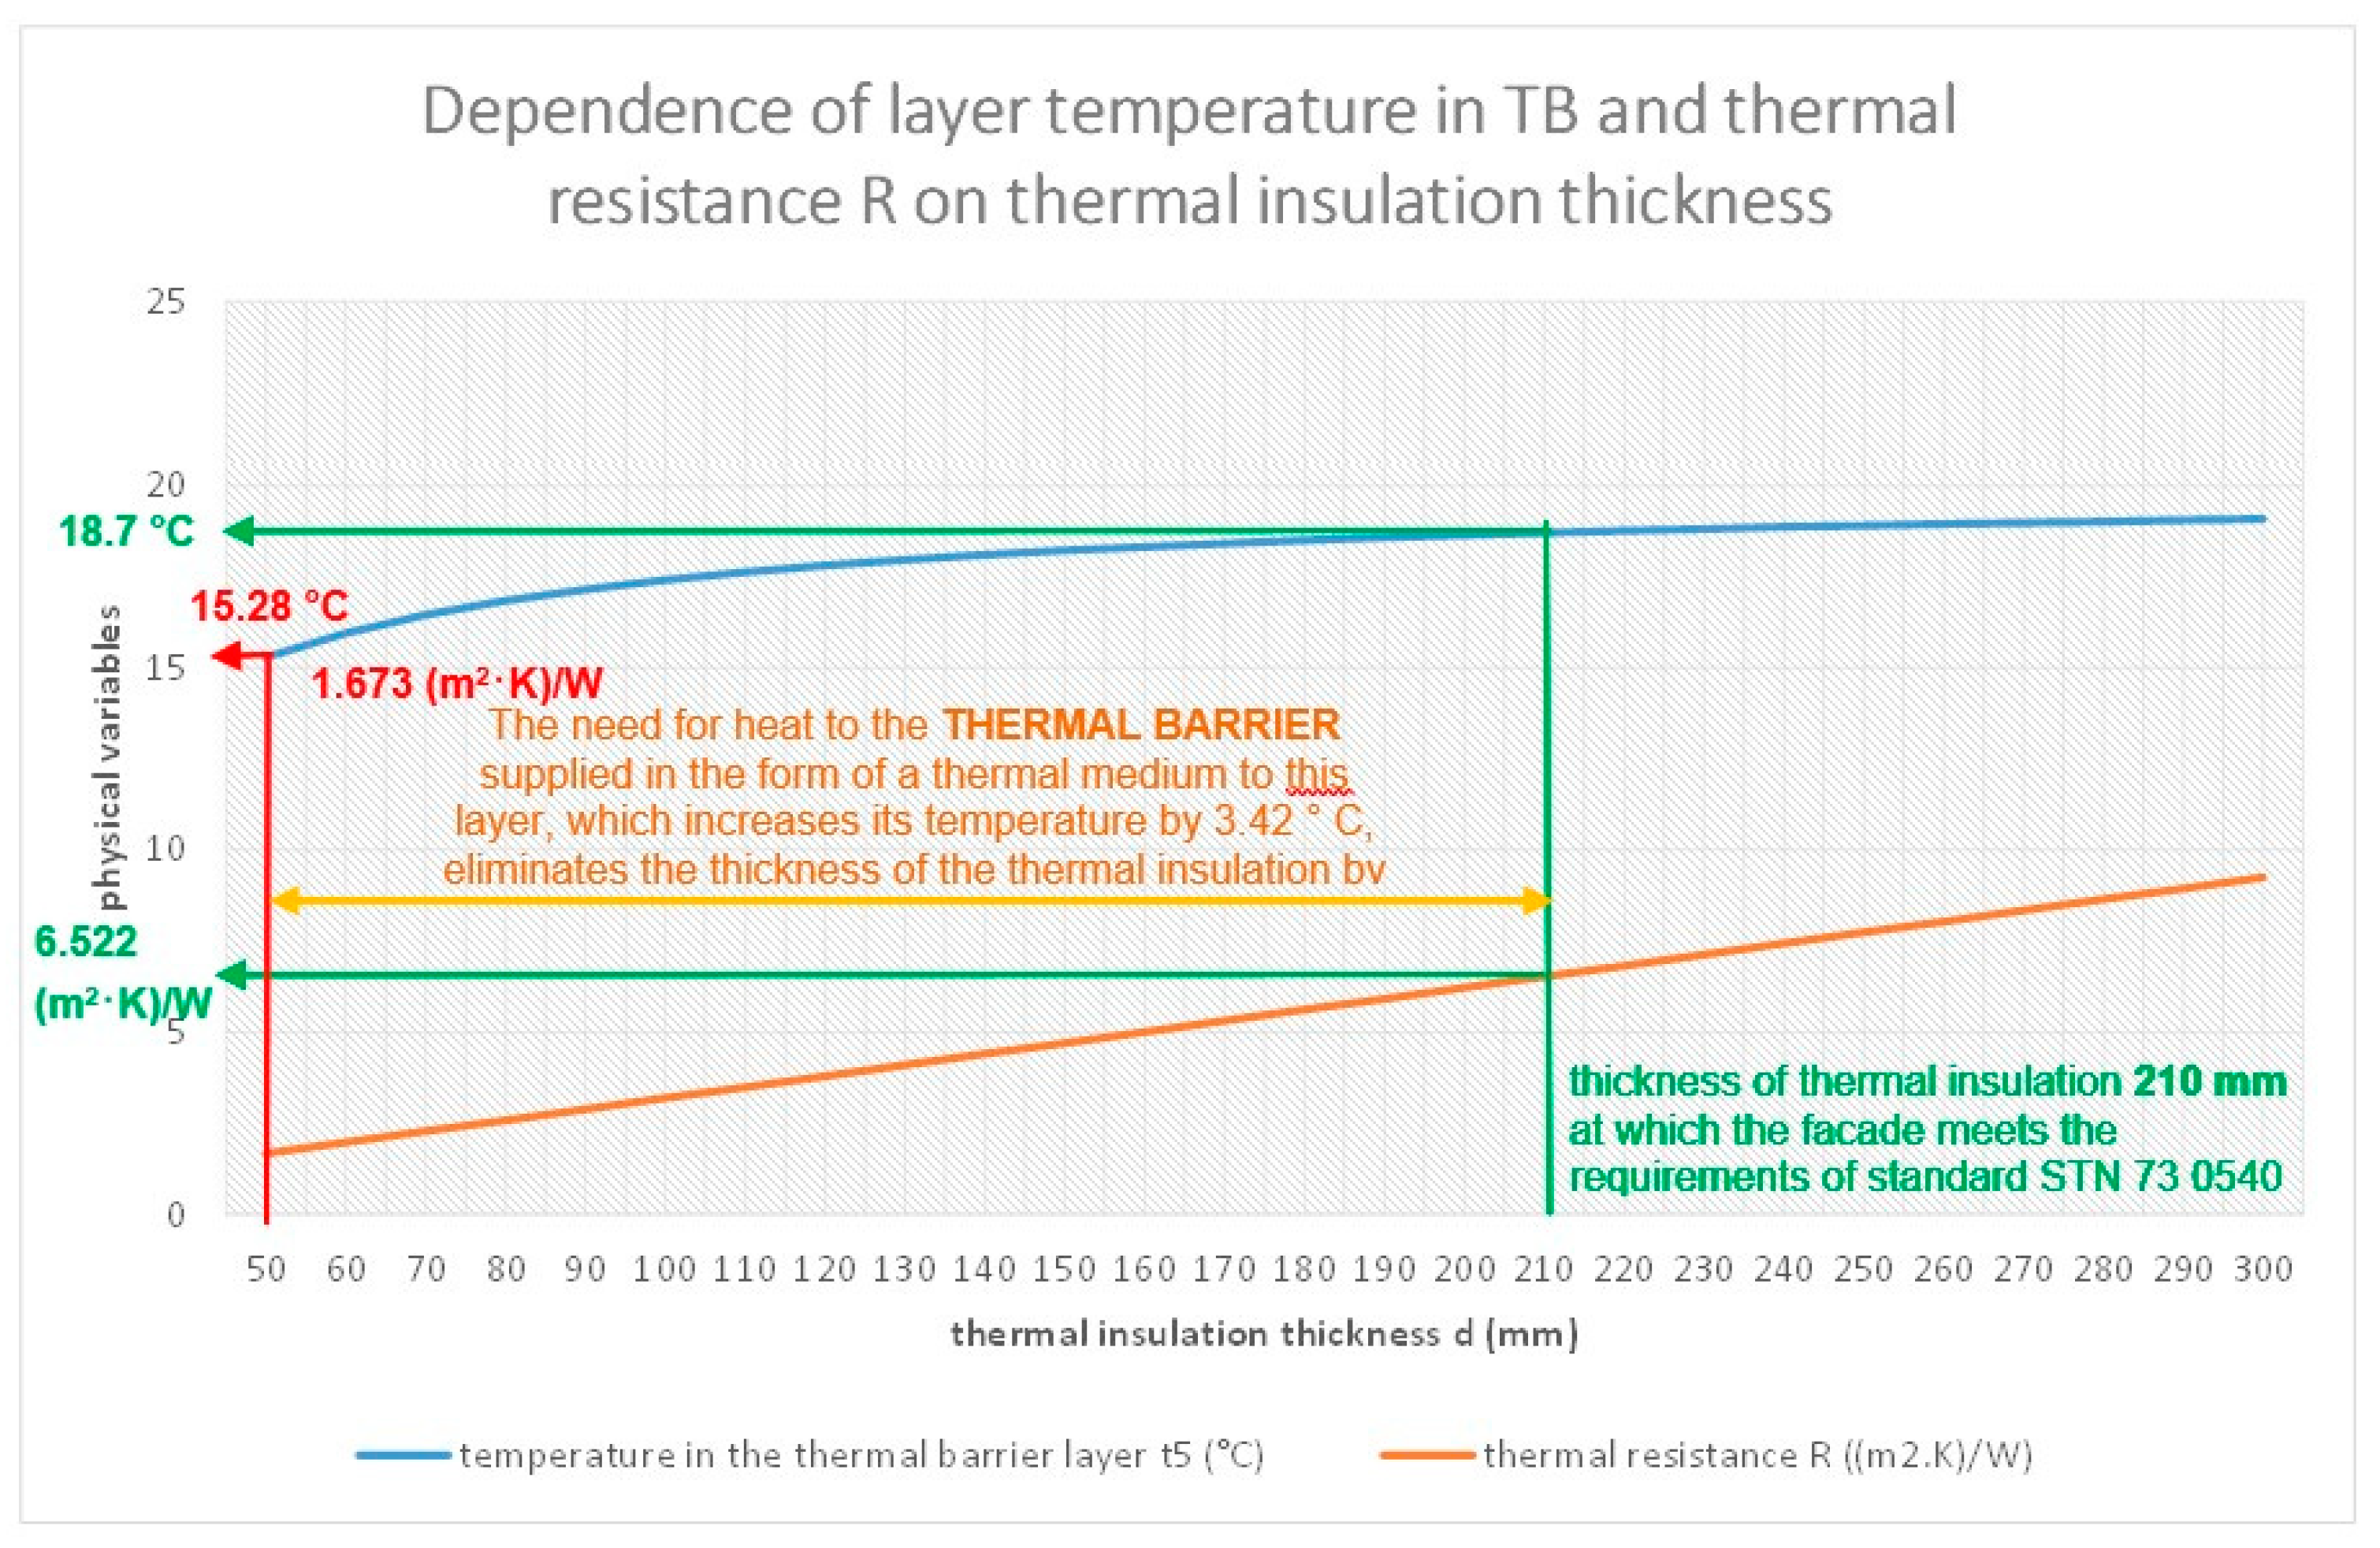
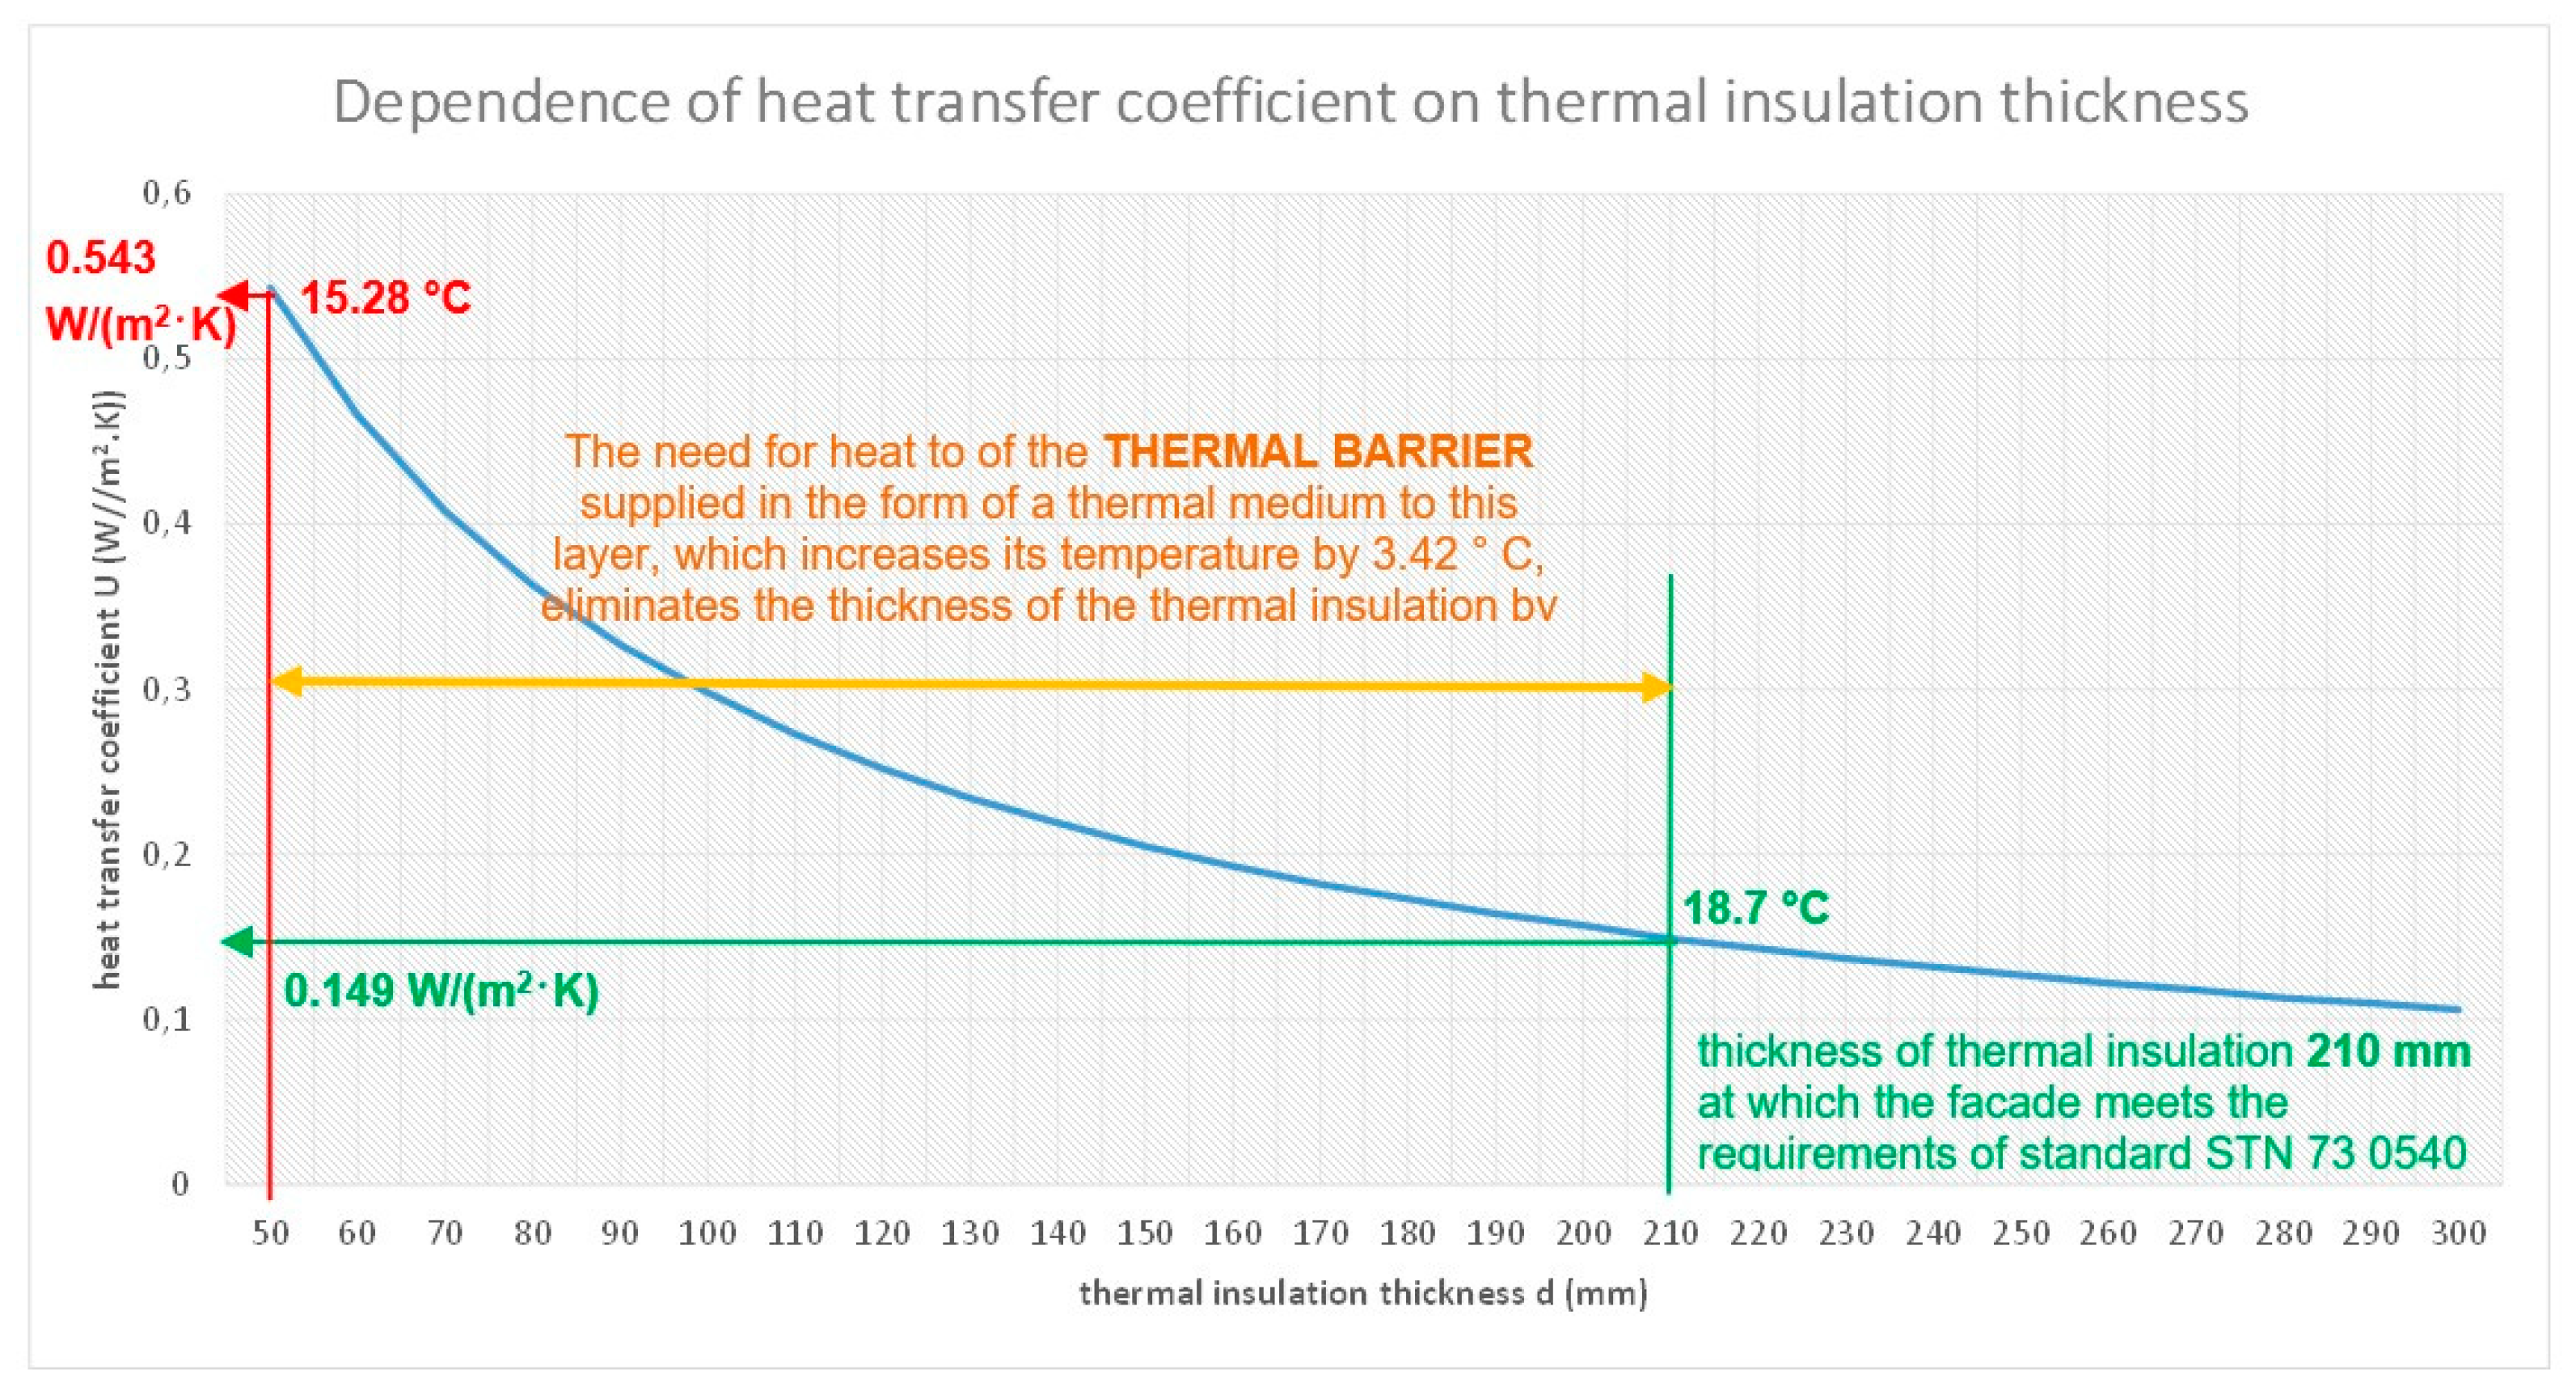
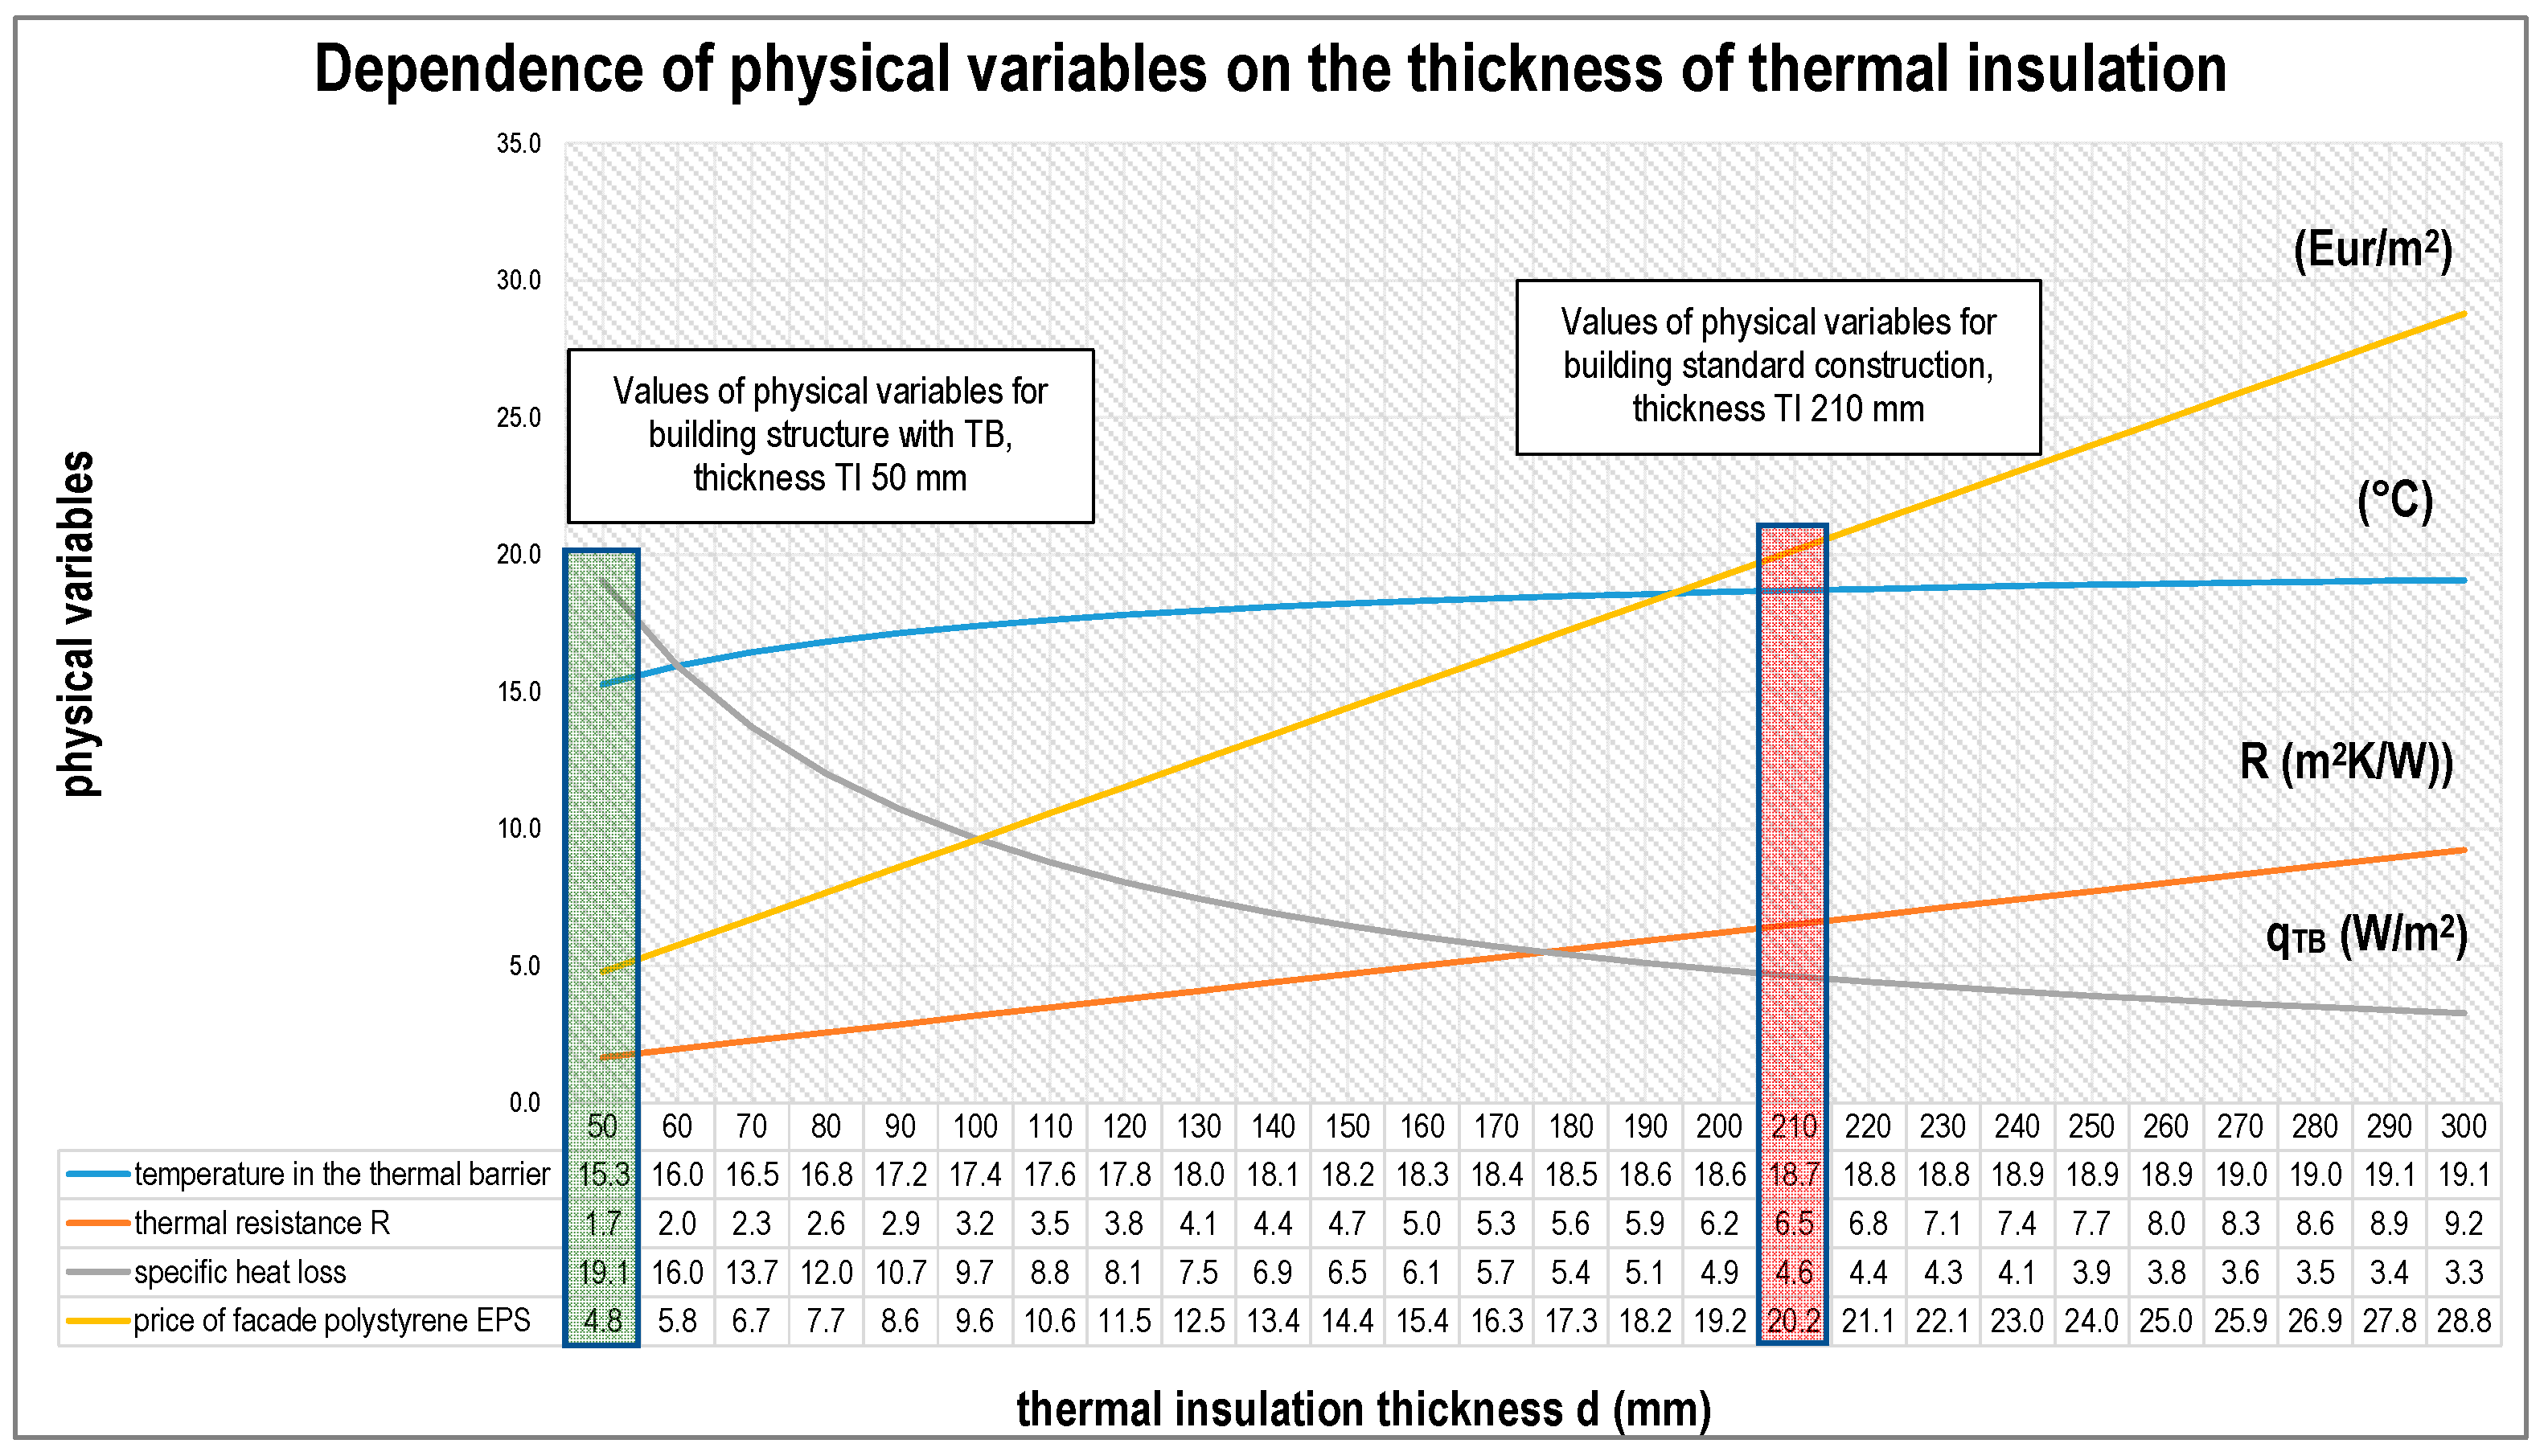
  • the temperature between the load-bearing part and the thermal insulation part of the envelope wall is 15.3 °C, with a standard value of 18.7 °C;
  • a thermal resistance of 1.7 (m2K)/W, with a standard value of 6.5 (m2K)/W;
  • a specific heat flux of 19.1 W/m2, with a standard value of 4.6 W/m2;
  • price of thermal insulation 4.8 €/m2, with standard value 20.2 €/m2.
Figure 11 describes the dependence of the annual heat demand for heating of the TB with a fragment area of 1 m2 building construction as a function of the operating time: 24, 16 and 8 h for the different thicknesses of thermal insulation. For example, for a building structure with TB and a thermal insulation thickness of 50 mm, these are:
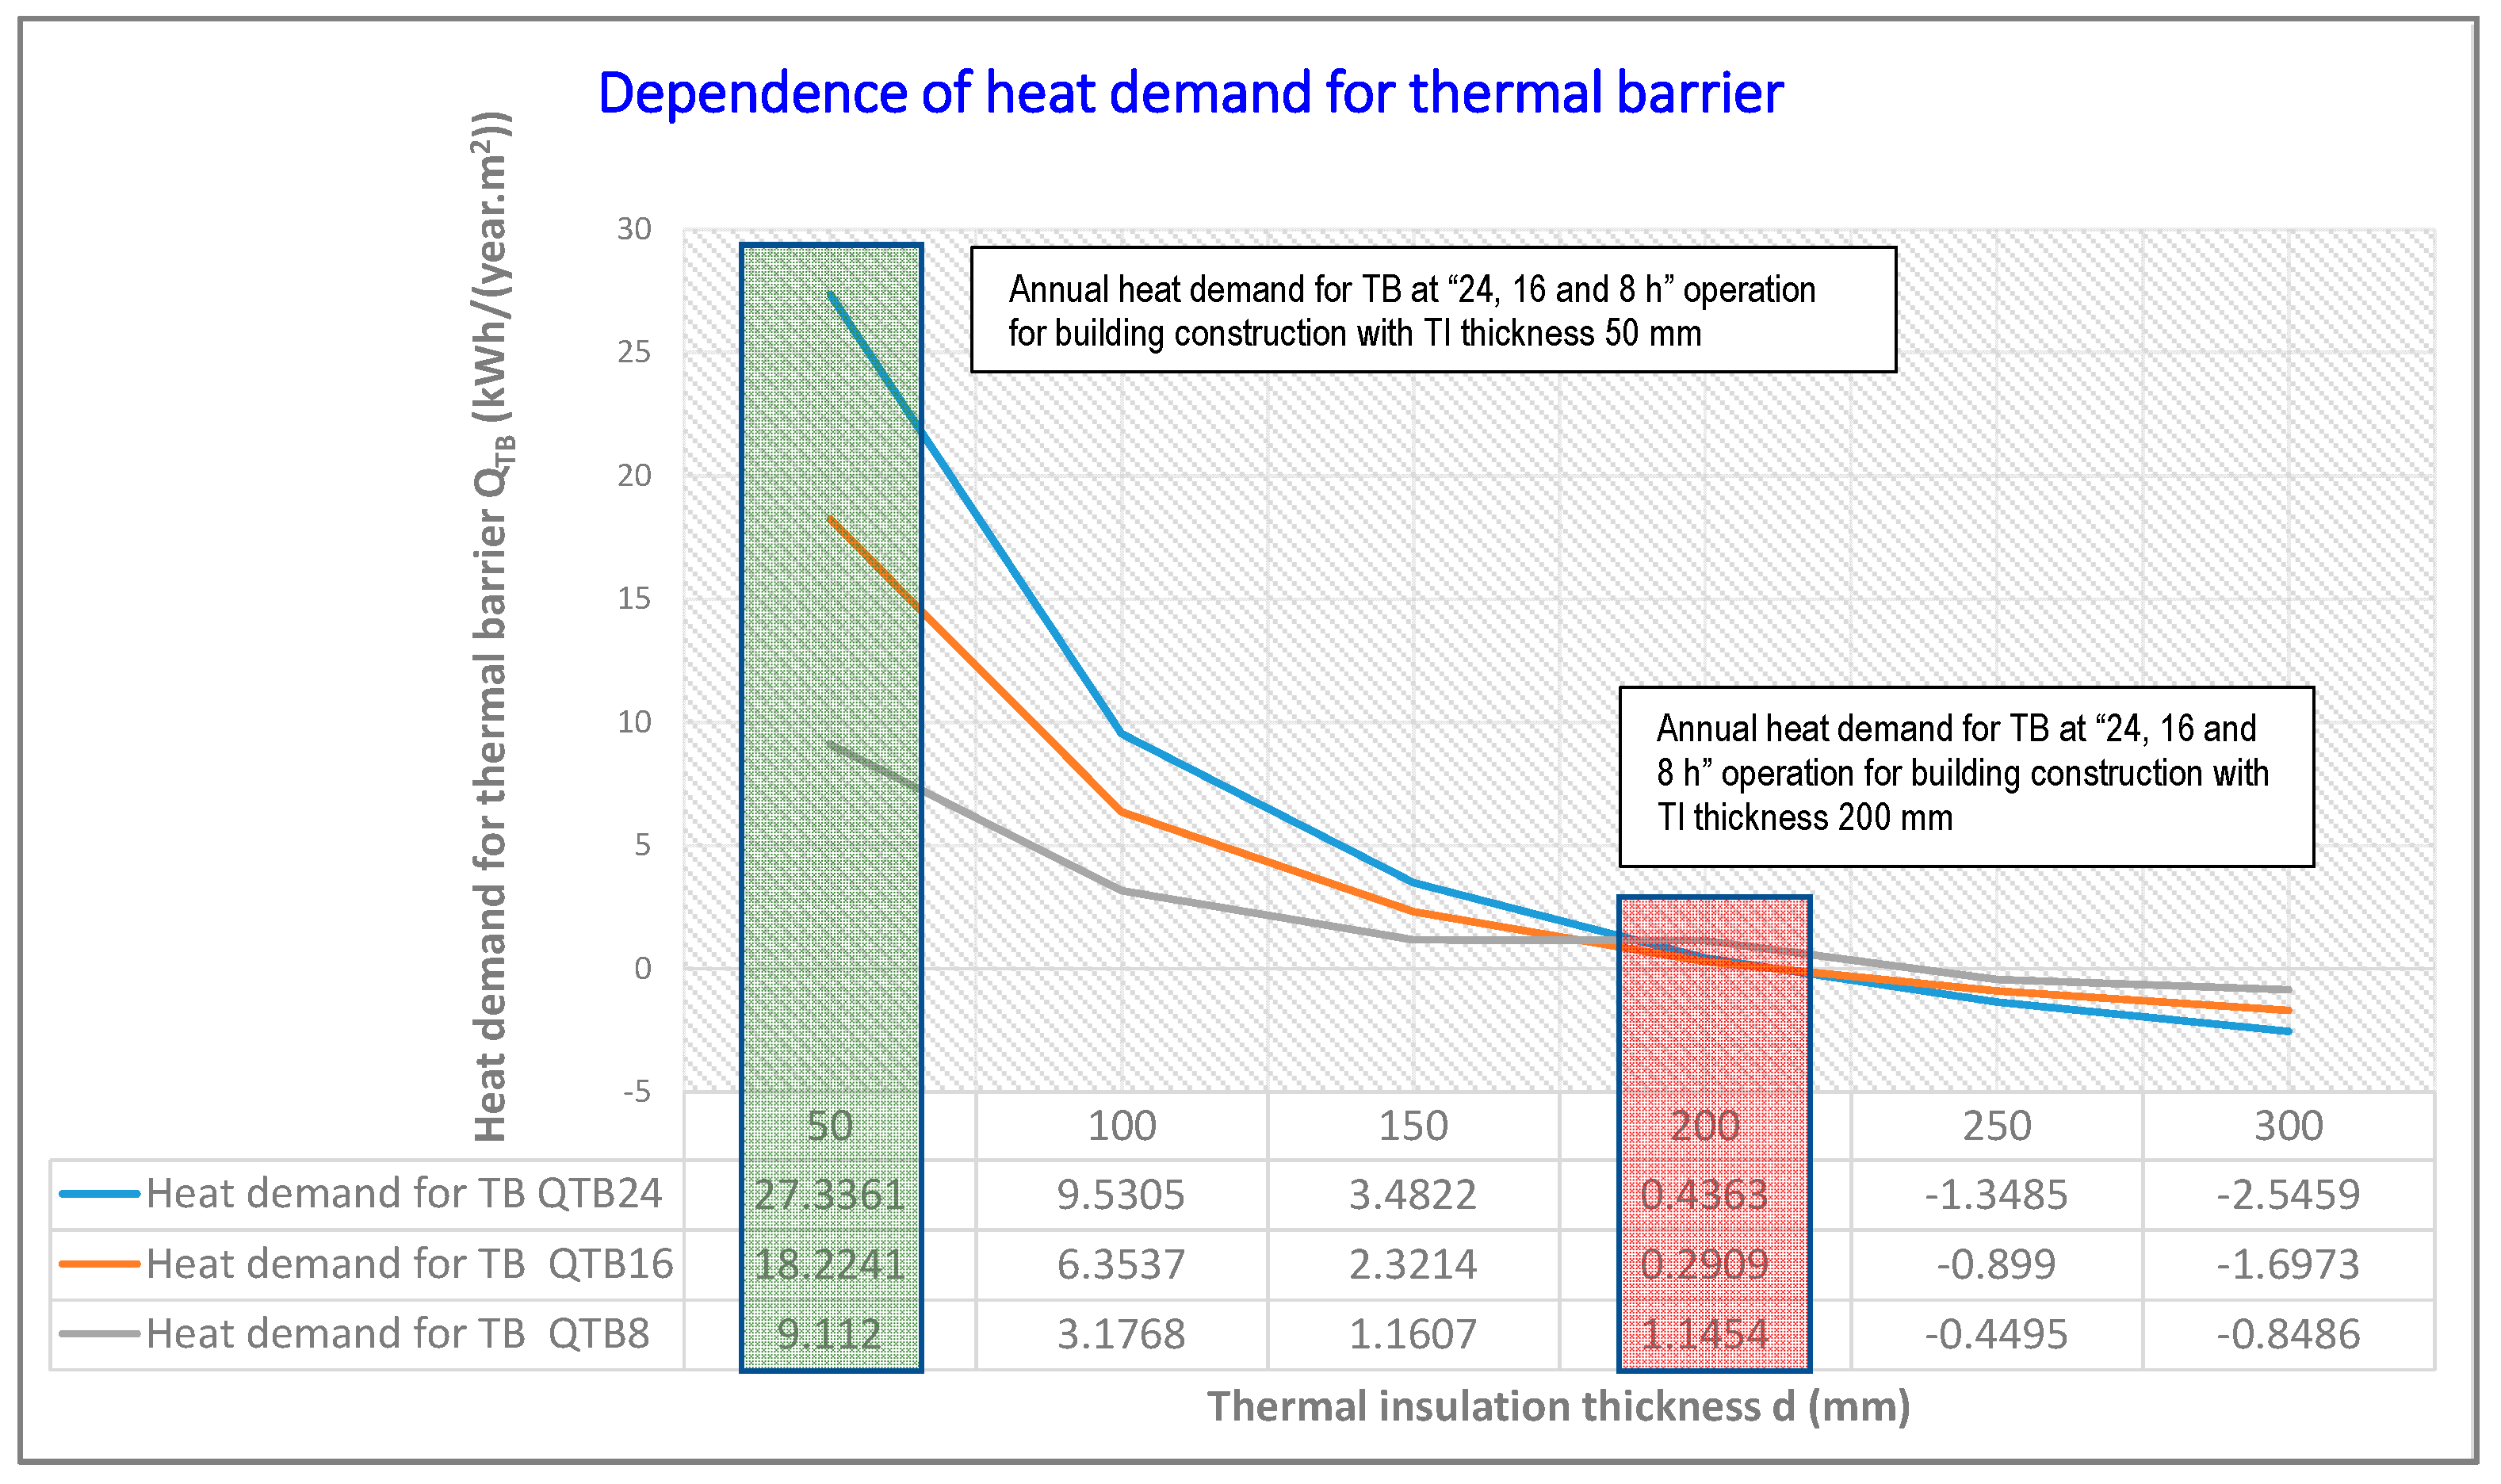
  • annual heat demand for TB at 24 h operation 27.34 kWh/(m2year),
  • annual heat demand for TB at 16 h operation 18.22 kWh/(m2year),
  • annual heat demand for TB at 8 h operation 9.11 kWh/(m2year).
Figure 12 shows the dependence of the annual heat cost for a TB with a fragment area of 1 m2 of the building structure in euros depending on the operating time: 24 h for different thicknesses of thermal insulation and the heat price for different heat sources. For example, for a building structure with TB and a thermal insulation thickness of 50 mm, these are:
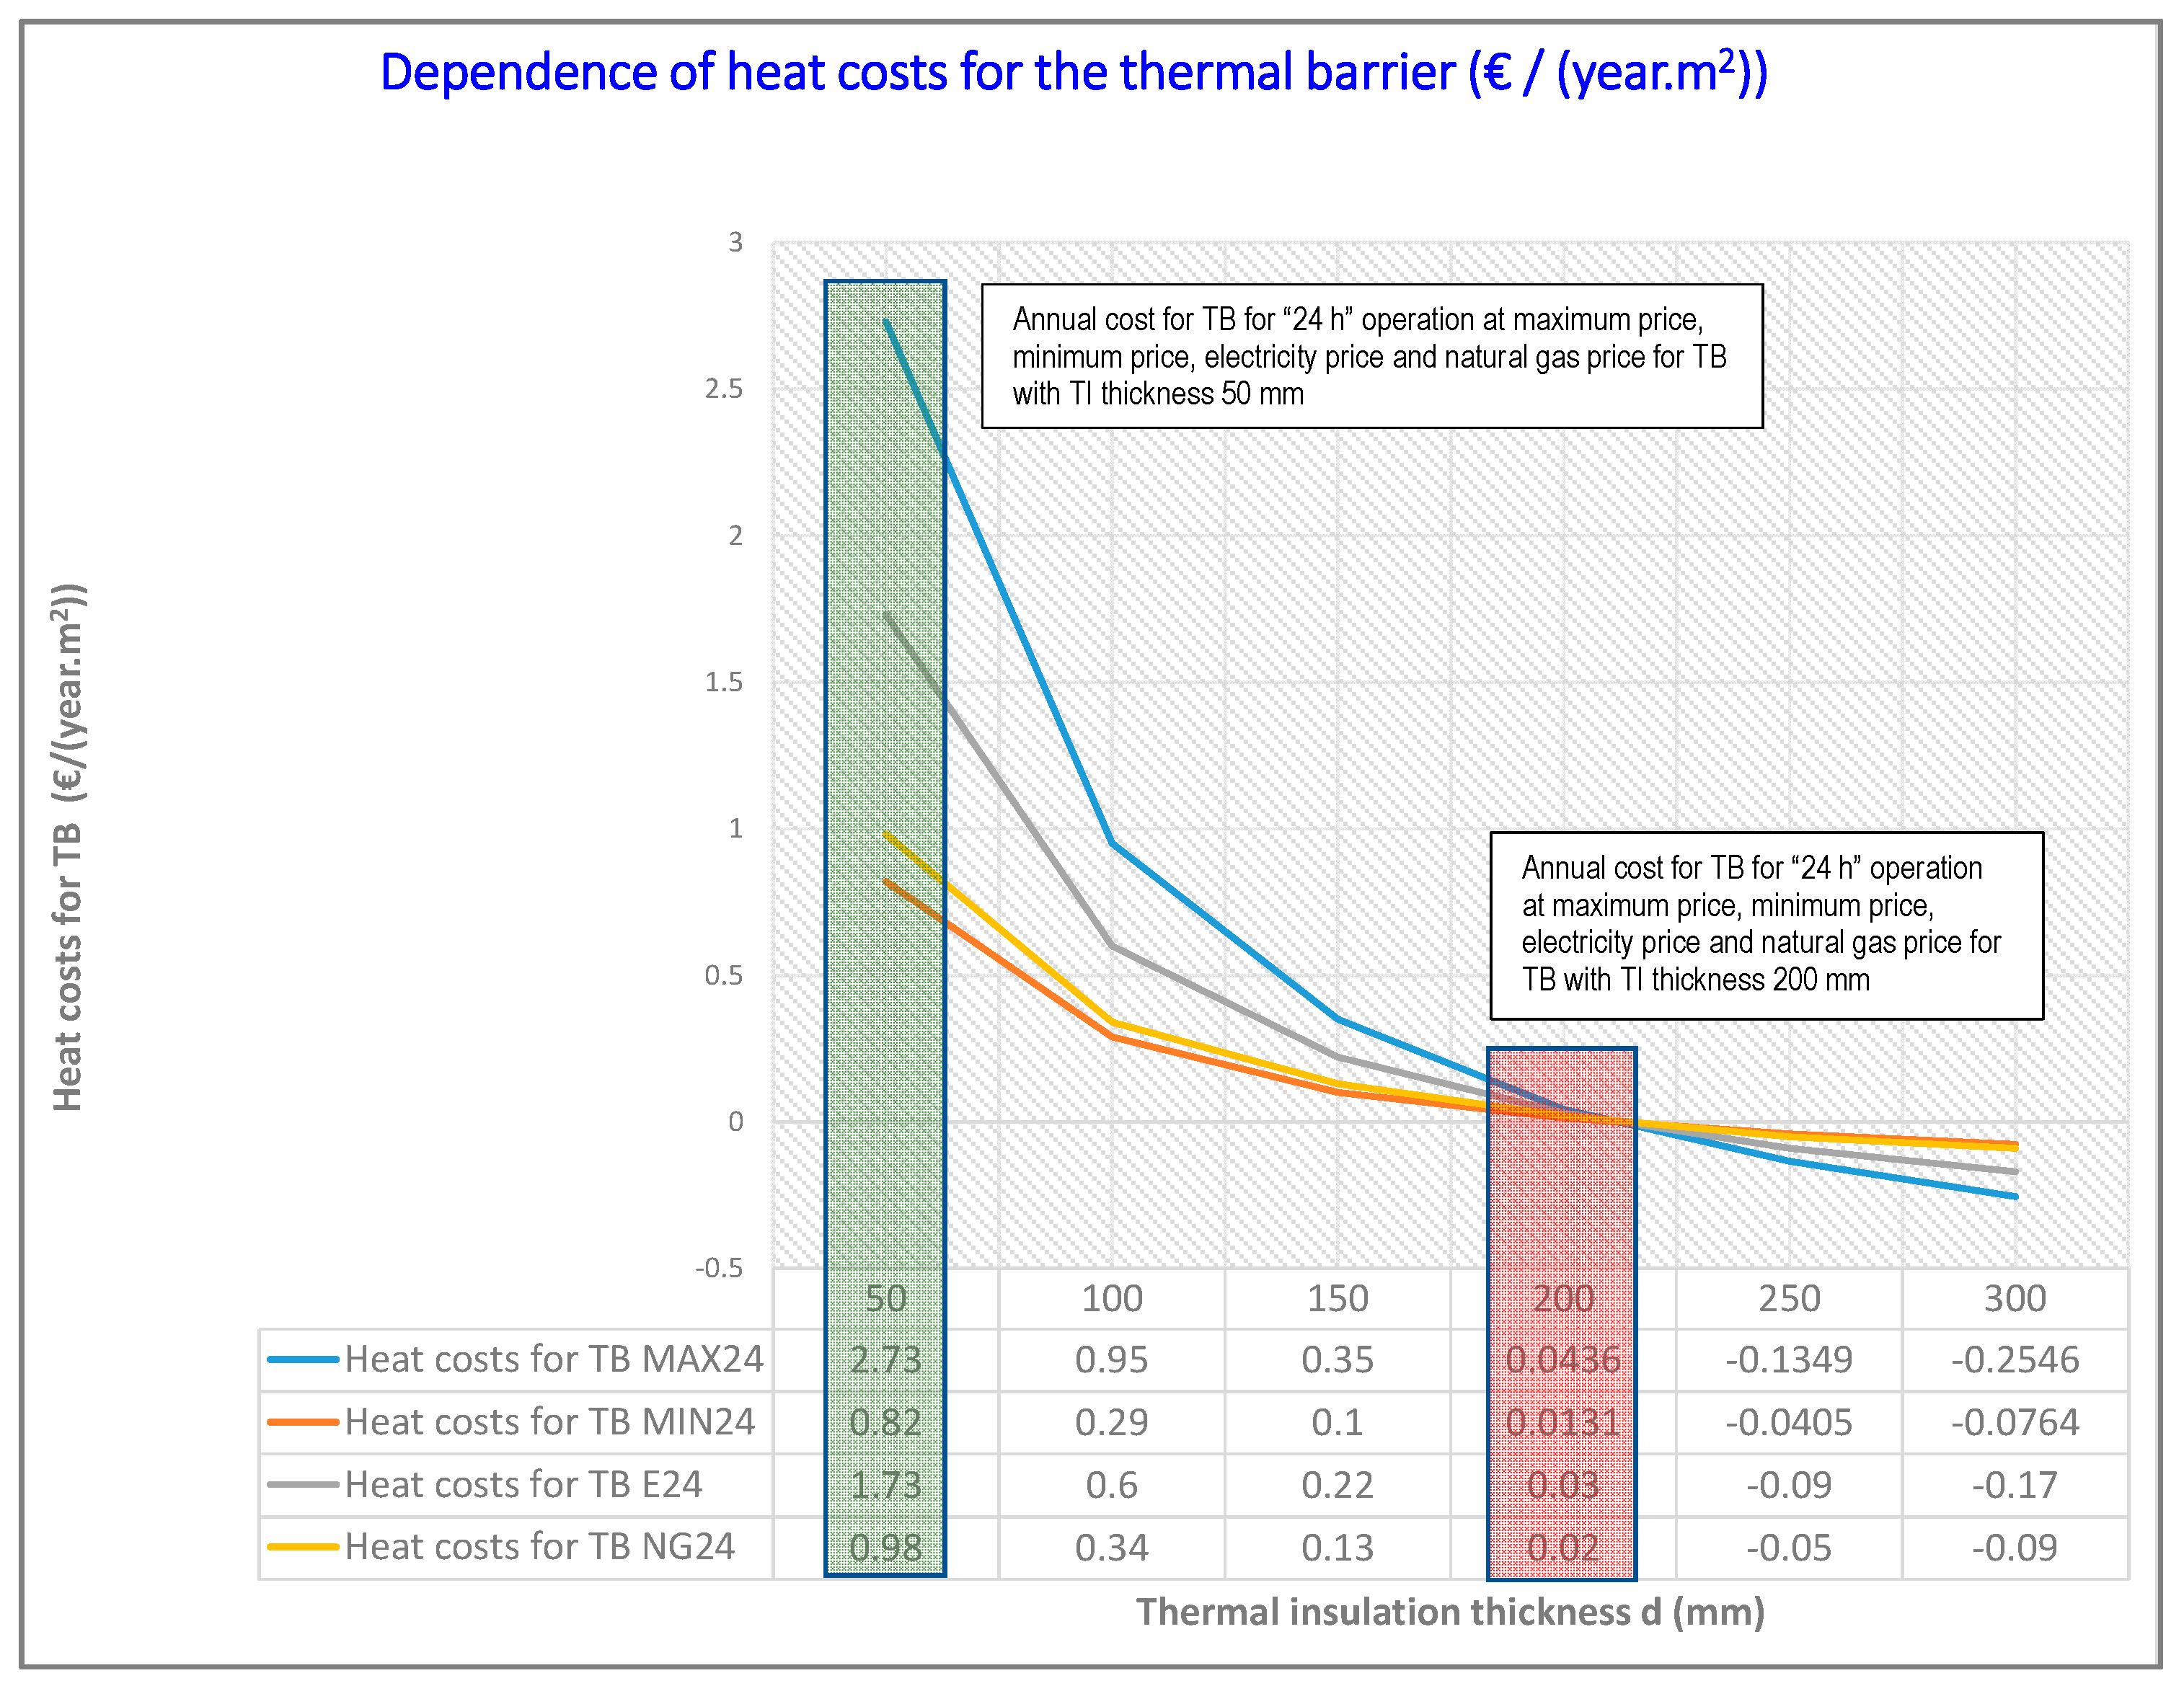
  • the annual cost for TB at 24 h operation at the maximum price is 2.73 €/(m2year),
  • the annual cost for TB at 24 h operation at the minimum price is 0.82 €/(m2year),
  • the annual cost for TB for 24 h operation at the electricity price is 1.73 €/(m2year),
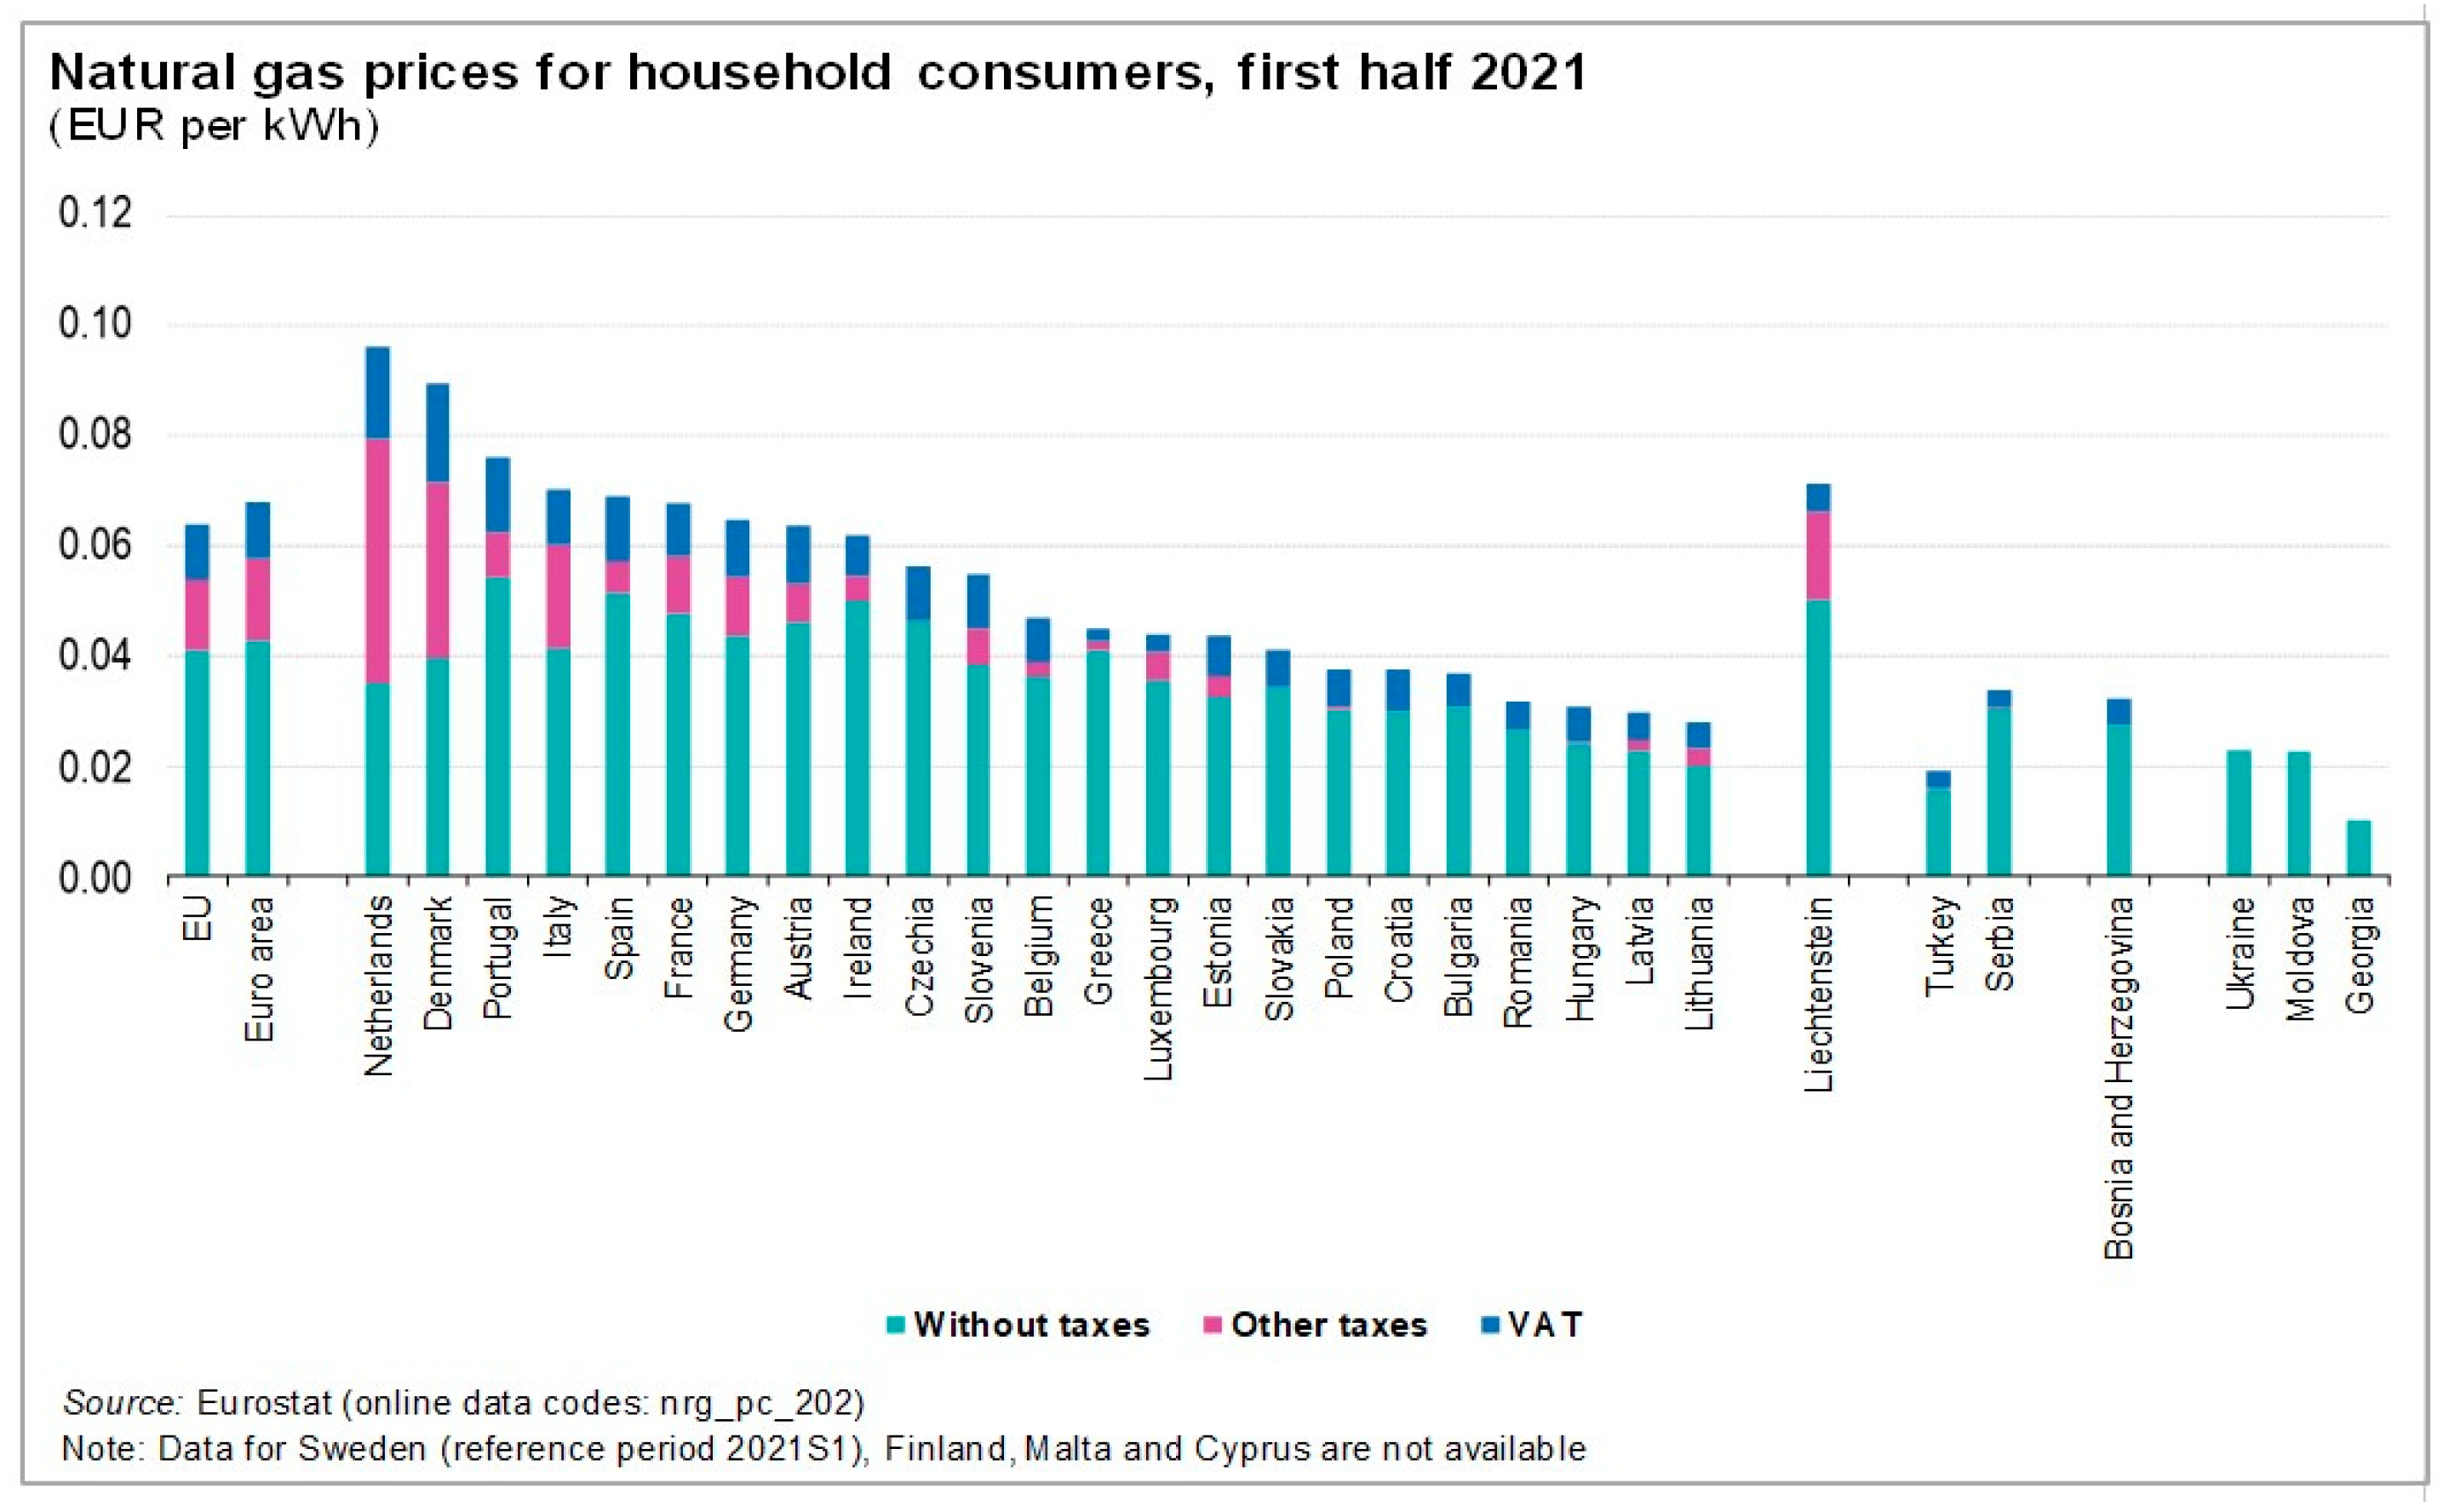
  • the annual cost for TB at 24 h operation at the natural gas price is 0.98 €/(m2year).

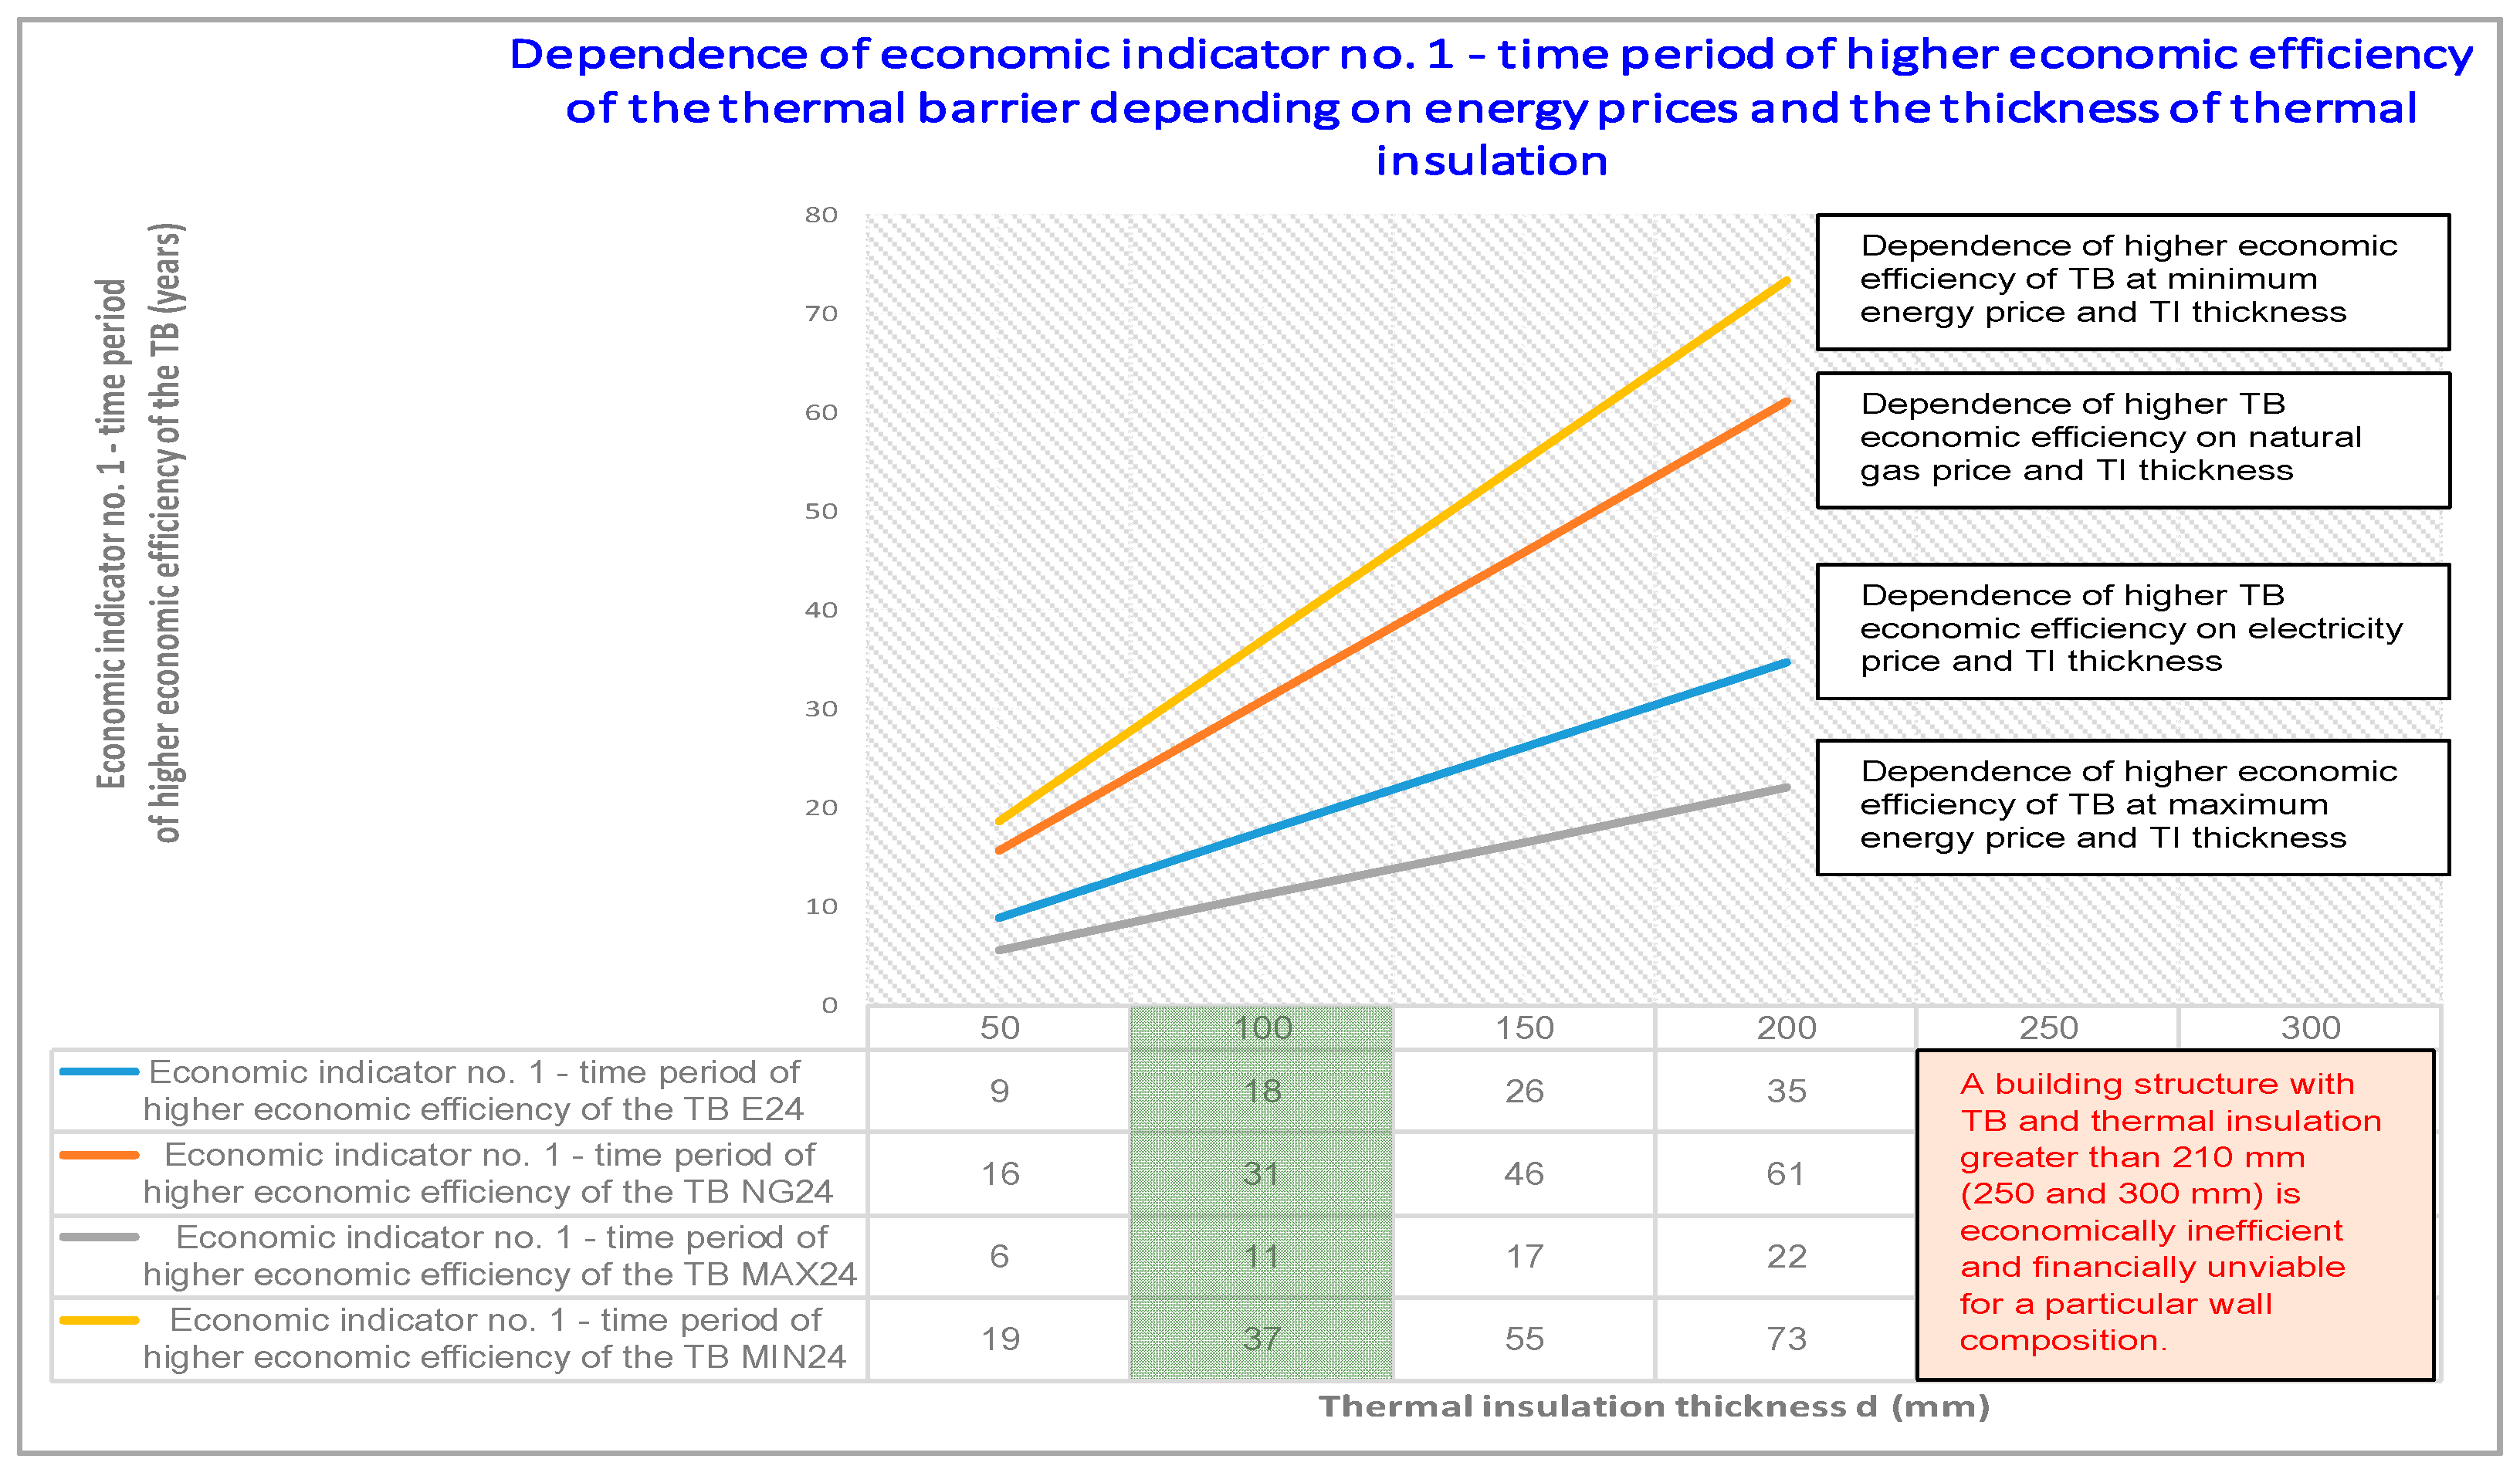
4.1. Economic Indicator No. 1—Time Period of Higher Economic Efficiency of the Thermal Barrier Depending on Energy Prices and Thickness of Thermal Insulation

Economic indicator No. 1 characterizes the time period of higher economic efficiency of TB depending on energy prices and thickness of thermal insulation in relation to the ratio of increased cost of thermal insulation for a building structure with standard value of thermal resistance and the cost of heat required for TB.
Under simplifying assumptions, we can calculate economic indicator No. 1 as follows:
EI 1 = P E P S S T A N D A R D P E P S T B P H E A T T B  
EI 1 ,   RSE   or   WH = P E P S S T A N D A R D P E P S T B P H E A T T B ,   R S E   o r   W H  
where:
  • EI1—economic indicator No. 1 taking into account the annual heat demand for a TB with a fragment area of 1 m2 without the use of RES or waste heat (years),
  • EI1, RSE or WH—economic indicator No 1 taking into account the annual heat demand for a TB with a fragment area of 1 m2 using RES or waste heat (years),
  • PEPS-STANDARD—price per m2 of thermal insulation thickness at the standard value of thermal resistance of the building structure (€/m2),
  • PEPS-TB—price per m2 of thermal insulation thickness for building construction with TB (€/m2),
  • PHEAT-TB—annual cost of heat delivered to a TB with a fragment area of 1 m2 (€/year),
  • PHEAT-TB, RSE or WH—annual cost of heat delivered to a TB with a fragment area of 1 m2 using RES or waste heat (€/year).
Figure 13 shows that for a TB application with less than half of the thermal insulation thickness (100 mm) compared to the normative building construction (TI = 210 mm), economic indicator No. 1 is 11 years for the maximum energy price, 18 years for electricity, 31 years for natural gas and 37 years for the minimum energy price. Economic indicator 1 shows the economic efficiency of a building structure with TB and thermal insulation thinner than the standard required thickness of 210 mm for a given external wall. A building structure with TB and thermal insulation greater than 210 mm (250 and 300 mm) is economically inefficient and financially unviable for a particular wall composition. For this reason, the values for 250 and 300 mm thick thermal insulation are not shown in the chart.

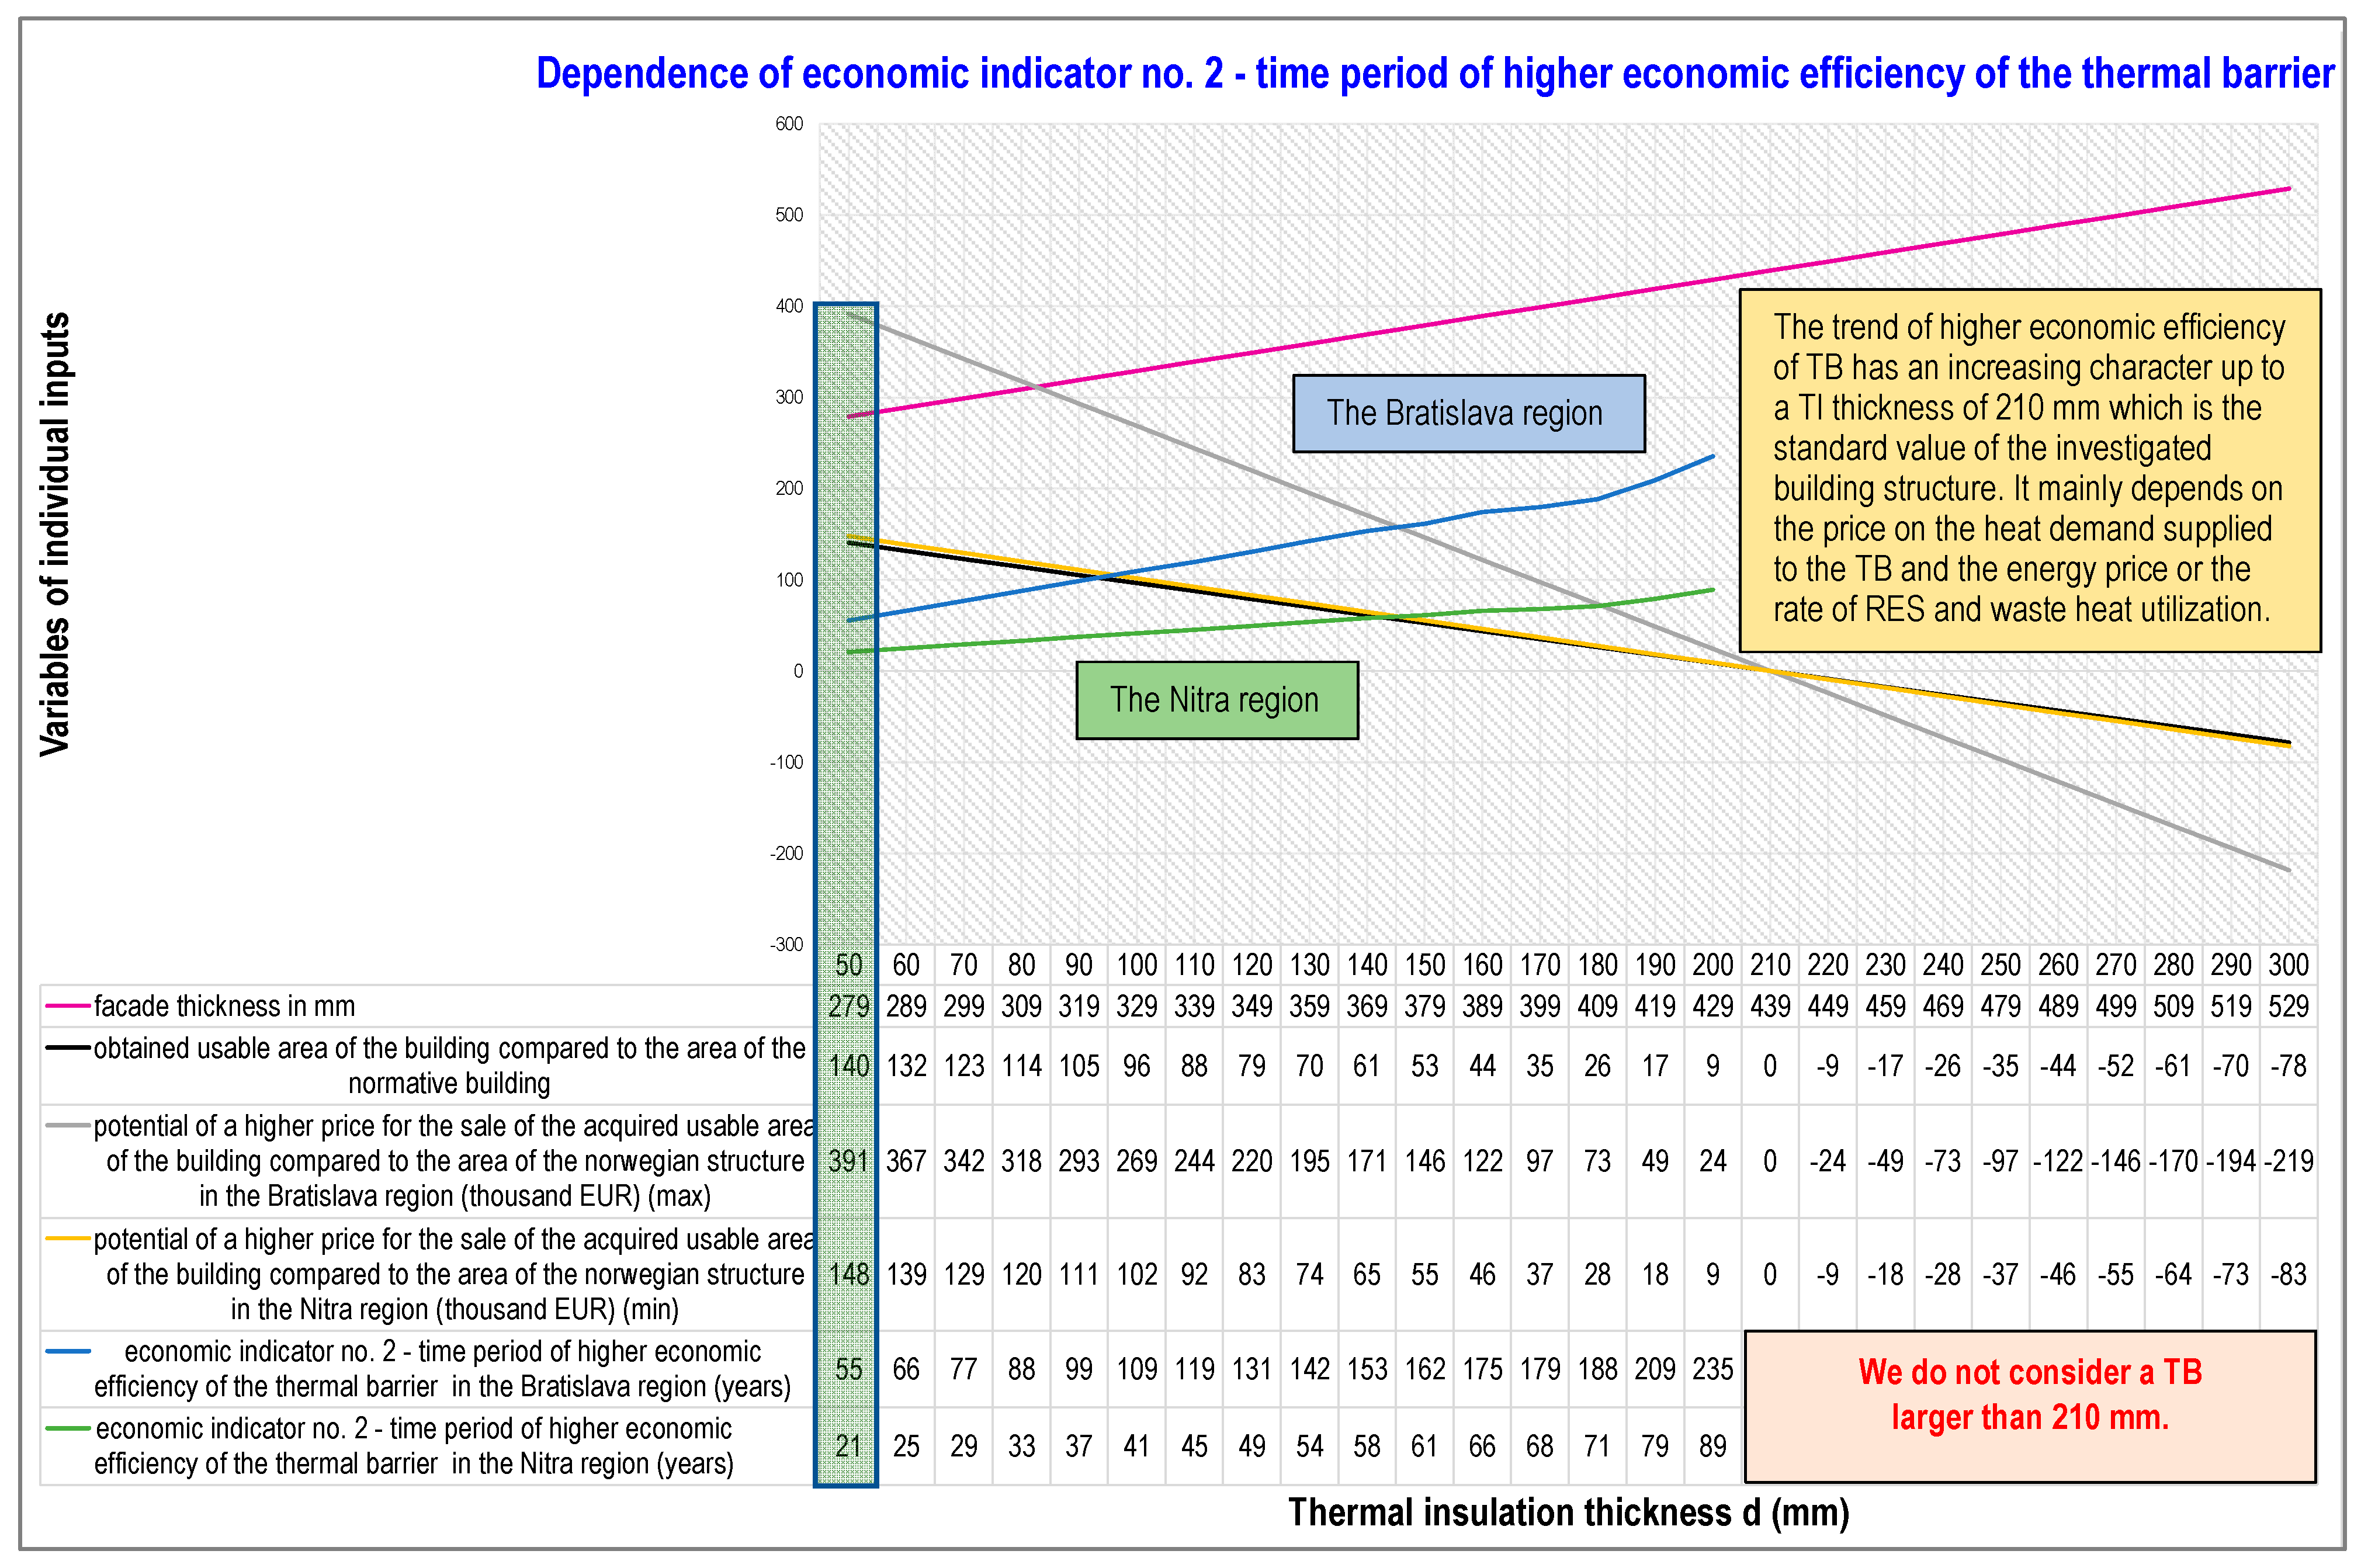
4.2. Economic Indicator No. 2—The Relationship between the Higher Selling Price of the Building and Heat for TB

By applying a thermal barrier, we can reduce the thickness of thermal insulation, and thereforethe total thickness of the facade. By building on the same built-up area with perimeter walls thinner than the thickness of the façade at the standard value of thermal resistance R ((m2K)/W), it is possible to obtain an additional area that increases the selling price of the property, as shown in Figure 14.
The potential for a higher selling price of the building as a result of an increase in usable–saleable area in the same built-up area is economic indicator No. 2—the time period of higher economic efficiency of the TB as a function of energy prices and thickness of thermal insulation in relation to the ratio of the potential for higher sales profit and the cost of heat demand for the TB.
For example, an apartment building with the following external dimensions has the potential for a higher selling price: 50 m length, 20 m width, 3.3 m construction height and eight floors. Construction location and average residential real estate price must also be taken into account, according to the National Bank of Slovakia in the Nitra region 1080 Euro/m2 and in the Bratislava region 2870 Euro/m2, Table 3 [31].
This means that with a thermal insulation thickness of 50 mm, the total thickness of the building envelope is approximately 279 and 439 mm for the standard value. For a given building, we can obtain an area of approximately 140 m2 more, which means a higher selling price of 148,000 to 391,000 €. Figure 15 shows that economic indicator 2—the time period of higher economic efficiency of TB as a function of energy prices and insulation thickness in relation to the ratio of the potential higher sales profit to the cost of heat demand for TB as a function of the average property price in each location—represents a high economic potential, for example, 21 years for the Nitra region and up to 55 years for the Bratislava region.
Under simplifying assumptions, we can calculate economic indicator No. 2 as follows:
EI 2 = A × P R E A L   E S T A T E   P R I C E     A T B × P H E A T T B  
EI 2 ,   RSE   or   WH = A × P R E A L   E S T A T E   P R I C E A T B × P H E A T T B ,   R S E   o r   W H  
where:
  • EI2—economic indicator No. 2 taking into account the annual heat demand for a TB with a fragment area of 1 m2 without the use of RES or waste heat (years),
  • EI2, RSE or WH—economic indicator No. 2 taking into account the annual heat demand for a TB with a fragment area of 1 m2 using RES or waste heat (years),
  • A—sales area obtained by using TB with a smaller thickness of the building envelope compared to the standard value of the building envelope walls (m2),
  • ATB—total area of facade with TB (m2),
  • PREAL ESTATE PRICE—price per m2 of real estate by region in Slovakia (€/m2),
  • PHEAT-TB—annual cost of heat delivered to a TB with a fragment area of 1 m2 (€/year),
  • PHEAT-TB, RSE or WH—annual cost of heat delivered to a TB with a fragment area of 1 m2 using RES or waste heat (€/year).

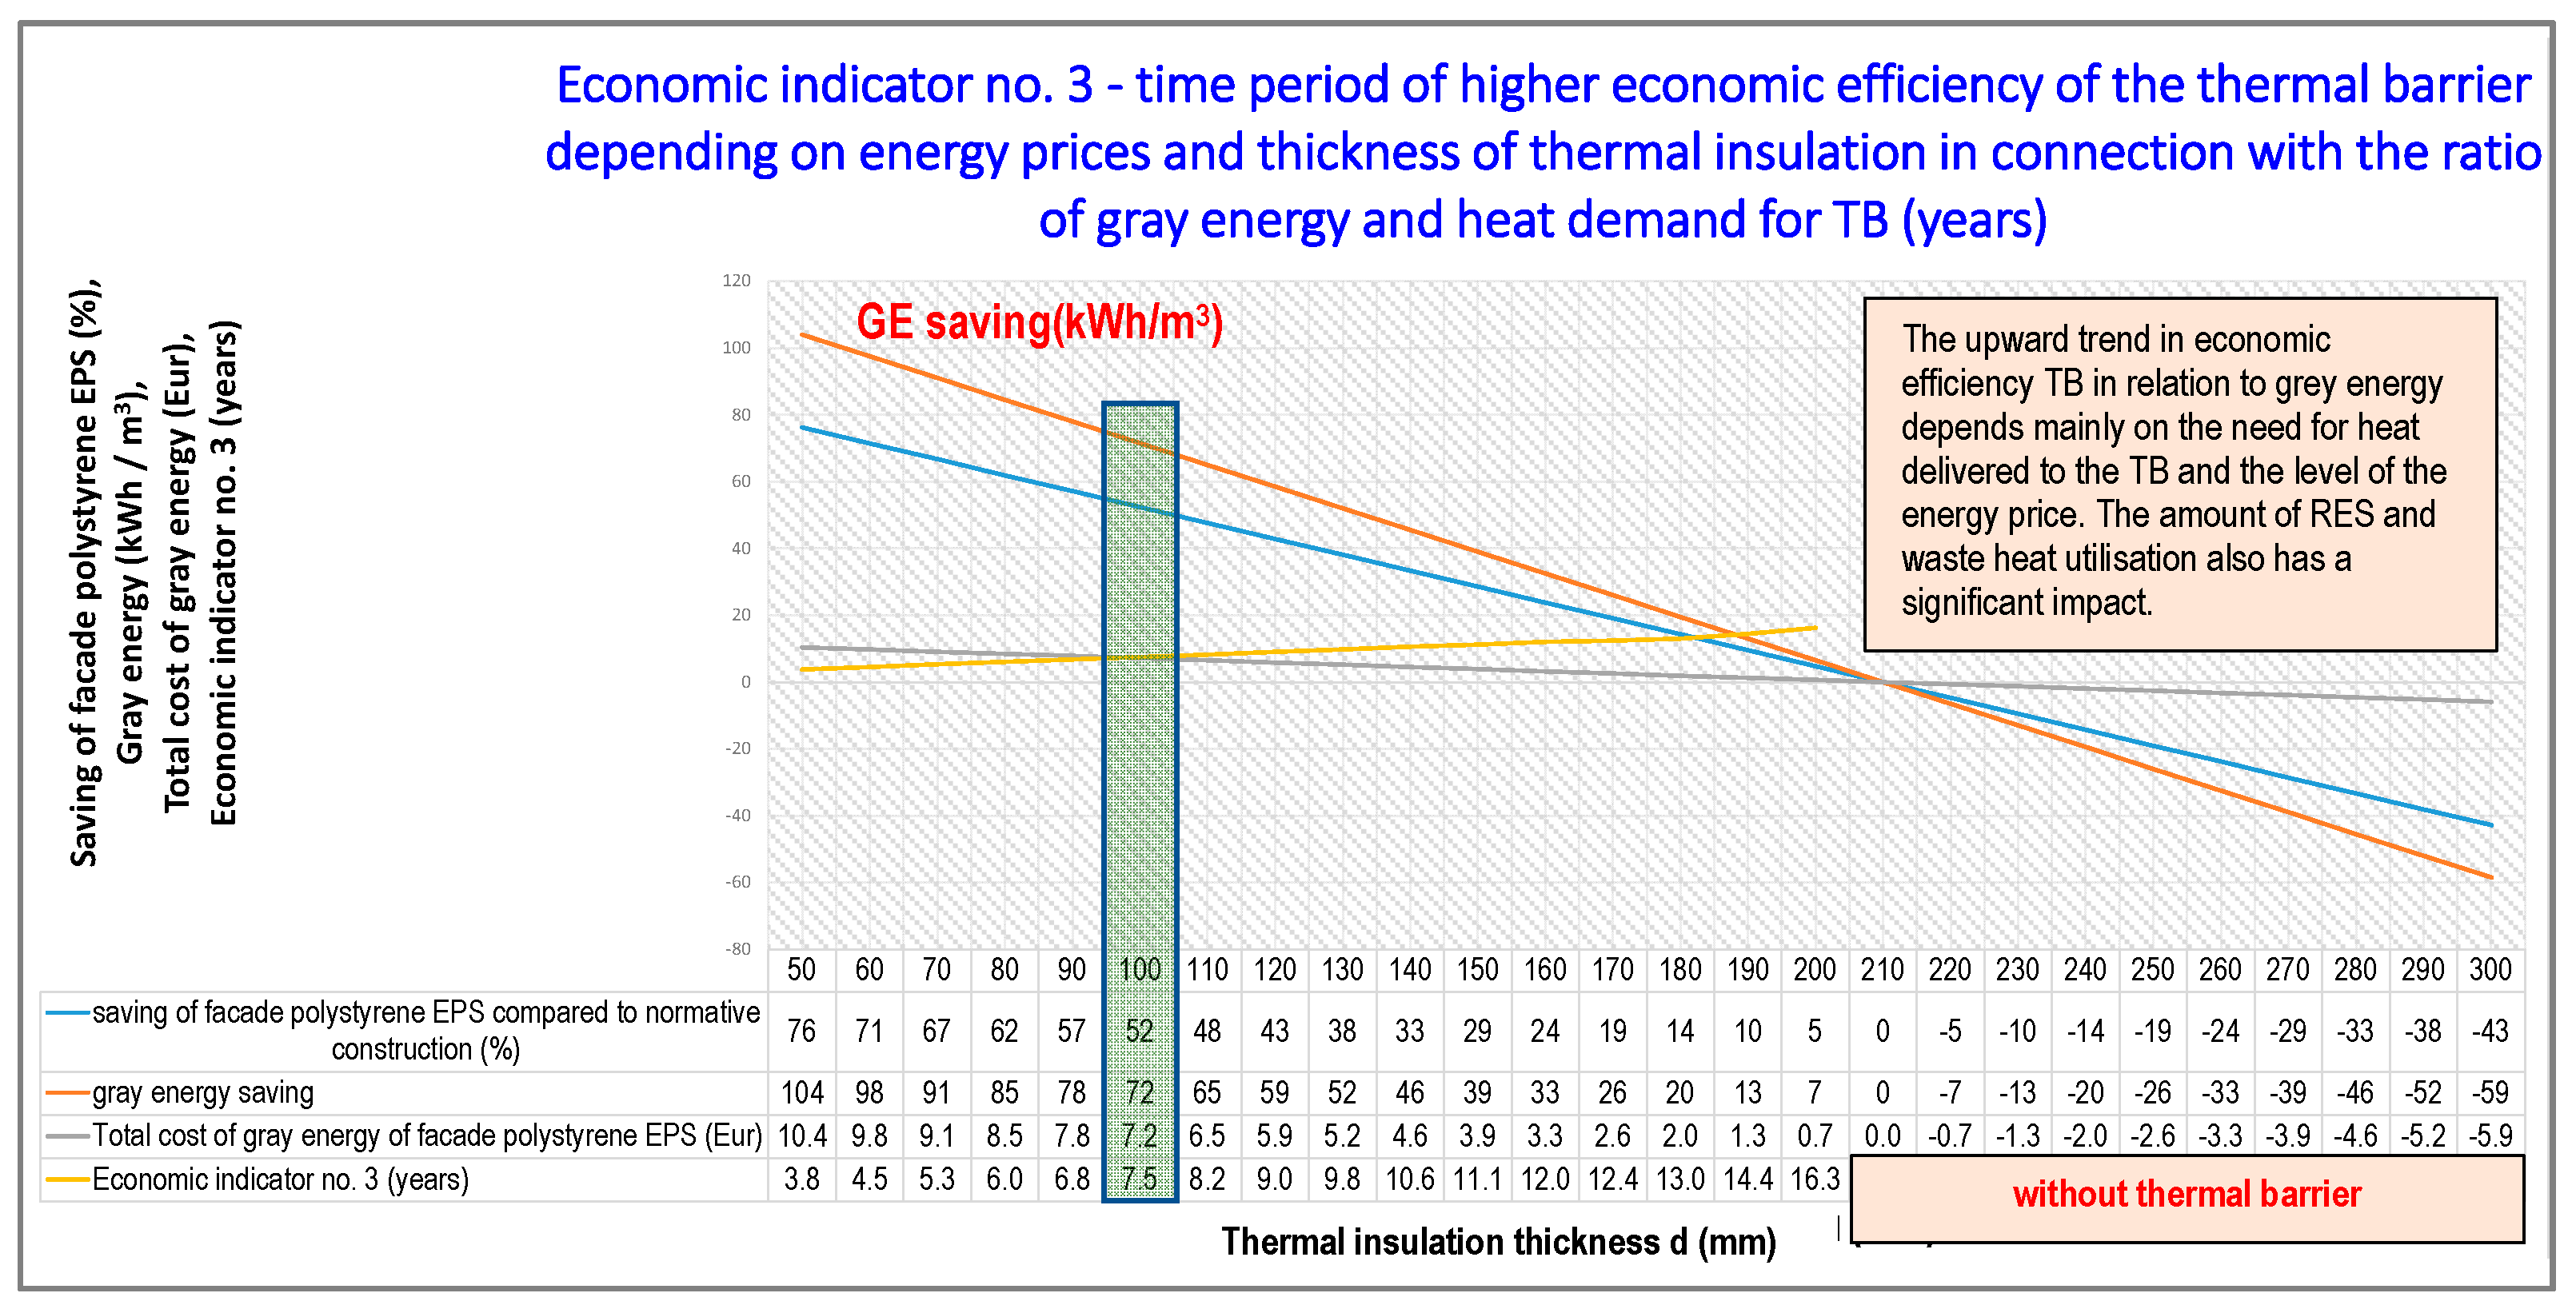
4.3. Economic Indicator No. 3—The Relationship between Gray Energy and Heat for TB

The application of the thermal barrier must also be assessed in terms of gray (built-in) energy [32]. The perception of the built-in energy in the building makes it possible to measure the impact that the building has on natural resources. Gray energy is the amount of energy consumed during the life cycle of a product (i.e., a physical product or service) in addition to the use of the product itself; it is the energy consumed in the extraction of raw materials, their transformation, production, transport, sale, maintenance and final recycling of the product. Metals and synthetic materials contain a lot of gray energy, as do products that come from far away. Materials that are processed and consumed near their place of production are those that contain the least gray energy. In construction, in order to minimize gray energy, we look around the construction site and look for plant materials (hemp, wood, straw, flax, cork), animals (sheep wool, duck feathers) or minerals (raw soil, stones, gravel). The following materials have been classified in order of least to highest gray energy content [32]:
  • flax fibers: 30 kWh/m3;
  • hemp fibers: 40 kWh/m3;
  • wood pulp: 50 kWh/m3;
  • sheep wool: 55 kWh/m3;
  • mineral wool: 150 kWh/m3;
  • perlite: 230 kWh/m3;
  • glass wool: 250 kWh/m3;
  • expanded clay: 300 kWh/m3;
  • cork board: 450 kWh/m3;
  • expanded polystyrene: 450 kWh/m3;
  • polyesters: 600 kWh/m3;
  • extruded polystyrene: 850 kWh/m3;
  • polyurethane foam: 1000 to 1200 kWh/m3;
  • fibreboard (soft): 1400 kWh/m3;
  • porous glass: 700 to 1300 kWh/m3.
Figure 16 shows economic indicator 3—the time period of higher economic efficiency of TB as a function of energy prices and insulation thickness in relation to the grey energy/heat demand ratio for TB (years). When using 100 mm thick thermal insulation (normative value is 210 mm), economic indicator No. 3 shows an economic efficiency of 7.5 years.
Under simplifying assumptions, we can calculate economic indicator No. 3 as follows:
EI 3 = Δ G E ×   P G E × V     P H E A T T B  
EI 3 ,   RSE   or   WH = Δ G E ×   P G E × V P H E A T T B ,   R S E   o r   W H  
where:
  • EI3—economic indicator No. 3 taking into account the annual heat demand for a TB with a fragment area of 1 m2 without the use of RES or waste heat (years),
  • EI3, RSE or WH—economic indicator No. 3 taking into account the annual heat demand for a TB with a fragment area of 1 m2 using RES or waste heat (years),
  • ΔGE—increased grey energy when using thermal insulation with a thickness corresponding to the standard thermal resistance compared to a building structure with TB (kWh/m3),
  • V—increased volume of thermal insulation for the building structure corresponding to the standard thermal resistance compared to the building structure with TB with a fragment area of 1 m2 (m3),
  • PGE—gray energy price (€/kWh),
  • PHEAT-TB—annual cost of heat delivered to a TB with a fragment area of 1 m2 (€/year),
  • PHEAT-TB, RSE or WH—annual cost of heat delivered to a TB with a fragment area of 1 m2 using RES or waste heat (€/year).

5. Results and Discussion

Based on this study, we can draw the following conclusions:
  • The thermal barrier is one of the functions of building structures with integrated energy-active elements;
  • From the review of the scientific literature, it is clear that this is a very new area of research and so far most studies on TB are based on calculations, computer simulations and experimental measurements. Few studies have focused on the economic and environmental aspects of TB use;
  • The heat required to cover heat loss of the interior in the application of a conventional building structure meeting standard requirements and a building structure with TB remains the same, except that in the case of TB, the thickness of the thermal insulation is reduced and the heat is supplied to the facade rather than to the interior of the building;
  • A parametric study based on theoretical assumptions states that the thermal barrier shows, in terms of evaluation of economic indicators No. 1 to 3, highly promising and effective solution;
  • For example, for a TB application with less than half the thermal insulation thickness (100 mm) compared to the normative building construction (TI = 210 mm), economic indicator No. 1 takes 11 years for maximum energy price 18 years for electricity, 31 years for natural gas and 37 years for minimum energy price;
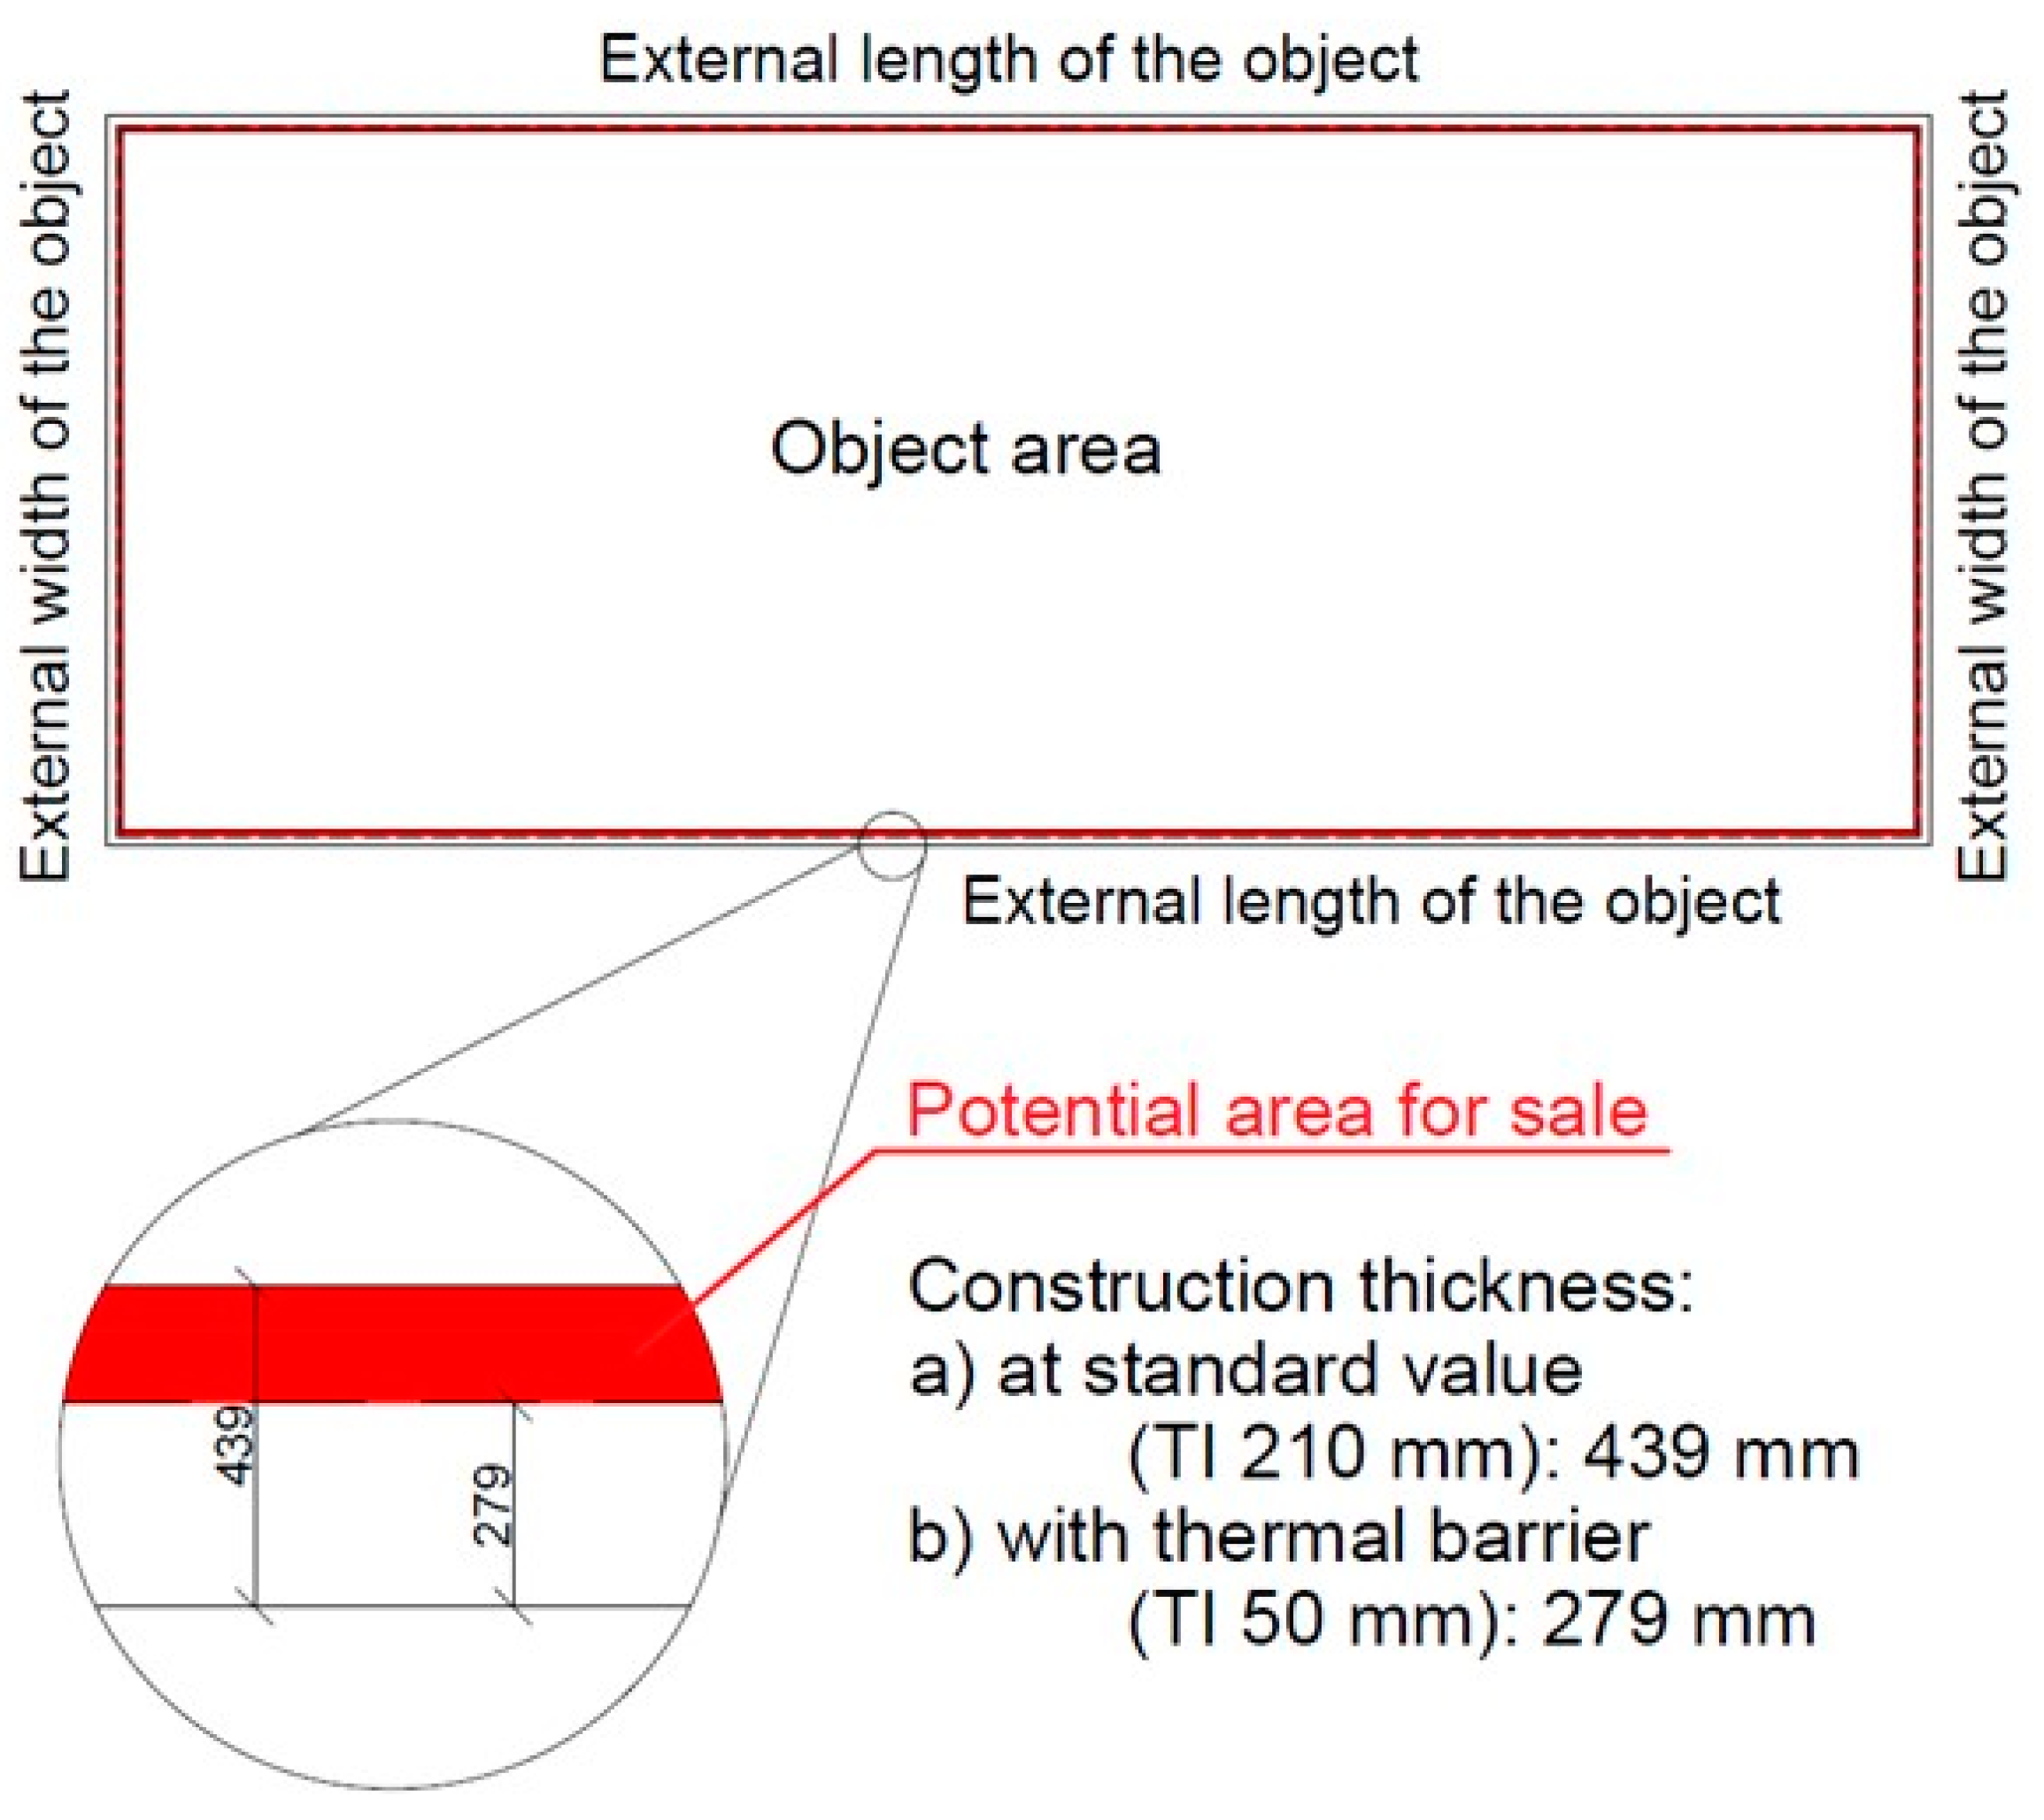
  • Economic indicator 2 characterizes the potential for a higher sales price. For example, for an apartment building with a length of 50 m, a width of 20 m, a 3.3 m construction height, eight stories and a thermal insulation thickness of 50 mm, the total thickness of the building envelope is approximately 279 mm and the standard value is 439 mm. For a given building, we can obtain an increased area of about 140 m2, which means a higher selling price of 148,000 to 391,000 €. Figure 15 shows that economic indicator 2—the time period of higher economic efficiency of the TB depending on energy prices and insulation thickness in relation to the ratio of potential higher profit from revenue and cost of heat demand for the TB depending on the average property price in each location—represents a high economic potential, for example 21 years for the Bratislava region and up to 55 years for the Nitra region;
  • Economic indicator No. 3—the time period of higher economic efficiency of TB depending on energy prices and thickness of thermal insulation in relation to the ratio of gray energy and heat demand for TB—is 7.5 years when using thermal insulation with a thickness of 100 mm (normative value is 210 mm);
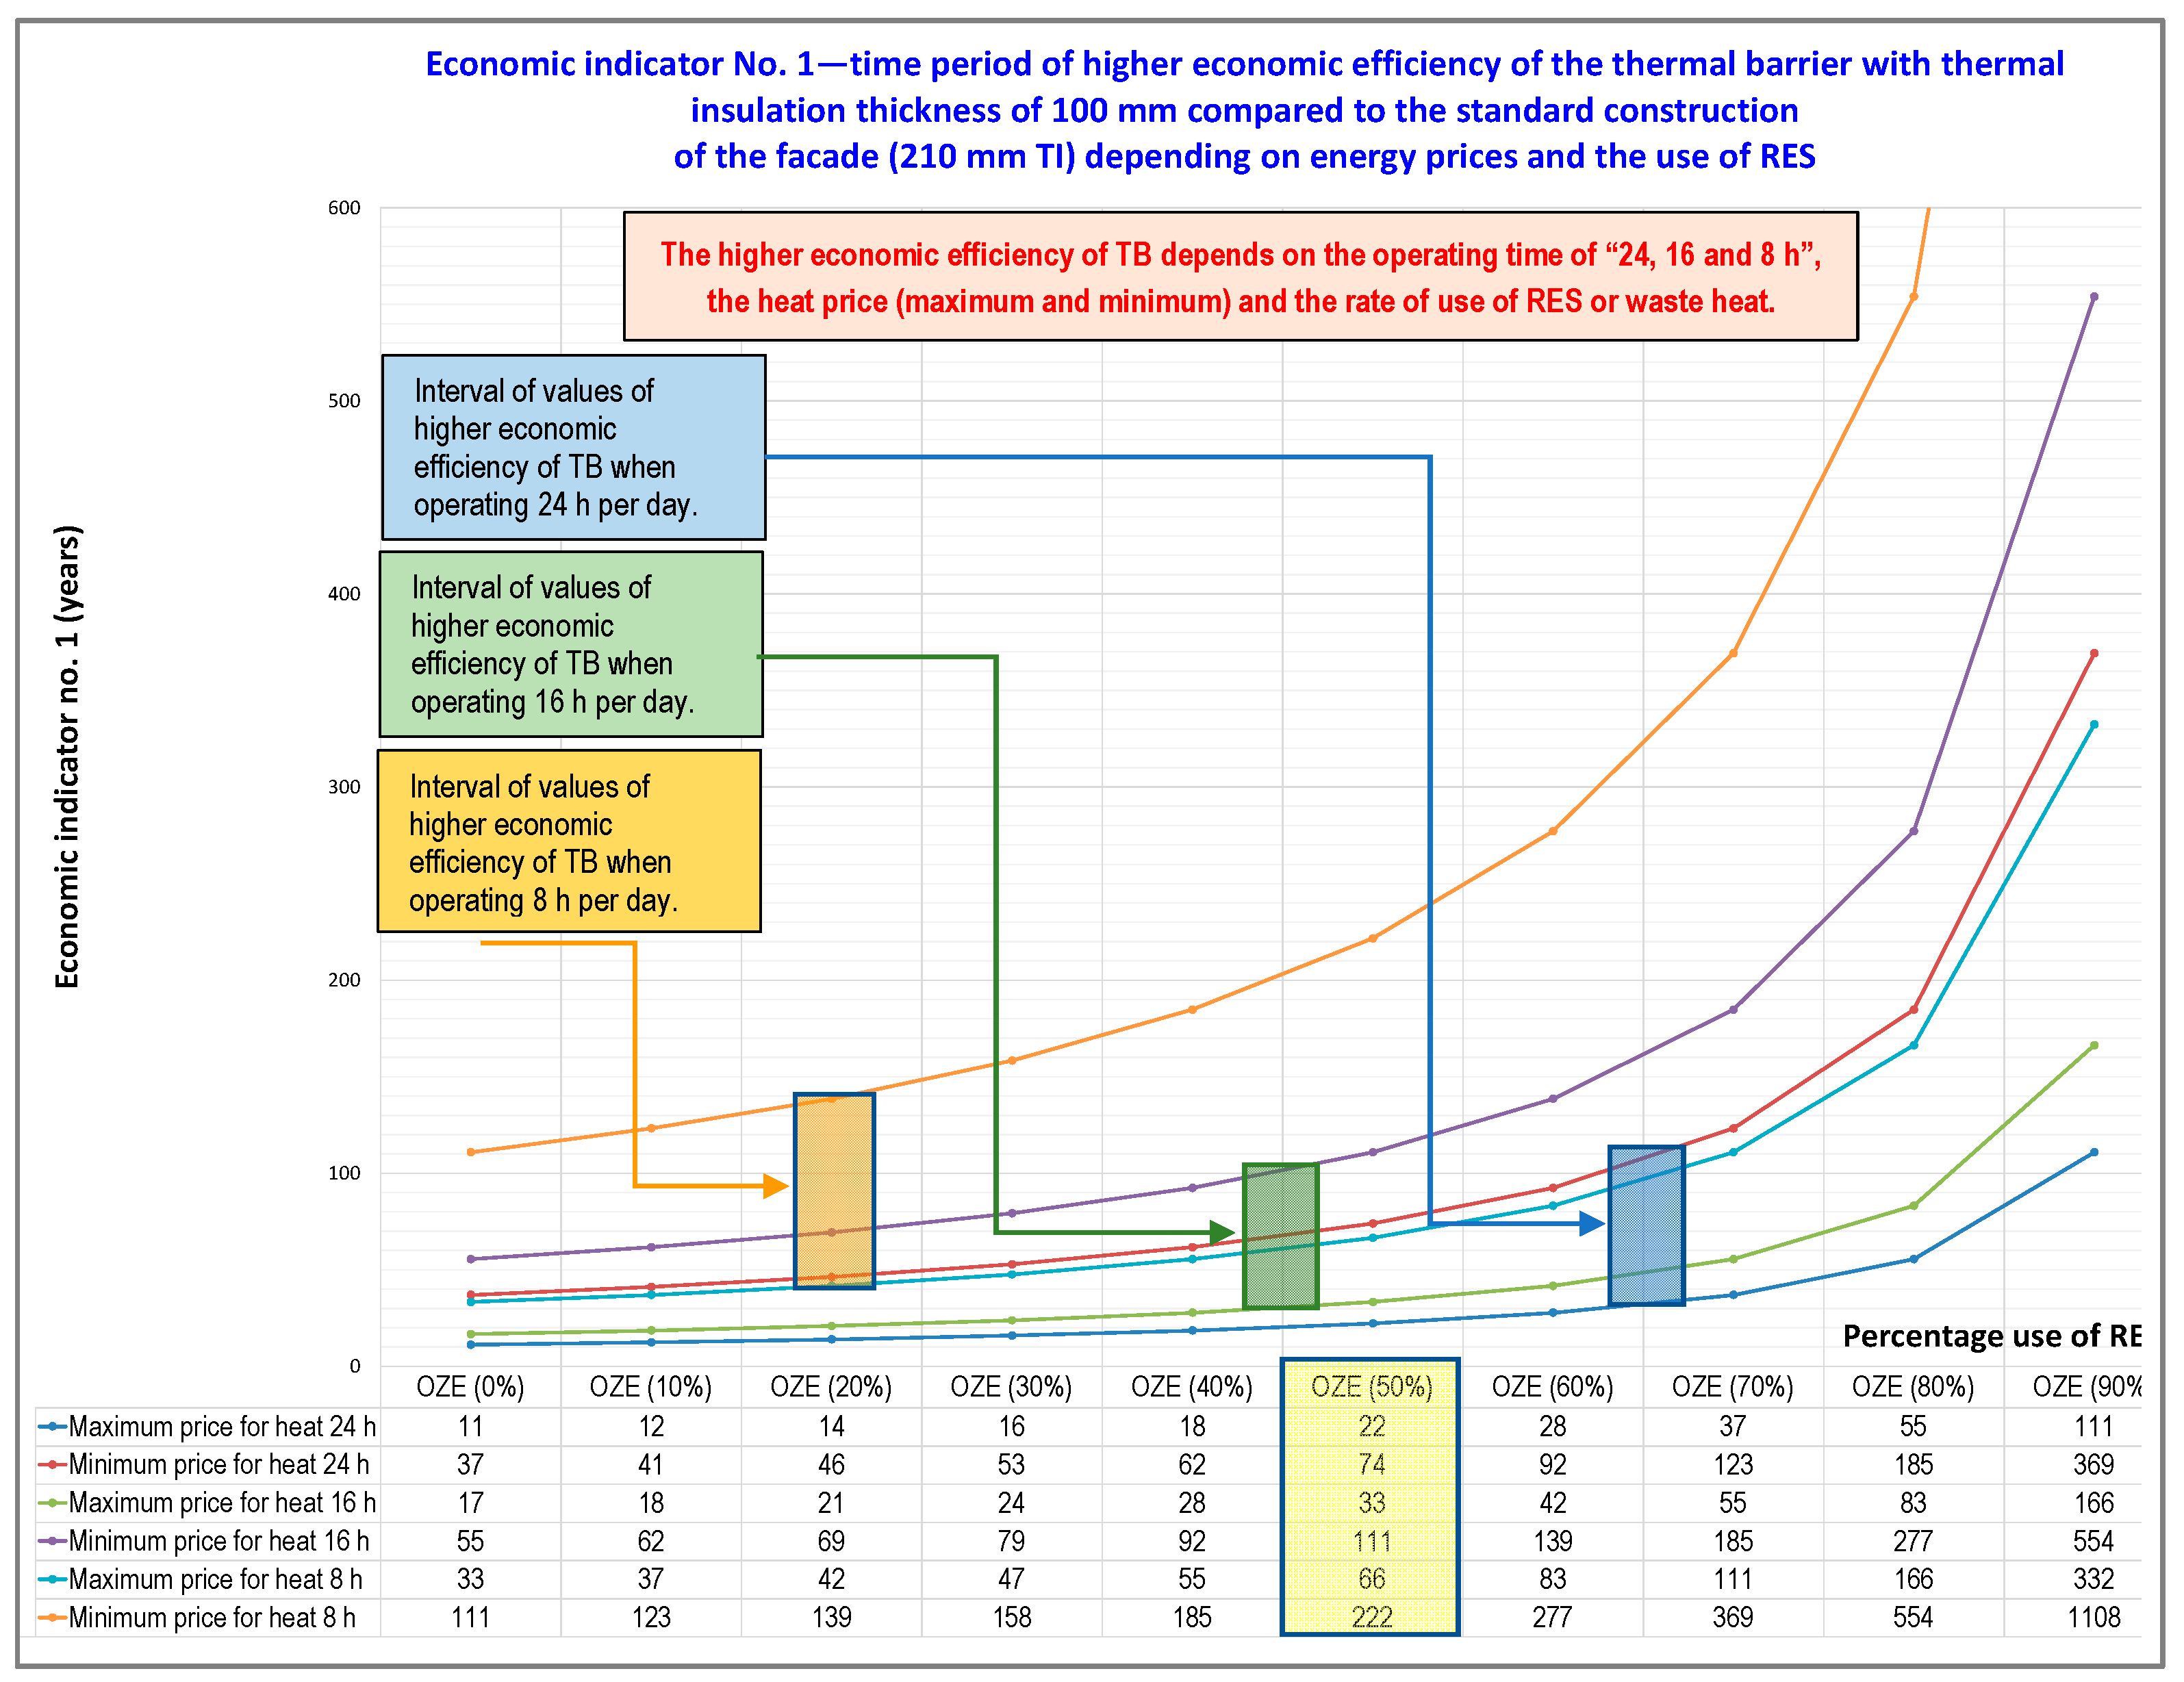
  • Figure 17 describes the economic indicator No. 1—time period of higher economic efficiency of the thermal barrier with a thermal insulation thickness of 100 mm compared to the standard construction of the facade (210 mm TI) depending on energy prices and the use of RES. the graph in Figure 17 shows that for a facade with a thermal insulation thickness of 100 mm and 50% use of RES supplied for the thermal barrier, at current heat prices (minimum to maximum price) such a facade is more economically advantageous depending on the operating time of the thermal barrier in the building (for example 16 h) from 33 to 111 years;
  • In general, it can be stated that when using heat from RES or waste heat for TB, the economic efficiency for all economic indicators is directly proportional to the amount of such delivered energy. For example, 50% RES represents a two-fold longer economic efficiency of TB in all three economic indicators;
  • The potential of facades with integrated energy-active elements is growing through the use of other functions of these elements, including large-scale low-temperature heating and high-temperature cooling, shown in Figure 18 [13,14,15,16,17,18,19,20,21,22,23,24,25,26,27];
  • Other variants of the use of facades with integrated energy-active elements are described in article [23];
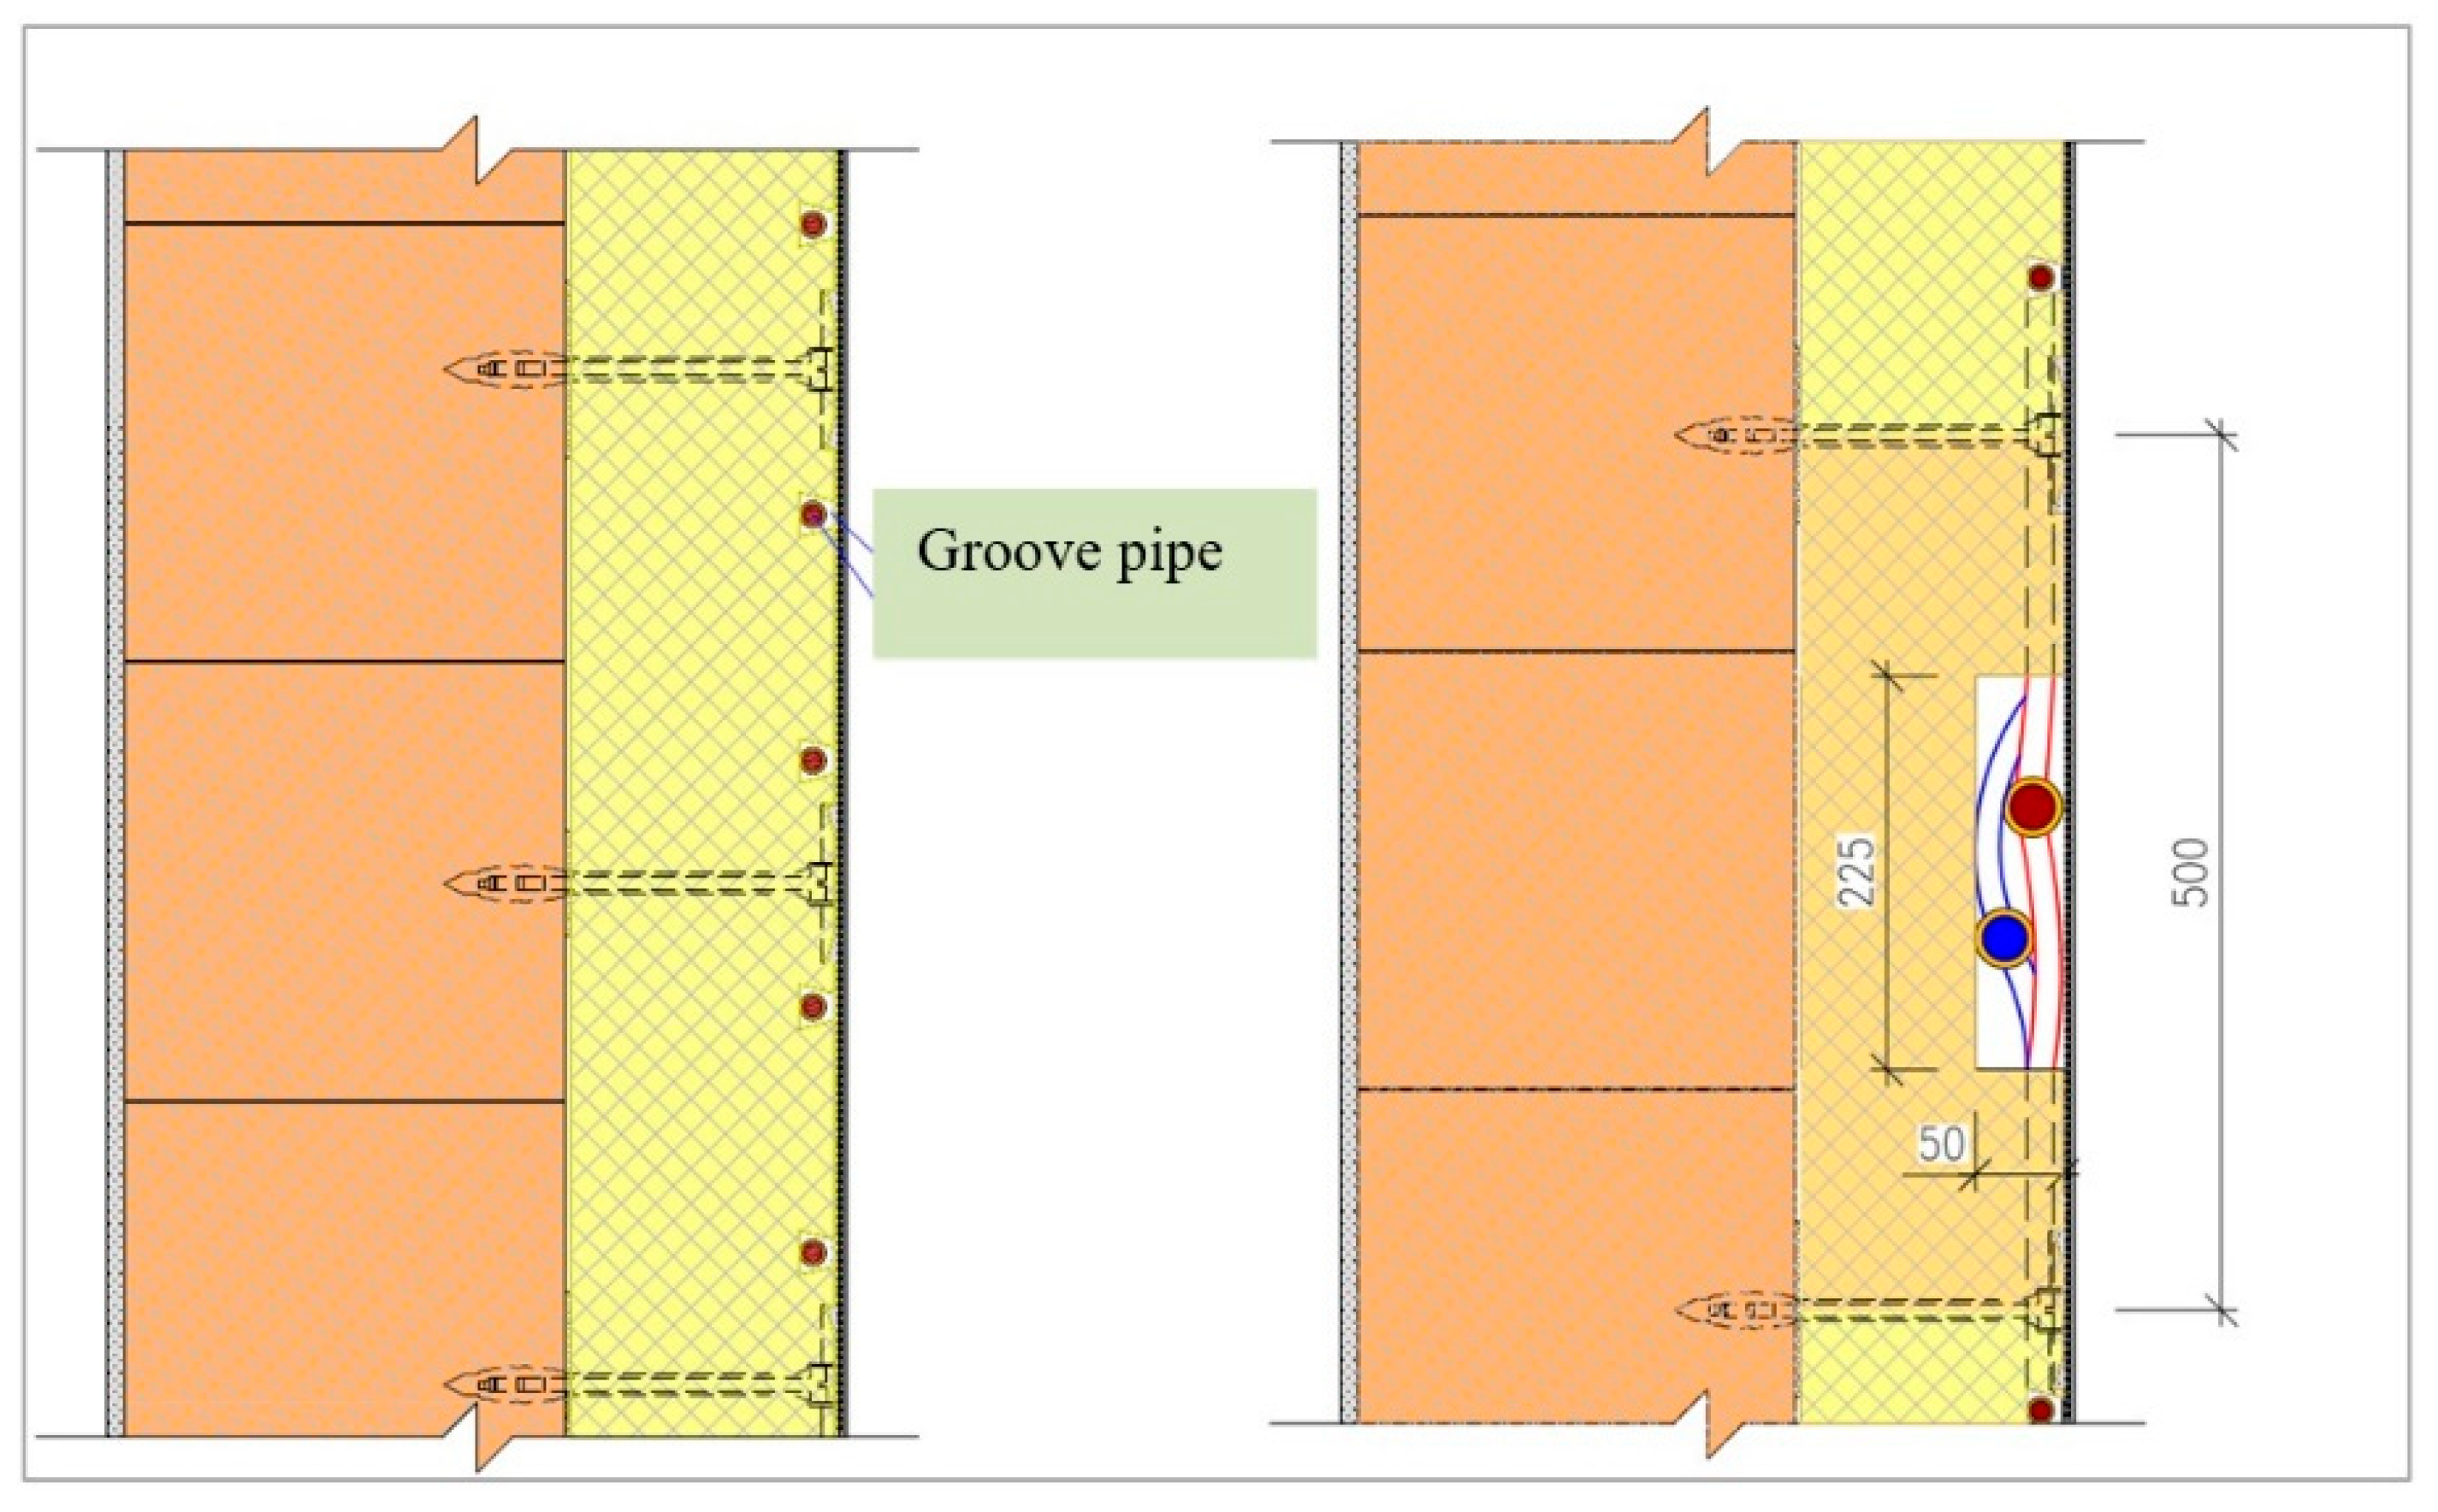
  • Thermal insulation panels with active regulation of heat transfer with integrated active area—a register collecting solar energy or energy of the surrounding environment—are applied as a standard contact insulation system. Active area—a register formed by the pipes for liquid or gaseous heat carrier—is a characteristic of the exterior surface. These thermally active panels are applied in combination with renewable heat sources, shown in Figure 19 [23];
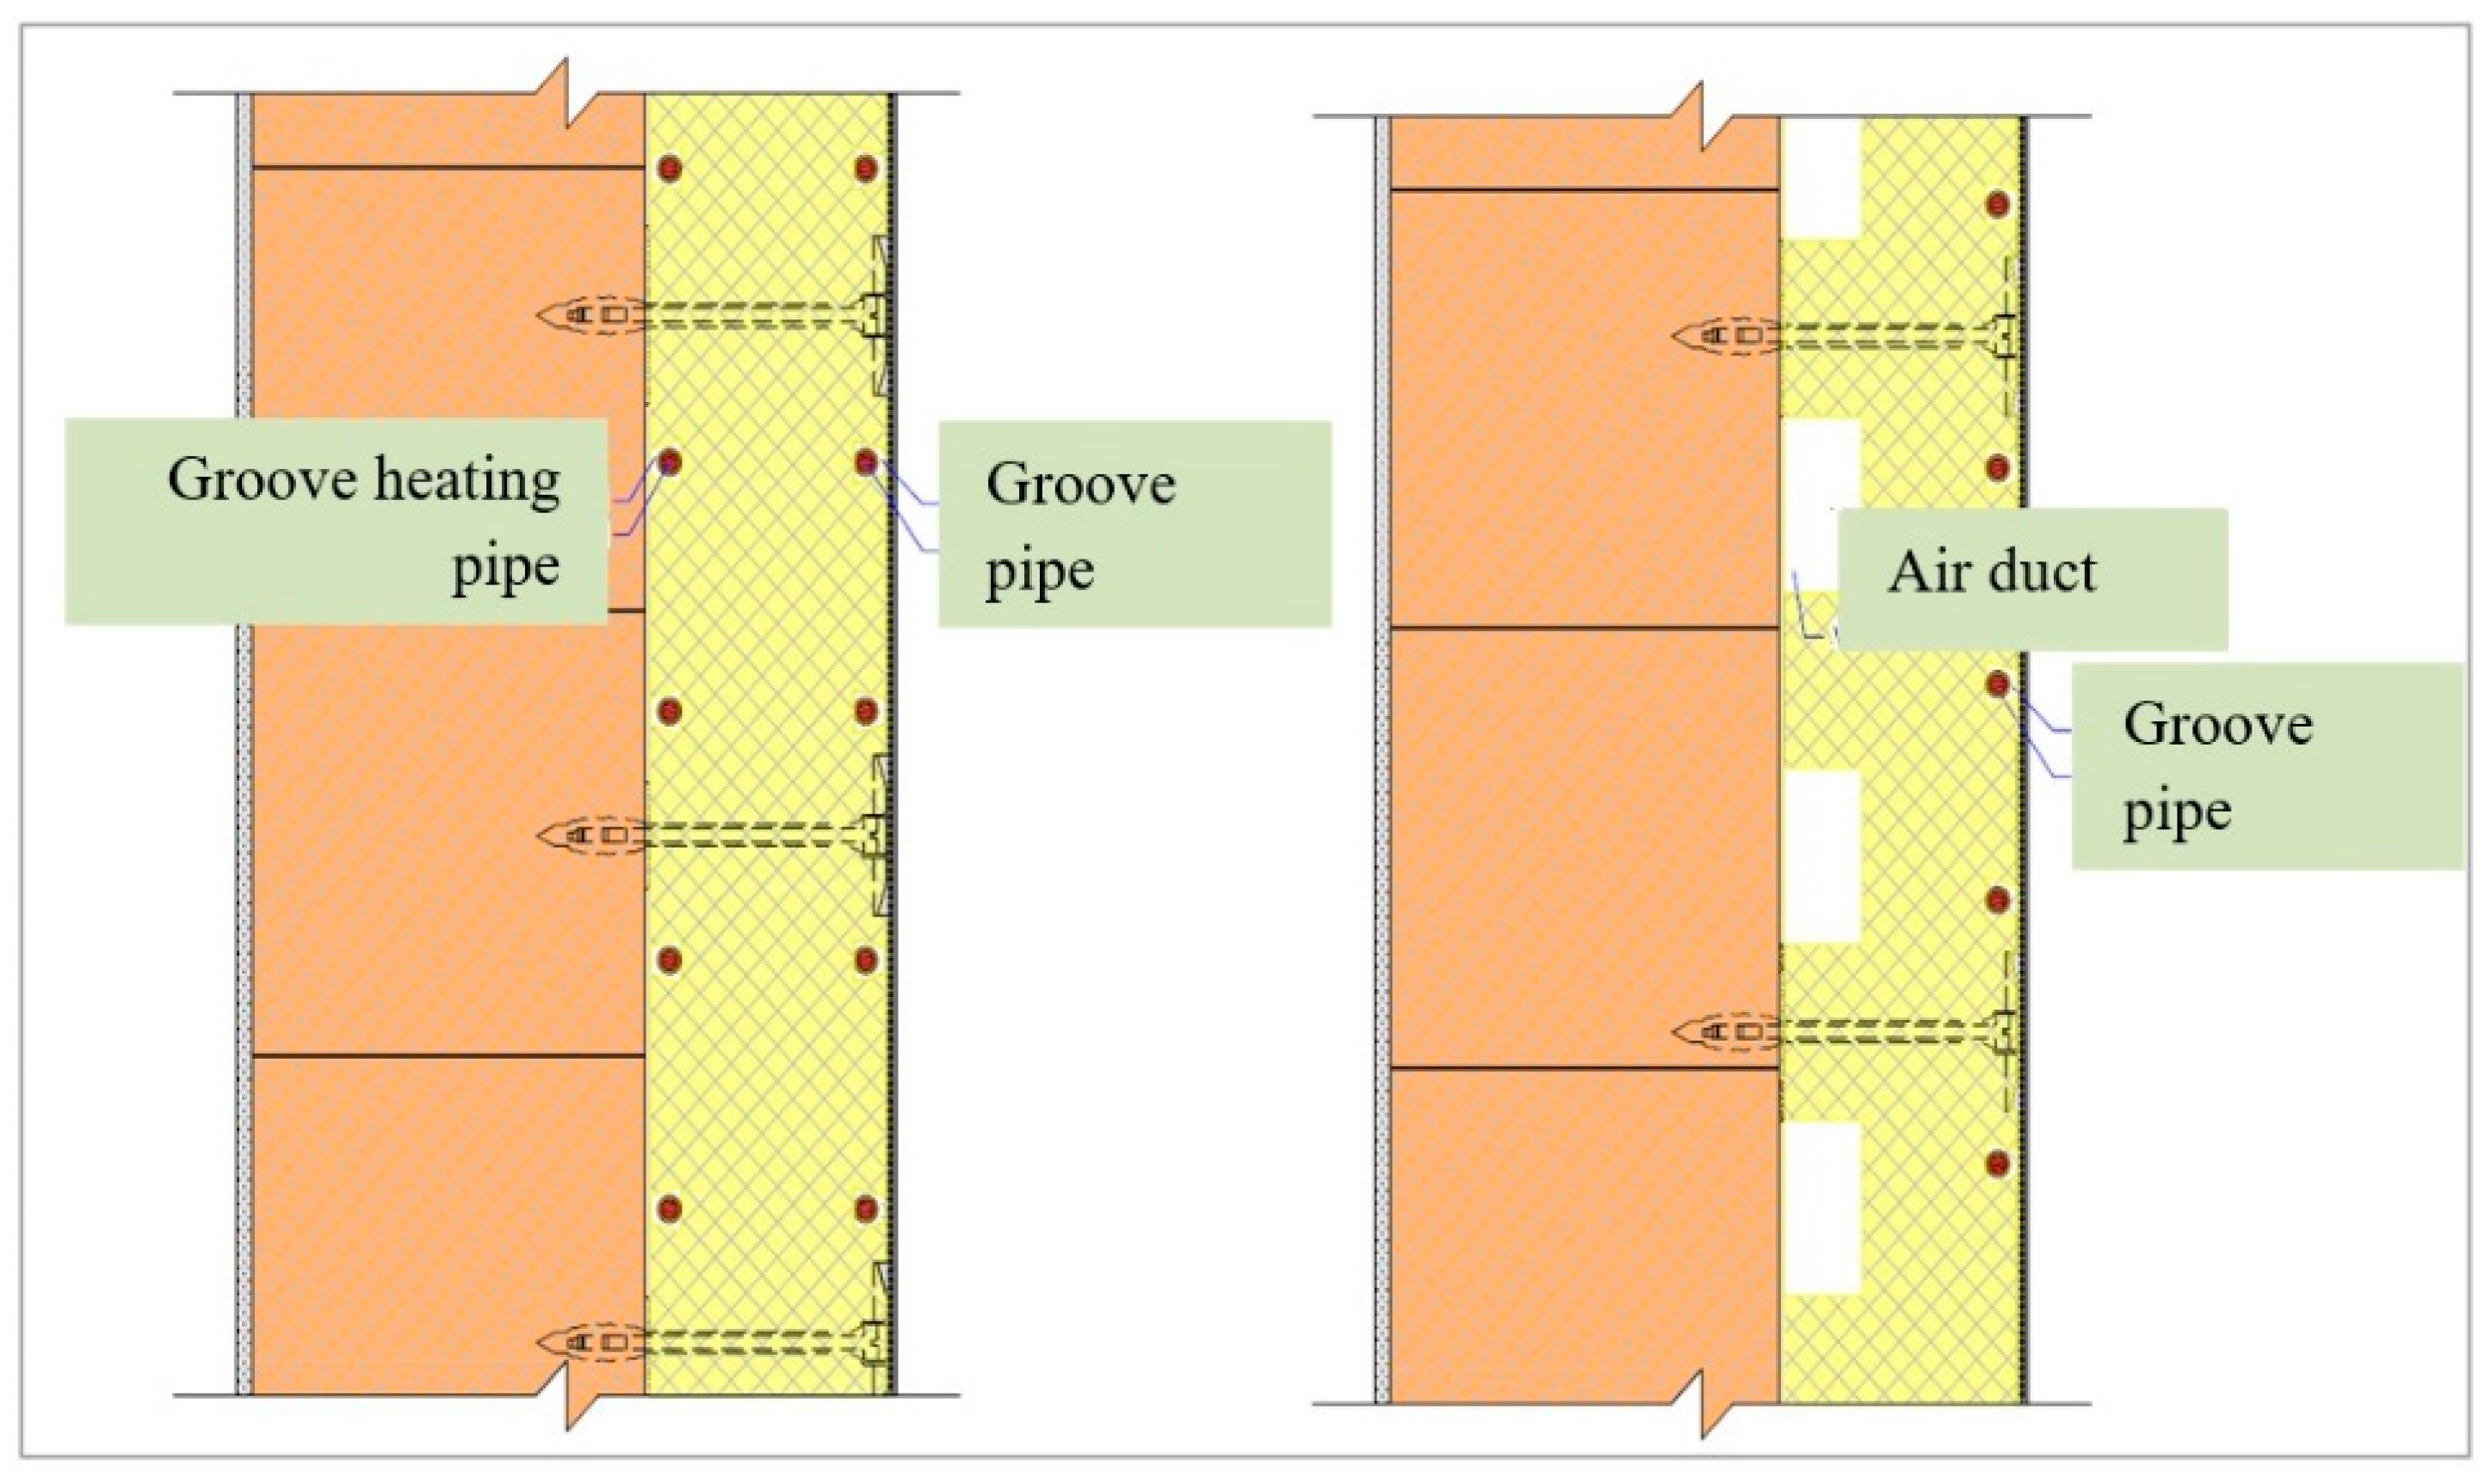
  • Combination of thermal insulation panels with active regulation of heat transfer with active thermal protection (ATP) with an integrated active area (heating and cooling) presents another possibility of creating a compact insulation system, shown in Figure 20. This category includes insulation panels with ATP (WATER as the heat carrier or AIR (the heat carrier is air) with an additional function of absorber on the exterior side to collect energy of the surrounding environment). Thereby, the multiple functions of the construction and the contact insulation system are expanded, and at the same time the number of operations in the process of construction of a building and realization of an energy system is decreased. Simplicity and technological procedure of realizing the combined facade system remains unchanged, as before [23].

6. Conclusions

The feasibility of integrating energetically active elements into the facade panels of a compact thermal insulation system, as described in European patent EP 2 572 057 B1: Heat insulating panel with active regulation of heat transition [33], utility model SK 5725 Y1: Thermal insulation panel for systems with active heat transfer control [34] and utility model SK 5729 Y1: Self-supporting thermal insulation panel for systems with active heat transfer control [35], was confirmed by making prototypes of thermal insulation panels with ATP (Figure 21) implementation of laboratory measurements in the climatic chamber of the Faculty of Civil Engineering, STU in Bratislava, within the doctoral study of Ing. Martina Šimka, PhD. [36], (Kalús—supervisor of doctoral studies) and also by computer simulations and experimental measurements in the climatic chamber of the Faculty of Civil Engineering STU in Bratislava, described in a professional article by the authors: Šimko, M.-Krajčík, M.-Šikula, O.-Šimko, P.-Kalús, D [20].
In the case of laboratory measurements in the climate chamber, it was the construction of an insulating facade panel with integrated active elements—a tube register applied to a reinforced concrete wall—where it was possible to investigate the properties of a combined building-energy wall system representing a perimeter wall as a thermal barrier, low-temperature heating cooling and heat/cold storage [36].
Measurements to quantify the benefits of TBs in real operation and to refine the conditions under which different types of TB can be operated still have many unanswered questions and present further research opportunities and challenges. We will further direct our research towards improving the heating/cooling performance of the external building envelope by using PCMs or by using thermally conductive materials in the active layer, for the application of active thermal protection (ATP) insulation systems in building retrofits, the alternation of heating, cooling and TB functions, and the harvesting of solar and ambient energy by using integrated active elements on the external building envelope.

7. Patents

The research of the thermal barrier carried out at our workplace developed three utility models and one European patent (author: Kalús):
  • EUROPEAN PATENT EP 2 572 057 B1: Heat insulating panel with active regulation of heat transition. Date of publication and mention of the grant of the patent: 15.10.2014 In: Bullettin 2014/42 European Patent Office, interantional application number: PCT/SK2011/000004, international publication number: WO 2011/146025 (24.11.2011 Gazette 2011/47), 67p. [33].
  • UTILITY MODEL SK 5725 Y1 (UTILITY MODEL): Thermal insulation panel for systems with active heat transfer control. Date of entry into force of the utility model: 25.2.2011 In: Vestník ÚPV SR č.: 4/2011, 63 p. [34].
  • UTILITY MODEL SK 5729 Y1 (UTILITY MODEL): Self-supporting thermal insulation panel for systems with active heat transfer control. Date of entry into force of the utility model: 28.2.2011 In: Vestník ÚPV SR č.: 4/2011, 32p. [35].
  • UTILITY MODEL SK 5749 Y1 (UTILITY MODEL): Method of operation of a combined construction-energy system of buildings and equipment. Date of entry into force of the utility model: 1.4.2011 In: Vestník ÚPV SR č.: 5/2011, 23p. [37].

Author Contributions

Conceptualization, D.K. (Daniel Kalús), V.M. and D.K. (Daniela Koudelková); methodology, D.K. (Daniel Kalús); validation, D.K. (Daniel Kalús); formal analysis, D.K. (Daniel Kalús), V.M. and D.K. (Daniela Koudelková); investigation, D.K. (Daniel Kalús), V.M. and D.K. (Daniela Koudelková); resources, D.K. (Daniel Kalús), V.M. and D.K. (Daniela Koudelková); data curation, D.K. (Daniel Kalús) and V.M.; writing—original draft preparation, D.K. (Daniel Kalús) and V.M.; writing—review and editing, D.K. (Daniel Kalús) and V.M. All authors have read and agreed to the published version of the manuscript.

Funding

The publication of this work was financially supported by EHBconsulting s.r.o.

Institutional Review Board Statement

Not applicable.

Informed Consent Statement

Not applicable.

Data Availability Statement

Data sharing is not applicable to this article.

Acknowledgments

The publication of this work was financially supported by EHBconsulting s.r.o. We express our sincere thanks to the private investor Ing. Tomáš Ircha, who significantly supported research in the field of combined construction and energy systems.

Conflicts of Interest

The authors declare no potential conflicts of interest with respect to the research, authorship, and publication of this Article.

References

  1. Directive (EU) 2018/844 of the European Parliament and of the Council of 30 May 2018 Amending Directive 2010/31/EU on the Energy Performance of Buildings and Directive 2012/27/EU on Energy Efficiency; EU: Maastricht, The Netherlands, 2018.
  2. Directive (EU) 2010/31/EU of the European Parliament and of the Council of 19 May 2010 on the Energy Performance of Buildings; EU: Maastricht, The Netherlands, 2010.
  3. Directive 2012/27/EU of the European Parliament and of the Council of 25 October 2012 on Energy Efficiency; EU: Maastricht, The Netherlands, 2012.
  4. STN 73 0540-2 + Z1 + Z2: Thermal Protection of Buildings. Thermal Pperformance of Buildings and Components. Part 2: Functional Requirements; Úrad pre Normalizáciu, Metrológiu a Skúšobníctvo Slovenskej republiky: Bratislava, Slovak Republic, 2019. [Google Scholar]
  5. Krecké, E.D. PATENT SK 284 751: Energetické Zariadenie Budov. [Energy Equipment of Buildings]. Patent In Vestník ÚPV SR č. 11/2005, Banská Bystrica, Slovak Republic. 3 November 2005. [Google Scholar]
  6. Krecké, E.D.; Kunkel, K. Air Conditioning of Buildings by Near-Surface Geothermal Energy; Issued by Verein Deutscher Ingenieure; Structural Engineering Yearbook: Dűsseldorf, Germany, 2005. [Google Scholar]
  7. Krecké, E.; Ulbrich, R.; Radlak, G. Terrasol–Connection of Solar and Near -Surface Geothermal Energy. Available online: http://www.isomax-terrasol.eu/fileadmin/_migrated/content_uploads/Bejing-x-Krecke-Kunkel-Radlak-Ulbrich_04.pdf (accessed on 11 December 2021).
  8. ®ISOMAX-TERRASOL Zero-Energy Building Technologies—Outer Wall Design with Thermal Barier (Climate Barier). Available online: http://www.isomax-terrasol.eu/en/technologie/isomax-technologies/isomax-temperature-barrier.html (accessed on 11 December 2021).
  9. Krzaczek, M.; Kowalczuk, Z. Thermal Barrier as a technique of indirect heating and cooling for residential buildings. In An International Journal Devoted to Investigations of Energy Use and Efficiency in Buildings-Energy and Buildings; Elsevier: Amsterdam, The Netherlands, 2011; Volume 43, pp. 823–837. [Google Scholar]
  10. Krzaczek, M.; Kowalczuk, Z. Gain scheduling control applied to thermal barrier in systems of indirect passive heating and cooling of buildings. Control Eng. Pract. 2012, 20, 1325–1336. [Google Scholar] [CrossRef]
  11. Meggers, F.; Baldini, L.; Leibundgut, H. An innovative use of renewable ground heat for insulation in low exergy building systems. Energies 2012, 5, 3149–3166. [Google Scholar] [CrossRef]
  12. Xie, J.; Zhu, Q.; Xu, X. An active pipe-embedded building envelope for utilizing low-grade energy sources. J. Cent. South Univ. Technol. 2012, 19, 1663–1667. [Google Scholar] [CrossRef]
  13. Ibrahim, M.; Wurtz, E.; Biwole, P.H.; Achard, P. Transferring the south solar energy to the north facade through embedded water pipes. Energy 2014, 78, 834–845. [Google Scholar] [CrossRef]
  14. Xie, J.; Xu, X.; Li, A.; Zhu, Q. Experimental validation of frequency-domain finite-difference model of active pipe-embedded building envelope in time domain by using Fourier series analysis. Energy Build. 2015, 99, 177–188. [Google Scholar] [CrossRef] [Green Version]
  15. Li, A.; Xu, X.; Sun, Y. A study on pipe-embedded wall integrated with ground source-coupled heat exchanger for enhanced building energy efficiency in diverse climate regions. Energy Build. 2016, 121, 139–151. [Google Scholar] [CrossRef] [Green Version]
  16. Niu, F.; Yu, Y. Location and optimization analysis of capillary tube network embedded in active tuning building wall. Energy 2016, 97, 36–45. [Google Scholar] [CrossRef]
  17. Shen, C.; Li, X. Dynamic thermal performance of pipe-embedded building envelope utilizing evaporative cooling water in the cooling season. Appl. Therm. Eng. 2016, 106, 1103–1113. [Google Scholar] [CrossRef]
  18. Yu, Y.; Niu, F.; Guo, H.A.; Woradechjumroen, D. A thermo-activated wall for load reduction and supplementary cooling with free to low-cost thermal water. Energy 2016, 99, 250–265. [Google Scholar] [CrossRef] [Green Version]
  19. Shen, C.; Li, X. Energy saving potential of pipe-embedded building envelope utilizing low temperature hot water in the heating season. Energy Build. 2017, 138, 318–331. [Google Scholar] [CrossRef]
  20. Šimko, M.; Krajčík, M.; Šikula, O.; Šimko, P.; Kalús, D. Insulation panels for active control of heat transfer in walls operated as space heating or as a thermal barrier: Numerical simulations and experiments. Energy Build. 2018, 158, 135–146. [Google Scholar] [CrossRef]
  21. Kisilewicz, T.; Fedorczak-Cisak, M.; Barkanyi, T. Active thermal insulation as an element limiting heat loss through external walls. Energy Build. 2019, 205, 109541. [Google Scholar] [CrossRef]
  22. Jiang, S.; Li, X.; Lyu, W.; Wang, B.; Shi, W. Numerical investigation of the energy efficiency of a serial pipe-embedded external wall system considering water temperature changes in the pipeline. J. Build. Eng. 2020, 31, 101435. [Google Scholar] [CrossRef]
  23. Kalús, D.; Gašparík, J.; Janík, P.; Kubica, M.; Šťastný, P. Innovative building technology implemented into facades with active thermal protection. Sustainability 2021, 13, 4438. [Google Scholar] [CrossRef]
  24. Kalús, D.; Janík, P.; Kubica, M. Experimental house EB2020–Research and experimental measurements of an energy roof. Energy Build. 2021, 248, 111172. [Google Scholar] [CrossRef]
  25. Krajčík, M.; Arici, M.; Šikula, O.; Šimko, M.; Review of water-based wall systems: Heating, cooling, and thermal barriers. In Energy & Buildings, September 2021, ISSN 0378-7788. Available online: https://www.sciencedirect.com/science/article/pii/S037877882100760X (accessed on 11 December 2021).
  26. Dahlsveen, T.; Petráš, D.; Chmúrny, I.; Smola, A.; Lulkovičová, O.; Füri, B.; Konkoľ, R. Energetický Audit a Certifikácia Budov; Jaga: Bratislava, Slovakia, 2008; ISBN 978-80-8076-063-2. [Google Scholar]
  27. Krajčík, M.; Petráš, D.; Skalíková, I. Energetické Hodnotenie Budov; SPEKTRUM STU: Bratislava, Slovakia, 2019; ISBN 978-80-227-4903-9. [Google Scholar]
  28. Žilinská Teplárenská, a. s. Available online: https://www.teplarenzilina.sk/zakaznicka-zona/ceny-tepla (accessed on 11 December 2021).
  29. EUROSTAT. Available online: https://ec.europa.eu/eurostat/statistics-explained/index.php?title=Main_Page (accessed on 11 December 2021).
  30. Isover. Available online: Isover-sk_cennik_tepelnych_izolacii_a_prislusenstva_isover_od_27_10_2021_0(2) (accessed on 11 December 2021).
  31. NBS. Available online: https://www.nbs.sk/sk/statisticke-udaje/vybrane-makroekonomicke-ukazovatele/ceny-nehnutelnosti-na-byvanie/ceny-nehnutelnosti-na-byvanie-podla-krajov (accessed on 11 December 2021).
  32. Wikipédia. Available online: https://sk.wikipedia.org/wiki/Siv%C3%A1_energia?veaction=edit&section=13 (accessed on 11 December 2021).
  33. EUROPEAN PATENT EP 2 572 057 B1. Heat Insulating Panel with Active Regulation of Heat Transition. International Application Number: PCT/SK2011/000004, International Publication Number: WO 2011/146025 (24.11.2011 Gazette 2011/47). 15 October 2014; 69p.
  34. UTILITY MODEL SK 5725 Y1 (UTILITY MODEL): Tepelnoizolačný Panel pre Systémy s Aktívnym Riadením Prechodu Tepla. Thermal Insulation Panel for Systems with Active Heat Transfer Control. Vestník ÚPV SR No. 4/2011. 25 February 2011; 63p.
  35. UTILITY MODEL SK 5729 Y1 (UTILITY MODEL): Samonosný Tepelnoizolačný Panel pre Systémy s Aktívnym Riadením Prechodu Tepla. Self-Supporting Thermal Insulation Panel for Systems with Active Heat Transfer Control. Vestník ÚPV SR No. 4/2011. 28 February 2011; 32p.
  36. Šimko, M. Energy Efficiency in Buildings with Systems with Active Thermal Protection. Ph.D. Thesis, Slovak Technical University in Bratislava, Faculty of Civil Engineering, Bratislava, Slovak, June 2011. [Google Scholar]
  37. UTILITY MODEL SK 5749 Y1 (UTILITY MODEL): Spôsob Prevádzky Kombinovaného Stavebno-Energetického Systému Budov a Zariadenie. Method of Operation of a Combined Construction-Energy System of Buildings and Equipment. Vestník ÚPV SR No. 5/2011. 1 April 2011; 23p.
Figure 1. Thermal technical properties and assessment of a multilayer perimeter wall fragment [4].
Coatings 11 01538 g001
Figure 2. Heat delivered to the thermal barrier at a thermal insulation thickness of 50 mm to achieve the standard thermal resistance of the building structure.
Coatings 11 01538 g002
Figure 3. Dependence of layer temperature in TB and thermal resistance R ((m2·K)/W) on thermal insulation thickness.
Coatings 11 01538 g003
Figure 4. Dependence of heat transfer coefficient on thermal insulation thickness.
Coatings 11 01538 g004
Figure 5. Continuous control of the heating/cooling water supply temperature according to the temperature at the thermal barrier level in a two-pipe system with summer-winter switching: 1—central distributor/collector for heating; 2—central distributor/collector for cooling; 3—zone distributor/collector; 4—three-way changeover valve; 5—changeover contact—summer/winter; 6—continuous temperature sensor for supply heating/cooling medium; 7—continuous temperature sensor at thermal barrier level; 8—controller; 9—three-way mixing valve with actuator; 10—contact humidity sensor; 11—two-way control valve with actuator; 12—room.
Coatings 11 01538 g005
Figure 6. Development of electricity prices for non-household consumers, EU, 2008–2021 [29].
Coatings 11 01538 g006
Figure 7. Electricity prices for household consumers, first half 2021 [29].
Coatings 11 01538 g007
Figure 8. Development of natural gas prices for non-household consumers, EU, 2008–2021 [29].
Coatings 11 01538 g008
Figure 9. Natural gas prices for household consumers, first half 2021 [29].
Coatings 11 01538 g009
Figure 10. Dependence of physical variables on the thickness of thermal insulation.
Coatings 11 01538 g010
Figure 11. Dependence of heat demand for thermal barrier.
Coatings 11 01538 g011
Figure 12. Dependence of heat costs for the thermal barrier (€/(year·m2)).
Coatings 11 01538 g012
Figure 13. Dependence of the time period of higher economic efficiency of the thermal barrier depending on energy prices and the thickness of thermal insulation (year).
Coatings 11 01538 g013
Figure 14. Increasing the potential area of the building for sale for a facade with 50 mm thermal insulation and a thermal barrier compared to a normative facade with 210 mm thermal insulation.
Coatings 11 01538 g014
Figure 15. Dependence of economic indicator No. 2—the relationship between the higher selling price of the building and the heat for thermal barrier (TB).
Coatings 11 01538 g015
Figure 16. Dependence of economic indicator No. 3.
Coatings 11 01538 g016
Figure 17. Economic indicator No. 1—time period of higher economic efficiency of the thermal barrier depending on energy prices, thickness of thermal insulation and use of RES.
Coatings 11 01538 g017
Figure 18. The multiple-function character of active thermal protection—ATP (WATER base) [23], RC—reinforced concrete, TI—thermal insulation, A—Thermal barrier, B—Heating, C—Cooling, D—Heat/cold accumulation.
Coatings 11 01538 g018
Figure 19. Application of the contact insulation system with a register collecting solar energy or energy of the surrounding environment, in combination with heat pump [23].
Coatings 11 01538 g019
Figure 20. Application of the contact insulation system by means of thermally active panels, with a combined function of ATP and register collecting solar energy or energy of the surrounding [23].
Coatings 11 01538 g020
Figure 21. Application of contact thermal insulation system using thermal insulation panels and prototypes of thermal insulation panels ATP—EPS and mineral wool [23,33,34].
Coatings 11 01538 g021
Table 1. Development of heat prices in Slovakia [28].
Heat ProducersTitle201020112012201320142015201620172018201920202021
Trnavská teplárenská€/MWh35.8537.1940.1444.1846.6647.2448.2348.7950.7751.7454.74854.535
Žilinská teplárenská, a.s. €/MWh43.6346.1648.9951.8353.4453.4453.4453.4458.2163.8666.24563.601
Martinská teplárenská, a.s.€/MWh47.1157.4662.5867.8767.0567.0566.9564.9064.9068.3068.3067.975
Zvolenská teplárenská, a.s.€/MWh58.2259.9261.5563.5564.3464.8364.8364.6364.6368.5469.66471.749
Tepláreň Košice, a.s.€/MWh49.8648.1154.7558.3361.9161.0760.6359.2164,9970.5670.48469.310
Tepláreň Považská Bystrica€/MWh57.7764.3771.5571.2272.7572.7572.7563.5563.5574.0074.0070.000
Bratislavská teplárenská, a.s.€/MWh67.9170.1174.7975.8975.8476.1675.3973.8173.8178.8978.89170.789
Table 2. Price list of thermal insulation and accessories ISOVER [30].
MarkingThermal Resistance RQuantity in PackageQuantity Per PalletPrice without VATPrice with VATCategory
(cm)(m2K/W)(m2)(m2/pal.)(€/m2)(€/m2)
EPS 70F 2 *0.5015.00150.001.201.44A
EPS 70F 3 *0.7510.00100.001.802.16A
EPS 70F 4 *1.57.5075.002.402.88A
EPS 70F 5 *1.306.0060.003.003.60A
EPS 70F 6 *1.555.0050.003.604.32A
EPS 70F 8 *2.103.5035.004.805.76A
EPS 70F 10 *2.603.0030.006.007.20A
EPS 70F 12 *3.152.5025.007.208.64A
EPS 70F 14 *3.652.0020.008.4010.8A
EPS 70F 15 *3.902.0020.009.0010.80A
EPS 70F 16 *4.201.5015.009.6011.52A
EPS 70F 18 *4.701.5015.0010.8012.96A
EPS 70F 20 *5.251.5015.0012.0014.40A
EPS 70 F 225.801.0010.0013.2015.84B
EPS 70 F 246.301.0010.0014.4017.28B
EPS 70 F 256.601.0010.0015.0018.00B
EPS 70 F 266.851.0010.0015.6018.72B
EPS 70 F 287.351.0010.0016.8020.16B
EPS 70 F 307.851.0010.0018.0021.60B
* Sale only on complete pallets. Category A: delivery time up to 5 working days after confirmation of receipt of order *. Category B: delivery time within 10–15 working days from order confirmation *.
Table 3. Housing real estate prices: by region of the Slovak Republic [31].
Year, QuarterSR AverageRegion SR
BATTNRTNZABBKEPO
3Q 2021212228701376108012571491121314821347
2Q 2021205227871285105311991451114514341323
1Q 2021193025791230101811271395109614951256
20201762233311969511054131298913251148
4Q 202018532470119497110651336109214341226
3Q 202017922360119898810891330103014211163
2Q 20201731227312089451038133091113541153
1Q 20201671223111839001025125492310921050
2019157421021138877944112382510341036
4Q 201915972 1321140881989116482310351085
3Q 201916032 1481143888944115182510501046
2Q 201915562 0721146857948109984310161025
1Q 201915392 053112488389510768091035988
Publisher’s Note: MDPI stays neutral with regard to jurisdictional claims in published maps and institutional affiliations.

