Article

Ion Sensitive GO-Si Based Metal-Semiconductor Junction Resistor Gas Sensor

1
SINOPEC Northwest Company of China Petroleum and Chemical Corporation, Urumqi 830011, China
2
School of Microelectronics, Xi’an Jiaotong University, Xi’an 710049, China
*
Author to whom correspondence should be addressed.
Coatings 2021, 11(11), 1310; https://doi.org/10.3390/coatings11111310
Submission received: 31 August 2021 / Revised: 18 October 2021 / Accepted: 21 October 2021 / Published: 28 October 2021
(This article belongs to the Special Issue New Advances in Thin-Film Transistor)

Abstract

:
Gas sensor based on the Ultraviolet and Ozone (UVO) treated Chemical Vapor Deposition (CVD) Graphene Oxide (GO) and the Ion Sensitive GO-Si based metal-semiconductor junction resistor was designed and realized. Under different gate voltages, the response characteristics of the sensor to ammonia concentration, as well as the selectivity and stability of the sensor were studied. The test results show that the comprehensive performance of the gas sensor is the best when the UVO processing time is 1 min and the applied gate voltage is −9 V. The proposed Ion Sensitive GO-Si based metal-semiconductor junction resistor Gas Sensor can detect 250 ppb ammonia with a sensitivity of 4%. The detection limit of the sensor is 50 ppb. Using acetone and ethanol as contrast gases, the sensor shows better selectivity for ammonia. The sensitivity retention rate of the sensor after 10 days is higher than 70%, which indicates that the sensor has a good retention performance.

1. Introduction

As a new type of low-dimensional carbon material, graphene not only has excellent electrical, optical, mechanical, and thermal properties [1,2,3,4,5], but also has high specific surface area. Graphene can provide more adsorption surface for gas molecules, and can realize gas detection at room temperature. In 2007, Geim et al. reported that intrinsic graphene can detect single gas molecules [6]. Graphene is considered to have great potential in the field of gas molecular detection. Since then, the research on gas sensing properties of graphene has become an important topic.
Moreover, as a toxic gas, ammonia has a great stimulating effect on the respiratory organs of the human body. Prolonged exposure to ammonia concentrations in excess of 25 ppm can cause cell damage and even death [7]. In industrial production and automobile industry, exhaust gas will produce a lot of ammonia, in order to protect the human property and life safety. Therefore, the detection effect of ammonia gas is very important.
The most basic gas detection device is the Chromatographic Instrument. However, due to its big size and high cost, it is not suitable for distributed detection environment [8]. At present, gas sensors are candidates suitable for distributed measurement. In the electric parameter gas sensor, there are chemical and physical categories, such as electrochemical sensors and infrared sensors. At present, the infrared sensor technology is not exquisite enough and the cost is high. Therefore, there are certain limitations in the application of the market. In addition, the electrochemical sensor market potential is huge. It has a low cost, long life, fast response and recovery time, simple electronic structure, and can be designed according to sensitive materials corresponding to the gas sensor [9]. Therefore, the paper mainly studies a kind of electrochemical gas sensor. The important performance indexes of gas sensor are sensitivity, linearity, stability, response speed, and selectivity. The sensitivity reflects the relative responsivity of the sensor when it meets the measured gas. Linearity reflects the correlation between the gas concentration and the output electrical parameters of the sensor [10,11,12,13,14]. Stability is related to the service life and repeatability of the sensor. The response speed represents the sensing speed of the sensor when it comes into contact with the measured gas and the recovery speed when it leaves the measured gas environment. Selectivity refers to the ability of the sensor to distinguish the interference gas. The higher the selectivity, the stronger the anti-interference ability of the sensor and the higher the signal-to-noise ratio of the target gas.
Graphene gas sensor can realize the ppb-level gas detection. For example, Seyedeh Maryam et al. doped graphene with nitrogen dioxide, and the detection limit of ammonia reached 200 ppb. In contrast, the detection limit of graphene before doping is only 1.4 ppm [15,16]. Jun Wu et al. achieved a three-dimensional reduced graphene oxide hydrogel sensor with a micro heater structure, and the detection limits for nitrogen dioxide and ammonia reached 200 ppb and 20 ppm [17], respectively. Our research team improved the detection sensitivity of graphene to ammonia through graphene modified with gold nanoparticles and reduced graphene oxide treated with tannic acid [18,19,20,21].
Around the research of graphene gas sensor, the graphene derivative Graphene Oxide (GO) Gas Sensor is extended. GO is a two-dimensional, flexible material with a highly defective structure that tends to form specific “selective groups” that can selectively recognize different gases [22,23,24,25]. At present, the application of graphene and GO gas sensors is focused on the research of harmful gases in life, biomedical, and industrial production. For example, toxic gases from industrial production, such as nitrogen dioxide and ammonia, are currently the focus of the research. Due to the low concentration of these gases, it has become one of the goals of the researchers to extend the gas sensor to lower the limit detection. At the same time, the sensitivity and response of the sensor are also essential when it is used for the detection of an extremely low concentration.
As gas sensitive materials, the selectivity and sensitivity of GO to ammonia are greatly improved, as compared to graphene. NH3 is N-type compared to CVD-GO. When the NH3 molecule is adsorbed on the surface of CVD-GO, it releases an electron, and at the same time, takes a proton from the film. The released electron binds to the holes in the film. However, since the contamination of chemical reagents to devices is immeasurable, it is difficult for the traditional GO process to be compatible with the integrated circuit field. Therefore, it is very important to study the gas sensors which are compatible with the IC technology and can realize graphically the GO preparation. Therefore, the Ion Sensitive GO-Si based metal-semiconductor junction resistor Gas Sensor is proposed. The gas sensor proposed in this paper is based on the surface adsorption. Its sensitivity and time characteristics have great potential to be improved. It can bias the sensor in the region with maximum responsiveness, thus improving the sensitivity of the sensor. It was prepared using the method of UVO, which is compatible with the IC technology. A few of our devices have good gate control characteristics, but most of the gate control characteristics are not obvious. Based on this, the Ion Sensitive GO-Si based metal-semiconductor junction resistor Gas Sensor was realized. In different gate voltage conditions, the way to improve the performance of the sensor is found by studying the sensitivity, response speed, selectivity, and stability of the sensor. This research has important implications for future research and commercial implementation.

2. Experiment

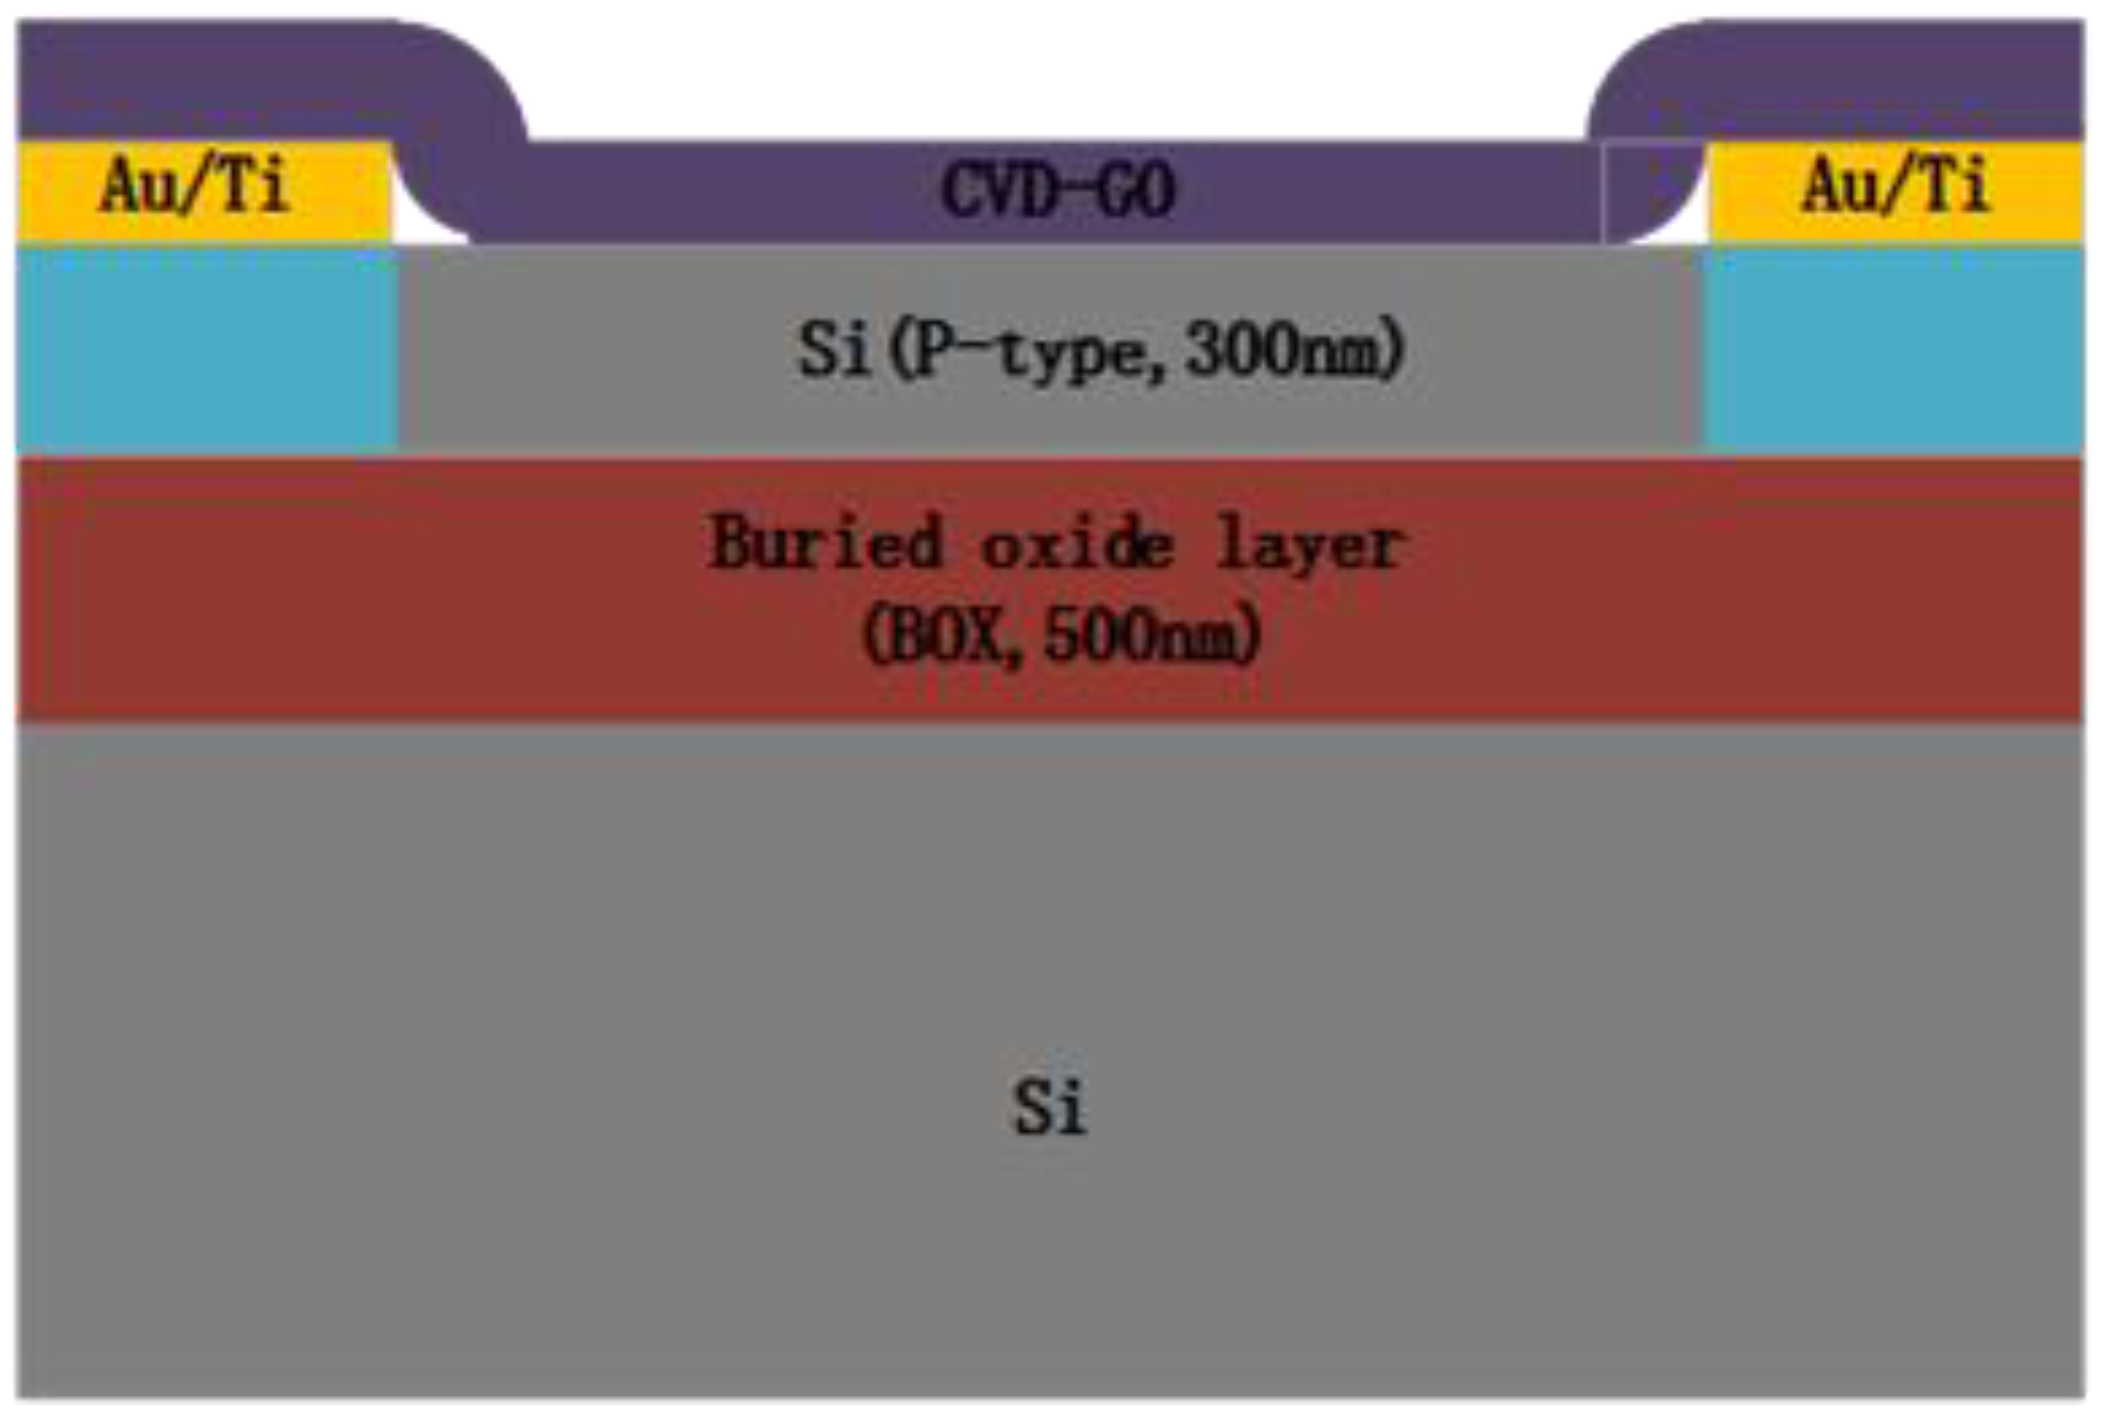
2.1. Structure of Ion Sensitive GO-Si Based Metal-Semiconductor Junction Resistor Gas Sensor

The structure of the proposed Ion Sensitive GO-Si based metal-semiconductor junction resistor Gas Sensor is shown in Figure 1. SEM images of similar structures have been studied in our previous paper. The SEM image is shown in Figure 2 [26]. The device uses Silicon On Insulator (SOI) as the substrate and Si nanoribbons as the ion effect part. The Si nanoribbons increase the contact area and improve the responsiveness. Among them, 50 μm-wide Si nanoribbons were obtained by Inductively Coupled Plasma (ICP180, Oxford Instruments PLC, Abingdon, UK) etching. After the CVD graphene is transferred to the top of the device, it is treated by Ultraviolet Light (No. 42–220, Jelight Company Inc., Irvine, CA, USA) and the Ozone (UVO, No. 42–220, Jelight Company Inc., Irvine, CA, USA) method to form the CVD-GO gas sensing material layer. The thickness of Si nanoribbons is 300 nm, and the thickness of buried oxygen layer is 500 nm. The part of p-type Si nanoribbons in contact with the metal electrode was implanted by ion implantation, as shown in the blue area of Figure 1. Since the impurity concentration is less than the original p-type impurity concentration, the ion implantation region in contact with the metal is still p-type, and the impurity concentration is far less than the Si nanoribbons. Since the noise is caused by the 1/f noise and Johnson noise, the 1/f noise mainly results from the changes of minority carrier number and carrier mobility caused by defects in the sensing material as graphene [27]. Whereas, the Johnson noise originates from the irregular thermal motion of the carrier, and is proportional to the impedance of the sensing material [28]. Based on the structure of this device, the component has few defects and low resistance, thus it has low noise and high SNR.

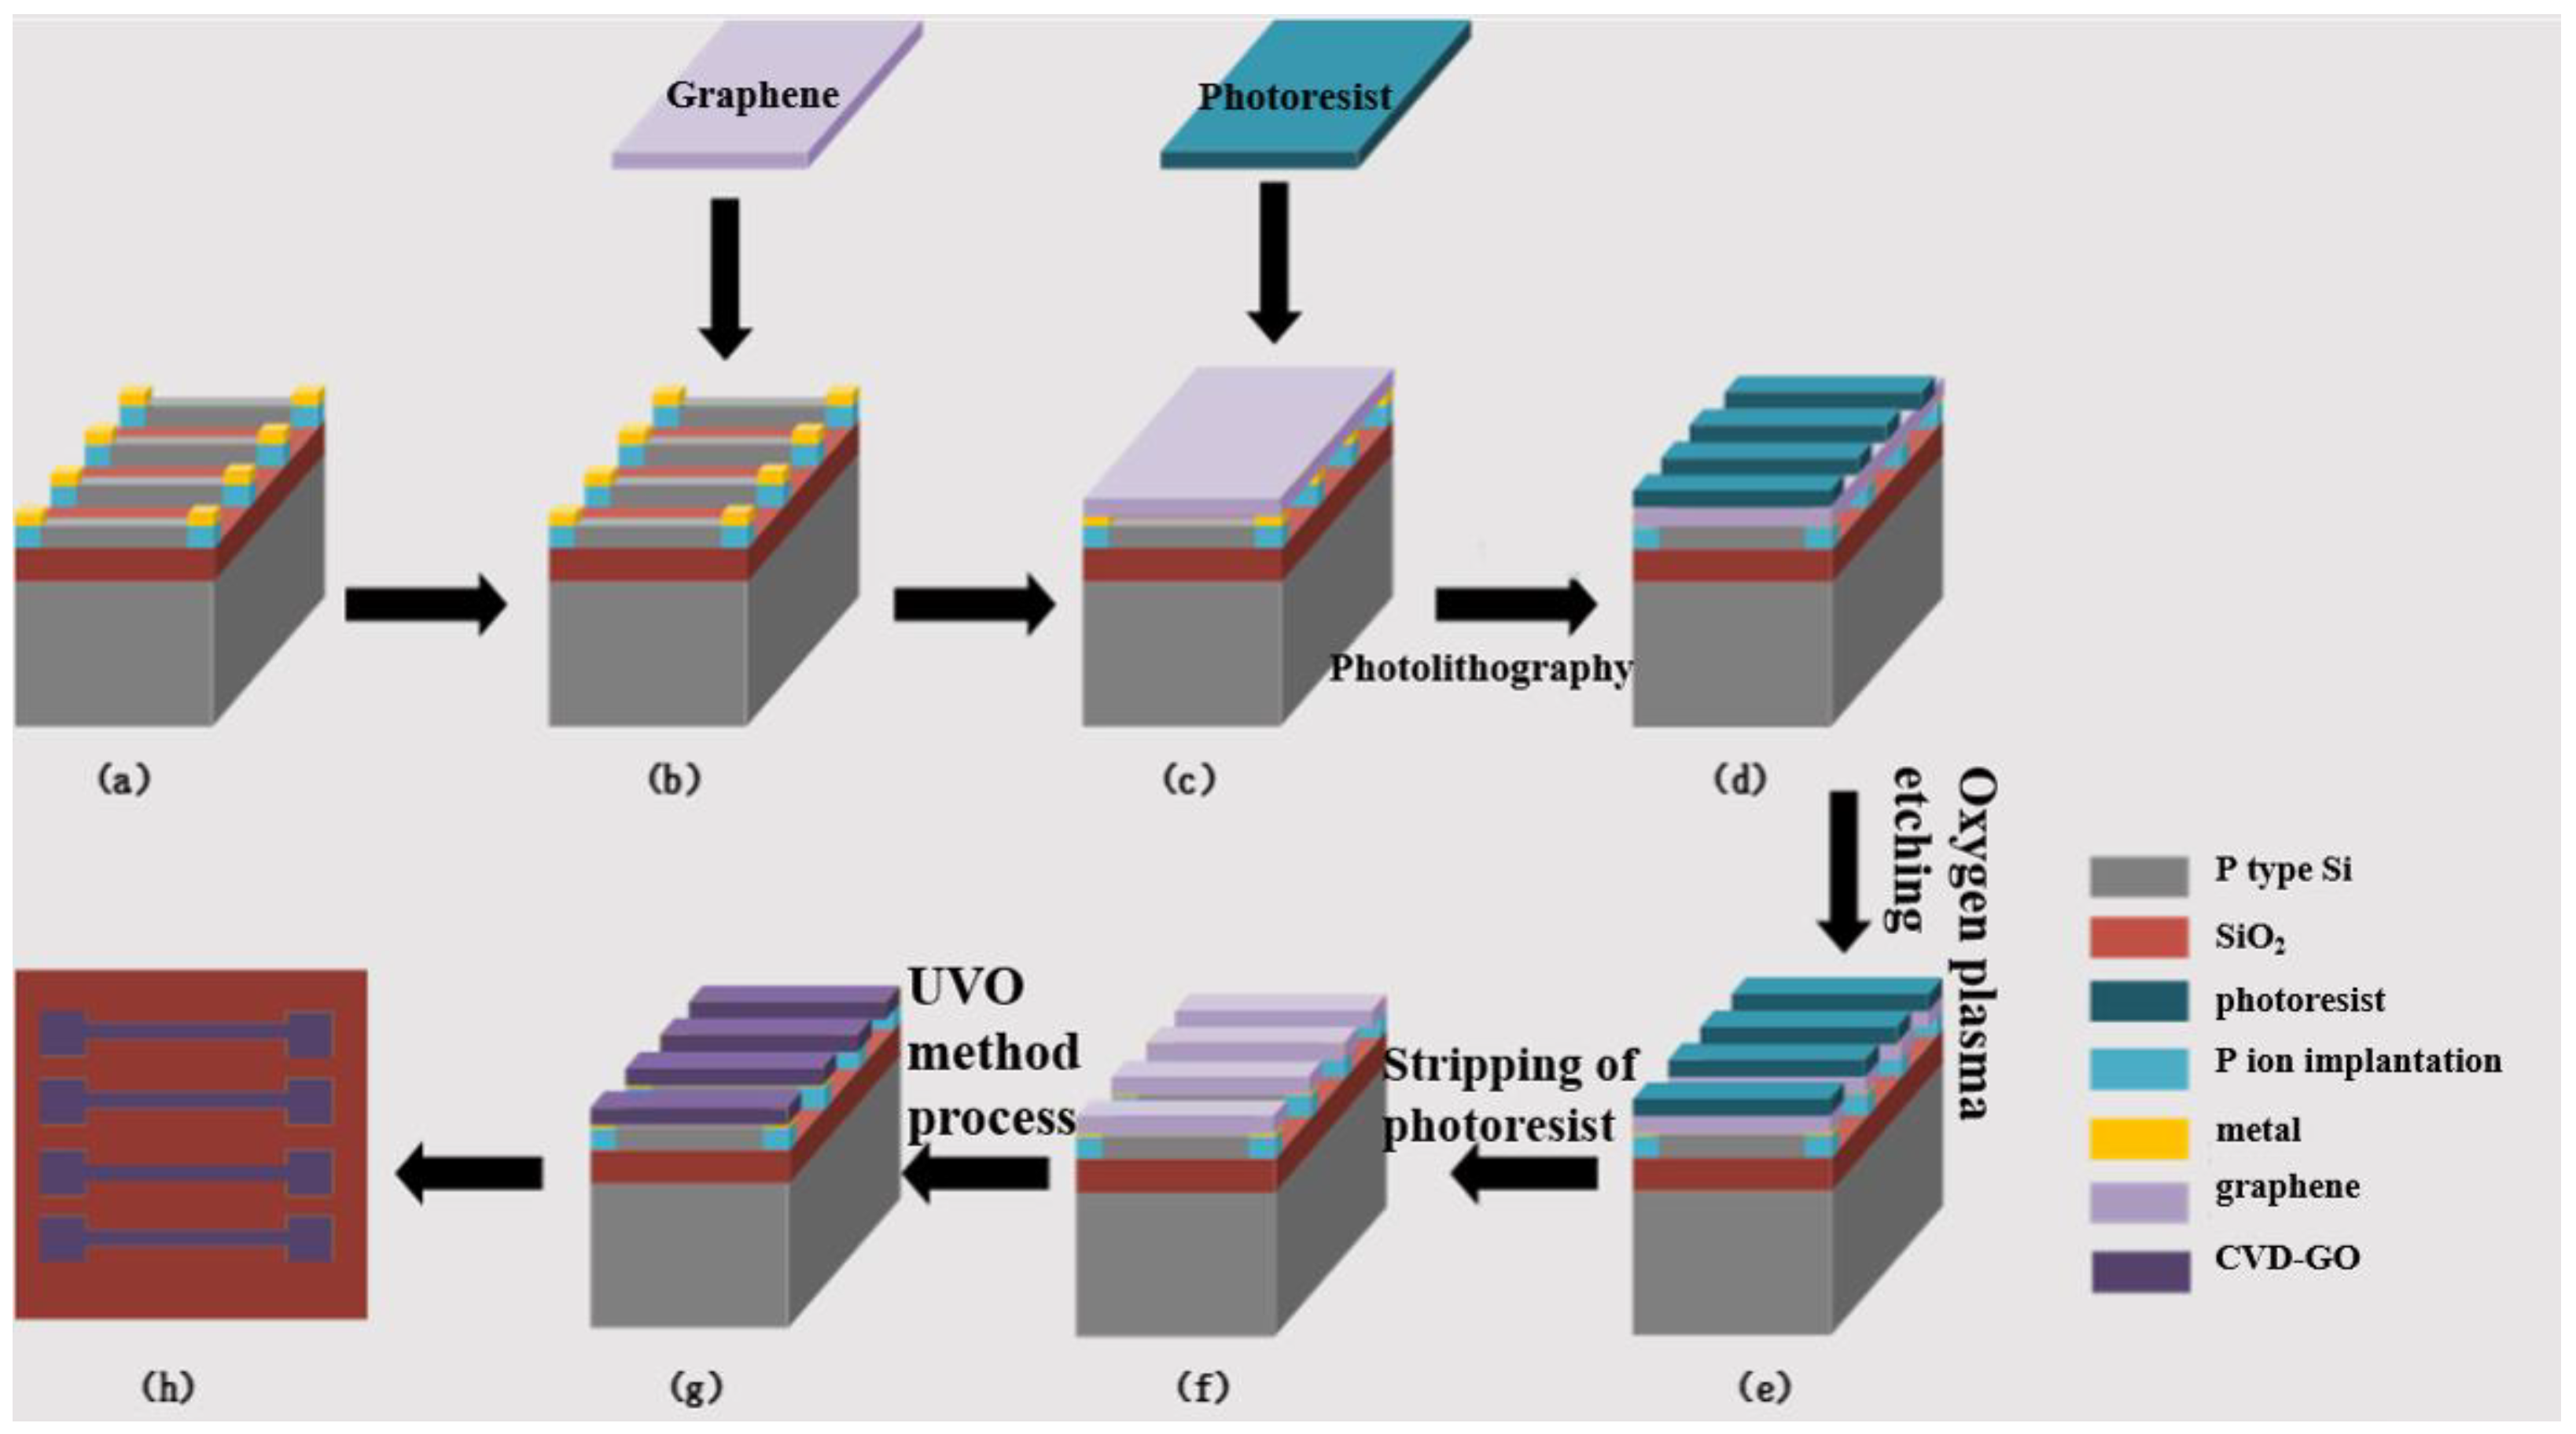
2.2. Fabrication Process of Ion Sensitive GO-Si Based Metal-Semiconductor Junction Resistor Gas Sensor

The process flow chart of Ion Sensitive GO-Si based metal-semiconductor junction resistor Gas Sensor is shown in Figure 3. Graphene was transferred onto Si nanoribbons, the required graphene strips were protected by lithography, and then the excess graphene outside the strips was removed by oxygen plasma. After gelatinization, the graphene is transformed into CVD-GO by the UVO process, and the Ion Sensitive GO-Si based metal-semiconductor junction resistor Gas Sensor is obtained. The top view of the sensor is shown in Figure 3h. The main processes used are photolithography, oxygen plasma, etc. The device array of four sensors is composed of Si substrate as the back gate, SiO2 as the gate dielectric layer, Au/Ti as the source leakage electrode, and silicon nanoribbon as the channel.
The annealing process can improve the contact between the graphene and metal electrode. By removing impurities between the graphene and metal, such as residual photoresist, and enhancing the interaction between the graphene and metal, we can improve the carrier transmission and reduce the contact resistance.
The characteristic curves of IDS-VDS and IDS-VGS were tested after graphene was transferred to the device. The curve is shown in Figure 4a,b.
Figure 4a clearly shows that graphene is in ohmic contact with the metal electrode of the device, and the current is about 1 × 10⁻³ A. Figure 4b shows the transfer characteristic curve of graphene transfer on the devices. It can be seen from Figure 4b that when the absolute value of Vgs is greater than 10 V, the device current reaches the upper limit of the maximum protection current, which is, 0.1 A. In Figure 4c, the transconductance of back gate (gm = dIds/dIgs) for different Vds can be extracted and plotted as a function of Vgs. In Figure 4c, the maximum transconductance is 3.13 × 10⁻⁵ S, which is generated when Vds is zero. Therefore, in subsequent tests, we choose Vds to be zero as the bias condition.

3. Results and Discussion

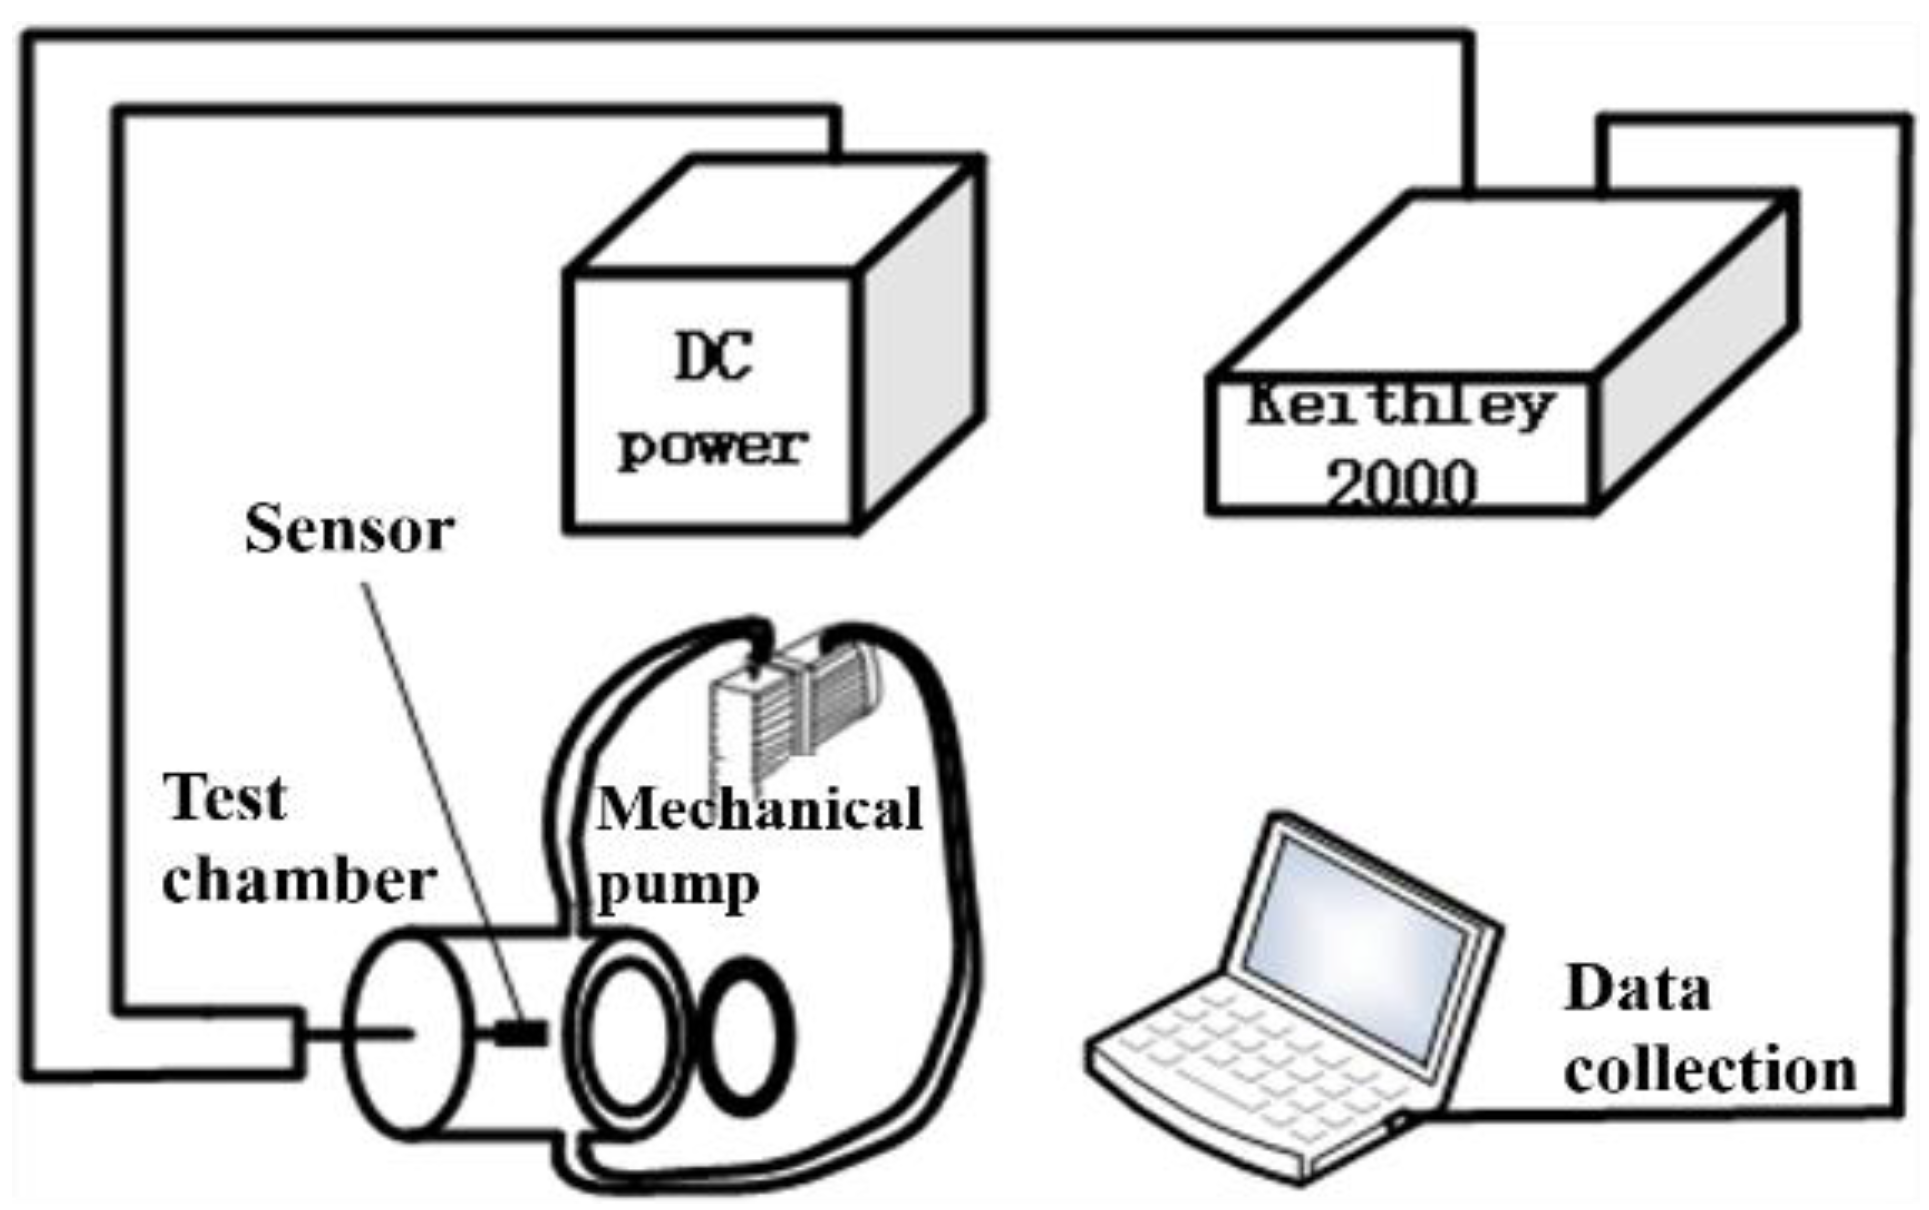
3.1. Gas Sensor Test System

The characteristics of Ion Sensitive GO-Si based metal-semiconductor junction resistor Gas Sensor are studied under different back-gate biases. The equipment used is a Keithley 2000 digital multimeter, PXN-1503D DC voltage source. Here, a manual injection is conducted through a syringe. Then, the volume of the injection is taken and converted into the concentration. The structure diagram of the gas test system setup is shown in Figure 5.
The condition of the gas test is composed of normal temperature and atmospheric pressure, and the humidity is about 45%. The test is divided into three stages, namely, the stable stage, the gas in the response stage, and the gas recovery stage. The characteristics of the gas sensor are extracted by monitoring the time response of the output current of the sensor with ammonia under different gate pressures. All of the gas sensing tests were implemented in the proposed self-made test system, as shown in Figure 5. The resistance values of several sensors changed with the injection and discharge of ammonia. The gas sensing sensitivity can be obtained by the following equation.
Sensitivity   ( % ) = R ammonia R air R air × 100 %
Rammonia and Rair are the electrical resistance values with and without ammonia gas, respectively. The ammonia characteristics of Ion Sensitive GO-Si based metal-semiconductor junction resistor Gas Sensor treated by UVO were tested. The duration of UVO treatment was 0, 1, 3, 5, 7, 9, and 11 min, respectively. Figure 6a shows the sensitivity characteristic scatter of gas sensor with different time lengths of UVO processing. As can be seen from the figure, the maximum sensitivity of the device can reach 50%. Compared with the previous sensor based on GO in our research group (the maximum sensitivity is 19%) [10], the sensitivity is significantly improved. The samples with the highest sensitivity were the 9- and 1-min samples, respectively. However, the sensitivity of 3-, 5-, and 7- min samples was lower than the 1- and 9-min samples for specific reasons, as follows: The proportion of oxygen-containing functional groups (C–O, C=O, O–C=O, etc.) on the surface of graphene increased with the increase of UVO treatment time, indicating that the oxygen-containing functional groups of GO in CVD could be improved after the UVO treatment. This, in turn, improves the gas sensitivity of the sensor. Therefore, the sensitivity of the 9-min sample is higher than the 1-, 3-, 5-, and 7-min samples. However, the resistance value of the 1-min sample decreased, since the graphene of the 1-min sample was not denaturated or the denaturation degree was very low. Therefore, the gas-sensitive performance of the 1-min sample treatment cannot be reached. However, the gas-sensitive property of the 11-min sample is obviously not as good as the sample treated for 9 min. Since the structure of the graphene treated by the UVO method for 11 min is seriously damaged and larger defects are added, thus the gas-sensitive property of the graphene is damaged and the gas-sensitive response drops sharply.
Next, the two groups of samples were fitted with linearity, and the results are shown in Figure 7. Although the sensitivity of the 9-min sample is the highest, its linearity is lower than that of the 1-min sample, and its R2 is as high as 0.98677. The reason is as follows: According to the Raman spectrum in Figure 6b, the ID/IG (≈1.07) of the 9-min sample is much higher than the 1-min sample (≈0.55). The I2D/IG (≈1.121) of the 0-min sample is greater than 1 and peak D is not visible, which shows the standard monolayer graphene Raman characteristic spectrum. I2D/IG increased sharply due to the fact that the CVD graphene oxide was obtained by the UVO treatment for 1 min. As the processing time increases, the defects increase, thus the I2D/IG weakens and the ID/IG increases. Due to the defects, the sensitivity of the 9-min sample is higher, but the linearity of the 9-min sample is lower. From the Raman spectrum, the 1-min sample has the least defect degree, the highest linearity, and high sensitivity. Therefore, through the experimental screening, the 1-min sample is the preferred sample.

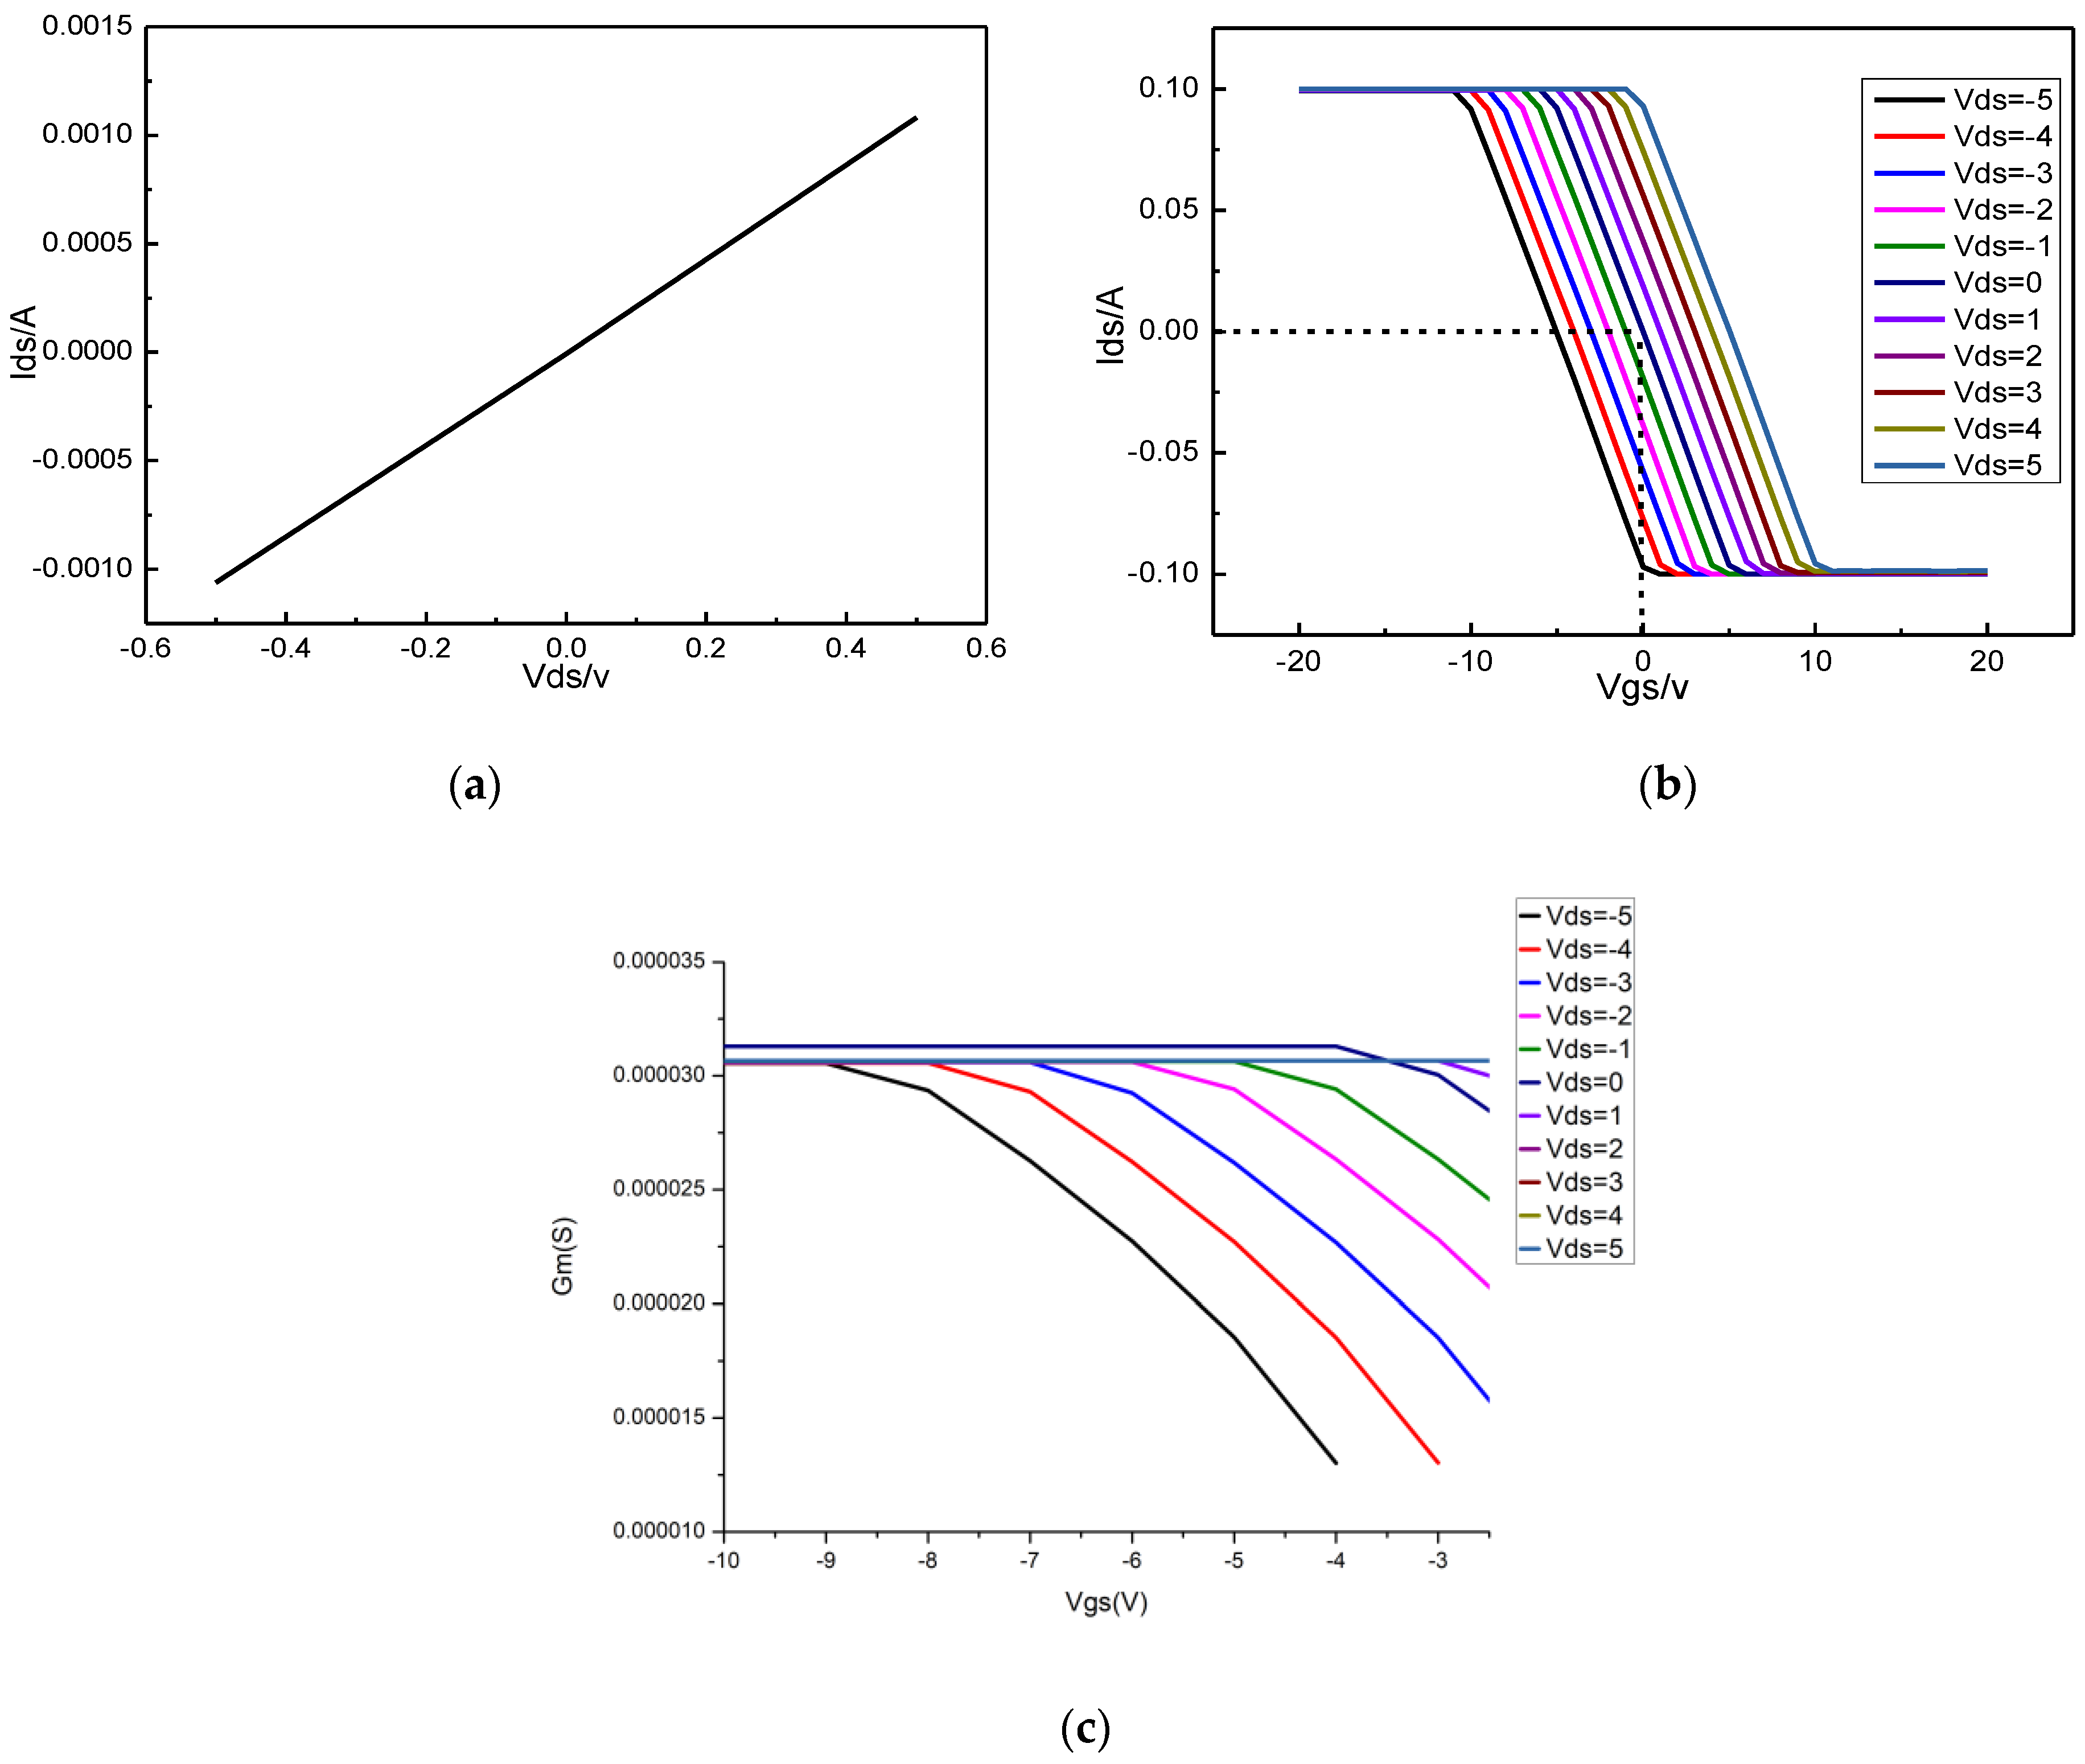
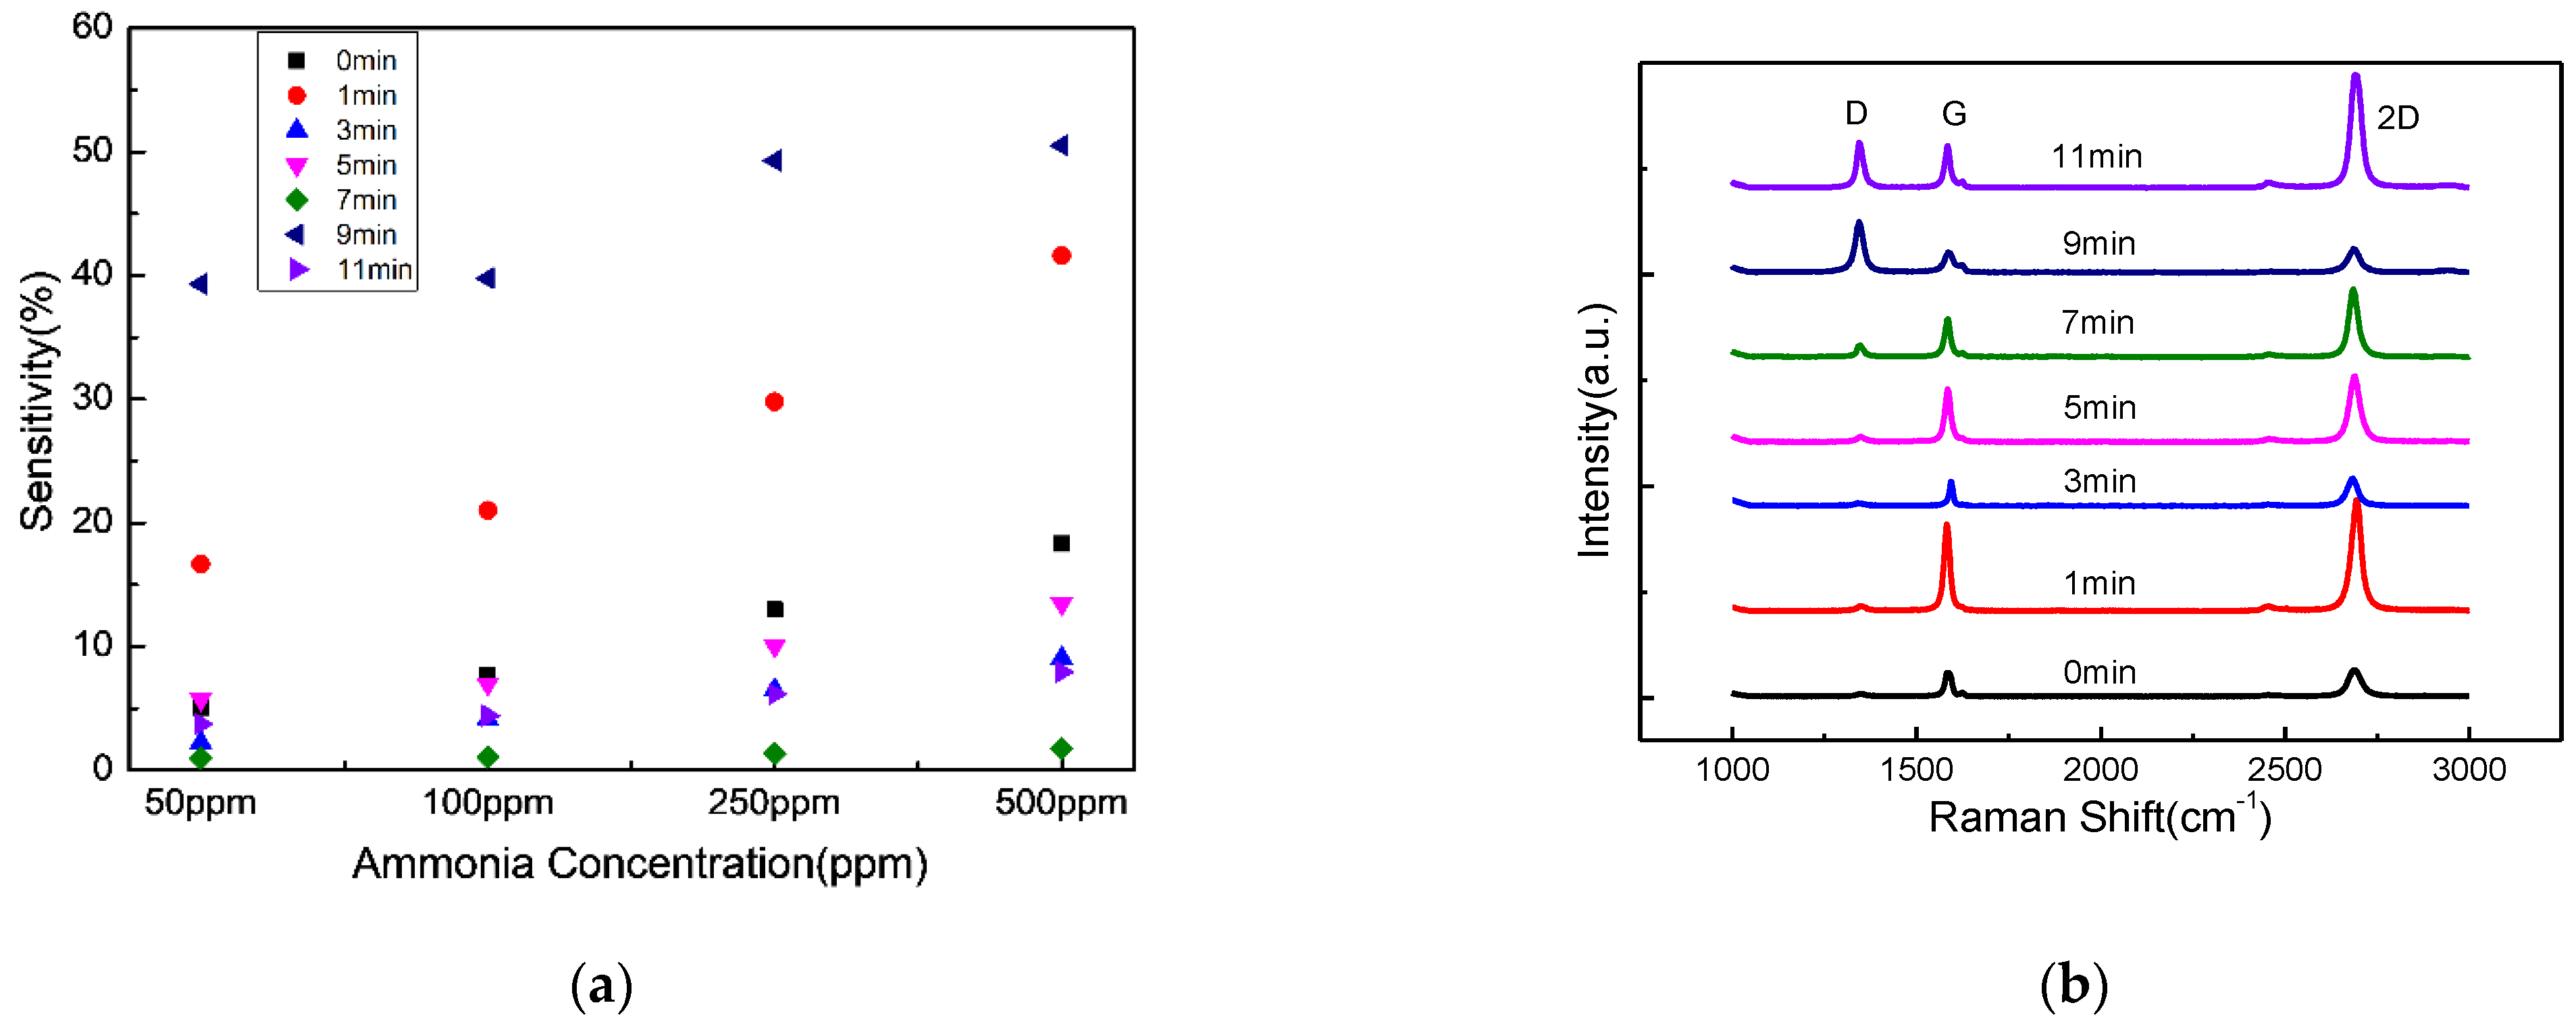
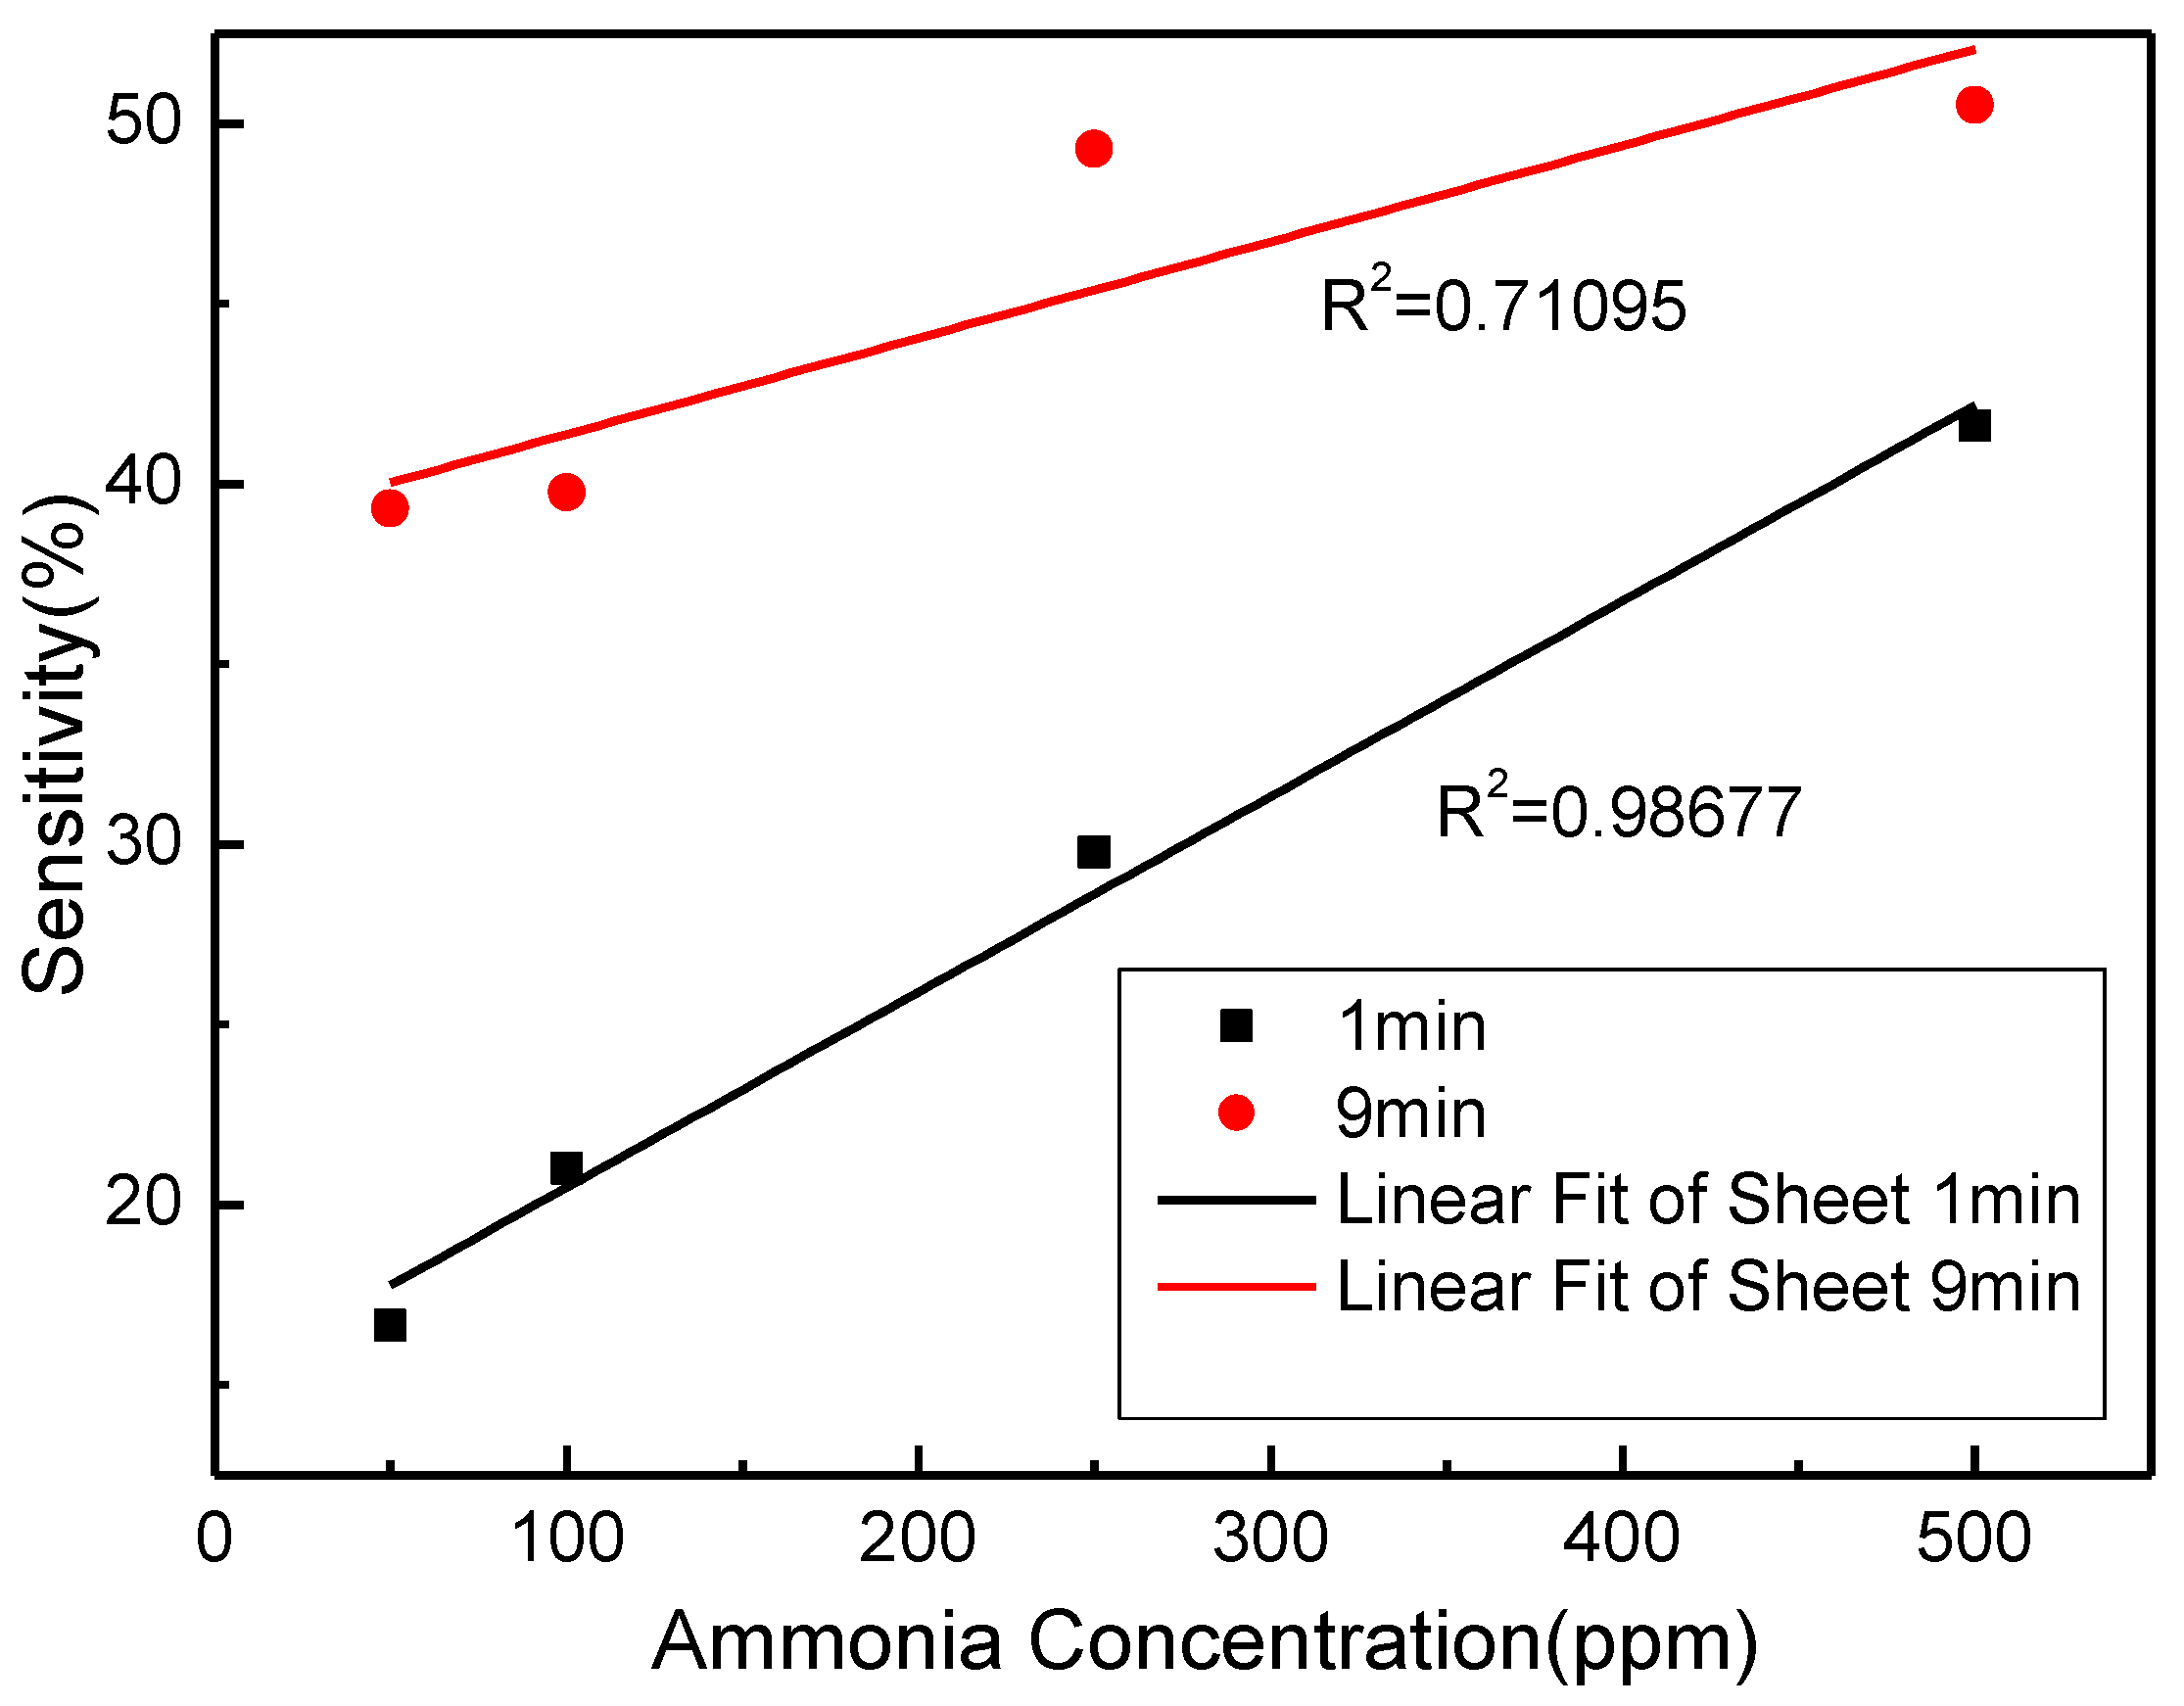
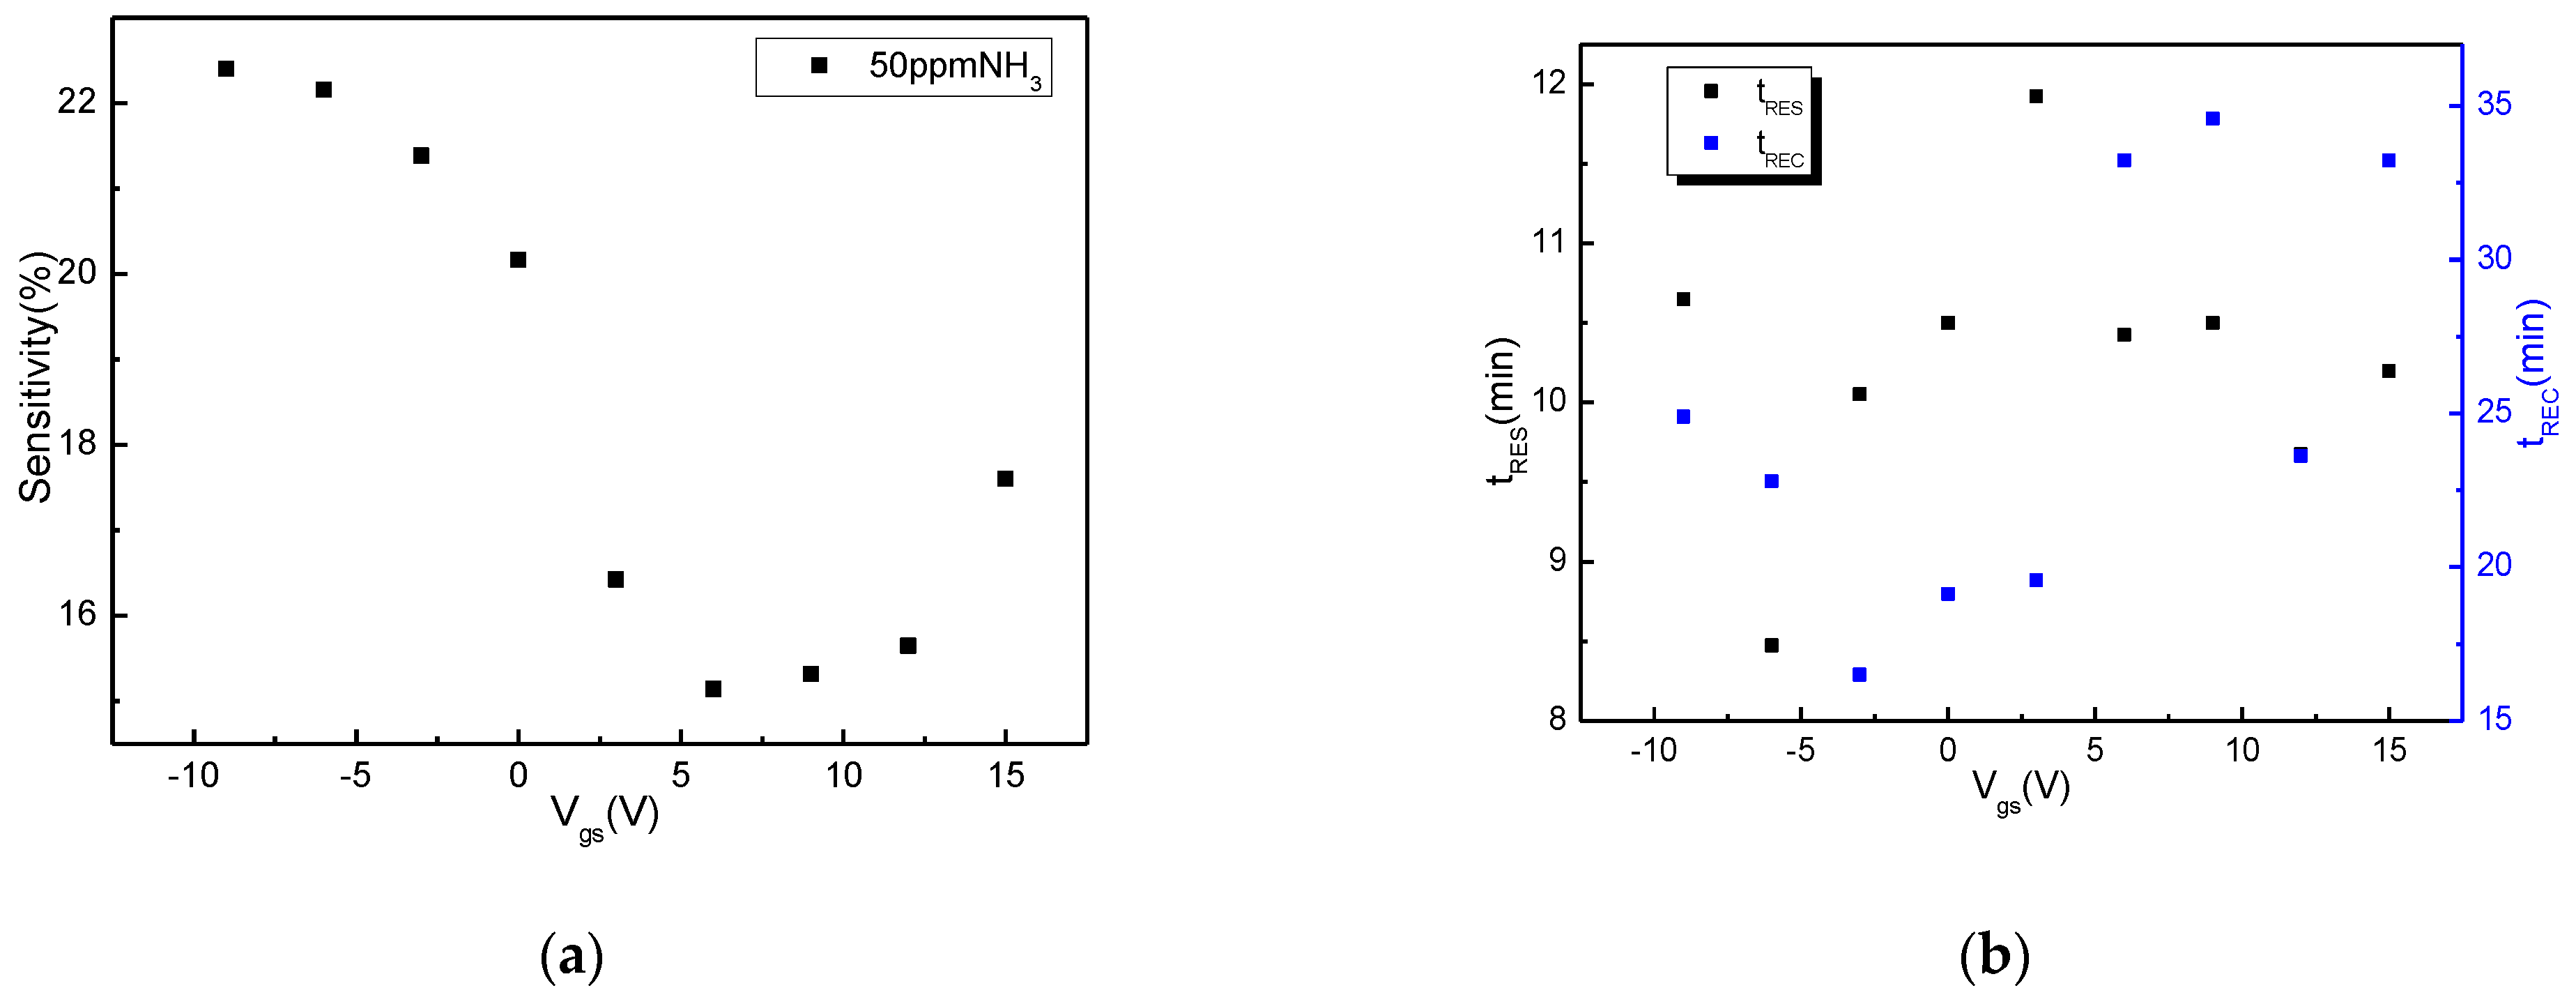
3.2. Sensing Performance of Ion Sensitive GO-Si Based Metal-Semiconductor Junction Resistor Gas Sensor

The subsequent test samples were the 1-min sample. The sensitivity response curve of Ion Sensitive GO-Si based metal-semiconductor junction resistor Gas Sensor to 50 ppm ammonia concentration at different gate pressures is shown in Figure 8, and VDS is 1 V. It can be observed from Figure 8 that the sensitivity is higher when the applied gate voltage is −10 V, but gradually tends to saturation. Therefore, it is recommended to apply the gate voltage range of −5 V to −10 V. Graphene is p-type, and the majority carrier is hole. While the negative bias pressure produces cavities, which increases the carrier concentration, it is helpful to improve the sensor sensitivity. When the positive gate voltage is applied, the sensitivity decreases first and then increases with the increase of the gate voltage. Since the positive VGS can improve the source potential and lead to the decrease of IDS, the sensitivity tends to decrease. However, when VGS is larger than VDS, IDS increases in reverse, and the sensitivity increases. Moreover, due to the positive gate voltage, the electron will compound the holes in the graphene, which will reduce the carrier concentration. Therefore, on the positive gate voltage side, the sensitivity increases, but the increase in the amplitude is not large.
Figure 8b shows the response time (tRES) and recovery time (tREC) characteristic curves of the 1-min sample. It can be observed from Figure 8b that when the negative gate voltage is applied, the recovery time of the sensor is shorter than the positive gate voltage. At the same time, when the negative gate voltage is applied, the response time of the sensor is relatively low. From the time response characteristics, when the gate voltage is −9 V, the sensitivity of the sensor is almost saturated and maximum, and the response time and recovery time are relatively low. Therefore, −9 V is the optimal gate voltage condition.

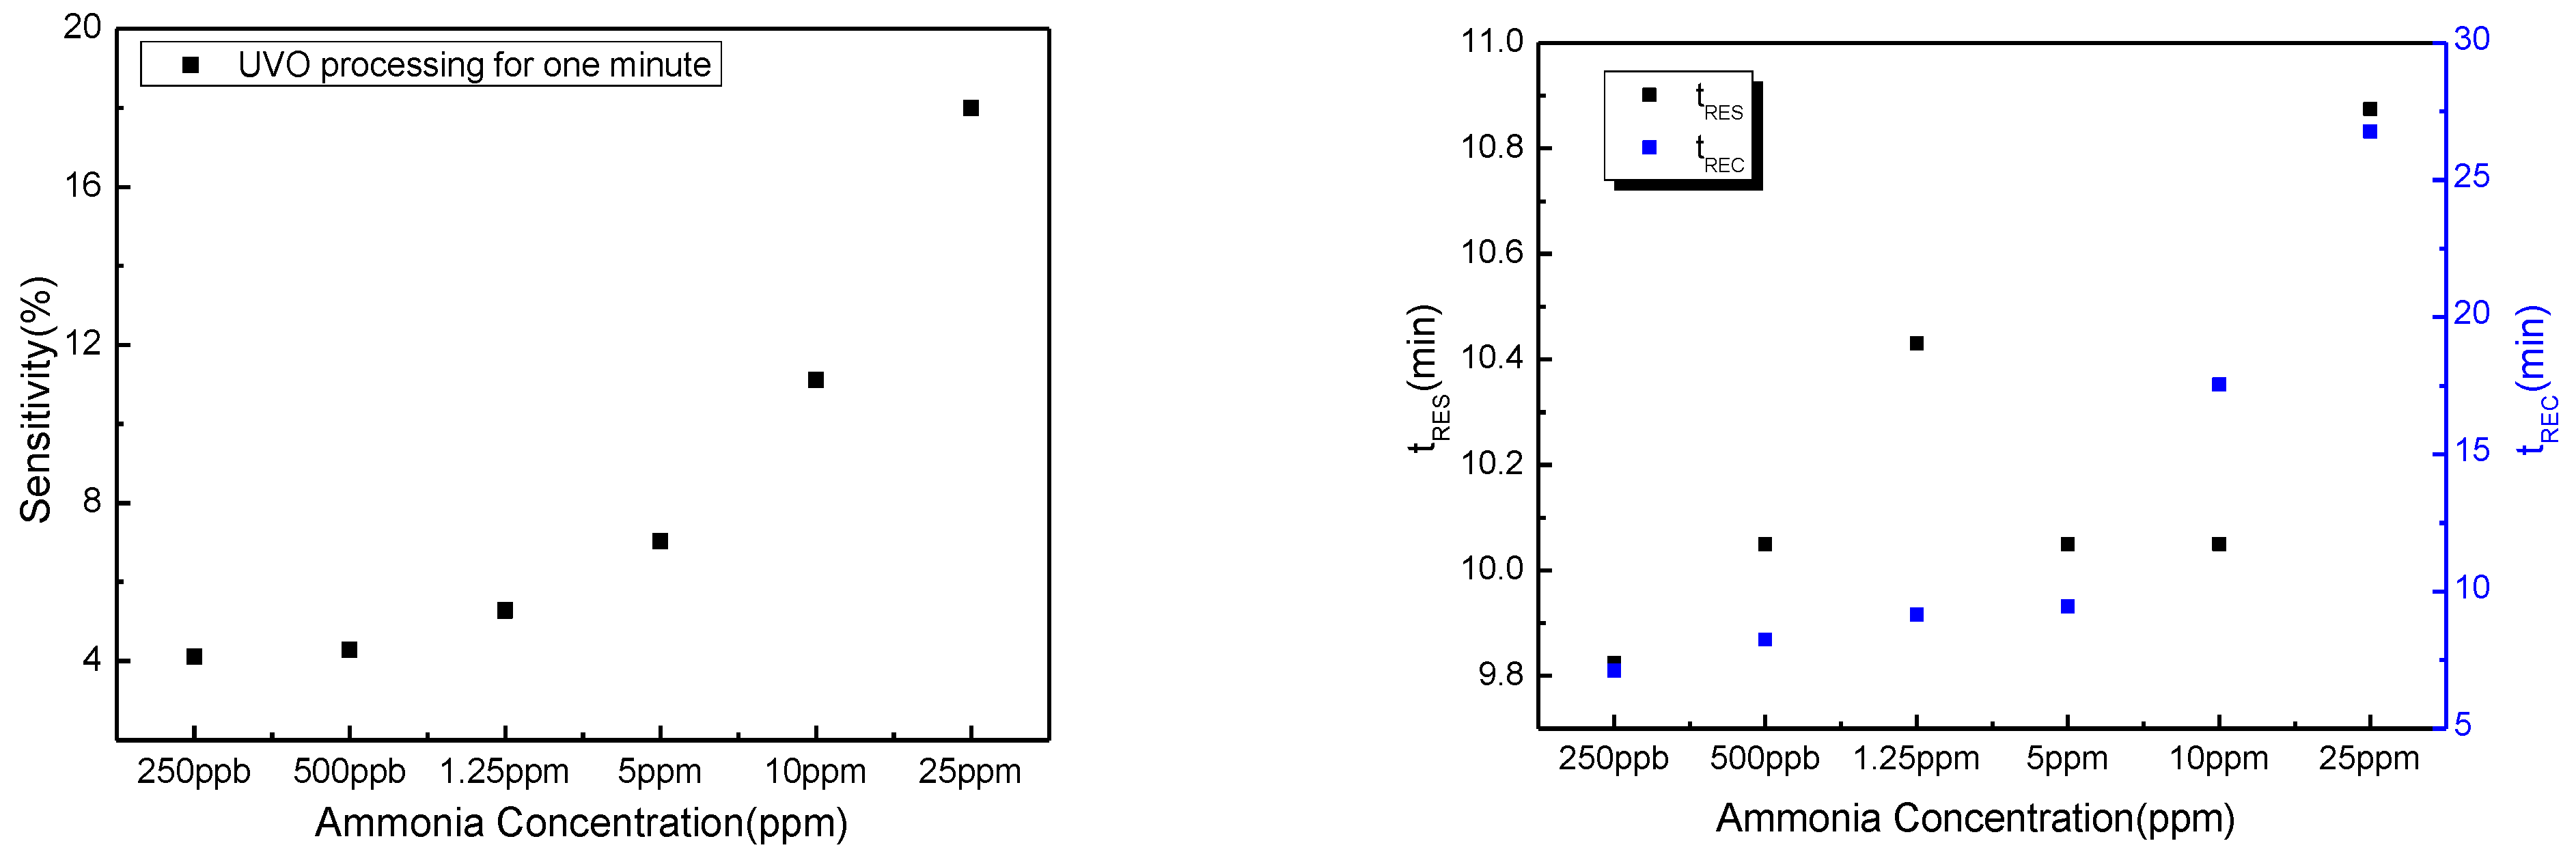
3.3. Research on the Detection Limit of Ion Sensitive GO-Si Based Metal-Semiconductor Junction Resistor Gas Sensor for Low Concentration of Ammonia

Under a low concentration of ammonia, the detection limit of the 1-min sample was studied. The gas sensing response curve of the UVO 1-min sample with the change of ammonia concentration is shown in Figure 9.
In laboratory conditions, the gas sensor can detect 250 ppb concentration of ammonia, and the sensitivity is about 4%. In the range of 250~25 ppm ammonia concentration, the response time tRES of the 1-min sample is about 10 min. Moreover, when the concentration of ammonia decreases, the tREC of the sensor decreases. When the concentration of ammonia is 250 ppb, the tRES and tREC of the sensor are about 9.8 min, respectively. The reason why the response time jumps when the ammonia concentration is 1.25 ppm may be due to the fact that the gas in the cavity is not completely dissipated. Therefore, it can be seen that when the TRES of the sensor is increased, its sensitivity will naturally improve. As a result, it is completely possible to detect the NH3 concentration below 250 ppb using this sensor. This equation [29] can be used to calculate the detection limit of the device:
DL ( ppb ) = 3 rms noise slope
where rmsnoise is the root-mean-square deviation of sensor noise, and slope is the slope of the black line (Figure 7). Finally, the gas detection limit of the sensor is calculated to be 50 ppb. Therefore, the sensor is used to detect ammonia at 50 ppb.

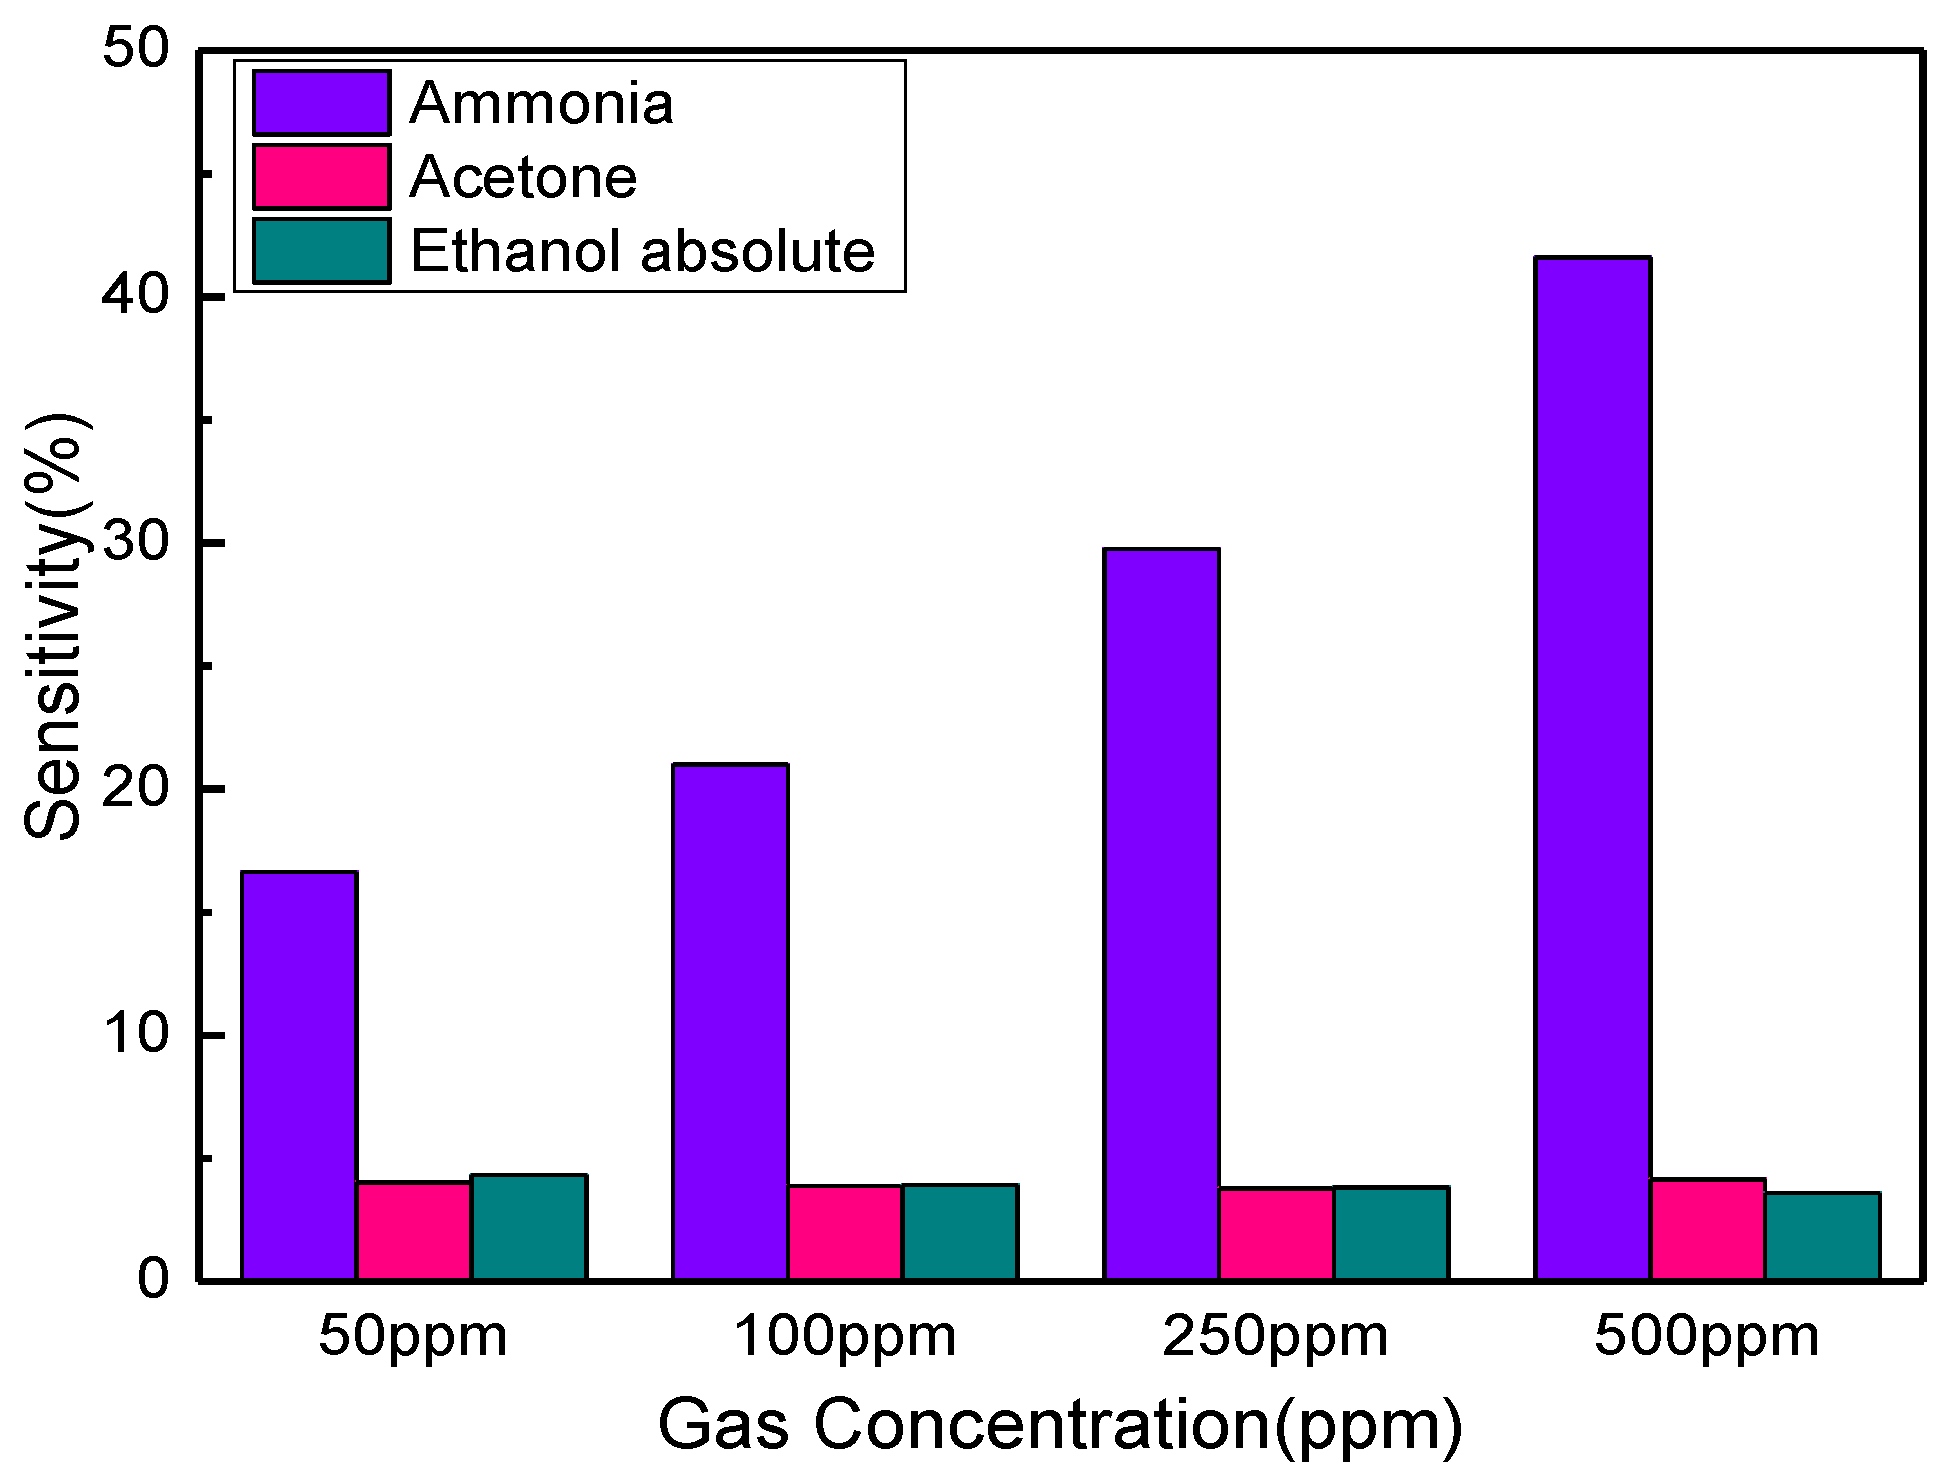
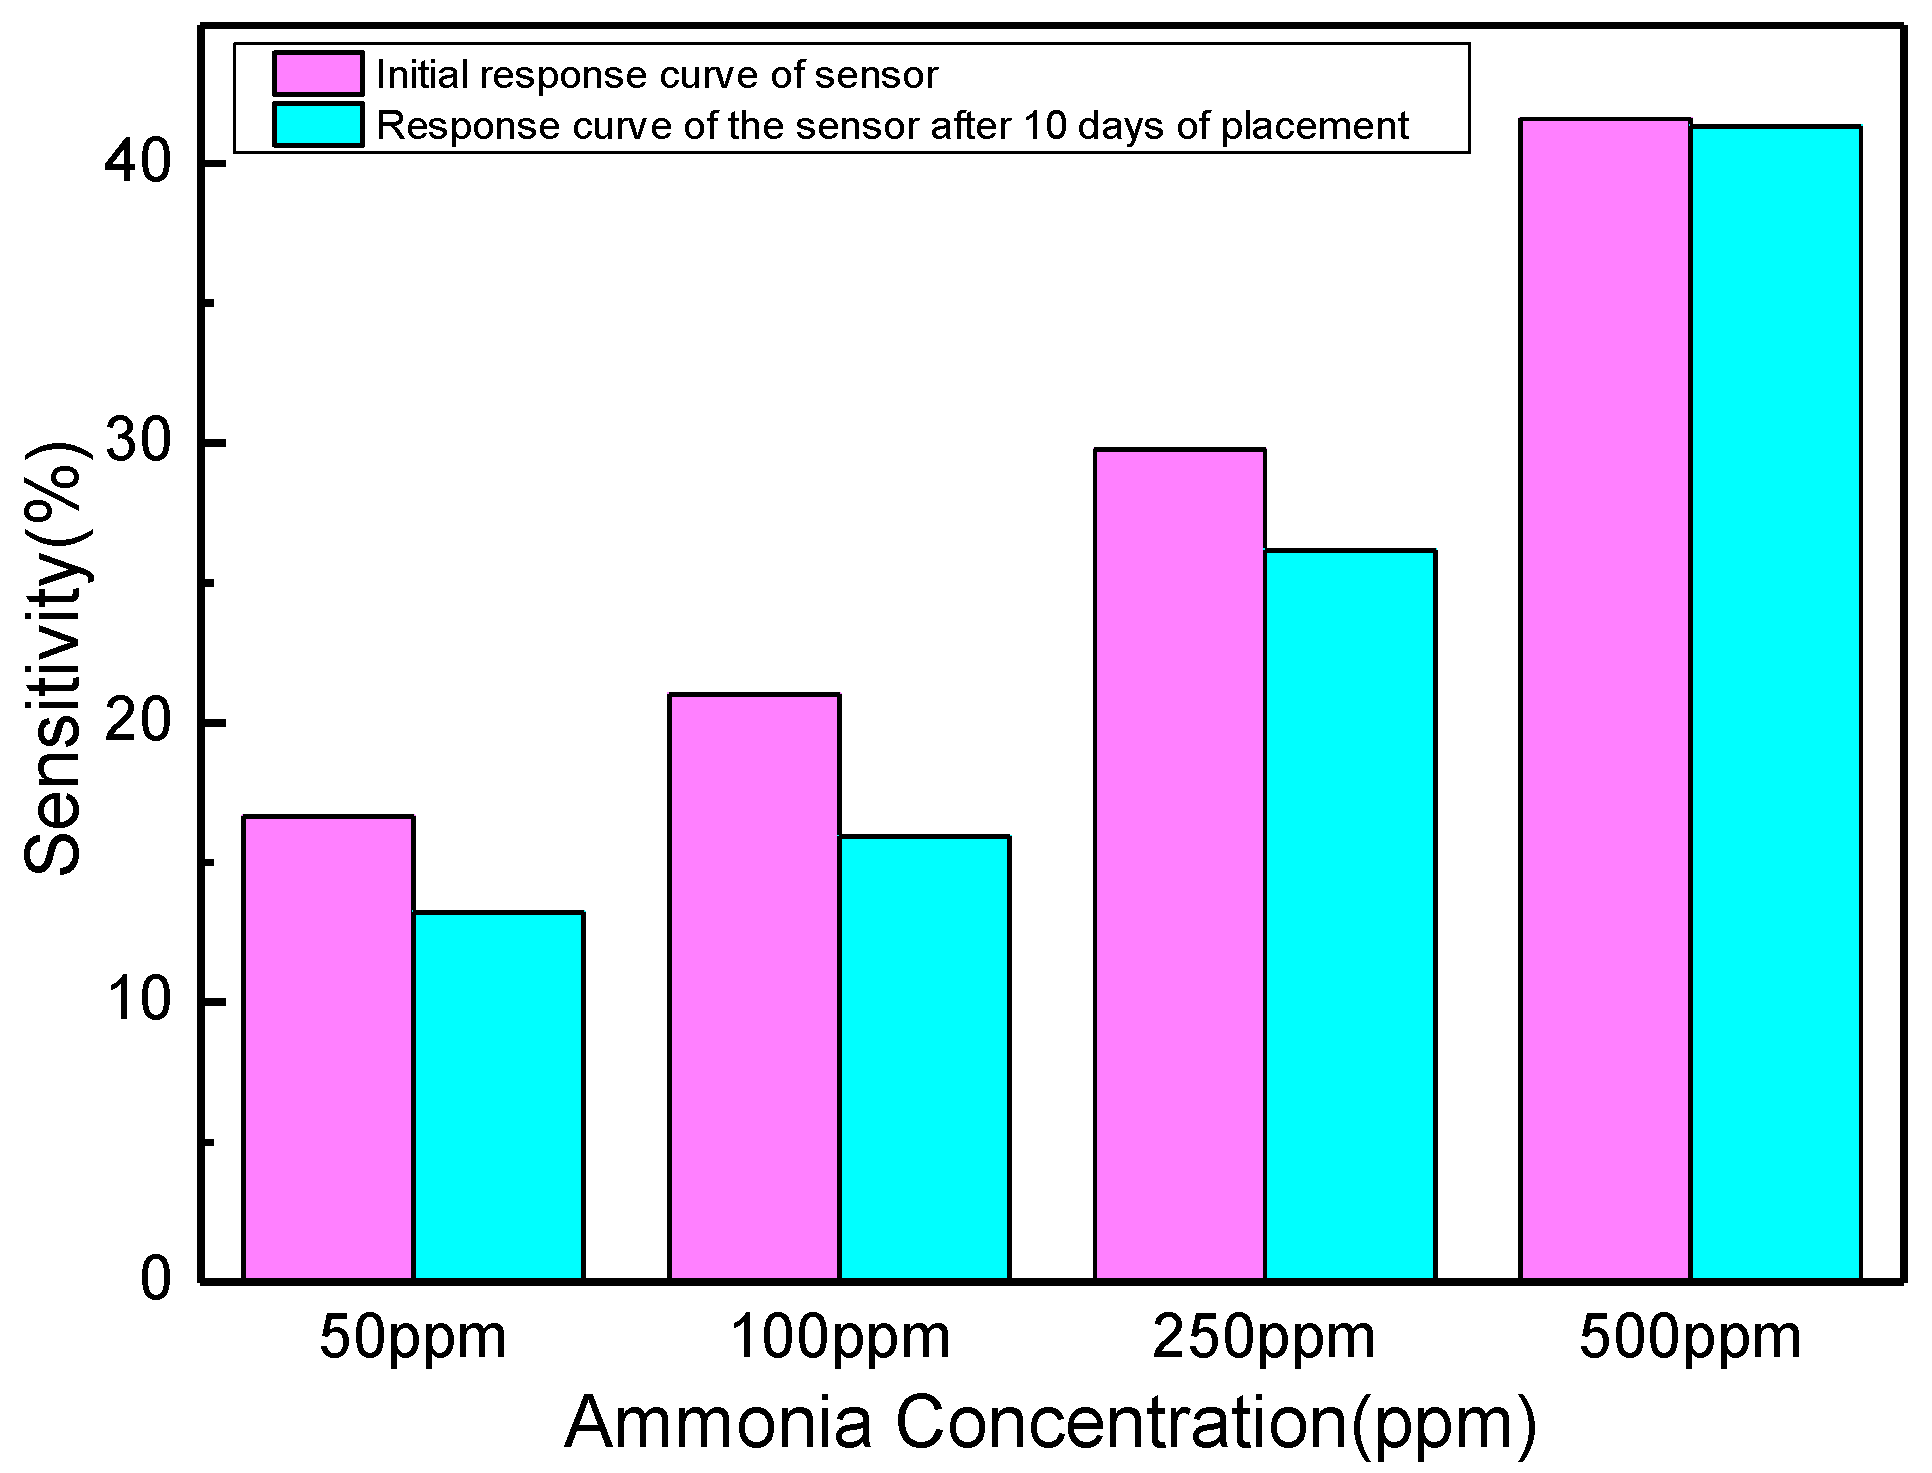
3.4. Selectivity and Stability of Ion Sensitive GO-Si Based Metal-Semiconductor Junction Resistor Gas Sensor

The selectivity and stability of UVO 1-min sample sensor were studied. Acetone and absolute ethanol were used as contrast gases. These two gases belong to the VOC gas, and the interference to ammonia gas is relatively large [30]. Therefore, they are widely used in ammonia noise gas to evaluate the selectivity of ammonia sensor. Here, we test the sensitivity to different gases by injecting different gases at once. Anhydrous ethanol and acetone are injected through a standard pipette. The sensitivity of UVO 1-min sample sensor to acetone, absolute ethanol, and ammonia is shown in Figure 10. On the one hand, the sensitivity of the sensor to ammonia is the highest, which is much larger than acetone and absolute ethanol (the maximum difference is 38%). On the other hand, the sensitivity to ammonia increases with the increase of concentration, but there is no trend for acetone and absolute ethanol.
The stability test results of UVO 1-min sample sensor are shown in Figure 10. There was no encapsulation of the sensor during the test. The sensor was tested at four different ammonia concentrations, and then the sensor was tested again after 10 days. It can be seen from Figure 11 that the sensitivity of the sensor placed for 10 days is almost unobservable compared to the fresh device. In order to accurately evaluate the aging condition of the sensor, the retention rate of Ion Sensitive GO-Si based metal-semiconductor junction resistor Gas Sensor is also estimated, as shown in Table 1.
The sensitivity of Ion Sensitive GO-Si based metal-semiconductor junction resistor Gas Sensor has low attenuation after a period of time, and its retention rate is higher than 70%. When the concentration of ammonia is higher than 250 ppm, the retention rate is higher than 85%. Since the sensor is not packaged in the process of placement, it shows that the device can resist the pollution of various particles in the air, and the retention rate is still higher than 70%. Therefore, the experimental results show that the sensor has good retention performance.
The performance of our sensor is compared with sensors that are reported by other groups. Table 2 summarizes the sensing materials, sensitivity, and response time of these studies. Although the sensitivity of the device in this paper is not significantly improved, it is able to detect a wider range of gas concentrations than the previously reported devices.

4. Conclusions

The Ion Sensitive GO-Si based metal-semiconductor junction resistor Gas Sensor based on the GO-Si sensitive film is designed and implemented. The width and length of the channel are 50 and 1000 μm, respectively. The performance of gas sensor is studied under different gate voltages, including sensitivity, time response, selectivity, and stability. The results show that the sample of UVO 1-min sample is the best of the sensors. The Ion Sensitive GO-Si based metal-semiconductor junction resistor has the best comprehensive performance when the gate voltage is −9 V. On the one hand, the minimum detection concentration of ammonia gas can reach 250 ppb, the minimum detection limit of extraction is 50 ppb, and the linearity R2 is as high as 0.987. On the other hand, when ethanol and acetone are used as contrast gases, the selectivity of the sensor to ammonia is very high, and the maximum sensitivity difference can reach 38%. The retention rate of the sensor is more than 70% after 10 days without the package, which indicates that the sensor has good stability.

Author Contributions

All authors discussed and agreed upon the idea, and made scientific contributions. Y.Z. designed the study project and experiments, collected and analyzed the data, and wrote the paper; D.Z. (Deyin Zhao), Z.M. and G.L. conducted the experiments and collected data; X.L. provided funds and guidance on research ideas, analyzed the data, and revised the paper; D.Z. (Dan Zhao) provided guidance and gave advice on the experiments. All authors have read and agreed to the published version of the manuscript.

Funding

This work was supported in part by the National Natural Science Foundation of China under grant nos. 51625504, 51707062, and 61671368, and in part by the Science and Technology Planning Project of Zhejiang Province, China under grant no. 2017C31087.

Institutional Review Board Statement

Not applicable.

Informed Consent Statement

Not applicable.

Data Availability Statement

Not applicable.

Acknowledgments

Some SEM and Raman work were done at the International Center for Dielectric Research (ICDR) and Instrumental Analysis Center, Xi’an Jiaotong University, Xi’an, China. The authors would also like to thank Dai and Yang for their help in using SEM. The data used to support the findings of this study are available from the corresponding author upon request.

Conflicts of Interest

The authors declare no conflict of interest.

References

  1. Khan, U.; Kim, T.H.; Ryu, H.; Seung, W.; Kim, S.W. Graphene tribotronics for electronic skin and touch screen applications. Adv. Mater. 2017, 19, 1603544. [Google Scholar] [CrossRef]
  2. Gunther, D.; LeBlanc, G.; Prasai, D.; Zhang, J.R.; Cliffel, D.E.; Bolotin, K.I.; Jennings, G.K. Photosystem I on graphene as a highly transparent, photoactive electrode. Langmuir 2013, 29, 4177–4180. [Google Scholar] [CrossRef]
  3. Luo, J.; Jang, H.D. Huang effect of sheet morphology on the scalability of graphene-based ultracapacitors. ACS Nano 2013, 7, 1464–1471. [Google Scholar] [CrossRef] [PubMed]
  4. Wang, C.; Kim, J.; Zhu, Y.; Yang, J.; Lee, G.H.; Lee SLiu, G.; Pei, R.; Yu, J.; Lin, Q. An aptameric graphene Nano sensor for label-free detection of small-molecule bomarkers. Biosens. Bioelectron. 2015, 71, 222–229. [Google Scholar] [CrossRef] [Green Version]
  5. Bae, S.H.; Lee, Y.; Sharma, B.K.; Lee, H.J.; Kim, J.H.; Ahn, J.H. Graphene-based transparent strain sensor. Carbon 2013, 51, 236–242. [Google Scholar] [CrossRef]
  6. Schedin, F.; Geim, A.K.; Morozov, S.V.; Hill, E.W.; Blake, P.; Katsnelson, M.I.; Novoselov, K.S. Detection of individual gas molecules adsorbed on graphene. Nat. Mater. 2007, 6, 652–655. [Google Scholar] [CrossRef]
  7. Wang, S.; Jiang, Y.; Liu, B.; Duan, Z.; Pan, H.; Yuan, Z.; Xie, J.; Wang, J.; Fang, Z.; Tai, H. Ultrathin Nb2CTx nanosheets-supported polyaniline nanocomposite: Enabling ultrasensitive NH3 detection. Sens. Actuators B Chem. 2021, 343, 130069. [Google Scholar] [CrossRef]
  8. Nagai, T.; Tamura, S.; Imanaka, N. Solid electrolyte type NH3 gas sensor applicable in a humid atmosphere. Electrochemistry 2010, 78, 126–128. [Google Scholar] [CrossRef] [Green Version]
  9. Hijazi, M.; Stambouli, V.; Rieu, M.; Tournier, G.; Pijolat, C.; Viricelle, J.-P. Sensitive and selective ammonia gas sensor based on molecularly modified SnO2. Proceedings 2017, 1, 399. [Google Scholar] [CrossRef] [Green Version]
  10. Qiu, H.F.; Zhao, D.; Teng, J.Q.; Jia, T.H.; Lei, S.C.; Wang, C.; WANG, X. A construction method and gas sensitive characteristics of graphene oxide sensors. J. Xi’an Jiaotong Univ. 2018, 52, 95–101. [Google Scholar]
  11. Yang, C.M.; Chen, T.C.; Yang, Y.C.; Hsiao, M.C.; Meyyappan, M.; Lai, C.S. Ultraviolet illumination effect on monolayer graphene-based resistive sensor for acetone detection. Vacuum 2017, 140, 89–95. [Google Scholar] [CrossRef]
  12. Sun, H.; Chen, D.; Wu, Y.; Yuan, Q.; Guo, L.; Dai, D.; Lin, C.T. High quality graphene films with a clean surface prepared by an UV/Ozone assisted transfer process. J. Mater. Chem. C 2017, 5, 1880–1884. [Google Scholar] [CrossRef]
  13. Hou, S.; Hu, Z.; Guan, F.; Li, C.; Xie, H. Effect of ozone treatment on gas-sensitity of graphene-based NO2 gas sensor. Transducer Microsyst. Technol. 2014, 33, 15–17. [Google Scholar]
  14. Bai, S.; Zhao, Y.; Sun, J.; Tian, Y.; Luo, R.; Li, D.; Chen, A. Ultrasensitive room temperature NH3 sensor based on a graphene–polyaniline hybrid loaded on pet thin film. Chem. Commun. 2015, 51, 7524–7527. [Google Scholar] [CrossRef]
  15. Mortazavi Zanjani, S.M.; Sadeghi, M.M.; Holt, M.; Chowdhury, S.F.; Tao, L.; Akinwande, D. Enhanced sensitivity of graphene ammonia gas sensors using molecular doping. Appl. Phys. Lett. 2016, 108, 666. [Google Scholar] [CrossRef]
  16. Toda, K.; Furue, R.; Hayami, S. Recent progress in application of graphene oxide for gas sensing: A review. Anal. Chim. Acta 2015, 878, 43–53. [Google Scholar] [CrossRef]
  17. Wu, J.; Tao, K.; Miao, J.; Norford, L.K. Improved selectivity and sensitivity of gas sensing using a 3D reduced graphene oxide hydrogel with an integrated microheater. ACS Appl. Mater. Interfaces 2015, 7, 27502–27510. [Google Scholar] [CrossRef]
  18. Yoo, S.; Li, X.; Wu, Y.; Liu, W.; Wang, X.; Yi, W. Ammonia gas detection by tannic acid functionalized and reduced graphene oxide at room temperature. J. Nanomater. 2014, 7, 1–6. [Google Scholar] [CrossRef] [Green Version]
  19. Li, X.; Wu, Y.; Song, H.; Yoo, S.; Liu, W.; Wang, X. Controllable decoration of CVD-grown graphene with Au NP as a promising ammonia sensing platform. J. Mater. Sci. Mater. Electron. 2014, 26, 1500–1506. [Google Scholar] [CrossRef]
  20. Wang, X.; Sun, X.; Hu, P.A.; Zhang, J.; Wang, L.; Feng, W. Colorimetric sensor based on self-assembled polydiacetylene/graphene-stacked composite film for vapor-phase volatile organic compounds. Adv. Funct. Mater. 2013, 23, 6044–6050. [Google Scholar] [CrossRef]
  21. Muñoz, R.; Gómez-Aleixandre, C. Review of CVD synthesis of graphene. Chem. Vap. Depos. 2013, 19, 297–322. [Google Scholar] [CrossRef] [Green Version]
  22. Nagelli, E.; Naik, R.; Xue, Y.; Gao, Y.; Zhang, M.; Dai, L. Sensor arrays from multicomponent micropatterned nanoparticles and graphene. Nanotechnology 2013, 24, 444010. [Google Scholar] [CrossRef] [PubMed] [Green Version]
  23. Yang, G.; Li, Y.; Rana, R.K.; Zhu, J.J. Pt-Au/nitrogen-doped graphene nanocomposites for enhanced electrochemical activities. J. Mater. Chem. A 2013, 1, 1754–1762. [Google Scholar] [CrossRef]
  24. Yu, L.; Song, H.; Tang, Y.; Zhang, L. Controllable deposition of ZnO-doped SnO2 nanowires on Au/graphene and their application in cataluminescence sensing for alcohols and ketones. Sens. Actuators B Chem. 2014, 203, 726–735. [Google Scholar] [CrossRef]
  25. Leong, W.S.; Nai, C.T.; Thong, J.T. What does annealing do to metal-graphene contacts. Nano Lett. 2014, 14, 3840–3847. [Google Scholar] [CrossRef] [PubMed]
  26. Ma, S.; Li, X.; Lee, Y.K.; Zhang, A. Direct label-free protein detection in high ionic strength solution and human plasma using dual-gate nanoribbon-based ion-sensitive field-effect transistor biosensor. Biosens. Bioelectron. 2018, 117, 276–282. [Google Scholar] [CrossRef] [PubMed]
  27. Wang, C.; Lei, S.; Li, X.; Guo, S.; Cui, P.; Wei, X.; Liu, W.; Liu, H. A Reduced GO-Graphene Hybrid Gas Sensor for Ultra-Low Concentration Ammonia Detection. Sensors 2018, 18, 3147. [Google Scholar] [CrossRef] [PubMed] [Green Version]
  28. Zhou, Y.; Jiang, Y.D.; Xie, T.; Tai, H.L.; Xie, G.Z. A novel sensing mechanism for resistive gas sensors based on layered reduced graphene oxide thin films at room temperature. Sens. Actuators B Chem. 2014, 203, 135–142. [Google Scholar] [CrossRef]
  29. Srivastava, S.; Jain, K.; Singh, V.N.; Singh, S.; Vijayan, N.; Dilawar, N.; Gupta, G.; Senguttuvan, T.D. Faster response of NO2 sensing in graphene-WO3 nanocomposites. Nanotechnology 2012, 23, 205501. [Google Scholar] [CrossRef] [PubMed]
  30. Zhao, Z.; Yang, H.; Wei, Z.; Xue, Y.; Sun, Y.; Zhang, W.; Li, P.; Gong, W.; Zhuiykov, S.; Hu, J. NH3 sensor based on 3D hierarchical flower-shaped n-ZnO/p-NiO heterostructures yields outstanding sensing capabilities at ppb level. Sensors 2020, 20, 4754. [Google Scholar] [CrossRef]
  31. Fan, X.; Deng, S.; Wei, Z.; Wang, F.; Tan, C.; Meng, H. Ammonia gas sensor based on graphene oxide-coated mach-zehnder interferometer with hybrid fiber structure. Sensors 2021, 21, 3886. [Google Scholar] [CrossRef] [PubMed]
  32. Wang, J.; Singh, B.; Park, J.-H.; Rathi, S.; Lee, I.; Maeng, S.; Joh, H.-I.; Lee, C.-H.; Kim, G.-H. Die-lectrophoresis of graphene oxide nanostructures for hydrogen gas sensor at room temperature. Sens. Actuators B Chem. 2014, 194, 296–302. [Google Scholar] [CrossRef]
Figure 1. Structure diagram of GO-Si based metal-semiconductor junction resistor CVD-GO gas sensor.
Coatings 11 01310 g001
Figure 2. The SEM images.
Coatings 11 01310 g002
Figure 3. Process flow chart diagram of ion sensitive GO-Si based metal-semiconductor junction resistor gas sensor.
Coatings 11 01310 g003
Figure 4. (a) Ids-Vds and (b) Ids-Vgs curves of ion sensitive GO-Si based metal-semiconductor junction resistor gas sensor. (c) Transconductance of back-gate (gm) of different Vds.
Coatings 11 01310 g004
Figure 5. Structure diagram of the gas test system setup.
Coatings 11 01310 g005
Figure 6. Sensitivity (a) and Raman spectrum (b) of ion sensitive GO-Si based metal-semiconductor junction resistor gas sensor with different time lengths of UVO processing.
Coatings 11 01310 g006
Figure 7. Linearity fitting curves of 1- and 9-min samples.
Coatings 11 01310 g007
Figure 8. Sensitivity (a) and time response (b) curve of UVO 1-min sample with the concentration of 50 ppm ammonia at different gate pressures.
Coatings 11 01310 g008
Figure 9. Response curve of the UVO 1-min sample sensor under a low concentration of ammonia.
Coatings 11 01310 g009
Figure 10. Bar chart of selectivity test for the UVO 1-min sample sensor.
Coatings 11 01310 g010
Figure 11. Retention characteristics of UVO 1-min sample sensor under different ammonia concentrations.
Coatings 11 01310 g011
Table 1. Retention and stability of ion sensitive GO-Si based metal-semiconductor junction resistor gas sensor.
NH3 ConcentrationInitial Value of S/%S after 10 days/%Retention Rate/%
50 ppm16.64913.21279.36
100 ppm21.00815.91675.76
250 ppm29.77726.17687.91
500 ppm41.60341.33099.34
Table 2. Comparison of various indicators between different sensors based on GO.
Sensing MaterialsGas ConcentrationSensitivityResponse TimeReference
GO
GO
150 ppm
100 ppm
4.97%
5%
5 min
<90 s
[31]
[32]
GO-Si250 ppb4%9.8 minThis Work
Publisher’s Note: MDPI stays neutral with regard to jurisdictional claims in published maps and institutional affiliations.

