Article

Mathematical Modeling of Carbon Flux Parameters for Low-Pressure Vacuum Carburizing with Medium-High Alloy Steel

1
School of Mechanical Engineering, Shenyang University of Technology, Shenyang 110870, China
2
State Key Laboratory of Rolling and Automation, Northeastern University, Shenyang 110819, China
*
Authors to whom correspondence should be addressed.
Coatings 2020, 10(11), 1075; https://doi.org/10.3390/coatings10111075
Submission received: 9 October 2020 / Revised: 3 November 2020 / Accepted: 5 November 2020 / Published: 9 November 2020
(This article belongs to the Special Issue Technologies of Coatings and Surface Hardening for Tool Industry)

Abstract

:
Low-pressure vacuum carburizing adopts a pulse process mode to improve the carburizing efficiency and reduces gas and energy consumption. Carbon flux is the key to accurately control the time of strong infiltration and diffusion in each pulse. In order to obtain the carbon fluxes with various materials under diffident carburizing process conditions, an evenly segmented carbon flux method is proposed. A systematic study with each model using different materials (12Cr2Ni4A, 16Cr3NiWMoVNbE, and 18Cr2Ni4WA represent different initial carbon concentrations and different alloy compositions), carburizing temperatures, and carburizing pressures to determine the effect of these conditions on carbon flux is conducted. Compared with traditional segmented carbon flux method, an evenly segmented carbon flux method can predict the actual carbon flux more precisely and effectively in order to finely control the pulse carburization process. The paper also indicates that carbon fluxes increase with the increase of pressure. The optimal carburization pressure for low-pressure vacuum carburization is 300 Pa. Raising the carburization temperature to 980 °C instead of 920 °C can increase effective carbon flux by more than 30%. Among the material compositions, alloy content has the biggest impact over the carbon, initial carbon concentration the second, and saturated carbon concentration the third biggest impact.

1. Introduction

Low-pressure carburization especially combined with high-pressure gas quenching is a new technology that allows accurate control over the carbide morphology, size, distribution, surface carbon content, and layer depth [1,2,3]. It also offers energy savings and environmental protection and is being applied to various gear steels. However, for high alloy steel, it is easy to exceed the standard of carburized layer carbide after carburizing. The main reason is the accuracy of carbon flux in the process of formulation. Carbon flux represents the mass of material passing through a unit area perpendicular to diffusion direction per unit time. The value of carbon flux is related to factors such as the material composition, temperature, carburizing pressure, and catalyst [4,5]. During carburization, the gas contacting the steel surface undergoes a chemical reaction, but the growth in mass cannot be measured in real time, rendering it difficult to measure the carbon flux. Hwang et al. [6,7] studied the effect of material composition and surface oxidation on carbon flux, and Kula et al. [8] studied the effect of carbides on carbon flux at the surface. Furthermore, Karabelchtchikova and Sisson [9] proposed an improved integration method to determine the carbon flux in the gas boundary layer in austenite, stating that the carbon flux changes with both time and carbon concentration on the workpiece surface. Zajusz et al. [10] optimized the carbon transfer coefficient in their research. They analyzed the effects of pressure, reaction rate, and alloy elements through extensive experiments, thereby obtaining the effect of process conditions on carbon flux, which achieved good results when applied to the model of carburizing. Lowell [11] studied the effect of workpiece surface roughness and the type of contaminant on the carbon flux of low-pressure vacuum carburizing surface. Gorockiewicz et al. [12,13] found that in the boost stage of carburization, carbon atoms are first adsorbed by the workpiece surface to form crystals, and then diffused as a carbon source. Su [14] proposed a saturated carburizing model for carbide migration and calculated the variation of average carbon flux with carburizing time. However, these studies mainly focus on low carbon steel and low alloy steel. For high alloy steel, it is difficult to control the surface carbides. The carbon flux is affected by many factors, so it is hard to determine the carbon flux accurately [15,16].
For low-pressure vacuum carburizing, the carbon potential of the atmosphere cannot be measured or controlled. The measurement of carbon flux is also difficult and there is no suitable method for on-line continuous testing. Philippe et al. [17] experimentally measured the change in carbon flux using a thin saturated carburizing iron foil with a carburizing atmosphere on one side and a decarburizing atmosphere on the other side. Therein, the carbon flux was determined by measuring the carbon flow rate in a decarburizing atmosphere. Owing to the short duration of the boost stage, the actual measurement precision and response time were difficult to control. Therefore, the application of this method to low-pressure vacuum carburization in real-world applications requires further research.
Oriental Furnace (Japan) and Dowa Holdings proposed a method to determine the carbon concentration using a high-temperature hydrogen probe [18] to analyze the hydrogen content in a gas mixture. Khan et al. [19] studied the cracking of propane during low-pressure vacuum carburization for carburization control. Furthermore, Yada et al. [20] and Makino et al. [21] numerically simulated and tested the carburization process and detected the decomposition of acetylene using the volume fraction of hydrogen in the gas mixture to calculate the carbon potential in the furnace. Thus far, this technique has not been successfully applied in industrial applications, and the values of relevant parameters remain confidential.
Currently, majority carbon flux determination methods utilize an experimentally obtained average value, without adequately considering the effects of process parameters such as carburizing temperature and pressure and material composition; this results in a relatively large experimental error. In practice, carbon flux continuously changes in the carburizing process; hence, most carbon flux values exhibit large deviation in real-life applications, particularly for high alloy materials. To the best of our knowledge, there has been no report on mathematical modeling related to this issue.
In the present study, a comparison of the carburized layer organizations obtained by the average and segmented average carbon flux models has been given. It is found that carbide network is more easily to form on the surface-carburized layer with an average carbon flux model. To accurately control the carburizing process, a systematic study with each model using different materials (12Cr2Ni4A, 16Cr3NiWMoVNbE, and 18Cr2Ni4WA represent different initial carbon concentrations and different alloy compositions), carburizing temperatures, and carburizing pressures is conducted to determine the effect of these conditions on carbon flux.
Nomenclature
Javerage carbon flux, g/(mm2∙s)ppressure of the carburized gas, Pa
Jesegmented average carbon flux, g/(mm2∙s)Tcarburizing temperature, °C
Δmmass difference, mgRgas constant, J/(mol∙K)
Ssurface area, mm2kPressure and tem/perature dependent constant
ttime, sAPressure and temperature dependent constant
Δtsegmented carburizing time, s

2. Mathematical Modeling of Carbon Flux

Carbon flux is the main parameter that influences model calculations and determines the control precision of the carburizing process. The transfer process of carbon atoms from the atmosphere to the workpiece surface can be defined by three types of boundary conditions. In typical atmospheric carburizing, the carbon potential control method is used, i.e., the third type of boundary condition. The difference between the carbon concentration of the atmosphere and the carbon concentration of the metal surface acts as the driving force for carbon to enter into the steel from the gas phase. During carburization, an oxygen probe is used to measure the carbon concentration in the atmosphere, and the steel foil method is applied to reverse calculate the transfer coefficient, thus achieving the detection and control of the carburization process [8].
Owing to the vacuum environment of low-pressure vacuum carburizing, the carburizing gas concentration is low, and the carbon concentration in the atmosphere cannot be measured using an oxygen probe. In this scenario, the second type of boundary condition is used, i.e., the carbon flux. Different from atmospheric carburizing, low-pressure vacuum carburizing has a low carburizing pressure. The number of carburizing gas molecules is extremely small and the molecules can be quickly decomposed and absorbed onto the steel surface, instantly boosting the surface carbon flux to the maximum. Therefore, the surface carbon flux model normally used for atmospheric carburizing is no longer applicable [22]. The value of carbon flux is related to the carburizing gas type, pressure, temperature, alloy type, and surface state. To study low-pressure vacuum carburizing, the overall average carbon flux method is generally used [23], as shown in Equation (1). This method obtains the carbon flux by experimentally measuring the mass increment before and after a certain period of carburization.
J = Δ m S t .

Average Carbon Flux vs. Segmented Average Carbon Flux

The value of carbon flux is directly related to carburizing pressure, carburizing temperature, and material properties [24]. In process design, the average carbon flux (mass increment detection after carburizing for 120 s or longer) is measured. Herein, the cylindrical samples are carburized for 30, 60, 90, and 120 s, and are subsequently weighed. Different from typical carbon flux measurement, the carbon flux of the samples at different times of carburization is calculated separately and defined as the segmented average carbon flux (Je), as shown in Equation (2).
J e = Δ m S Δ t .
High alloy materials are more likely to absorb carbon atoms. To better determine the accuracy of the original carbon flux model, a carburizing experiment was performed on 16Cr3NiWMoVNbE steel at a carburizing temperature of 920 °C and carburizing pressure of 300 Pa. The average carbon flux over 120 s and the segmented average carbon flux were measured. The obtained carbon flux over carburizing time is shown in Figure 1.
Figure 1 shows that the average carbon flux and segmented average carbon flux both decrease as carburizing time increases. During carburization, the carbon concentration gradient at the carburized layer gradually decreases; hence, the number of carbon atoms entering the sample surface per unit time decreases. In the initial stage of carburization from 0 to 60 s, the carbon concentration gradient at the gas–solid interface is relatively large. After 30 s, the carbon flux obtained using the segmented average method is 2.5 times that of the carbon flux obtained by the overall average method, which result in the obtained value exceeding the carbide standard in the carburized layer.
Herein, two carbon flux models using the average carbon flux and segmented average carbon flux are used to calculate the carburizing process; the corresponding results are shown in Figure 2. The number of carburizing pulses is 19 according to both models. As carburizing proceeds, the carburizing time gradually decreases, and the diffusion time gradually increases. Carburizing stops once the surface carbon concentration reaches 1.3%, and then restarts once the concentration reaches 1.1% through diffusion. For the last pulse, the surface carbon concentration decreases to 0.9%, and the carbon concentration at 1.1 mm of the carburized layer increases to 0.42%. The carburizing process is then completed. The total carburizing time is 18,500 s.
The changes in surface carbon concentration over carburizing time and boost time along with the number of pulses obtained from the simulations using average carbon flux and segmented average carbon flux are shown in Figure 3 and Figure 4, respectively.
Using the average carbon flux model, the pulse time of the first boost stage is 80 s, and the pulse time of boost stages thereafter (2nd–19th) is 14 s. However, the data obtained using the segmented average carbon flux method shows that the first boost had a pulse time of 37 s, and the boost stages thereafter (2nd–19th) had a pulse time of 11 s. The carburizing time of the first boost pulse obtained using the average carbon flux method is 2.2 times longer than the segmented average carbon method. For subsequent pulse times, the first boost pulse obtained using the average carbon flux method is 1.3 times longer than the segmented average carbon method.
The variation in the different boost times will cause differences in the carbide morphology of the carburized layer. The results of carburized layer organization after the different carburizing processes (carburizing and quenching) are shown in Figure 5. For the same diffusion time, the surface organization of the carburized layer obtained using the average carbon flux model appears to have a discontinuous carbide network and some continuous carbide network, whereas the surface organization obtained using the segmented carbon flux model has more diffused carbides, which verifies the efficiency of the proposed model and enables a more accurate and efficient characterization of the actual carbon flux value, effectively avoiding the effects of the first pulse and achieving more precise control over the time of subsequent pulses.
Based on this influencing factor, a systematic study on the carbon flux model with different materials, carburizing temperature, and carburizing pressure conditions was conducted to determine the effect of the different process conditions on carbon flux and to build a mathematical model for carbon flux.

3. Materials and Methods

3.1. Experimental Materials

To study the overall pattern of carbon flux and consider the contingency of the experiment, three alloy steel materials were selected for carburization: 12Cr2Ni4A, 16Cr3NiWMoVNbE, and 18Cr2Ni4WA. Table 1 shows the chemical composition of the studied alloy steels. These materials enable the study of carbon flux values with different initial carbon contents and different alloying elements under different carburizing conditions. For this experiment, the samples were processed to have an outer diameter of 24 mm, a small hole with a diameter of 3 mm, and a thickness of 3 mm. As the mass increment is calculated in milligrams, the samples were specially cleaned to maintain the validity of the experiment. The vacuum furnace had a degreasing effect. The samples were first cleaned with alcohol and then dried, followed by heating in a vacuum furnace to 920 °C. They were kept warm for 30 min and then left to cool in the vacuum cooling chamber. The samples were weighed before and after carburization using a LE204E 1/10000 scale (Dongbo Thermal Technology Co., Ltd., Shenyang, China), and the average of the three experiments was considered the measurement value. The experiments were carried out in a dual-chamber vacuum carburizing furnace.

3.2. Experimental Procedures of Carbon Flux Measurement

The low-pressure vacuum carburizing furnaces were heated to 920 °C, 950 °C, and 980 °C. The pretreated samples were transferred into a hot chamber from a cold chamber and kept warm for 20 min to ensure they were fully heated. Then, the carburizing process was performed. The pressure in the carburizing furnaces was rapidly increased to 100, 200, and 300 Pa with a large flow setting. The closed-loop control of the carburizing pressure was realized by controlling the pumping speed and air intake volume of the root pump to maintain the pressure within the range of ±10 Pa. After stabilizing the pressure for 30, 60, 90, 120, and 150 s, the carburizing gas was quickly extracted, the samples were taken out of the furnaces, and then immediately quenched and weighed after cleaning. The schematic of the pressure maintaining process in the boost stage is shown in Figure 6.

4. Results and Discussion

4.1. Carbon Flux Measurement

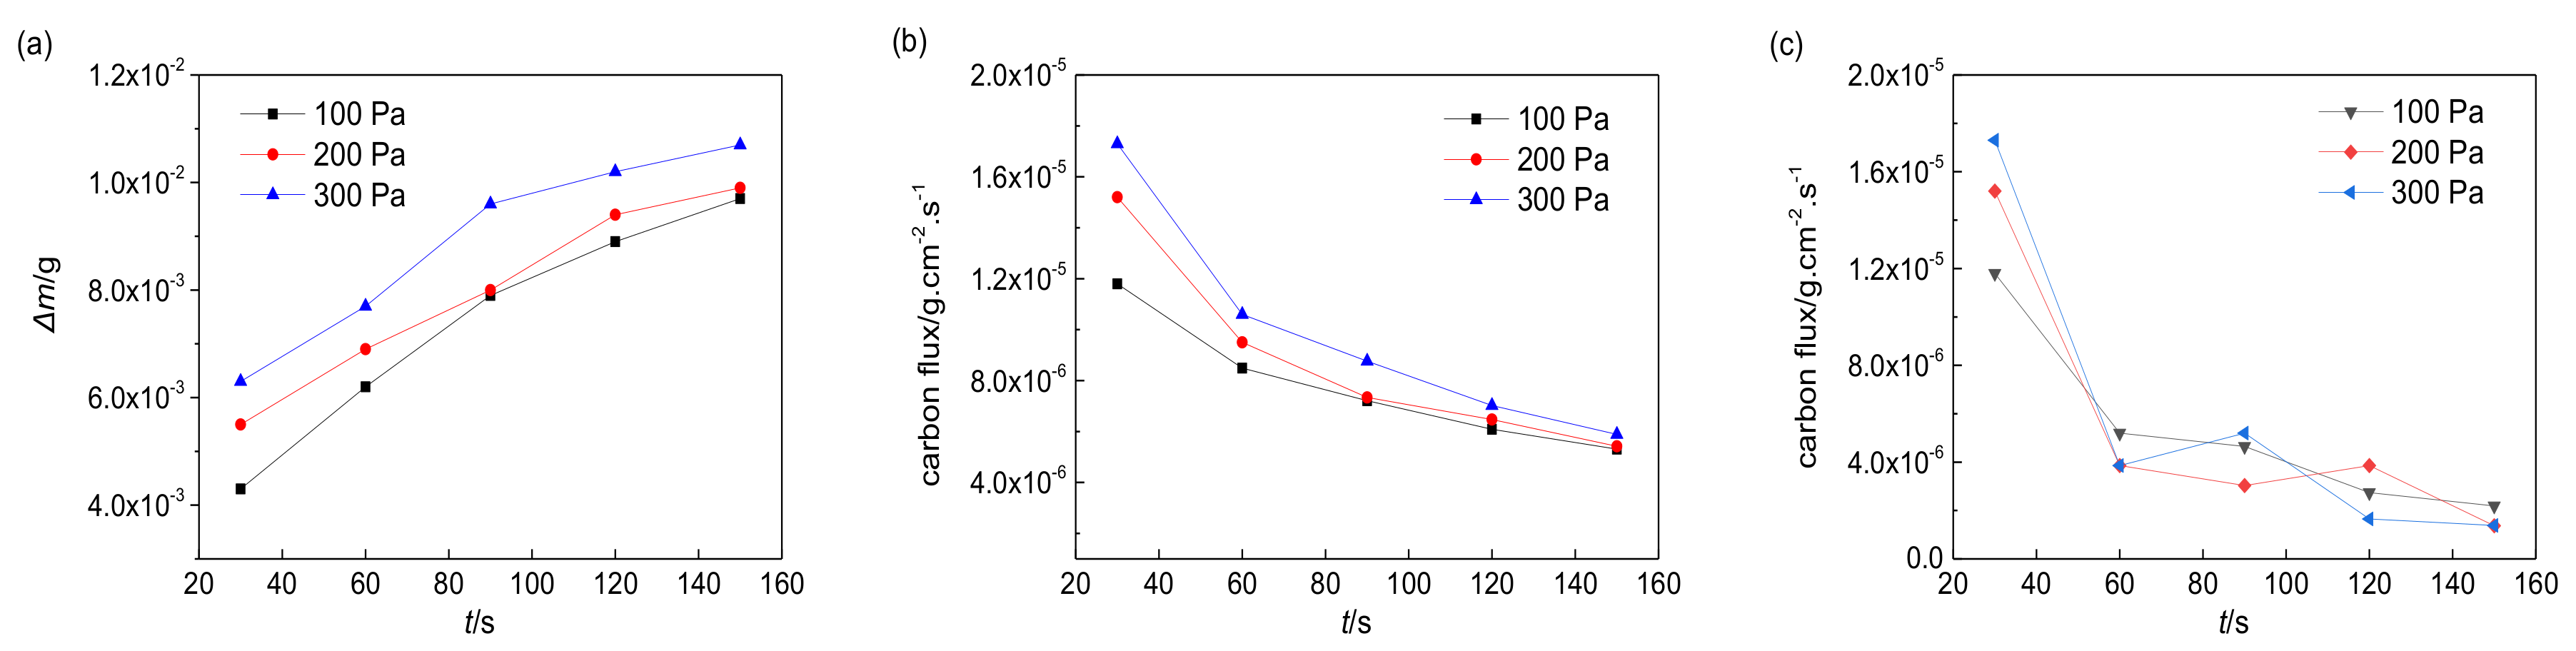
4.1.1. Effect of Carburizing Pressure on Surface Carbon Flux

The surface mass increment, average carbon flux changes, and segmented average carbon flux changes were investigated at a carburizing temperature of 950 °C, and carburizing pressures of 100, 200, and 300 Pa to determine the effect of carburizing pressure on the surface carbon flux. Figure 7 shows the surface mass increment, average carbon flux, and segmented average carbon flux of 12Cr2Ni4A steel over time.
During the boost stage of 12Cr2Ni4A steel, the mass linearly increased quickly from 0 to 60 s. From 60 to 120 s, the mass gradually decreased, and approached zero after 120 s. The segmented average carbon flux value increased from 1.04 × 10⁻⁵ to 1.36 × 10⁻⁵ at 30 s, and from 8.11 × 10⁻⁶ to 9.58 × 10⁻⁶ at 60 s. The segmented average carbon flux values are 5.98 × 10⁻⁶ and 7.7 × 10⁻⁶ at 90 s, respectively. From 120 to 150 s, the segmented average carbon flux remained nearly identical at the three pressures mentioned above, exhibiting relatively small flux values.
Figure 8 shows the surface mass increment, average carbon flux, and segmented average carbon flux for 16Cr3NiWMoVNbE steel over time.
During the boost stage for 16Cr3NiWMoVNbE steel, the mass linearly increased relatively quickly with increasing pressure. After 90 s, the mass increment gradually decreased and approached zero after 120 s. The surface carbon flux value increased from 1.17 × 10⁻⁵ to 1.72 × 10⁻⁵ at 30 s and from 5.2 × 10⁻⁶ to 3.8 × 10⁻⁶ at 60 s. The effect of pressure on the carbon flux was small after 90 s.
Figure 9 shows the surface mass increment, average carbon flux, and segmented average carbon flux of 12Cr2Ni4A steel over carburizing time. During the boost stage, the mass linearly increased relatively quickly from 0 to 90 s. After 90 s, the mass increment gradually decreased and approached zero after 120 s. The surface carbon flux value increased from 6.5 × 10⁻⁶ to 1.3 × 10⁻⁵ at 30 s and from 5.7 × 10⁻⁶ to 4.5 × 10⁻⁶ at 60 s. After 90 s, the effect of pressure on the carbon flux was small, and the values of the flux were small.
The relationship between carburizing pressure and carbon flux of the above three materials shows that under the same carburizing temperature of 950 °C and carburizing pressures of 100, 200, and 300 Pa, the mass increment, average carbon flux, and segmented carbon flux of the materials exhibit the same trend. The mass of the samples increased between 30 and 90 s. From 90 to 150 s, the rate of mass increase gradually reduced, the average carbon flux tended to stabilize, and the segmented average carbon flux approached zero. With increasing pressure, the overall carbon flux tended to increase. Under the carburizing pressures of 200 and 300 Pa, the carbon flux values exhibited small differences. As the pressure increased, the time required to saturate the carbon concentration on the sample surface decreased.
The carbon flux value was microscopically characterized as the flow rate of acetylene in contact with the workpiece surface, which is microscopically reflected as the number of activated carbon atoms and the time of contact between the activated carbon atoms and the workpiece. During the boost stage of carburization, the acetylene reaction produced hydrogen gas. As carburization proceeded, the gas in the furnace gradually transformed from acetylene to a mixture of acetylene and hydrogen. The flow rate of the acetylene on the sample surface was influenced by the speed of the acetylene on the workpiece surface and the relative effective density (density of acetylene in the gas mixture in the furnace), both of which are pressure dependent.
The process of low-pressure vacuum carburizing requires stable carburizing pressure and carburizing temperature. When the carburizing temperature, acetylene inlet gas flow, and furnace volume were fixed to maintain the dynamic balance of gas pressure in the furnace, adjusting the outlet pumping speed of the furnace was necessary. At a lower carburizing pressure, the outlet speed was at its highest, the gas exchange efficiency in the furnace was high, the relative effective density of acetylene increased, and the probability of active gas flowing through the surface of the workpiece increased; however, the effective density of active gas in the furnace was low. Considering the two factors, if the outlet pumping speed is too large, the contact time between the effective carbon atoms and the workpiece will be shortened, causing the decomposed active carbon atoms to be pumped out of the furnace without contact with the workpiece. This would further decrease the flow rate of acetylene on the surface of the sample, resulting in a decrease in the carbon flux. With the increase in carburizing pressure in the furnace, the outlet pumping speed gradually decreased, and the density of the carburizing atmosphere in the furnace increased. The number of active carbon atoms increased, and the carbon flux gradually increased. When the carburizing pressure reached a certain value, the gas flow in the furnace decreased, and although the density of the workpiece surface increased, the hydrogen content gradually increased per unit time, and the density of the effective active gas gradually decreased, additionally decreasing the value of carbon flux.
For the three representative materials discussed herein, at a carburizing temperature of 950 °C, the value of carbon flux was the smallest at a carburizing pressure of 100 Pa. When the pressure was low and the gas exchange rate was high, part of the decomposed active carbon atoms may have been pumped out before contacting the surface. When the carburizing pressure increased to 200 Pa, the relative density plays a dominant role in effective carbon flux, the pressure increased, the pumping rate decreased, the impact of the flow rate was small, and the effect of the gas exchange rate was small. The time for which acetylene molecules remained on the surface of the workpiece and the relative density increased. When the pressure increased to 300 Pa, the value of carbon flux was close to that under 200 Pa, indicating that the flow rate and the relative effective density attained equilibrium. Therefore, in actual carburization, a pressure of 300 Pa will have relatively little effect on the process.

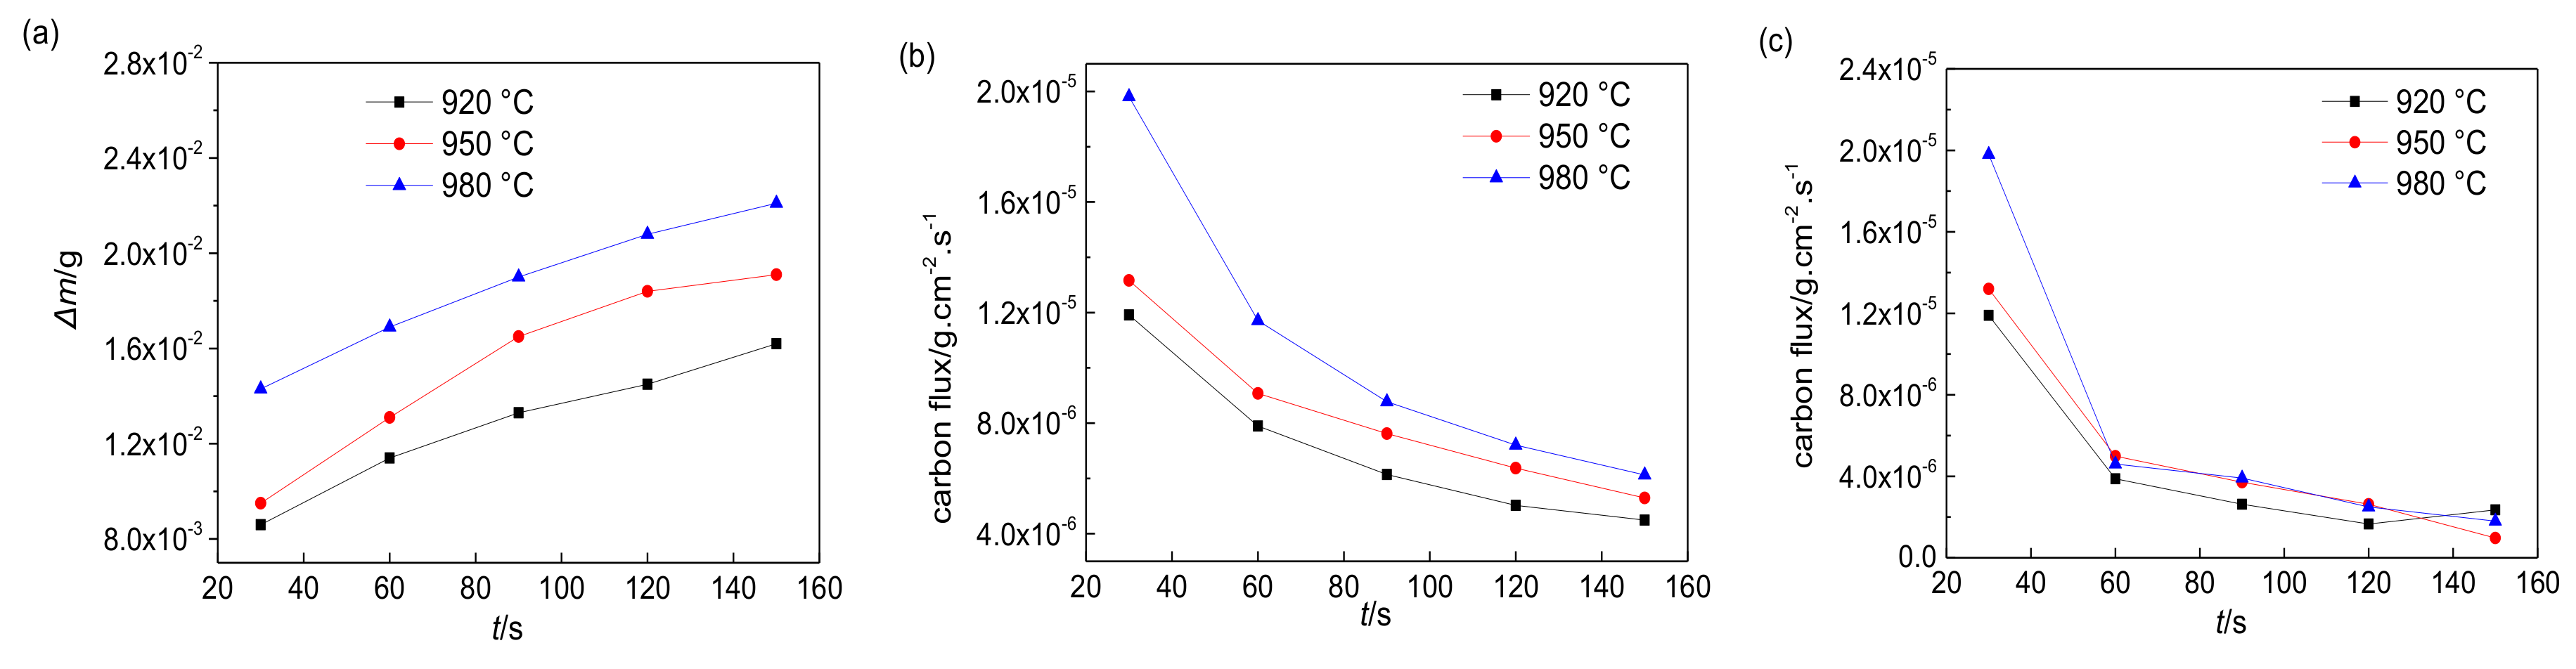
4.1.2. Effect of Carburizing Temperature on Surface Carbon Flux

Based on the effect of carburizing pressure in the previous section, the mass increment, average carbon flux, and segmented average carbon flux variations at different carburizing temperatures were investigated.
Figure 10 shows the surface mass increment, average carbon flux, and segmented average carbon flux with carburizing time for 12Cr2Ni4A steel under a carburizing pressure of 300 Pa at carburizing temperatures of 920, 950, and 980 °C.
During the boost stage for all carburizing temperatures, the mass linearly increased relatively quickly for 12Cr2Ni4A steel from 0 to 60 s. From 60 to 120 s, the mass increment gradually decreased and approached zero after 120 s. The average carbon flux value decreased by 50%–60%, and the segmented average carbon flux value decreased by ~80%. On increasing the carburizing temperature from 920 °C to 980 °C, the segmented average carbon flux value of the surface also increased from 1.18 × 10⁻⁵ to 1.72 × 10⁻⁵ at 30 s and from 3.38 × 10⁻⁶ to 7.48 × 10⁻⁶ at 60 s. At 90 s, the segmented average carbon flux values at 920 and 950 °C were 2.53 × 10⁻⁶ and 2.48 × 10⁻⁶, respectively. The carbon flux corresponding to 980 °C was 3.94 × 10⁻⁶. From 120 to 150 s, the segmented average carbon flux remained nearly identical at all three pressures, exhibiting relatively small flux values.
Figure 11 shows the surface mass increment, average carbon flux, and segmented average carbon flux with carburizing time for 16Cr3NiWMoVNbE steel under a carburizing pressure of 300 Pa at the carburizing temperatures of 920, 950, and 980 °C.
The mass linearly increased relatively quickly for 16Cr3NiWMoVNbE steel from 0 to 30 s. From 60 to 90 s, the mass increment gradually decreased and approached zero after 90 s. On increasing the carburizing temperature from 920 to 980 °C, the segmented average carbon flux value of the surface also increased from 1.49 × 10⁻⁵ to 2.26 × 10⁻⁵ at 30 s and from 3.86 × 10⁻⁶ to 5.78 × 10⁻⁶ at 60 s, respectively. At 90 s, the segmented average carbon flux values at 920 and 950 °C were 1.6 × 10⁻⁶ and 1.8 × 10⁻⁶, respectively, i.e., they were practically identical. The carbon flux at 980 °C had a minimum of 1.38 × 10⁻⁶. From 120 to 150 s, the segmented average carbon flux exhibited relatively small flux values under all temperatures.
Figure 12 shows the surface mass increment, average carbon flux, and segmented average carbon flux with carburizing time for 18Cr2Ni4WA steel under a carburizing pressure of 300 Pa at different carburizing temperatures. For 16Cr3NiWMoVNbE steel, the mass linearly increased relatively quickly from 0 to 60 s. From 60 to 150 s, the mass increment gradually decreased and approached zero after 150 s. On increasing the carburizing temperature from 920 to 980 °C, the segmented average carbon flux value of the surface also increased: from 1.19 × 10⁻⁵ to 1.98 × 10⁻⁵ at 30 s, and from 3.88 × 10⁻⁶ to 4.6 × 10⁻⁶ at 60 s. From 90 to 120 s, the segmented average carbon flux value at all three temperatures was relatively small and consistent.
As can be observed in Figure 10, Figure 11 and Figure 12, the average carbon flux and segmented carbon flux show the same trend for all three materials at the same holding temperature. Under the same holding pressure, with an increase of carburization temperature, the average carbon flux, and the segmented average carbon flux both gradually increased.
As carburizing proceeded, carbon atoms gradually accumulated on the steel surface until saturation was attained, and the mass growth became gradually slower until equilibrium was reached. The main driving force for carburizing is the carbon concentration gradient at the gas–solid interface, where the carbon concentration in the atmosphere is in a state of supersaturation. During carburization, the carbon concentration on the steel surface gradually increased, causing the concentration gradient to decrease slowly, thereby reducing the driving force as well as the effective carbon flux value.
As the carburizing temperature increased, the maximum solid solubility of carbon in austenite gradually increased, along with the carbon concentration gradient on the surface of the carburized layer. The steel surface needed more carbon atoms to reach saturation, and thus the carburizing time required increased. In addition, the diffusion coefficient of carbon in steel became larger, resulting in the number of surface carbon atoms entering inside increasing. Under the joint effect of these two factors, both the overall average carbon flux and segmented average carbon flux values of steel samples increased with carburizing temperature. The effective carbon flux increased by more than 30% on increasing the temperature from 920 to 980 °C. Furthermore, the time required for the carbon concentration on the sample surface to reach saturation also increased with the carburization temperature, which is consistent with the results of this experiment.

4.1.3. Effect of Material on Surface Carbon Flux

The mass increment, average carbon flux, and segmented average carbon flux changes of three different materials were studied at the carburizing temperatures of 920, 950, and 980 °C and carburizing pressures of 100, 200, and 300 Pa to determine the effect of the three carburizing materials on surface carbon flux. Figure 13 and Figure 14 show the effect of carburizing pressure and carburizing temperature on the average carbon flux within 30 s for the three steel materials. 12Cr2Ni4A is indexed as steel #1, 16Cr3NiWMoVNbE as steel #2, and 18Cr2Ni4WA as steel #3.
From the experimental data at the same carburization temperature and pressure, the order of the carbon flux values at 30 s was 12Cr2Ni4A, 18Cr2Ni4WA, and then 16Cr3NiWMoVNbE (without considering diffusion). The average carbon flux is affected by three factors: original carbon content, saturated carbon concentration, and alloy content. The carbon content of 12Cr2Ni4A, 16Cr3NiWMoVNbE, and 18Cr2Ni4WA was 0.12%, 0.16%, and 0.18%, respectively. In terms of alloy elements, 18Cr2Ni4WA has 1% more W than 12Cr2Ni4A, and 16Cr3NiWMoVNbE steel has a more complex alloy system, which contains a large amount of W, Mo, V, and Nb. In the alloy composition of the three materials, Cr, W, Mo, V, and Nb are strong carbide forming elements, whereas Si and Ni are non-carbide forming elements. The alloy content had the greatest effect on carbon flux, followed by the initial carbon concentration, and then saturated carbon concentration. Therefore, 16Cr3NiWMoVNbE steel is more receptive to active carbon atoms.

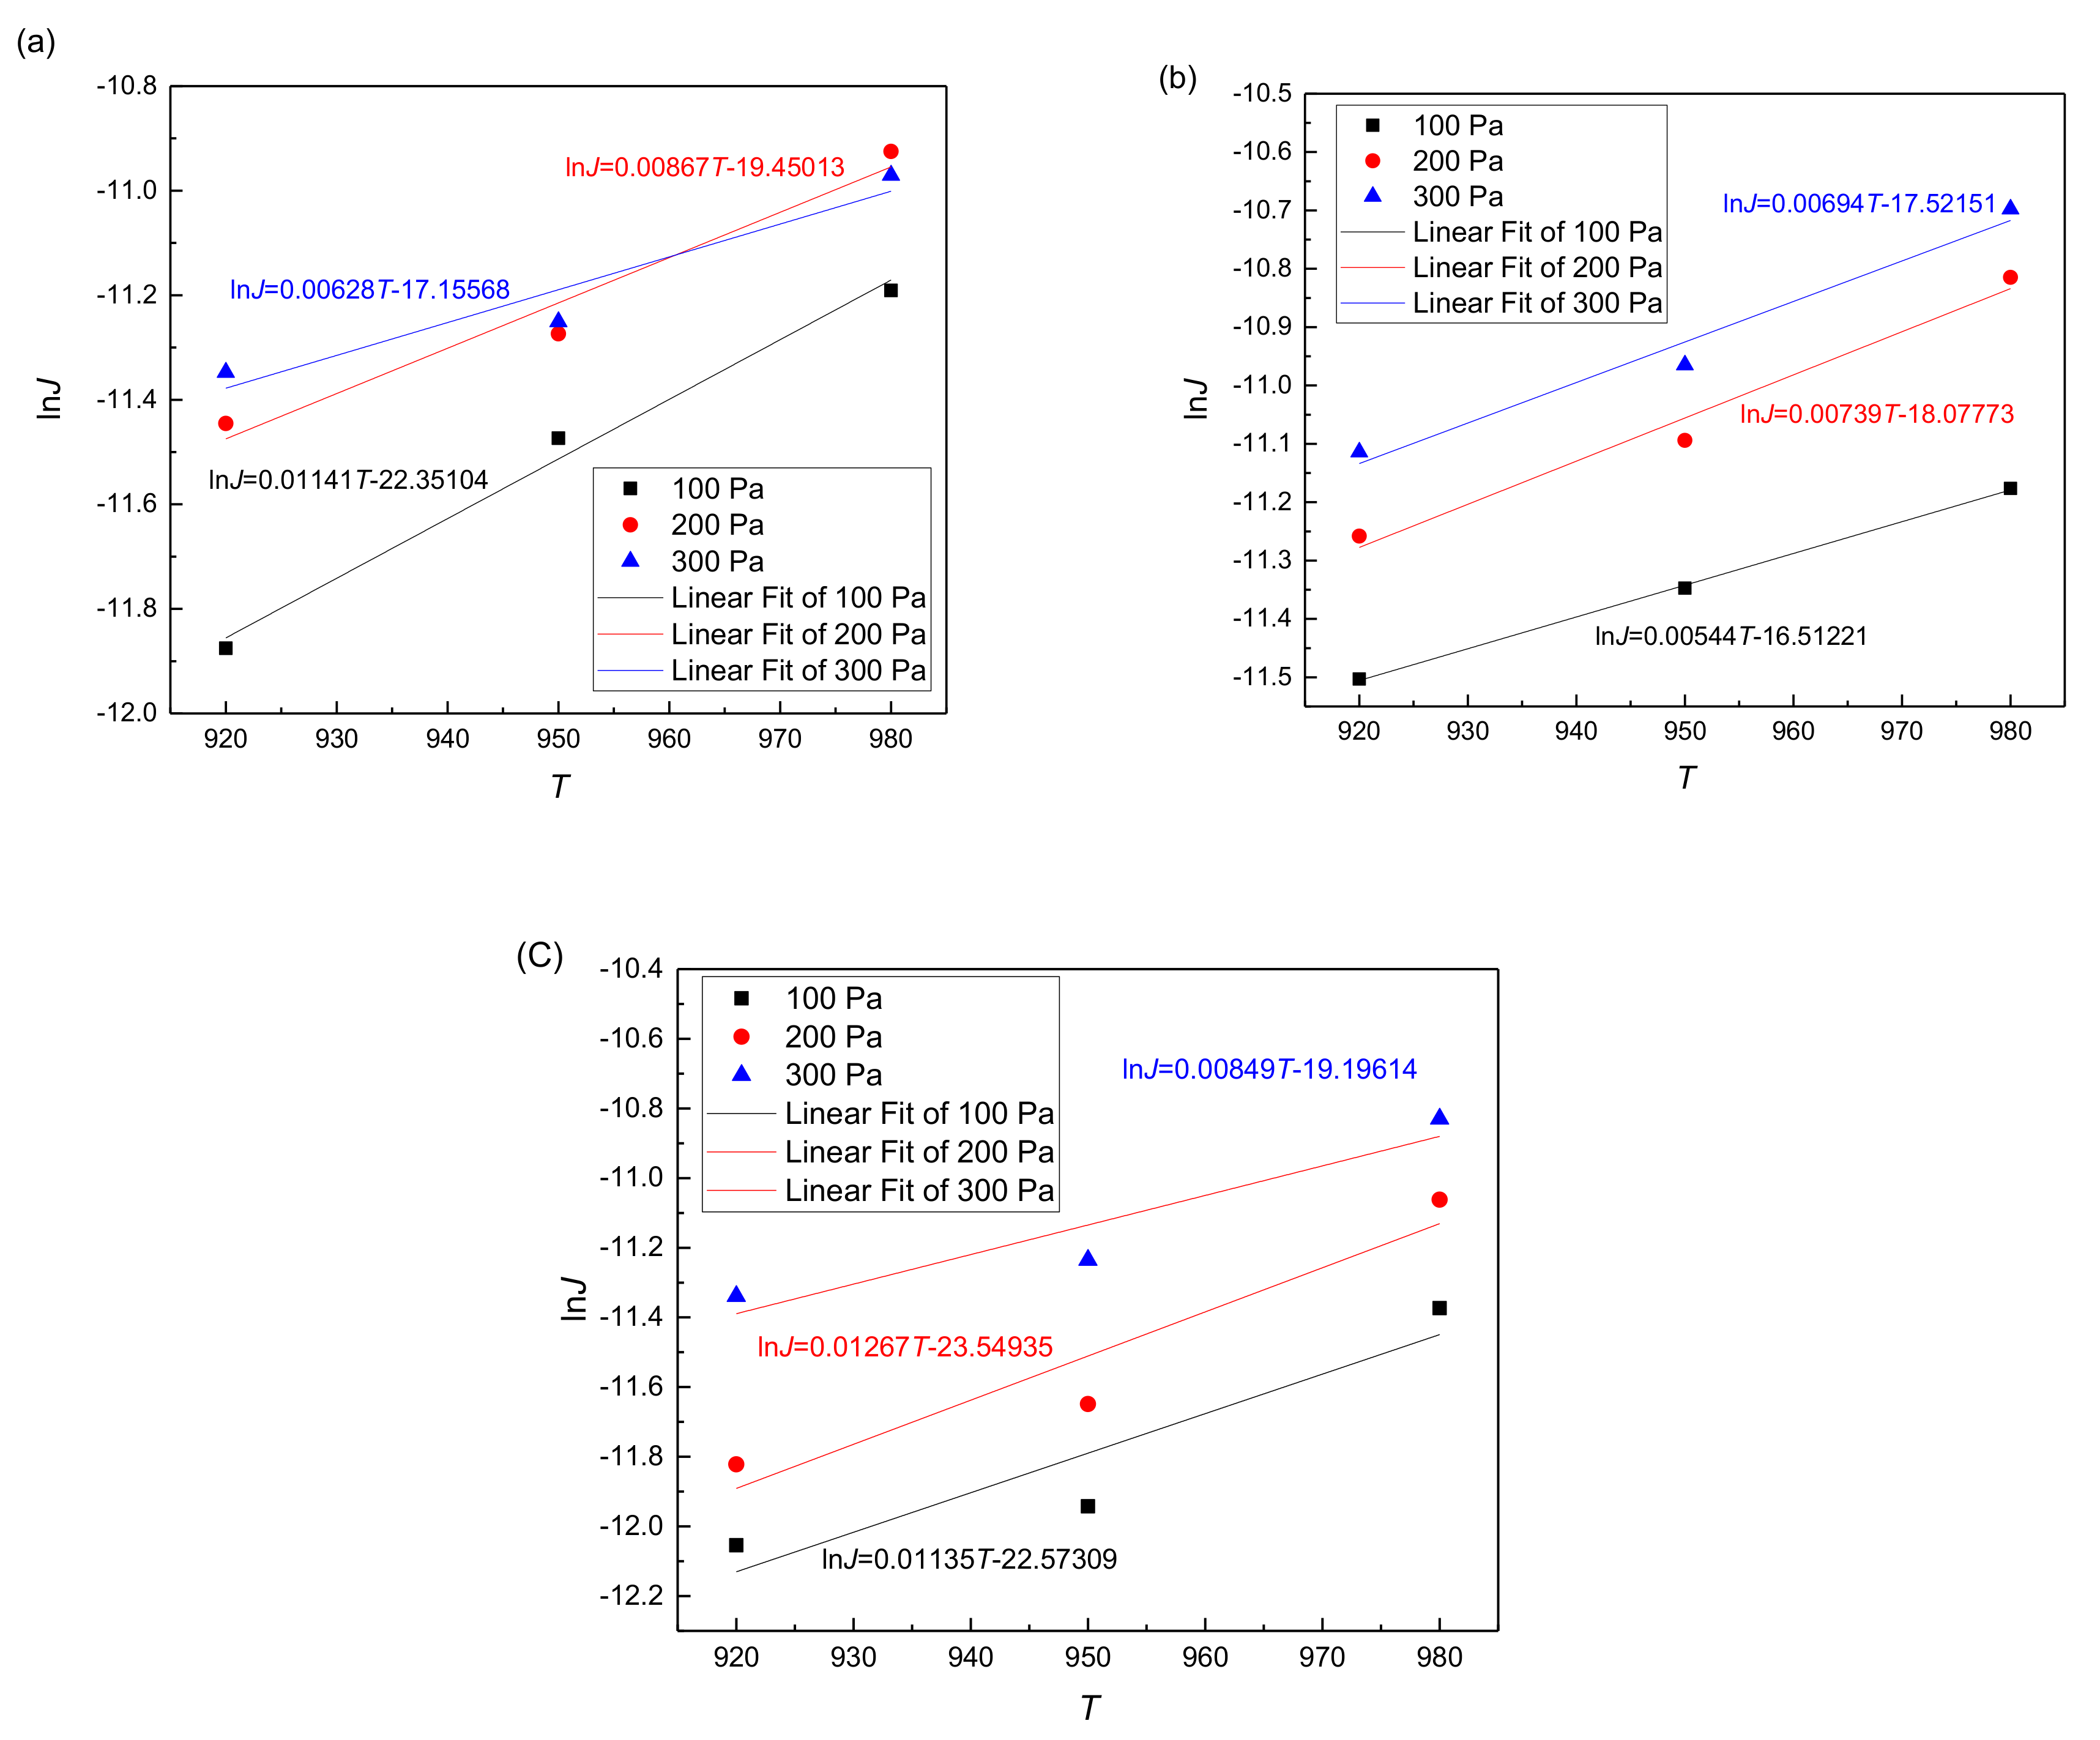
4.2. Carbon Flux Modeling for the Carburization Process

The amount of carbon atoms transferred at the metal surface is defined as carbon flux, which is determined by temperature and pressure, according to physicochemical principles. In practical, the carbon transfer from the atmosphere to the steel surface is proportional to the adsorption capacity of carburizing gas medium, so it follows the empirically derived Freundlich equation [25]:
J = k p R T A
As can be seen from the above analysis, in the first carburizing pulse, which occurs generally within the first 30 s, the carbon concentration gradient and the carbon flux are both relatively large. When the carbon concentration on the workpiece surface reaches a certain level (an intermediate carbon concentration), the carbon concentration gradient decreases by more than 80%. The driving force for carbon atoms to enter the sample has decreased by a relatively large amount, and the carbon flux also shows an order-of-magnitude decrease, which is a process maintained in the subsequent 30 s to 90 s. After this, the carbon flux value of the pulse takes the average carbon flux value at 90 s owing to its small carbon concentration gradient. In the carburization process, the initial carburization of the first pulse plays a dominant role in carburization. Therefore, a regression analysis on the adsorption amount of three materials under different carburization temperature and pressure conditions within the first 30 s was conducted. The carbon flux values of the three materials in 30 s are shown in Table 2, Table 3 and Table 4.
Equation (3) is converted to obtain Equation (4):
ln J = ln k + R T A ln p = R A ln p T + ln k ,
R A ln p = M ,
ln k = N .
p is taken as a constant. In this way, linear regression can be performed on the data of the three different materials in Table 2, Table 3 and Table 4.
Figure 15 shows the regression curves of carburization temperature at different pressure.
The regression results are shown in Equations (7)–(9).
For 12Cr2Ni4A steel:
J = 3.26 × 10 9 p 8.314 T 4412 .
For 16Cr3NiWMoVNbE steel:
J = 1.14 × 10 8 p 8.314 T 5512 .
For 18Cr2Ni4WA steel:
J = 2.35 × 10 10 p 8.314 T 3366 .

5. Conclusions

The engineering modeling of key process parameters, including carburizing temperature, saturated carbon concentration in austenite, diffusion coefficient, and carbon flux, were investigated to meet the requirements of the process parameter model and database for low-pressure vacuum carburization conditions. The following conclusions have been drawn.
  • The use of segmented average carbon flux enables more accurate and efficient characterization of the actual carbon flux required, not only effectively avoiding the effect of the first pulse but also enabling the fine control of the timing of the subsequent pulses. Therefore, the segmented average carbon flux method should be selected when formulating the vacuum carburizing process.
  • For the 16Cr3NiWMoVNE steel carburizing 30 s, the carbon flux obtained using the segmented average method is 2.5 times than that of the carbon flux obtained by the overall average method, which result in the obtained value exceeding the carbide standard in the carburized layer;
  • For the 16Cr3NiWMoVNE steel, the first pulse carburizing time and subsequent pulse time obtained by using the overall average method are 2.2 and 1.3 times longer than those obtained by using the segmented average method;
  • Carbon flux increases with pressure. The optimum carburizing pressure is 300 Pa for low-pressure vacuum carburizing. On increasing the carburizing temperature from 920 °C to 980 °C, the effective carbon flux value increased by more than 30%. Furthermore, with the increase in carburizing temperature, the time required for the surface carbon concentration of the sample to reach saturation also increases;
  • In terms of the degree of influence of material composition on the value of carbon flux, the alloy content has the greatest influence, followed by the initial carbon concentration, and then the saturated carbon concentration;
  • Future work will focus on the effect of different alloy elements and content on carbon flux in detail, and establish a more general mathematical model of carbon flux under the optimal carburizing temperature and pressure, which is verified by experiments.

Author Contributions

All authors contributed equally to this paper and research. Conceptualization, H.W. and Z.W.; data curation, X.A.; formal analysis, Y.T. and J.L.; supervision, Z.W.; writing—review and editing, H.W. All authors have read and agreed to the published version of the manuscript.

Funding

This research was funded by the National Key Research and Development Program of China (2017YFB0305300).

Acknowledgments

The authors would like to express their thanks to teachers and students in the State Key Lab of Rolling and Automation, Northeastern University, for their continuous help and support.

Conflicts of Interest

The authors declare no conflict of interest.

References

  1. Sawicki, J.; Krupanek, K.; Stachurski, W.; Buzalski, V. Algorithm Scheme to Simulate the Distortions during Gas Quenching in a Single-Piece Flow Technology. Coatings 2020, 10, 694. [Google Scholar] [CrossRef]
  2. Derevyanov, M.Y.; Livshits, M.Y.; Yakubovich, E.A. Vacuum Carburizing Process: Identification of Mathematical Model and Optimization. IOP Conf. Ser. Mater. Sci. Eng. 2018, 327, 022022. [Google Scholar] [CrossRef] [Green Version]
  3. Li, W.; Li, A.; Liang, Y.; Zhang, Z.; Cui, J. Effect of vacuum carburizing on surface properties and microstructure of a tungsten heavy alloy. Mater. Res. Express 2020, 7, 016558. [Google Scholar] [CrossRef]
  4. Yuan, Z.X.; Yu, Z.S.; Tan, P.; Song, S.H. Effect of rare earths on the carburization of steel. Mater. Sci. Eng. A 1999, 267, 162–166. [Google Scholar] [CrossRef]
  5. Yan, M.F.; Liu, Z.R. Influence of rare earths on carbon diffusion and transfer coefficients of carburizing process. Chin. J. Rare Earths 2001, 19, 9–11. [Google Scholar]
  6. Hwang, J.I.; Melville, A.T.; Jhee, T.G.; Kim, Y.K. Equilibration of plain carbon and alloy steels with endothermic carburizing atmospheres: Part I. Activity of carbon in plain carbon steels. Met. Mater. Int. 2010, 15, 159–173. [Google Scholar] [CrossRef]
  7. Hwang, J.I.; Jhee, T.G.; Kim, Y.K.; Hwang, T.Y. Equilibration of plain carbon and alloy steels with endothermic carburizing atmospheres: Part II. Oxidation of plain carbon and armco steels during carburizing at 1000 °C and 1038 °C. Met. Mater. Int. 2010, 16, 693–699. [Google Scholar] [CrossRef]
  8. Kula, P.; Pietrasik, R.; Dybowski, K. Vacuum carburizing-process optimization. J. Mater. Process. Technol. 2005, 164, 876–881. [Google Scholar] [CrossRef]
  9. Karabelchtchikova, O.; Sisson, R.D. Carbon diffusion in steels: A numerical analysis based on direct integration of the flux. J. Phase Equil. Diff. 2006, 27, 598–604. [Google Scholar] [CrossRef]
  10. Zajusz, M.; Tkacz, S.K.; Danielewski, M. Modeling of vacuum pulse carburizing of steel. Surf. Coat. Technol. 2014, 258, 646–651. [Google Scholar] [CrossRef]
  11. Lowell, J. The Effects of Contamination and Cleaning on AISI 9310 Vacuum Carburized Steel. Master’s Thesis, Worcester Polytechnic Institute, Worcester, MA, USA, 2009. [Google Scholar]
  12. Gorockiewicz, R.; Lapiński, A. Structure of the carbon layer deposited on the steel surface after low pressure carburizing. Vacuum 2010, 85, 429–433. [Google Scholar] [CrossRef]
  13. Gorockiewicz, R. The kinetics of low pressure carburizing of alloy steels. Vacuum 2011, 86, 448–451. [Google Scholar] [CrossRef]
  14. Su, Y. Measurement of Critical Parameters in Vacuum Carburizing and Development of Simulation Software; Shanghai Jiaotong University: Shanghai, China, 2009. [Google Scholar]
  15. Yin, L.; Wang, T.; Ma, X.; Fu, Z.; Hao, G.; Li, L.; Wang, L. Pre-Coated Fe–Ni Film to Promote Low-Pressure Carburizing of 14Cr14Co13Mo4 Steel. Coatings 2019, 9, 304. [Google Scholar] [CrossRef] [Green Version]
  16. Yin, L.; Ma, X.; Tang, G.; Fu, Z.; Yang, S.; Wang, T.; Wang, L.; Li, L. Characterization of carburized 14cr14co13mo4 stainless steel by low pressure carburizing. Surf. Coat. Technol. 2019, 358, 654–660. [Google Scholar] [CrossRef]
  17. Jacquet, P.; Rousse, D.R.; Bernard, G.; Lambertin, M. A novel technique to monitor carburizing processes. Mater. Chem. Phys. 2003, 77, 542–551. [Google Scholar] [CrossRef]
  18. Zhang, J.G.; Cong, P.W. Overview and development of vacuum carburizing technology. Metal. Heat Treat. 2003, 28, 52–55. [Google Scholar]
  19. Khan, R.U.; Bajohr, S.; Buchholz, D.; Reimert, R.; Minh, H.D.; Norinaga, K.; Janardhanan, V.M.; Tischer, S.; Deutschmann, O. Pyrolysis of propane under vacuum carburizing conditions: An experimental and modeling study. J. Anal. Appl. Pyrolysis 2007, 81, 148–156. [Google Scholar] [CrossRef]
  20. Yada, K.; Watanabe, O. Reactive flow simulation of vacuum carburizing by acetylene gas. Comput. Fluids 2013, 34, 26. [Google Scholar] [CrossRef]
  21. Makino, S.; Inagaki, M.; Ikehata, H.; Tanaka, K.; Inagaki, K. Multi-step simulation of vacuum-carburizing reactor based on kinetics approach. ISIJ Int. 2020, 60, 2000–2006. [Google Scholar] [CrossRef] [Green Version]
  22. Wang, H.J.; Wang, B.; Tian, Y.; Misra, R.D.K. Optimizing the low-pressure carburizing process of 16Cr3NiWMoVNbE gear steel. J. Mater. Sci. Technol. 2019, 35, 1218–1227. [Google Scholar] [CrossRef]
  23. Wang, X.L.; Zurecki, Z.; Sisson, R.D. Development of nitrogen-hydrocarbon atmospheric carburizing and process control methods. J. Mater. Eng. Perform. 2013, 22, 1879–1885. [Google Scholar] [CrossRef]
  24. Tian, Y.; Wang, H.J.; An, X.; Wang, Z. Experimental study on carbon flux in vacuum carburizing. Mater. Res. Exp. 2019, 6, 096516. [Google Scholar] [CrossRef]
  25. Kanô, F.; Abe, I.; Kamaya, H.; Ueda, I. Fractal model for adsorption on activated carbon surfaces: Langmuir and freundlich adsorption. Surf. Sci. 2000, 467, 131–138. [Google Scholar] [CrossRef]
Figure 1. Variation in carbon flux with carburizing time.
Coatings 10 01075 g001
Figure 2. Process curves of (a) the average carbon flux method and (b) the segmented average carbon flux method.
Coatings 10 01075 g002
Figure 3. First three pulse curves obtained via different carbon flux measurement methods.
Coatings 10 01075 g003
Figure 4. Carburizing time of each pulse obtained via different carbon flux measurement methods.
Coatings 10 01075 g004
Figure 5. Surface organization of carburized layer of 16Cr3NiWMoVNbE steel under (a) the average carbon flux model and (b) the segmented average carbon flux model after carburizing and quenching.
Coatings 10 01075 g005
Figure 6. Schematic of the boost stages of the carburizing process.
Coatings 10 01075 g006
Figure 7. Effect of carburizing pressure on (a) mass increment, (b) average carbon flux, and (c) segmented average carbon flux for 12Cr2Ni4A steel at 950 °C.
Coatings 10 01075 g007
Figure 8. Effect of carburizing pressure on (a) mass increment, (b) average carbon flux, and (c) segmented average carbon flux for 16Cr3NiWMoVNbE steel at 950 °C.
Coatings 10 01075 g008
Figure 9. Effect of carburizing pressure on (a) mass increment, (b) average carbon flux, and (c) segmented average carbon flux of 18Cr2Ni4WA steel.
Coatings 10 01075 g009
Figure 10. Effect of carburizing temperature on (a) mass increment, (b) average carbon flux, and (c) segmented average carbon flux of 12Cr2Ni4 steel under 300 Pa.
Coatings 10 01075 g010
Figure 11. Effect of carburizing temperature on (a) mass increment, (b) average carbon flux, and (c) segmented average carbon flux of 16Cr3NiWMoVNbE steel under 300 Pa.
Coatings 10 01075 g011
Figure 12. Effect of carburizing temperature on (a) mass increment, (b) average carbon flux, and (c) segmented average carbon flux of 18Cr2Ni4WA steel under 300 Pa.
Coatings 10 01075 g012
Figure 13. Effect of carburizing pressure on average carbon flux of three materials (a) 100 Pa; (b) 200 Pa; (c) 300 Pa.
Coatings 10 01075 g013
Figure 14. Effect of carburizing temperature on average carbon flux of three materials in 30s (a) 920 °C; (b) 950 °C; (c) 980 °C.
Coatings 10 01075 g014
Figure 15. Regression curves of carburization temperature and lnJ: (a) 12Cr2Ni4A steel, (b) 16Cr3NiWMoVNbE steel, and (c) 18Cr2Ni4WA steel.
Coatings 10 01075 g015
Table 1. Chemical compositions of the alloy steels (wt.%).
GradeCCrNiMnSiWVMoNbCeFe
12Cr2Ni4A0.121.53.50.50.3-----Bal.
16Cr3NiWMoVNbE0.162.81.40.50.81.20.450.50.150.1Bal.
18Cr2Ni4WA0.181.53.90.40.230.9----Bal.
Table 2. Effect of carburizing temperature and pressure on average carbon flux of 12Cr2Ni4A steel.
Pressure/PaTemperature/°CAverage Carbon Flux in 30 s/g·cm−2·s−1
1009206.96 × 10−6
9501.04 × 10−5
9801.38 × 10−5
2009201.07 × 10−5
9501.27 × 10−5
9801.80 × 10−5
3009201.18 × 10−5
9501.30 × 10−5
9801.72 × 10−5
Table 3. Effect of carburizing temperature and pressure on average carbon flux of 16Cr3NiWMoVNbE steel.
Pressure/PaTemperature/°CAverage Carbon Flux in 30 s/g·cm−2·s−1
1009201.01 × 10−5
9501.18 × 10−5
9801.40 × 10−5
2009201.29 × 10−5
9501.52 × 10−5
9802.01 × 10−5
3009201.49 × 10−5
9501.73 × 10−5
9802.26 × 10−5
Table 4. Effect of carburizing temperature and pressure on average carbon flux of 18Cr2Ni4WA steel.
Pressure/PaTemperature/°CAverage Carbon Flux in 30 s/g·cm−2·s−1
1009205.82 × 10−6
9506.51 × 10−6
9801.15 × 10−5
2009207.34 × 10−6
9508.73 × 10−6
9801.57 × 10−5
3009201.19 × 10−5
9501.32 × 10−5
9801.98 × 10−5
Publisher’s Note: MDPI stays neutral with regard to jurisdictional claims in published maps and institutional affiliations.

