
An Ocean between the Waves: Trends in Antimicrobial Consumption in Hospitalized Patients with COVID-19
 , and
, and
Abstract
:1. Introduction
2. Results
3. Discussion
4. Materials and Methods
4.1. Setting and Study Design
4.2. Data Collection and Outcomes
4.3. Statistical Analysis
Author Contributions
Funding
Institutional Review Board Statement
Informed Consent Statement
Data Availability Statement
Acknowledgments
Conflicts of Interest
References
- Viasus, D.; Paño-Pardo, J.R.; Pachón, J.; Campins, A.; López-Medrano, F.; Villoslada, A.; Fariñas, M.C.; Moreno, A.; Rodríguez-Baño, J.; Oteo, J.A.; et al. Factors associated with severe disease in hospitalized adults with pandemic (H1N1) 2009 in Spain. Clin. Microbiol. Infect. 2011, 17, 738–746. [Google Scholar] [CrossRef] [PubMed]
- Clinical Management of Severe Acute Respiratory Infection (SARI) When COVID-19 Disease Is Suspected: Interim Guidance, 13 March 2020. WHO Reference Number: WHO/2019-nCoV/clinical/2020.4. Available online: https://www.who.int/docs/default-source/coronaviruse/clinical-management-of-novel-cov.pdf (accessed on 26 September 2023).
- Langford, B.J.; So, M.; Raybardhan, S.; Leung, V.; Westwood, D.; MacFadden, D.R.; Soucy, J.R.; Daneman, N. Bacterial co-infection and secondary infection in patients with COVID-19: A living rapid review and meta-analysis. Clin. Microbiol. Infect. 2020, 26, 1622–1629. [Google Scholar] [CrossRef] [PubMed]
- Sturdy, A.; Basarab, M.; Cotter, M.; Hager, K.; Shakespeare, D.; Shah, N.; Randall, P.; Spray, D.; Arnold, A. Severe COVID-19 and healthcare-associated infections on the ICU: Time to remember the basics? J. Hosp. Infect. 2020, 105, 593–595. [Google Scholar] [CrossRef] [PubMed]
- Abelenda-Alonso, G.; Puig-Asensio, M.; Jiménez-Martínez, E.; García-Lerma, E.; Hornero, A.; Gutiérrez, C.; Torrecillas, M.; Tebé, C.; Pujol, M.; Carratalà, J. Impact of the coronavirus disease 2019 (COVID-19) pandemic on infection control practices in a university hospital. Infect. Control Hosp. Epidemiol. 2023, 44, 135–138. [Google Scholar] [CrossRef] [PubMed]
- Centers for Disease Control and Prevention. Outpatient antibiotic prescriptions—United States. 2021. Available online: https://www.cdc.gov/antibiotic-use/data/report-2021.html (accessed on 7 June 2023).
- European Centre for Disease Prevention and Control. Antimicrobial Consumption in the EU/EEA (ESAC-Net)—Annual Epidemiological Report 2021; ECDC: Stockholm, Sweden, 2022. [Google Scholar]
- Van Laethem, J.; Wuyts, S.; Van Laere, S.; Koulalis, J.; Colman, M.; Moretti, M.; Seyler, L.; De Waele, E.; Pierard, D.; Lacor, P.; et al. Antibiotic prescriptions in the context of suspected bacterial respiratory tract superinfections in the COVID-19 era: A retrospective quantitative analysis of antibiotic consumption and identification of antibiotic prescription drivers. Intern. Emerg. Med. 2022, 17, 141–151. [Google Scholar] [CrossRef]
- Nestler, M.J.; Godbout, E.; Lee, K.; Kim, J.; Noda, A.J.; Taylor, P.; Pryor, R.; Markley, J.D.; Doll, M.; Bearman, G.; et al. Impact of COVID-19 on pneumonia-focused antibiotic use at an academic medical center. Infect. Control Hosp. Epidemiol. 2021, 42, 915–916. [Google Scholar] [CrossRef] [PubMed]
- Salehi, M.; Khalili, H.; Seifi, A.; Davoudi, H.; Darazam, I.A.; Jahangard-Rafsanjani, Z.; Mohammadnejad, E.; Heydari, B.; Siahkaly, S.J.M.; Tabarsi, P.; et al. Antibiotic use during the first 6 months of COVID-19 pandemic in Iran: A large-scale multi-centre study. J. Clin. Pharm. Ther. 2022, 47, 2140–2151. [Google Scholar] [CrossRef]
- Chedid, M.; Waked, R.; Haddad, E.; Chetata, N.; Saliba, G.; Choucair, J. Antibiotics in treatment of COVID-19 complications: A review of frequency, indications, and efficacy. J. Infect. Public Health 2021, 14, 570–576. [Google Scholar] [CrossRef]
- Piroth, L.; Cottenet, J.; Mariet, A.S.; Bonniaud, P.; Blot, M.; Tubert-Bitter, P.; Quantin, C. Comparison of the characteristics, morbidity, and mortality of COVID-19 and seasonal influenza: A nationwide, population-based retrospective cohort study. Lancet Respir. Med. 2021, 9, 251–259. [Google Scholar] [CrossRef]
- Singh, S.; McNab, C.; Olson, R.M.; Bristol, N.; Nolan, C.; Bergstrøm, E.; Bartos, M.; Mabuchi, S.; Panjabi, R.; Karan, A.; et al. How an outbreak became a pandemic: A chronological analysis of crucial junctures and international obligations in the early months of the COVID-19 pandemic. Lancet 2021, 398, 2109–2124. [Google Scholar] [CrossRef] [PubMed]
- Popp, M.; Stegemann, M.; Riemer, M.; Metzendorf, M.I.; Romero, C.S.; Mikolajewska, A.; Kranke, P.; Meybohm, P.; Skoetz, N.; Weibel, S. Antibiotics for the treatment of COVID-19. Cochrane Database Syst. Rev. 2021, 10, CD015025. [Google Scholar] [CrossRef] [PubMed]
- Lansbury, L.; Lim, B.; Baskaran, V.; Lim, W.S. Co-infections in people with COVID-19: A systematic review and meta-analysis. J. Infect. 2020, 81, 266–275. [Google Scholar] [CrossRef] [PubMed]
- Garcia-Vidal, C.; Sanjuan, G.; Moreno-García, E.; Puerta-Alcalde, P.; Garcia-Pouton, N.; Chumbita, M.; Fernandez-Pittol, M.; Pitart, C.; Inciarte, A.; Bodro, M.; et al. Incidence of co-infections and superinfections in hospitalized patients with COVID-19: A retrospective cohort study. Clin. Microbiol. Infect. 2021, 27, 83–88. [Google Scholar] [CrossRef] [PubMed]
- Fjelltveit, E.B.; Cox, R.J.; Kittang, B.R.; Blomberg, B.; Buanes, E.A.; Group Bergen COVID-19 Research; Langeland, N.; Mohn, K. Lower antibiotic prescription rates in hospitalized COVID-19 patients than influenza patients, a prospective study. Infect. Dis. 2021, 54, 79–89. [Google Scholar] [CrossRef] [PubMed]
- RECOVERY Collaborative Group; Horby, P.; Lim, W.S.; Emberson, J.R.; Mafham, M.; Bell, J.L.; Linsell, L.; Staplin, N.; Brightling, C.; Ustianowski, A.; et al. Dexamethasone in Hospitalized Patients with COVID-19. N. Engl. J. Med. 2021, 384, 693–704. [Google Scholar] [CrossRef] [PubMed]
- WHO Rapid Evidence Appraisal for COVID-19 Therapies (REACT) Working Group; Sterne, J.A.C.; Murthy, S.; Diaz, J.V.; Slutsky, A.S.; Villar, J.; Angus, D.C.; Annane, D.; Azevedo, L.C.P.; Berwanger, O.; et al. Association between Administration of Systemic Corticosteroids and Mortality among Critically Ill Patients with COVID-19: A Meta-analysis. JAMA 2020, 324, 1330–1341. [Google Scholar] [CrossRef] [PubMed]
- Institut d’Estadística de Catalunya Home Page. Available online: https://www.idescat.cat/indicadors/?id=conj&n=14357 (accessed on 21 April 2023).
- Informe n° 112. Situación de COVID-19 en España a 5 de Enero de 2022. Equipo COVID-19. RENAVE. CNE. CNM (ISCIII). Available online: https://www.isciii.es/QueHacemos/Servicios/VigilanciaSaludPublicaRENAVE/EnfermedadesTransmisibles/Documents/INFORMES/Informes%20COVID-19/INFORMES%20COVID-19%202023/Informe%20n%C2%BA%20182%20Situaci%C3%B3n%20actual%20de%20COVID-19%20en%20Espa%C3%B1a%20a%205%20de%20julio%20de%202023.pdf (accessed on 1 April 2023).
- WHO Collaborating Centre for Drug Statistics Methodology Home Page. Available online: https://www.whocc.no/use_of_atc_ddd/ (accessed on 5 September 2023).
- Vallès, J.; Fernández, S.; Cortés, E.; Morón, A.; Fondevilla, E.; Oliva, J.C.; Diaz, E. Comparison of the defined daily dose and days of treatment methods for evaluating the consumption of antibiotics and antifungals in the intensive care unit. Med. Intensiv. (Engl. Ed.) 2020, 44, 294–300. [Google Scholar] [CrossRef] [PubMed]
- WHO Access, Watch, Reserve (AWaRe) Classification of Antibiotics for Evaluation and Monitoring of Use; World Health Organization: Geneva, Switzerland, 2021; (WHO/MHP/HPS/EML/2021.04).
- Yin, J.; Li, H.; Sun, Q. Analysis of Antibiotic Consumption by AWaRe Classification in Shandong Province, China, 2012–2019: A Panel Data Analysis. Front. Pharmacol. 2021, 12, 790817. [Google Scholar] [CrossRef] [PubMed]


| 1st Wave | 2nd Wave | 3rd Wave | 5th Wave | p-Value | |
|---|---|---|---|---|---|
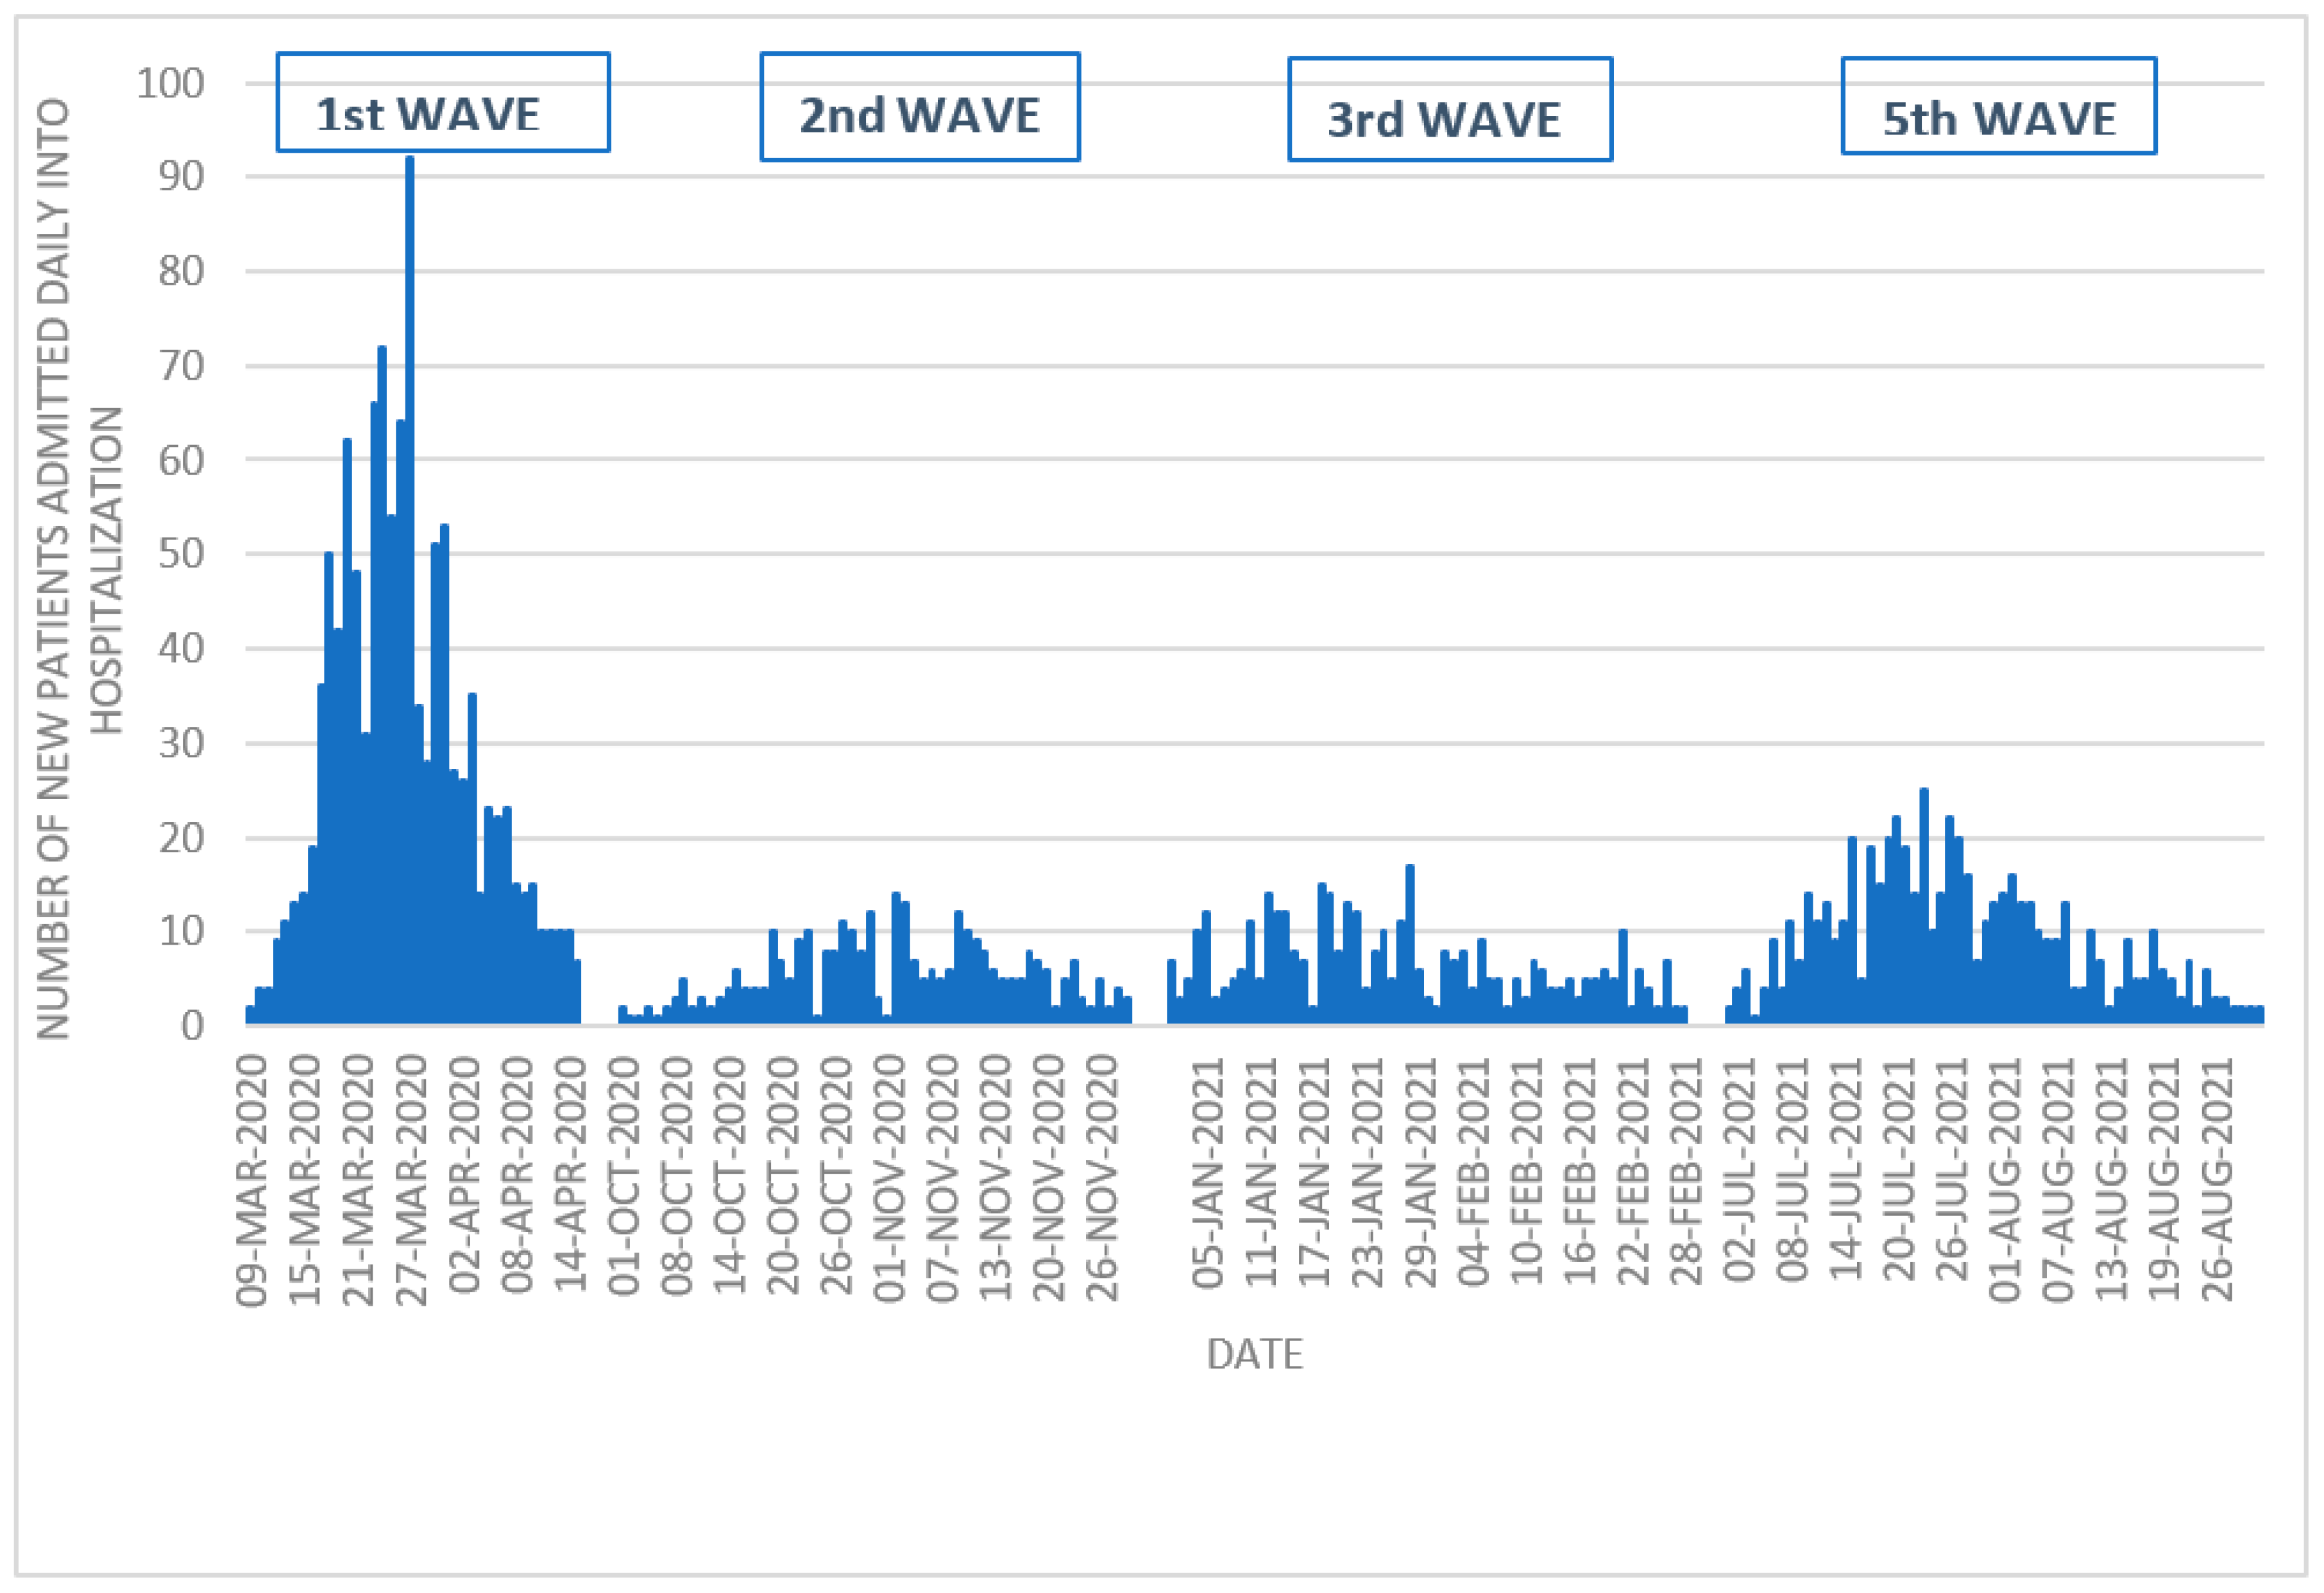
| Dates | 9 March 2020 15 April 2020 | 1 October 2020 30 November 2020 | 1 January 2021 28 February 2021 | 1 July 2021 31 August 2021 | |
| Number of patients admitted | 1120 | 322 | 395 | 578 | |
| Length of hospital stay, median (range) | 8 (1–138) | 10 (1–198) | 10 (1–247) | 9 (1–123) | <0.001 |
| Hospital admissions per day, median | 23 | 5 | 6 | 9 | <0.001 |
| Maximum hospital admissions per day, n | 92 (27 March 2020) | 14 (2 November 2020) | 17 (28 January 2021) | 25 (23 July 2021) | |
| ICU admissions, n (%) | 130 (11.6) | 51 (15.8) | 65 (16.5) | 86 (14.9) | 0.035 |
| Days of ICU stay, median (range) | 14 (1–93) | 16 (1–107) | 15 (1–153) | 8 (1–109) | 0.191 |
| 1st Wave n = 1120 | 2nd Wave n = 322 | 3rd Wave n = 395 | 5th Wave n = 578 | p-Value | |
|---|---|---|---|---|---|
| Male sex (%) | 676 (60.4) | 212 (65.8) | 228 (57.7) | 362 (62.6) | 0.126 |
| Age, years (median, range) | 67 (22–98) | 67 (26–94) | 68 (26–101) | 57 (20–99) | <0.001 |
Comorbidities:
| 267 (23.8) 197 (17.6) 3.37 | 75 (23.3) 67 (20.8) 3.71 | 97 (24.6) 88 (22.3) 3.73 | 118 (20.4) 123 (21.3) 2.67 | <0.001 |
Ceiling of care, n (%)
| 221 (29.7) 158 (21.3) 364 (49) | 38 (15.3) 52 (21) 158 (63.7) | 29 (7.4) 79 (20.2) 284 (72.4) | 41 (7.2) 77 (13.5) 452 (79.3) | <0.001 |
| Fever at admission, n (%) | 253 (22.7) | 75 (23.4) | 55 (14) | 84 (14.6) | <0.001 |
SpO2/FiO2 at admission, n (%)
| 891 (80.2) 61 (5.5) 83 (7.5) 76 (6.8) | 202 (64.1) 27 (8.6) 42 (13.3) 44 (14) | 231 (59.1) 29 (7.4) 73 (18.7) 58 (14.8) | 332 (58.1) 56 (9.8) 121 (21.2) 62 (10.9) | <0.001 |
| Shock at admission, n (%) | 8 (0.7) | 0 | 2 (0.5) | 0 | |
| Leucocytosis at admission, n (%) | 167 (15) | 53 (16.5) | 77 (19.6) | 113 (19.7) | 0.049 |
| ICU admission, n (%) | 130 (11.6) | 51 (15.8) | 65 (16.5) | 86 (14.9) | 0.035 |
| ADRS, n (%) | 518 (46.3) | 184 (57.1) | 242 (61.3) | 292 (50.5) | <0.001 |
| Shock, n (%) | 34 (3) | 19 (5.9) | 23 (5.8) | 15 (2.6) | 0.006 |
| Exitus, n (%) | 215 (19.2) | 68 (21.1) | 81 (20.5) | 69 (11.9) | <0.001 |
L. pneumophila urinary antigen, n (%)
| 200 (17.9) 2 (1) | 33 (10.3) 0 | 29 (7.4) 0 | 42 (7.3) 2 (4.8) | <0.001 |
S. pneumoniae urinary antigen, n (%)
| 217 (19.4) 15 (6.9) | 39 (12.1) 6 (15.4) | 33 (8.4) 4 (12.1) | 44 (7.6) 6 (13.6) | <0.001 |
Blood culture, n (%)
| 433 (38.8) 12 (2.8) | 133 (41.6) 4 (3) | 123 (31.2) 5 (4.1) | 126 (21.8) 4 (3.2) | <0.001 |
| 29 (2.6) | 21 (6.5) | 13 (3.3) | 26 (4.5) | 0.006 |
| Non-ventilator-associated pneumonia, n (%) | 14 (1.3) | 8 (2.5) | 13 (3.3) | 24 (4.2) | 0.002 |
| Nosocomial tracheobronchitis, n (%) | 22 (2) | 12 (3.7) | 0 | 5 (0.9) | <0.001 |
Disclaimer/Publisher’s Note: The statements, opinions and data contained in all publications are solely those of the individual author(s) and contributor(s) and not of MDPI and/or the editor(s). MDPI and/or the editor(s) disclaim responsibility for any injury to people or property resulting from any ideas, methods, instructions or products referred to in the content. |
© 2024 by the authors. Licensee MDPI, Basel, Switzerland. This article is an open access article distributed under the terms and conditions of the Creative Commons Attribution (CC BY) license (https://creativecommons.org/licenses/by/4.0/).
Share and Cite
Durà-Miralles, X.; Abelenda-Alonso, G.; Bergas, A.; Laporte-Amargós, J.; Sastre-Escolà, E.; Padullés, A.; Carratalà, J.; Gudiol, C. An Ocean between the Waves: Trends in Antimicrobial Consumption in Hospitalized Patients with COVID-19. Antibiotics 2024, 13, 55. https://doi.org/10.3390/antibiotics13010055
Durà-Miralles X, Abelenda-Alonso G, Bergas A, Laporte-Amargós J, Sastre-Escolà E, Padullés A, Carratalà J, Gudiol C. An Ocean between the Waves: Trends in Antimicrobial Consumption in Hospitalized Patients with COVID-19. Antibiotics. 2024; 13(1):55. https://doi.org/10.3390/antibiotics13010055
Chicago/Turabian StyleDurà-Miralles, Xavier, Gabriela Abelenda-Alonso, Alba Bergas, Júlia Laporte-Amargós, Enric Sastre-Escolà, Ariadna Padullés, Jordi Carratalà, and Carlota Gudiol. 2024. "An Ocean between the Waves: Trends in Antimicrobial Consumption in Hospitalized Patients with COVID-19" Antibiotics 13, no. 1: 55. https://doi.org/10.3390/antibiotics13010055